
Identification of Urban Functional Areas and Governance Measures Based on Point of Interest Data: A Case Study of the Shenyang Railway Station Area in Shenyang City


Abstract
:1. Introduction
1.1. Research Background
1.2. Literature Review
1.3. Research Aims
2. Materials and Methods
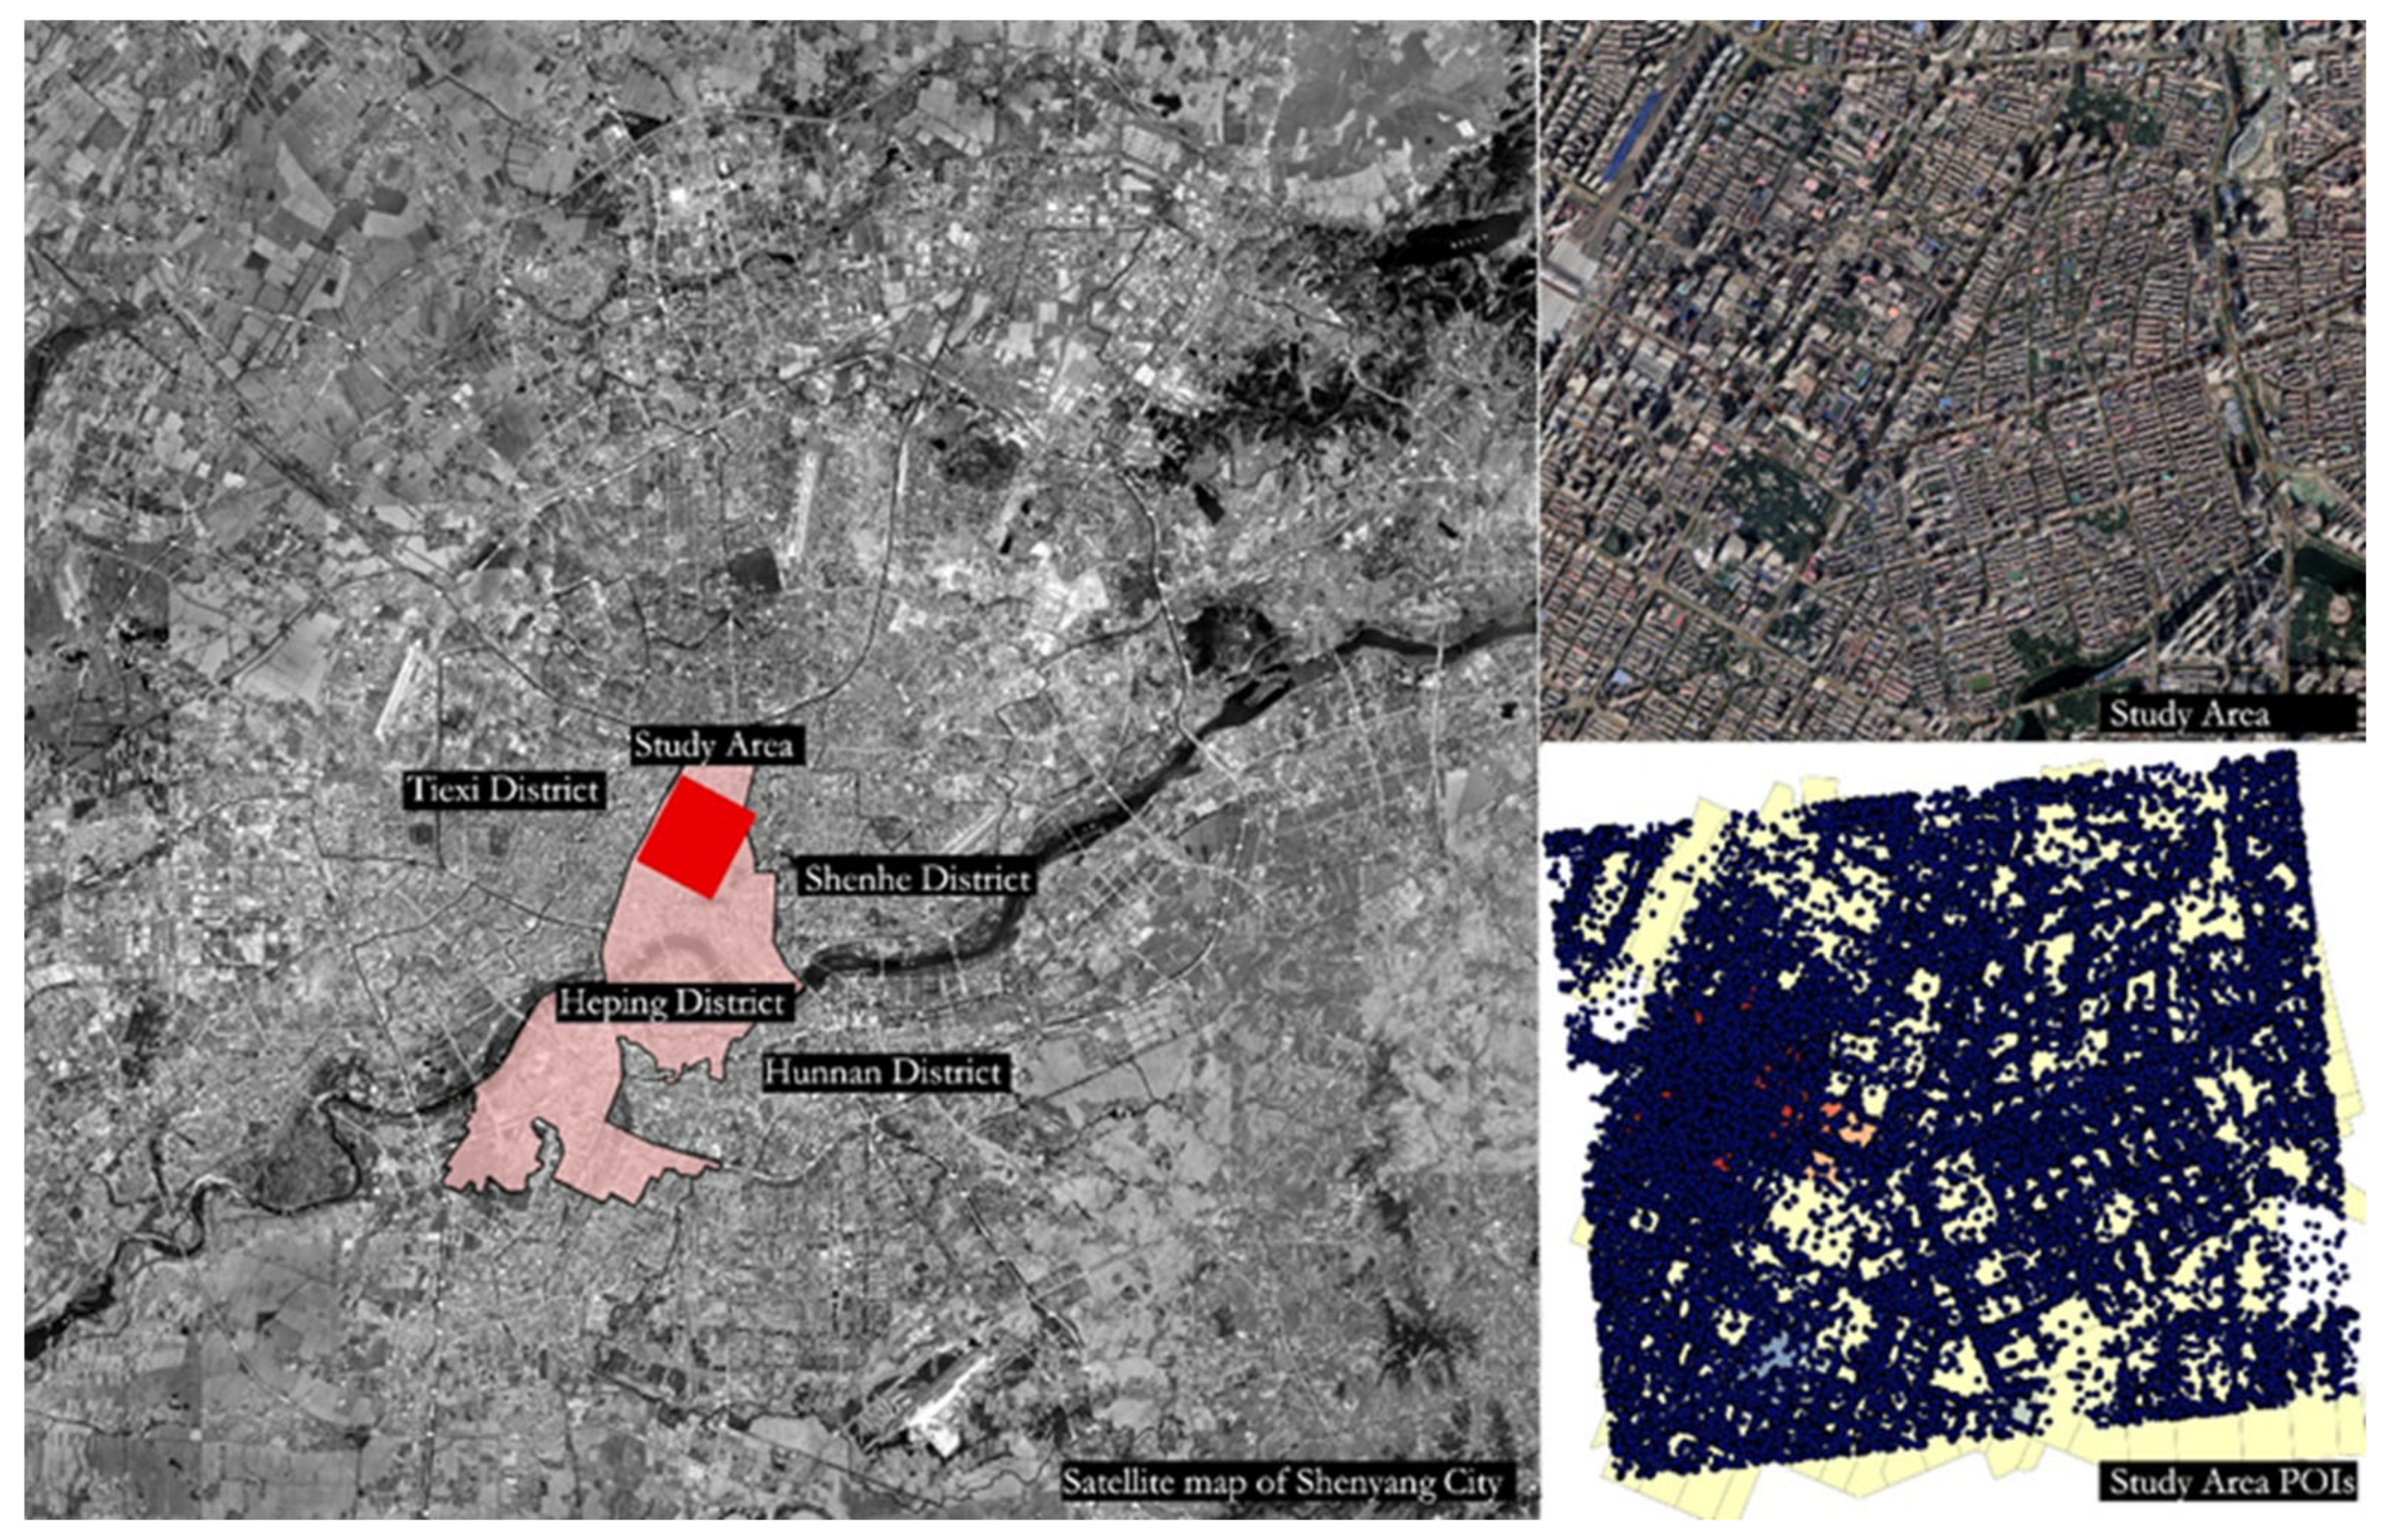
2.1. Study Area
2.2. Data and Pre-Processing
2.2.1. Data Sources
2.2.2. Data Pre-Processing
2.3. Methods
2.3.1. Frequency Density Analysis
2.3.2. Spatial Autocorrelation Analysis
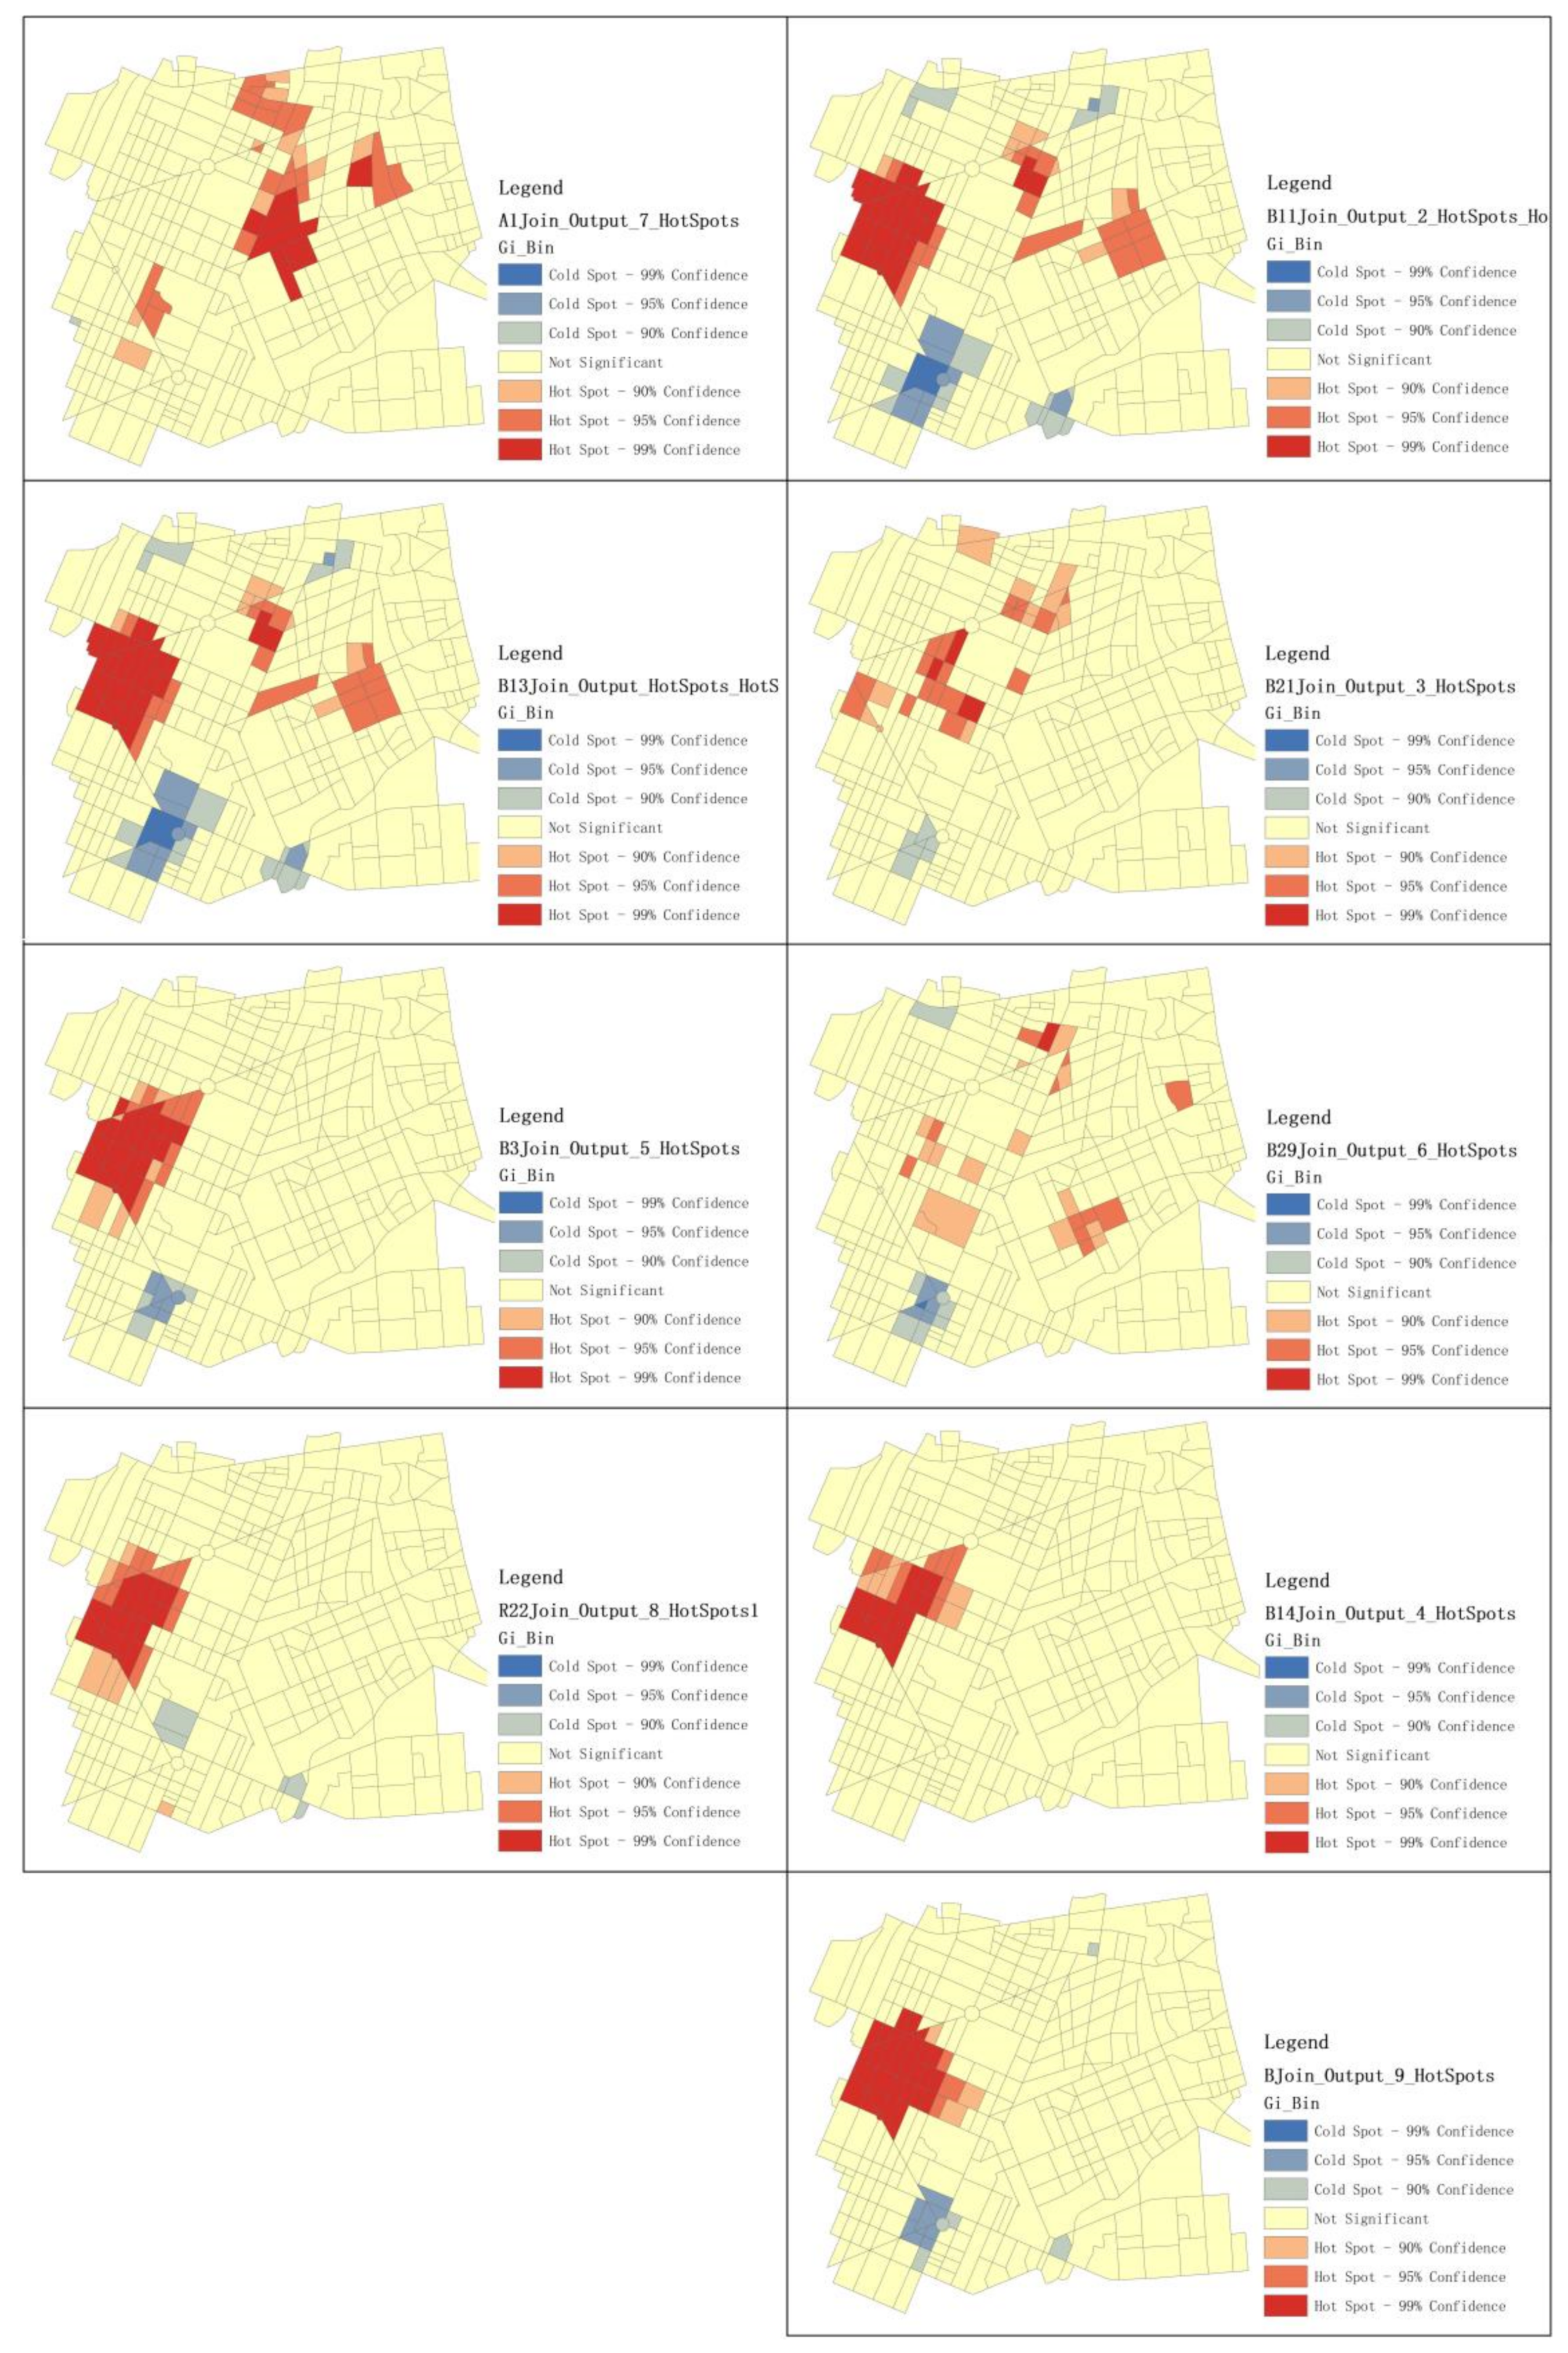
2.3.3. Getis–Ord Gi* Analysis
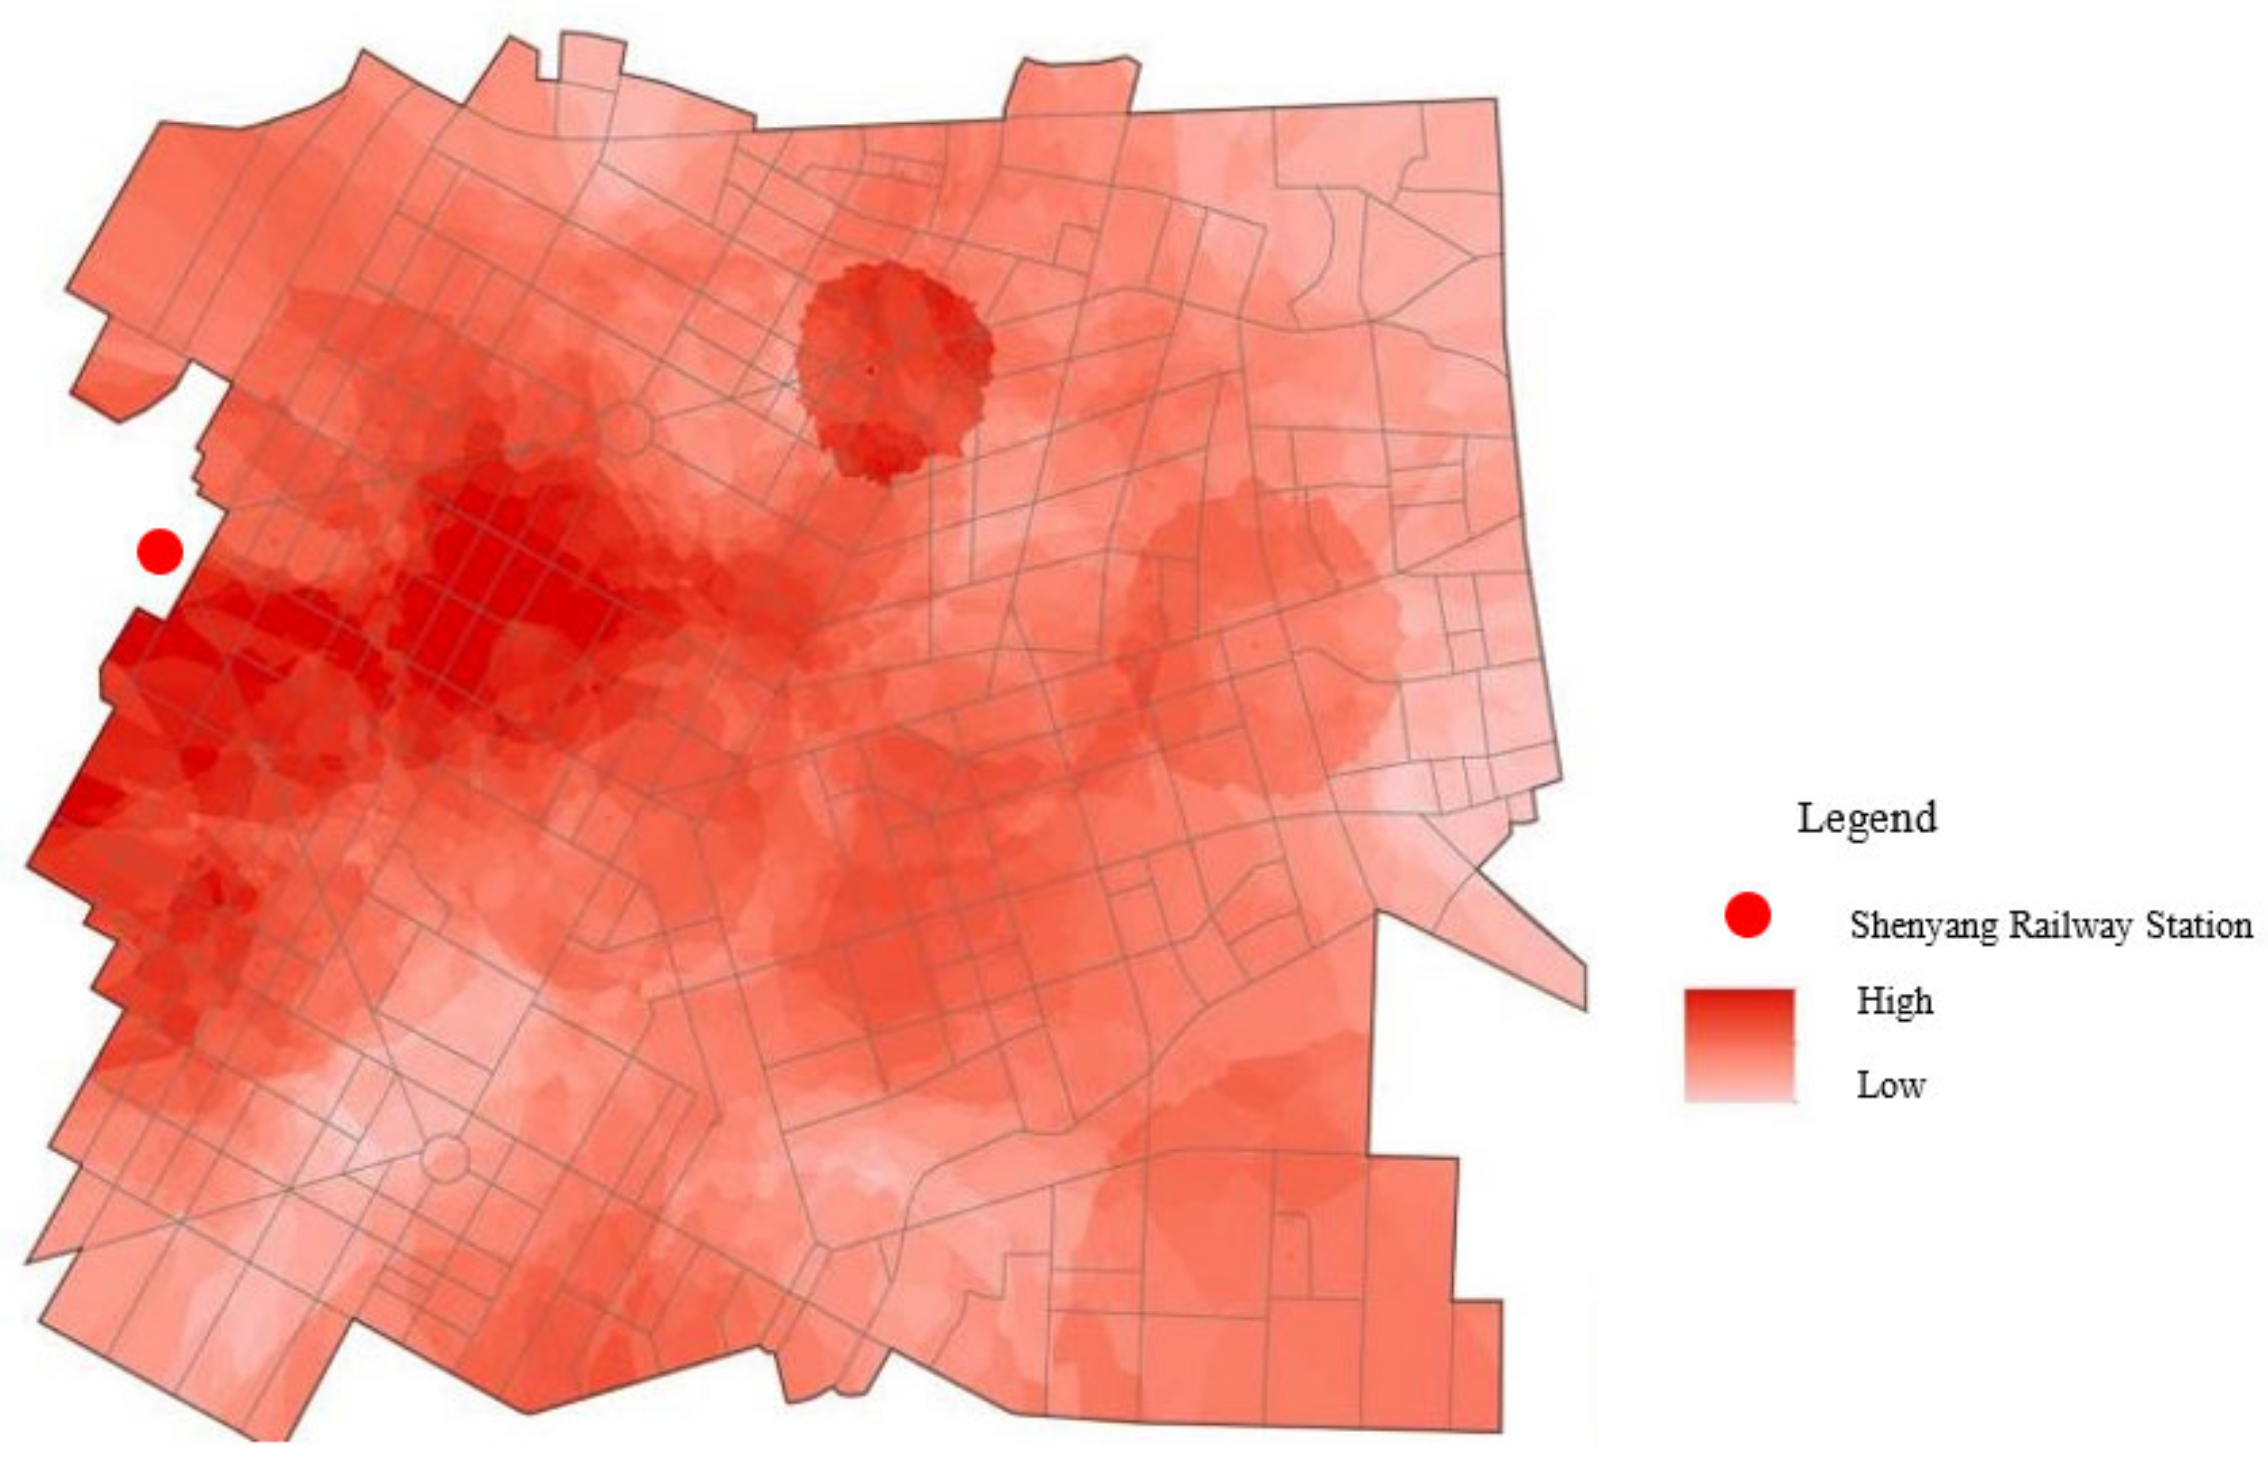
2.3.4. Spatial Intensity Analysis
3. Results
4. Discussion
4.1. The Adoption of Holistic and Comprehensive Governance Mindsets
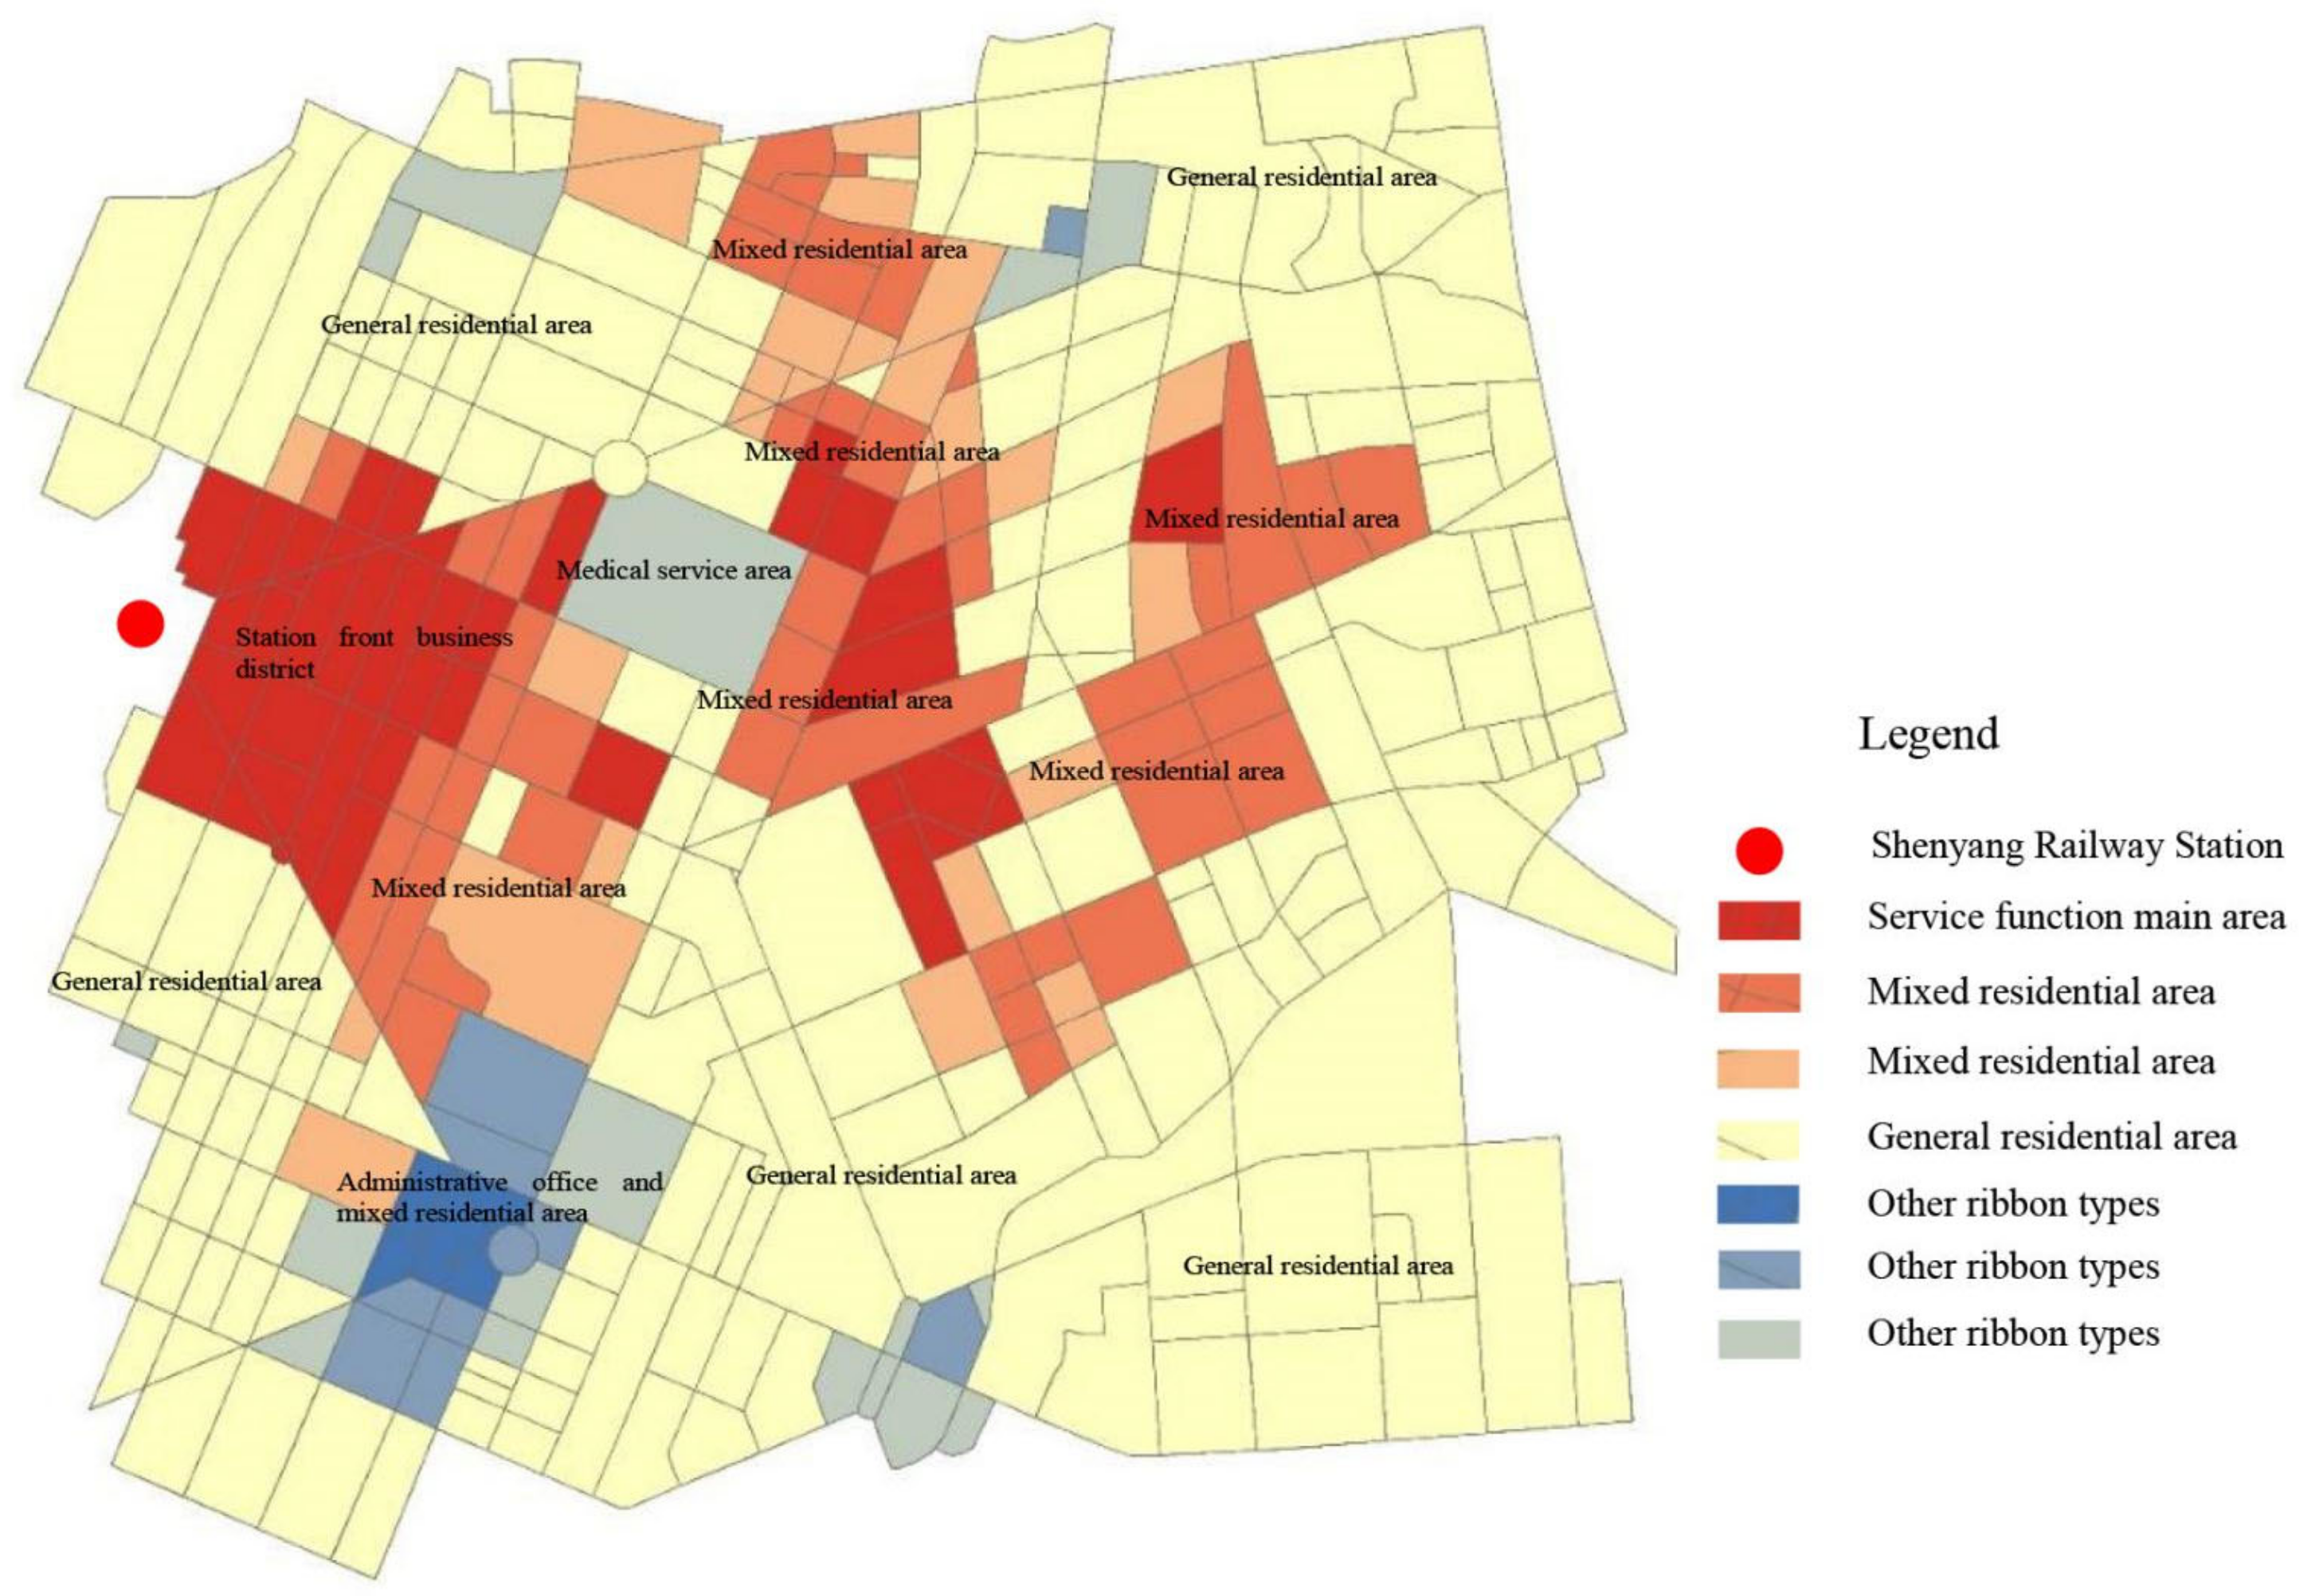
4.2. Typological Characteristics of the District’s Spatial Structure
4.3. Strategies for Design Governance
4.4. Limitations
5. Conclusions and Recommendations
5.1. Conclusions
5.2. Recommendations
Author Contributions
Funding
Institutional Review Board Statement
Informed Consent Statement
Data Availability Statement
Conflicts of Interest
References
- Biddulph, M. Urban design, regeneration and the entrepreneurial city. Prog. Plan. 2011, 76, 63–103. [Google Scholar] [CrossRef]
- White, J.T. Pursuing design excellence: Urban design governance on Toronto’s waterfront. Prog. Plan. 2016, 110, 1–41. [Google Scholar] [CrossRef] [Green Version]
- Zhou, J.; Ge, Y.; Zhang, K.; Tang, Q.; Ye, Y. Research and practice on the type of method for evaluating the implementation of conservation planning in historical and cultural landscape areas—An example of the Hengshan Road-Fuxing Road historical and cultural landscape area in Shanghai. J. Urban Plan. 2021, 4, 29–37. [Google Scholar] [CrossRef]
- Zhan, M.; Peng, D.L. Urban physical examination evaluation methods and improvement strategies for territory space security: The case study of Guangzhou. J. Nat. Resour. 2021, 36, 2382–2393. [Google Scholar] [CrossRef]
- Yang, Y.; Li, G.P.; Sun, Y.; Fu, H. A comparative study on the physical examination and planning implementation assessment of large cities at home and abroad. Geoscience 2022, 2, 16–25. [Google Scholar]
- Zhang, X.; Hua, Q.; Zhang, L. Development and application of a planning support system for regional spatial functional zoning based on GIS. Sustainability 2016, 8, 909. [Google Scholar] [CrossRef] [Green Version]
- Gu, C.; Wang, Y.; Shao, Y.; Gu, J. Research on administrative divisions based on functional areas analysis: A case of Shaoxing metropolitan area. Acta Geogr. Sin. 2015, 70, 1187–1201. [Google Scholar]
- Liu, X.; Peng, W. Urban functional zoning, and zoning classification management. Urban Oper. Manag. 2010, 4, 20–22. [Google Scholar]
- Hu, Y.F.; Han, Y.Q. Identification of urban functional areas based on POI Data: A case study of the Guangzhou Economic and Technological Development Zone. Sustainability 2019, 11, 1385. [Google Scholar] [CrossRef] [Green Version]
- Oliveria, V.; Yaygin, M.A. The concept of the morphological region: Developments and prospects. Urban Morph. 2020, 1, 35–52. [Google Scholar]
- Comert, N.Z.; Hoskara, S.O. A typo-morphological study: The CMC industrial mass housing district, Lefke, Northern Cyprus. Open House Int. 2013, 38, 16–30. [Google Scholar] [CrossRef]
- Pei, T.; Sobolevsky, S.; Ratti, C.; Sw, S.-L.; Li, T.; Zhou, C. A new insight into land use classification based on aggregated mobile phone data. Int. J. Geogr. Inf. Syst. 2014, 28, 1988–2007. [Google Scholar] [CrossRef] [Green Version]
- Zhang, X.; Du, S.; Wang, Q. Hierarchical semantic cognition for urban functional zones with VHR satellite images for and POI data. ISPRS J. Photogram. Remote Sen. 2017, 132, 170–184. [Google Scholar]
- Xing, H.F.; Meng, Y. Integrating landscape metrics and socioeconomic features for urban functional region classification. Comput. Environ. Urban Syst. 2018, 72, 134–145. [Google Scholar] [CrossRef]
- Farmer, C.J.Q.; Fotheringham, A.S. Network-based functional regions. Environ. Plan. A 2011, 43, 2723–2741. [Google Scholar] [CrossRef]
- Luo, S.; Liu, Y.; Du, M.; Gao, S.; Wang, P.; Liu, X. The influence of spatial grid division on the layout analysis of urban functional areas. Int. J. Geo-Inf. 2021, 10, 189. [Google Scholar] [CrossRef]
- Ye, Y.; Huang, R.; Zhang, L.Z. Quantitative urban morphology: Emergence, concepts, and urban design responses. Time + Archit. 2021, 1, 34–43. [Google Scholar]
- Van de Voorde, T.; Ven Der Kwast, J.; Poelmans, L.; Canters, F.; Binard, M.; Cornet, Y.; Williams, B. Projecting alternative urban growth patterns: The development and application of a remote sensing assisted calibration framework for the great Dublin area. Landsc. Urban Plan. 2016, 167, 399–409. [Google Scholar] [CrossRef] [Green Version]
- Liu, Y.; Wang, F.; Xiao, Y.; Gao, S. Urban land uses and traffic ‘source-sink areas’: Evidence from GPS-enabled taxi data in Shanghai. Landsc. Urban Plan. 2012, 106, 73–87. [Google Scholar] [CrossRef]
- Mao, H.; Ahn, Y.-Y.; Bhaduri, B.; Thakur, G. Improving land use inference by factorizing mobile phone call activity matrix. J. Land Use Sci. 2017, 12, 138–153. [Google Scholar] [CrossRef]
- Zhou, S.; Hao, X.; Liu, L. Validation of spatial decay law caused by urban commercial centre’s mutual attraction in polycentric city: Spatio-temporal data mining of floating cars’ GPS data in Shenzhen. Acta Geogr. Sin. 2014, 69, 1810–1820. [Google Scholar] [CrossRef]
- Wang, B.; Zhen, F.; Zhang, H. The dynamic changes of urban space-time activity and activity zoning based on check-in data in Sina web. Acta Geogr. Sin. 2015, 35, 151–160. [Google Scholar]
- Zhang, X.Y.; Li, W.W.; Zhang, F.; Liu, R.Y.; Du, Z.H. Identifying urban functional zones using public bicycle rental records and point-of-interest data. ISPRS Int. J. Geo. Inf. 2018, 7, 459. [Google Scholar] [CrossRef] [Green Version]
- Yan, S.C.; Wang, J.L.; Li, C.M.; Dai, Z.X.; Li, H. Urban functional zoning considering POI and land use data. J. Geomat. Sci. Technol. 2021, 38, 181–186. [Google Scholar]
- Han, Z.; Cui, C.; Miao, C.; Wang, H.; Chen, X. Identifying spatial patterns of retail stores in road network structure. Sustainability 2019, 11, 4539. [Google Scholar] [CrossRef] [Green Version]
- Yi, D.; Yang, J.; Liu, J.; Liu, Y.; Zhang, J. Quantitative identification of urban functions with Fishers’ Exact Test and POI data applied in classifying urban districts: A case study within the Sixth Ring Road in Beijing. ISPRS Int. J. Geo-Inf. 2019, 8, 555. [Google Scholar] [CrossRef] [Green Version]
- Zhang, Y.; Liu, J.P.; Wang, Y.; Cao, Y.G.; Bai, Y.D. Research on the method of urban jobs-housing space recognition combining trajectory and POI Data. ISPRS Int. J. Geo-Inf. 2021, 10, 71. [Google Scholar] [CrossRef]
- Cao, Y.H.; Liu, J.P.; Wang, Y.; Wang, L.J.; Wu, W.Z.; Su, F.Z. Research on the functional classification method of urban buildings based on POI data. J. Geo-Inf. Sci. 2020, 22, 1339–1348. [Google Scholar]
- Niu, H.; Silva, E.A. Delineating urban functional use from points of interest data with neural network embedding: A case study in Greater London. Comp. Environ. Urban Syst. 2021, 88, 101651. [Google Scholar] [CrossRef]
- Aubrecht, C.; Steinnocher, K.; Hollaus, M.; Wagner, W. Integrating earth observation and GIScience for high resolution spatial and functional modeling of urban land use. Comp. Environ. Urban Syst. 2009, 33, 15–25. [Google Scholar] [CrossRef]
- Lu, C.Y.; Pang, M.; Zhang, Y.; Li, H.J.; Lu, C.P.; Tang, X.L.; Cheng, W. Mapping urban spatial structure based on POI (Point of Interest) data: A case study of the central city of Lanzhou. ISPRS Intern. J. Geo-Inf. 2020, 9, 92. [Google Scholar] [CrossRef] [Green Version]
- Westlund, H. A brief history of time, space, and growth: Waldo Tobler’s first law of geography revisited. Ann. Reg. Sci. 2013, 51, 917–924. [Google Scholar] [CrossRef]
- Caruso, G.; Hilal, M.; Thomas, I. Measuring urban forms from inter-building distances: Combining MST graphs with a Local Index of Spatial Association. Landsc. Urban Plan. 2017, 163, 80–89. [Google Scholar] [CrossRef] [Green Version]
- Cetinkaya, S.; Basaraner, M.; Burghardt, D. Proximity-based grouping of buildings in urban blocks: A comparison of four algorithms. Geocarto Int. 2015, 30, 618–632. [Google Scholar] [CrossRef]
- Wu, B.; Wu, Q.S.; Chen, Z.Q.; Yao, S.J.; Huang, Y.; Wu, J.P. An extended minimum spanning tree method for characterizing local urban patterns. Int. J. Geogr. Inf. Sci. 2018, 32, 450–475. [Google Scholar] [CrossRef]
- Wu, P.; Zhang, S.Q.; Li, H.P.; Dale, P.; Ding, X.H.; Lu, Y.B. Urban parcel grouping method based on urban form and functional connectivity characterisation. ISPRS Int. J. Geo-Inf. 2019, 8, 282. [Google Scholar] [CrossRef] [Green Version]
- Gehl, J. Life between Buildings: Using Public Space; Island Press: Washington, DC, USA, 2011. [Google Scholar]
- Richardson, R.; White, J.T. Design governance, austerity and the public interest: Planning and the delivery of ‘well-designed places’ in West Dunbartonshire, Scotland. Plan. Theory Pract. 2021, 22, 572–594. [Google Scholar] [CrossRef]
- Lak, A.; Hasankhan, F.; Garakani, S.A. Principles in practice: Toward a conceptual framework for resilient urban design. J. Environ. Plan. 2020, 63, 2194–2226. [Google Scholar] [CrossRef]
- Iaione, C. The CO-City: Sharing, collaborating, cooperating, and commoning in the city. Am. J. Econ. Sociol. 2016, 75, 415–455. [Google Scholar] [CrossRef]
- Kokx, A. Management of urban development processes in The Netherlands: Governance, design & feasibility. J. Hous. Built Environ. 2013, 28, 409–410. [Google Scholar]
- Oakley, S. Re-imagining city waterfronts: A comparative analysis of governing renewal in Adelaide, Darwin, and Melbourne. Urban Policy Res. 2011, 29, 221–238. [Google Scholar] [CrossRef]
- Wang, H.W.; Li, Y.; Zhou, Y.G.; Tong, L.; Jin, F.S. Conservation and regeneration strategies for Shenyang’s historic landscape district. Planners 2020, S1, 75–84. [Google Scholar]
- Liu, Z.G.; Zhang, T.L.; Dong, Z.Y. Planning and implementation strategies for the conservation of historical buildings in Shenyang. Planners 2014, 30, 80–85. [Google Scholar]
- Hanqing, B.; Dongping, M.; Ya, G.; Kui, Z.; Keqi, Z.; Shigao, D. DFCNN-Based Semantic Recognition of Urban Functional Zones by Integrating Remote Sensing Data and POI Data. Remote. Sens. 2020, 12, 1088. [Google Scholar]
- Chi, J.; Jiao, L.M.; Dong, T. Quantitative identification, and visualisation of urban functional area based on POI data. J. Geom. Sci. Technol. 2016, 41, 68–73. [Google Scholar]
- Porat, I.; Shach-Pinsly, D. Building morphometric analysis as a tool for urban renewal: Identifying post-Second World War mass public housing development potential. J. Environ. Plan. B-URBAN Anal. City Sci. 2019, 48, 148–264. [Google Scholar] [CrossRef]
- Dong-woo, K.; Woo-Hyun, Y. The Development Unit and Direction for Gradual Development of Released Renewal District. J. SH Urban Res. Insight 2019, 8, 17–32. [Google Scholar] [CrossRef]
- Guo, L.; Kunhui, Y. Interactive effects of high-speed rail on nodal zones in a city: Exploratory study on China. J. Front. Eng. Manag. 2019, 6, 327–335. [Google Scholar]
- Rubini, L. The railway station areas of Mestre: From the functional improvement to the urban renewal. J. Tria-Territ. Della Ric. su Insediamenti e Ambiente 2015, 8, 89–102. [Google Scholar]
- Zurlo, R.; Sorbello, R. The high-speed railway hub of Florence Protection measures of pre-existing historical buildings in the excavation of urban tunnels with thin cover. J. Gallerie e Grandi Opera Sotter. 2022, 140, 37–45. [Google Scholar]
- Shen, Y.; Martinez, L.M.; Silva, J.D.E. Cellular agent-based approach incorporating spatial discrete choice methods simulation of future land use impacts of high-speed rail on Aveiro, Portugal. J. Transp. Res. Rec. 2014, 2430, 105–115. [Google Scholar] [CrossRef]
- Zhao, G.Y.; Song, J.S. Methodological improvements in measuring the functional mix of urban land. J. Urban Plan. 2022, 1, 54–61. [Google Scholar]
- Hu, X.M.; Li, X.L.; Wei, F. Research on the identification of urban functional areas and their mix based on POI—An example of the core urban area of Chongqing. J. Southwest Univ. 2021, 43, 169–178. [Google Scholar]
- Hubbard, P. Urban design and city regeneration: Social representations of entrepreneurial landscapes. Urban Stud. 1996, 33, 1441. [Google Scholar] [CrossRef]
- Yang, Z.; Su, J.; Yang, H.; Zhao, Y. Exploring urban functional areas based on multi-source data: A case study of Beijing. J. Geog. Res. 2021, 40, 477–494. [Google Scholar]


| Format Index | A1 | B11 | B13 | B14 | B21 | B29 | B3 | R22 |
|---|---|---|---|---|---|---|---|---|
| General category | A | B | R | |||||
| Affiliated land | Administrative offices | Retail businesses | Restaurants | Hotels | Finance & insurance | Other business facilities | Entertainment & recreation | Residential services |
| POI format category | Government agencies & social organisations | Shopping services | Dining services | Accommodation, business & residential services | Companies & enterprise and financial & insurance services | Scientific, educational, and cultural services, automobile repair, other | Sports and leisure services | Life and medical services |
| No. of cases | Valid data | 6008 | 6008 | 6008 | 6008 | 6008 | 6008 | 6008 | 6008 | 6008 |
| Missing data | 0.000 | 0.000 | 0.000 | 0.000 | 0.000 | 0.000 | 0.000 | 0.000 | 0.000 | |
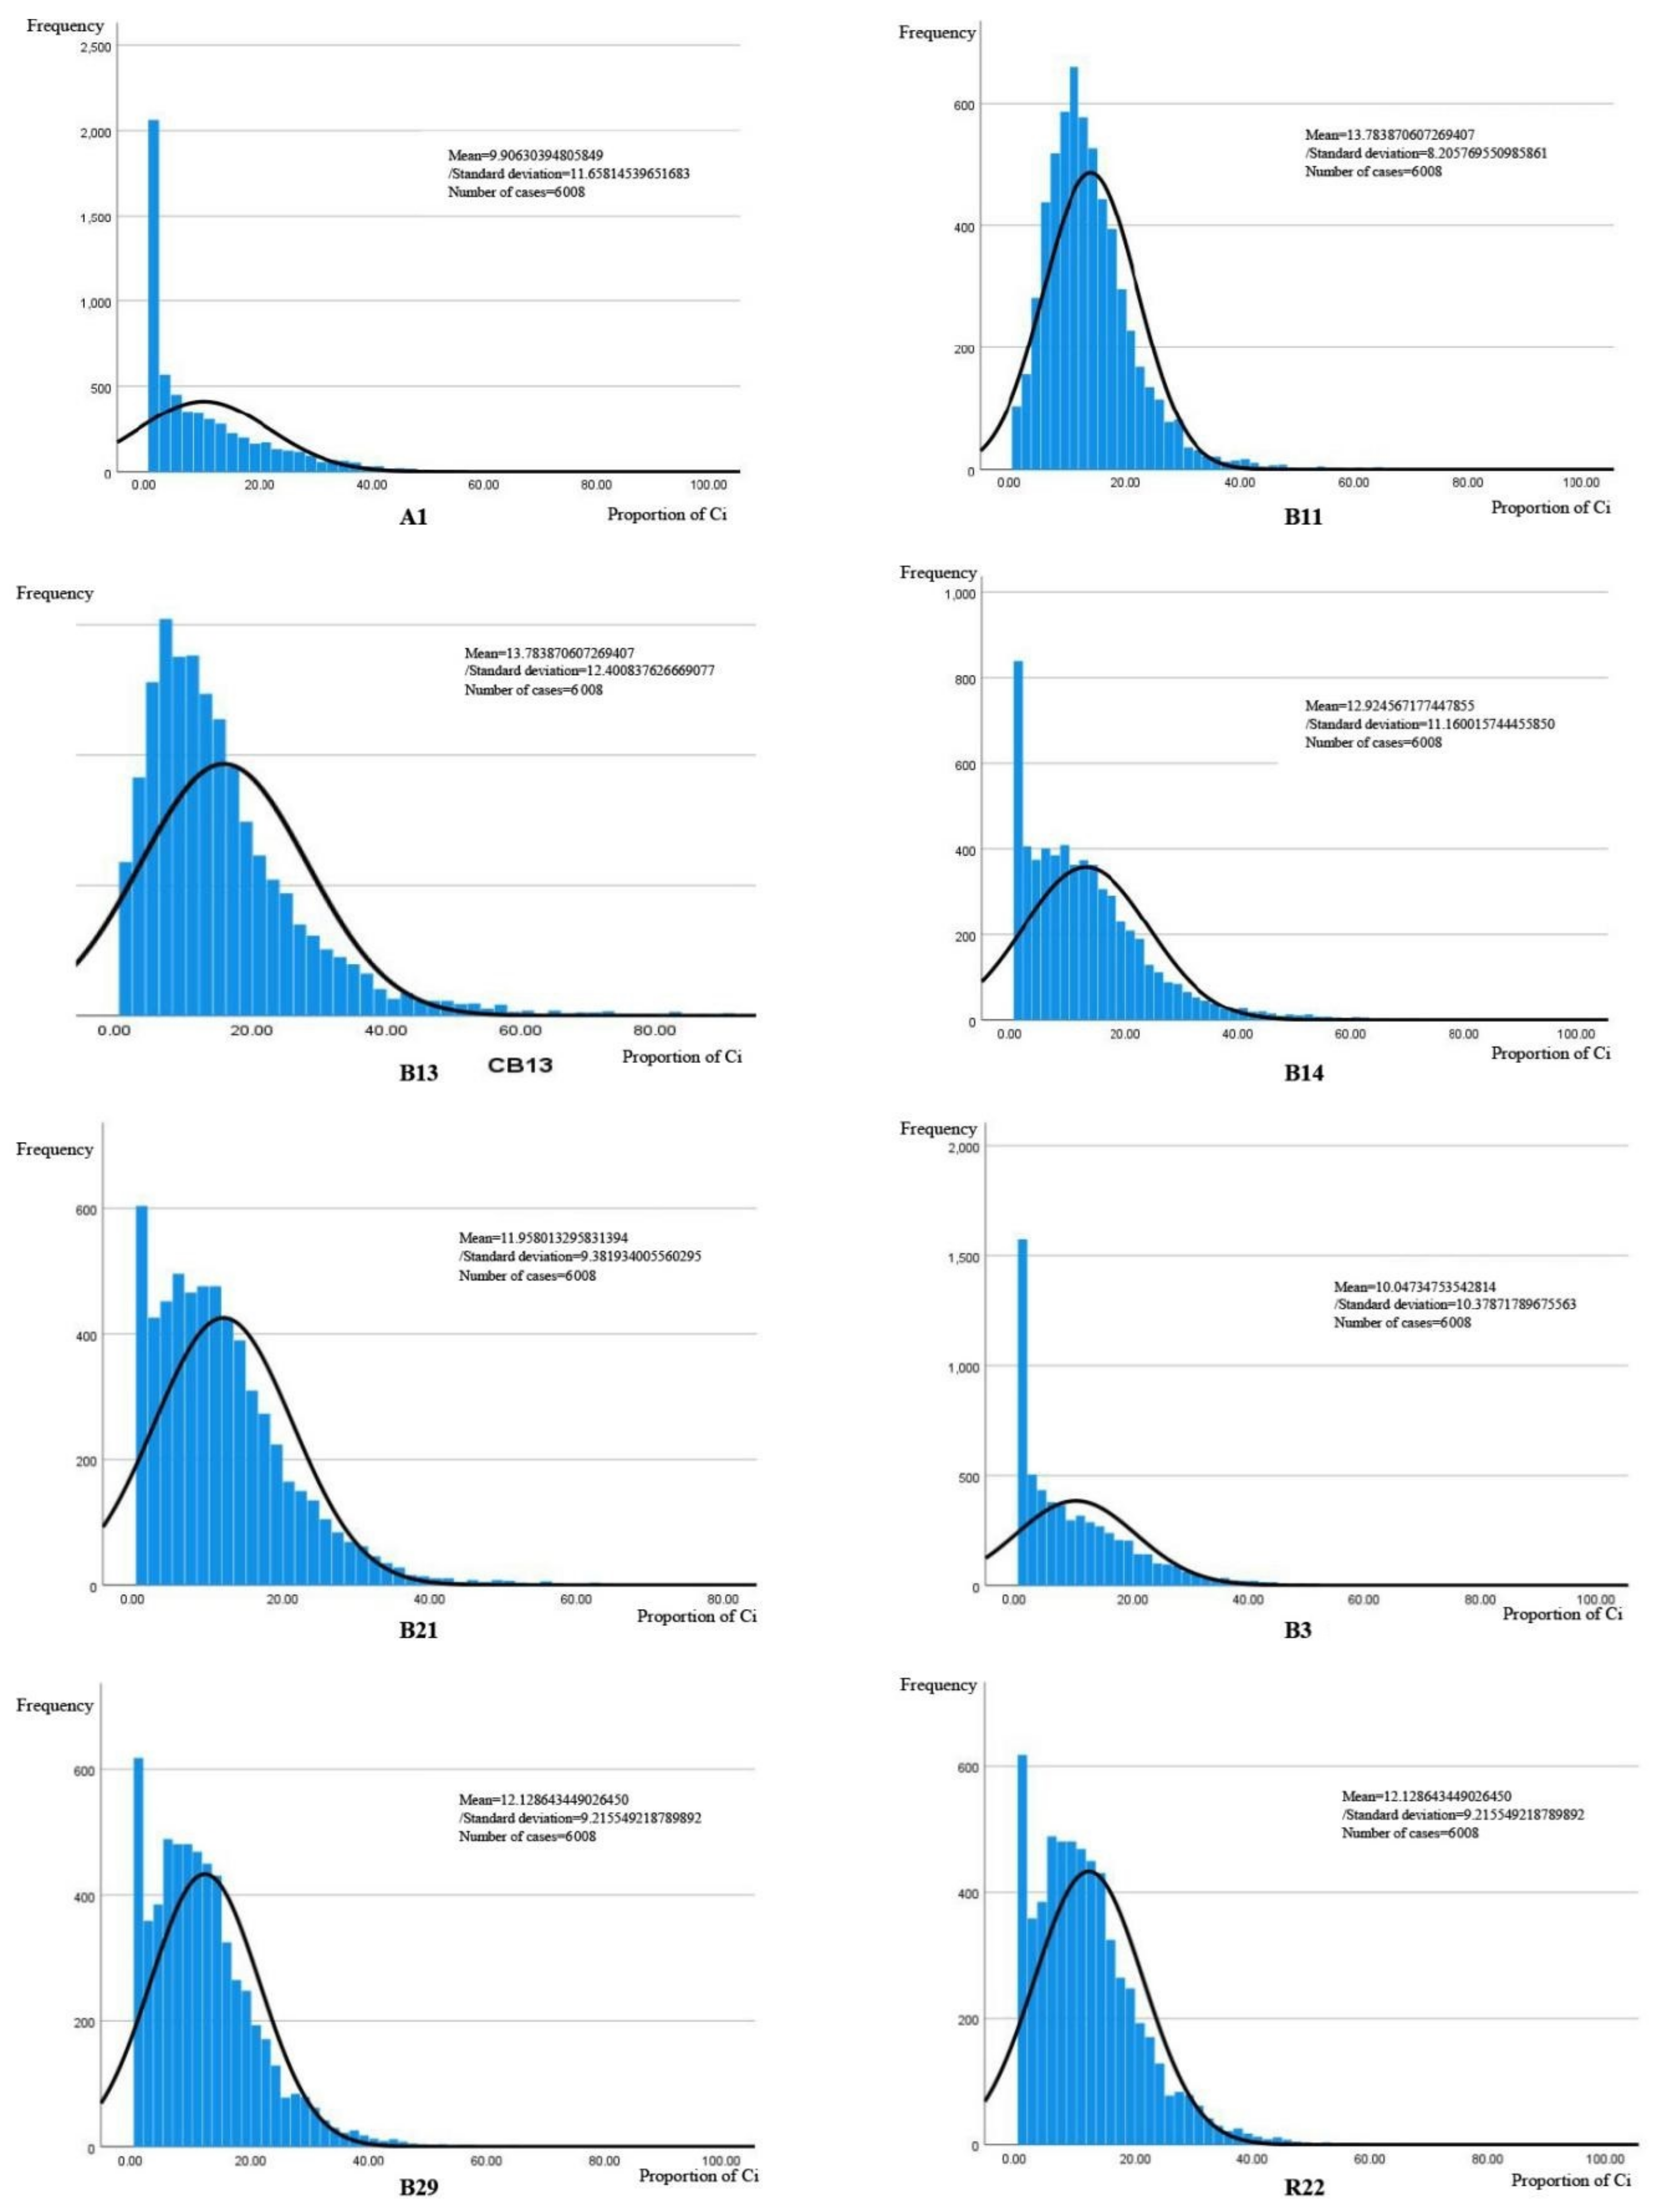
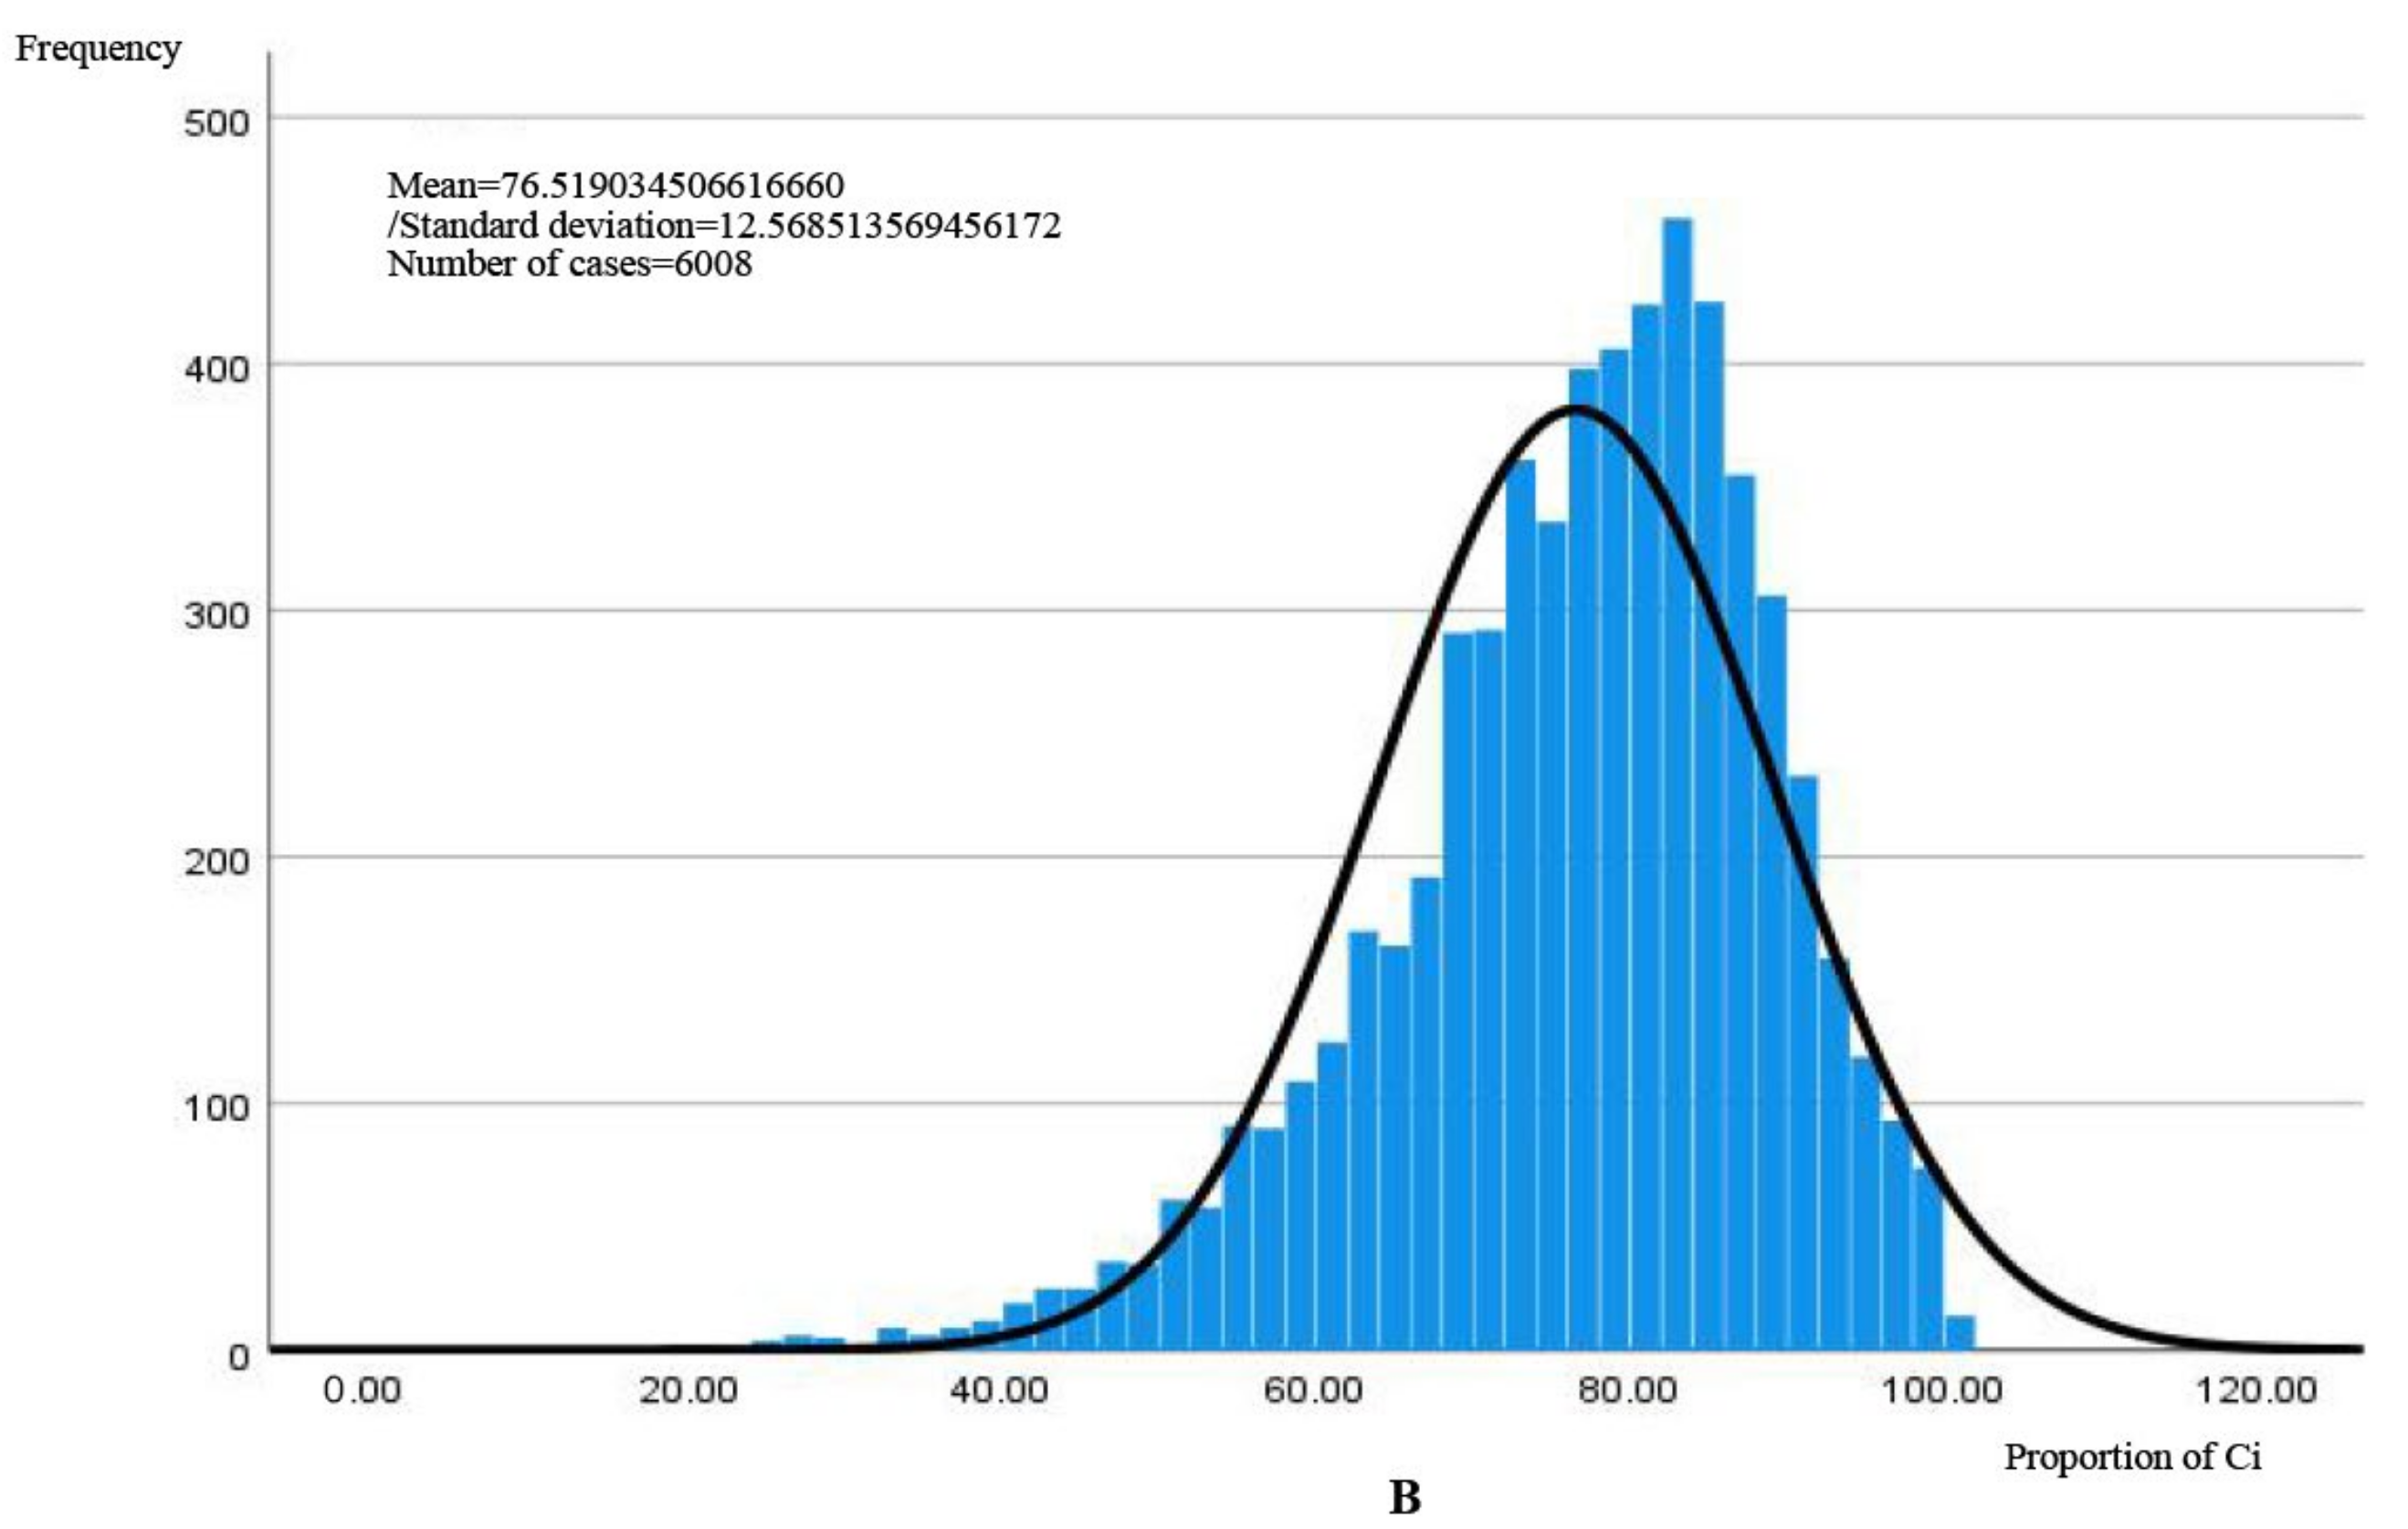
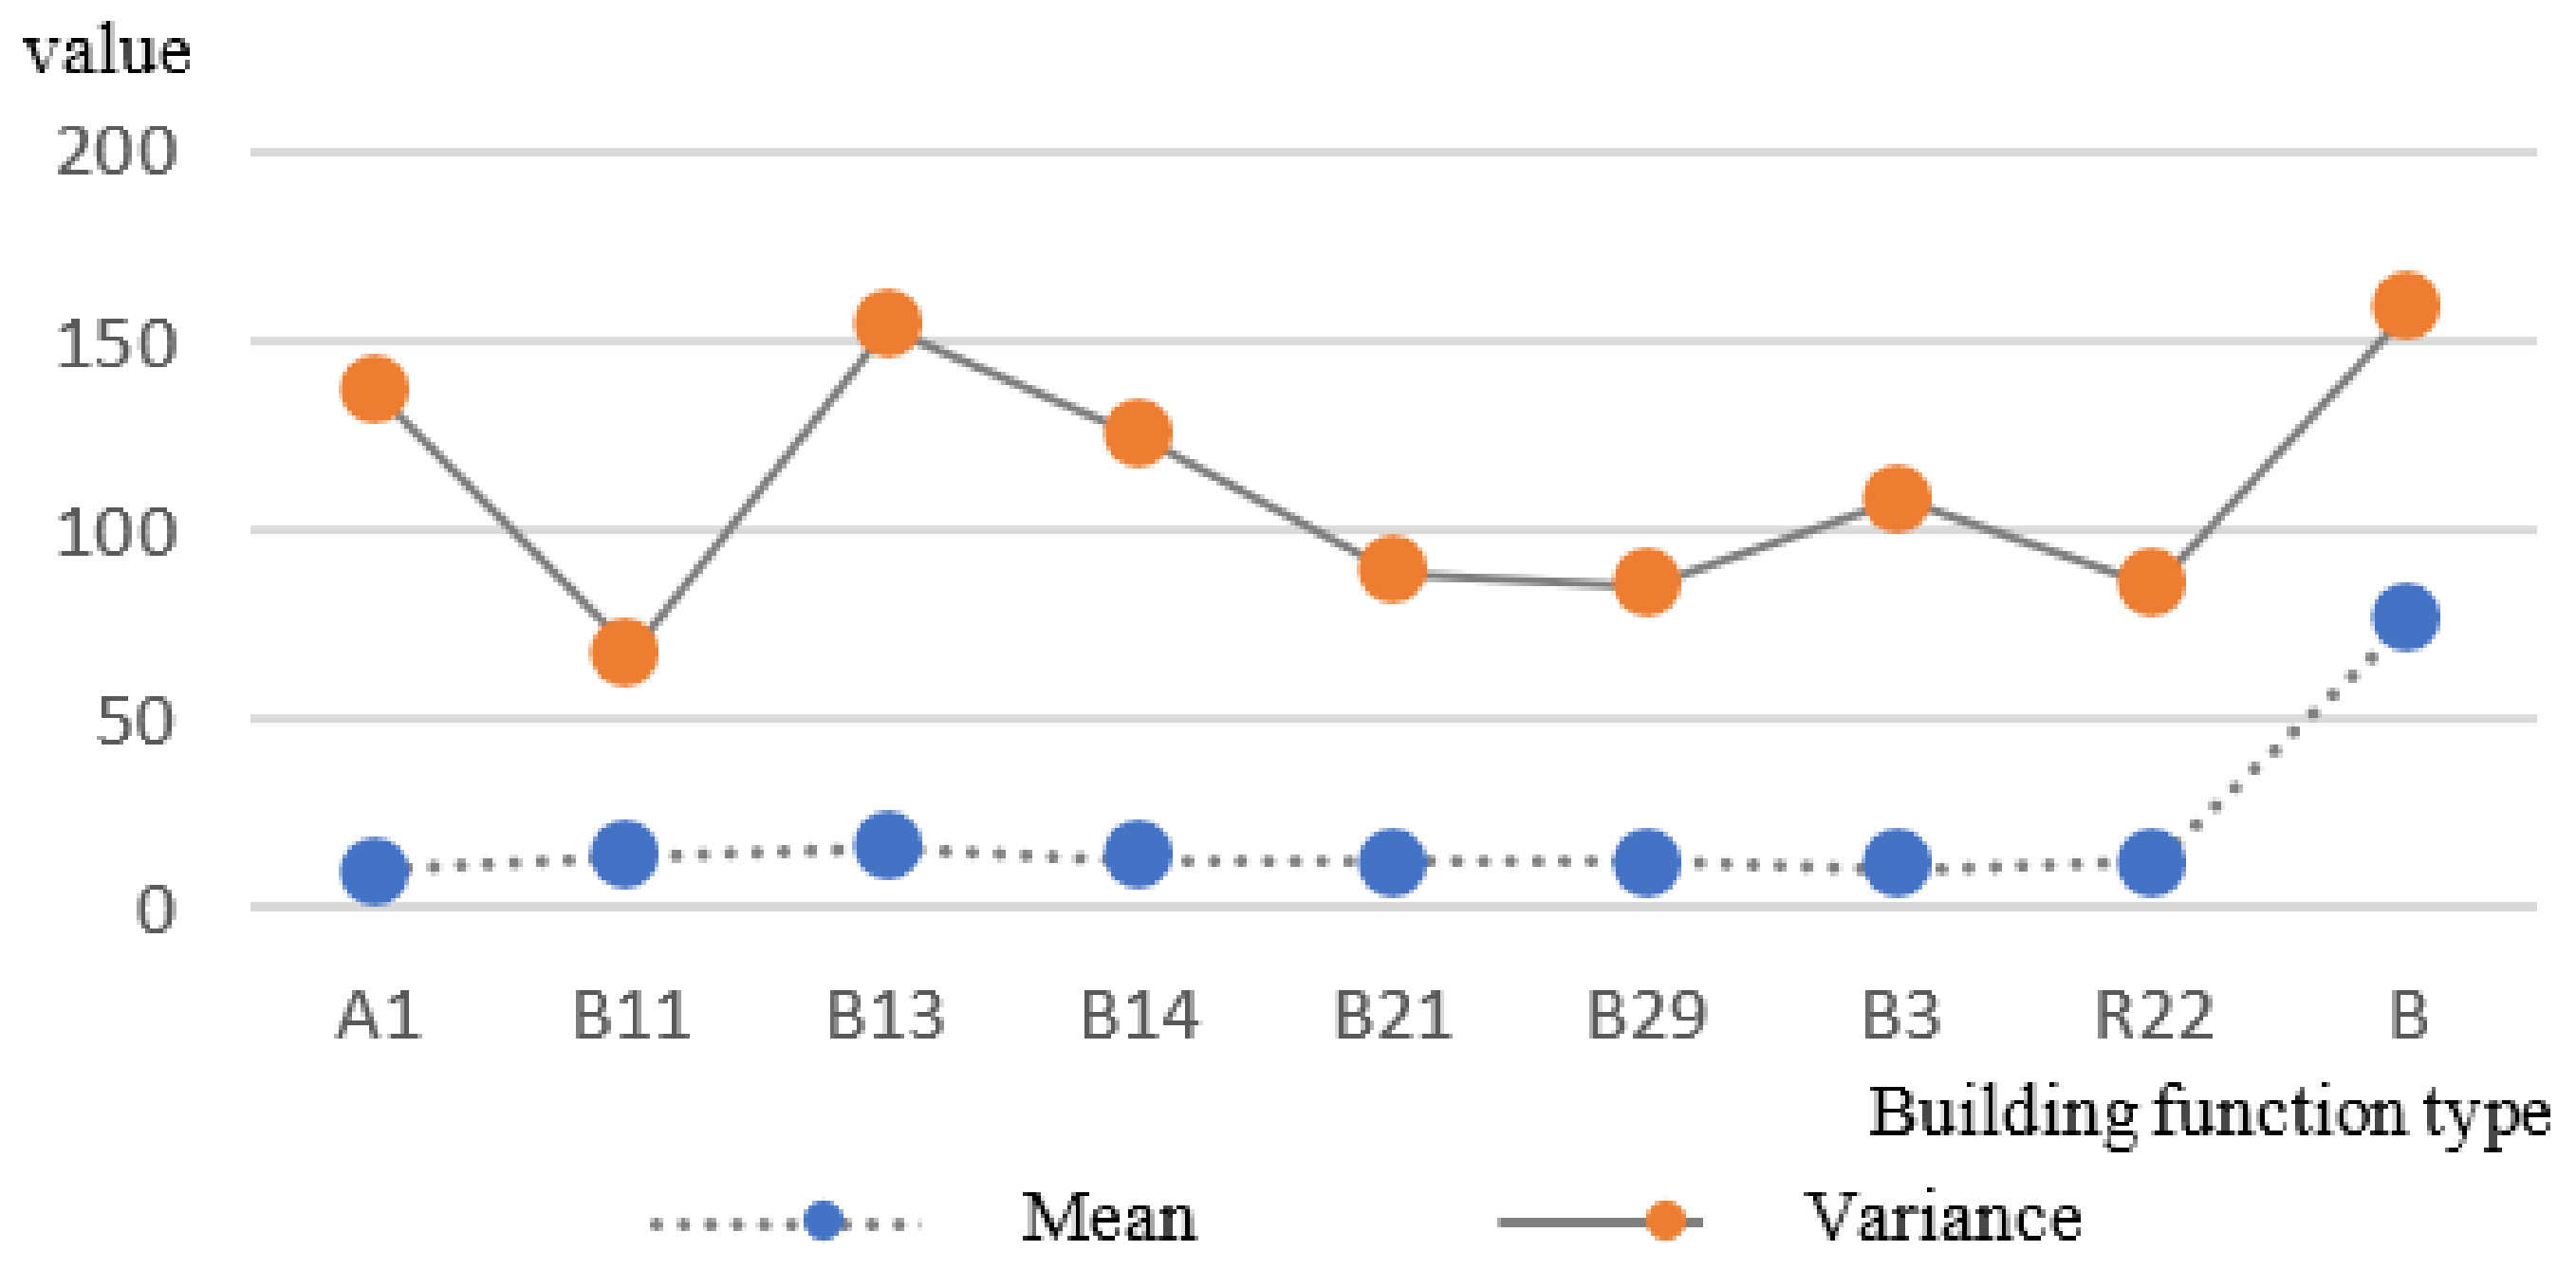
| Mean | 9.906 | 13.784 | 15.677 | 12.925 | 11.958 | 12.129 | 10.047 | 12.129 | 76.519 | |
| Standard deviation | 11.658 | 8.206 | 12.401 | 11.160 | 9.382 | 9.216 | 10.379 | 9.216 | 12.569 | |
| Variance | 135.912 | 67.335 | 153.781 | 124.546 | 88.021 | 84.926 | 107.718 | 84.926 | 157.968 | |
| Skewness | 1.660 | 1.726 | 2.030 | 1.439 | 1.401 | 1.333 | 1.471 | 1.333 | (0.929) | |
| Standard error of skewness | 0.032 | 0.032 | 0.032 | 0.032 | 0.032 | 0.032 | 0.032 | 0.032 | 0.032 | |
| Kurtosis | 3.575 | 6.270 | 6.462 | 3.004 | 3.275 | 3.418 | 2.952 | 3.418 | 1.565 | |
| Standard error of kurtosis | 0.063 | 0.063 | 0.063 | 0.063 | 0.063 | 0.063 | 0.063 | 0.063 | 0.063 | |
| Min. value | 0.000 | 0.000 | 0.000 | 0.000 | 0.000 | 0.000 | 0.000 | 0.000 | 1.664 | |
| Max. value | 98.336 | 85.889 | 100.00 | 81.395 | 76.316 | 86.472 | 86.616 | 86.472 | 100.00 | |
| A1 | B11 | B13 | B14 | B21 | B29 | B3 | R22 | B | ||
|---|---|---|---|---|---|---|---|---|---|---|
| Global Moran’s Ⅰ | Index | 0.057265 | 0.349522 | 0.349522 | 0.065379 | 0.014452 | 0.024536 | 0.200207 | 0.150106 | 0.289477 |
| Z-score | 1.199865 | 7.110324 | 7.110324 | 2.510486 | 0.367017 | 0.568939 | 4.547237 | 3.60044 | 6.019681 | |
| p-value | 0.230192 | 0 | 0 | 0.012057 | 0.713607 | 0.569397 | 0.000005 | 0.000318 | 0 | |
Publisher’s Note: MDPI stays neutral with regard to jurisdictional claims in published maps and institutional affiliations. |
© 2022 by the authors. Licensee MDPI, Basel, Switzerland. This article is an open access article distributed under the terms and conditions of the Creative Commons Attribution (CC BY) license (https://creativecommons.org/licenses/by/4.0/).
Share and Cite
Liu, S.; Su, L.; Guo, H.; Chen, Y. Identification of Urban Functional Areas and Governance Measures Based on Point of Interest Data: A Case Study of the Shenyang Railway Station Area in Shenyang City. Buildings 2022, 12, 1038. https://doi.org/10.3390/buildings12071038
Liu S, Su L, Guo H, Chen Y. Identification of Urban Functional Areas and Governance Measures Based on Point of Interest Data: A Case Study of the Shenyang Railway Station Area in Shenyang City. Buildings. 2022; 12(7):1038. https://doi.org/10.3390/buildings12071038
Chicago/Turabian StyleLiu, Shengjun, Lihong Su, Hongqian Guo, and Yijing Chen. 2022. "Identification of Urban Functional Areas and Governance Measures Based on Point of Interest Data: A Case Study of the Shenyang Railway Station Area in Shenyang City" Buildings 12, no. 7: 1038. https://doi.org/10.3390/buildings12071038