
Experimental and Numerical Studies on Repaired Wooden Beam of Traditional Buildings in Huizhou Region, China

Abstract
:1. Introduction
2. Materials and Methods
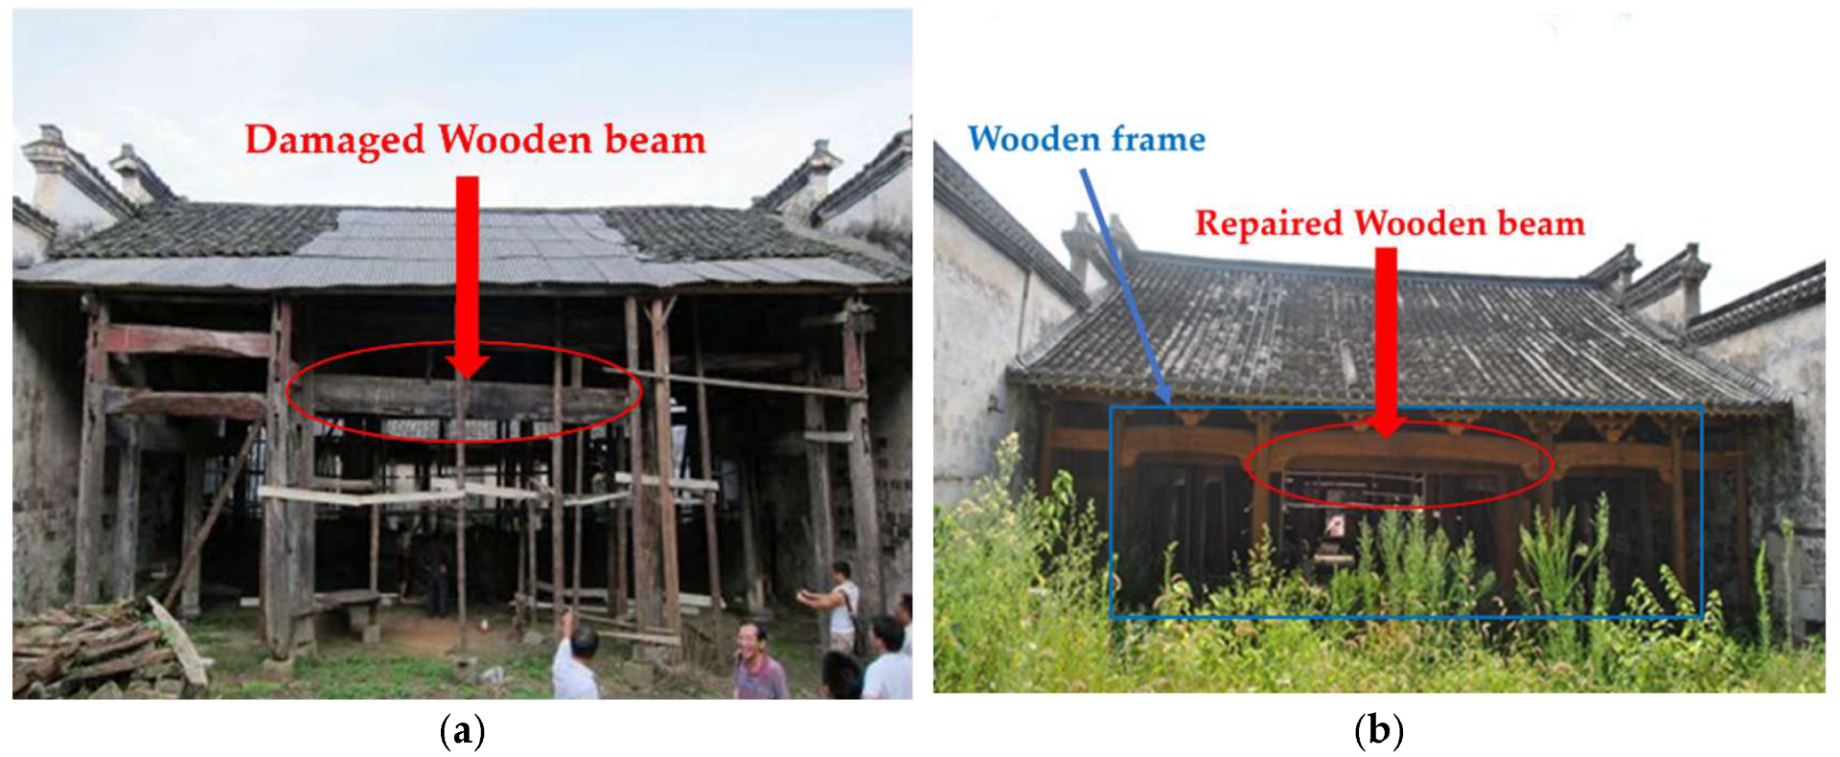
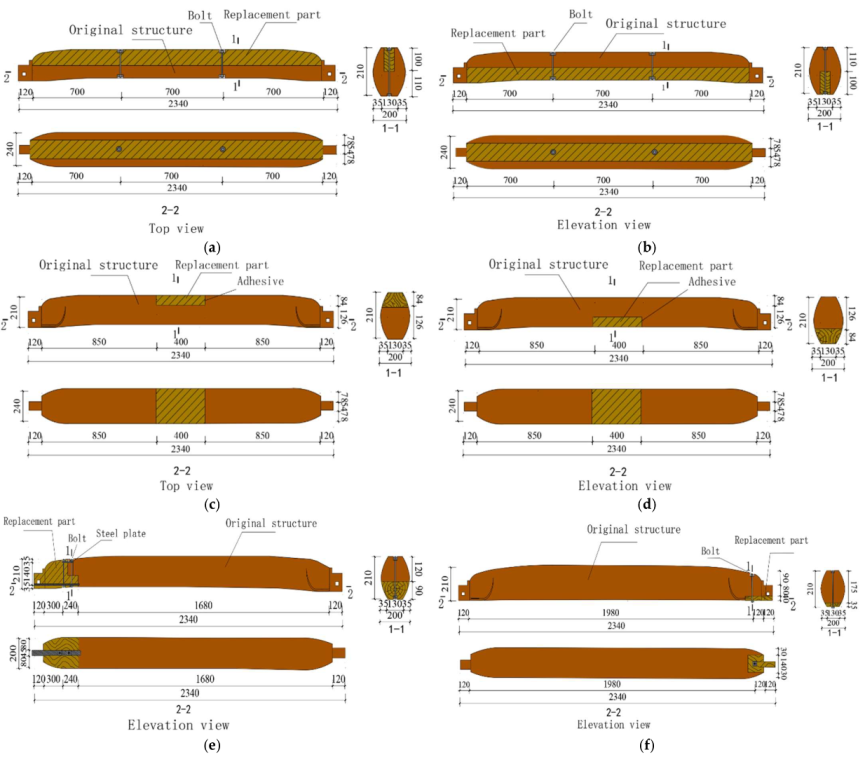
2.1. Establishment of Repair Methods
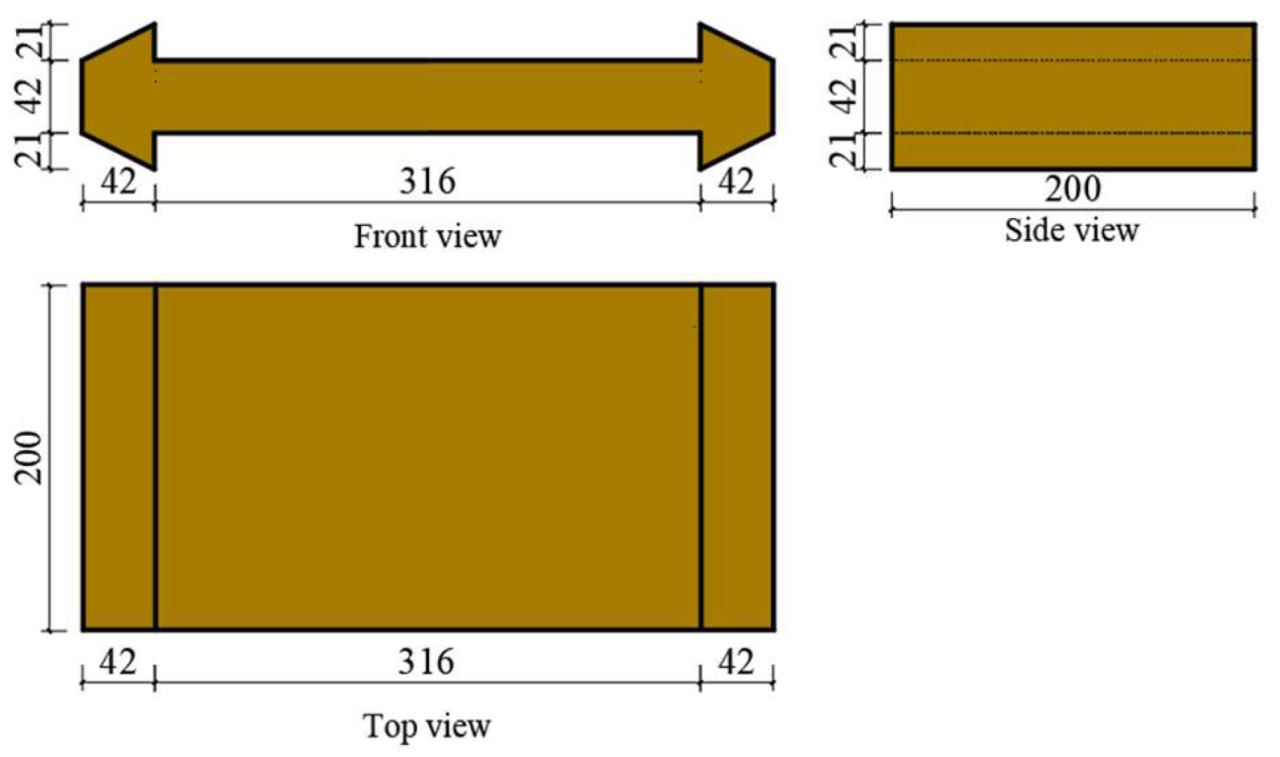
2.2. Experimental Design
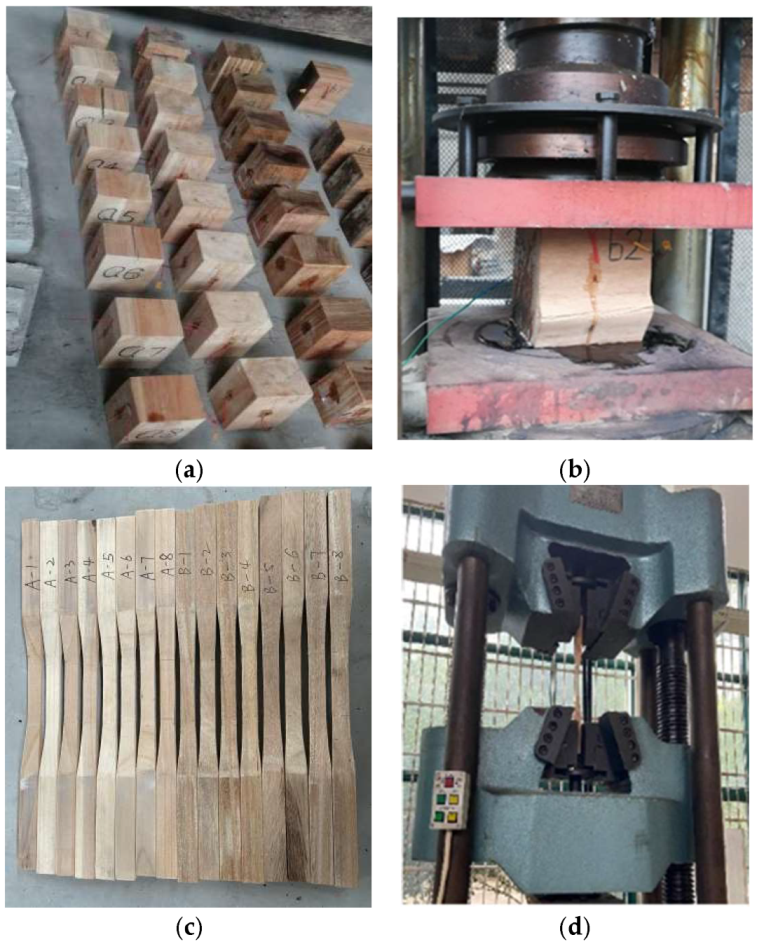
2.3. Mechanical Characteristics of Materials
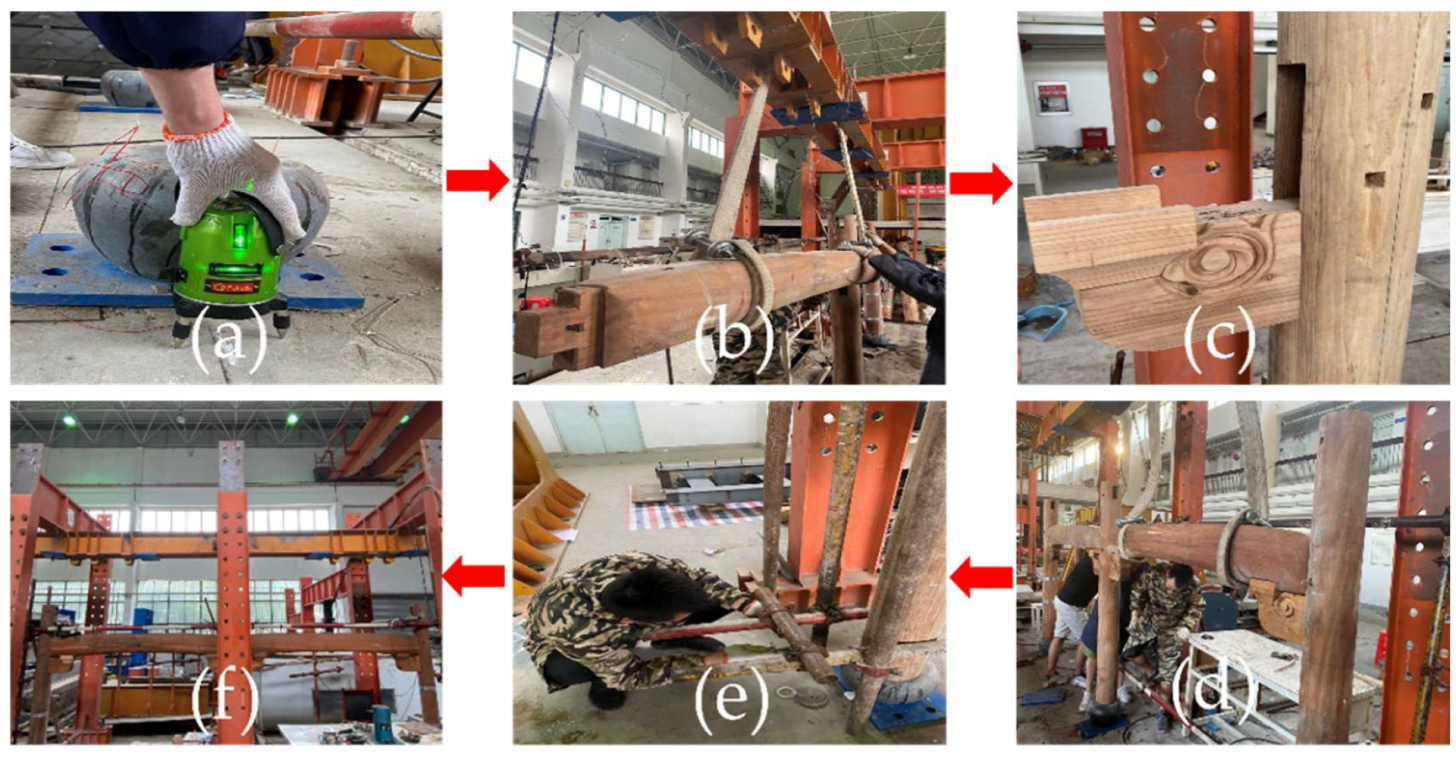
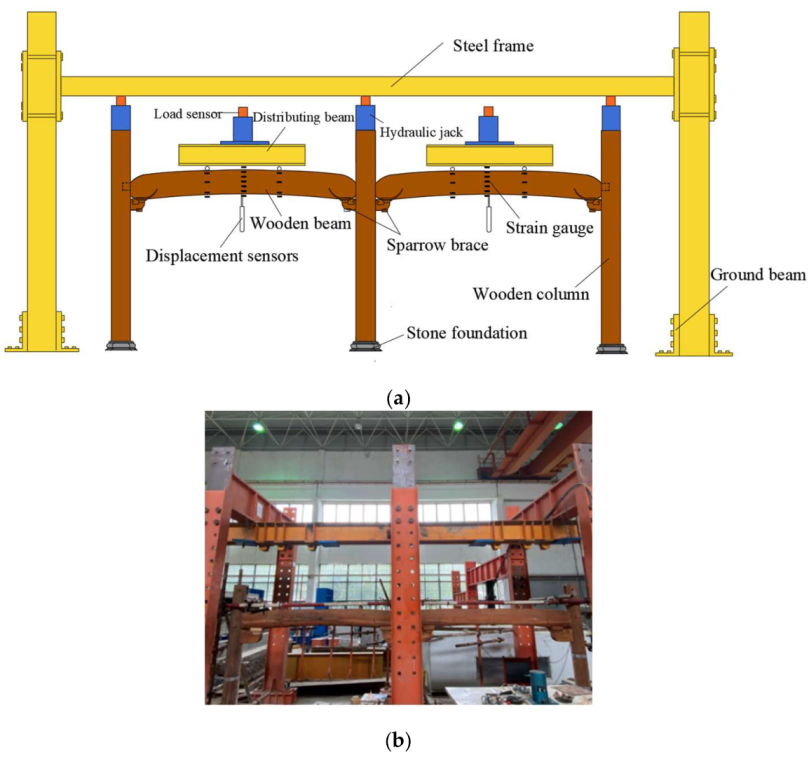
2.4. Experimental and Loading Devices
3. Test Results
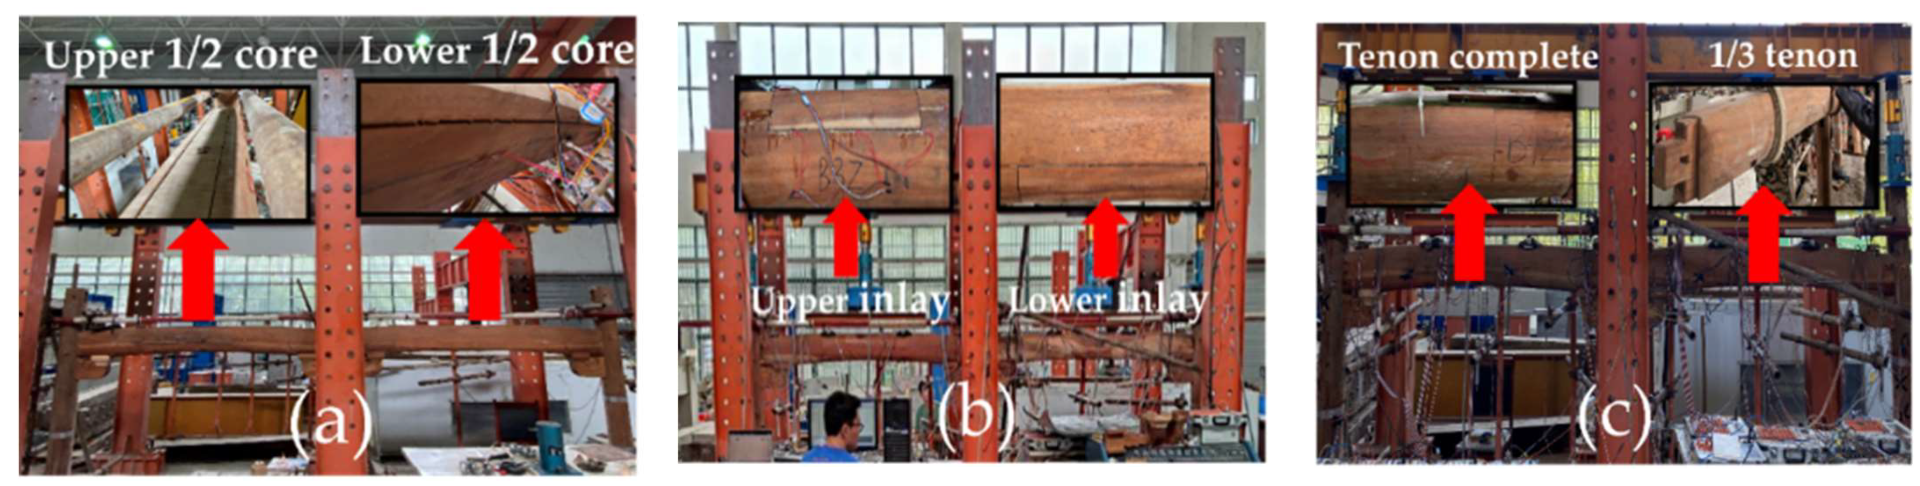
3.1. Failure Modes
3.2. Force-Displacement Curves
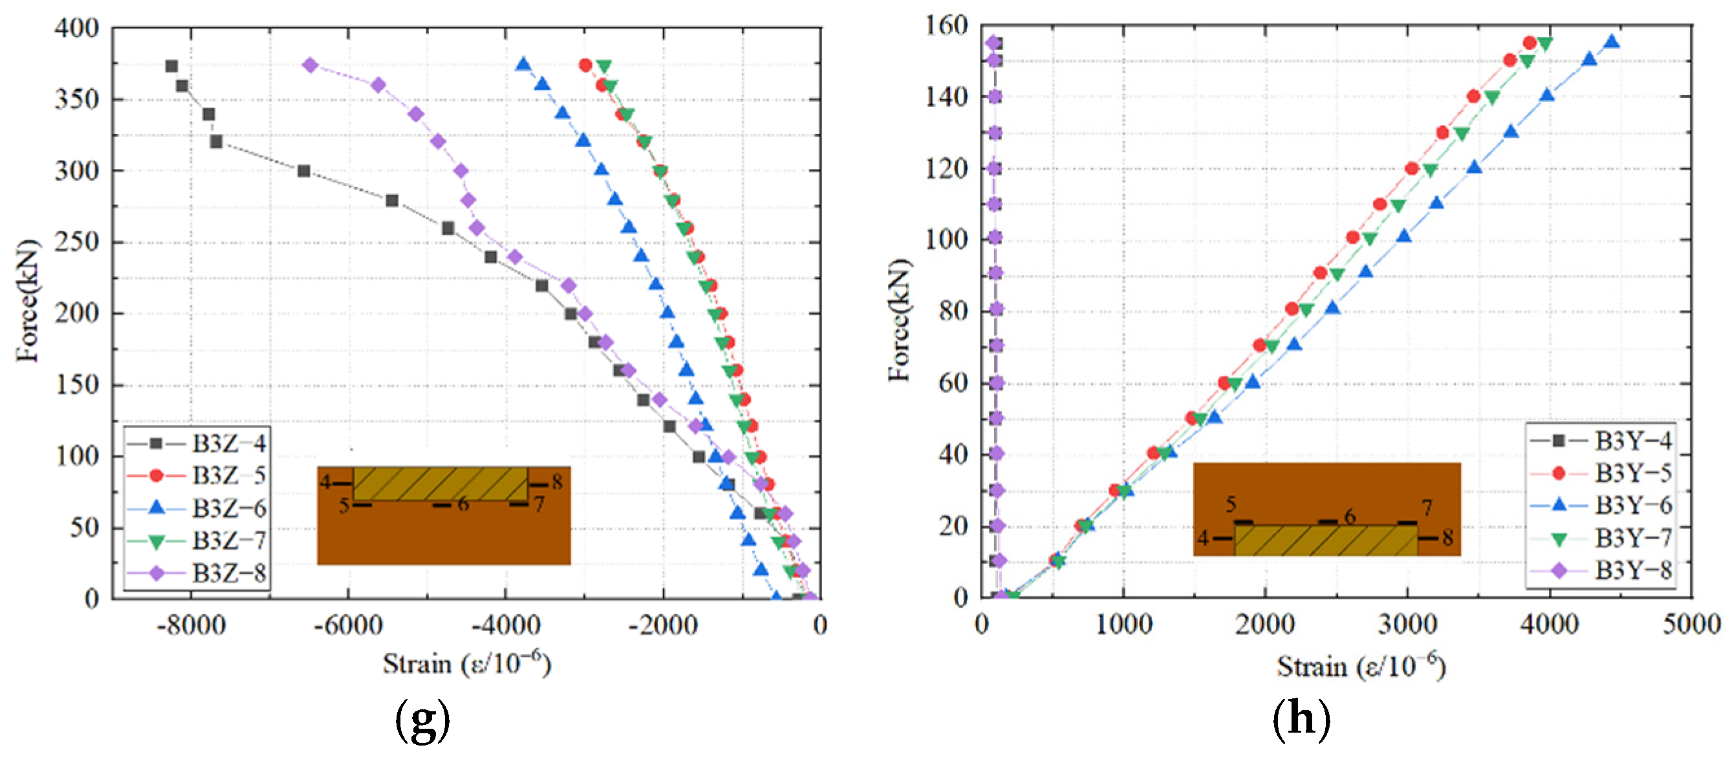
3.3. Force-Strain Curves
3.4. Mid-Span Height-Strain Curves
4. Finite Element Analysis
4.1. Repair Methods
4.2. Finite Element Model
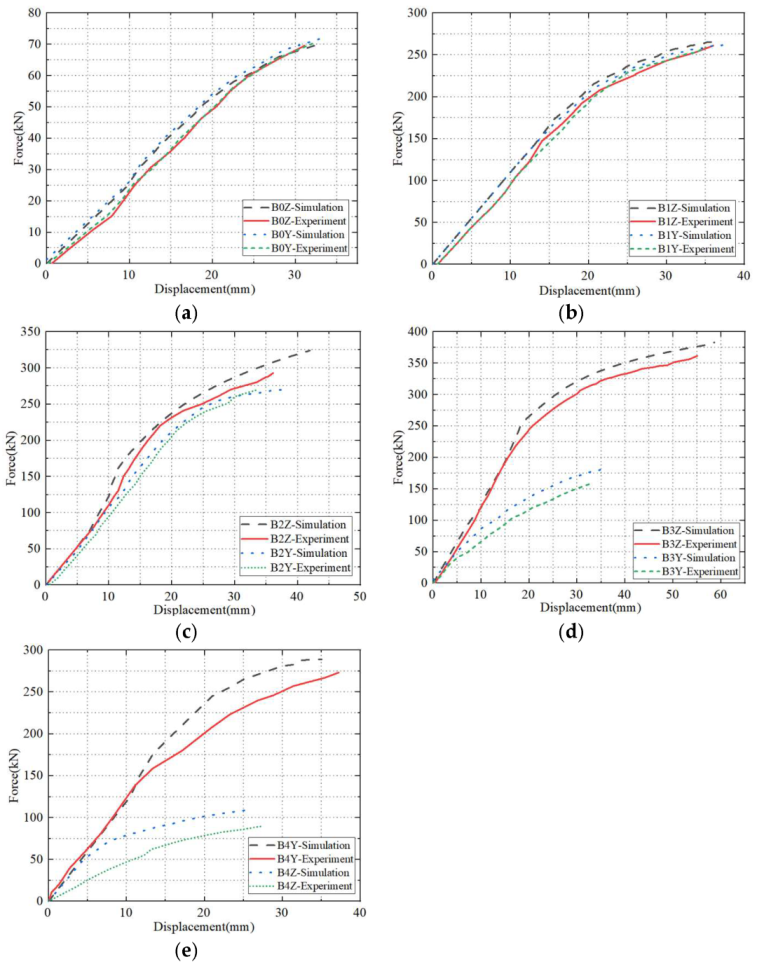
4.3. Comparison between the Simulation and Test Results
4.4. Parametric Analysis
4.4.1. Influence of Repair Height in Lower Inlay Method
4.4.2. Influence of Repair Position in Lower Inlay Method
4.4.3. Influence of Repair Form in Lower Inlay
5. Conclusions
- In the flexural test, the bearing capacity of Merbau was 3.73 times higher than that of Chinese fir in wooden beams without initial damage. The wooden beams exhibited brittle damage, and the maximum stress values were observed at the bottom 1/3 and 2/3 height of the tensile zone. The stress value on both sides of the upper inlay part varied greatly with the vertical contact part of the original structure, which should be given more attention in the analysis. For the lower inlay part, the top part of the reinforcement in contact with the original structure should be emphasized.
- The experimental and finite element results were combined to compare the bearing capacity and stiffness of wooden beams, and the results revealed the following performance order of the repair methods: complete tenon repair < lower inlay repair < lower 1/2 core repair < 1/3 tenon repair < upper 1/2 core repair < upper inlay repair. It was observed that for engineering applications, the upper and lower parts of the wooden beam with initial damage could be more effectively repaired by the inlay method and core method, respectively. Compared to the overall damage of the tenon, the proposed tenon repair method was more effective for partial tenon damage.
- The parametric analysis revealed that the bearing capacity of the beam with lower inlay repair was inversely proportional to the repair height as well as the distance between the repair position and the span. Compared with the rectangular inlay form, the dovetail inlay form provided better performance indicators and effectively prevented stress concentration in the contact area.
6. Patent
Author Contributions
Funding
Institutional Review Board Statement
Informed Consent Statement
Data Availability Statement
Conflicts of Interest
References
- Asdrubali, F.; Ferracuti, B.; Lombardi, L.; Guattari, C.; Evangelisti, L.; Grazieschi, G. A review of structural, thermo-physical, acoustical, and environmental properties of wooden materials for building applications. Build. Environ. 2017, 114, 307–332. [Google Scholar] [CrossRef]
- Ghosal, M.; Ghosh, I. Restoration and development of listed heritage buildings in Kolkata, India. Proc. Inst. Civ. Eng.-Civ. Eng. 2021, 176, 53–58. [Google Scholar] [CrossRef]
- Yang, R.; Sun, Y.; Zhang, X. Application and progress of reinforcement technology for Chinese ancient buildings with wood structure. Geotech. Geol. Eng. 2020, 38, 5695–5701. [Google Scholar] [CrossRef]
- Gómez, E.P.; González, M.N.; Hosokawa, K.; Cobo, A. Experimental study of the flexural behavior of timber beams reinforced with different kinds of FRP and metallic fibers. Compos. Struct. 2019, 213, 308–316. [Google Scholar] [CrossRef]
- Donadon, B.F.; Mascia, N.T.; Vilela, R.; Trautwein, L.M. Experimental investigation of glued-laminated timber beams with Vectran-FRP reinforcement. Eng. Struct. 2020, 202, 109818. [Google Scholar] [CrossRef]
- Yeboah, D.; Gkantou, M. Investigation of flexural behaviour of structural timber beams strengthened with NSM basalt and glass FRP bars. Structures 2021, 33, 390–405. [Google Scholar] [CrossRef]
- Corradi, M.; Vemury, C.M.; Edmondson, V.; Poologanathan, K.; Nagaratnam, B. Local FRP reinforcement of existing timber beams. Compos. Struct. 2021, 258, 113363. [Google Scholar] [CrossRef]
- Işleyen, Ü.K.; Kesik, H.İ. Experimental and numerical analysis of compression and bending strength of old wood reinforced with CFRP strips. Structures 2021, 33, 259–271. [Google Scholar] [CrossRef]
- Nowak, T.P. Analysis of the Static Work of Bent Wooden Beams Reinforced with CFRP. Ph.D. Thesis, University of Wrocław, Wrocław, Poland, 2007. [Google Scholar]
- Nowak, T.P.; Jasienko, J.; Czepizák, D. Experimental tests and numerical analysis of historic bent timber elements reinforced with CFRP strips. Constr. Build. Mater. 2013, 40, 197–206. [Google Scholar] [CrossRef]
- Borri, A.; Corradi, M.; Grazini, A. A method for flexural reinforcement of old wood beams with CFRP materials. Compos. Part B-Eng. 2005, 36, 143–153. [Google Scholar] [CrossRef]
- Bhat, J.A. Effect of CFRP Reinforcement variation on the strength parameters of different timber beams. Mater. Today Proc. 2021, 44, 2785–2791. [Google Scholar] [CrossRef]
- Rescalvo, F.J.; Valverde-Palacios, I.; Suarez, E.; Gallego, A. Experimental and analytical analysis for bending load capacity of old timber beams with defects when reinforced with carbon fiber strips. Compos. Struct. 2018, 186, 29–38. [Google Scholar] [CrossRef]
- Jose-Antonio, B.; Luis-Alfonso, B.; Luis, A. Internal GFRP Reinforcement of Low-Grade Maritime Pine Duo Timber Beams. J. Mater. 2020, 13, 571–583. [Google Scholar]
- Shi, H.; Liu, W.; Fang, H.; Bai, Y.; Hui, D. Flexural responses and pseudo-ductile performance of lattice-web reinforced GFRP-wood sandwich beams. Compos. Part B-Eng. 2017, 108, 364–376. [Google Scholar] [CrossRef]
- Yang, H.; Liu, W. Study on the flexural performance of FRP-reinforced glued laminated timber beams. Build Struct. 2007, 1, 64–71. [Google Scholar]
- Guo, T.; Yang, N.; Zhou, H.; Wang, S. Experimental and Numerical Studies on the Traditional Penetration Mortise–Tenon Connection Reinforced by Self-Tapping Screws. Forests 2022, 13, 513. [Google Scholar] [CrossRef]
- Tsalkatidis, T. Numerical simulation and analytical study of glulam timber beams. Int. J. Eng. Technol. 2014, 3, 129. [Google Scholar] [CrossRef] [Green Version]
- Baño, V.; Arriaga, F.; Soilán, A.; Guaita, M. Prediction of bending load capacity of timber beams using a finite element method simulation of knots and grain deviation. Biosyst. Eng. 2011, 109, 241–249. [Google Scholar] [CrossRef] [Green Version]
- Kotšmíd, S.; Beňo, P. Determination of buckling loads for wooden beams using the elastic models. J. Arch. Appl. Mech. 2019, 89, 1501–1512. [Google Scholar] [CrossRef]
- Fajdiga, G.; Šubic, B.; Kovačič, A. Bending Stiffness of Hybrid Wood-Metal Composite Beams: An Experimentally Validated Numerical Model. Forests 2021, 12, 918. [Google Scholar] [CrossRef]
- Lukin, M.; Prusov, E.; Roshchina, S.; Karelina, M.; Vatin, N. Multi-Span Composite Timber Beams with Rational Steel Reinforcements. Buildings 2021, 11, 46. [Google Scholar] [CrossRef]
- Alam, P.; Ansell, M.P.; Smedley, D. Mechanical repair of timber beams fractured in flexure using bonded-in reinforcements. Compos. Part B-Eng. 2009, 40, 95–106. [Google Scholar] [CrossRef]
- Alam, P.; Ansell, M.P.; Smedley, D. Effects of reinforcement geometry on strength and stiffness in adhesively bonded steel-timber flexural beams. Buildings 2012, 2, 231–244. [Google Scholar] [CrossRef] [Green Version]
- Corradi, M.; Osofero, A.I.; Borri, A. Repair and reinforcement of historic timber structures with stainless steel—A review. Metals 2019, 9, 106. [Google Scholar] [CrossRef] [Green Version]
- Chen, S.; Wei, Y.; Zhao, K.; Dong, F.; Huang, L. Experimental investigation on the flexural behaviour of laminated bamboo-timber I-beams. J. Build. Eng. 2022, 46, 103651. [Google Scholar] [CrossRef]
- Duan, S.; Zhou, W.; Liu, X.; Yuan, J.; Wang, Z. Experimental Study on the Bending Behavior of Steel-Wood Composite Beams. Adv. Civ. Eng. 2021, 2021, 1315849. [Google Scholar] [CrossRef]
- Zhang, X.; Luo, J.; Luo, L.; Sun, Y.; Li, Z. Experimental and numerical investigation into the bending behaviour of stiffened hollow glulam beams. J. Build. Eng. 2022, 45, 103488. [Google Scholar] [CrossRef]
- Lukin, M.; Roshchina, S.; Gribanov, A.; Naychuk, A. Stress-strain state of wooden beams with external reinforcement. IOP Conf. Ser. Mater. Sci. Eng. 2020, 896, 012066. [Google Scholar] [CrossRef]
- Li, S. Writing a Modern Chinese Architectural History: Liang Sicheng and Liang Qichao. J. Archit. Educ. 2002, 56, 35–45. [Google Scholar]
- Franke, S.; Franke, B.; Harte, A.M. Failure modes and reinforcement techniques for timber beams–State of the art. Constr. Build. Mater. 2015, 97, 2–13. [Google Scholar] [CrossRef]
- Franke, S.; Franke, B.; Harte, A.M. Reinforcement of timber beams. In Reinforcement of Timber Structures a State-of-the-Art Report; COST: Brussels, Belgium, 2015; p. 5. [Google Scholar]
- Dietsch, P.; Brandner, R. Self-tapping screws and threaded rods as reinforcement for structural timber elements—A state-of-the-art report. Constr. Build. Mater. 2015, 97, 78–89. [Google Scholar] [CrossRef]
- Schober, K.U.; Harte, A.M.; Kliger, R.; Jockwer, R.; Xu, Q.; Chen, J.-F. FRP reinforcement of timber structures. Constr. Build. Mater. 2015, 97, 106–118. [Google Scholar] [CrossRef] [Green Version]
- Gugutsidze, G.; Draskovic, F. Reinforcement of timber beams with carbon fibers reinforced plastics. Slovak J. Civ. Eng. 2010, 18, 13. [Google Scholar] [CrossRef] [Green Version]
- He, M.; Wang, Y.; Li, Z.; Zhou, L.; Tong, Y.; Sun, X. An experimental and analytical study on the bending performance of CFRP reinforced glulam beams. Front. Mater. 2022, 8, 607. [Google Scholar] [CrossRef]
- Guan, Z.W.; Zhu, E.C. Finite element modelling of anisotropic elasto-plastic timber composite beams with openings. Eng. Struct. 2009, 31, 394–403. [Google Scholar] [CrossRef]
- UNE-EN 384:2016 +A1:2019; Structural Timber—Determination of Characteristic Values of Mechanical Properties and Density. Asociación Española de Normalización: Madrid, Spain, 2019.
- GB/T 15777-2017; Method for Determination of the Modulus of Elasticity in Compression Parallel to Grain of Wood. Standardization Administration of China Press: Beijing, China, 2017.
- ASTM D143-14; Standard Test Methods for Small Clear Specimens of Timber. ASTM International: West Conshohocken, PA, USA, 2014.
- Raftery, G.M.; Harte, A.M. Nonlinear numerical modelling of FRP reinforced glued laminated timber. Compos. Part B-Eng. 2013, 52, 40–50. [Google Scholar] [CrossRef]
- Zhang, H.; Ling, Z. Finite Element Modeling on Shear Performance of Grouted Stud Connectors for Steel–Timber Composite Beams. Materials 2022, 15, 1196. [Google Scholar] [CrossRef]


| Group | Specimen | Specimen Dimension (mm) | Material | Repair Method |
|---|---|---|---|---|
| 1 | B0Z | 2340 × 210 × 200 | Chinese fir | - |
| B0Y | 2340 × 210 × 200 | Chinese fir | - | |
| 2 | B1Z | 2340 × 210 × 200 | Merbau | - |
| B1Y | 2340 × 210 × 200 | Merbau | - | |
| 3 | B2Z | 2340 × 210 × 200 | Merbau | Upper 1/2 core repair |
| B2Y | 2340 × 210 × 200 | Merbau | Lower 1/2 core repair | |
| 4 | B3Z | 2340 × 210 × 200 | Merbau | Upper inlay repair |
| B3Y | 2340 × 210 × 200 | Merbau | Lower inlay repair | |
| 5 | B4Z | 2340 × 210 × 200 | Merbau | Complete tenon repair |
| B4Y | 2340 × 210 × 200 | Merbau | 1/3 tenon repair |
| Material | Parallel to Grain | Perpendicular to Grain | ||
|---|---|---|---|---|
| Tensile Strength (MPa) | Compressive Strength (MPa) | Tensile Strength (MPa) | Compressive Strength (MPa) | |
| Chinese fir | 53.17 | 38.34 | 8.87 | 12.78 |
| Merbau | 76.90 | 51.91 | 18.53 | 25.96 |
| Specimen Type | Specimen | Fu (kN) | Increasing Ratio (%) | Du (mm) | K (kN·mm−1) |
|---|---|---|---|---|---|
| Undamaged | B0Z | 69.54 | - | 30.09 | 2.61 |
| B0Y | 69.80 | - | 34.01 | 2.57 | |
| B1Z | 261.31 | - | 35.3 | 12.25 | |
| B1Y | 259.97 | - | 35.22 | 11.85 | |
| Repaired | B2Z | 293.95 | 13.06 | 35.87 | 16.58 |
| B2Y | 270.26 | 3.94 | 33.79 | 12.56 | |
| B3Z | 361.23 | 38.93 | 54.99 | 24.63 | |
| B3Y | 159.20 | −38.75 | 33.17 | 7.02 | |
| B4Z | 90.03 | −65.37 | 27.50 | 4.82 | |
| B4Y | 273.2 | 5.08 | 37.20 | 12.81 |
| Material | Poisson’s Ratio | Elastic Modulus (MPa) | Shear Modulus (MPa) | ||||||
|---|---|---|---|---|---|---|---|---|---|
| uLR | uLT | uRT | EL | ER | ET | GLR | GLT | GRT | |
| Merbau | 0.031 | 0.703 | 0.05 | 20,181 | 1734 | 1009 | 1210.8 | 1513.6 | 363 |
| Cunninghamia lanceolata | 0.2 | 0.47 | 0.43 | 12,400 | 1013 | 610 | 913 | 736 | 223.6 |
| Specimen | Fu (kN) | K (kN·mm−1) | ||||
|---|---|---|---|---|---|---|
| Exp | Num | Error (%) | Exp | Num | Error (%) | |
| B0Z | 69.54 | 71.30 | 2.53 | 2.61 | 2.74 | 4.98 |
| B0Y | 69.80 | 72.28 | 3.55 | 2.57 | 2.82 | 9.73 |
| B1Z | 261.31 | 266.28 | 1.90 | 12.25 | 12.46 | 1.71 |
| B1Y | 259.97 | 262.16 | 0.84 | 11.85 | 11.92 | 0.59 |
| B2Z | 293.95 | 324.47 | 10.38 | 16.58 | 17.36 | 4.70 |
| B2Y | 270.26 | 273.28 | 1.12 | 12.56 | 13.97 | 11.23 |
| B3Z | 361.23 | 383.62 | 6.20 | 24.63 | 25.53 | 3.65 |
| B3Y | 159.20 | 184.39 | 15.82 | 7.02 | 14.21 | 102.42 |
| B4Z | 90.03 | 109.21 | 21.30 | 4.82 | 9.34 | 93.78 |
| B4Y | 273.2 | 289.31 | 5.90 | 12.81 | 13.63 | 6.40 |
| Repair Height | Fmax (kN) | Increase in Strength (%) |
|---|---|---|
| 0.2 | 205.21 | - |
| 0.4 | 184.39 | −10.15% |
| 0.6 | 155.43 | −24.26% |
| Reinforcement Position (mm) | Fmax (kN) | Increase in Strength (%) |
|---|---|---|
| 0 | 184.39 | - |
| 200 | 164.12 | −10.99% |
| 400 | 142.43 | −22.76% |
| Repair Form | Fmax (kN) | |
|---|---|---|
| Dovetail form (B3N) | 218.68 | 22.65 |
| Rectangular form (B3Y) | 184.39 | 55.25 |
Publisher’s Note: MDPI stays neutral with regard to jurisdictional claims in published maps and institutional affiliations. |
© 2022 by the authors. Licensee MDPI, Basel, Switzerland. This article is an open access article distributed under the terms and conditions of the Creative Commons Attribution (CC BY) license (https://creativecommons.org/licenses/by/4.0/).
Share and Cite
Jiang, Y.; Sun, Q. Experimental and Numerical Studies on Repaired Wooden Beam of Traditional Buildings in Huizhou Region, China. Buildings 2022, 12, 1025. https://doi.org/10.3390/buildings12071025
Jiang Y, Sun Q. Experimental and Numerical Studies on Repaired Wooden Beam of Traditional Buildings in Huizhou Region, China. Buildings. 2022; 12(7):1025. https://doi.org/10.3390/buildings12071025
Chicago/Turabian StyleJiang, Yunpeng, and Qiang Sun. 2022. "Experimental and Numerical Studies on Repaired Wooden Beam of Traditional Buildings in Huizhou Region, China" Buildings 12, no. 7: 1025. https://doi.org/10.3390/buildings12071025