
Circular Economy in the Construction Industry: A Step towards Sustainable Development


 ,
,  , , ,
, , , 
Abstract
:1. Introduction
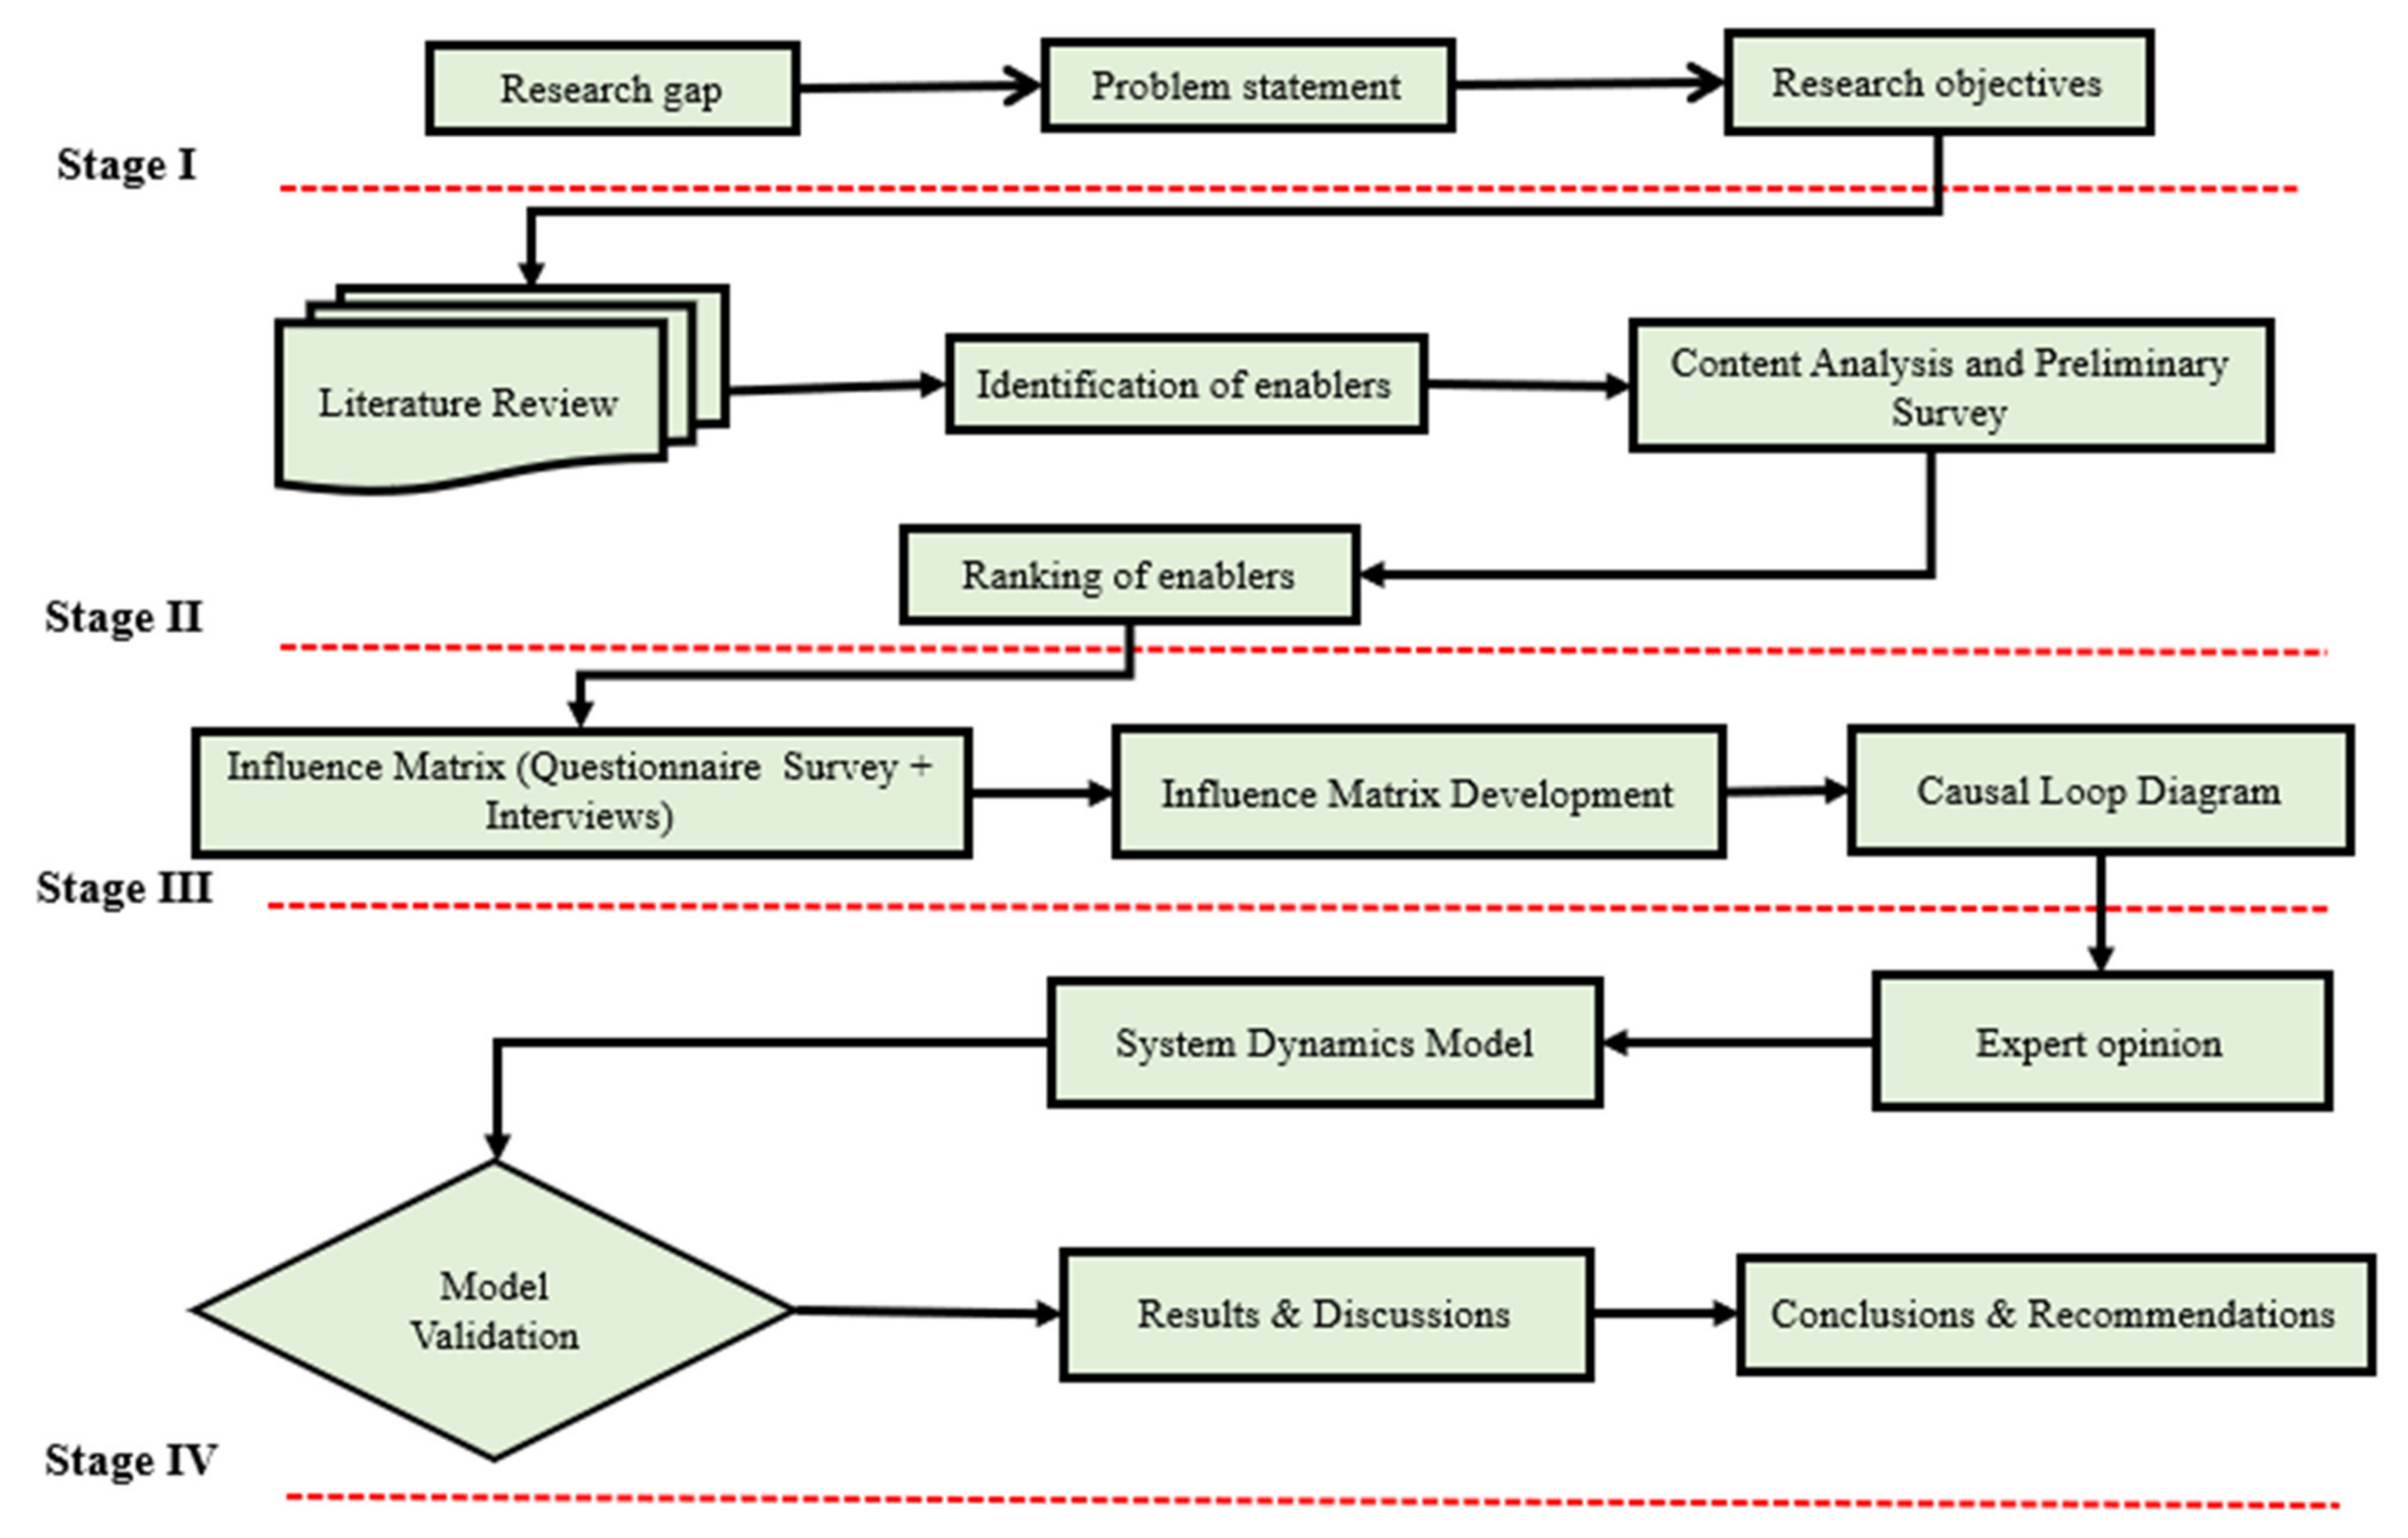
- To identify the key enablers of the CE which lead towards sustainable development in the CI.
- To determine the causality among CE enablers, reducing uncertainty and leading towards sustainable development in the CI.
- To develop an SD model to address complexity related to sustainable development due to a CE in the CI.
2. Literature Review
2.1. Circular Economy (CE)
2.2. CE Concept for Sustainable Development in the CI
2.3. CE and United Nations’ (UN’s) Sustainable Development Goals (SDGs)
2.4. Implementation Complexities of the CE in the CI
2.5. The SD Approach for Handling CE Implementation Complexities in the CI
3. Research Methodology
4. Results and Discussions
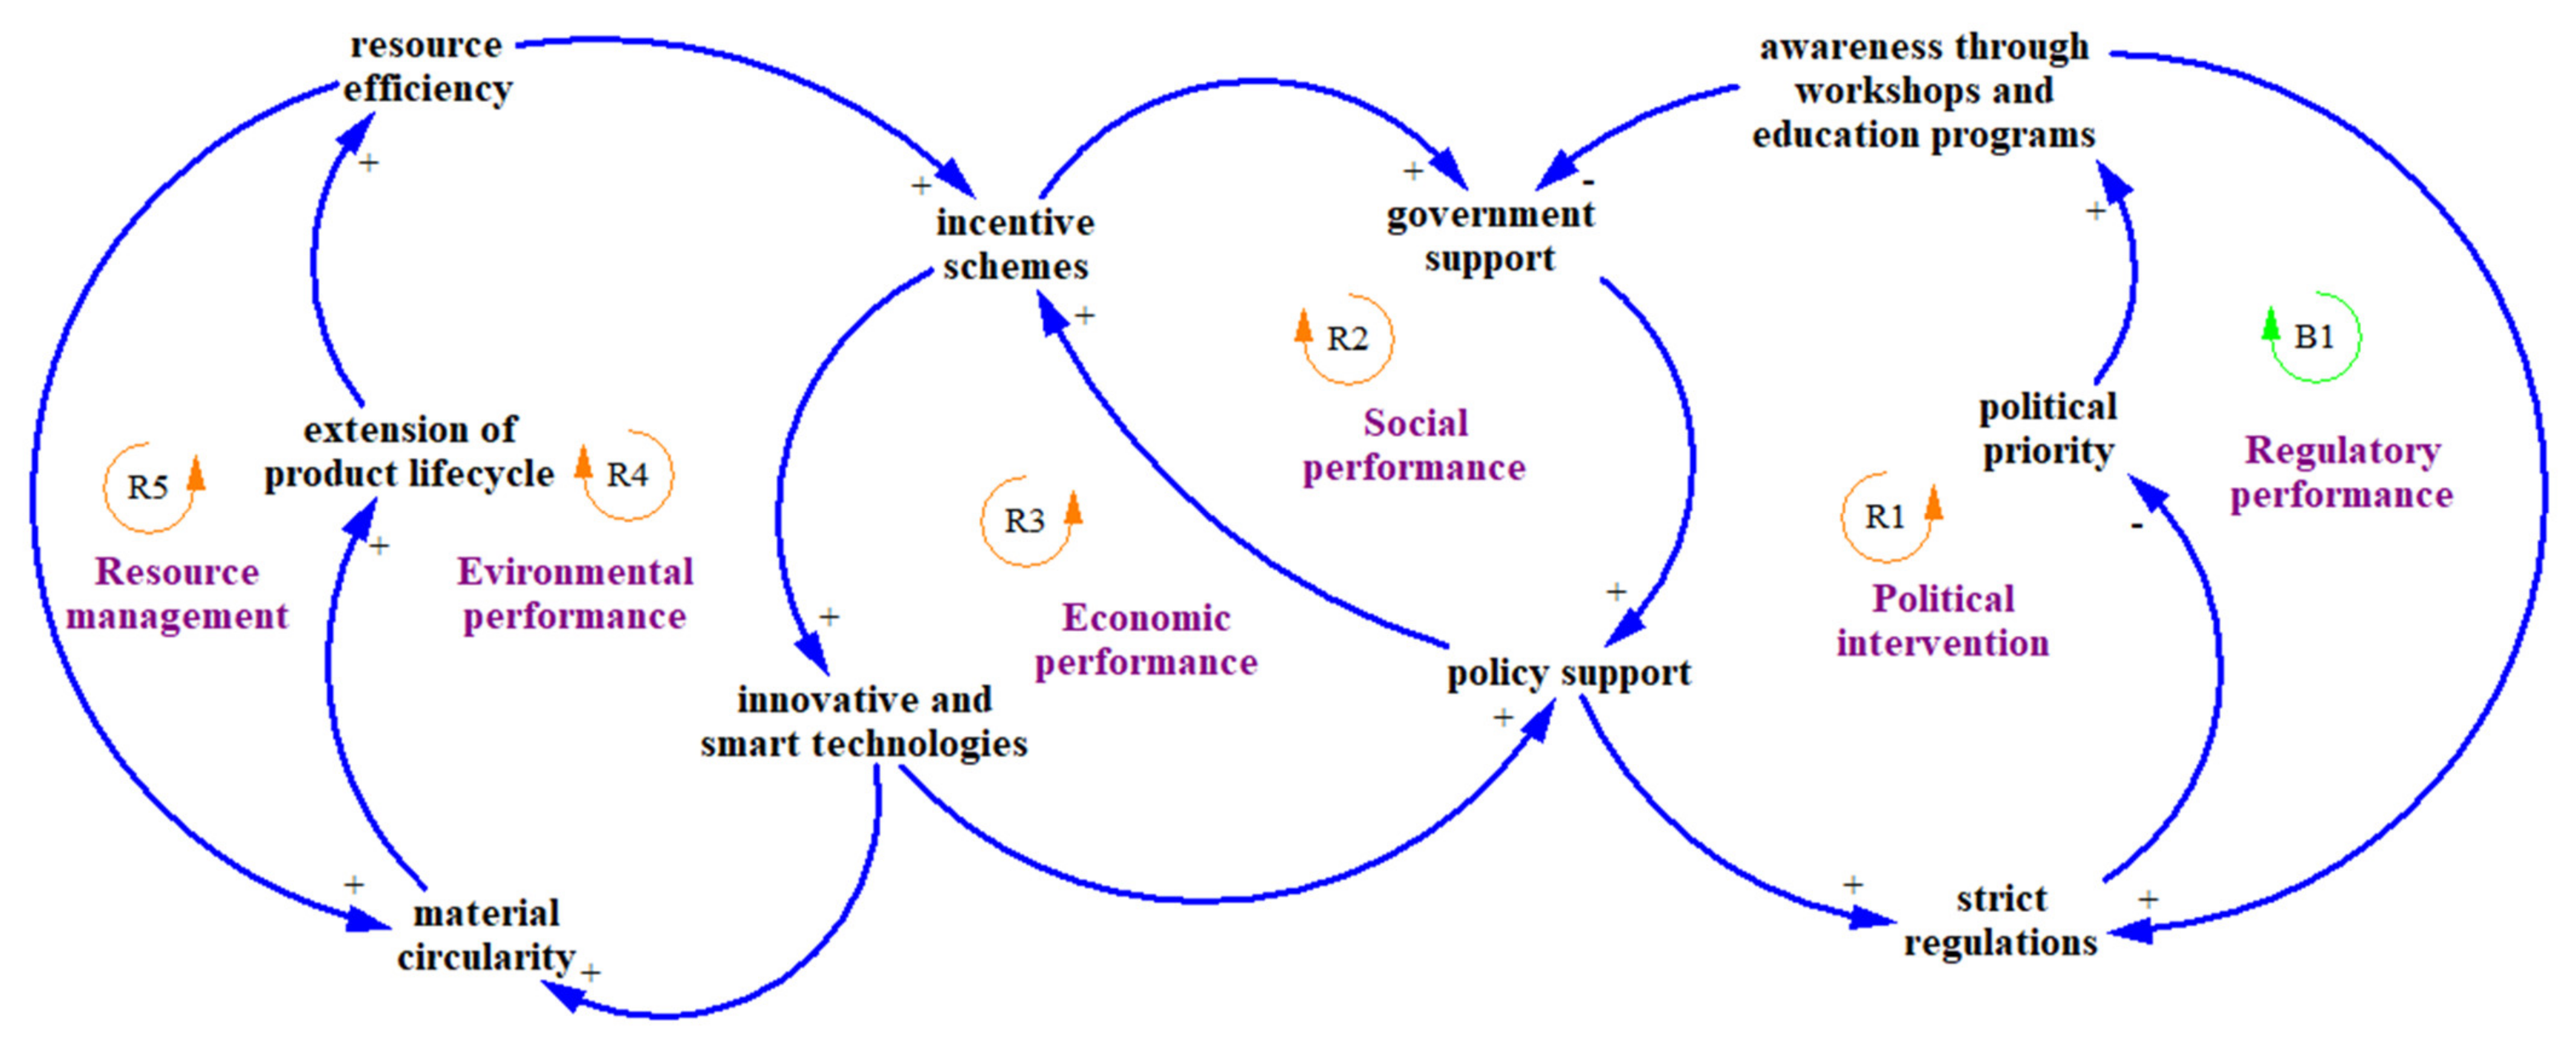
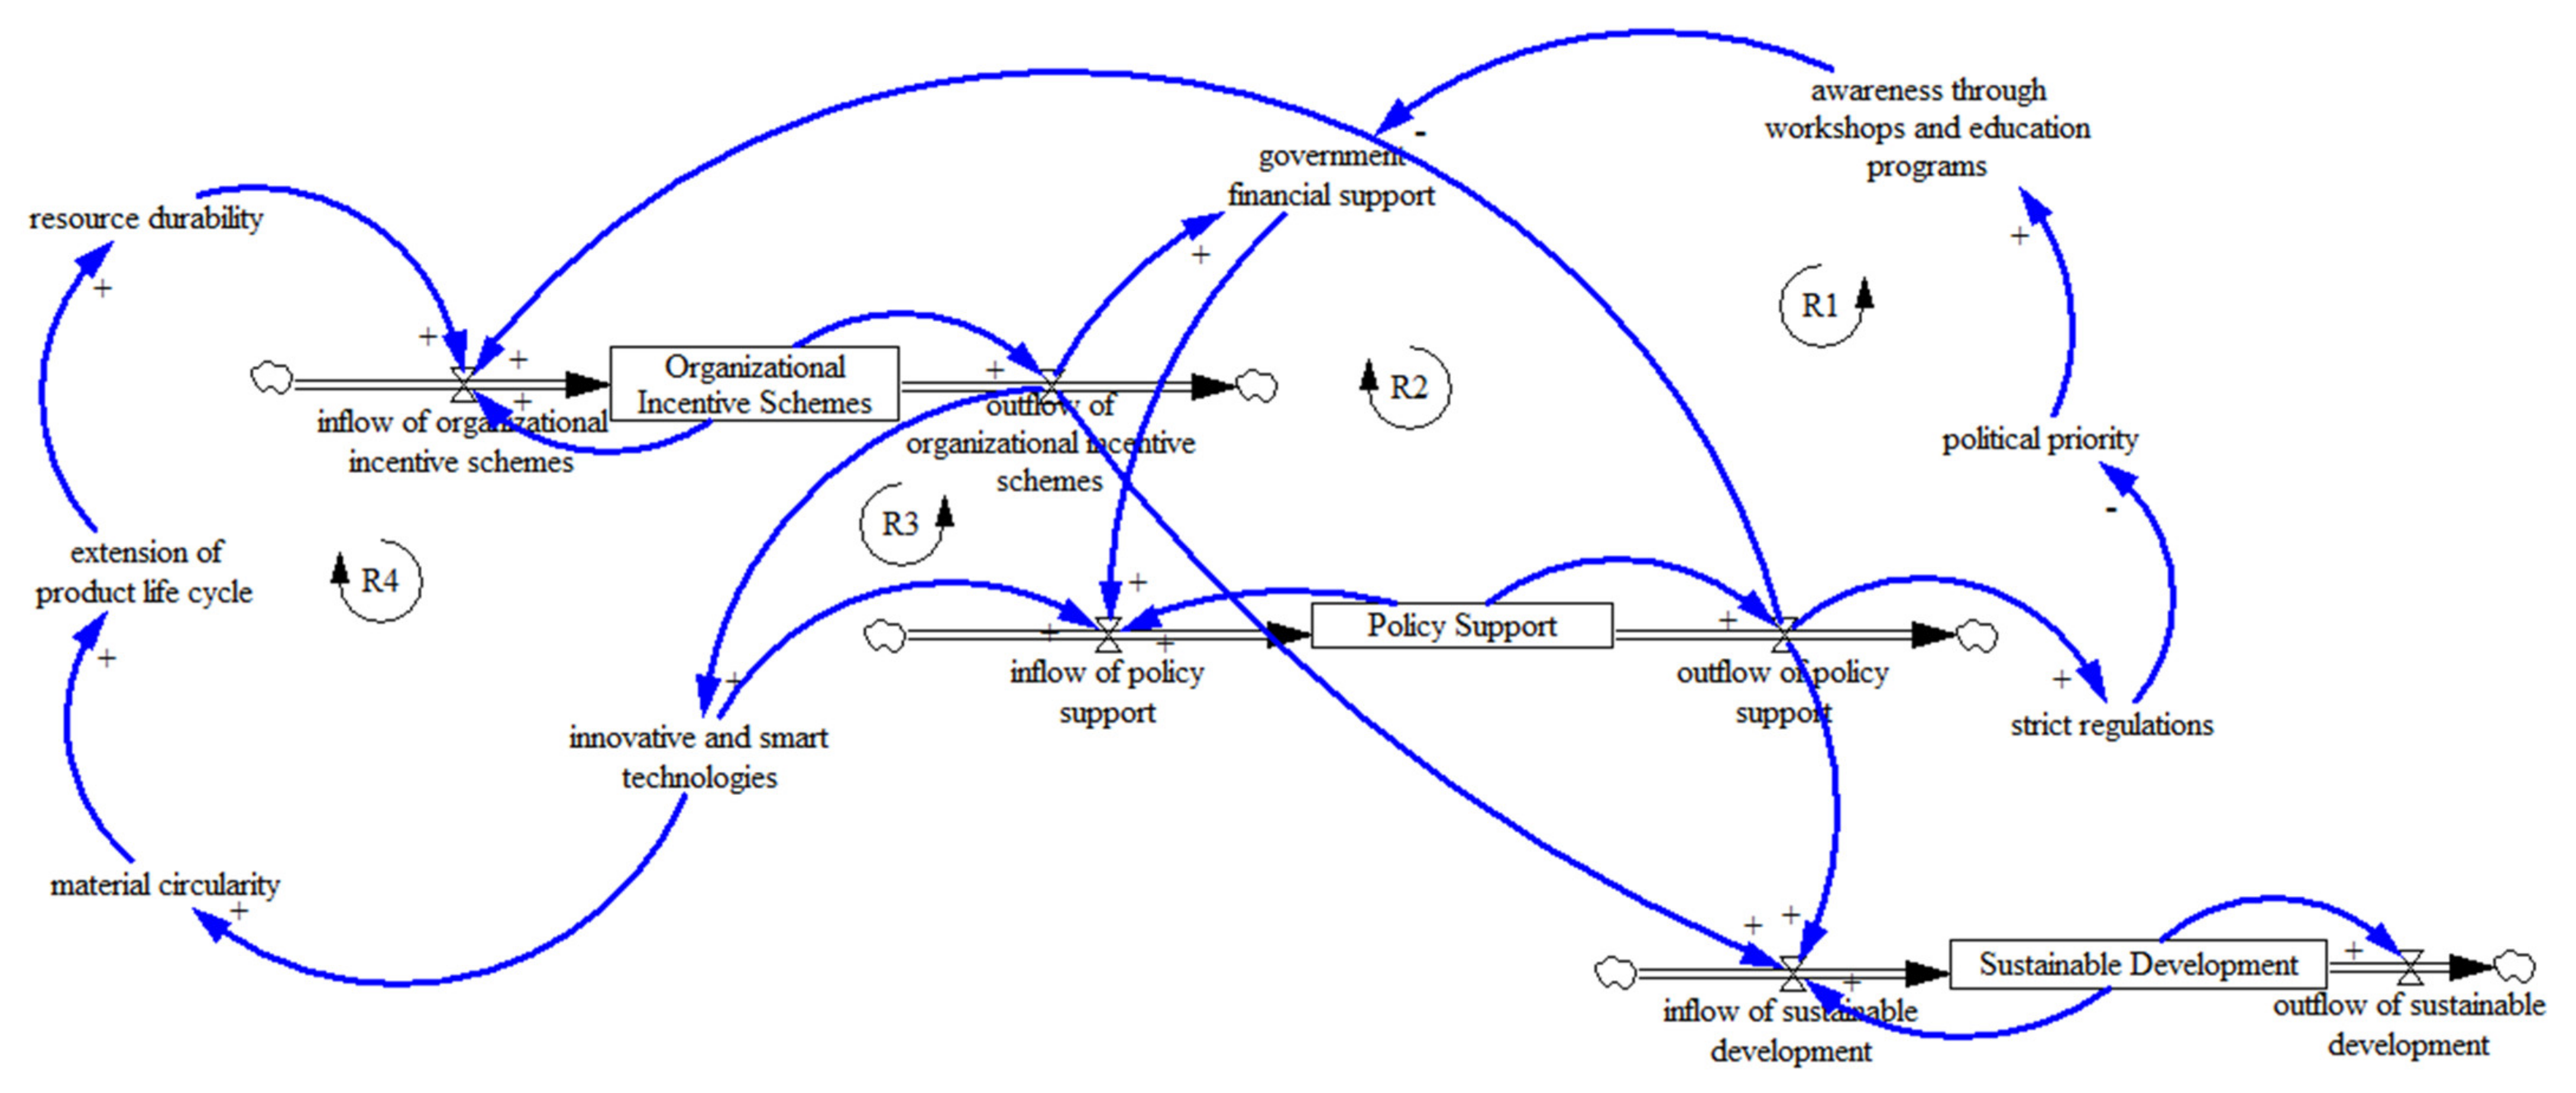
4.1. Causal Loop Diagram (CLD)
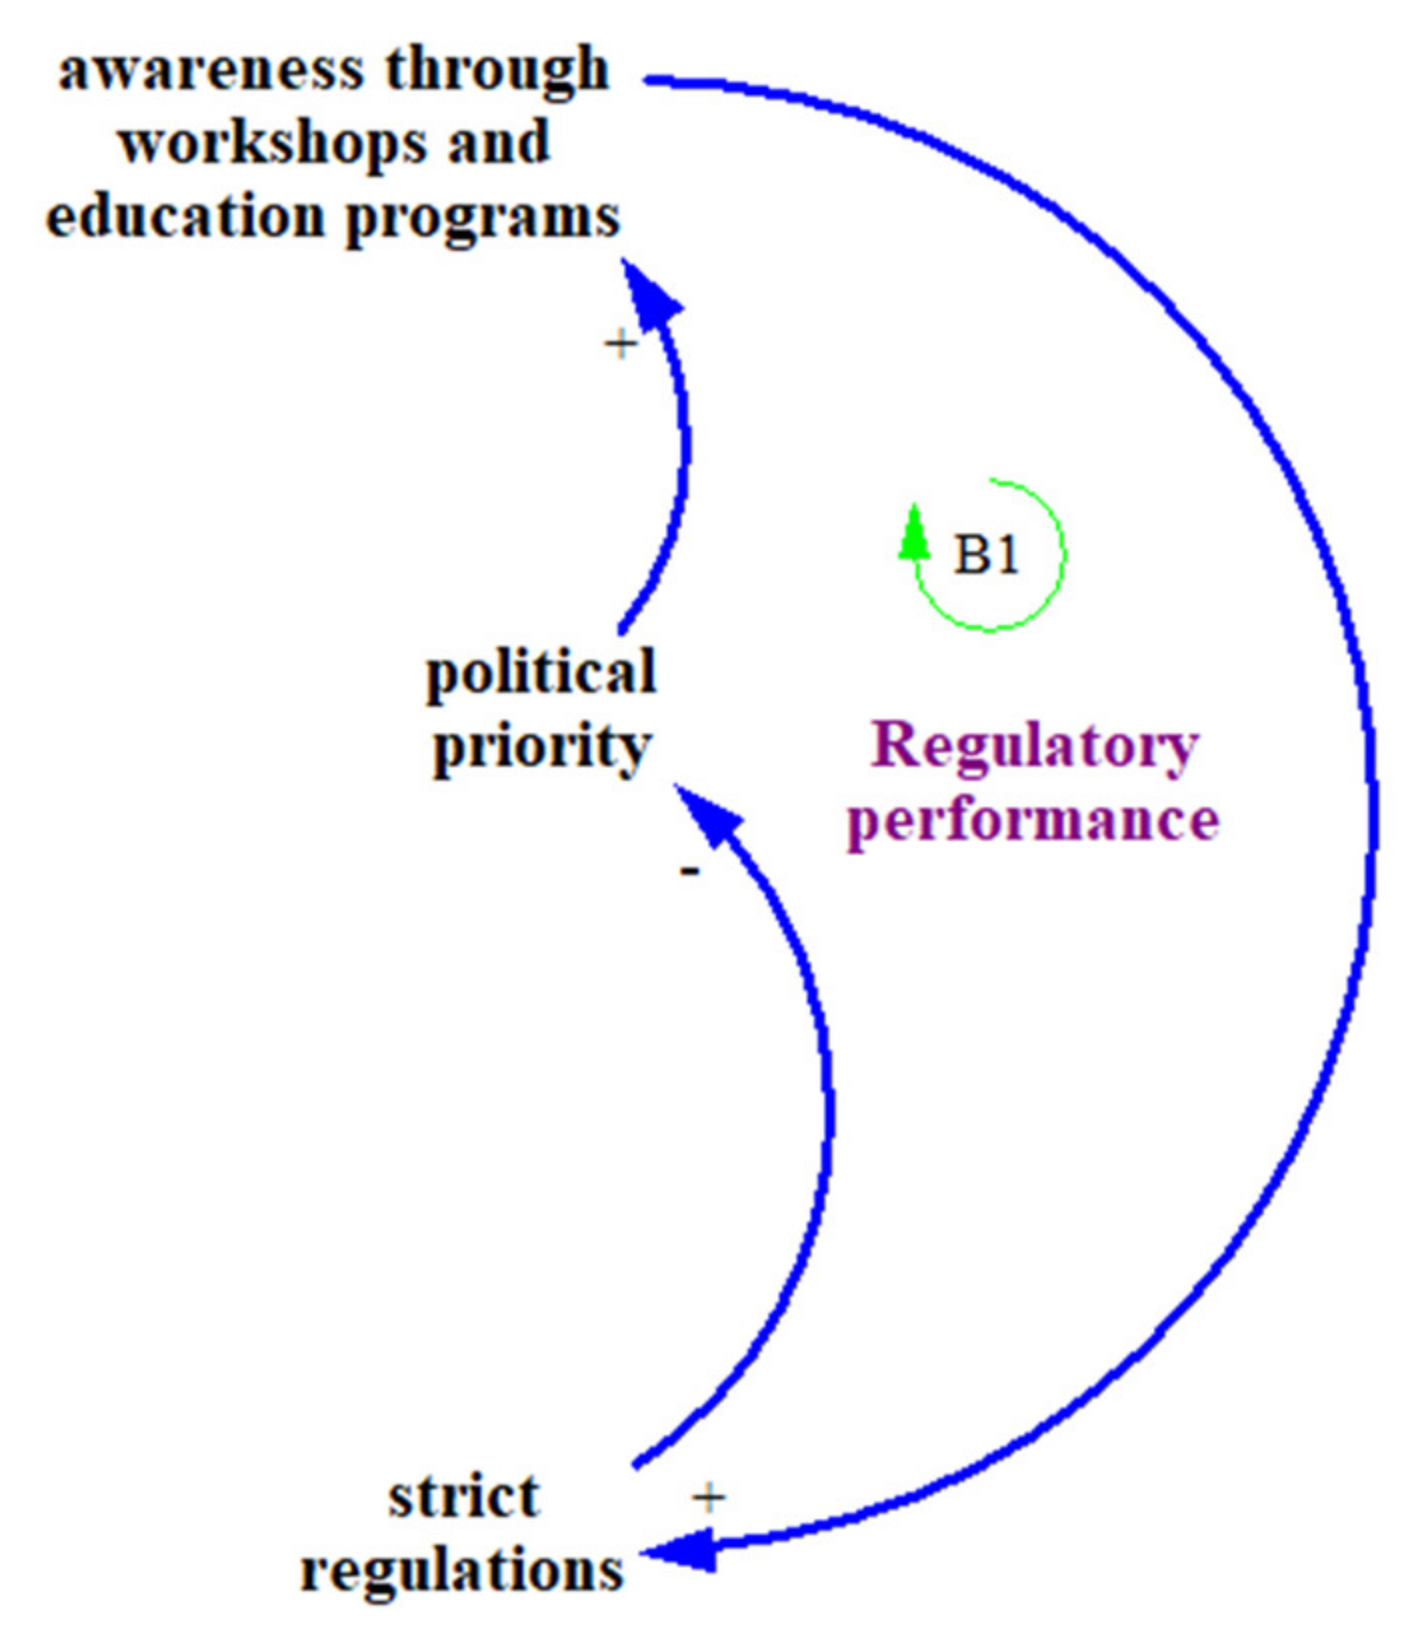
4.1.1. Balancing Loop B1—Regulatory Performance
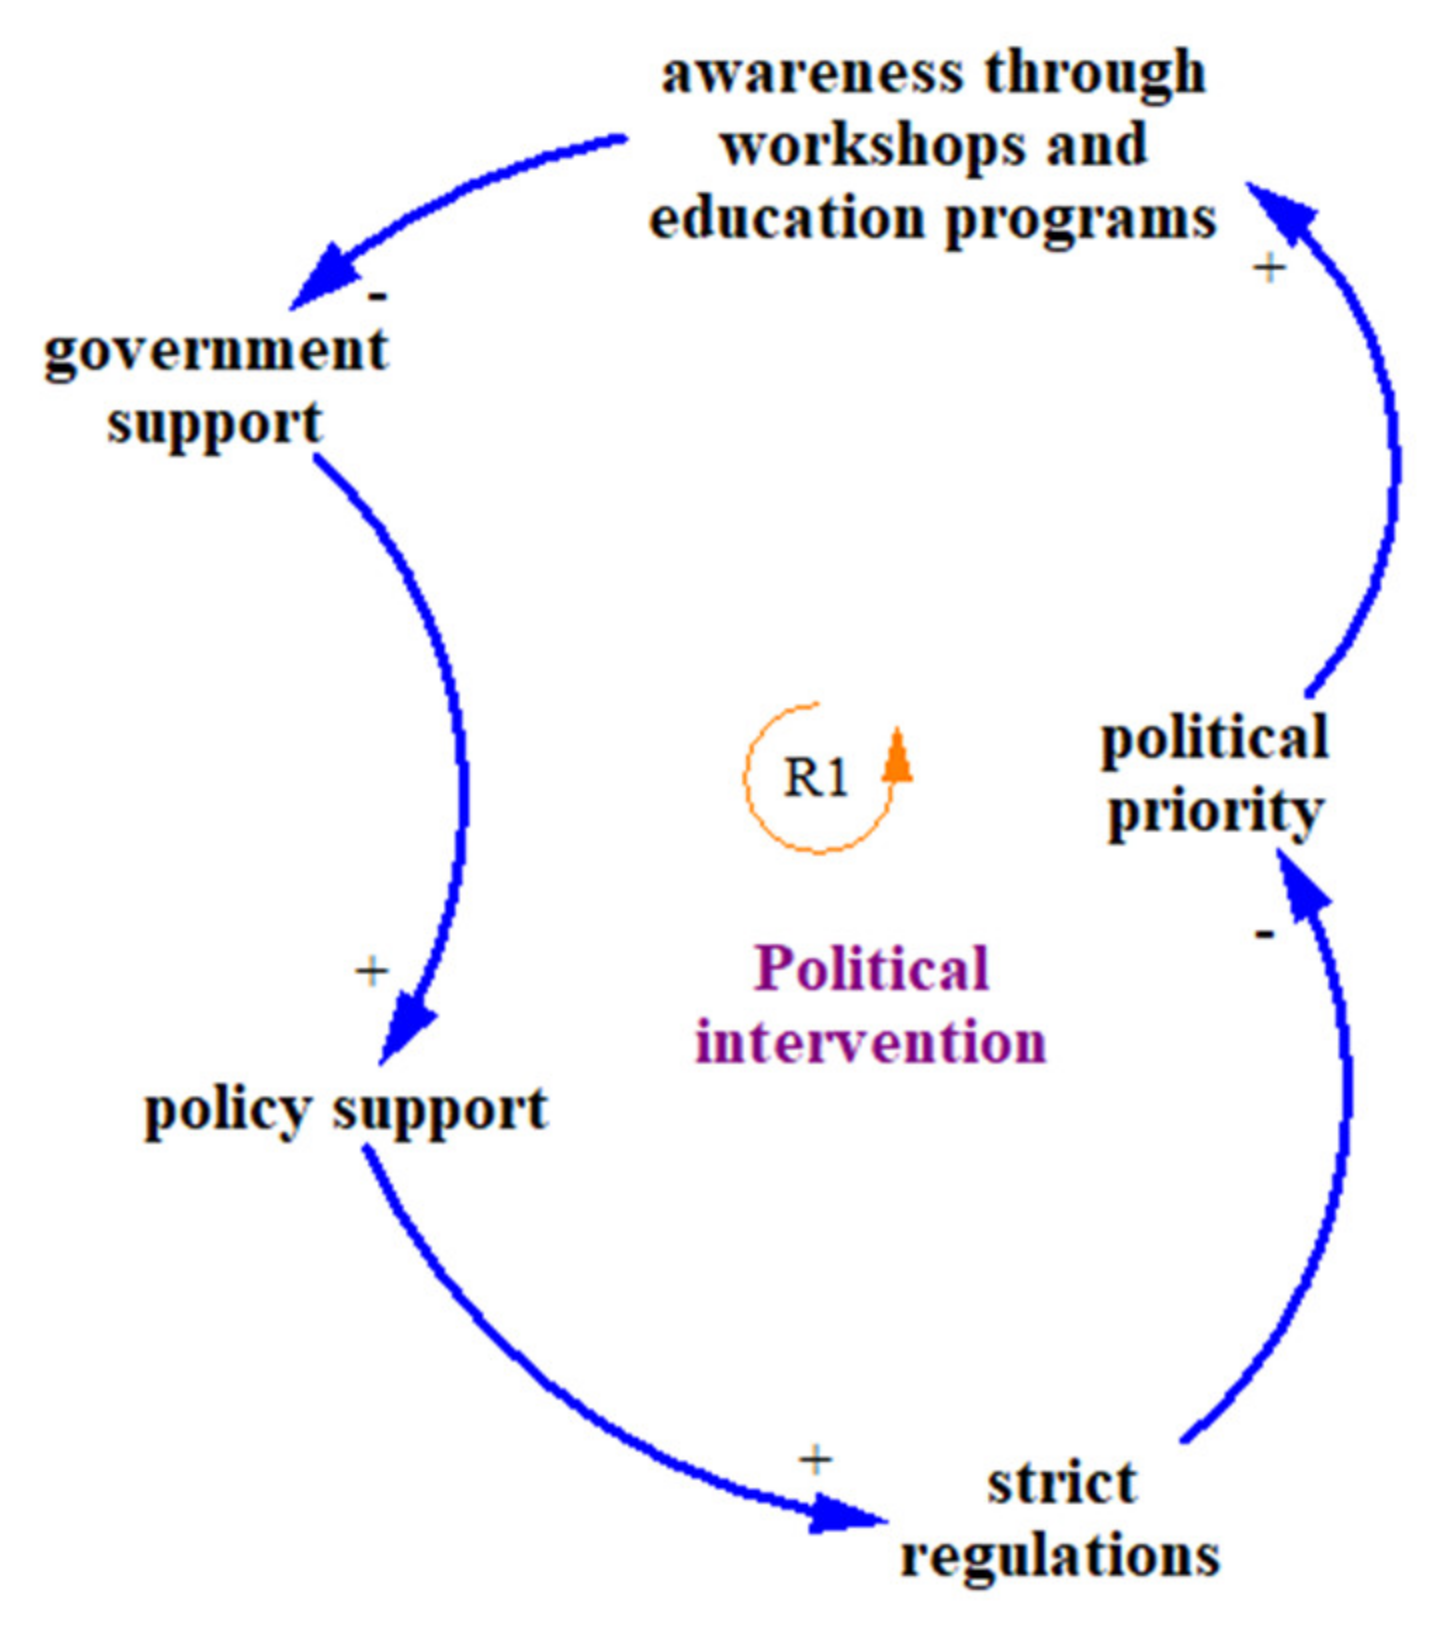
4.1.2. Reinforcing Loop R1—Political Intervention
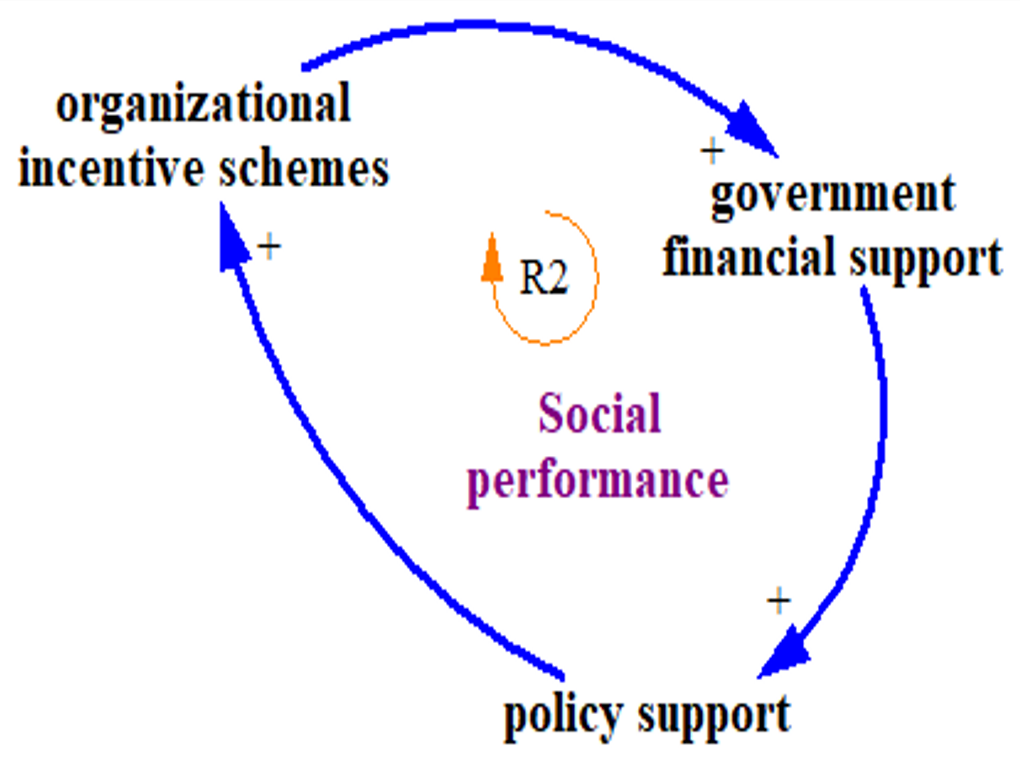
4.1.3. Reinforcing Loop R2—Social Performance
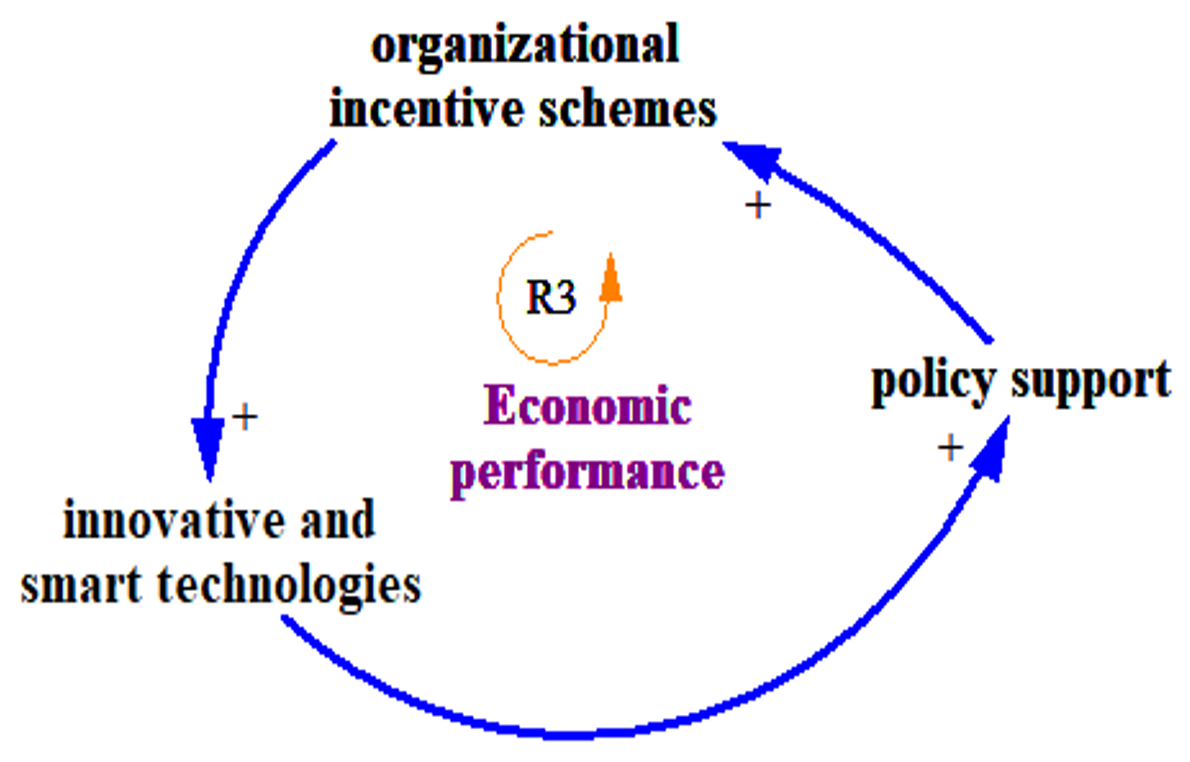
4.1.4. Reinforcing Loop R3—Economic Performance
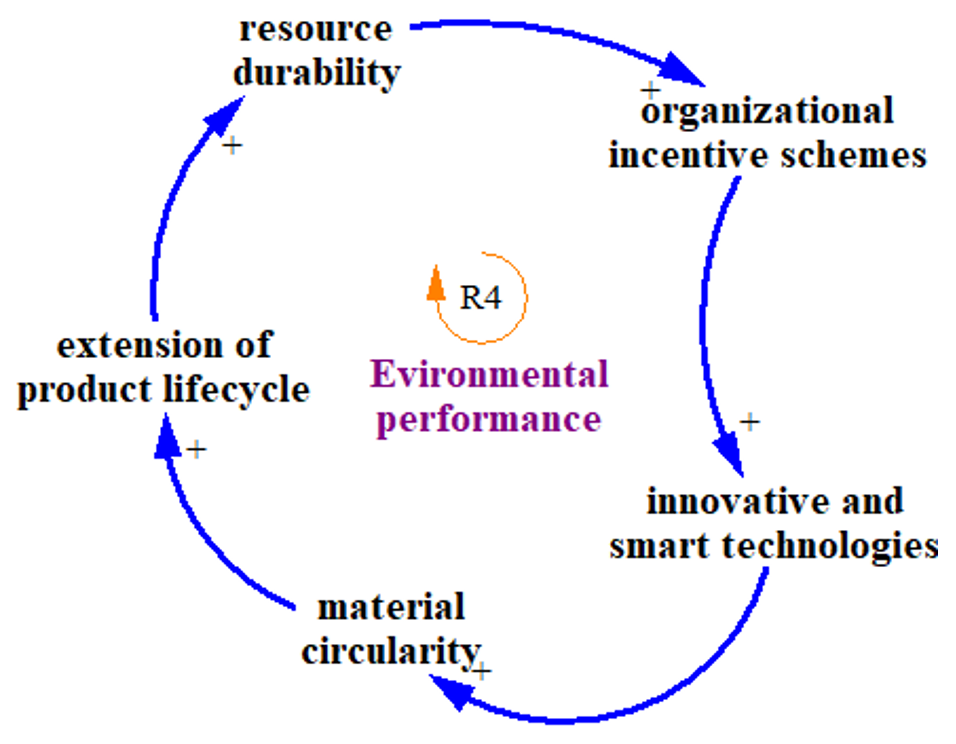
4.1.5. Reinforcing Loop R4—Environmental Performance
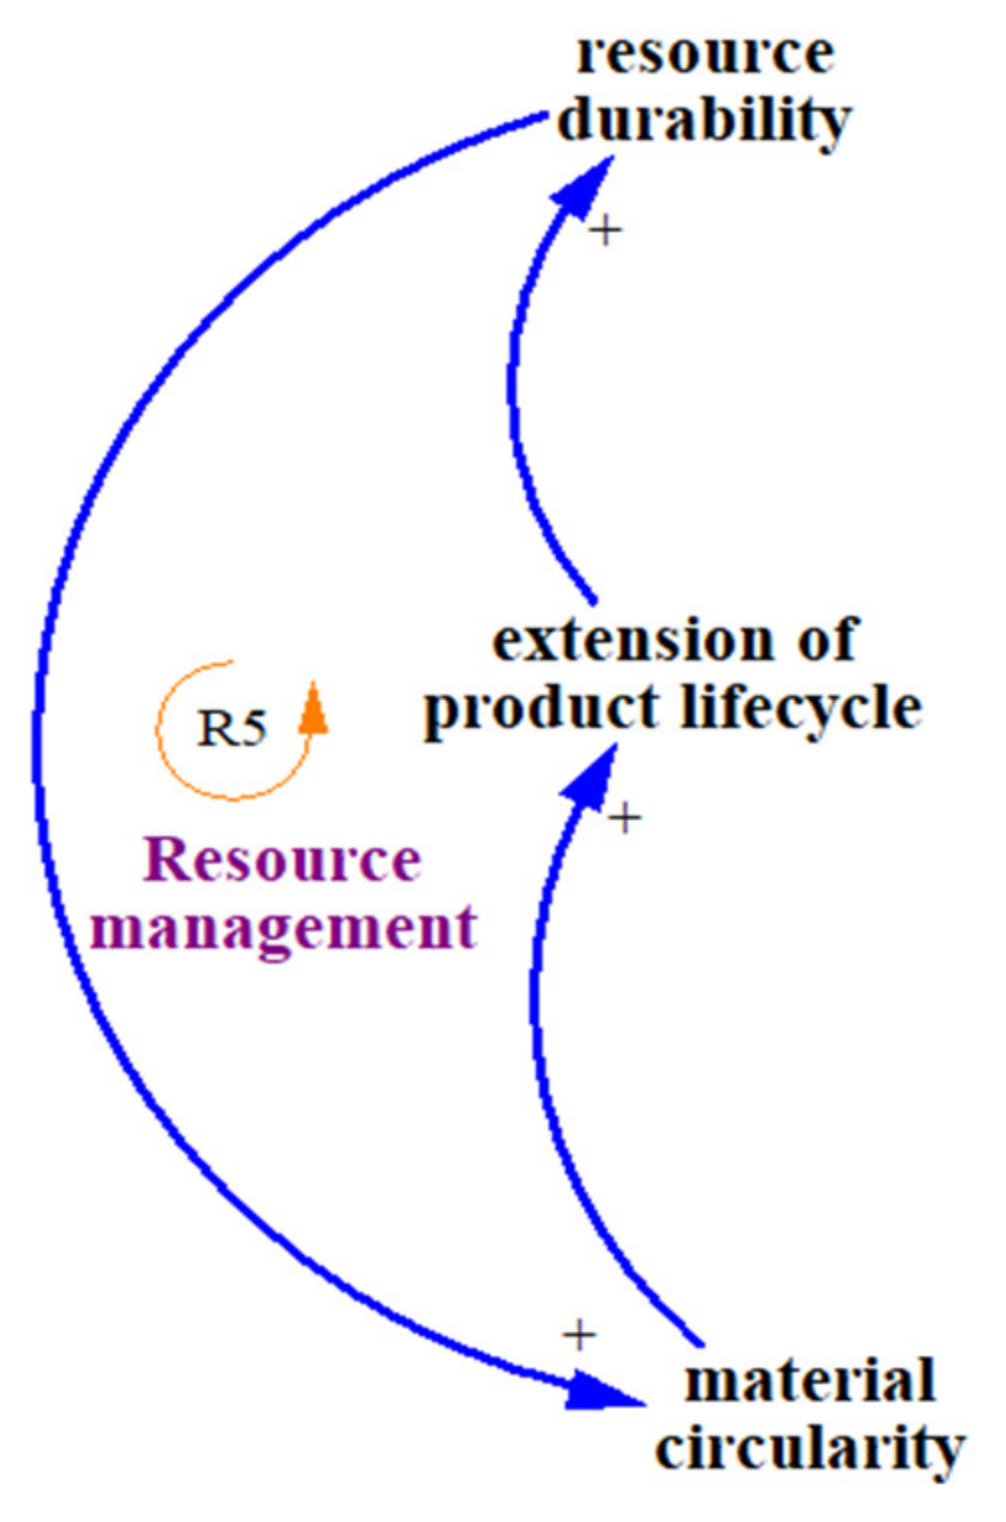
4.1.6. Reinforcing Loop R5—Resource Management
4.2. Loop Analysis
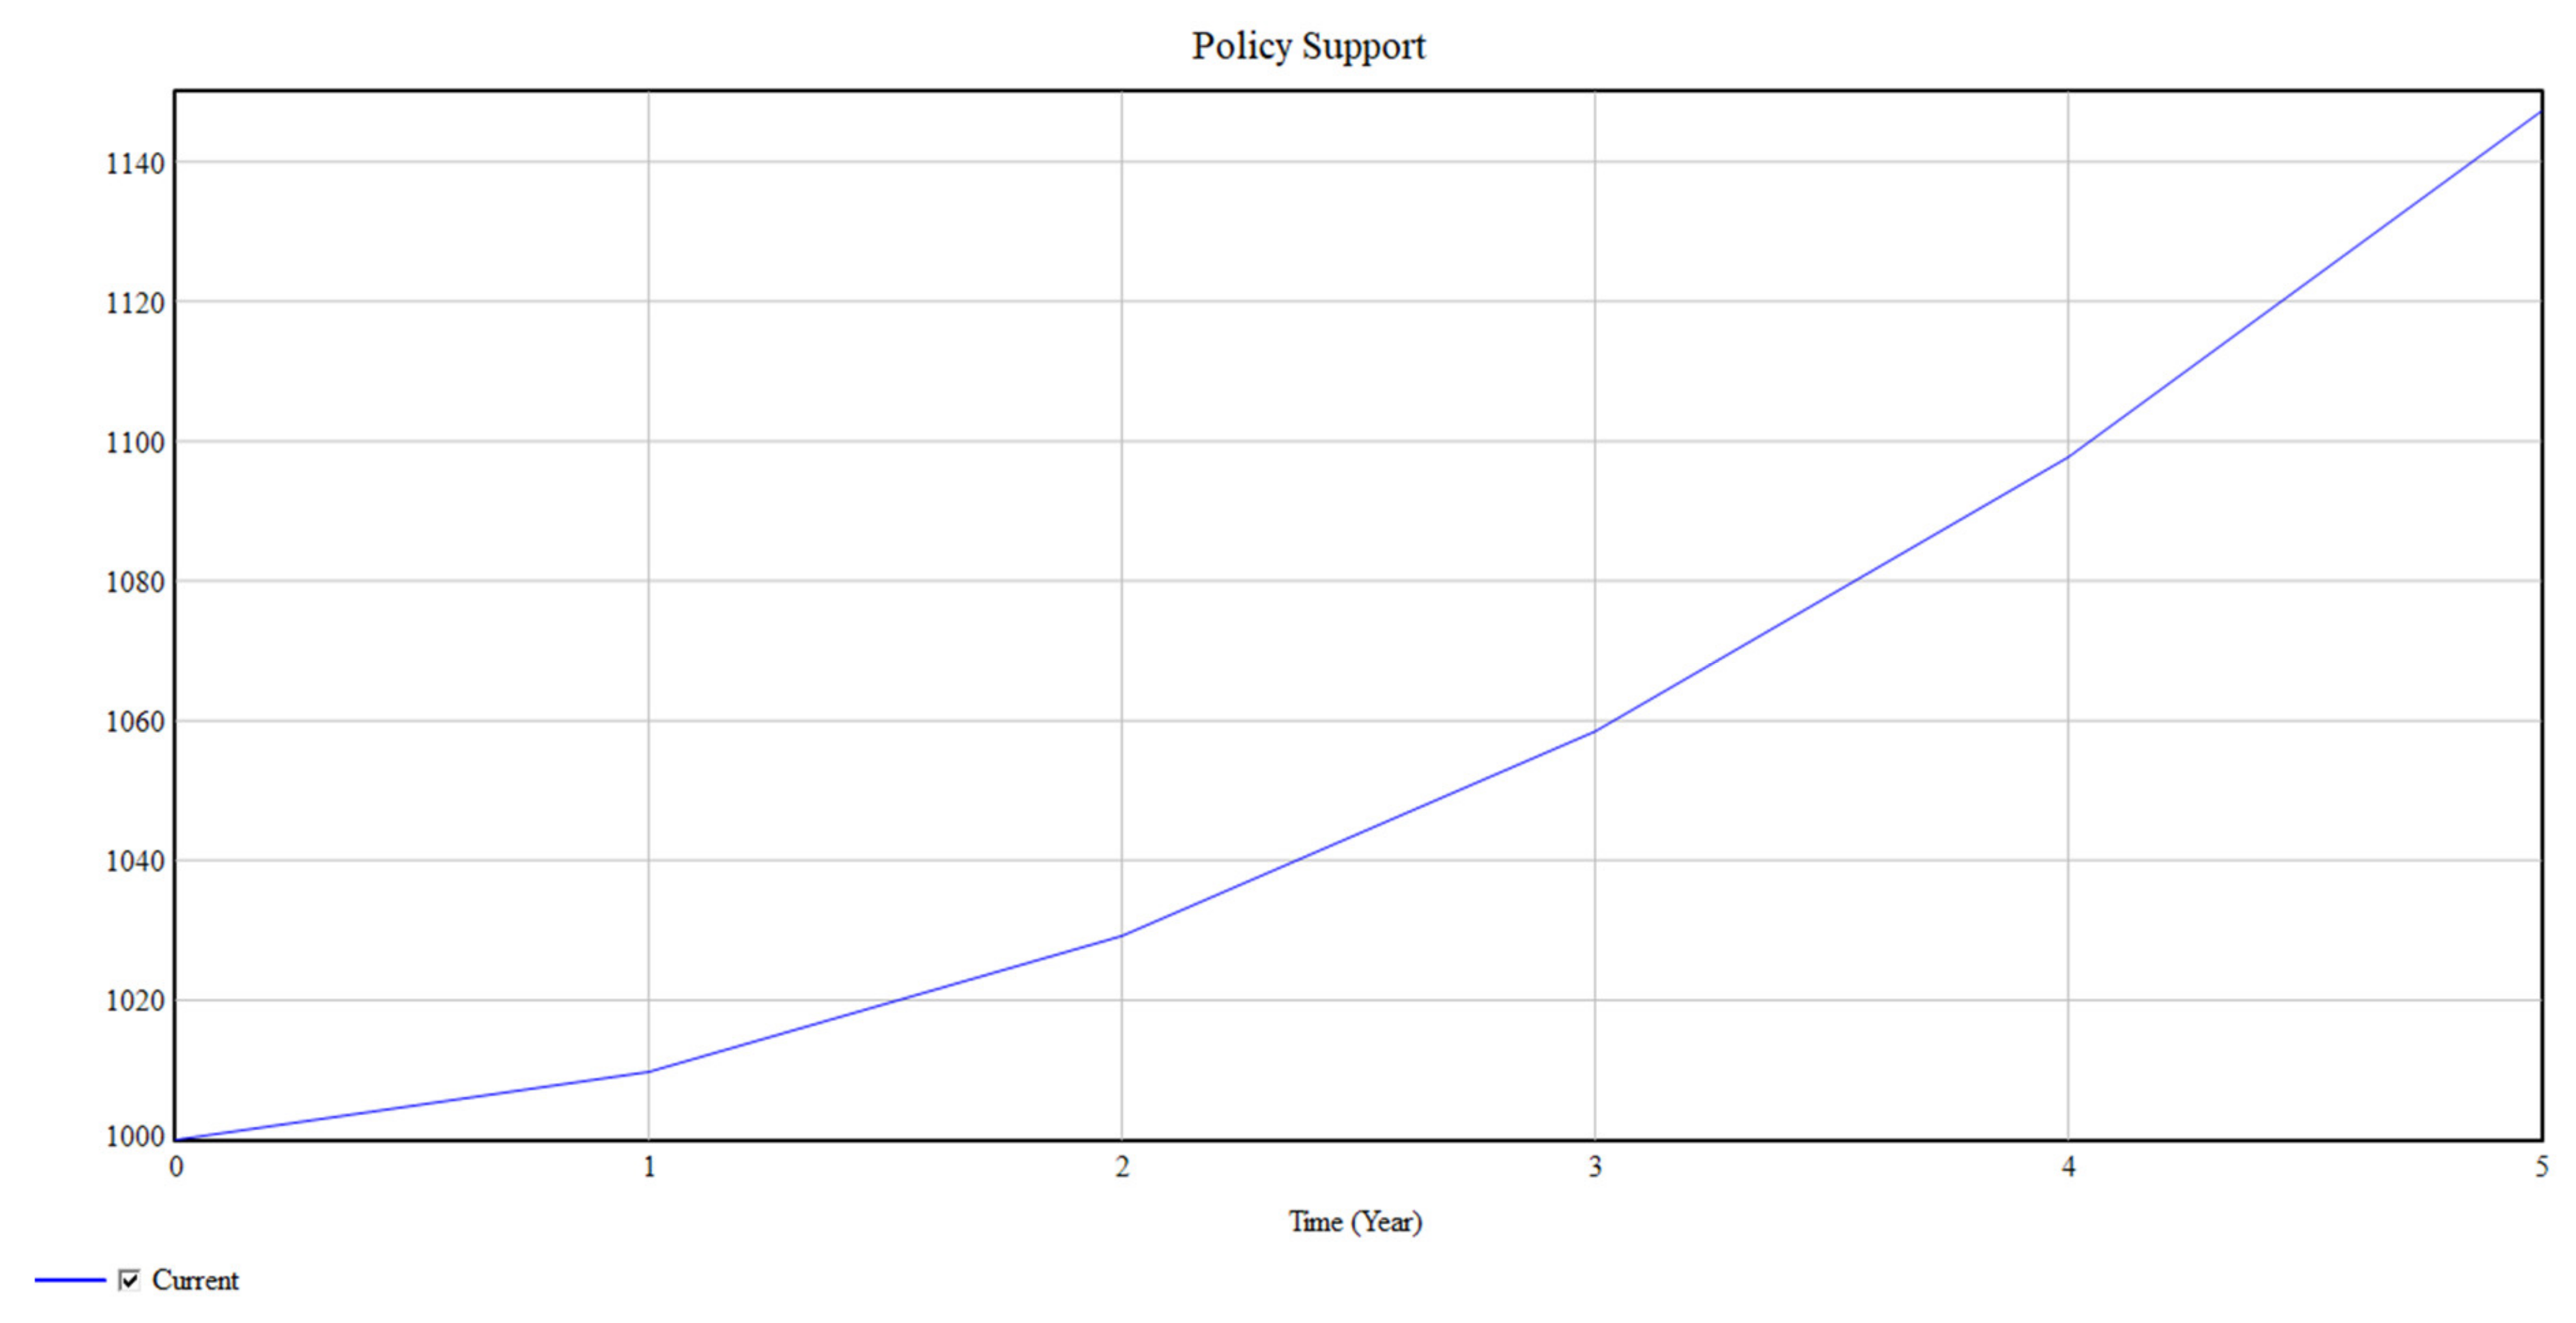
4.3. System Dynamics Model and Simulations
4.4. Model Validation
5. Discussions
5.1. Theoretical Implications
5.2. Practical Implications
6. Conclusions
Author Contributions
Funding
Institutional Review Board Statement
Informed Consent Statement
Data Availability Statement
Acknowledgments
Conflicts of Interest
References
- Zu Castell-Rüdenhausen, M.; Wahlström, M.; Fruergaard Astrup, T.; Jensen, C.; Oberender, A.; Johansson, P.; Waerner, E.R. Policies as drivers for circular economy in the construction sector in the Nordics. Sustainability 2021, 13, 9350. [Google Scholar] [CrossRef]
- Benachio, G.L.F.; Freitas, M.D.C.D.; Tavares, S.F. Circular economy in the construction industry: A systematic literature review. J. Clean. Prod. 2020, 260, 121046. [Google Scholar] [CrossRef]
- Guerra, B.C.; Leite, F. Circular economy in the construction industry: An overview of United States stakeholders’ awareness, major challenges, and enablers. Resour. Conserv. Recycl. 2021, 170, 105617. [Google Scholar] [CrossRef]
- Garcés-Ayerbe, C.; Rivera-Torres, P.; Suárez-Perales, I.; Leyva-De La Hiz, D.I. Is It Possible to Change from a Linear to a Circular Economy? An Overview of Opportunities and Barriers for European Small and Medium-Sized Enterprise Companies. Int. J. Environ. Res. Public Health 2019, 16, 851. [Google Scholar] [CrossRef] [Green Version]
- Joensuu, T.; Edelman, H.; Saari, A. Circular economy practices in the built environment. J. Clean. Prod. 2020, 276, 124215. [Google Scholar] [CrossRef]
- Paris, R. Understanding the “coordination problem” in postwar state building. In The Dilemmas of State building; Routledge: Abingdon, UK, 2009; pp. 67–92. [Google Scholar]
- Ghisellini, P.; Cialani, C.; Ulgiati, S. A Review on Circular Economy: The Expected Transition to a Balanced Interplay of Environmental and Economic Systems. J. Clean. Prod. 2016, 114, 11–32. [Google Scholar] [CrossRef]
- Masi, D.; Day, S.; Godsell, J. Supply Chain Configurations in the Circular Economy: A Systematic Literature Review. Sustainability 2017, 9, 1602. [Google Scholar] [CrossRef] [Green Version]
- Hobson, K. The limits of the loops: Critical environmental politics and the Circular Economy. Environ. Politics 2021, 30, 161–179. [Google Scholar] [CrossRef]
- Kirchherr, J.; Reike, D.; Hekkert, M. Conceptualizing the circular economy: An analysis of 114 definitions. Resour. Conserv. Recycl. 2017, 127, 221–232. [Google Scholar] [CrossRef]
- Suárez-Eiroa, B.; Fernández, E.; Méndez-Martínez, G.; Soto-Oñate, D. Operational principles of circular economy for sustainable development: Linking theory and practice. J. Clean. Prod. 2019, 214, 952–961. [Google Scholar] [CrossRef]
- Geissdoerfer, M.; Savaget, P.; Bocken, N.M.; Hultink, E.J. The Circular Economy–A new sustainability paradigm? J. Clean. Prod. 2017, 143, 757–768. [Google Scholar] [CrossRef] [Green Version]
- Ritzén, S.; Sandström, G.Ö. Barriers to the Circular Economy–integration of perspectives and domains. Procedia CIRP 2017, 64, 7–12. [Google Scholar] [CrossRef]
- Schöggl, J.-P.; Stumpf, L.; Baumgartner, R.J. The narrative of sustainability and circular economy—A longitudinal review of two decades of research. Resour. Conserv. Recycl. 2020, 163, 105073. [Google Scholar] [CrossRef]
- Walker, A.M.; Opferkuch, K.; Lindgreen, E.R.; Raggi, A.; Simboli, A.; Vermeulen, W.J.; Caeiro, S.; Salomone, R. What Is the Relation between Circular Economy and Sustainability? Answers from Frontrunner Companies Engaged with Circular Economy Practices. Circ. Econ. Sustain. 2021, 2, 731–758. [Google Scholar] [CrossRef]
- Sparrevik, M.; de Boer, L.; Michelsen, O.; Skaar, C.; Knudson, H.; Fet, A.M. Circular economy in the construction sector: Advancing environmental performance through systemic and holistic thinking. Environ. Syst. Decis. 2021, 41, 392–400. [Google Scholar] [CrossRef]
- Stewart, R.; Niero, M. Circular economy in corporate sustainability strategies: A review of corporate sustainability reports in the fast-moving consumer goods sector. Bus. Strategy Environ. 2018, 27, 1005–1022. [Google Scholar] [CrossRef] [Green Version]
- Menon, S.; Suresh, M. Synergizing education, research, campus operations, and community engagements towards sustainability in higher education: A literature review. Int. J. Sustain. High. Educ. 2020, 21, 1015–1051. [Google Scholar] [CrossRef]
- Wijewansha, A.S.; Tennakoon, G.; Waidyasekara, K.; Ekanayake, B. Implementation of circular economy principles during pre-construction stage: The case of Sri Lanka. Built Environ. Proj. Asset Manag. 2021, 11, 750–766. [Google Scholar] [CrossRef]
- Bilal, M.; Khan, K.I.A.; Thaheem, M.J.; Nasir, A.R. Current state and barriers to the circular economy in the building sector: Towards a mitigation framework. J. Clean. Prod. 2020, 276, 123250. [Google Scholar] [CrossRef]
- Schroeder, P.; Anggraeni, K.; Weber, U. The Relevance of Circular Economy Practices to the Sustainable Development Goals. J. Ind. Ecol. 2019, 23, 77–95. [Google Scholar] [CrossRef] [Green Version]
- Iacovidou, E.; Hahladakis, J.N.; Purnell, P. A systems thinking approach to understanding the challenges of achieving the circular economy. Environ. Sci. Pollut. Res. 2021, 28, 24785–24806. [Google Scholar] [CrossRef]
- Dantas, T.; De-Souza, E.; Destro, I.; Hammes, G.; Rodriguez, C.; Soares, S. How the combination of Circular Economy and Industry 4.0 can contribute towards achieving the Sustainable Development Goals. Sustain. Prod. Consum. 2020, 26, 213–227. [Google Scholar] [CrossRef]
- Hák, T.; Janoušková, S.; Moldan, B. Sustainable Development Goals: A need for relevant indicators. Ecol. Indic. 2016, 60, 565–573. [Google Scholar] [CrossRef]
- Wieser, A.A.; Scherz, M.; Maier, S.; Passer, A.; Kreiner, H. Implementation of Sustainable Development Goals in construction industry—A systemic consideration of synergies and trade-offs. IOP Conf. Ser. Earth Environ. Sci. 2019, 323, 012177. [Google Scholar] [CrossRef]
- Xia, B.; Olanipekun, A.; Chen, Q.; Xie, L.; Liu, Y. Conceptualising the state of the art of corporate social responsibility (CSR) in the construction industry and its nexus to sustainable development. J. Clean. Prod. 2018, 195, 340–353. [Google Scholar] [CrossRef]
- Mansell, P.; Philbin, S.P.; Konstantinou, E. Delivering UN Sustainable Development Goals’ Impact on Infrastructure Projects: An Empirical Study of Senior Executives in the UK Construction Sector. Sustainability 2020, 12, 7998. [Google Scholar] [CrossRef]
- Xu, X.; Wang, Y.; Tao, L. Comprehensive evaluation of sustainable development of regional construction industry in China. J. Clean. Prod. 2018, 211, 1078–1087. [Google Scholar] [CrossRef]
- Corona, B.; Shen, L.; Reike, D.; Carreón, J.R.; Worrell, E. Towards sustainable development through the circular economy—A review and critical assessment on current circularity metrics. Resour. Conserv. Recycl. 2019, 151, 104498. [Google Scholar] [CrossRef]
- Ogunmakinde, O.E.; Egbelakin, T.; Sher, W. Contributions of the circular economy to the UN sustainable development goals through sustainable construction. Resour. Conserv. Recycl. 2022, 178, 106023. [Google Scholar] [CrossRef]
- Padilla-Rivera, A.; Russo-Garrido, S.; Merveille, N. Addressing the Social Aspects of a Circular Economy: A Systematic Literature Review. Sustainability 2020, 12, 7912. [Google Scholar] [CrossRef]
- Kutty, A.A.; Abdella, G.M.; Kucukvar, M.; Onat, N.C.; Bulu, M. A system thinking approach for harmonizing smart and sustainable city initiatives with United Nations sustainable development goals. Sustain. Dev. 2020, 28, 1347–1365. [Google Scholar] [CrossRef]
- Khan, K.I.A.; Flanagan, R.; Lu, S.-L. Managing information complexity using system dynamics on construction projects. Constr. Manag. Econ. 2016, 34, 192–204. [Google Scholar] [CrossRef]
- Sapiri, H.; Kamil, A.A.; Tahar, R.M. System Dynamics Approach as A Risk Management Tool in Analyzing Pension Expenditure: The Case of Malaysian Employees Public Pension Plan. Singap. Econ. Rev. 2014, 59, 1450046. [Google Scholar] [CrossRef]
- Blomsma, F.; Brennan, G. The Emergence of Circular Economy: A New Framing Around Prolonging Resource Productivity. J. Ind. Ecol. 2017, 21, 603–614. [Google Scholar] [CrossRef]
- Kalmykova, Y.; Sadagopan, M.; Rosado, L. Circular economy—From review of theories and practices to development of implementation tools. Resour. Conserv. Recycl. 2018, 135, 190–201. [Google Scholar] [CrossRef]
- Ullah, F.; Sepasgozar, S.M.; Wang, C. A Systematic Review of Smart Real Estate Technology: Drivers of, and Barriers to, the Use of Digital Disruptive Technologies and Online Platforms. Sustainability 2018, 10, 3142. [Google Scholar] [CrossRef] [Green Version]
- Adams, K.T.; Osmani, M.; Thorpe, T.; Thornback, J. Circular economy in construction: Current awareness, challenges and enablers. In Proceedings of the Institution of Civil Engineers-Waste and Resource Management, London, UK, 24 April 2017; pp. 15–24. [Google Scholar]
- Mele, R.; Poli, G. The Evaluation of Landscape Services: A New Paradigm for Sustainable Development and City Planning. In Proceedings of the International Conference on Computational Science and Its Applications, Banff, AB, Canada, 22–25 June 2015; pp. 64–76. [Google Scholar] [CrossRef]
- Allacker, K.; Mathieux, F.; Manfredi, S.; Pelletier, N.; De Camillis, C.; Ardente, F.; Pant, R. Allocation solutions for secondary material production and end of life recovery: Proposals for product policy initiatives. Resour. Conserv. Recycl. 2014, 88, 1–12. [Google Scholar] [CrossRef]
- Ma, Y.; Rong, K.; Luo, Y.; Wang, Y.; Mangalagiu, D.; Thornton, T.F. Value Co-creation for sustainable consumption and production in the sharing economy in China. J. Clean. Prod. 2019, 208, 1148–1158. [Google Scholar] [CrossRef]
- Moallemi, E.A.; Zare, F.; Reed, P.M.; Elsawah, S.; Ryan, M.J.; Bryan, B.A. Structuring and evaluating decision support processes to enhance the robustness of complex human–natural systems. Environ. Model. Softw. 2020, 123, 104551. [Google Scholar] [CrossRef]
- Ullah, F.; Sepasgozar, S.M. Key Factors Influencing Purchase or Rent Decisions in Smart Real Estate Investments: A System Dynamics Approach Using Online Forum Thread Data. Sustainability 2020, 12, 4382. [Google Scholar] [CrossRef]
- Agrawal, R.; Wankhede, V.A.; Kumar, A.; Upadhyay, A.; Garza-Reyes, J.A. Nexus of circular economy and sustainable business performance in the era of digitalization. Int. J. Prod. Perform. Manag. 2021, 71, 748–774. [Google Scholar] [CrossRef]
- Nogueira, A.; Ashton, W.S.; Teixeira, C. Expanding perceptions of the circular economy through design: Eight capitals as innovation lenses. Resour. Conserv. Recycl. 2019, 149, 566–576. [Google Scholar] [CrossRef]
- Yaduvanshi, N.R.; Myana, R.; Krishnamurthy, S. Circular Economy for Sustainable Development in India. Indian J. Sci. Technol. 2016, 9, 1–9. [Google Scholar] [CrossRef]
- Kyriakopoulos, G.L.; Kapsalis, V.C.; Aravossis, K.G.; Zamparas, M.; Mitsikas, A. Evaluating Circular Economy under a Multi-Parametric Approach: A Technological Review. Sustainability 2019, 11, 6139. [Google Scholar] [CrossRef] [Green Version]
- Ullah, F.; Sepasgozar, S.M.; Shirowzhan, S.; Davis, S. Modelling users’ perception of the online real estate platforms in a digitally disruptive environment: An integrated KANO-SISQual approach. Telemat. Inform. 2021, 63, 101660. [Google Scholar] [CrossRef]
- Merli, R.; Preziosi, M.; Acampora, A. How do scholars approach the circular economy? A systematic literature review. J. Clean. Prod. 2018, 178, 703–722. [Google Scholar] [CrossRef]
- Mongsawad, P. The philosophy of the sufficiency economy: A contribution to the theory of development. Asia-Pac. Dev. J. 2012, 17, 123–143. [Google Scholar] [CrossRef] [Green Version]
- Türkeli, S.; Kemp, R.; Huang, B.; Bleischwitz, R.; McDowall, W. Circular economy scientific knowledge in the European Union and China: A bibliometric, network and survey analysis (2006–2016). J. Clean. Prod. 2018, 197, 1244–1261. [Google Scholar] [CrossRef]
- Schoenmaker, D. Investing for the Common Good: A Sustainable Finance Framework; Bruegel: Brussels, Belgium, 2017; p. 80. [Google Scholar]
- Kontokosta, C.E. The Quantified Community and Neighborhood Labs: A Framework for Computational Urban Science and Civic Technology Innovation. J. Urban Technol. 2016, 23, 67–84. [Google Scholar] [CrossRef] [Green Version]
- Willis, K. International development planning and the Sustainable Development Goals (SDGs). Int. Dev. Plan. Rev. 2016, 38, 105–111. [Google Scholar] [CrossRef]
- Kumar, S.; Kumar, N.; Vivekadhish, S. Millennium development goals (MDGS) to sustainable development goals (SDGS): Addressing unfinished agenda and strengthening sustainable development and partnership. Indian J. Commun. Med. 2016, 41, 1–4. [Google Scholar] [CrossRef] [PubMed]
- Howden-Chapman, P.; Siri, J.; Chisholm, E.; Chapman, R.; Doll, C.N.; Capon, A. SDG 3: Ensure healthy lives and promote wellbeing for all at all ages. In A Guide to SDG Interactions: From Science to Implementation; International Council for Science: Paris, France, 2017; pp. 81–126. [Google Scholar]
- Chaudhary, K.; Vrat, P. Circular economy model of gold recovery from cell phones using system dynamics approach: A case study of India. Environ. Dev. Sustain. 2020, 22, 173–200. [Google Scholar] [CrossRef]
- Ormazabal, M.; Prieto-Sandoval, V.; Puga-Leal, R.; Jaca, C. Circular Economy in Spanish SMEs: Challenges and opportunities. J. Clean. Prod. 2018, 185, 157–167. [Google Scholar] [CrossRef]
- Hanseth, O.; Lyytinen, K. Design Theory for Dynamic Complexity in Information Infrastructures: The Case of Building Internet. In Enacting Research Methods in Information Systems; Springer: Berlin/Heidelberg, Germany, 2016; pp. 104–142. [Google Scholar] [CrossRef]
- Hopkinson, P.; Zils, M.; Hawkins, P.; Roper, S. Managing a Complex Global Circular Economy Business Model: Opportunities and Challenges. Calif. Manag. Rev. 2018, 60, 71–94. [Google Scholar] [CrossRef]
- Naveed, F.; Khan, K.I.A. Investigating the influence of information complexity on construction quality: A systems thinking approach. Eng. Constr. Arch. Manag. 2021, 29, 1427–1448. [Google Scholar] [CrossRef]
- Gharajedaghi, J. Systems Thinking: Managing Chaos and Complexity: A Platform for Designing Business Architecture; Elsevier: Amsterdam, The Netherlands, 2011. [Google Scholar]
- Xing, L.; Levitin, G. Connectivity modeling and optimization of linear consecutively connected systems with repairable connecting elements. Eur. J. Oper. Res. 2018, 264, 732–741. [Google Scholar] [CrossRef]
- Knickel, K.; Redman, M.; Darnhofer, I.; Ashkenazy, A.; Chebach, T.C.; Šūmane, S.; Tisenkopfs, T.; Zemeckis, R.; Atkociuniene, V.; Rivera, M.; et al. Between aspirations and reality: Making farming, food systems and rural areas more resilient, sustainable and equitable. J. Rural Stud. 2018, 59, 197–210. [Google Scholar] [CrossRef] [Green Version]
- Bertassini, A.C.; Zanon, L.G.; Azarias, J.G.; Gerolamo, M.C.; Ometto, A.R. Circular Business Ecosystem Innovation: A guide for mapping stakeholders, capturing values, and finding new opportunities. Sustain. Prod. Consum. 2020, 27, 436–448. [Google Scholar] [CrossRef]
- Bianchini, A.; Rossi, J.; Pellegrini, M. Overcoming the Main Barriers of Circular Economy Implementation through a New Visualization Tool for Circular Business Models. Sustainability 2019, 11, 6614. [Google Scholar] [CrossRef] [Green Version]
- Sani, D.; Picone, S.; Bianchini, A.; Fava, F.; Guarnieri, P.; Rossi, J. An Overview of the Transition to a Circular Economy in Emilia-Romagna Region, Italy Considering Technological, Legal–Regulatory and Financial Points of View: A Case Study. Sustainability 2021, 13, 596. [Google Scholar] [CrossRef]
- Ghufran, M.; Khan, K.I.A.; Thaheem, M.J.; Nasir, A.R.; Ullah, F. Adoption of Sustainable Supply Chain Management for Performance Improvement in the Construction Industry: A System Dynamics Approach. Architecture 2021, 1, 161–182. [Google Scholar] [CrossRef]
- Saiz-Alvarez, J.M. Circular Economy: An Emerging Paradigm–Concept, Principles, and Characteristics. In Handbook of Research on Entrepreneurship Development and Opportunities in Circular Economy; IGI Global: Hershey, PA, USA, 2020; pp. 1–20. [Google Scholar]
- Brennan, C.; Ashley, M.; Molloy, O. A System Dynamics Approach to Increasing Ocean Literacy. Front. Mar. Sci. 2019, 6, 360. [Google Scholar] [CrossRef]
- Rebs, T.; Brandenburg, M.; Seuring, S. System dynamics modeling for sustainable supply chain management: A literature review and systems thinking approach. J. Clean. Prod. 2019, 208, 1265–1280. [Google Scholar] [CrossRef]
- Mashaly, A.F.; Fernald, A.G. Identifying Capabilities and Potentials of System Dynamics in Hydrology and Water Resources as a Promising Modeling Approach for Water Management. Water 2020, 12, 1432. [Google Scholar] [CrossRef]
- Martinez-Moyano, I.J.; Richardson, G.P. Best practices in system dynamics modeling. Syst. Dyn. Rev. 2013, 29, 102–123. [Google Scholar] [CrossRef]
- Kiani, B.; Gholamian, M.R.; Hamzehei, A.; Hosseini, S.H. Using Causal Loop Diagram to Achieve a Better Understanding of e-Business Models. Int. J. Electron. Bus. Manag. 2009, 7, 159–167. [Google Scholar]
- Sapiri, H.; Zulkepli, J.; Ahmad, N.; Abidin, N.Z.; Hawari, N.N. Introduction to System Dynamic Modelling and Vensim Software; UUM Press: Kedah, Malaysia, 2017. [Google Scholar]
- Elsawah, S.; Danesh, D.; Ryan, M. A strategic asset planning decision analysis: An integrated System Dynamics and multi-criteria decision-making method. In Proceedings of the INCOSE International Symposium, Orlando, FL, USA, 20–25 July 2019; pp. 788–802. [Google Scholar] [CrossRef]
- Peter, C.; Swilling, M. Linking Complexity and Sustainability Theories: Implications for Modeling Sustainability Transitions. Sustainability 2014, 6, 1594–1622. [Google Scholar] [CrossRef] [Green Version]
- Cosenz, F.; Bivona, E. Fostering growth patterns of SMEs through business model innovation. A tailored dynamic business modelling approach. J. Bus. Res. 2021, 130, 658–669. [Google Scholar] [CrossRef]
- Mohammadrezaytayebi, S.; Sebt, M.H.; Afshar, M.R. Introducing a system dynamic–based model of quality estimation for construction industry subcontractors’ works. Int. J. Constr. Manag. 2021, 1–15. [Google Scholar] [CrossRef]
- Khan, S.A.R.; Shah, A.S.A.; Yu, Z.; Tanveer, M. A systematic literature review on circular economy practices: Challenges, opportunities and future trends. J. Entrep. Emerg. Econ. 2022. [Google Scholar] [CrossRef]
- Ullah, F. A Beginner’s Guide to Developing Review-Based Conceptual Frameworks in the Built Environment. Architecture 2021, 1, 5–24. [Google Scholar] [CrossRef]
- Jahan, S.; Khan, K.I.A.; Thaheem, M.J.; Ullah, F.; Alqurashi, M.; Alsulami, B.T. Modeling Profitability-Influencing Risk Factors for Construction Projects: A System Dynamics Approach. Buildings 2022, 12, 701. [Google Scholar] [CrossRef]
- Rasul, N.; Malik, M.S.A.; Bakhtawar, B.; Thaheem, M.J. Risk assessment of fast-track projects: A systems-based approach. Int. J. Constr. Manag. 2019, 1099–1114. [Google Scholar] [CrossRef]
- Amin, F.; Khan, K.I.A.; Ullah, F.; Alqurashi, M.; Alsulami, B.T. Key Adoption Factors for Collaborative Technologies and Barriers to Information Management in Construction Supply Chains: A System Dynamics Approach. Buildings 2022, 12, 766. [Google Scholar] [CrossRef]
- Rizos, V.; Behrens, A.; Van Der Gaast, W.; Hofman, E.; Ioannou, A.; Kafyeke, T.; Flamos, A.; Rinaldi, R.; Papadelis, S.; Hirschnitz-Garbers, M.; et al. Implementation of Circular Economy Business Models by Small and Medium-Sized Enterprises (SMEs): Barriers and Enablers. Sustainability 2016, 8, 1212. [Google Scholar] [CrossRef] [Green Version]
- Govindan, K.; Hasanagic, M. A systematic review on drivers, barriers, and practices towards circular economy: A supply chain perspective. Int. J. Prod. Res. 2017, 56, 278–311. [Google Scholar] [CrossRef]
- Brown, P.; Bocken, N.; Balkenende, R. Why do companies pursue collaborative circular oriented innovation? Sustainability 2019, 11, 635. [Google Scholar] [CrossRef] [Green Version]
- Tayebi-Khorami, M.; Edraki, M.; Corder, G.; Golev, A. Re-Thinking Mining Waste through an Integrative Approach Led by Circular Economy Aspirations. Minerals 2019, 9, 286. [Google Scholar] [CrossRef] [Green Version]
- Barreiro-Gen, M.; Lozano, R. How circular is the circular economy? Analysing the implementation of circular economy in organisations. Bus. Strat. Environ. 2020, 29, 3484–3494. [Google Scholar] [CrossRef]
- Kanters, J. Circular Building Design: An Analysis of Barriers and Drivers for a Circular Building Sector. Buildings 2020, 10, 77. [Google Scholar] [CrossRef]
- Patwa, N.; Sivarajah, U.; Seetharaman, A.; Sarkar, S.; Maiti, K.; Hingorani, K. Towards a circular economy: An emerging economies context. J. Bus. Res. 2021, 122, 725–735. [Google Scholar] [CrossRef]
- De Jesus, A.; Mendonça, S. Lost in Transition? Drivers and Barriers in the Eco-innovation Road to the Circular Economy. Ecol. Econ. 2018, 145, 75–89. [Google Scholar] [CrossRef] [Green Version]
- Ranta, V.; Aarikka-Stenroos, L.; Ritala, P.; Mäkinen, S.J. Exploring institutional drivers and barriers of the circular economy: A cross-regional comparison of China, the US, and Europe. Resour. Conserv. Recycl. 2018, 135, 70–82. [Google Scholar] [CrossRef]
- Tura, N.; Hanski, J.; Ahola, T.; Ståhle, M.; Piiparinen, S.; Valkokari, P. Unlocking circular business: A framework of barriers and drivers. J. Clean. Prod. 2019, 212, 90–98. [Google Scholar] [CrossRef]
- Charef, R.; Lu, W. Factor dynamics to facilitate circular economy adoption in construction. J. Clean. Prod. 2021, 319, 128639. [Google Scholar] [CrossRef]
- Torres-Guevara, L.E.; Prieto-Sandoval, V.; Mejia-Villa, A. Success Drivers for Implementing Circular Economy: A Case Study from the Building Sector in Colombia. Sustainability 2021, 13, 1350. [Google Scholar] [CrossRef]
- Velenturf, A.P.; Purnell, P. Principles for a sustainable circular economy. Sustain. Prod. Consum. 2021, 27, 1437–1457. [Google Scholar] [CrossRef]
- Alhosni, I.S.; Amoudi, O. Drivers of adopting Circular Economy in Oman built environment. J. Stud. Res. 2020. [Google Scholar] [CrossRef]
- Smol, M.; Marcinek, P.; Koda, E. Drivers and Barriers for a Circular Economy (CE) Implementation in Poland—A Case Study of Raw Materials Recovery Sector. Energies 2021, 14, 2219. [Google Scholar] [CrossRef]
- Ilić, M.; Nikolić, M. Drivers for development of circular economy—A case study of Serbia. Habitat Int. 2016, 56, 191–200. [Google Scholar] [CrossRef]
- De Mattos, C.A.; De Albuquerque, T.L.M. Enabling factors and strategies for the transition toward a circular economy (CE). Sustainability 2018, 10, 4628. [Google Scholar] [CrossRef] [Green Version]
- Hart, J.; Adams, K.; Giesekam, J.; Tingley, D.D.; Pomponi, F. Barriers and drivers in a circular economy: The case of the built environment. Procedia CIRP 2019, 80, 619–624. [Google Scholar] [CrossRef]
- Antikainen, M.; Uusitalo, T.; Kivikytö-Reponen, P. Digitalisation as an enabler of circular economy. Procedia CIRP 2018, 73, 45–49. [Google Scholar] [CrossRef]
- Zhou, X.; Song, M.; Cui, L. Driving force for China’s economic development under Industry 4.0 and circular economy: Technological innovation or structural change? J. Clean. Prod. 2020, 271, 122680. [Google Scholar] [CrossRef]
- Kalmykova, Y.; Rosado, L.; Patrício, J. Resource consumption drivers and pathways to reduction: Economy, policy and lifestyle impact on material flows at the national and urban scale. J. Clean. Prod. 2015, 132, 70–80. [Google Scholar] [CrossRef] [Green Version]
- Gue, I.H.V.; Promentilla, M.A.B.; Tan, R.R.; Ubando, A.T. Sector perception of circular economy driver interrelationships. J. Clean. Prod. 2020, 276, 123204. [Google Scholar] [CrossRef]
- Ratner, S.; Gomonov, K.; Lazanyuk, I.; Revinova, S. Barriers and Drivers for Circular Economy 2.0 on the Firm Level: Russian Case. Sustainability 2021, 13, 11080. [Google Scholar] [CrossRef]
- Taber, K.S. The Use of Cronbach’s Alpha When Developing and Reporting Research Instruments in Science Education. Res. Sci. Educ. 2018, 48, 1273–1296. [Google Scholar] [CrossRef]
- Duo, C.; Tie-Jun, Z.; Li-Fen, Z. An Adaptive Cluster Validity Index Based on Fuzzy Set. In Proceedings of the 2012 International Conference on Industrial Control and Electronics Engineering, Xi’an, China, 23–25 August 2012; pp. 1824–1827. [Google Scholar]
- García, J.M. Theory and Practical Exercises of System Dynamics: Modeling and Simulation with Vensim PLE; Preface John Sterman; Juan Martin Garcia: Littleton, MA, USA, 2020. [Google Scholar]
- Samans, R.; Blanke, J.; Drzeniek, M.; Corrigan, G. The inclusive development index 2018 summary and data highlights. In Proceedings of the World Economic Forum, Geneva, Switzerland, 23–26 January 2018. [Google Scholar]
- Gupta, S.; Chen, H.; Hazen, B.T.; Kaur, S.; Gonzalez, E.D.S. Circular economy and big data analytics: A stakeholder perspective. Technol. Forecast. Soc. Change 2019, 144, 466–474. [Google Scholar] [CrossRef]
- Awan, U.; Sroufe, R.; Shahbaz, M. Industry 4.0 and the circular economy: A literature review and recommendations for future research. Bus. Strat. Environ. 2021, 30, 2038–2060. [Google Scholar] [CrossRef]
- Gedam, V.V.; Raut, R.D.; Jabbour, A.B.L.d.S.; Agrawal, N. Moving the circular economy forward in the mining industry: Challenges to closed-loop in an emerging economy. Resour. Policy 2021, 74, 102279. [Google Scholar] [CrossRef]
- Camagni, R.; Capello, R. Regional Innovation Patterns and the EU Regional Policy Reform: Towards Smart Innovation Policies. In Seminal Studies in Regional and Urban Economics; Springer: Berlin/Heidelberg, Germany, 2017; pp. 313–343. [Google Scholar] [CrossRef] [Green Version]
- Sassanelli, C.; Pezzotta, G.; Pirola, F.; Sala, R.; Margarito, A.; Lazoi, M.; Corallo, A.; Rossi, M.; Terzi, S. Using design rules to guide the PSS design in an engineering platform based on the product service lifecycle management paradigm. Int. J. Prod. Lifecycle Manag. 2018, 11, 91–115. [Google Scholar] [CrossRef] [Green Version]
- Despeisse, M.; Ford, S. The role of additive manufacturing in improving resource efficiency and sustainability. In Proceedings of the IFIP International Conference on Advances in Production Management Systems, Tokyo, Japan, 7–9 September 2015; pp. 129–136. [Google Scholar]
- Tahir, M.B.; Khan, K.I.A.; Nasir, A.R. Tacit knowledge sharing in construction: A system dynamics approach. Asian J. Civ. Eng. 2021, 22, 605–625. [Google Scholar] [CrossRef]
- Qudrat-Ullah, H. On the validation of system dynamics type simulation models. Telecommun. Syst. 2012, 51, 159–166. [Google Scholar] [CrossRef]
- Al-Kofahi, Z.G.; Mahdavian, A.; Oloufa, A. System dynamics modeling approach to quantify change orders impact on labor productivity 1: Principles and model development comparative study. Int. J. Constr. Manag. 2020, 22, 1355–1366. [Google Scholar] [CrossRef]
- Byrne, B.M. Structural Equation Modeling with EQS: Basic Concepts, Applications, and Programming; Routledge: Abingdon, UK, 2013. [Google Scholar]
- Sachs, J.D.; Schmidt-Traub, G.; Mazzucato, M.; Messner, D.; Nakicenovic, N.; Rockström, J. Six transformations to achieve the sustainable development goals. Nat. Sustain. 2019, 2, 805–814. [Google Scholar] [CrossRef]
- Caiado, R.G.G.; Filho, W.L.; Quelhas, O.L.G.; Nascimento, D.L.d.M.; Ávila, L.V. A literature-based review on potentials and constraints in the implementation of the sustainable development goals. J. Clean. Prod. 2018, 198, 1276–1288. [Google Scholar] [CrossRef]
- Triplett, A. Incentive-Based Compensation Arrangements: An Examination of the Wells Fargo Scandal and the Need for Reform in Financial Institutions. Univ. Baltim. Law Rev. 2018, 47, 6. [Google Scholar]
- Giourka, P.; Apostolopoulos, V.; Angelakoglou, K.; Kourtzanidis, K.; Nikolopoulos, N.; Sougkakis, V.; Fuligni, F.; Barberis, S.; Verbeek, K.; Costa, J.M.; et al. The Nexus between Market Needs and Value Attributes of Smart City Solutions towards Energy Transition. An Empirical Evidence of Two European Union (EU) Smart Cities, Evora and Alkmaar. Smart Cities 2020, 3, 604–641. [Google Scholar] [CrossRef]
- Srinivasan, S.; Jayaraman, V. Orchestrating Sustainable Stakeholder Value Creation: A Product Life Cycle Extension Perspective. In Pursuing Sustainability; Springer: Berlin/Heidelberg, Germany, 2021; pp. 239–254. [Google Scholar] [CrossRef]
- Epstein, M.J.; Elkington, J.; Herman, B. Making Sustainability Work: Best Practices in Managing and Measuring Corporate Social, Environmental and Economic Impacts; Routledge: Abingdon, UK, 2018. [Google Scholar]


| Sr. No | Enabler | NLS | References |
|---|---|---|---|
| 1 | Government financial support | 0.1213 | [1,85,86,87,88,89,90,91] |
| 2 | Strict regulations | 0.1070 | [1,23,86,87,92,93,94,95] |
| 3 | Extension of product life cycle | 0.1070 | [88,89,90,92,93,96,97] |
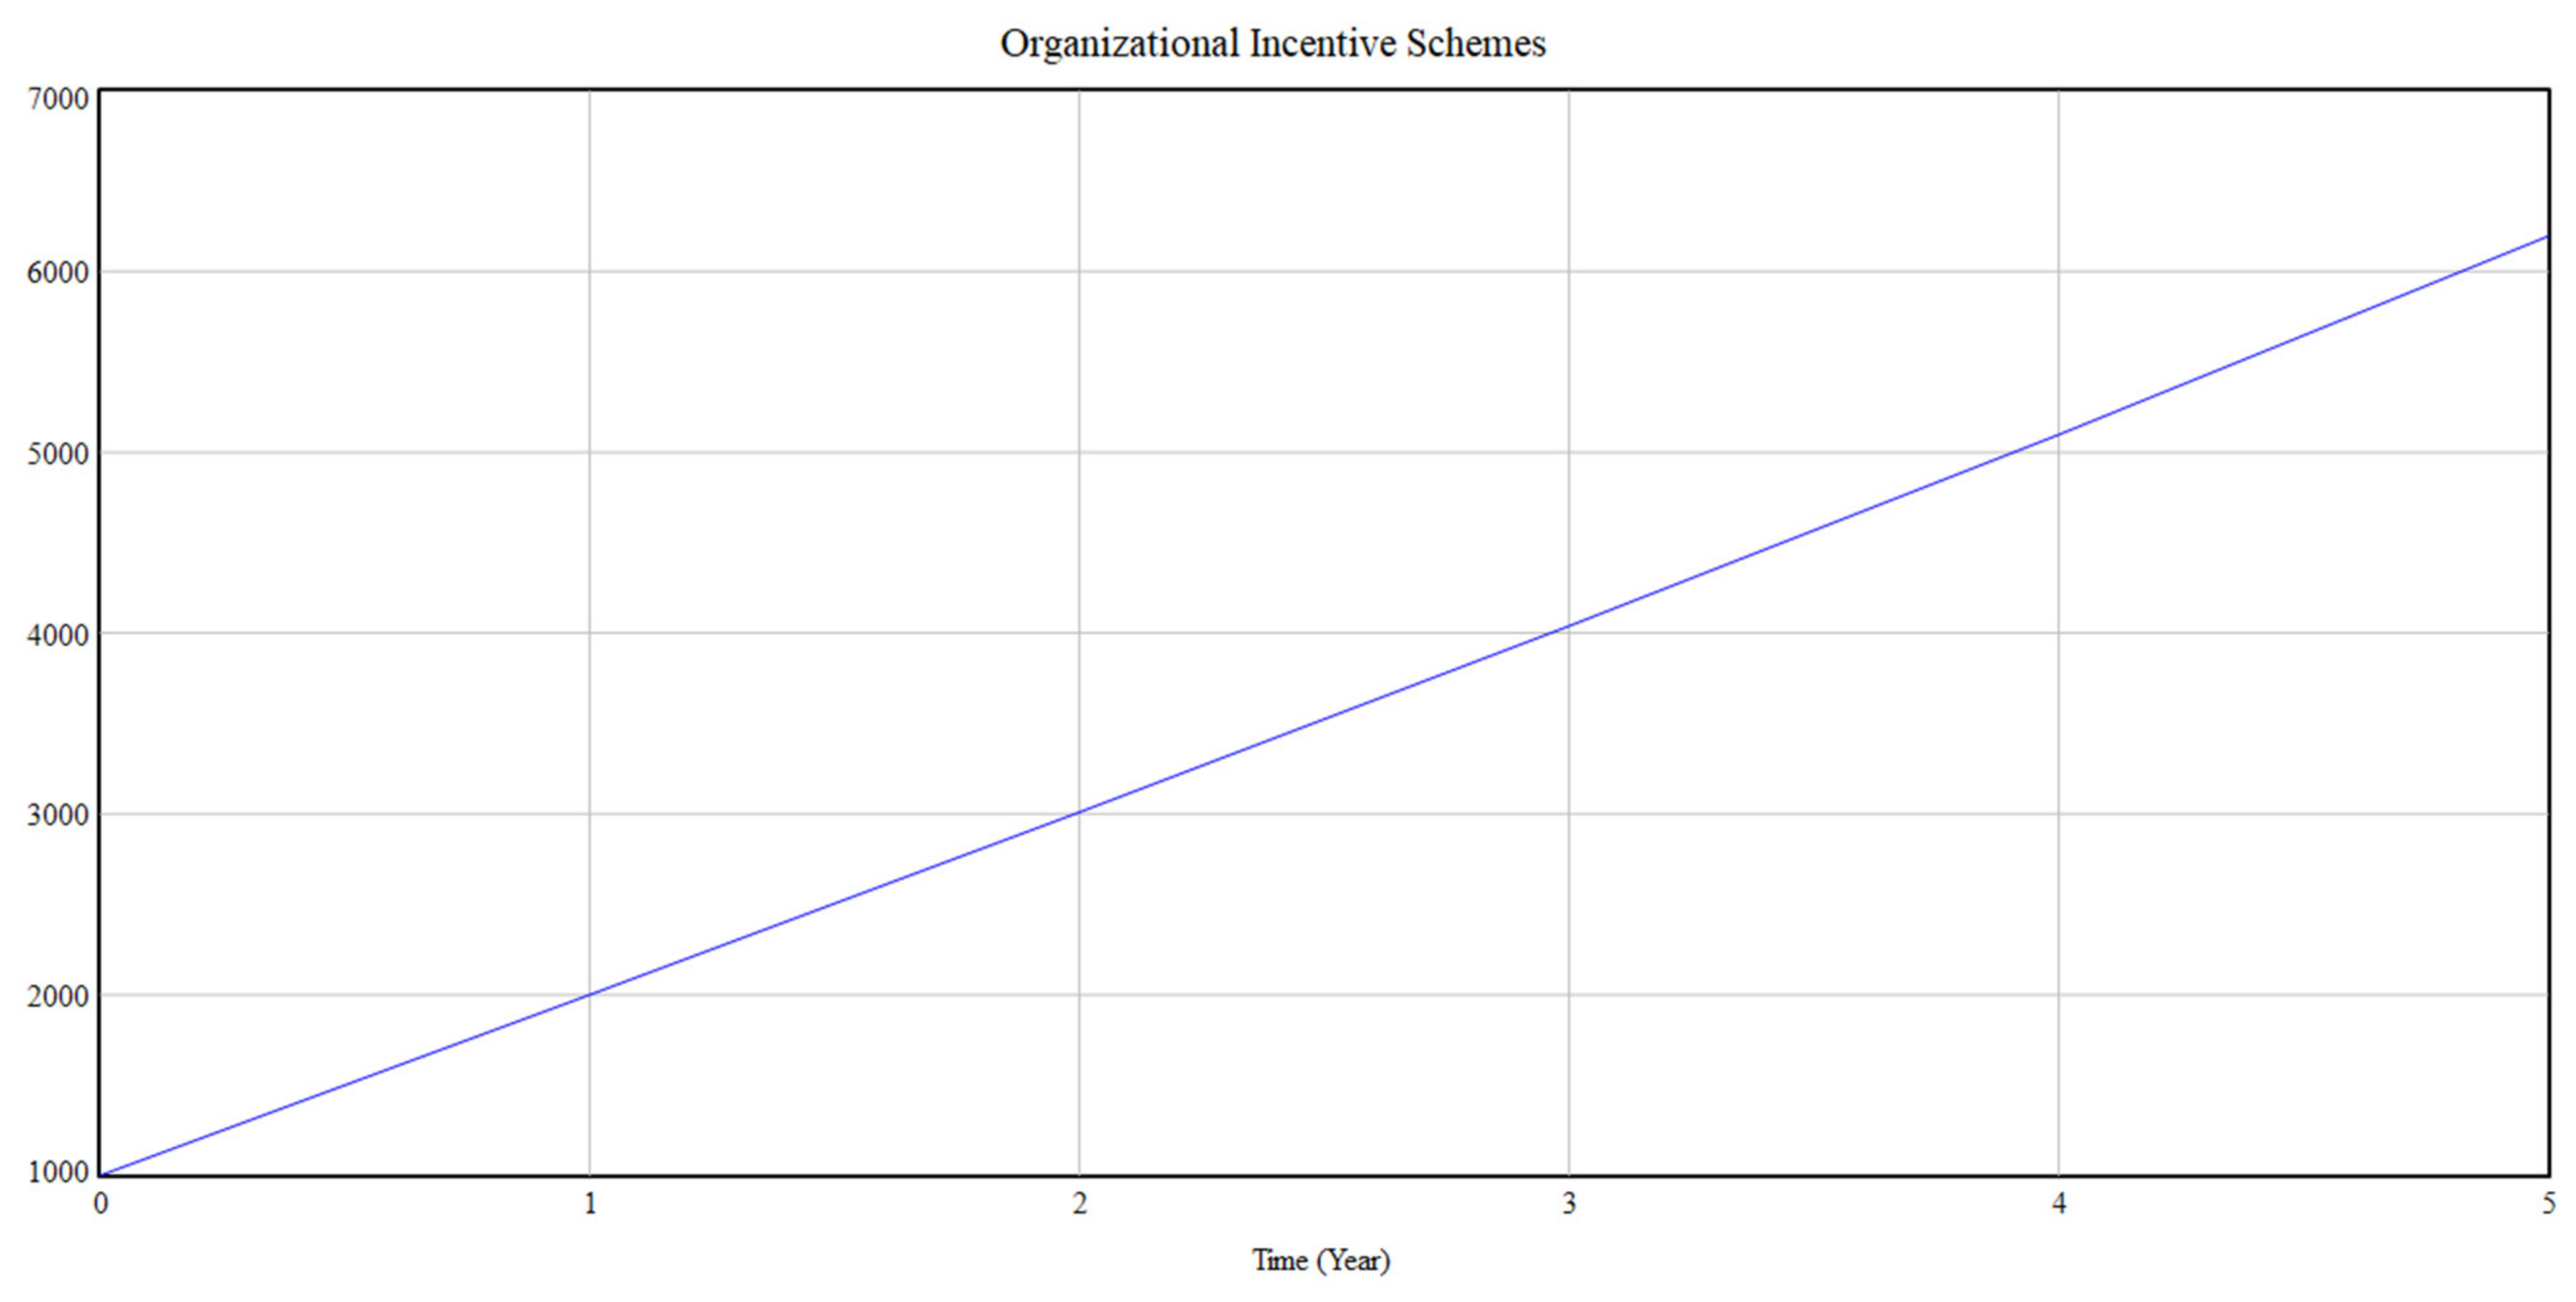
| 4 | Organizational incentive schemes | 0.0999 | [1,23,38,58,86,93,94] |
| 5 | Innovative and smart technologies | 0.0856 | [1,38,86,89,93,95] |
| 6 | Awareness through workshops and education programs | 0.0713 | [3,38,46,92,98,99] |
| 7 | Policy support | 0.0642 | [46,93,96,100,101,102] |
| 8 | Resource durability | 0.0342 | [23,85,91,93,94,103,104] |
| 9 | Collaboration among different parties | 0.0342 | [23,58,87,89,94,97,98,105] |
| 10 | Political priority | 0.0285 | [90,99,100,102] |
| 11 | Material circularity | 0.0285 | [86,99,100] |
| 12 | Management support | 0.0257 | [23,87,93,96] |
| 13 | Social recognition | 0.0214 | [58,85,87,100,106] |
| 14 | Supportive infrastructure to facilitate reuse | 0.0214 | [96,97,98] |
| 15 | Accessibility to transparent data | 0.0171 | [3,58,96,100] |
| 16 | Transparency of supply chain | 0.0171 | [86,93,94,107] |
| 17 | Flexible decision making | 0.0171 | [1,94,95,97] |
| 18 | Consumer demand | 0.0128 | [86,92,101,106] |
| 19 | Organizational big data management | 0.0128 | [91] |
| 20 | Organization culture | 0.0086 | [85,86,93,100,101,106] |
| 21 | Risk reduction through tax levies | 0.0086 | [86] |
| 22 | Team commitment | 0.0086 | [86,101] |
| 23 | Training and education | 0.0086 | [86,95] |
| 24 | Regulations and standards | 0.0086 | [38,102] |
| 25 | Digitalization (Virtualization) | 0.0057 | [93,102,103,105] |
| 26 | Consumer behavior | 0.0043 | [58,86,91,101] |
| 27 | Leadership | 0.0043 | [58,100,102] |
| 28 | Supportive vision | 0.0043 | [86,97,98] |
| 29 | Development of skills and capabilities | 0.0043 | [94,99,102] |
| 30 | Legislation | 0.0043 | [23,58,86] |
| 31 | Stakeholders’ early involvement | 0.0029 | [86,103] |
| Profile | Frequency | Percentage |
|---|---|---|
| Total responses = 108 | ||
| Job title | ||
| Construction Manager | 17 | 16% |
| Assistant Manager | 14 | 13% |
| Project Director | 10 | 9% |
| Project Manager | 23 | 21% |
| Architect/Designer | 14 | 13% |
| Planning Engineer | 18 | 17% |
| Academician | 12 | 11% |
| Professional Experience (Years) | ||
| 0–1 | 2 | 1% |
| 2–5 | 25 | 23% |
| 6–10 | 29 | 27% |
| 11–15 | 16 | 16% |
| 16–20 | 16 | 16% |
| >20 | 17 | 17% |
| Education | ||
| Graduation | 22 | 20% |
| Post-Graduation | 52 | 48% |
| PhD | 34 | 32% |
| Organization type | ||
| Government | 38 | 35% |
| Semi-Government | 16 | 15% |
| Private | 54 | 50% |
| Understanding of circular economy and sustainable development | ||
| Slight | 5 | 4% |
| Moderate | 23 | 21% |
| High | 32 | 31% |
| Exceptional | 48 | 44% |
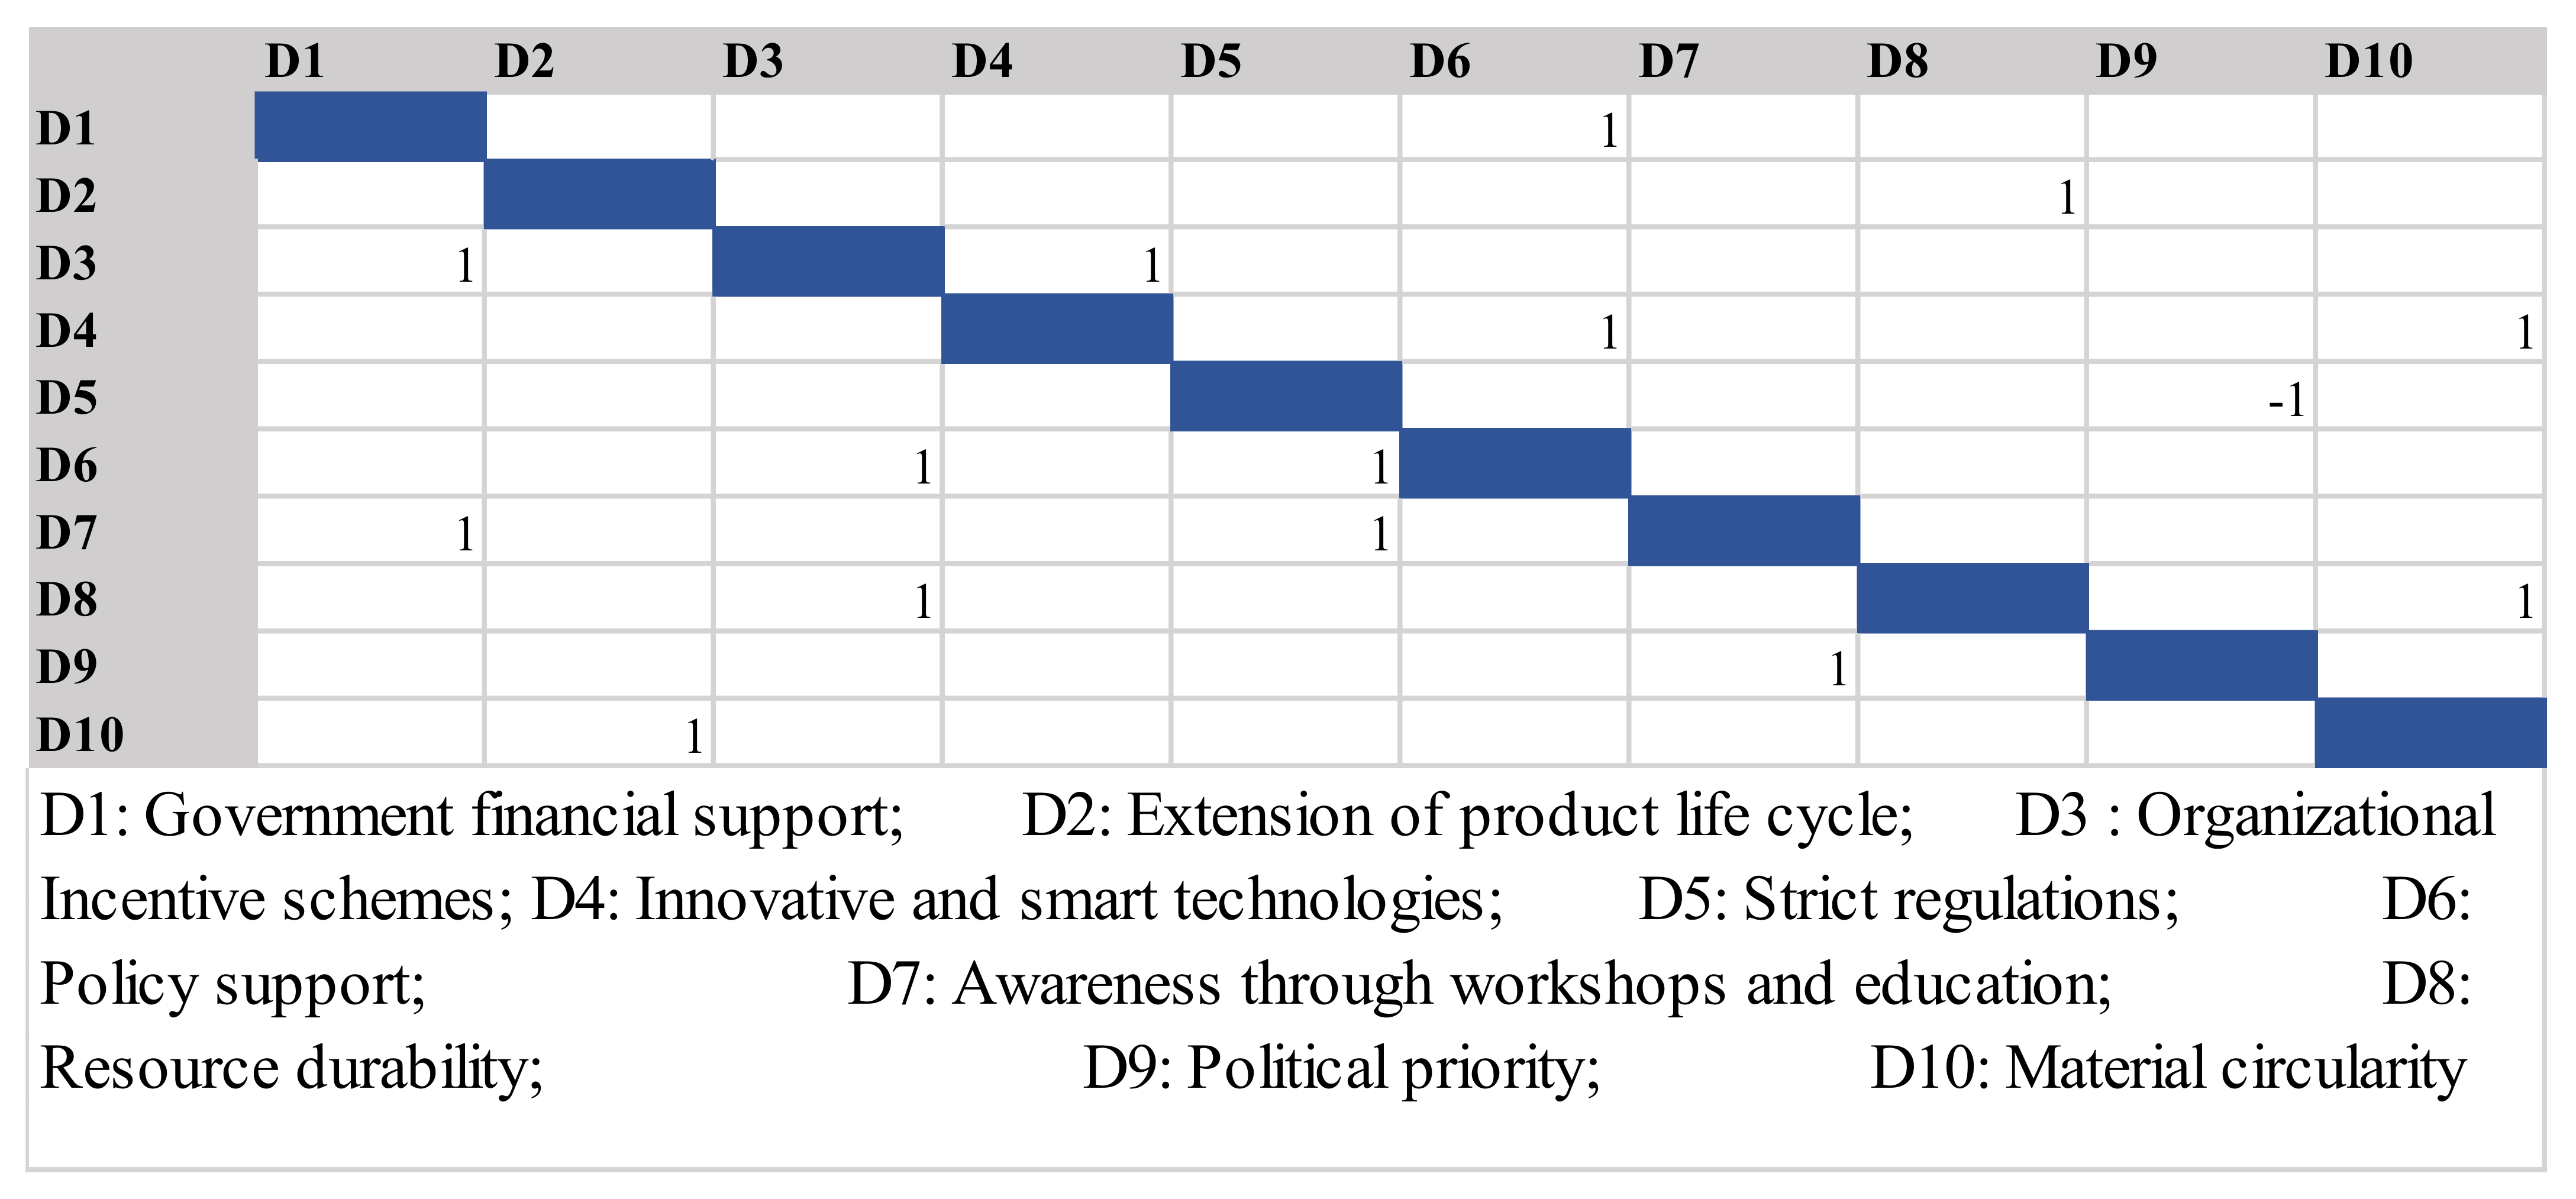
| Sr. No | Enablers | Description | 60R/40L | Cumulative Score |
|---|---|---|---|---|
| 1 | Government financial support | Financial assistance from the government agency | 0.074 | 0.074 |
| 2 | Extension of product life cycle | Increasing the life of the product using reduce, reuse, and recycle approach | 0.068 | 0.141 |
| 3 | Organizational incentive schemes | An arrangement under which a company makes extra payments to employees to reward good performance other than financial. | 0.060 | 0.201 |
| 4 | Innovative and smart technologies | Use of technology to provide cognitive awareness | 0.059 | 0.260 |
| 5 | Strict regulations | Rigid and precise rules to be obeyed completely | 0.053 | 0.313 |
| 6 | Policy support | The support from the government available to the organization for the transition toward the circular economy | 0.051 | 0.364 |
| 7 | Awareness through workshops and education programs | Programs designed to teach practical skills, techniques, or ideas | 0.044 | 0.407 |
| 8 | Resource durability | Long-lasting resources/environmentally friendly materials | 0.034 | 0.441 |
| 9 | Political priority | The degree to which political parties pay attention to an issue | 0.031 | 0.473 |
| 10 | Material circularity | State of materials being in the loop to ensure uninterrupted supply | 0.031 | 0.504 |
| Loop | Speed of Influence | Strength of Influence | Nature of Influence |
|---|---|---|---|
| R1 | Slow | Strong | Reinforcing |
| R2 | Slow | Strong | Reinforcing |
| R3 | Slow | Strong | Reinforcing |
| R4 | Slow | Strong | Reinforcing |
| R5 | Slow | Strong | Reinforcing |
| B1 | Fast | Strong | Balancing |
Publisher’s Note: MDPI stays neutral with regard to jurisdictional claims in published maps and institutional affiliations. |
© 2022 by the authors. Licensee MDPI, Basel, Switzerland. This article is an open access article distributed under the terms and conditions of the Creative Commons Attribution (CC BY) license (https://creativecommons.org/licenses/by/4.0/).
Share and Cite
Ghufran, M.; Khan, K.I.A.; Ullah, F.; Nasir, A.R.; Al Alahmadi, A.A.; Alzaed, A.N.; Alwetaishi, M. Circular Economy in the Construction Industry: A Step towards Sustainable Development. Buildings 2022, 12, 1004. https://doi.org/10.3390/buildings12071004
Ghufran M, Khan KIA, Ullah F, Nasir AR, Al Alahmadi AA, Alzaed AN, Alwetaishi M. Circular Economy in the Construction Industry: A Step towards Sustainable Development. Buildings. 2022; 12(7):1004. https://doi.org/10.3390/buildings12071004
Chicago/Turabian StyleGhufran, Maria, Khurram Iqbal Ahmad Khan, Fahim Ullah, Abdur Rehman Nasir, Ahmad Aziz Al Alahmadi, Ali Nasser Alzaed, and Mamdooh Alwetaishi. 2022. "Circular Economy in the Construction Industry: A Step towards Sustainable Development" Buildings 12, no. 7: 1004. https://doi.org/10.3390/buildings12071004