
Correlation Analysis of Thermal Comfort and Landscape Characteristics: A Case Study of the Coastal Greenway in Qingdao, China

 ,
,
Abstract
:1. Introduction
2. Methods
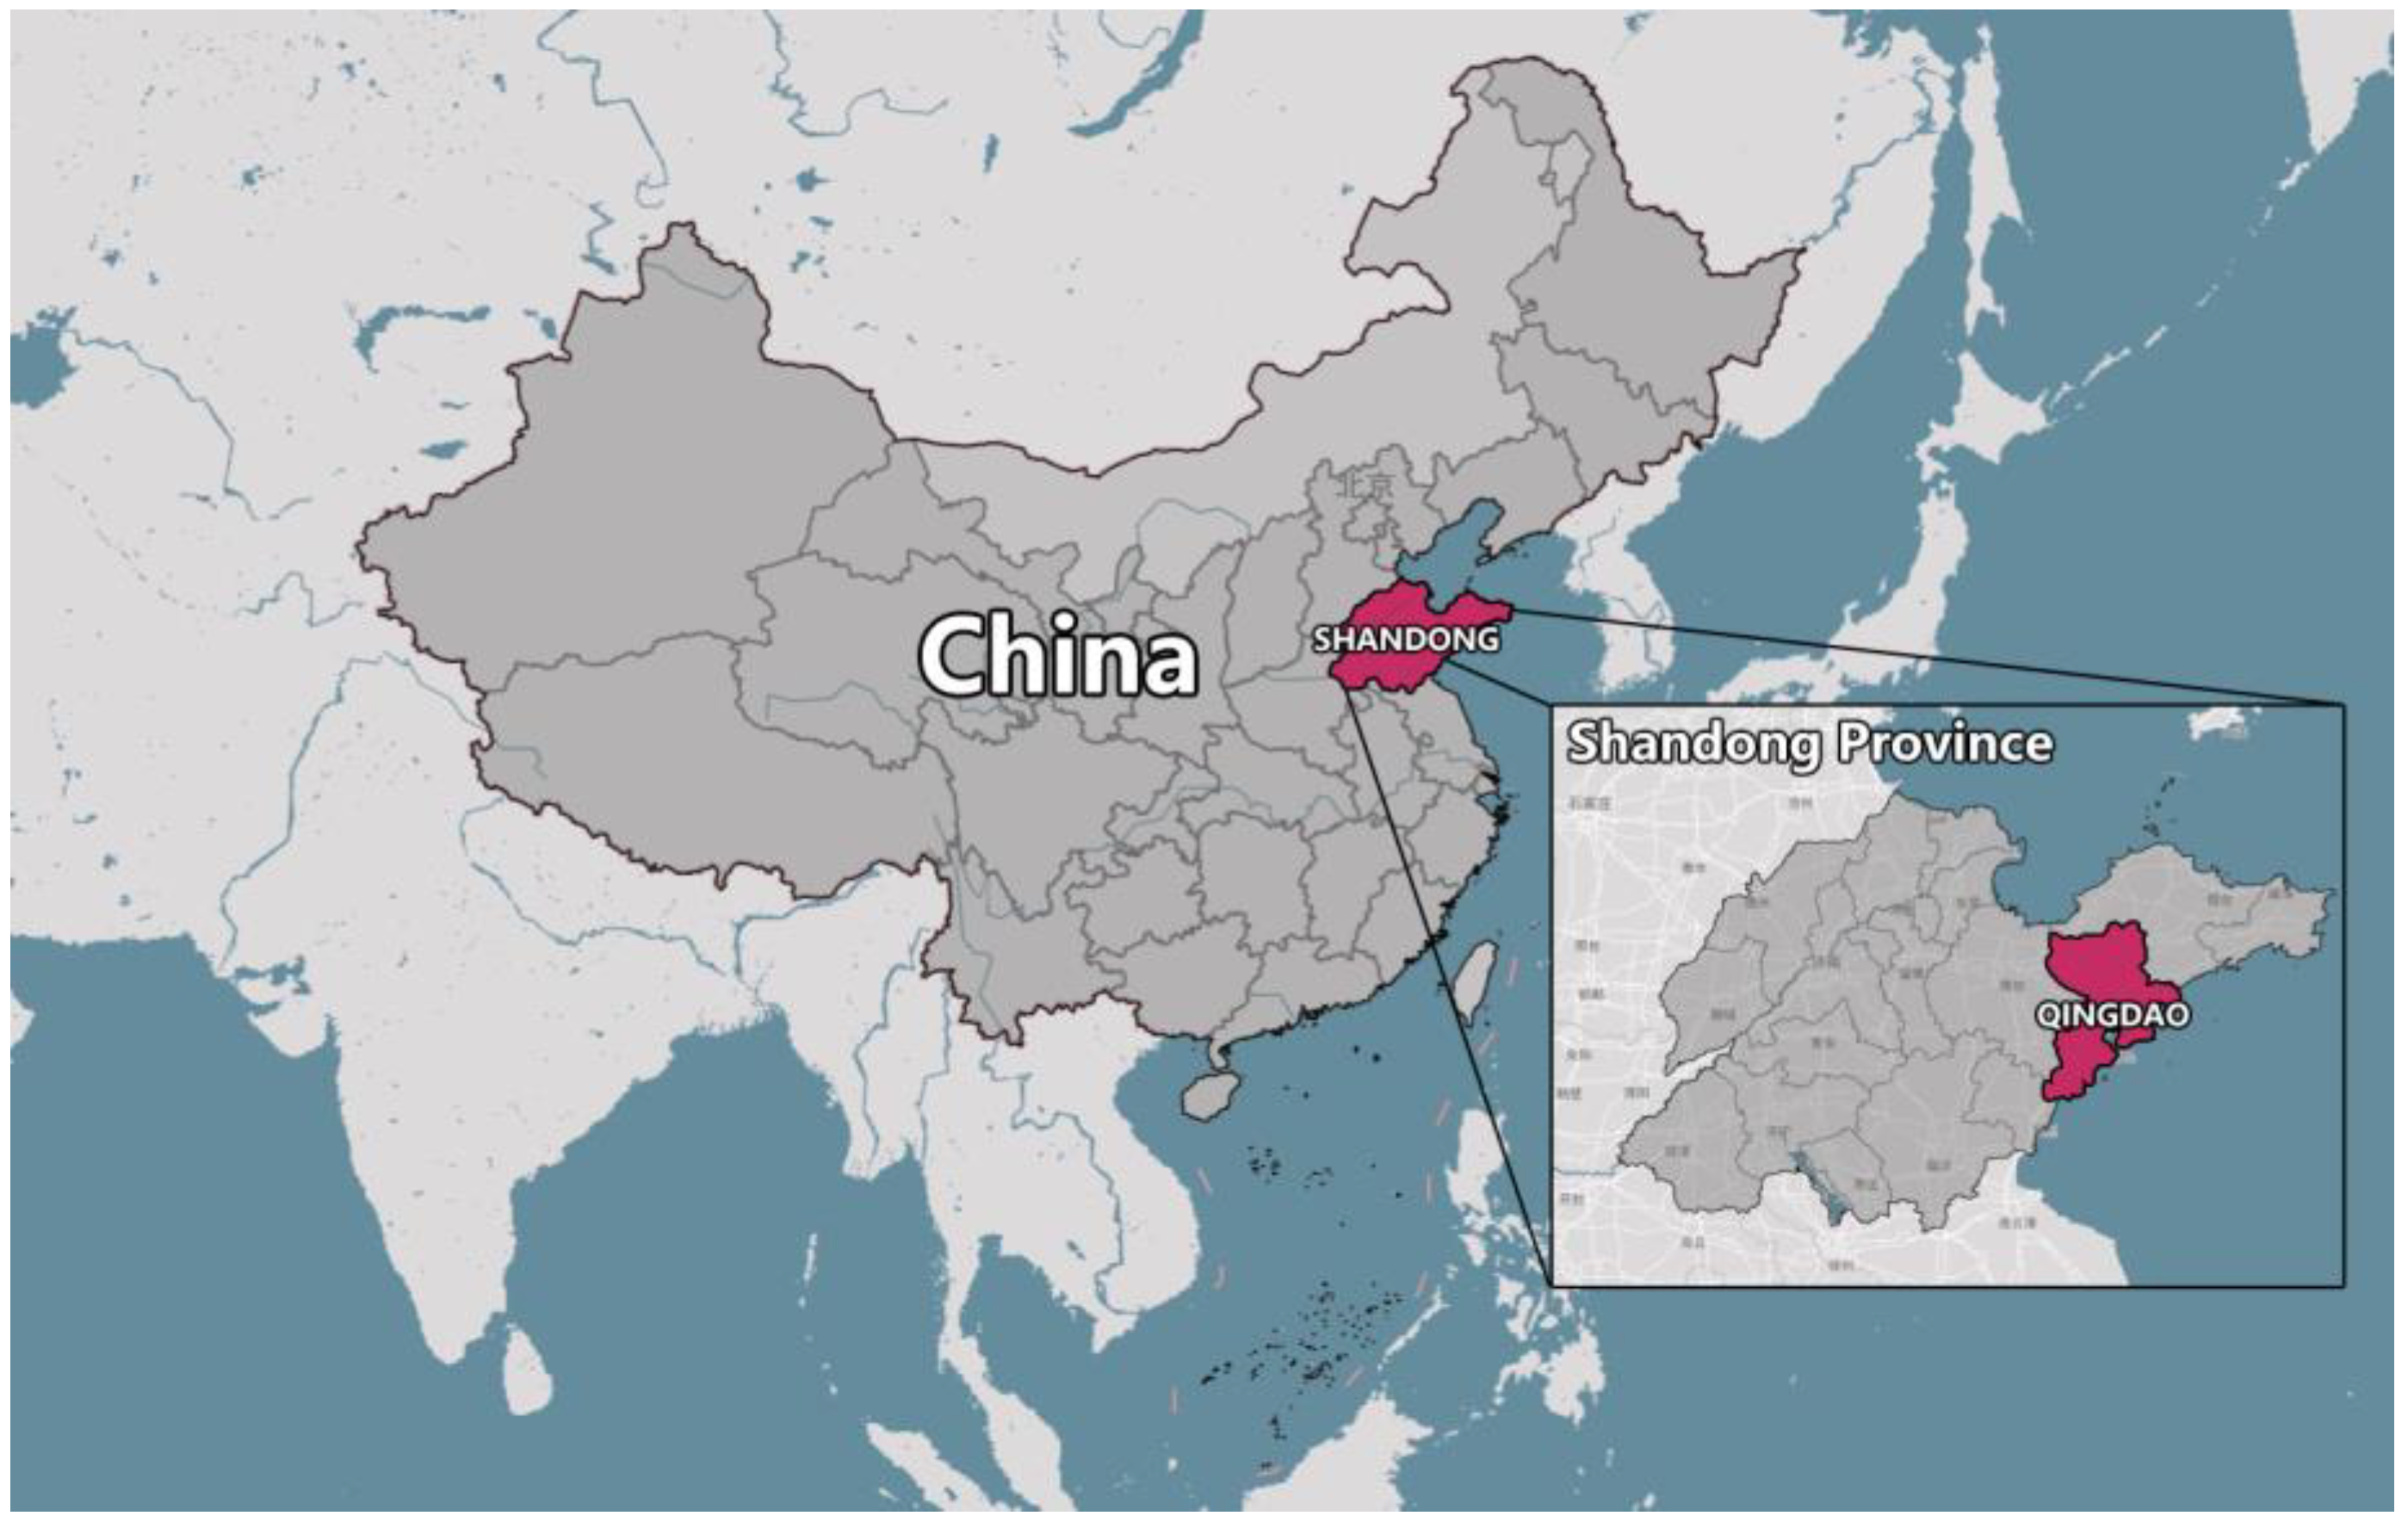
2.1. The Site
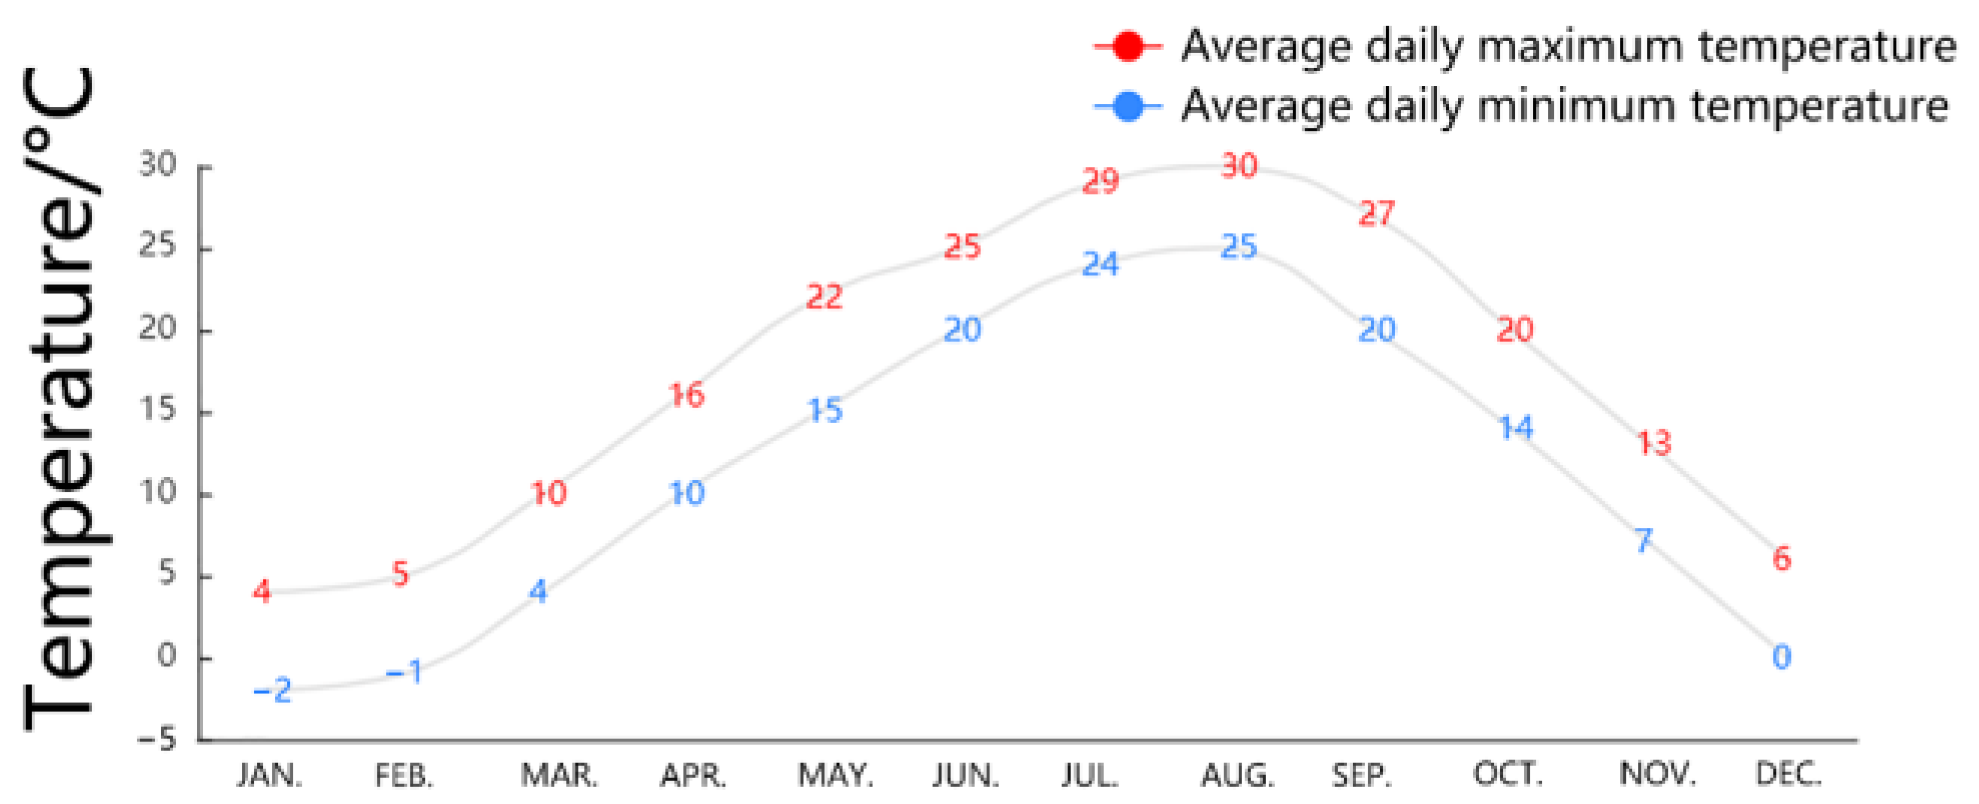
2.1.1. Climatic Background of the City
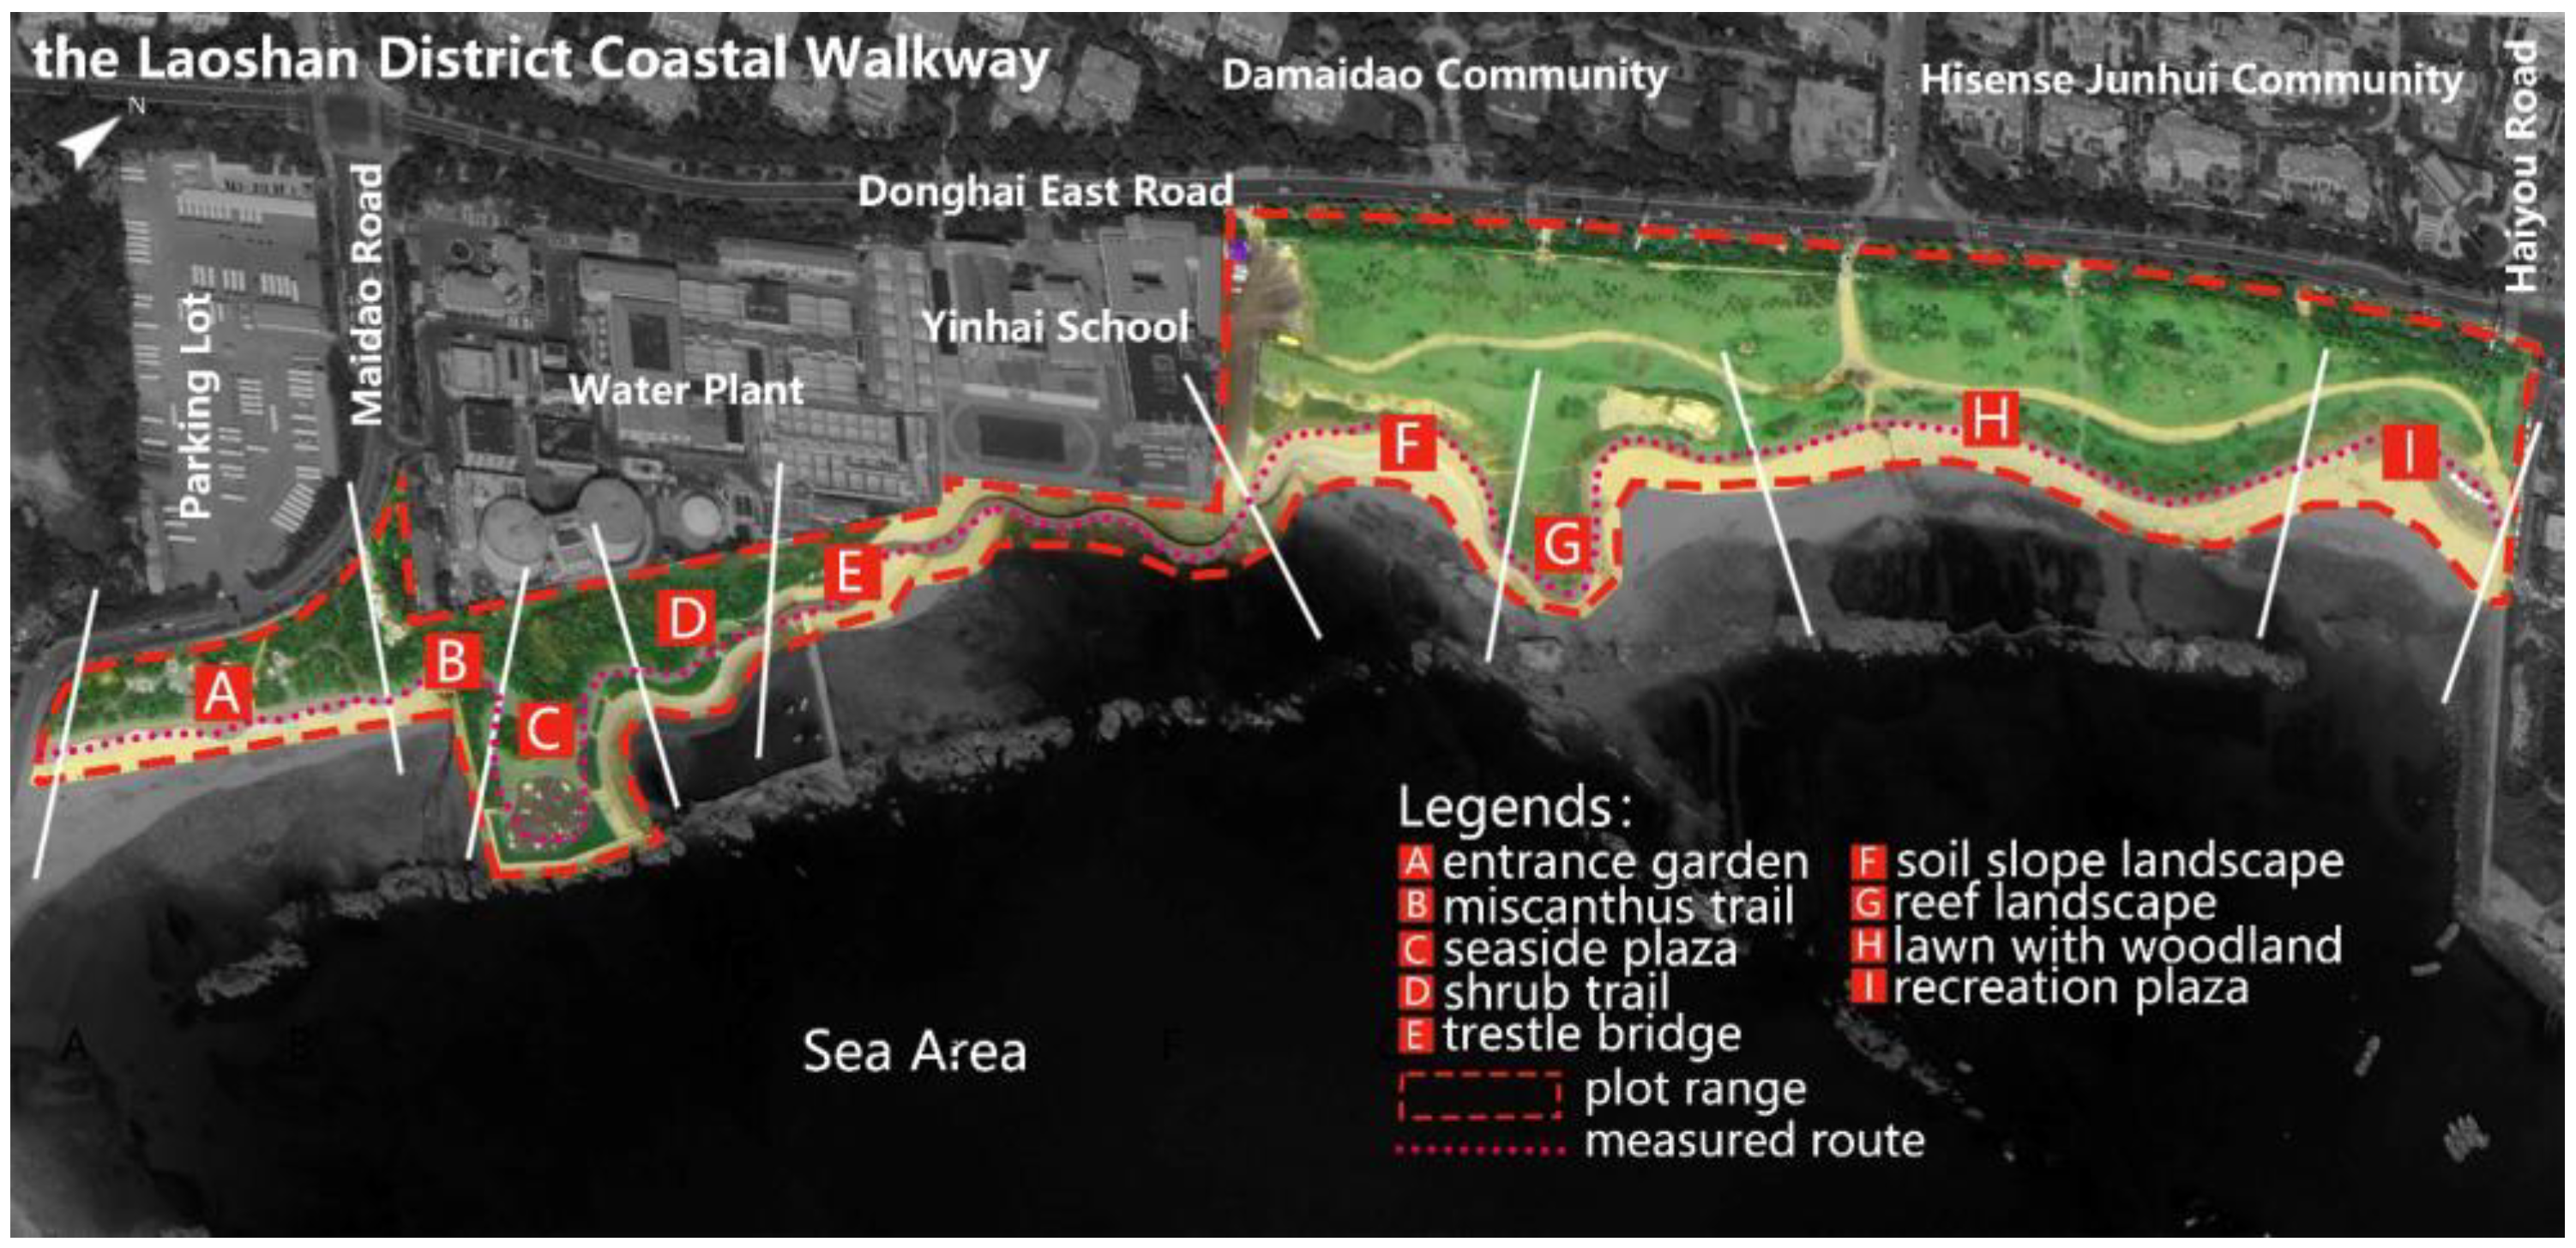
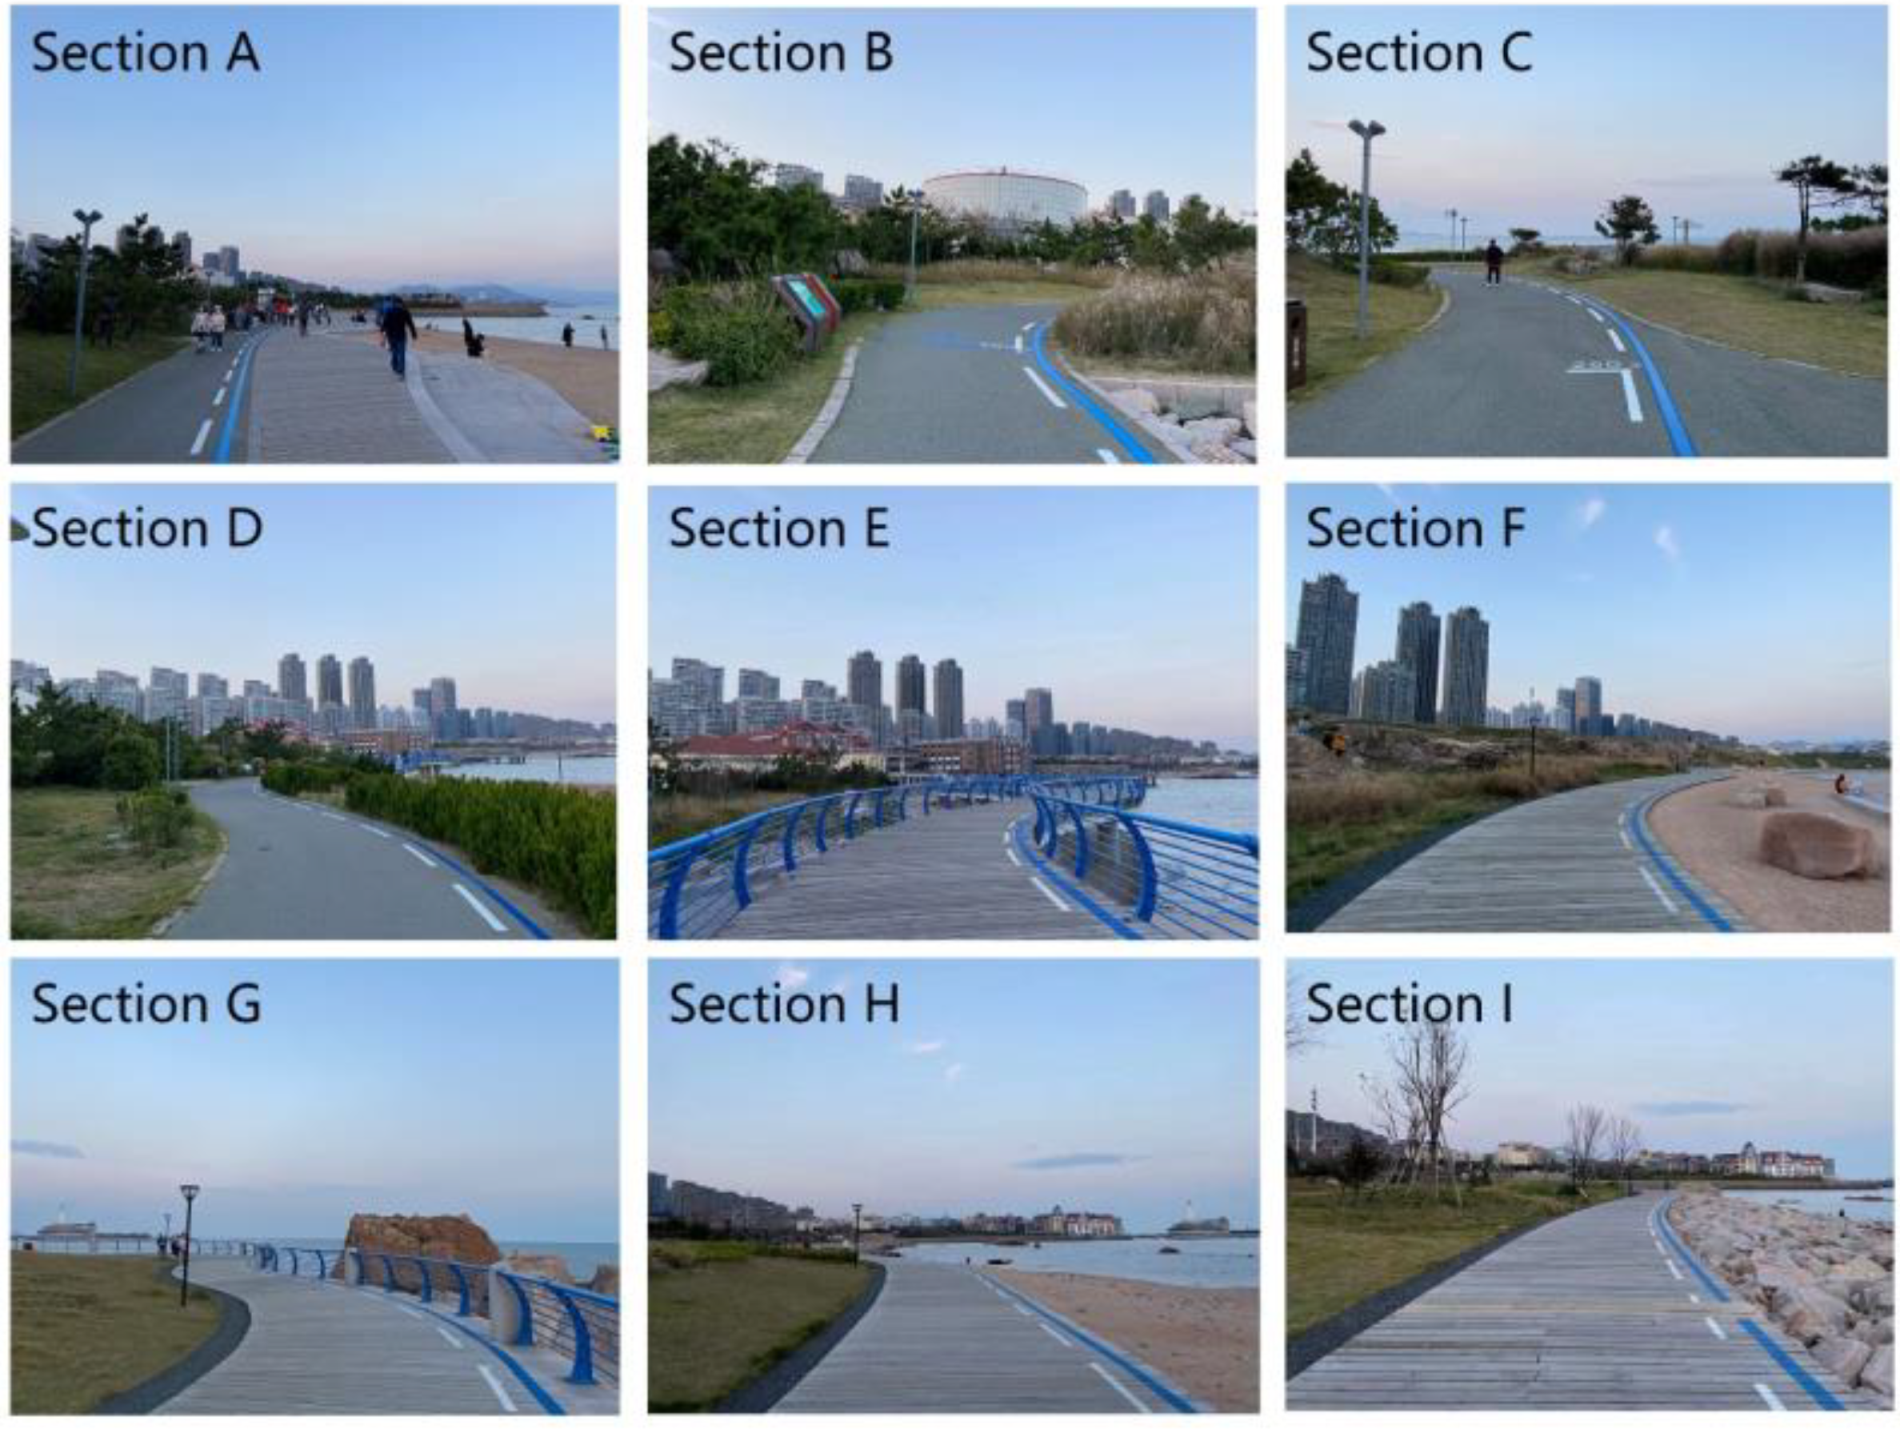
2.1.2. The Measured Site
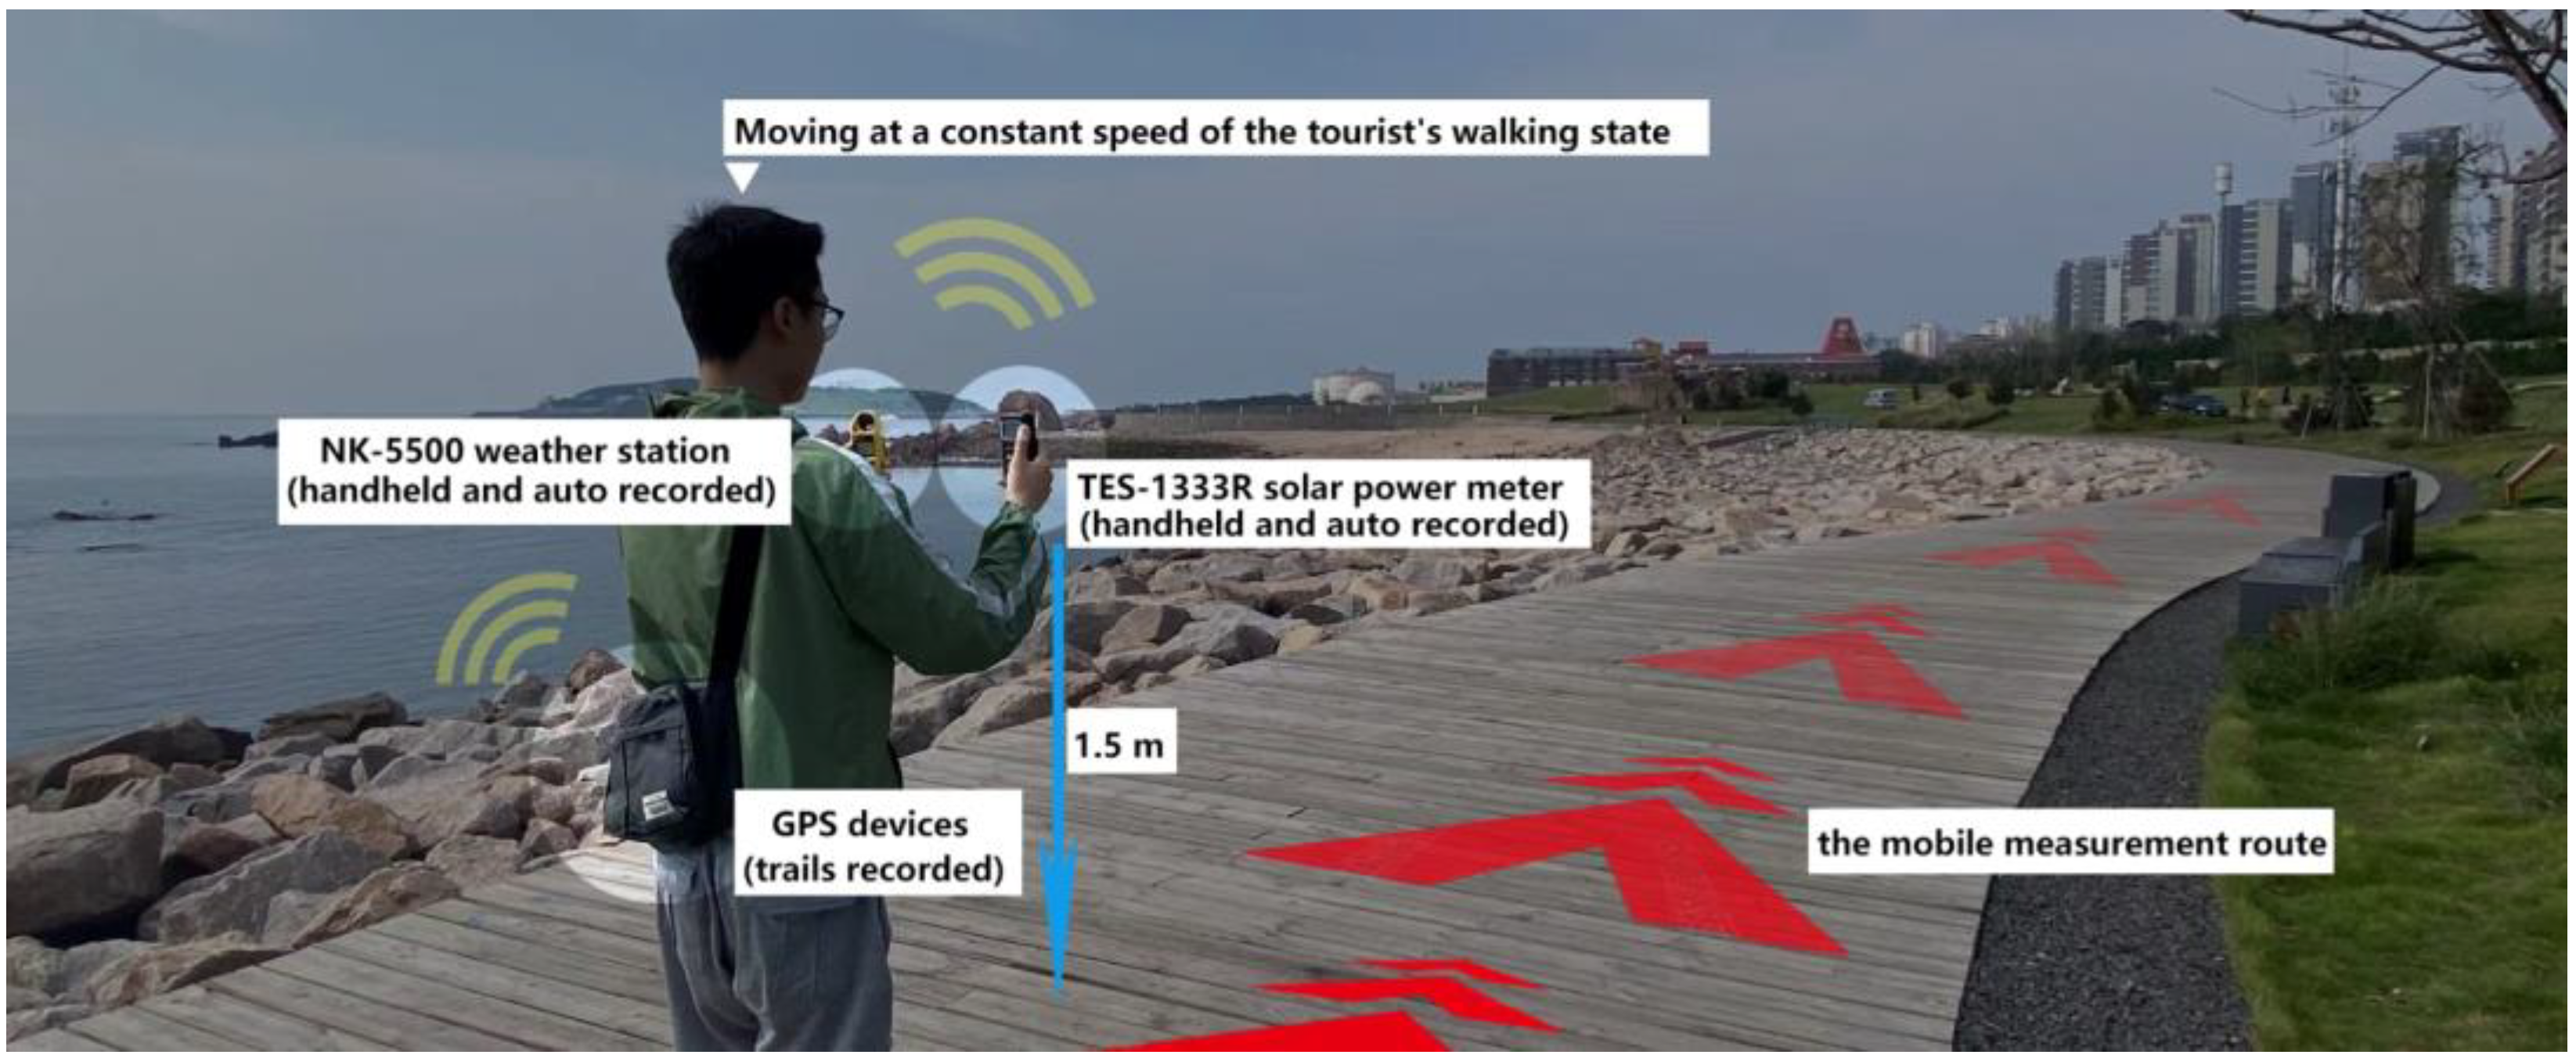
2.2. Microclimate Measurements
2.2.1. Date, Time, and Specific Methods of Measurement
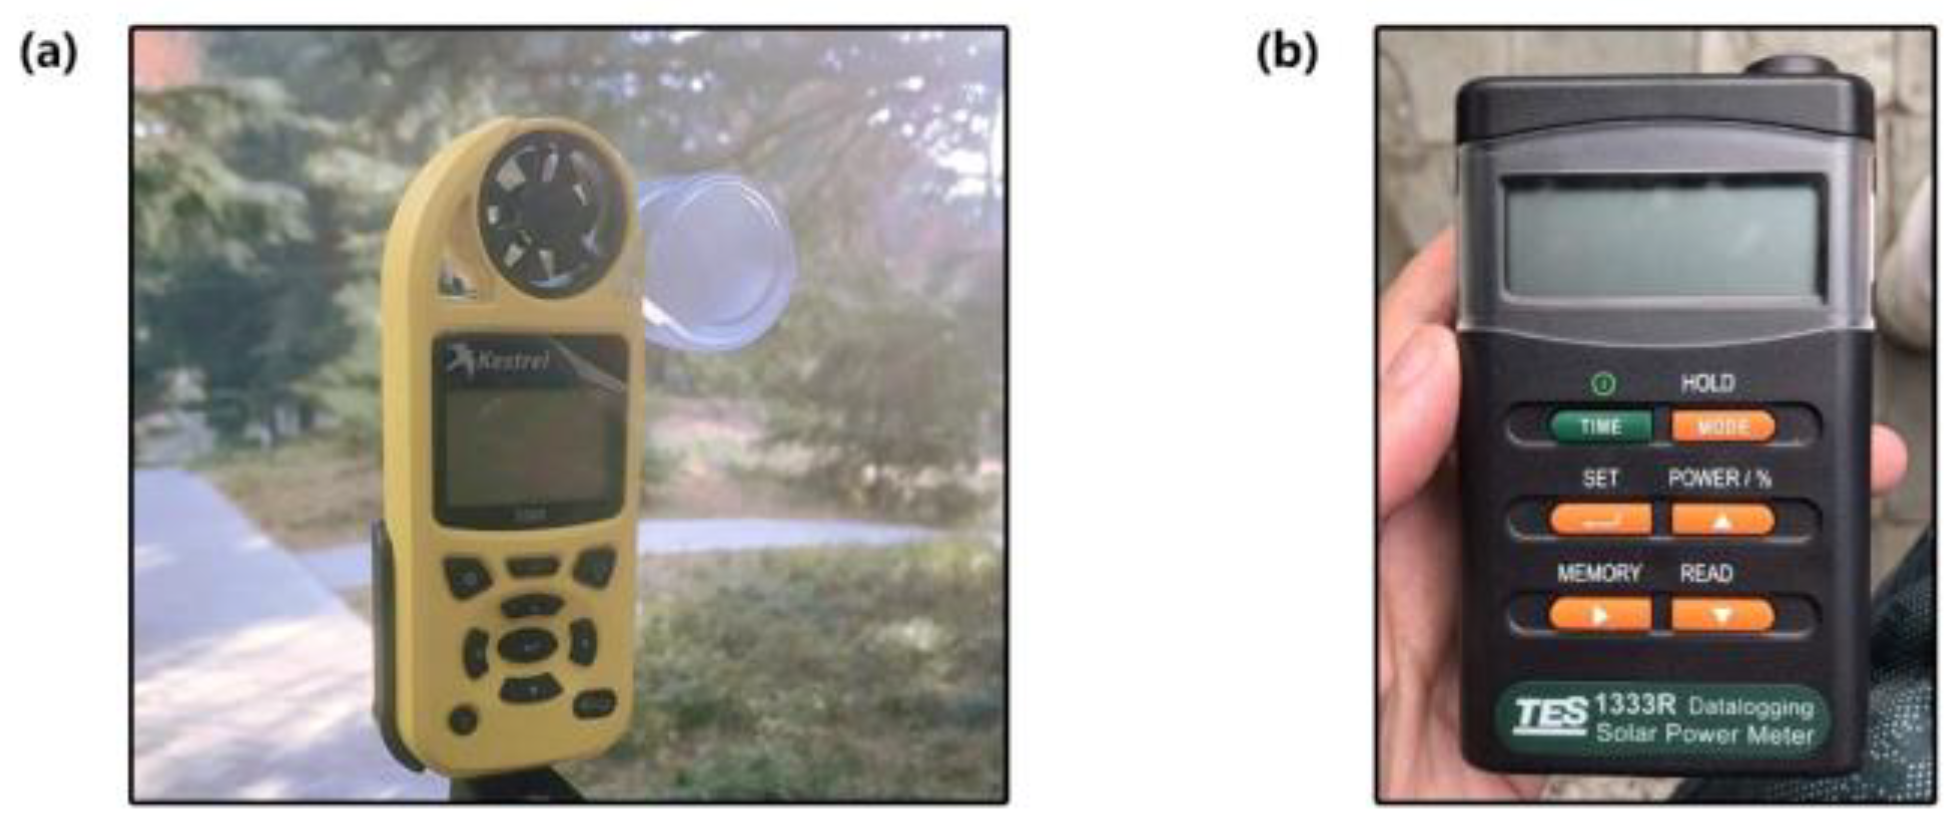
2.2.2. Measurement Equipment
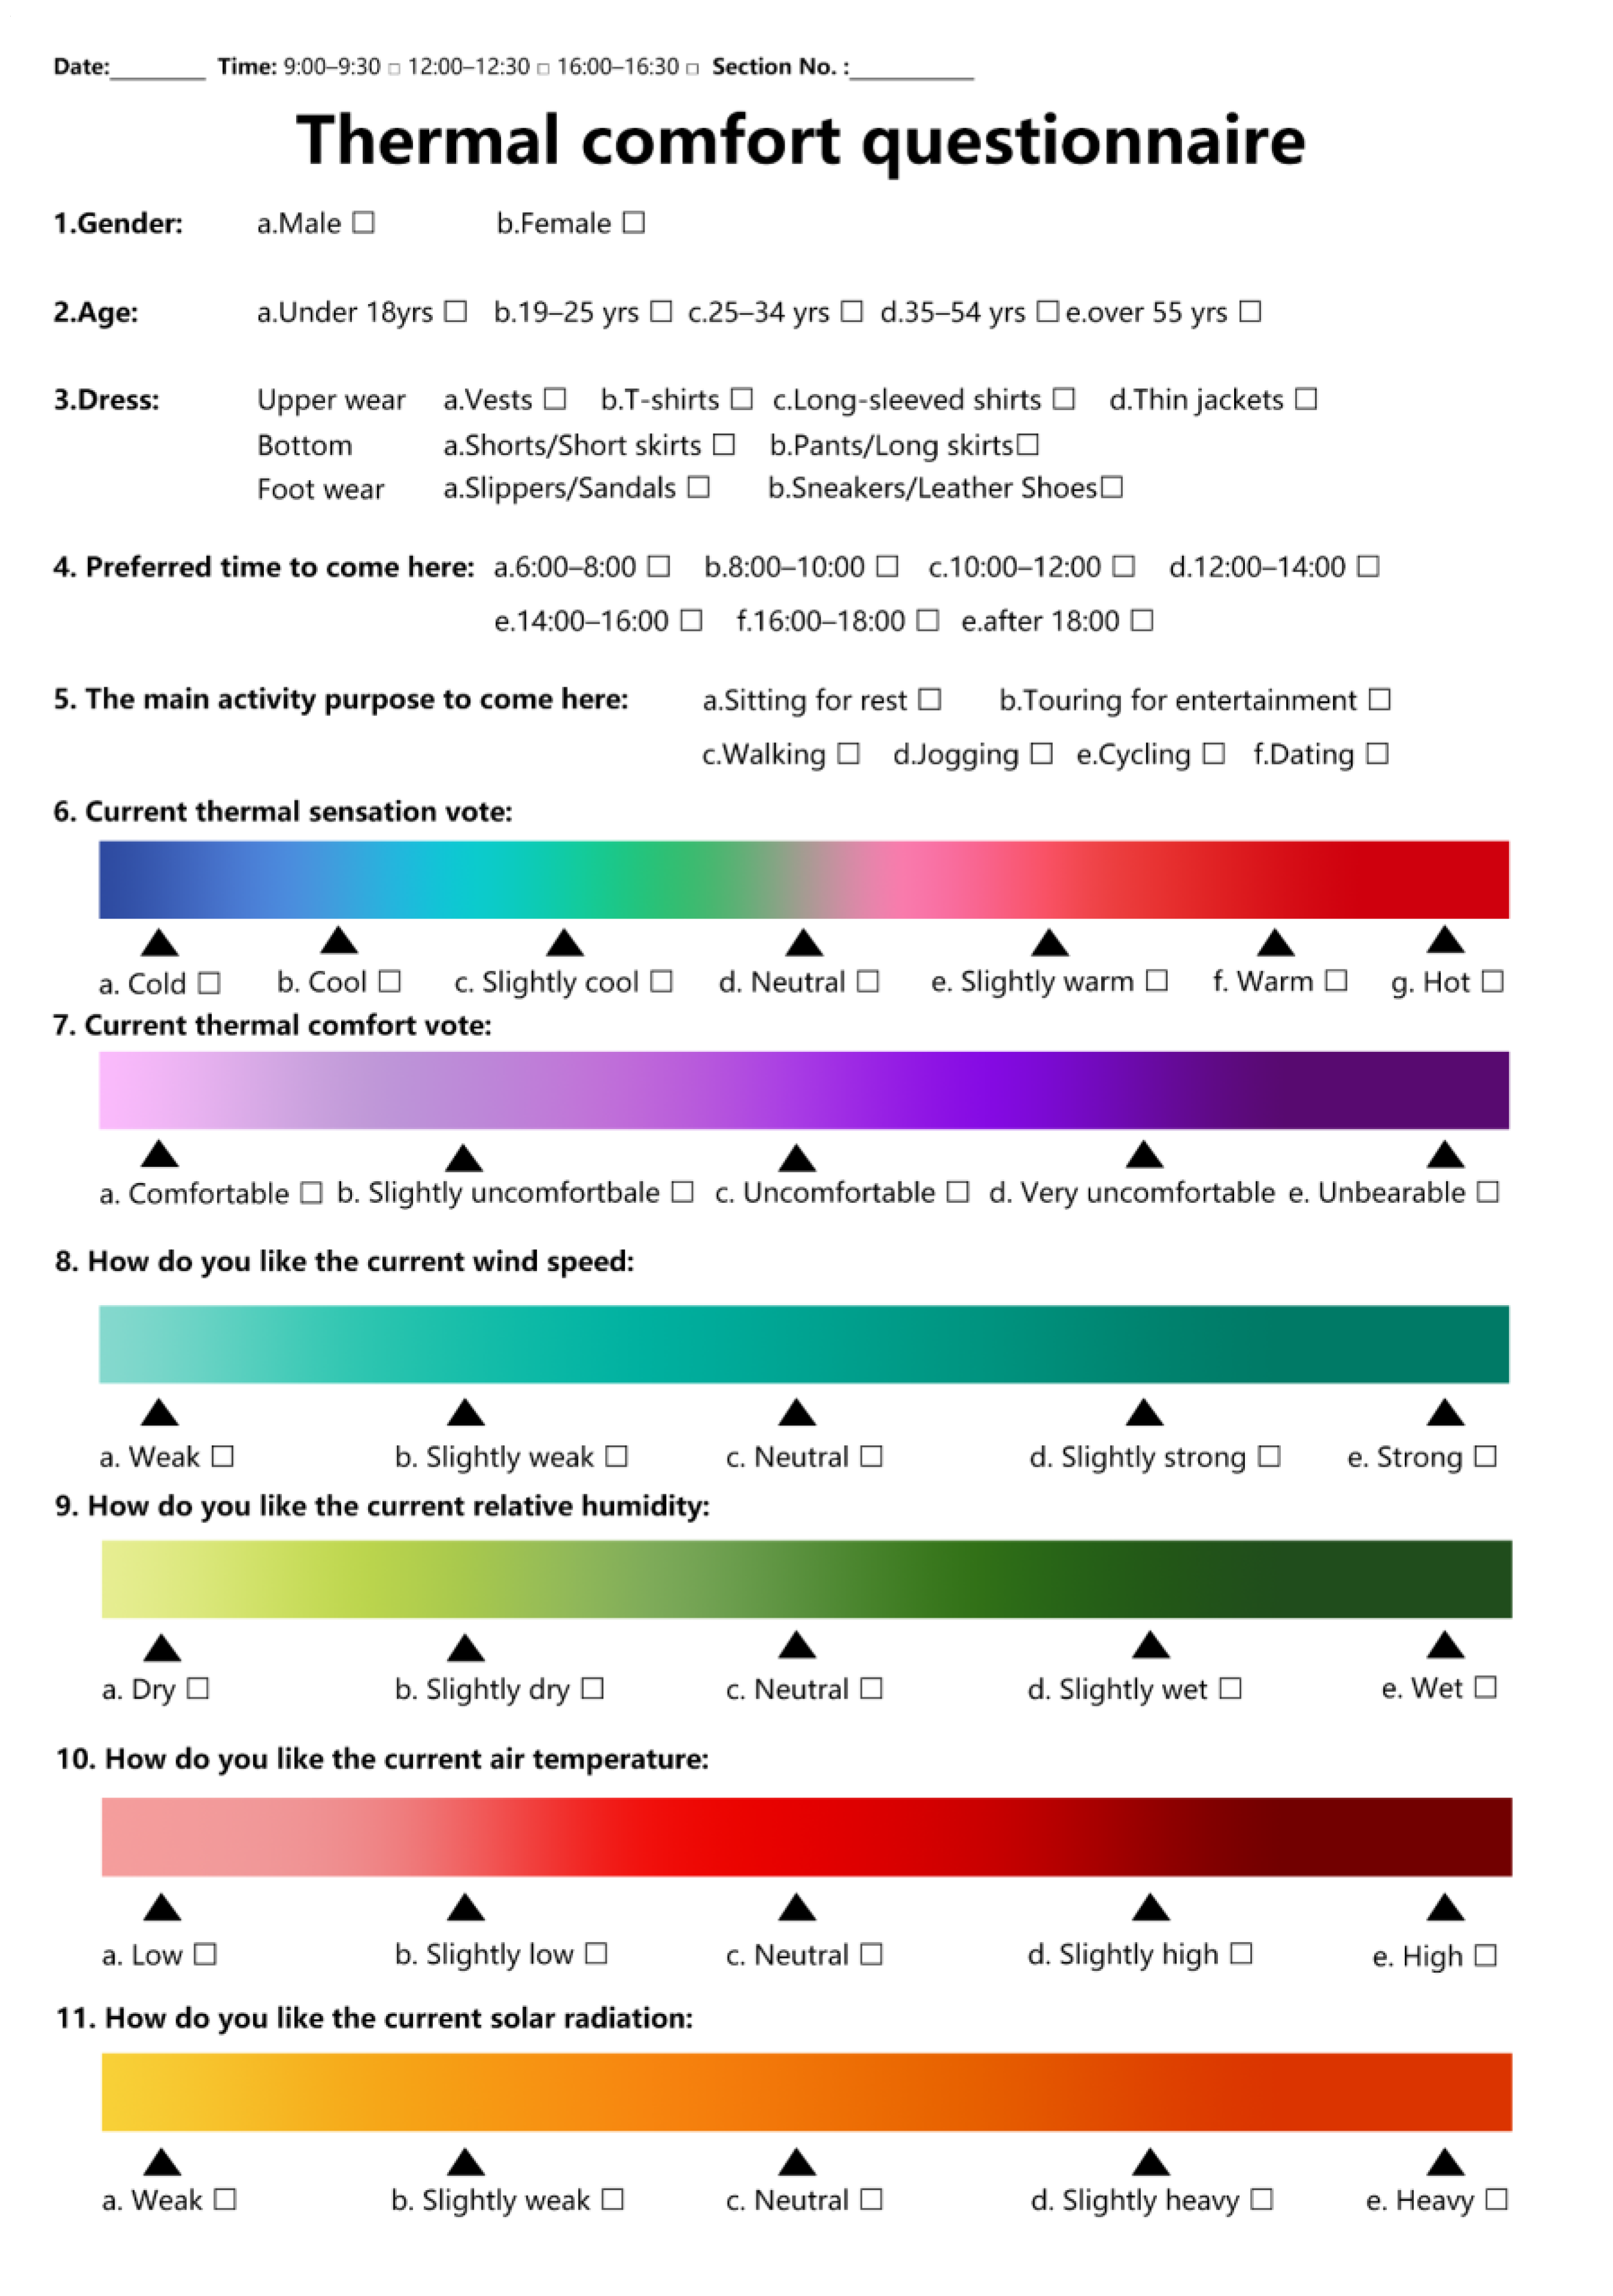
2.3. Questionnaire Survey
3. Results
3.1. Microclimate Analysis
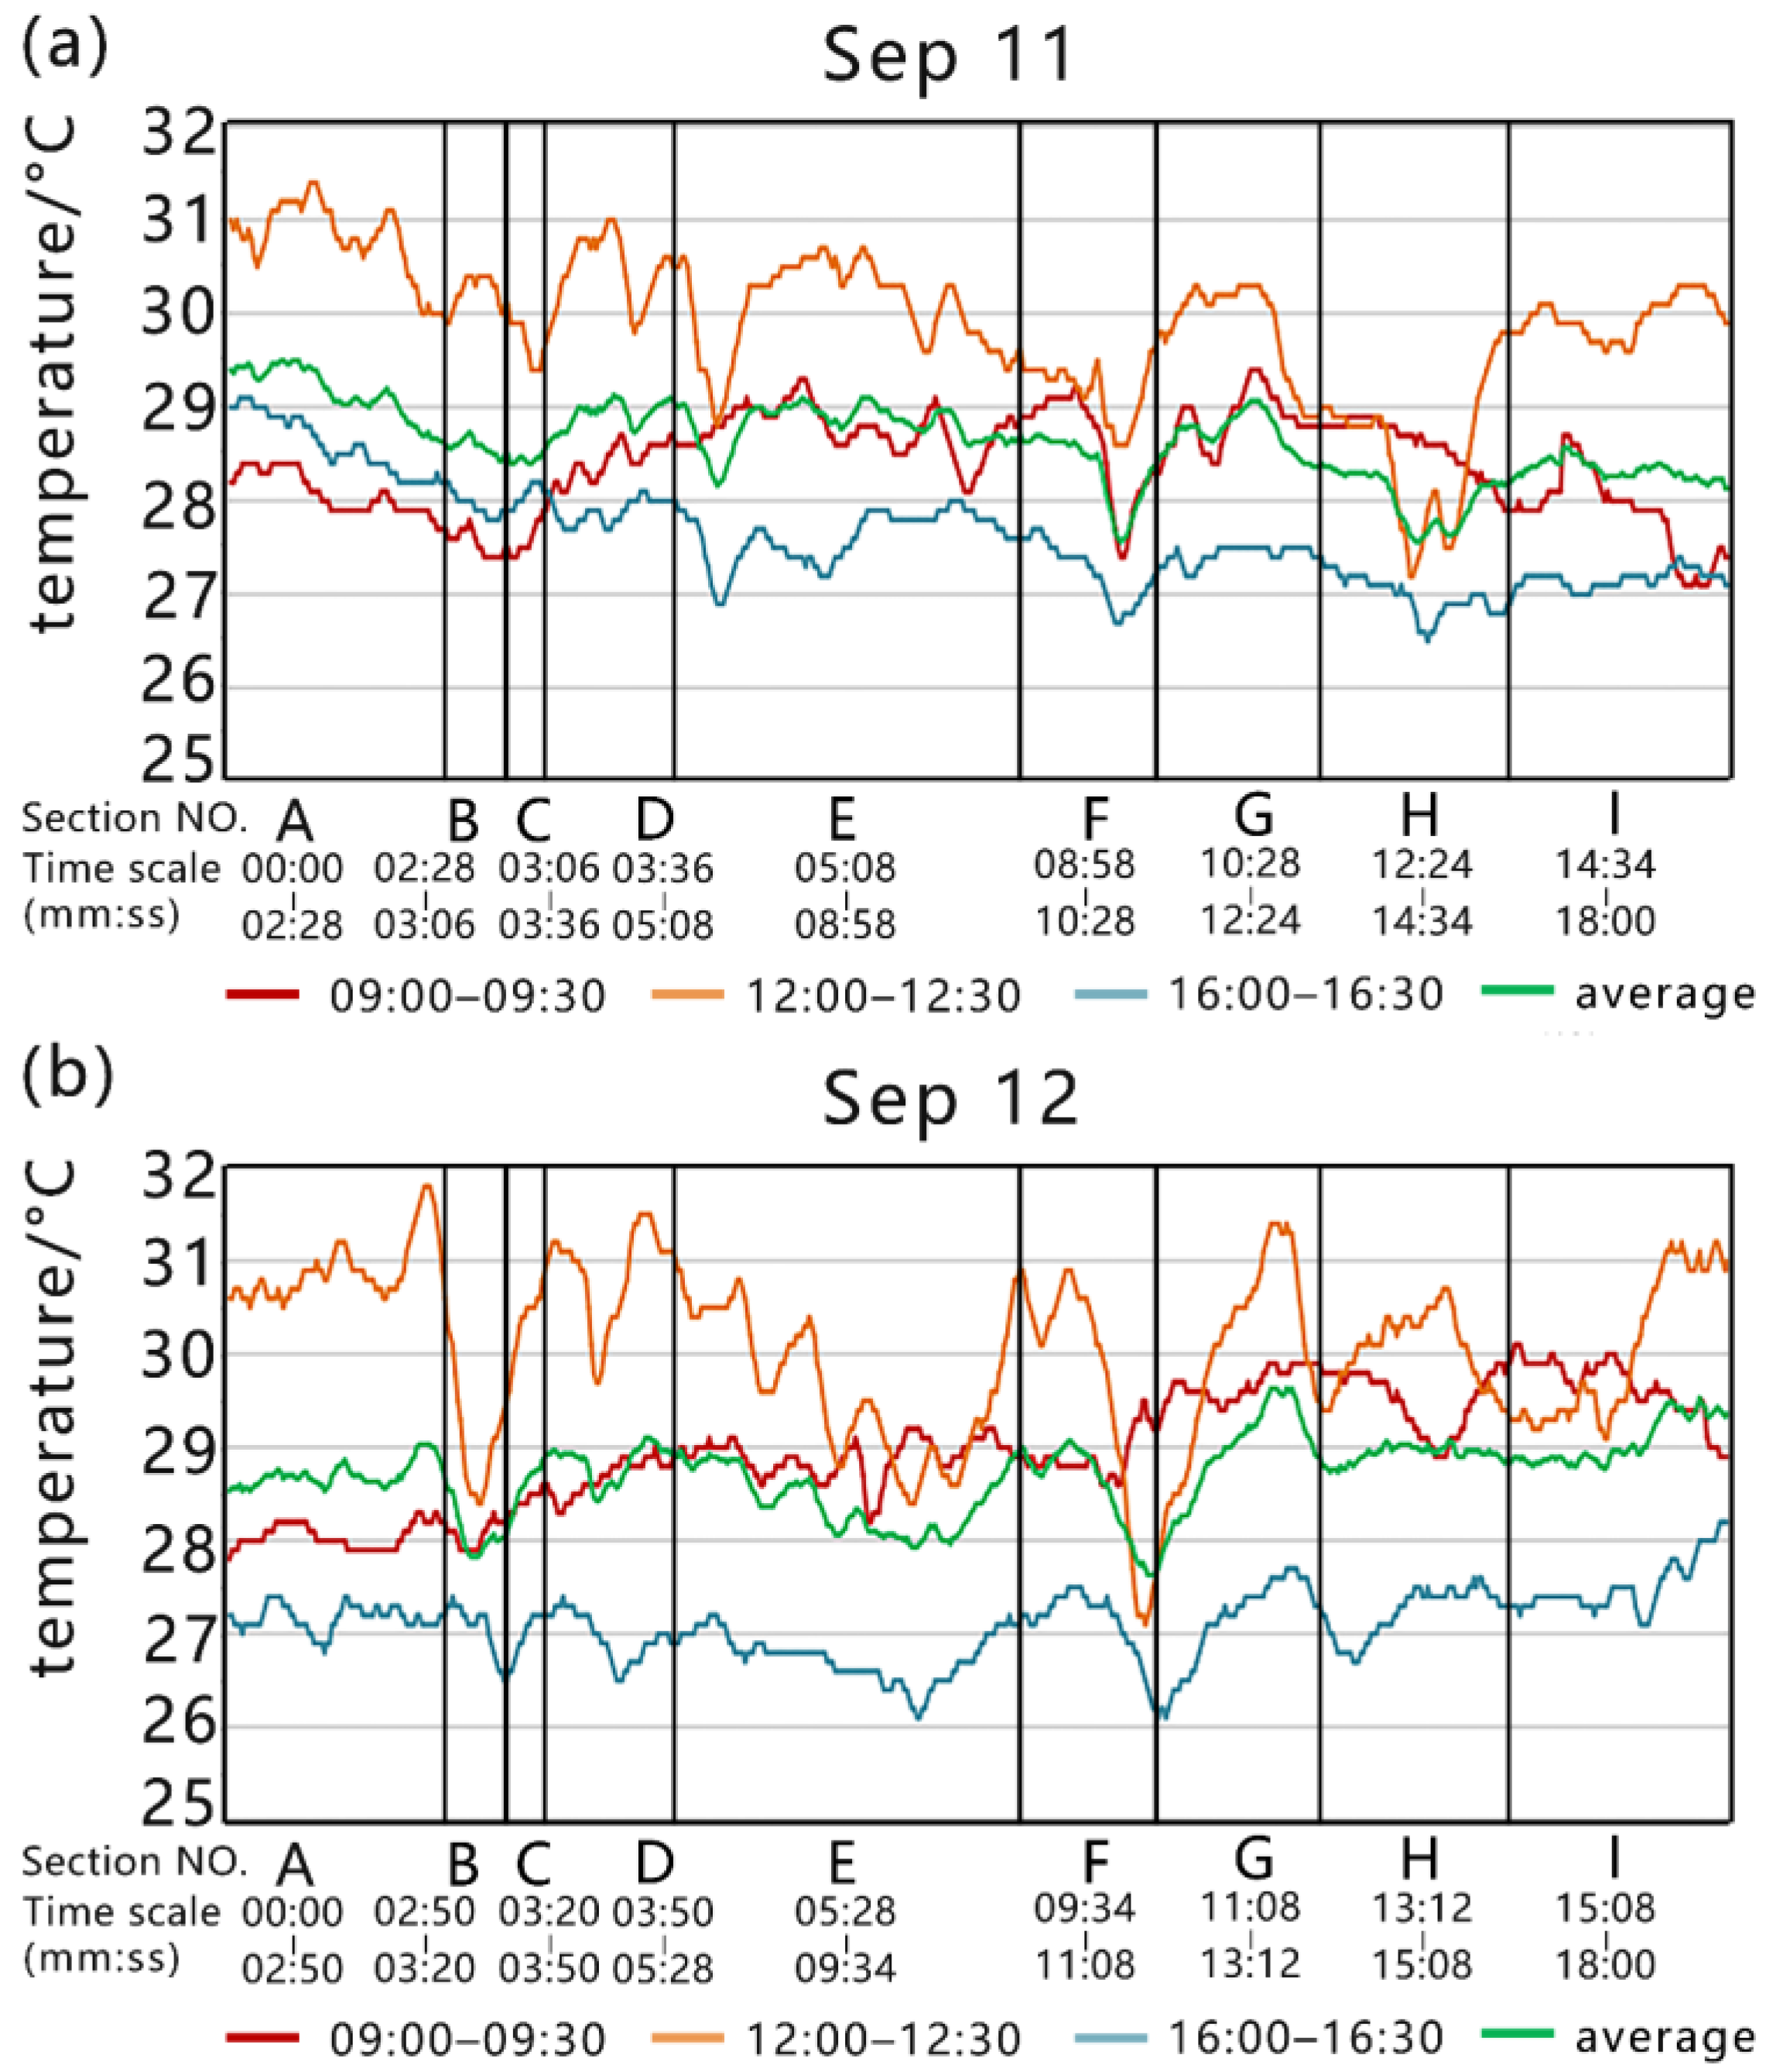
3.1.1. Temperature Analysis
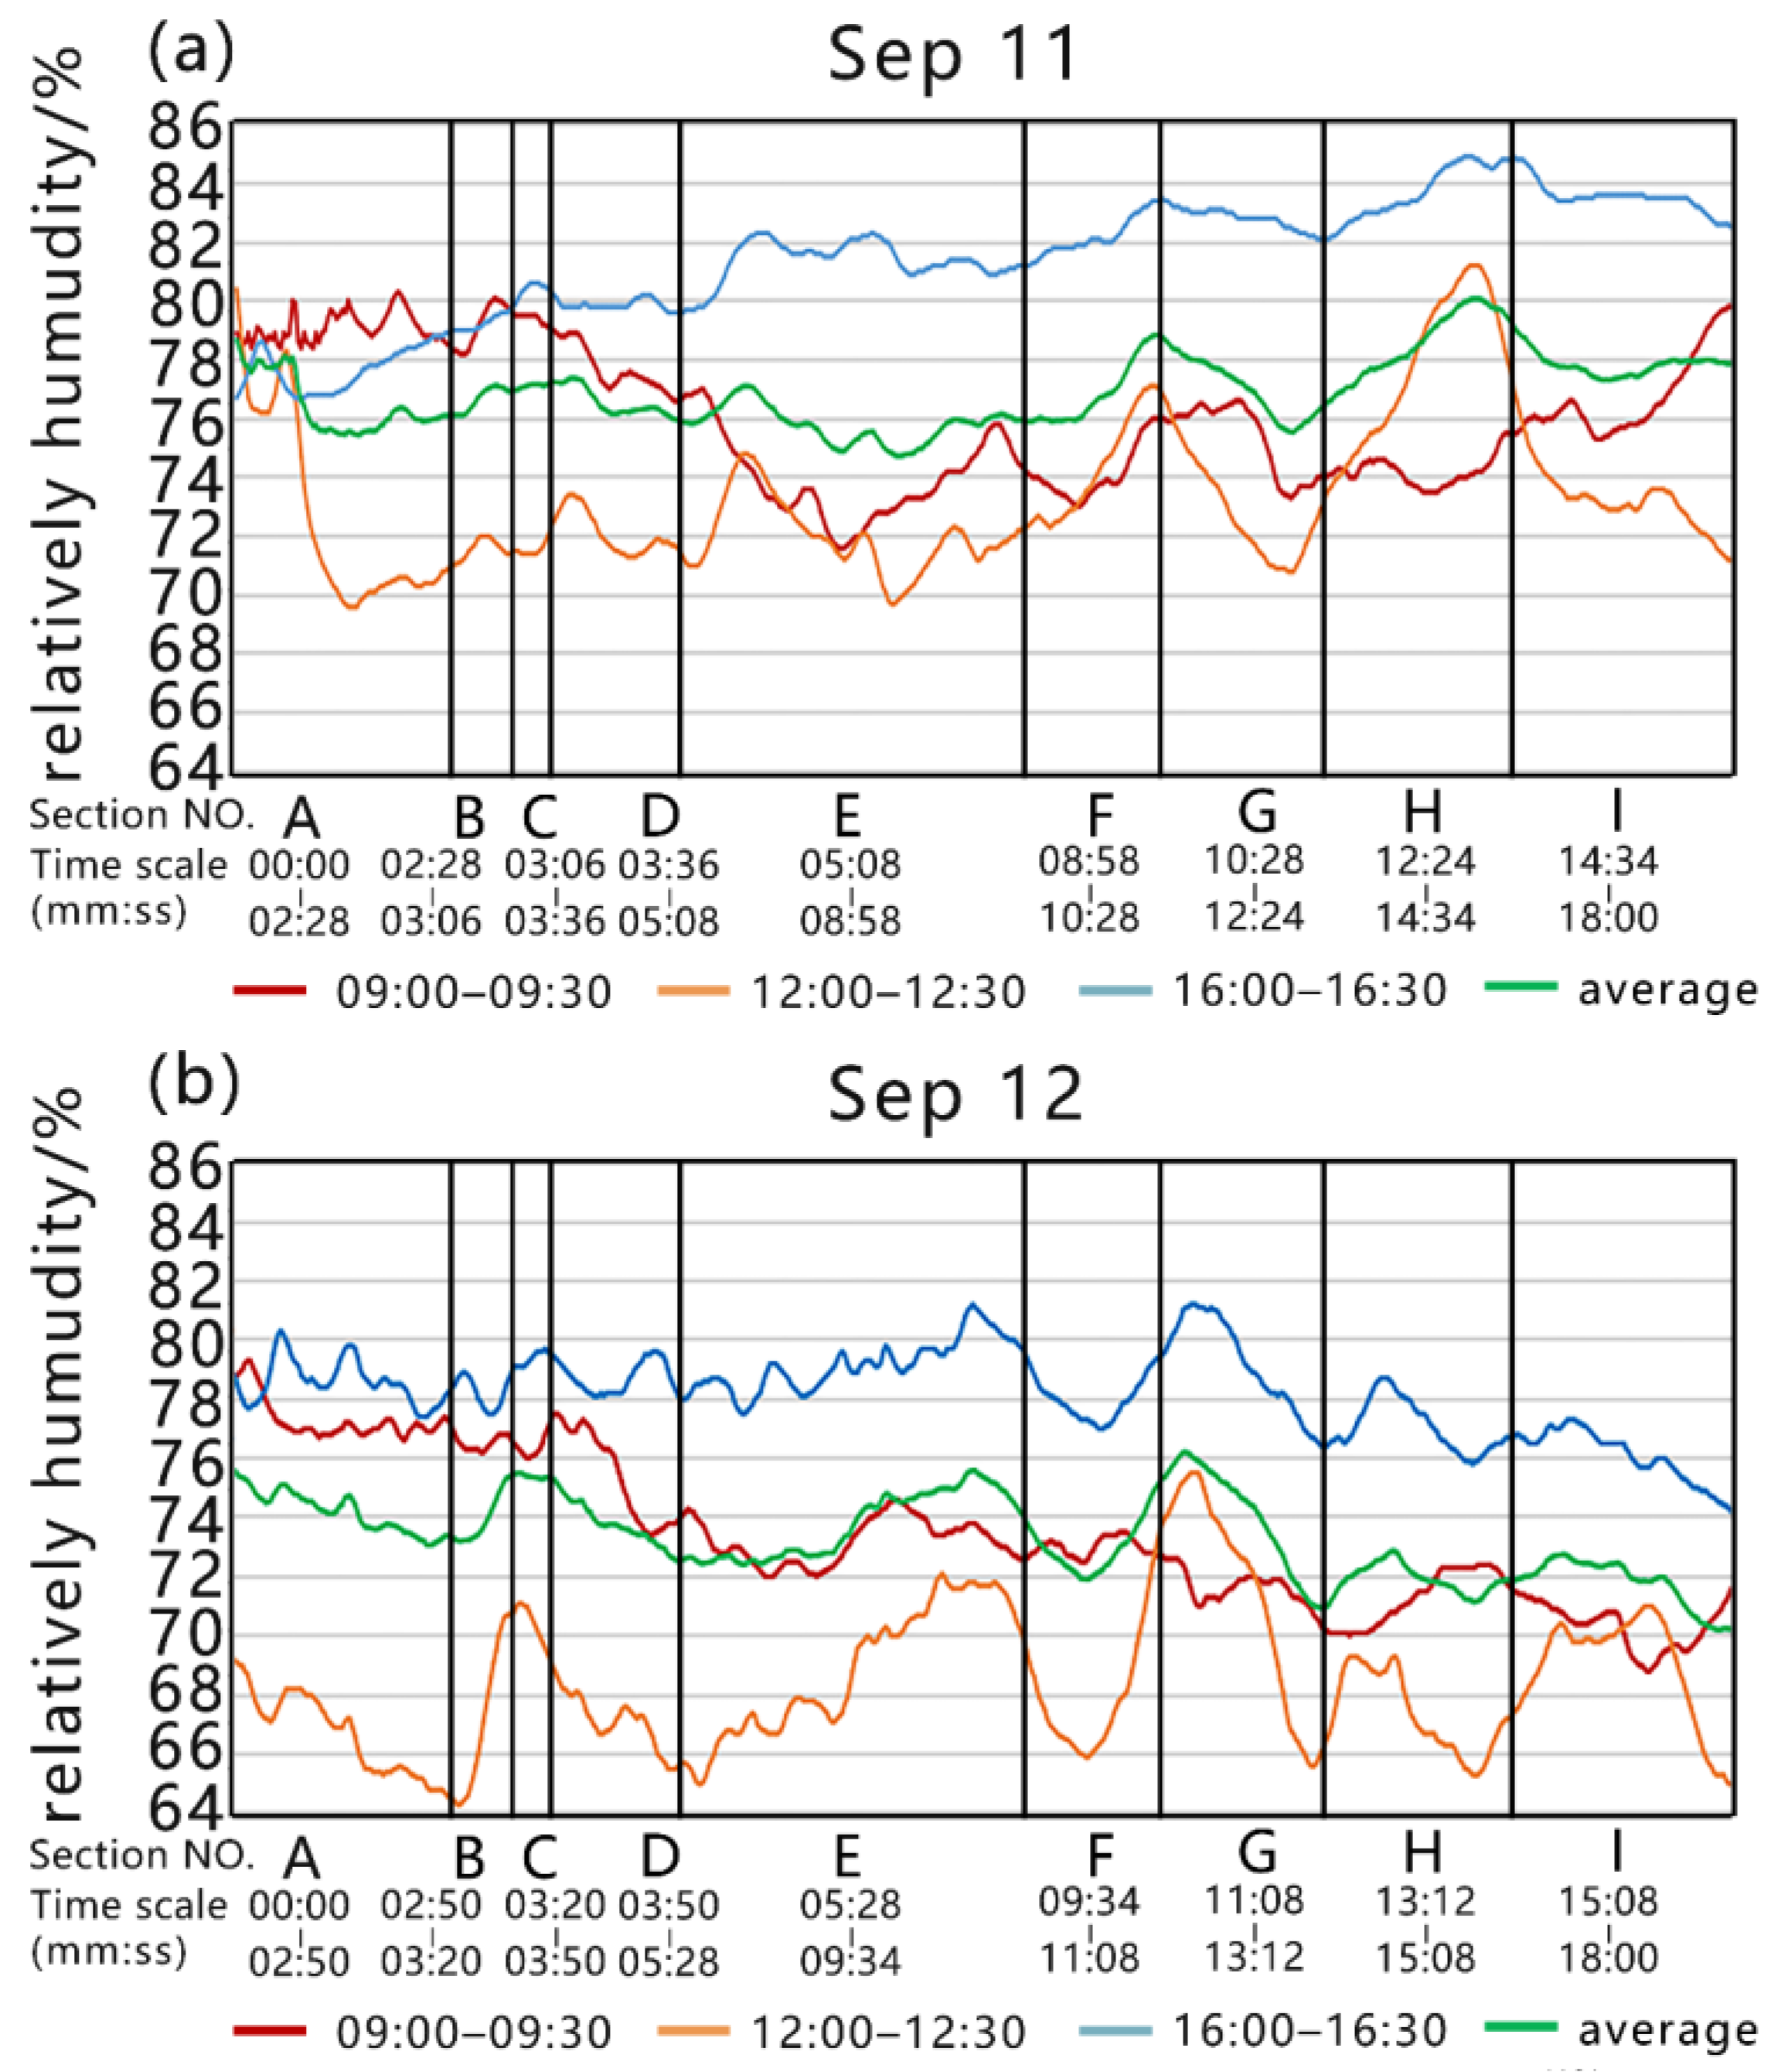
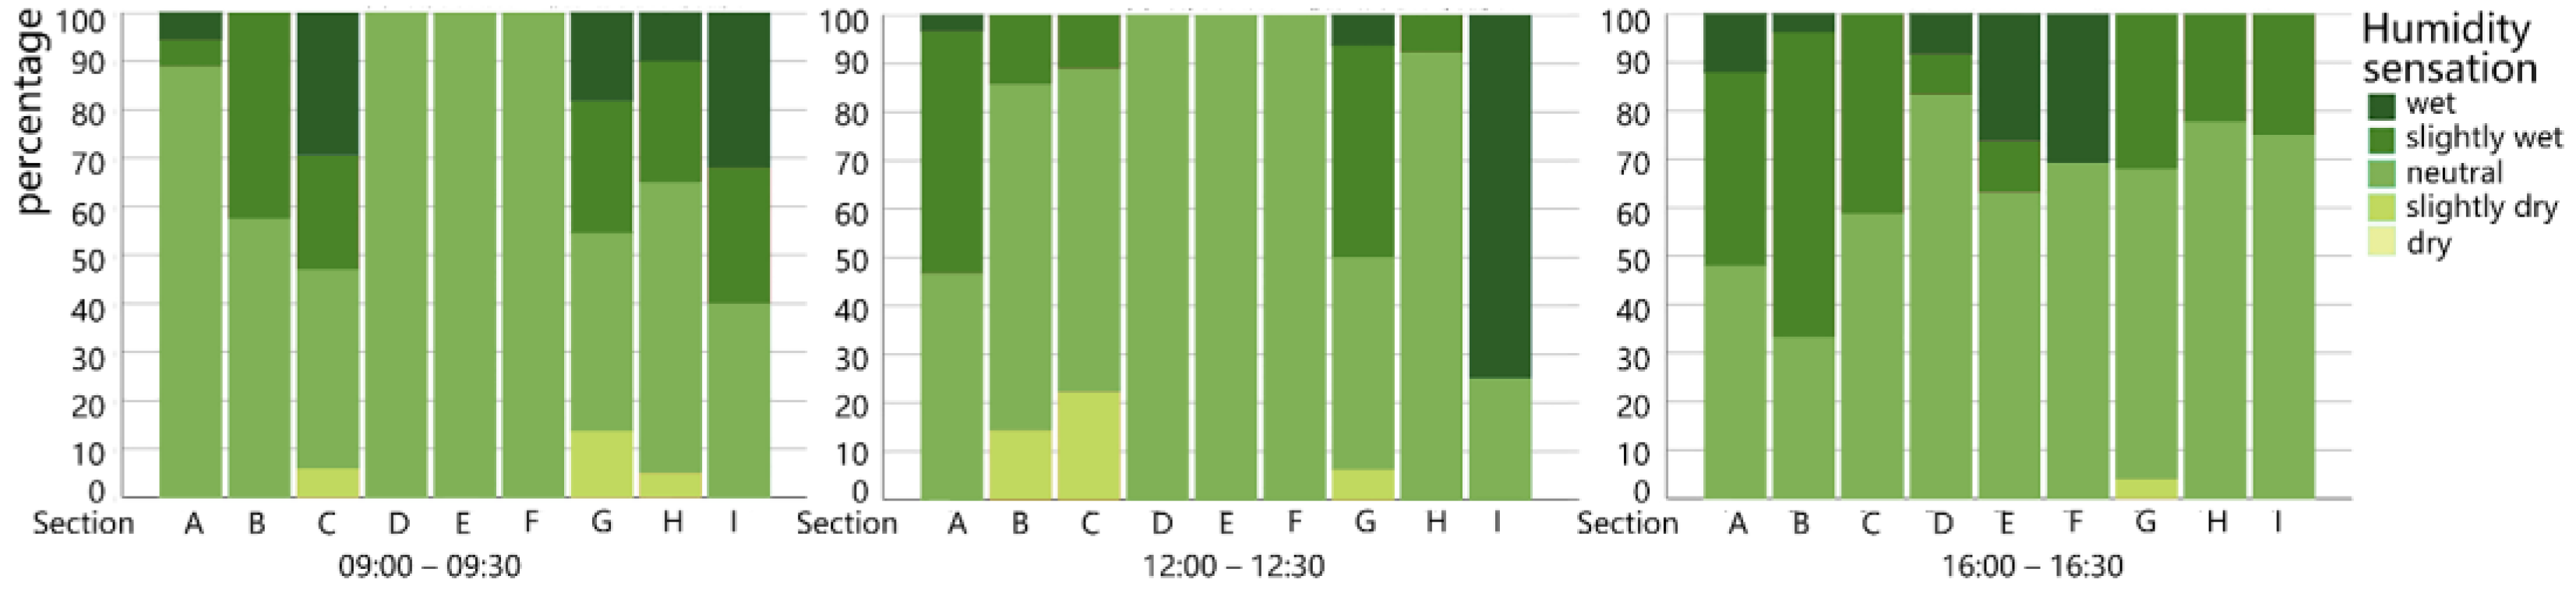
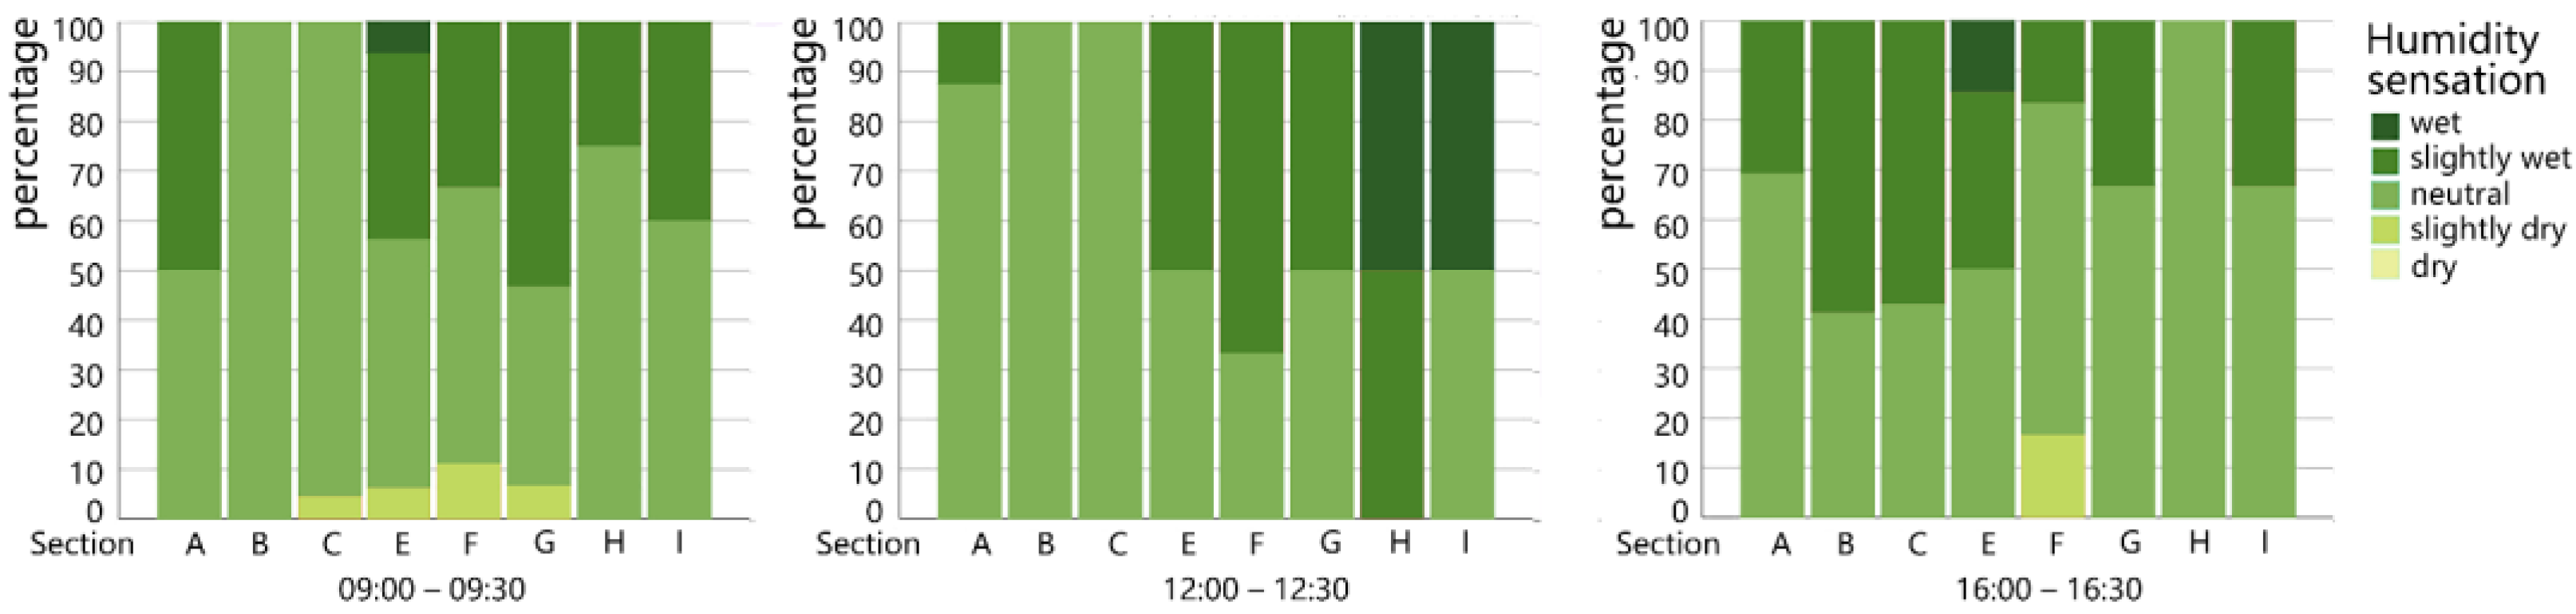
3.1.2. Relative Humidity Analysis
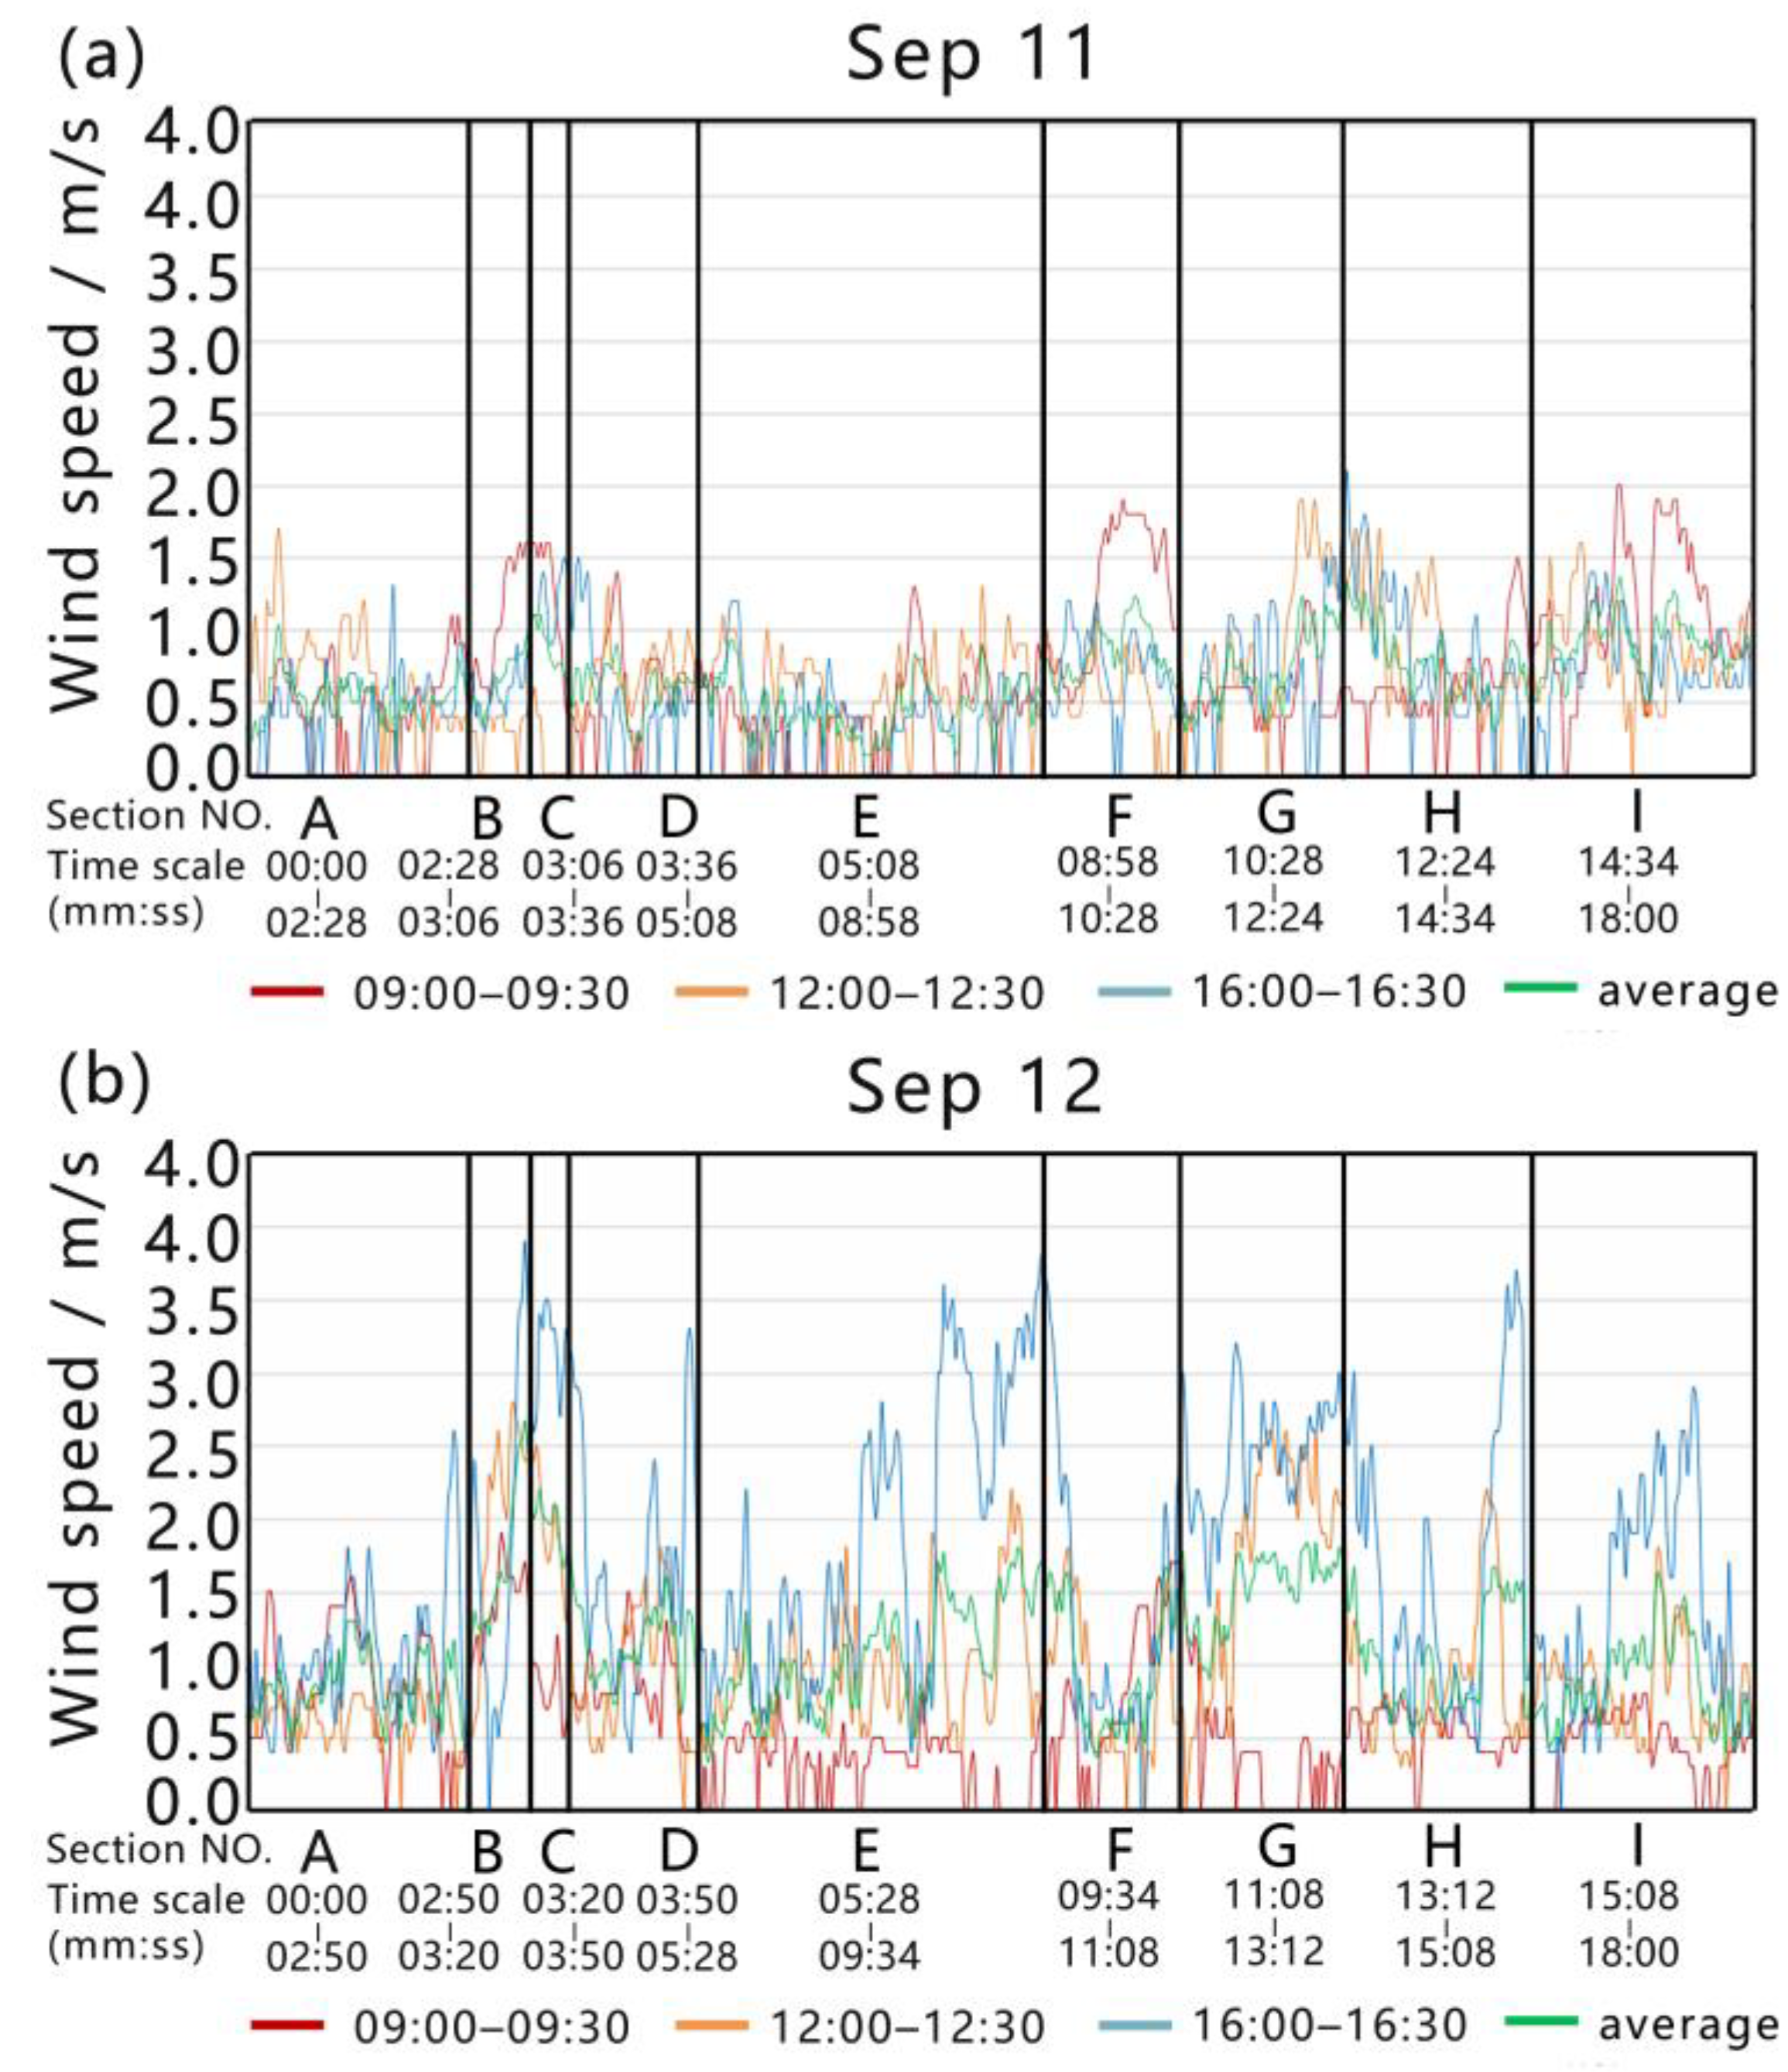
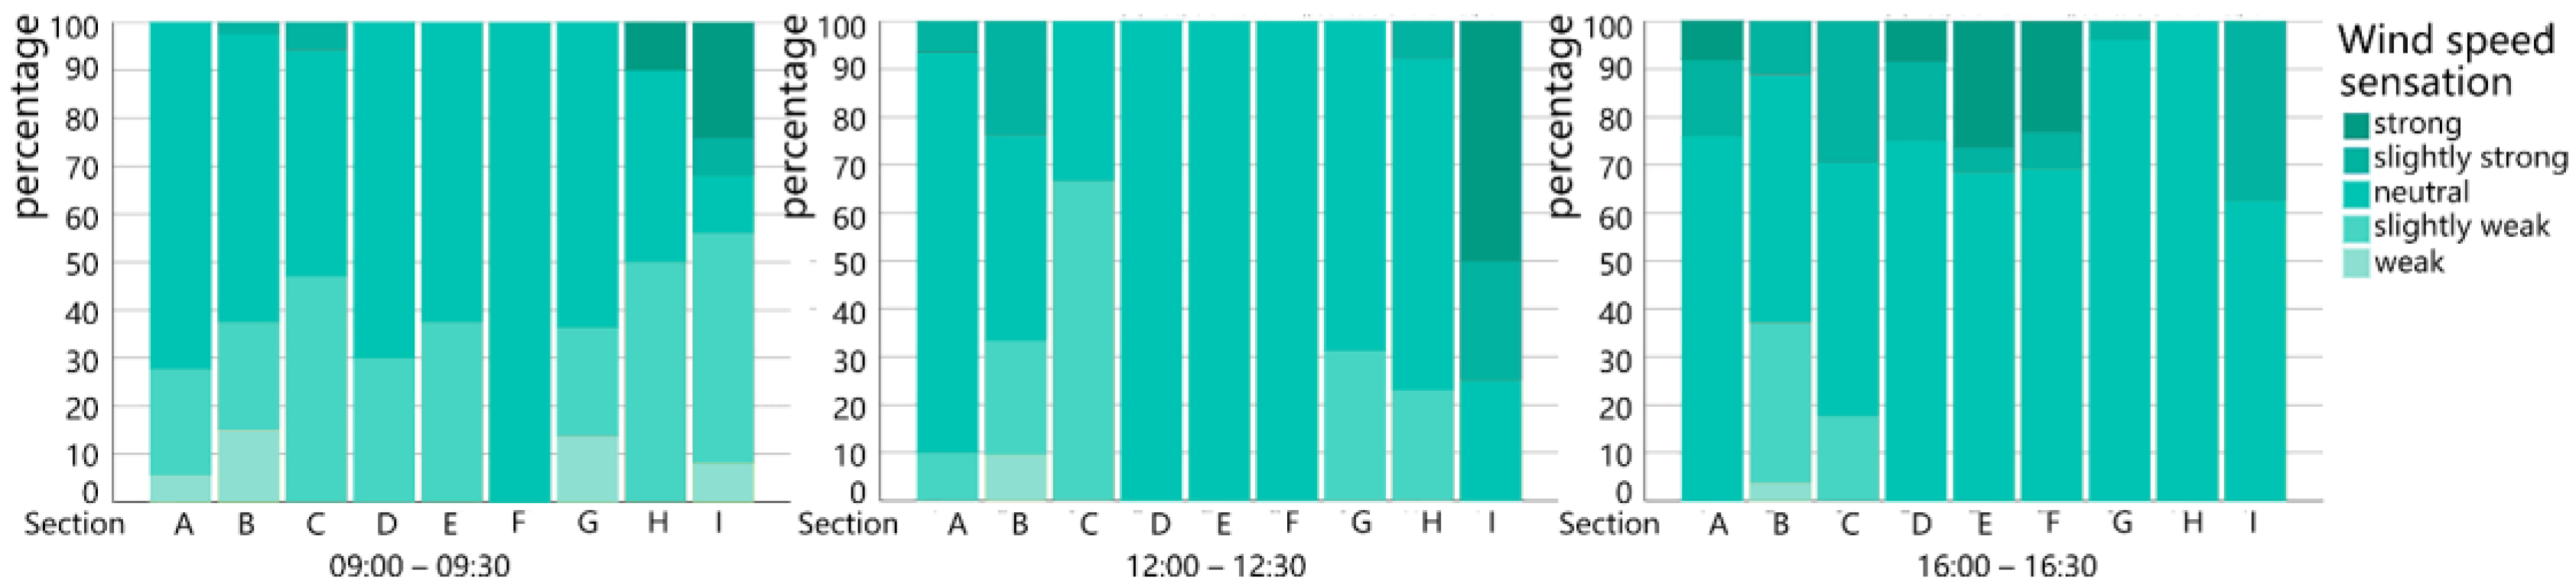
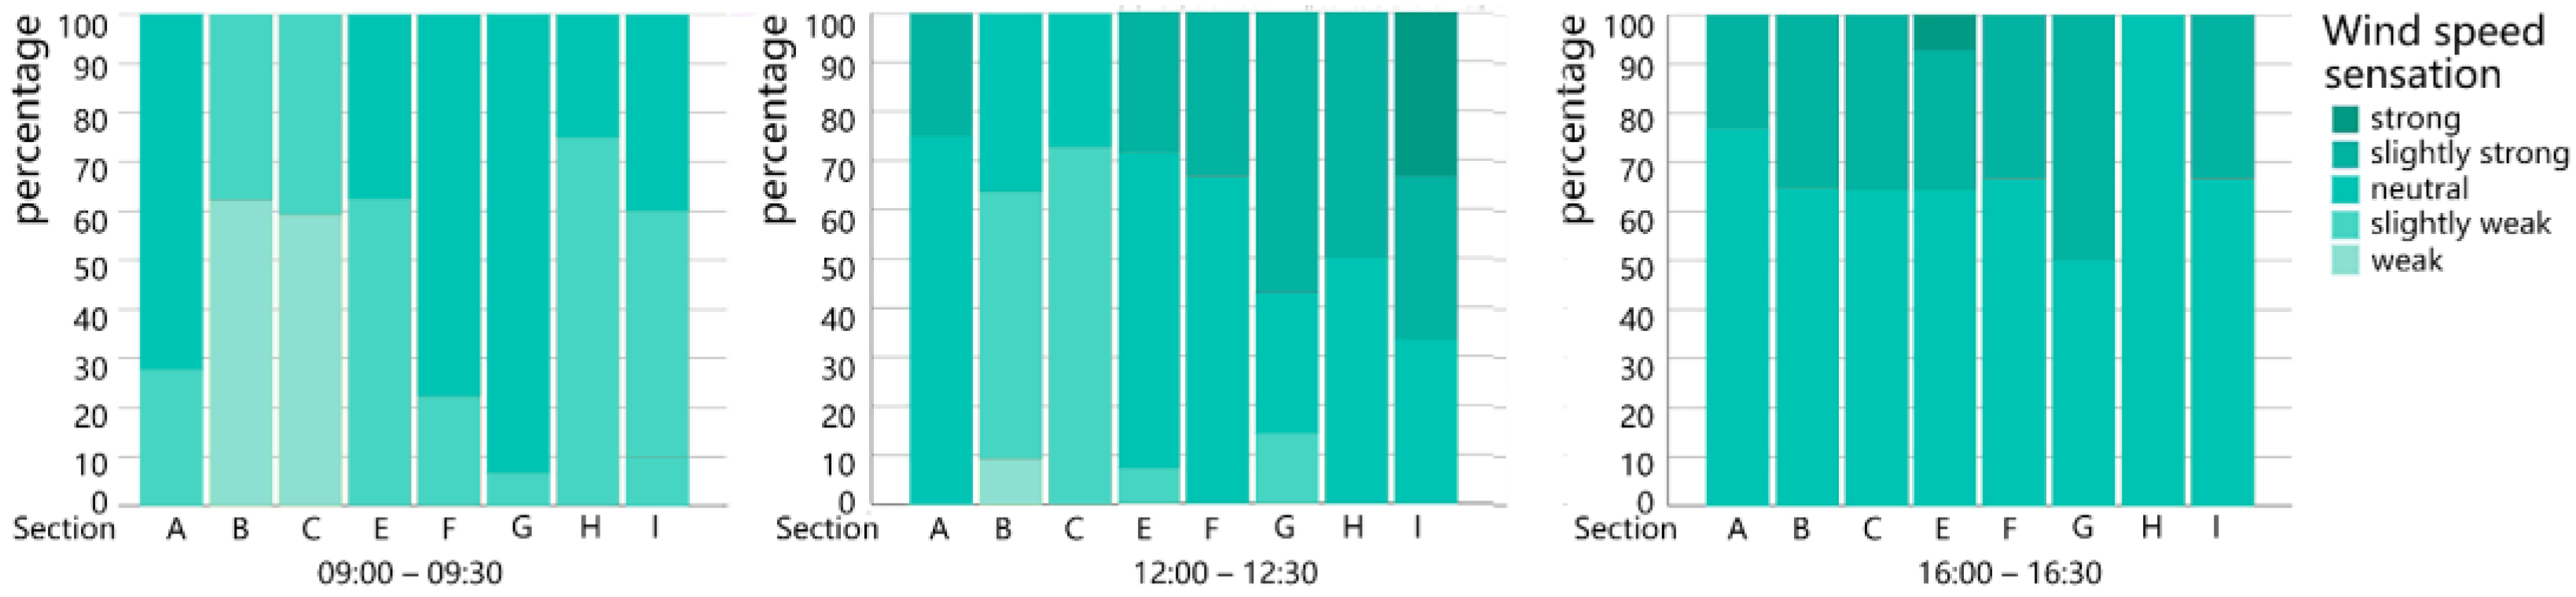
3.1.3. Wind Speed Analysis
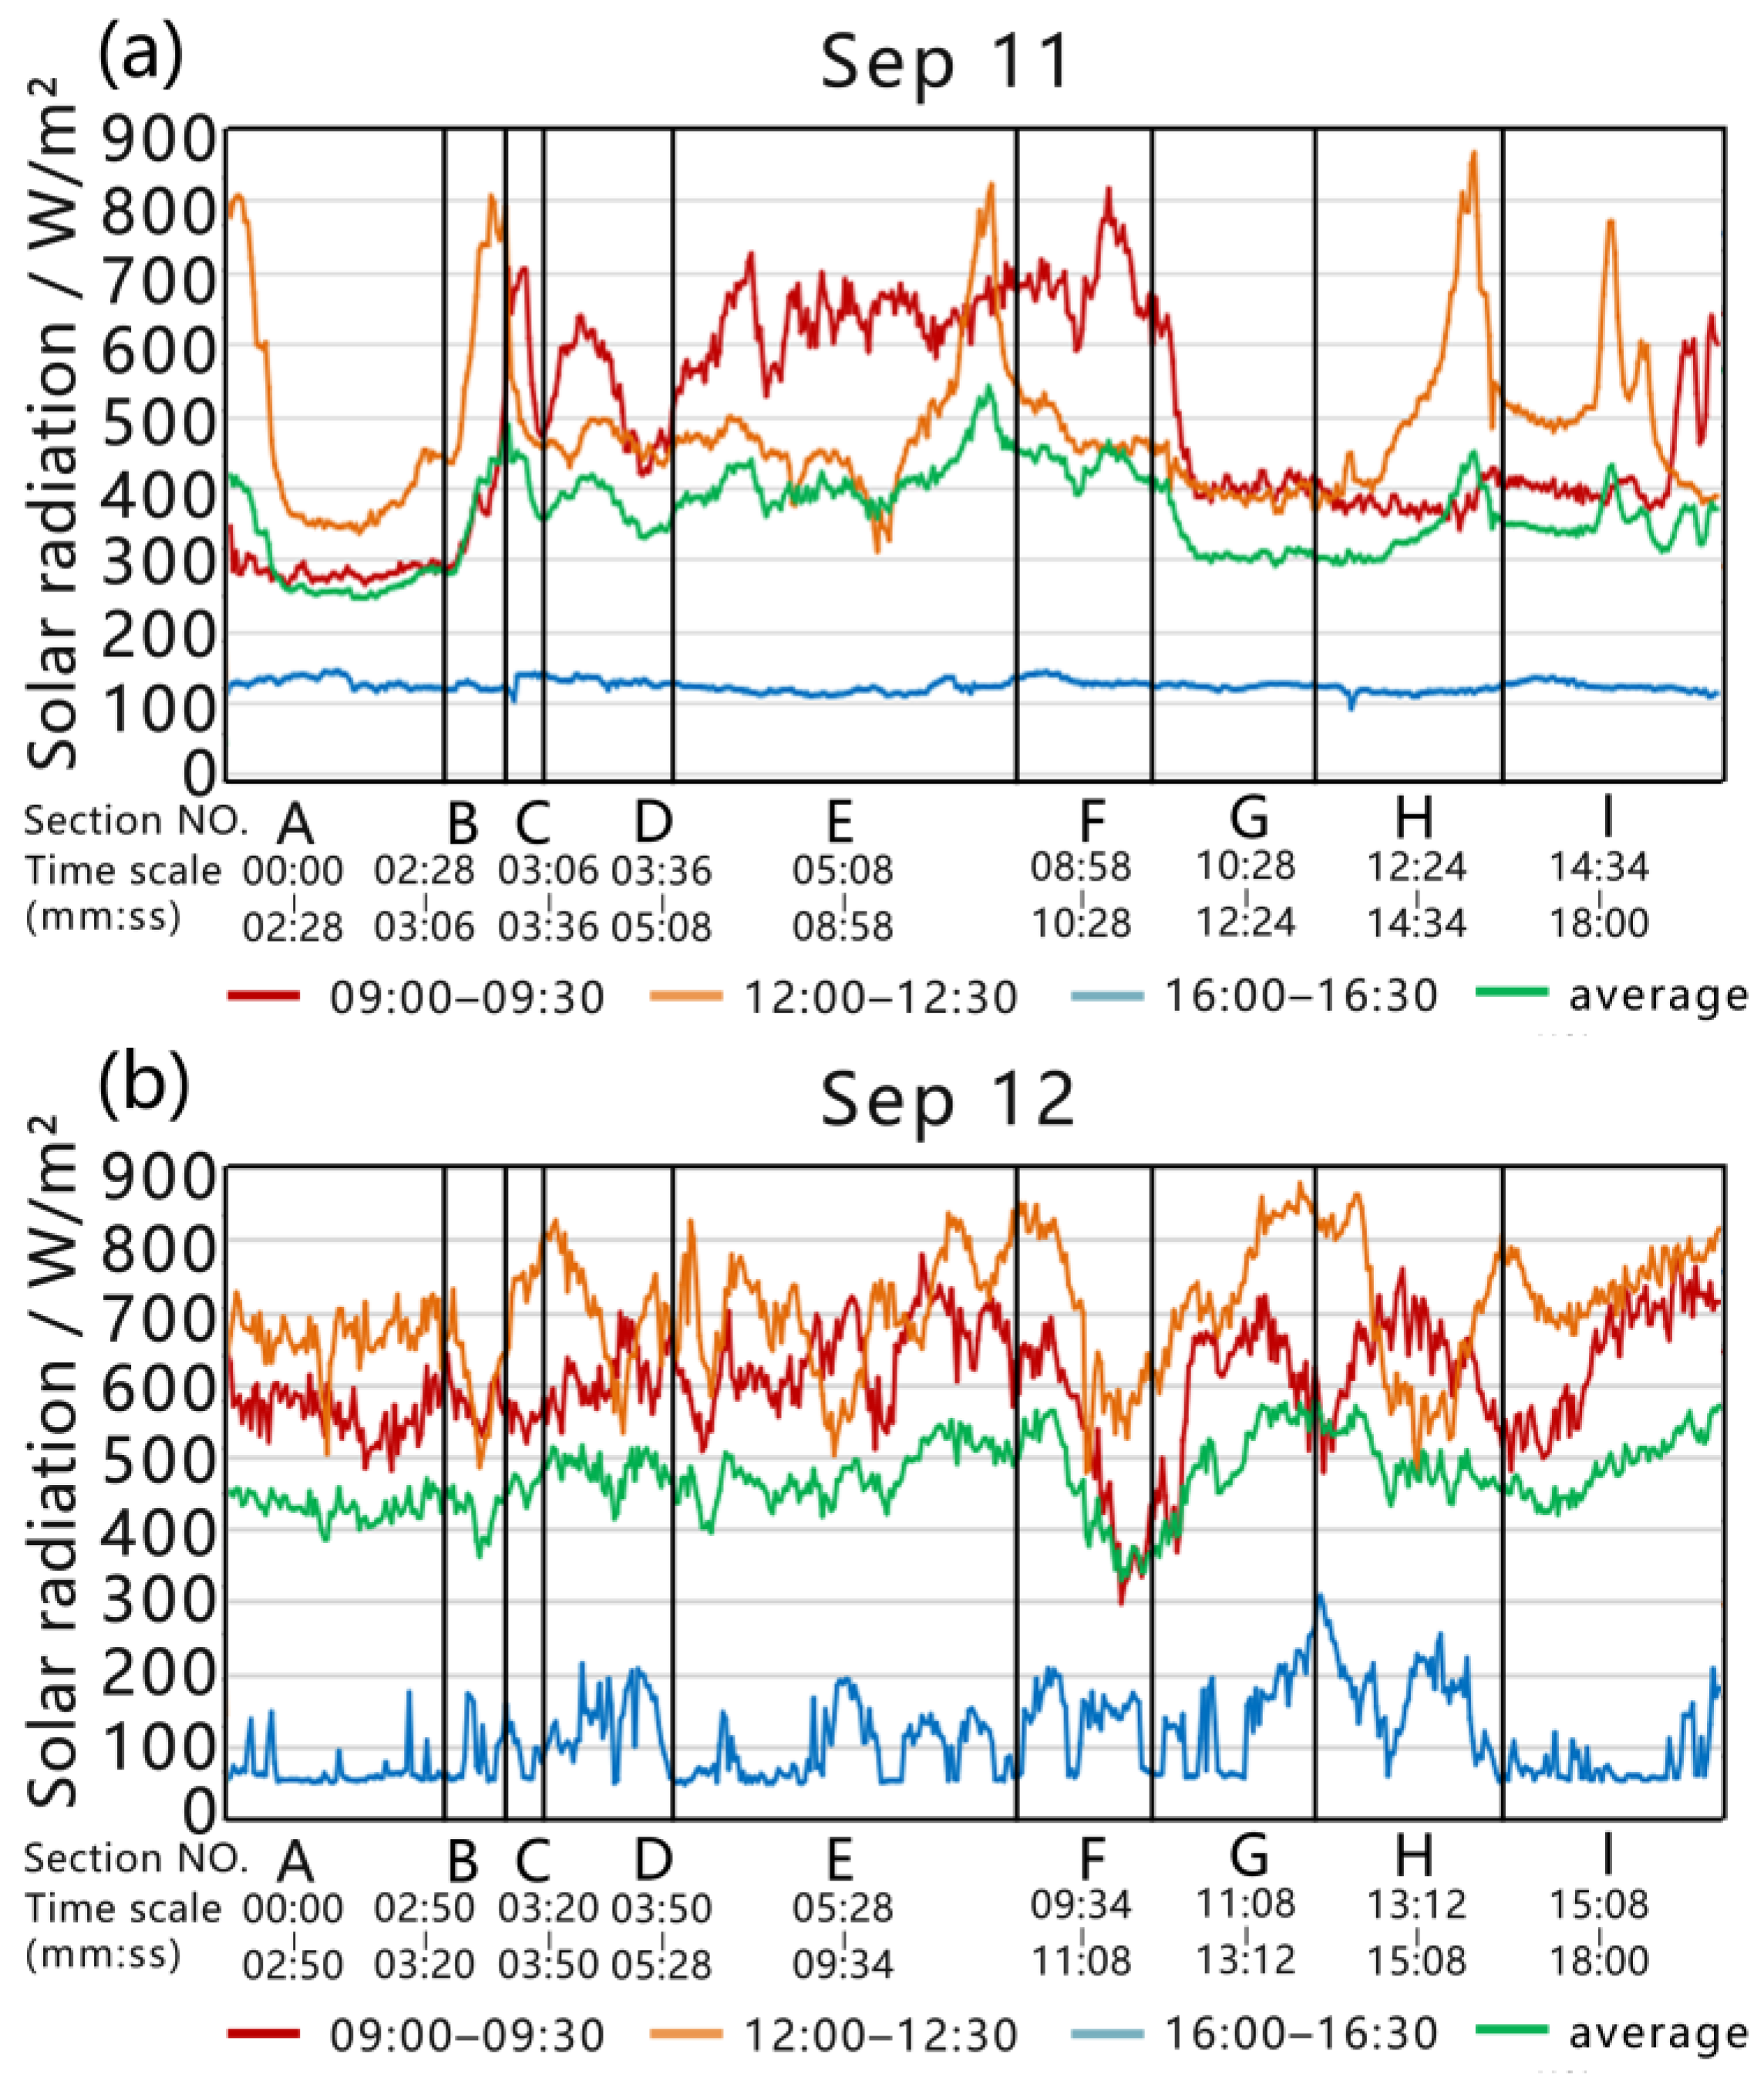
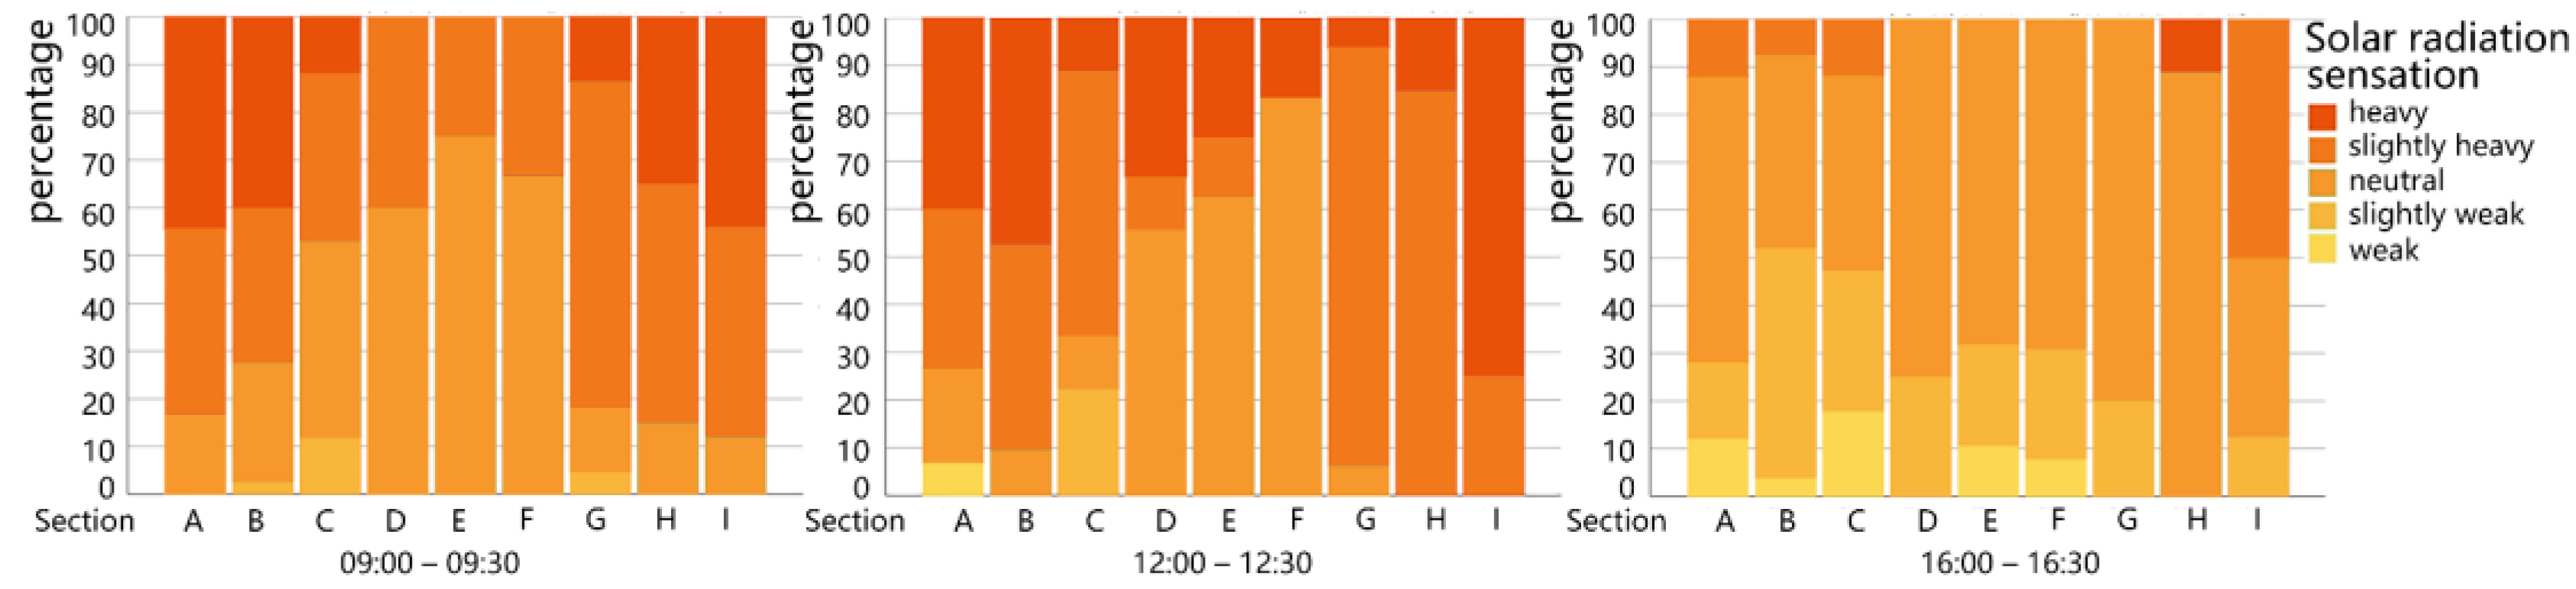
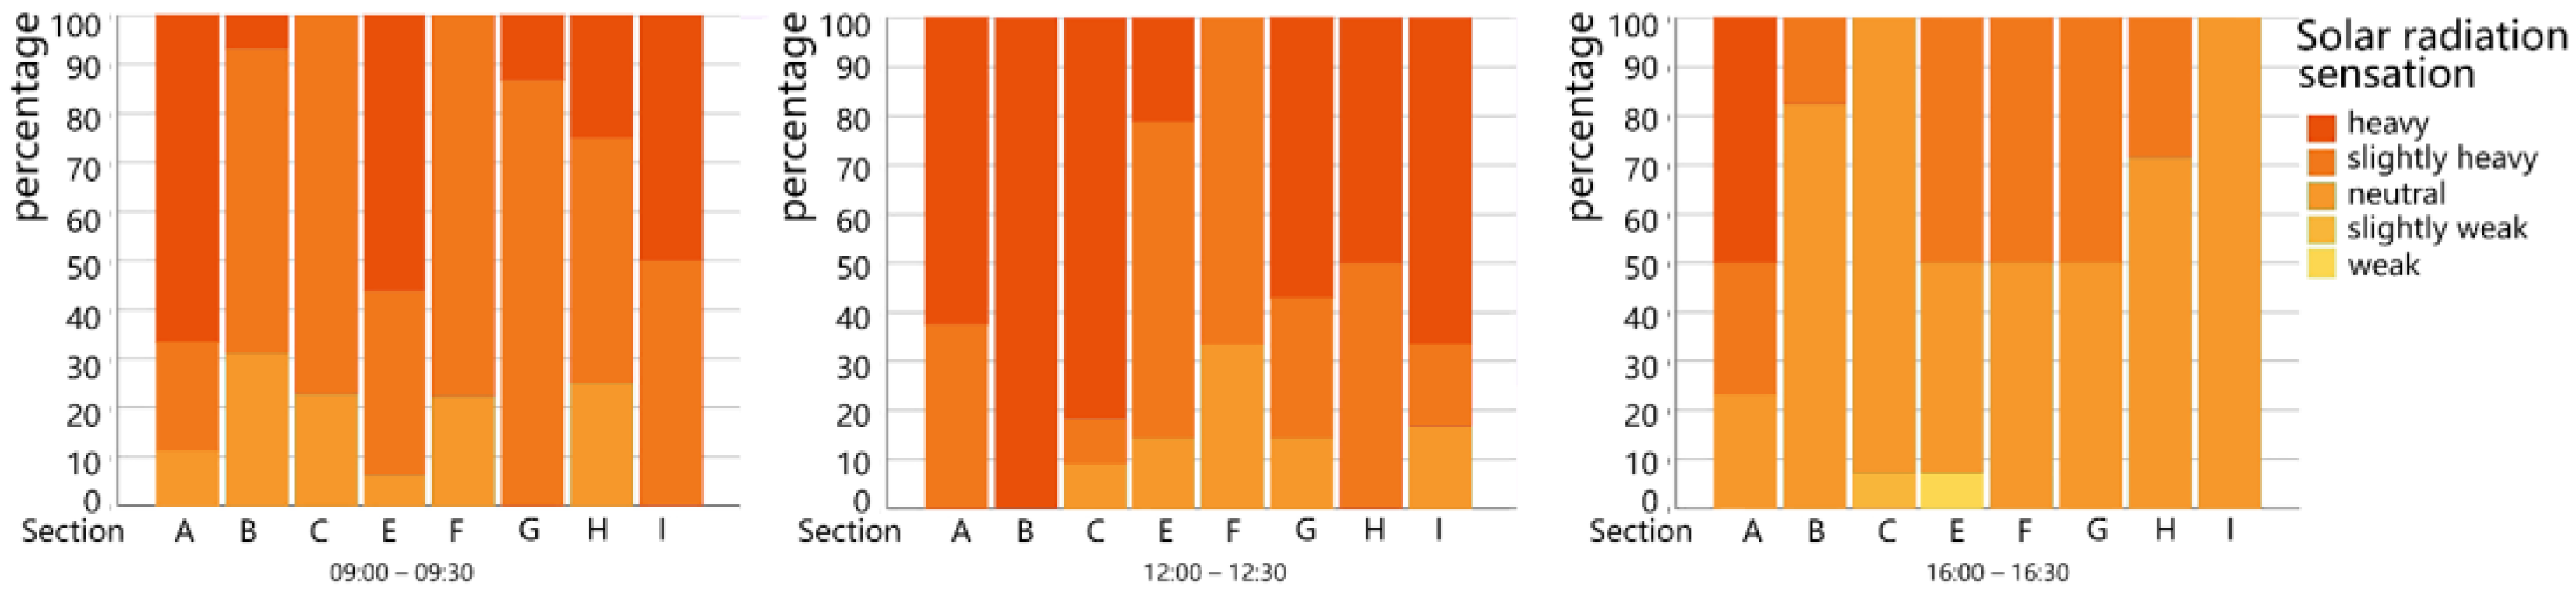
3.1.4. Solar Radiation Analysis
3.1.5. Interaction between the Measured Microclimate Parameters
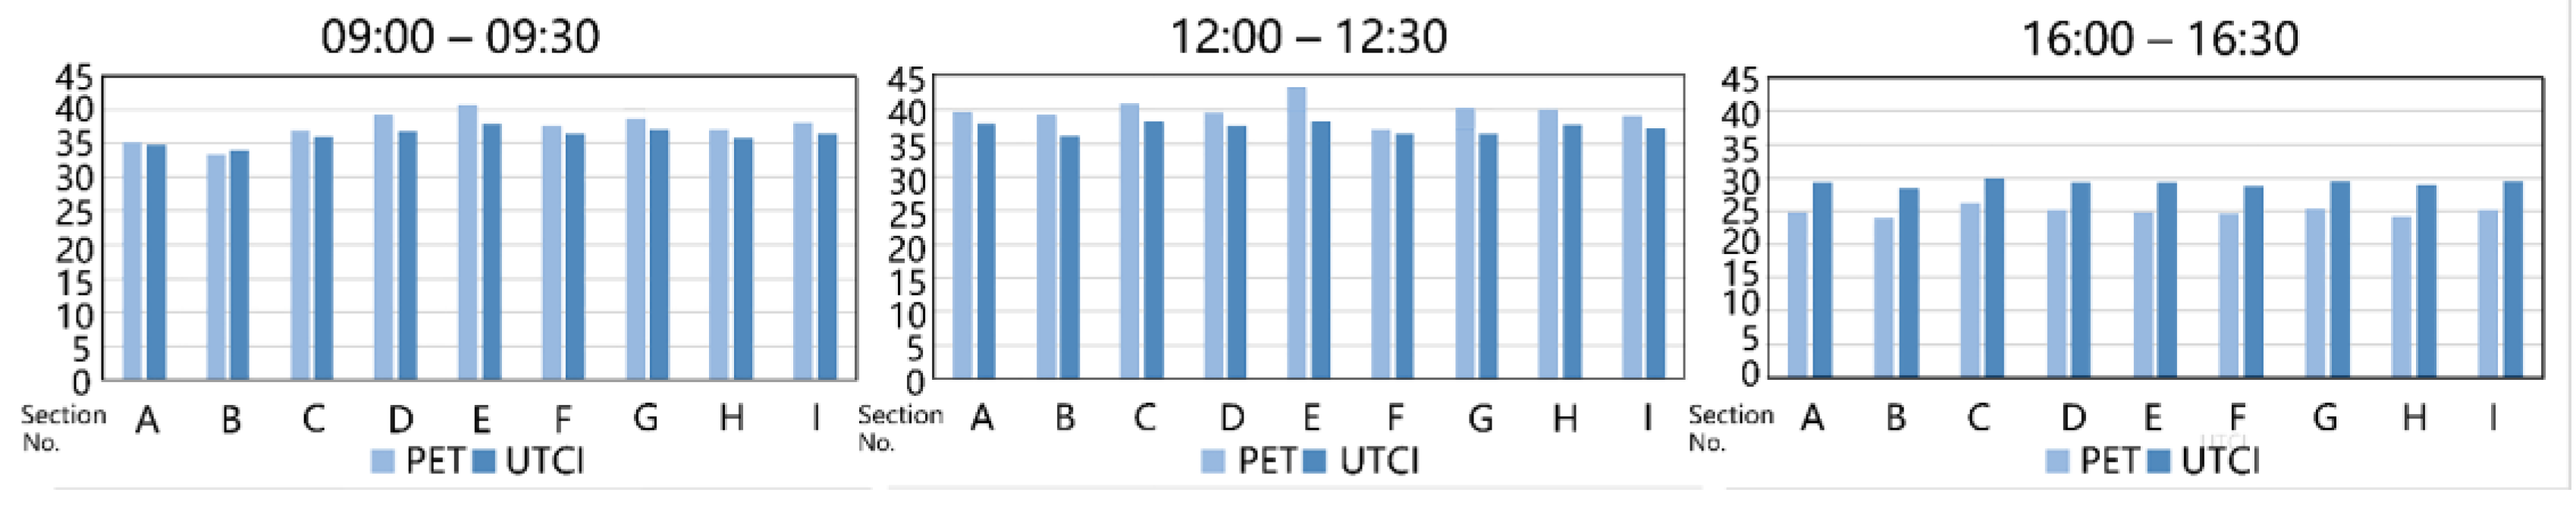
3.2. Objective Thermal Comfort Surveys
3.2.1. Correlation Analysis of the Vegetation Coverage, the Paved Area Coverage with PET, UTCI
3.2.2. Correlation Analysis of Measured Microclimatic Parameters with PET and UTCI
3.3. Subjective Thermal Comfort Surveys
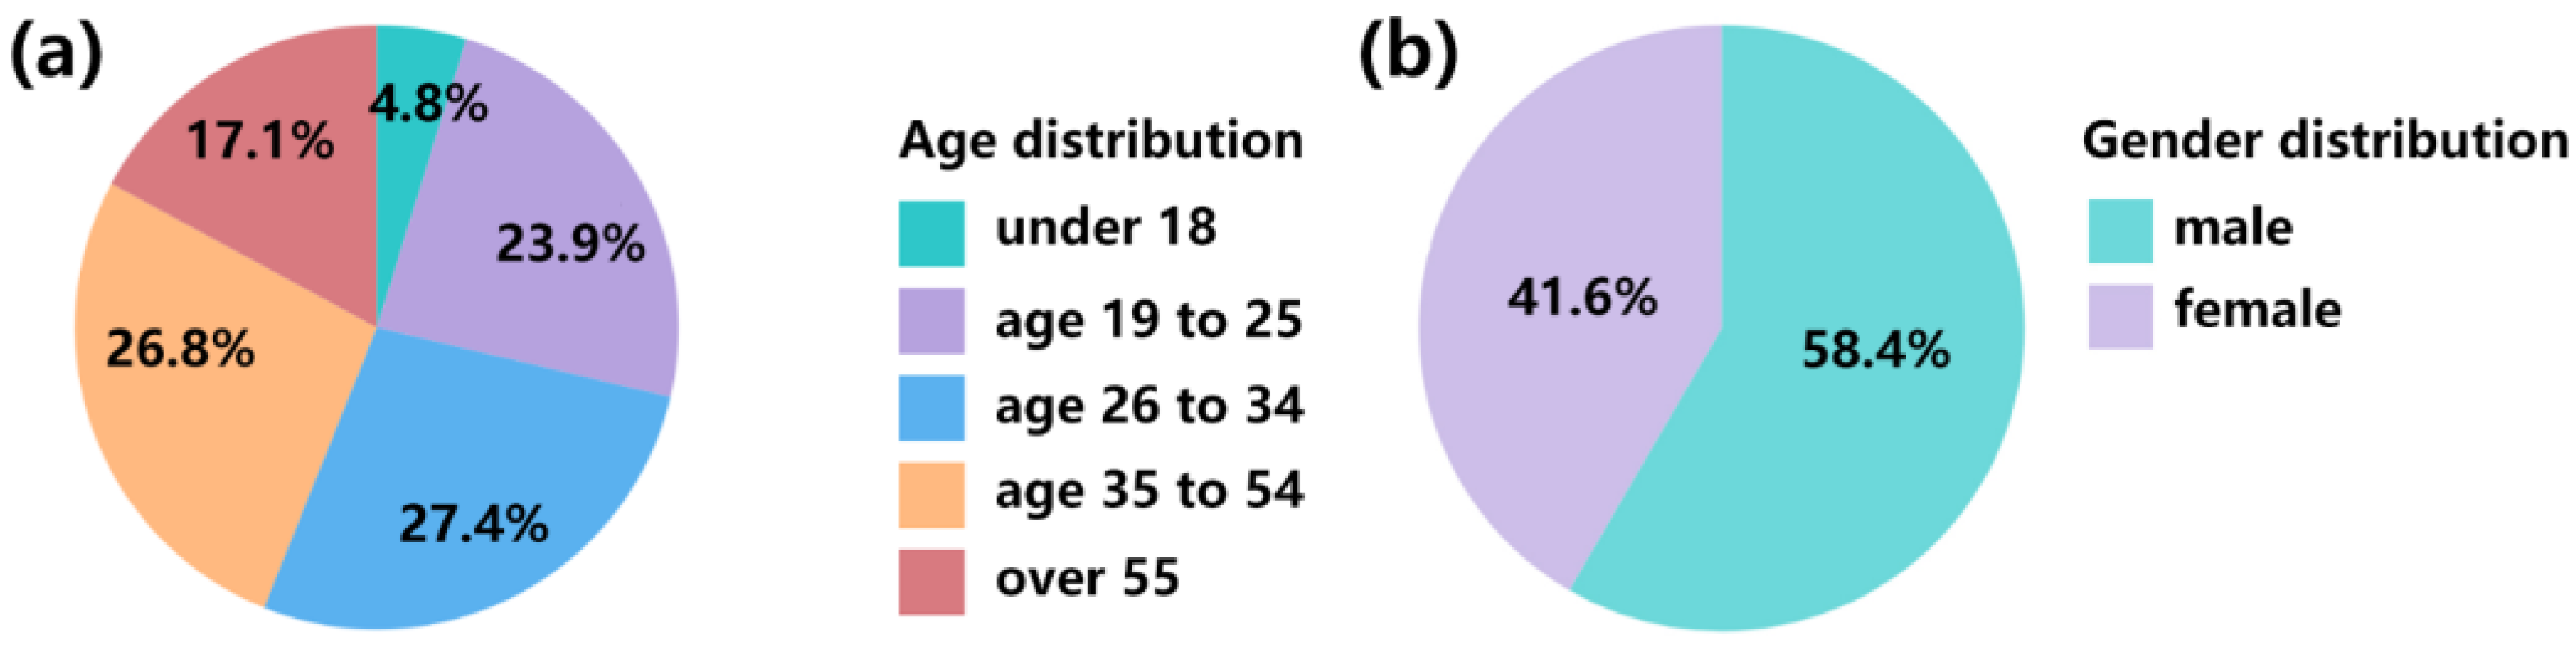
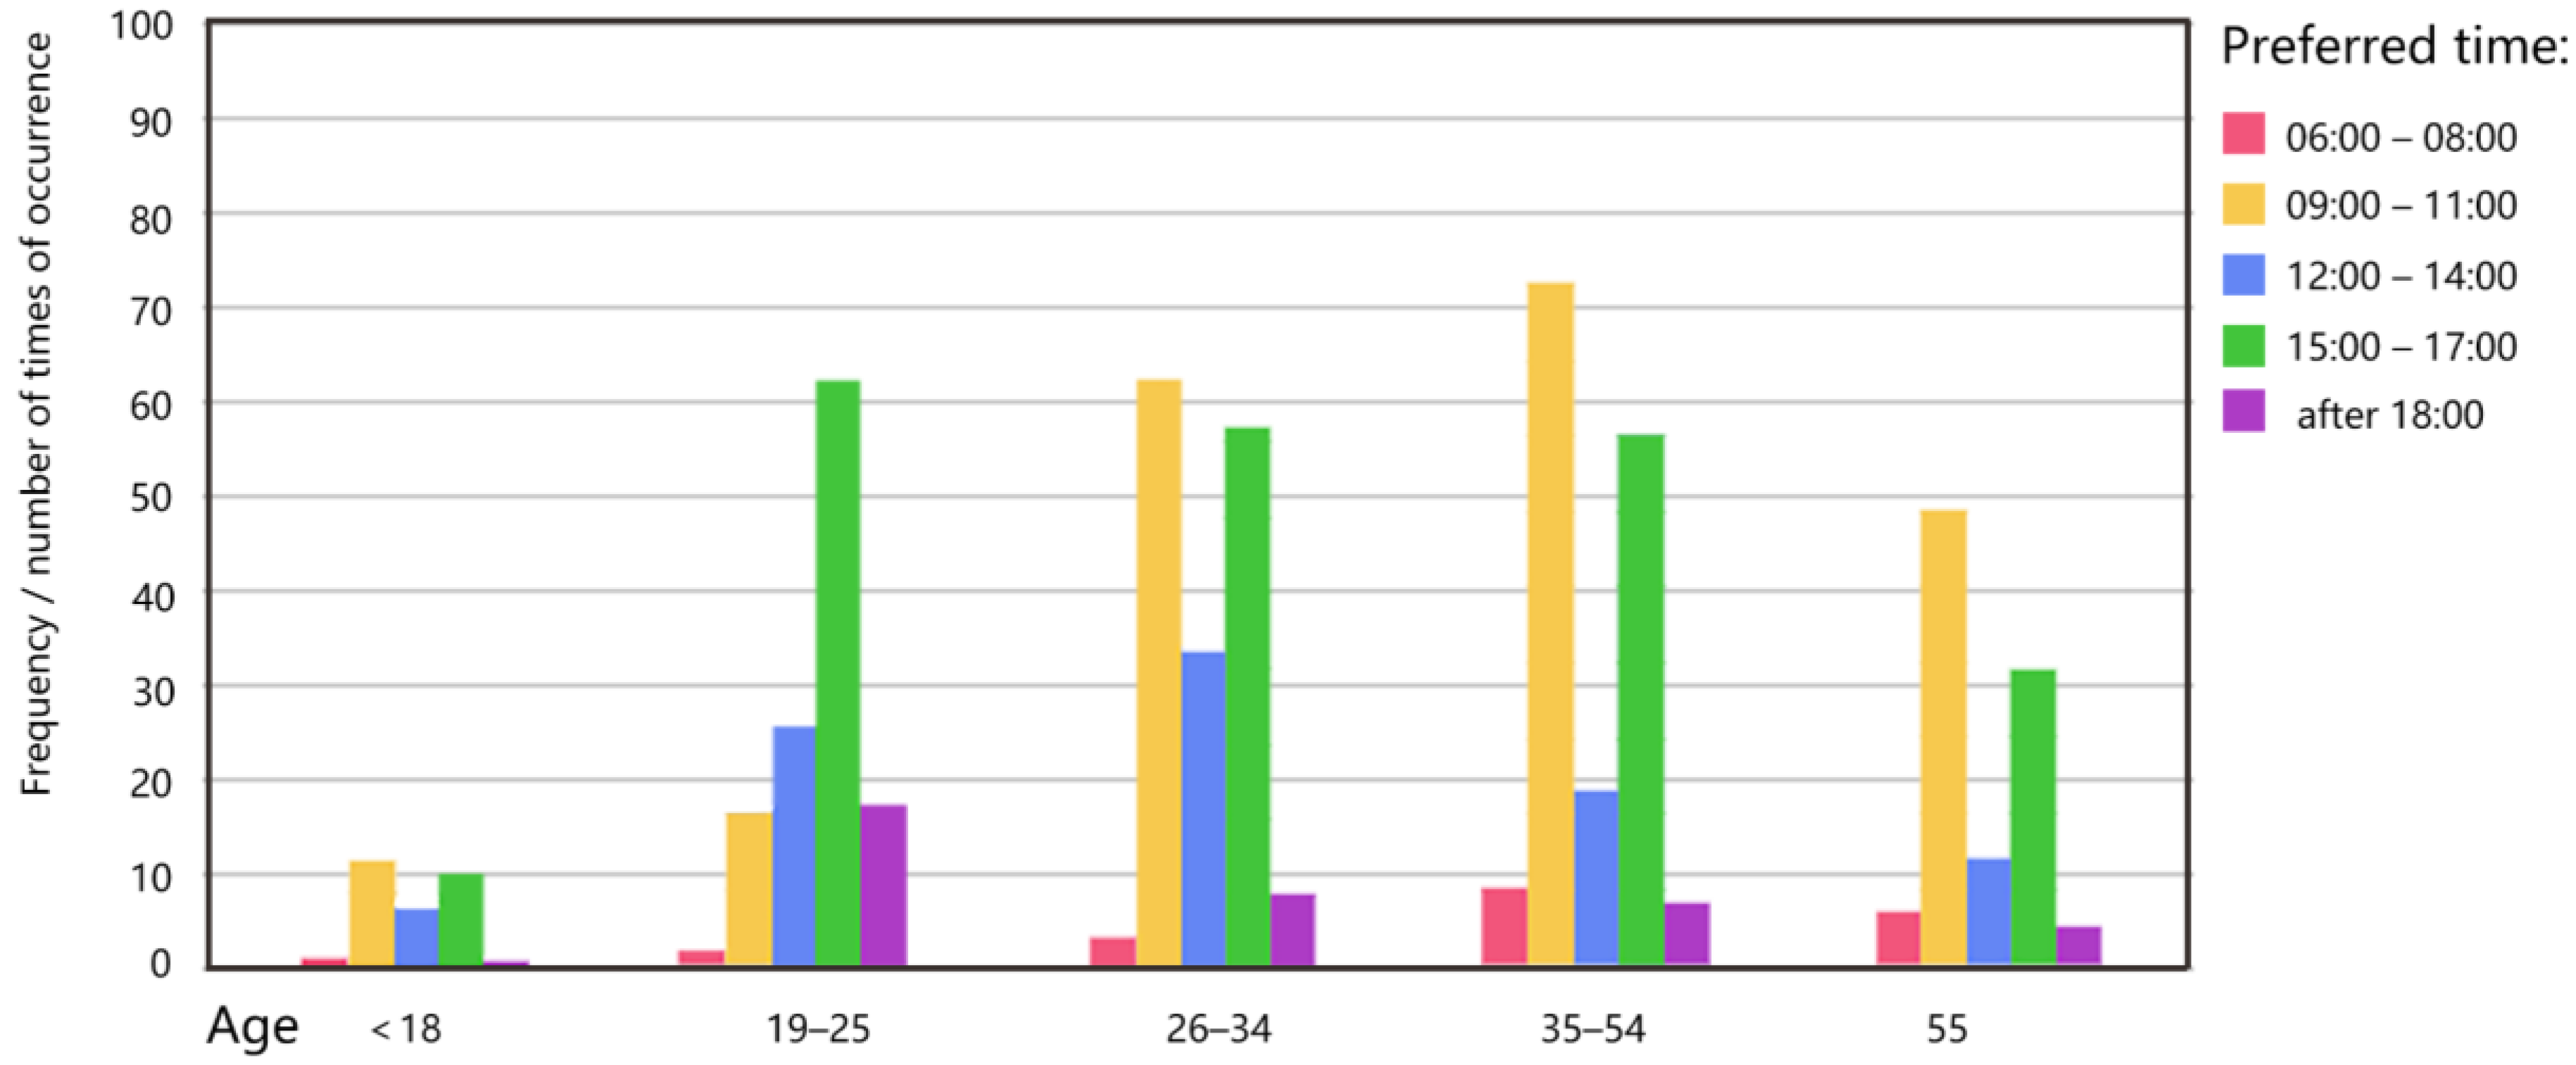
3.3.1. Analysis of Interviewees’ Basic Information
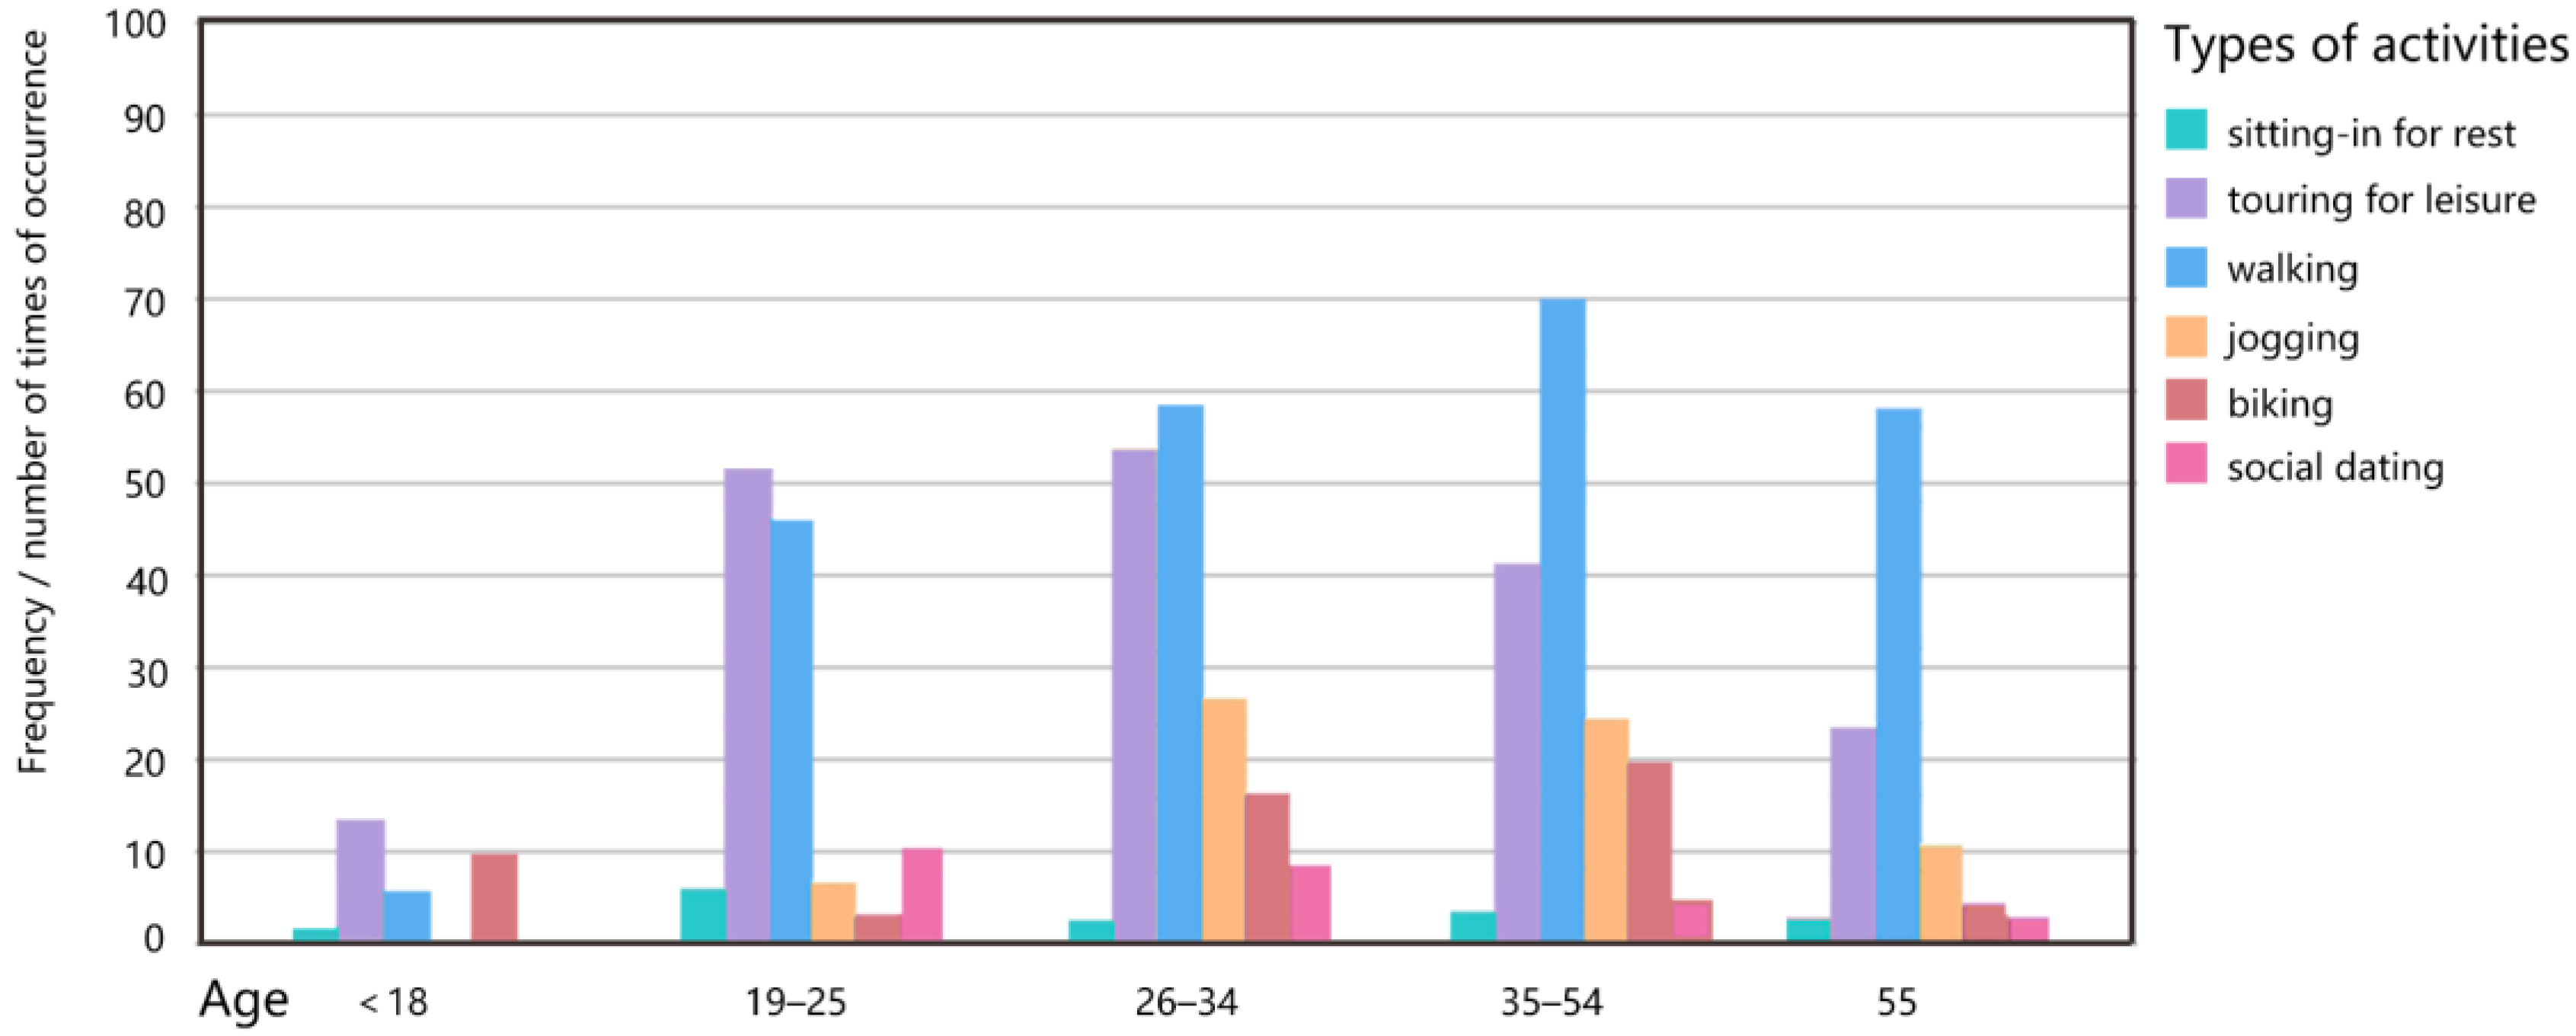
3.3.2. Crowd Behavior and Activities Analysis
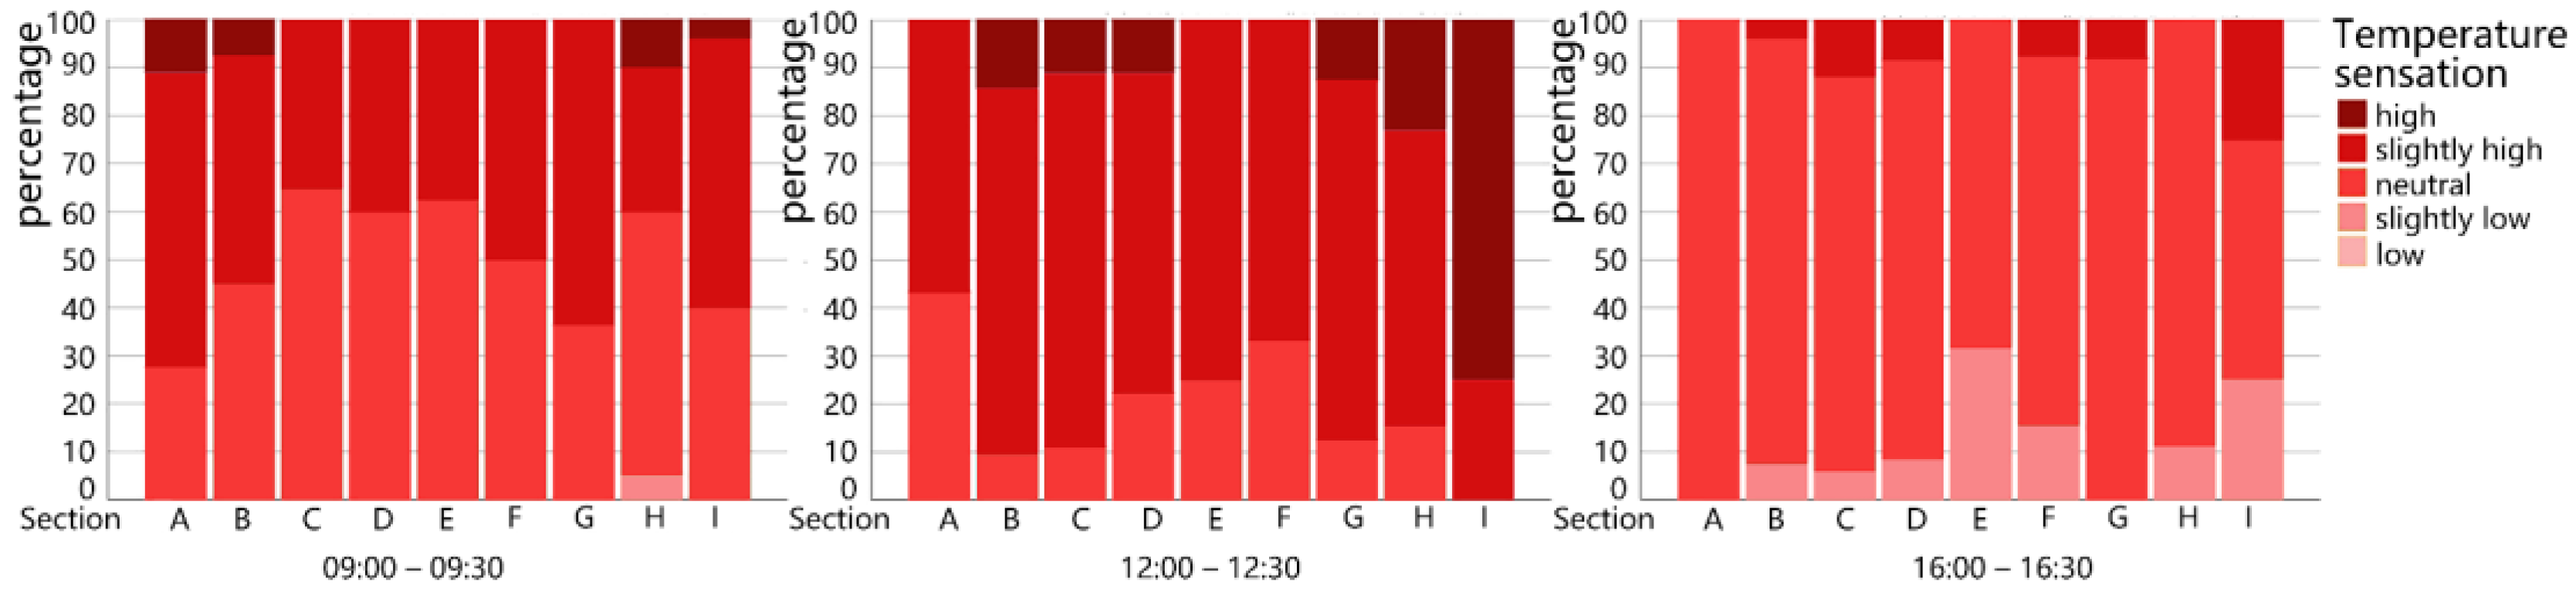
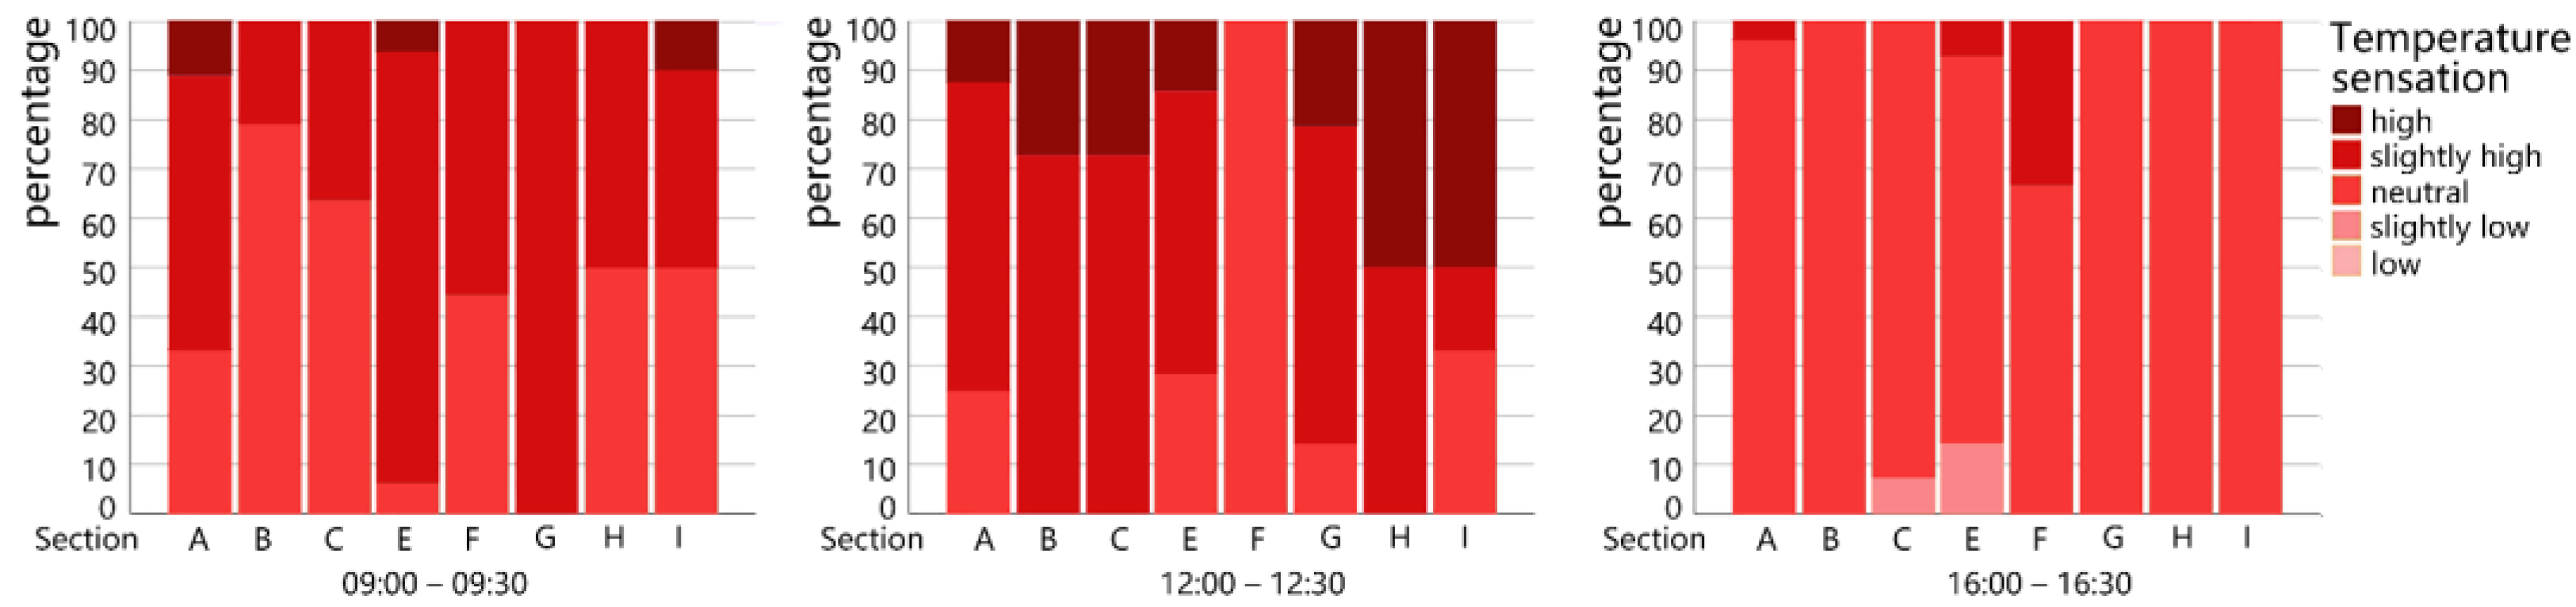
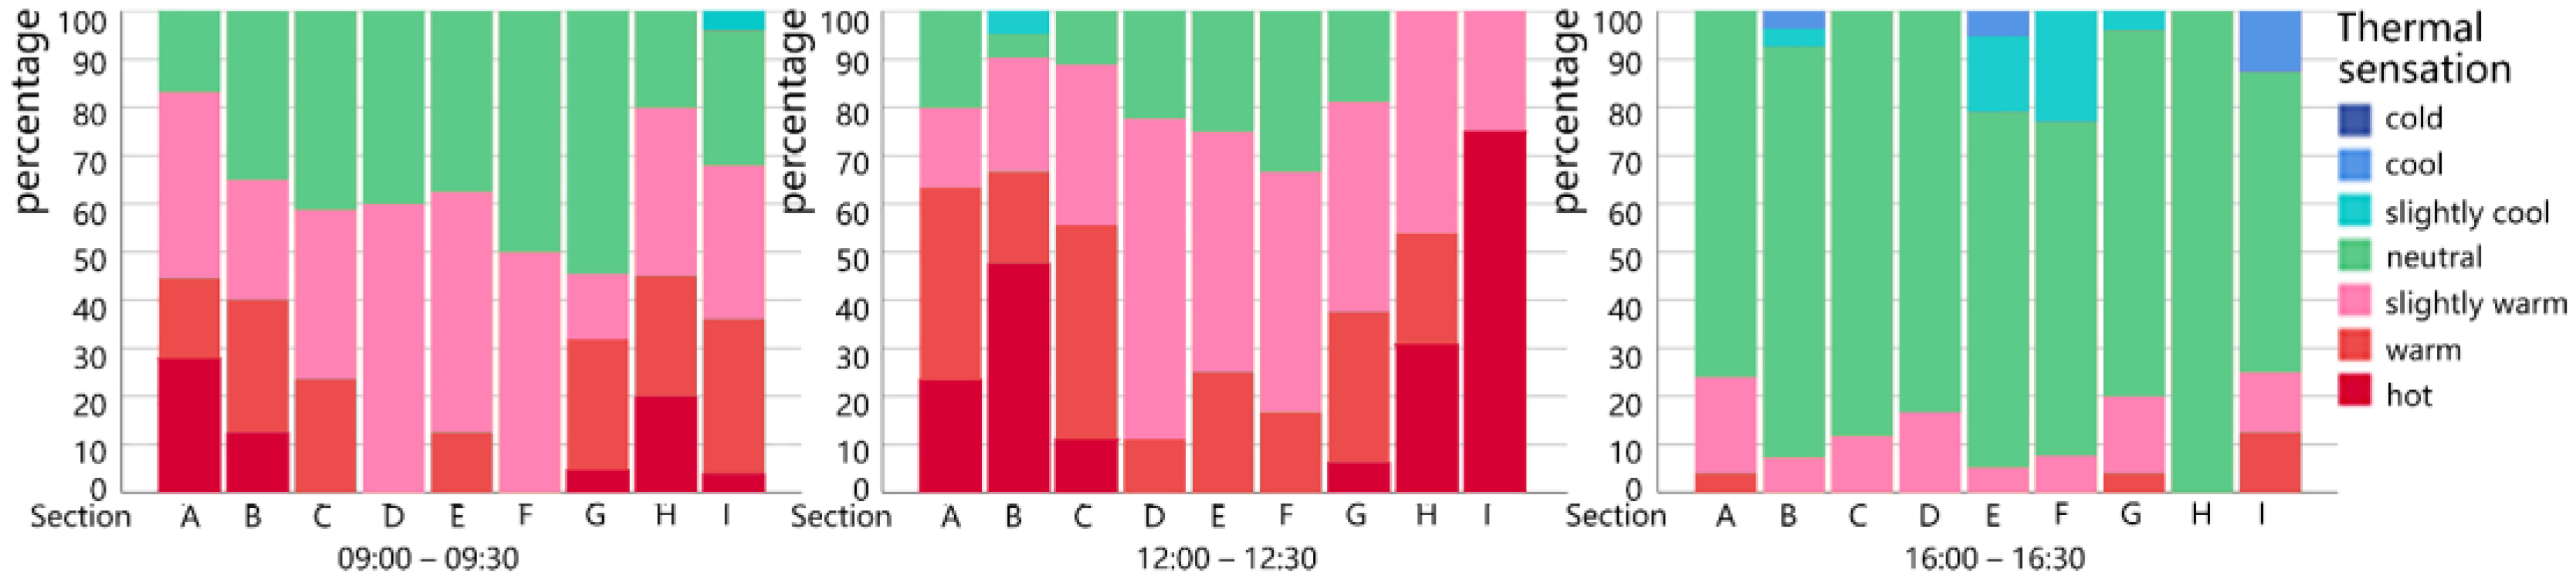
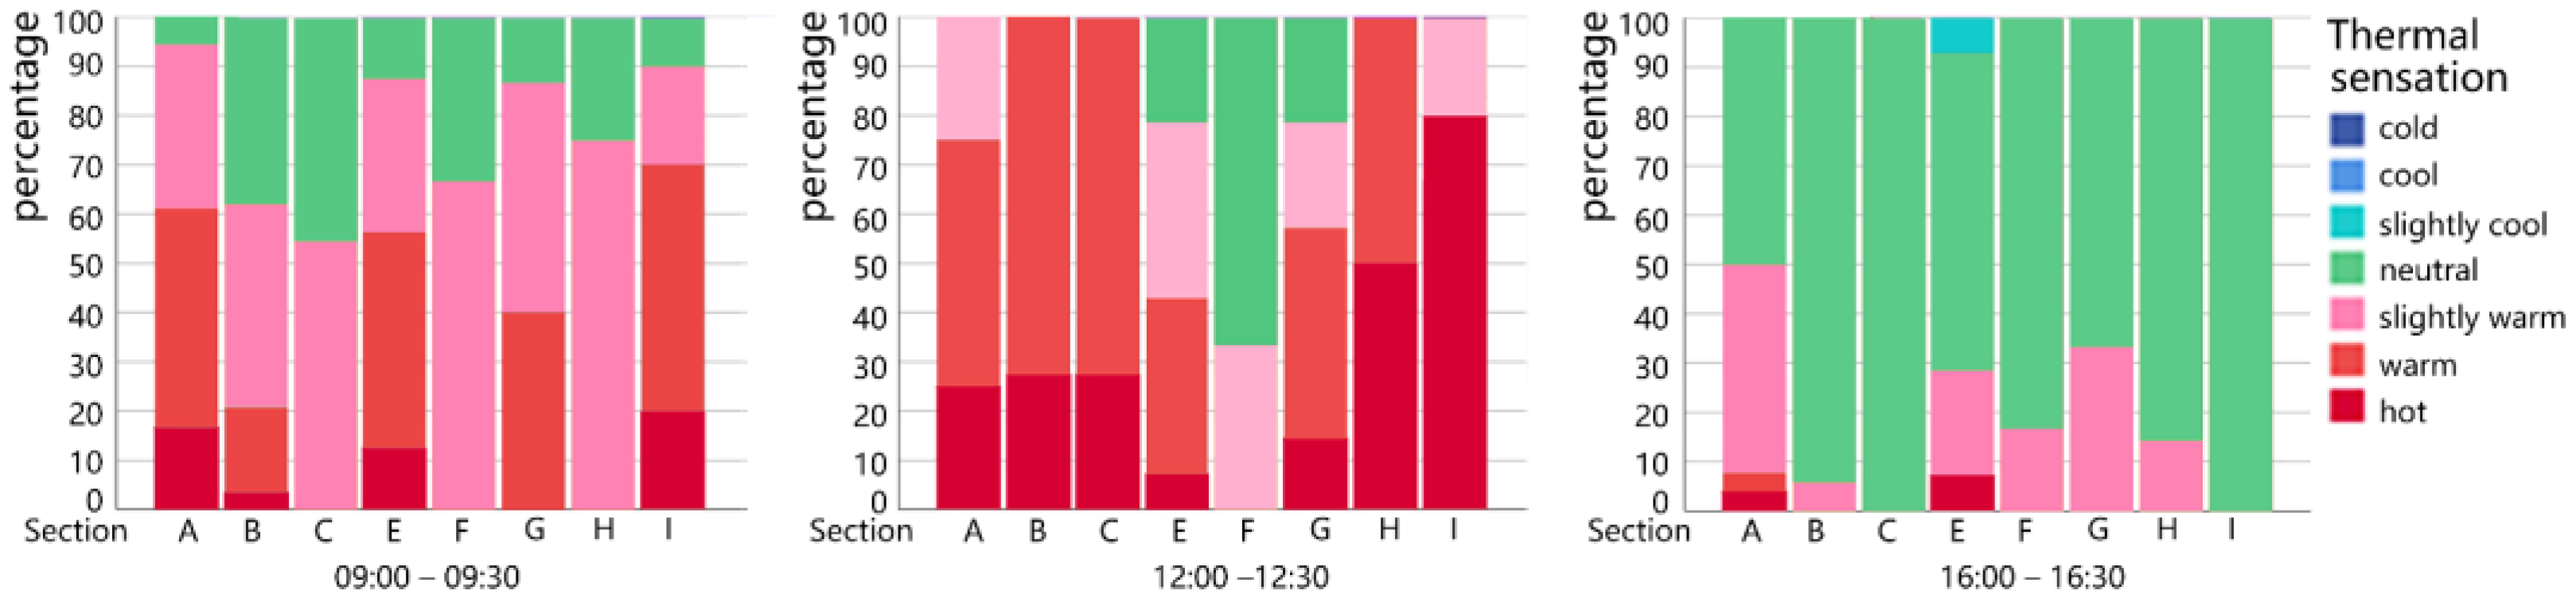
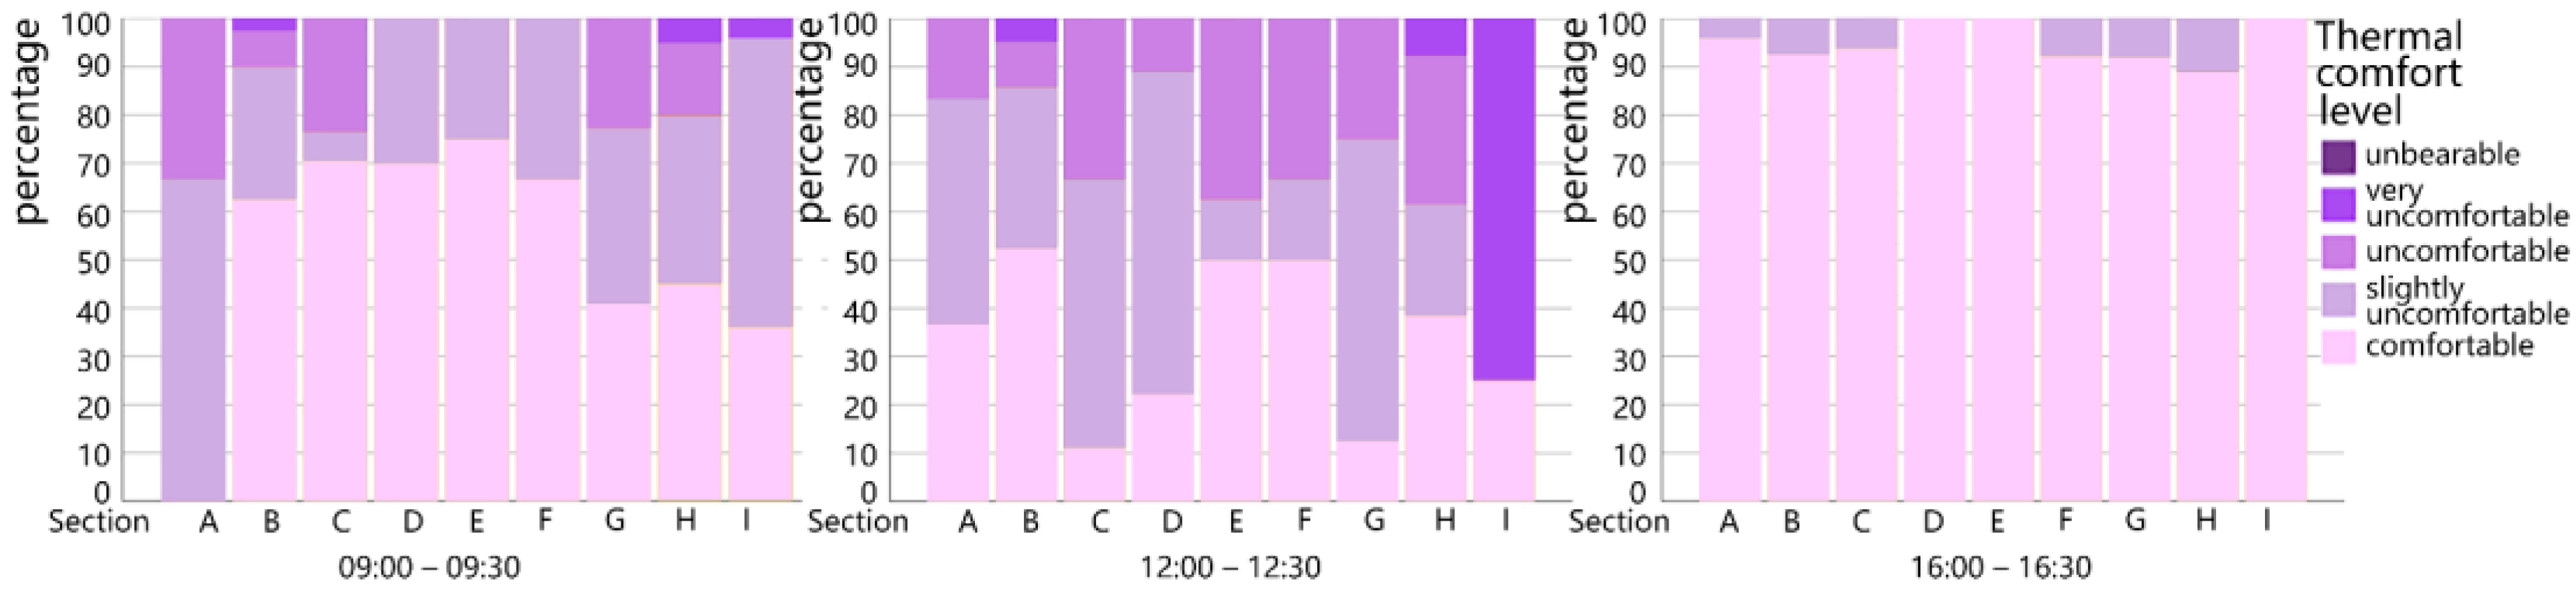
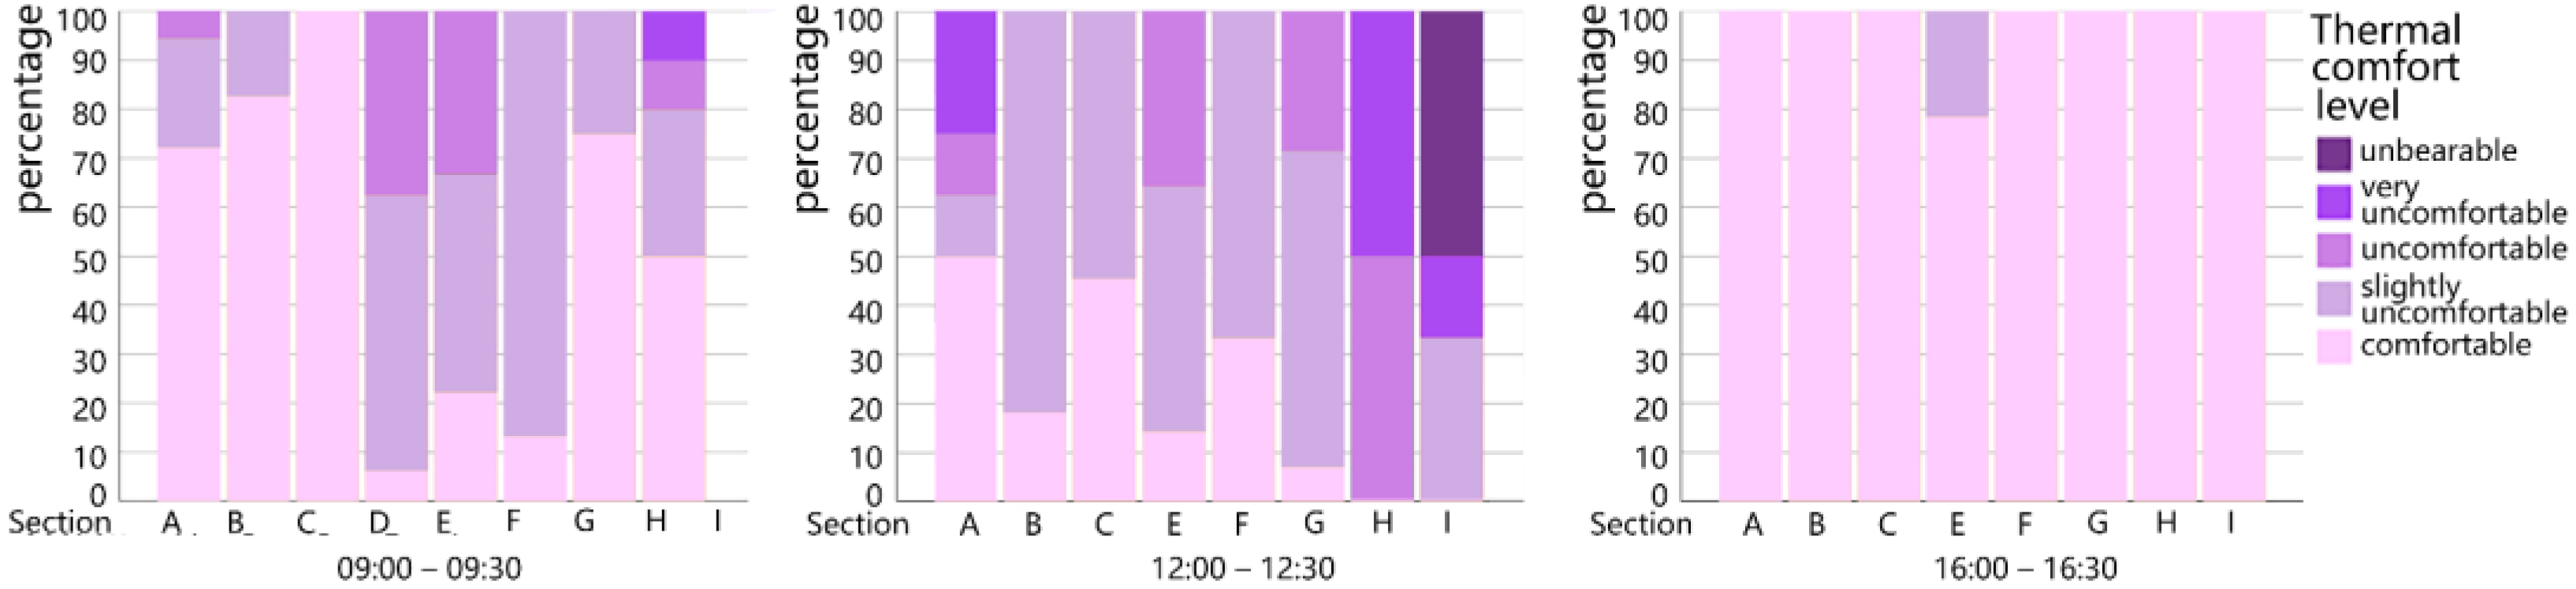
3.3.3. Results of Sensation Votes and Thermal Comfort Votes
Correlation Analysis of Votes with Types of Activities, Age and Gender
Correlation Analysis of Vegetation Coverage, Paved Area Coverage with Thermal Sensation Votes, Thermal Comfort Votes
4. Discussion
4.1. Summary of the Microclimate Measurement and Thermal Comfort Vote
4.2. Comparison with Previous Studies
4.3. New Insights on the Implications for Landscape and Urban Planning
4.4. Shortcomings and Outlooks
Author Contributions
Funding
Institutional Review Board Statement
Informed Consent Statement
Data Availability Statement
Acknowledgments
Conflicts of Interest
Appendix A

| Section No. | A | B | C | D | E | F | G | H | I |
|---|---|---|---|---|---|---|---|---|---|
| Average Air Temperature | 28.06 | 27.73 | 27.93 | 28.52 | 28.81 | 28.76 | 29.08 | 28.93 | 29.05 |
| Average Relative Humidity | 78.12 | 77.97 | 77.93 | 76.74 | 73.58 | 73.52 | 73.79 | 73.42 | 72.62 |
| Average Wind Speed | 0.68 | 1.18 | 1.02 | 0.62 | 0.35 | 1.10 | 0.45 | 0.60 | 0.77 |
| Average Solar Radiation | 433.93 | 446.59 | 577.56 | 565.49 | 640.23 | 578.57 | 541.14 | 467.46 | 518.24 |
| Section No. | A | B | C | D | E | F | G | H | I |
|---|---|---|---|---|---|---|---|---|---|
| Average Air Temperature | 30.77 | 30.67 | 30.35 | 30.49 | 29.73 | 29.82 | 29.18 | 29.96 | 29.71 |
| Average Relative Humidity | 69.46 | 69.75 | 71.70 | 69.61 | 70.67 | 70.74 | 74.01 | 70.78 | 71.32 |
| Average Wind Speed | 0.71 | 1.14 | 0.63 | 0.78 | 0.75 | 1.11 | 1.05 | 0.80 | 0.96 |
| Average Solar Radiation | 563.23 | 644.98 | 617.54 | 575.71 | 593.77 | 559.49 | 593.53 | 634.49 | 625.40 |
| Section No. | A | B | C | D | E | F | G | H | I |
|---|---|---|---|---|---|---|---|---|---|
| Average Air Temperature | 27.81 | 27.44 | 27.47 | 27.31 | 27.14 | 27.15 | 27.10 | 27.26 | 27.38 |
| Average Relative Humidity | 78.32 | 79.26 | 79.60 | 79.61 | 80.47 | 80.67 | 81.12 | 80.48 | 80.23 |
| Average Wind Speed | 0.68 | 1.18 | 1.02 | 0.62 | 0.35 | 1.10 | 0.45 | 0.60 | 0.77 |
| Average Solar Radiation | 98.91 | 114.08 | 130.25 | 109.93 | 118.78 | 140.44 | 131.77 | 96.58 | 111.60 |
| Name of Options in Rayman | Data Content | Detailed Parameters |
|---|---|---|
| Data and time | The time and date of the measurement | 9:00–9:30, 12:00–12:30, 16:00–16:30; 9.11–9.12, 2021 |
| Geographic data | Latitude, longitude, time zone of the site | 121°26′ 31°12′ UTC + 8 Asia/China |
| Current data | Air temperature, relative humidity, wind speed, solar radiation | Table A1, Table A2 and Table A3 |
| Personal data | Height, weight, age, gender | 1.75 m, 75 kg, 35, male |
| Clothing and activity | Clothing thermal resistance, metabolic rate of activities | 0.5 80 |
Appendix B


Appendix C

References
- Manley, G. On the frequency of snowfall in metropolitan England. Q. J. R. Meteorol. Soc. 1958, 84, 70–72. [Google Scholar] [CrossRef]
- Aram, F.; Solgi, E.; Garcia, E.H.; Mosavi, A. Urban heat resilience at the time of global warming: Evaluating the impact of the urban parks on outdoor thermal comfort. Environ. Sci. Eur. 2020, 32, 1–15. [Google Scholar] [CrossRef]
- Wong, L.P.; Alias, H.; Aghamohammadi, N.; Aghazadeh, S.; Sulaiman, N.M.N. Physical, Psychological, and Social Health Impact of Temperature Rise Due to Urban Heat Island Phenomenon and Its Associated Factors. Biomed. Environ. Sci. 2018, 31, 545–550. [Google Scholar]
- Zhu, D.; Zhou, Q.; Liu, M.; Bi, J. Non-optimum temperature-related mortality burden in China: Addressing the dual influences of climate change and urban heat islands. Sci. Total Environ. 2021, 782, 146760. [Google Scholar] [CrossRef]
- Kim, S.; Yoon, S. The Correlation between Outdoor Temperature Distributionand Urban Structure in the Costal City. Korean Soc. Living Environ. Syst. 2007, 14, 313–319. [Google Scholar]
- Marzouk, M.; Attia, K.; Azab, S. Assessment of Coastal Vulnerability to Climate Change Impacts using GIS and Remote Sensing: A Case Study of Al-Alamein New City. J. Clean. Prod. 2021, 290, 125723. [Google Scholar] [CrossRef]
- Yeo, I.; Yee, J.J.; Yoon, S. An Analysis of Urban Temperature and Air-Conditioning Energy Characteristics by Eco-Friendly Urban Planning. J. Archit. Inst. Korea Plan. Des. 2010, 26, 255–265. [Google Scholar]
- Pascal, M.; Goria, S.; Wagner, V.; Sabastia, M.; Guillet, A.; Cordeau, E.; Mauclair, C.; Host, S. Greening is a promising but likely insufficient adaptation strategy to limit the health impacts of extreme heat. Environ. Int. 2021, 151, 106441. [Google Scholar] [CrossRef]
- Huang, H.; Yang, H.; Chen, Y.; Chen, T.; Bai, L.; Peng, Z.R. Urban green space optimization based on a climate health risk appraisal–A case study of Beijing city, China. Urban For. Urban Green. 2021, 62, 127154. [Google Scholar] [CrossRef]
- Marando, F.; Salvatori, E.; Sebastiani, A.; Fusaro, L.; Manes, F. Regulating Ecosystem Services and Green Infrastructure: Assessment of Urban Heat Island effect mitigation in the municipality of Rome, Italy. Ecol. Model. 2019, 392, 92–102. [Google Scholar] [CrossRef]
- Elliott, H.; Eon, C.; Breadsell, J.K. Improving City Vitality through Urban Heat Reduction with Green Infrastructure and Design Solutions: A Systematic Literature Review. Buildings 2020, 10, 219. [Google Scholar] [CrossRef]
- Duan, J.; Wang, Y.; Fan, C.; Xia, B.; De Groot, R. Perception of Urban Environmental Risks and the Effects of Urban Green Infrastructures (UGIs) on Human Well-being in Four Public Green Spaces of Guangzhou, China. Environ. Manag. 2018, 62, 500–517. [Google Scholar] [CrossRef] [PubMed]
- Linehan, J.; Gross, M.; Finn, J. Greenway planning: Developing a landscape ecological network approach. Landsc. Urban Plan. 1995, 33, 179–193. [Google Scholar] [CrossRef]
- Bryant, M.M. Urban landscape conservation and the role of ecological greenways at local and metropolitan scales. Landsc. Urban Plan. 2006, 76, 23–44. [Google Scholar] [CrossRef]
- Smith, D.S.; Hellmund, P.C. Ecology of Greenways: Design and Function of Linear Conservation Areas, 1st ed.; University of Minnesota Pr: Minneapolis, MN, USA, 1993. [Google Scholar]
- Lee, J.; Kweon, B.-S.; Ellis, C.D.; Lee, S.-W. Assessing the Social Value of Ecosystem Services for Resilient Riparian Greenway Planning and Management in an Urban Community. Int. J. Environ. Res. Public Health 2020, 17, 3261. [Google Scholar] [CrossRef]
- Wu, J.Y. Conservation of Agriculture Landscape through Greenway Planning and Design: A Case Study of the Wax Gourd Production Base of Xiaolou Town, Zengcheng (Guangdong). Adv. Mater. Res. 2013, 869-870, 235–238. [Google Scholar] [CrossRef]
- Wu, J.Y.; Xie, C. Analysis and Evaluation of Guangzhou Zengcheng Greenway. In Proceedings of the 2012 World Automation Congress (WAC), Puerto Vallarta, Mexico, 24–28 June 2012. [Google Scholar]
- Hong, L.P.; Hua, X. Greenway as a New Path for the Exploration of Urban-Rural Coordinate based on a Low-Carbon Model: A Case Study of Greenway Planning and Construction in Dongguan, Guangdong province (China). In Proceedings of the 49th Isocarp Congress: Frontiers of Planning—Evolving and Declining Models of Planning Practice, Brisbane, Australia, 1–4 October 2013; pp. 1188–1200. [Google Scholar]
- Liu, Z.; Lin, Y.; De Meulder, B.; Wang, S. Can greenways perform as a new planning strategy in the Pearl River Delta, China? Landsc. Urban Plan. 2019, 187, 81–95. [Google Scholar] [CrossRef]
- Chi, W.; Lin, G. The Use of Community Greenways: A Case Study on A Linear Greenway Space in High Dense Residential Areas, Guangzhou. Land 2019, 8, 188. [Google Scholar] [CrossRef] [Green Version]
- Leconte, F.; Bouyer, J.; Claverie, R.; Pétrissans, M. Using Local Climate Zone scheme for UHI assessment: Evaluation of the method using mobile measurements. Build. Environ. 2015, 83, 39–49. [Google Scholar] [CrossRef]
- Stewart, I.D.; Oke, T.R.; Krayenhoff, E.S. Evaluation of the ‘local climate zone’ scheme using temperature observations and model simulations. Int. J. Climatol. 2014, 34, 1062–1080. [Google Scholar] [CrossRef]
- Sundborg, A. Climatological Studies in Uppsala with Special Regard to the Temperature Conditions in the Urban Area; Geographical Institute of Uppsala: Geographica, Japan, 1951. [Google Scholar]
- Qaid, A.; Bin Lamit, H.; Ossen, D.R.; Shahminan, R.N.R. Urban heat island and thermal comfort conditions at micro-climate scale in a tropical planned city. Energy Build. 2016, 133, 577–595. [Google Scholar] [CrossRef]
- Zaki, S.; Azid, N.; Shahidan, M.; Hassan, M.; Daud, M.M.; Abu Bakar, N.; Salim, S.A.Z.S.; Yakub, F. Analysis of Urban Morphological Effect on the Microclimate of the Urban Residential Area of Kampung Baru in Kuala Lumpur Using a Geospatial Approach. Sustainability 2020, 12, 7301. [Google Scholar] [CrossRef]
- Tondini, S.; Hasanabadi, F.; Monsorno, R.; Novelli, A. Toward Near Real-Time Kinematics Differential Correction: In View of Geometrically Augmented Sensor Data for Mobile Microclimate Monitoring. Eng. Proc. 2020, 2, 61. [Google Scholar]
- Chan, S.Y.; Chau, C.K. On the study of the effects of microclimate and park and surrounding building configuration on thermal comfort in urban parks. Sustain. Cities Soc. 2021, 64, 102512. [Google Scholar] [CrossRef]
- He, B.-J.; Ding, L.; Prasad, D. Urban ventilation and its potential for local warming mitigation: A field experiment in an open low-rise gridiron precinct. Sustain. Cities Soc. 2020, 55, 102028. [Google Scholar] [CrossRef]
- Höppe, P. The physiological equivalent temperature–A universal index for the biometeorological assessment of the thermal environment. Int. J. Biometeorol. 1999, 43, 71–75. [Google Scholar] [CrossRef] [PubMed]
- Fiala, D.; Havenith, G.; Bröde, P.; Kampmann, B.; Jendritzky, G. UTCI-Fiala multi-node model of human heat transfer and temperature regulation. Int. J. Biometeorol. 2011, 56, 429–441. [Google Scholar] [CrossRef] [PubMed] [Green Version]
- Chen, Q.; Lin, C.; Guo, D.; Hou, Y.; Lai, D. Studies of outdoor thermal comfort in northern China. Build. Environ. 2014, 77, 110–118. [Google Scholar] [CrossRef]
- Huang, J.; Zhou, C.; Zhuo, Y.; Xu, L.; Jiang, Y. Outdoor thermal environments and activities in open space: An experiment study in humid subtropical climates. Build. Environ. 2016, 103, 238–249. [Google Scholar] [CrossRef] [Green Version]
- Fang, Z.; Feng, X.; Liu, A.J.; Lin, Z.; Mak, C.M.; Niu, J.; Tse, K.-T.; Xu, X. Investigation into the differences among several outdoor thermal comfort indices against field survey in subtropics. Sustain. Cities Soc. 2019, 44, 676–690. [Google Scholar] [CrossRef]
- Xu, M.; Hong, B.; Jiang, R.; An, L.; Zhang, T. Outdoor thermal comfort of shaded spaces in an urban park in the cold region of China. Build. Environ. 2019, 155, 408–420. [Google Scholar] [CrossRef]
- Zaki, S.A.; Othman, N.E.; Syahidah, S.W.; Yakub, F.; Muhammad-Sukki, F.; Ardila-Rey, J.A.; Shahidan, M.F.; Saudi, A.S.M. Effects of Urban Morphology on Microclimate Parameters in an Urban University Campus. Sustainability 2020, 12, 2962. [Google Scholar] [CrossRef] [Green Version]
- Matzarakis, A.; Fröhlich, D. Influence of urban green on human thermal bioclimate—Application of thermal indices and micro-scale models. Acta Hortic. 2018, 1–10. [Google Scholar] [CrossRef]
- Li, W.; Ouyang, Z.; Meng, X.; Wang, X. Plant species composition in relation to green cover configuration and function of urban parks in Beijing, China. Ecol. Res. 2006, 21, 221–237. [Google Scholar] [CrossRef]
- Pigliautile, I.; Pisello, A. Environmental data clustering analysis through wearable sensing techniques: New bottom-up process aimed to identify intra-urban granular morphologies from pedestrian transects. Build. Environ. 2020, 171, 106641. [Google Scholar] [CrossRef]
- Colter, K.; Middel, A.; Martin, C. Effects of natural and artificial shade on human thermal comfort in residential neighborhood parks of Phoenix, Arizona, USA. Urban For. Urban Green. 2019, 44, 44. [Google Scholar] [CrossRef]
- Davtalab, J.; Deyhimi, S.P.; Dessi, V.; Hafezi, M.R.; Adib, M. The impact of green space structure on physiological equivalent temperature index in open space. Urban Clim. 2020, 31, 100574. [Google Scholar] [CrossRef]
- Ali, S.B.; Patnaik, S. Thermal comfort in urban open spaces: Objective assessment and subjective perception study in tropical city of Bhopal, India. Urban Clim. 2018, 24, 954–967. [Google Scholar] [CrossRef]
- Lin, W.; Zeng, C.; Lam, N.S.-N.; Liu, Z.; Tao, J.; Zhang, X.; Lyu, B.; Li, N.; Li, D.; Chen, Q. Study of the relationship between the spatial structure and thermal comfort of a pure forest with four distinct seasons at the microscale level. Urban For. Urban Green. 2021, 62, 127168. [Google Scholar] [CrossRef]
- Morakinyo, T.E.; Kong, L.; Lau KK, L.; Yuan, C.; Ng, E. A study on the impact of shadow-cast and tree species on in-canyon and neighborhood’s thermal comfort. Build. Environ. 2017, 115, 1–17. [Google Scholar] [CrossRef]


| Section No. | A | B | C | D | E | F | G | H | I |
|---|---|---|---|---|---|---|---|---|---|
| Vegetation Coverage | 0.578 | 0.896 | 0.192 | 0.530 | 0.130 | 0.400 | 0.450 | 0.400 | 0.300 |
| Paved Area Coverage | 0.422 | 0.104 | 0.808 | 0.470 | 0.870 | 0.536 | 0.402 | 0.600 | 0.700 |
| Name | Storage Method | Parameter | Accuracy | Test Range | Unit | Data Output |
|---|---|---|---|---|---|---|
| Kerel NK-5500 handheld weather station | Manual or Automatic | Air temperature | ±1.0 | −29~70 | °C | The screen displays stable data and records automatically. |
| Relative humidity | ±3 | 0~100.0 | % | |||
| Wind speed | ±3 | 0.1~60.0 | m/s | |||
| TES-1333R solar power meter | Manual or Automatic | Solar radiation | ±10 | 0~2000 | W/m2 | The screen displays stable data and records automatically. |
| Spearman | Air Temperature | Relative Humidity | Wind Speed | Solar Radiation | |
|---|---|---|---|---|---|
| Air Temperature | R. | / | −0.855 ** | −0.243 ** | 0.687 ** |
| S. | / | 0.000 | 0.000 | 0.000 | |
| Relative Humidity | R. | −0.855 ** | / | 0.41 * | −0.719 * |
| S. | 0.000 | / | 0.013 | 0.000 | |
| Wind Speed | R. | −0.243 ** | −0.41 * | / | −0.101 ** |
| S. | 0.030 | 0.013 | / | 0.000 | |
| Solar Radiation | R. | −0.687 ** | −0.719 ** | −1.01 ** | / |
| S. | 0.000 | 0.000 | 0.000 | / |
| 09:00–09:30 | 12:00–12:30 | 16:00–16:30 | |||||||||
|---|---|---|---|---|---|---|---|---|---|---|---|
| Spearman | PET | UTCI | Spearman | PET | UTCI | Spearman | PET | UTCI | |||
| Vegetation Coverage | R. | −0.494 | −0.510 | Vegetation Coverage | R. | −0.326 * | −0.552 | Vegetation Coverage | R. | −0.647 | −0.706 * |
| S. | 0.177 | 0.160 | S. | 0.391 | 0.123 | S. | 0.06 | 0.034 | |||
| 09:00–09:30 | 12:00–12:30 | 16:00–16:30 | |||||||||
|---|---|---|---|---|---|---|---|---|---|---|---|
| Spearman | PET | UTCI | Spearman | PET | UTCI | Spearman | PET | UTCI | |||
| Paved Areas | R. | 0.367 | 0.367 | Paved Areas | R. | 0.500 | 0.683 * | Paved Areas | R. | 0.561 | 0.644 |
| S. | 0.332 | 0.332 | S. | 0.170 | 0.042 | S. | 0.116 | 0.061 | |||
| 09:00–09:30 | |||||
|---|---|---|---|---|---|
| Spearman | Air Temperature | Relative Humidity | Wind Speed | Solar Radiation | |
| PET | R. | 0.717 * | −0.483 | −0.733 * | 0.650 |
| S. | 0.030 | −0.035 | 0.025 | 0.058 | |
| UTCI | R. | 0.583 | 0.350 | −0.633 | 0.783 * |
| S. | 0.099 | 0.356 | 0.067 | 0.013 | |
| 12:00–12:30 | |||||
|---|---|---|---|---|---|
| Spearman | Air Temperature | Relative Humidity | Wind Speed | Solar Radiation | |
| PET | R. | 0.633 * | −0.133 | −0.483 | 0.550 |
| S. | 0.067 | −0.732 | 0.187 | 0.125 | |
| UTCI | R. | 0.717 * | −0.117 | −0.267 | 0.417 |
| S. | 0.030 | 0.765 | 0.488 | 0.265 | |
| 16:00–16:30 | |||||
|---|---|---|---|---|---|
| Spearman | Air Temperature | Relative Humidity | Wind Speed | Solar Radiation | |
| PET | R. | 0.319 | −0.226 | −0.924 ** | 0.109 |
| S. | 0.402 | −0.035 | 0.000 | 0.058 | |
| UTCI | R. | 0.395 | −0.268 | −0.966 ** | −0.050 |
| S. | 0.293 | 0.486 | 0.000 | 0.013 | |
| Spearman | Thermal Sensation | Thermal Comfort | |
|---|---|---|---|
| Vegetation Coverage | R. | 0.072 | 0.077 * |
| S. | 0.055 | 0.038 |
| Spearman | Thermal Sensation | Thermal Comfort | |
|---|---|---|---|
| Paved Area | R. | −0.049 | −0.041 |
| S. | 0.190 | 0.268 |
Publisher’s Note: MDPI stays neutral with regard to jurisdictional claims in published maps and institutional affiliations. |
© 2022 by the authors. Licensee MDPI, Basel, Switzerland. This article is an open access article distributed under the terms and conditions of the Creative Commons Attribution (CC BY) license (https://creativecommons.org/licenses/by/4.0/).
Share and Cite
Cong, Y.; Zhu, R.; Yang, L.; Zhang, X.; Liu, Y.; Meng, X.; Gao, W. Correlation Analysis of Thermal Comfort and Landscape Characteristics: A Case Study of the Coastal Greenway in Qingdao, China. Buildings 2022, 12, 541. https://doi.org/10.3390/buildings12050541
Cong Y, Zhu R, Yang L, Zhang X, Liu Y, Meng X, Gao W. Correlation Analysis of Thermal Comfort and Landscape Characteristics: A Case Study of the Coastal Greenway in Qingdao, China. Buildings. 2022; 12(5):541. https://doi.org/10.3390/buildings12050541
Chicago/Turabian StyleCong, Yu, Ruirui Zhu, Lei Yang, Xiaotong Zhang, Yibin Liu, Xi Meng, and Weijun Gao. 2022. "Correlation Analysis of Thermal Comfort and Landscape Characteristics: A Case Study of the Coastal Greenway in Qingdao, China" Buildings 12, no. 5: 541. https://doi.org/10.3390/buildings12050541