1. Introduction
The urban wind environment is an important part of urban ecosystems. It is very useful to study the effects of wind on mitigating the urban heat island phenomenon, dispersing gaseous pollutants, and the outdoor wind comfort of pedestrians, and thus the outdoor wind comfort is an important indicator of a livable city. Studying the wind comfort and wind adaptation is highly significant for revising wind comfort standards and constructing livable cities [
1,
2,
3,
4].
Research on wind comfort dates back to the 1970s. Relatively famous researchers include Isyumov and Davenport [
5], Hunt et al. [
6], Melbourne [
7], Murakami et al. [
8], Durgin [
9] etc. Among them, Isyumov and Davenport established a full-scale mean wind speed model in the outdoor square, and compared it with the wind tunnel model, and concluded that the two models had 10% consistency. Through wind tunnel experiment, Hunt et al established the influence of what kinds of wind speed, gustiness and variation of wind speed on people’s activities of different intensity. By studying the correlation between peak gust wind speed and mean wind speed, Melbourne proposed the occurrence frequency of average wind speed as an indicator of wind environment assessment. Murakami et al. Through a study of the correlation between local residents’ subjective feelings, wind-induced troubles and wind speed, the evaluation index of acceptable Wind frequency was proposed. Durgin summarized the previous Wind comfort Criteria and defined Equivalent Average Wind speed as the Wind speed indicator to obtain a new Wind comfort criteria. As the Computational Fluid dynamics (CFD) simulation method matures, more and more researchers use methods and models in CFD to study wind environment. Hong et al. [
10] employed an air model in Simulation Platform for Outdoor Thermal Environment (SPOTE), which employed a Standard K-ε model, to analyze the wind effect of urban vegetations; Jacob and Sagaut [
11] operated a Large-eddy simulations based on the Lattice-Boltzmann method and compared with several traditional wind comfort criteria.
The wind comfort Criteria proposed by these studies have the following similarities: Categories of people’s activity and wind speed are commonly used. For people’s activity, there are long periods of standing or sitting, short periods of standing or sitting and walking and for wind speed are, e.g., comfortable, uncomfortable, dangerous or unacceptable, which is based on the human body’s reaction to the wind environment. Peak gust wind speed) and statistic values (e.g., mean wind speed) is the main focus, which is used to make predictions of the occurrence probability of the former by summarizing the range and frequency of the latter.
Apart from the existing wind comfort criteria, recent studies have found that wind comfort differs a lot in various climate zones. For example, the wind chill effect is extra stressed in researches in severely cold regions, which means wind could strengthen the discomfort of "freezing" or even cause frostbite [
12,
13,
14,
15]. In hot and Humid regions, due to high air temperatures and high relative humidity, when the wind speed is two low or two high, this discomfort of “sweltering” or “burning” [
16,
17,
18]. These studies showed that the meteorological parameters in different climate zones, such as air temperature, have an influence on the wind comfort and wind adaptation in humans.
According to the above literature review, authors are inspired to make a research combining subjective wind comfort survey and objective meteorological measurement. The purpose are given below: (1) Xi’an City located in the middle of Guan Zhong Basin in China was selected as the survey site, where the variation of wind speed has long periodicity [
17], the actual wind speed can be best reflected by the average wind speed in a short period of time their surroundings. (2) Meteorological measurement can give a better description to the objective physical environment with relatively simple data acquisition and collation process. The main aims of this study were to investigate the wind comfort and wind adaptation in this region, and to examine the relationships between meteorological parameters and subjective perceptions of the wind environment.
2. Materials and Methods
2.1. Research Site
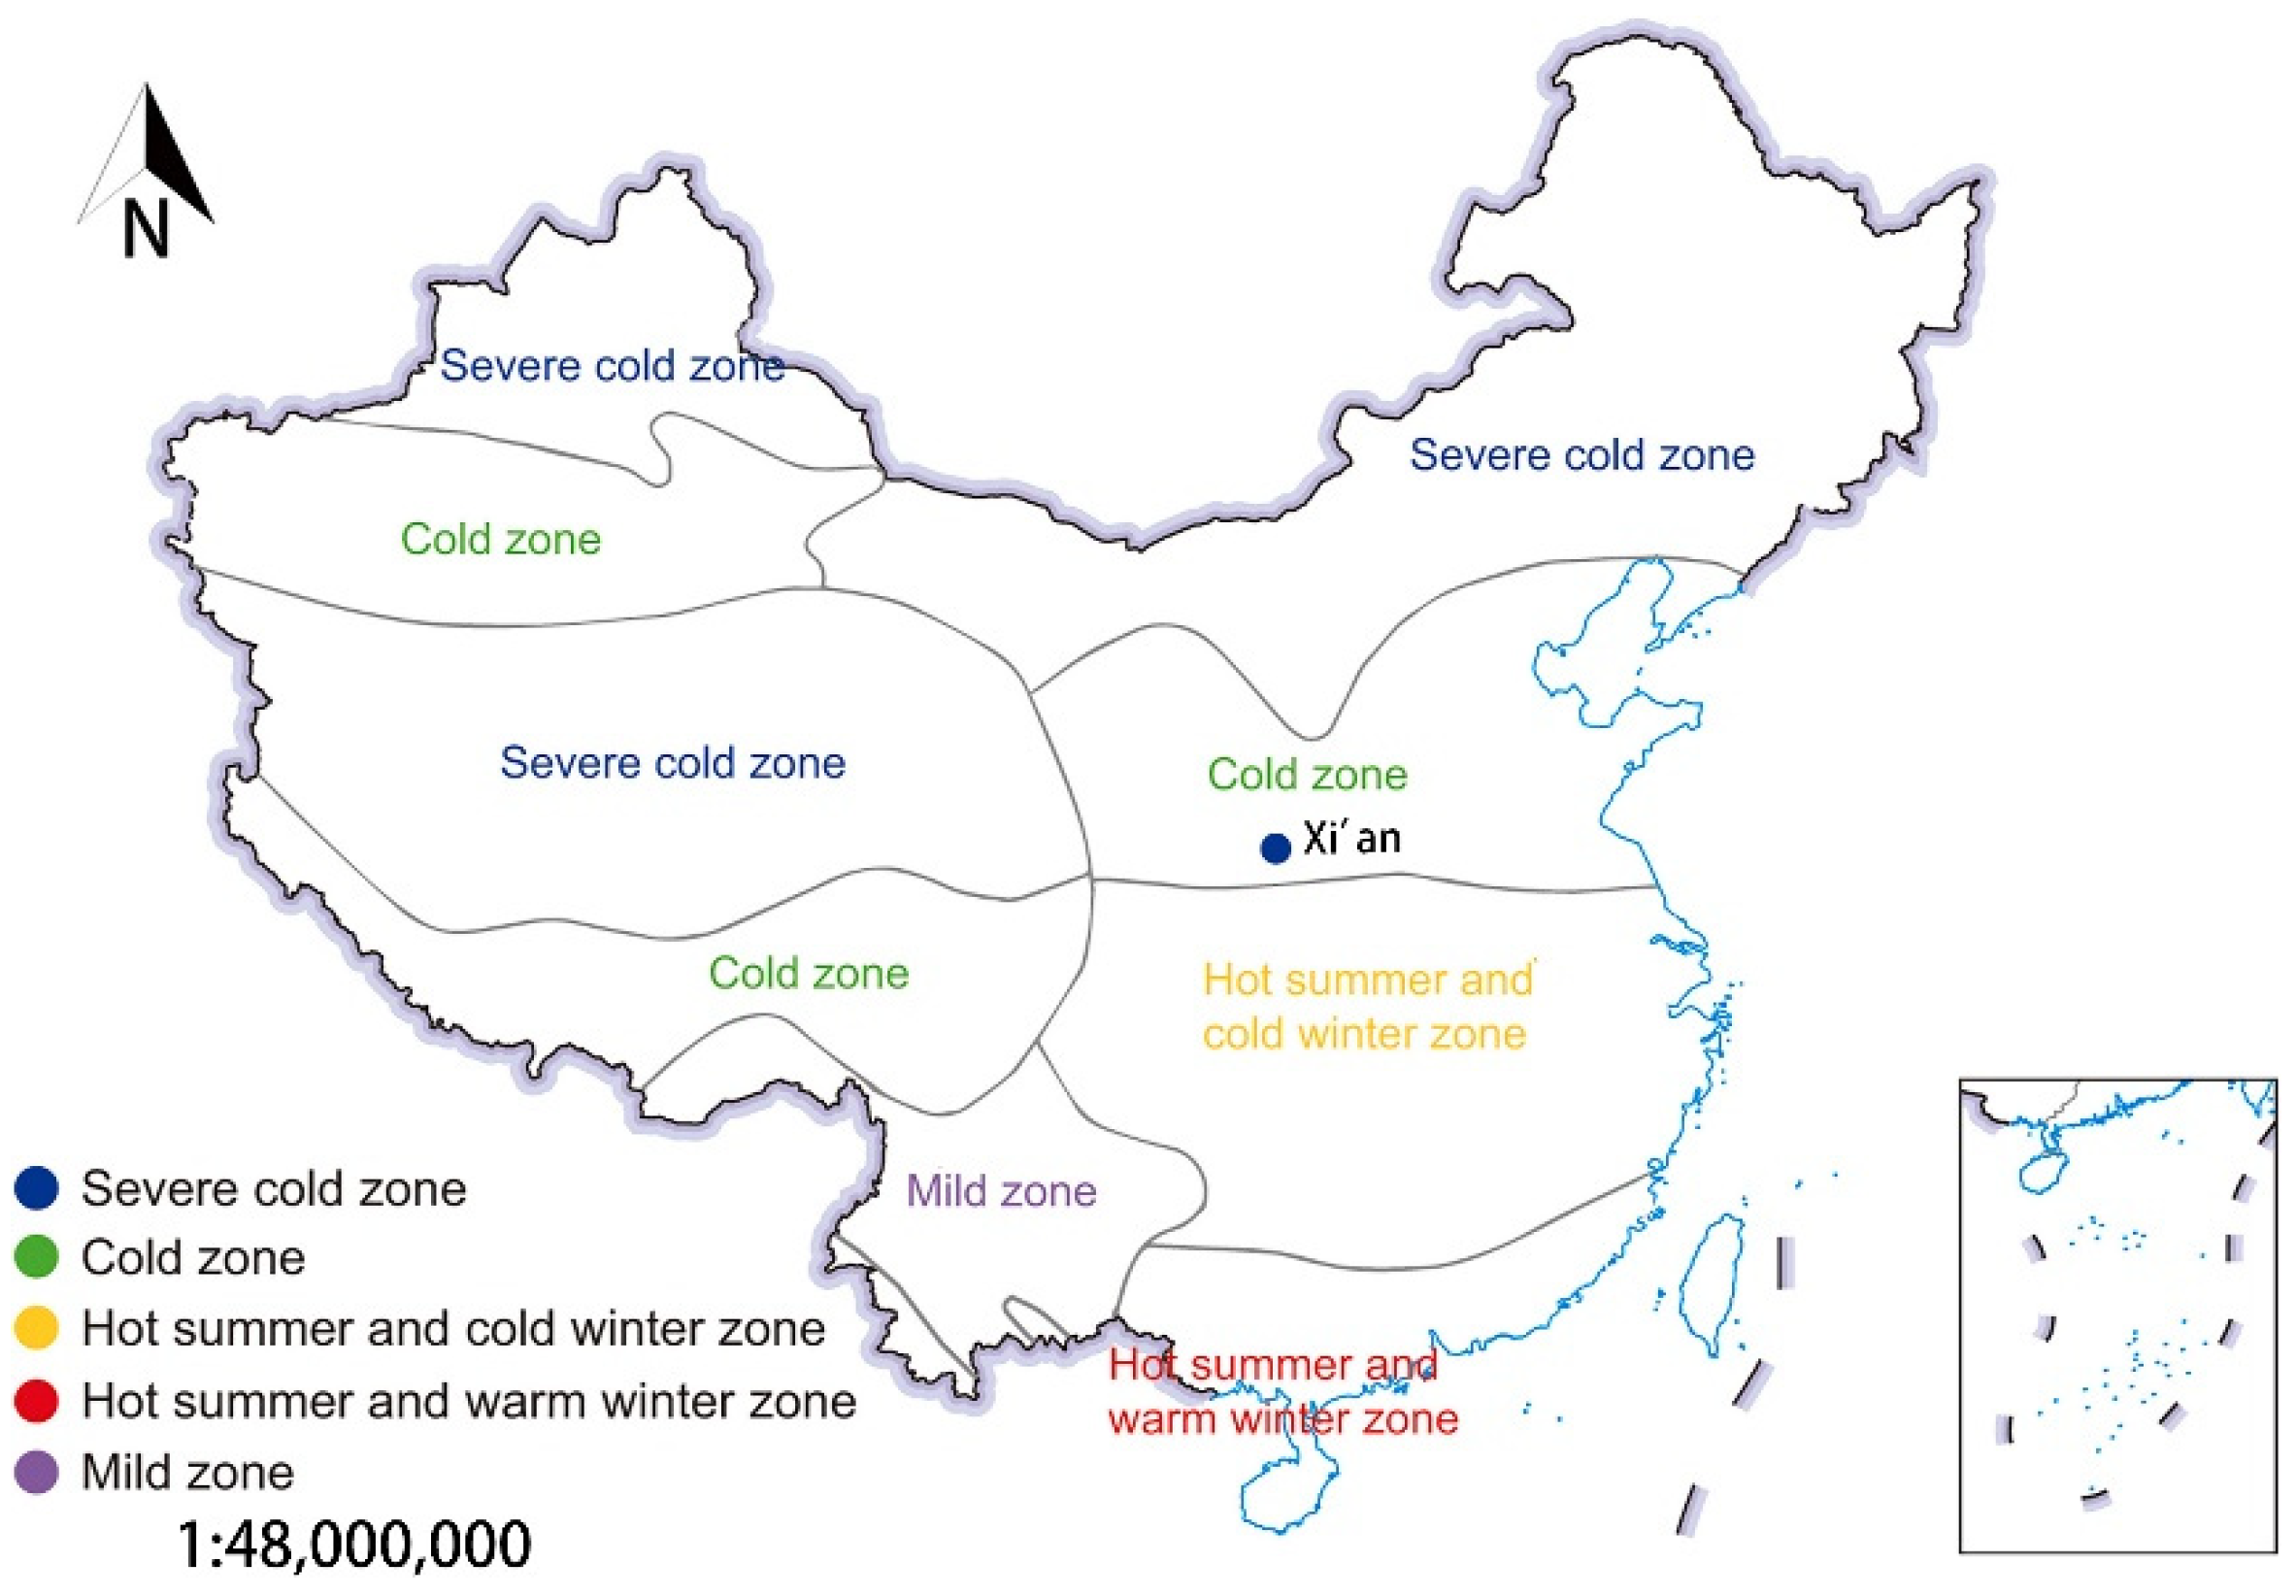
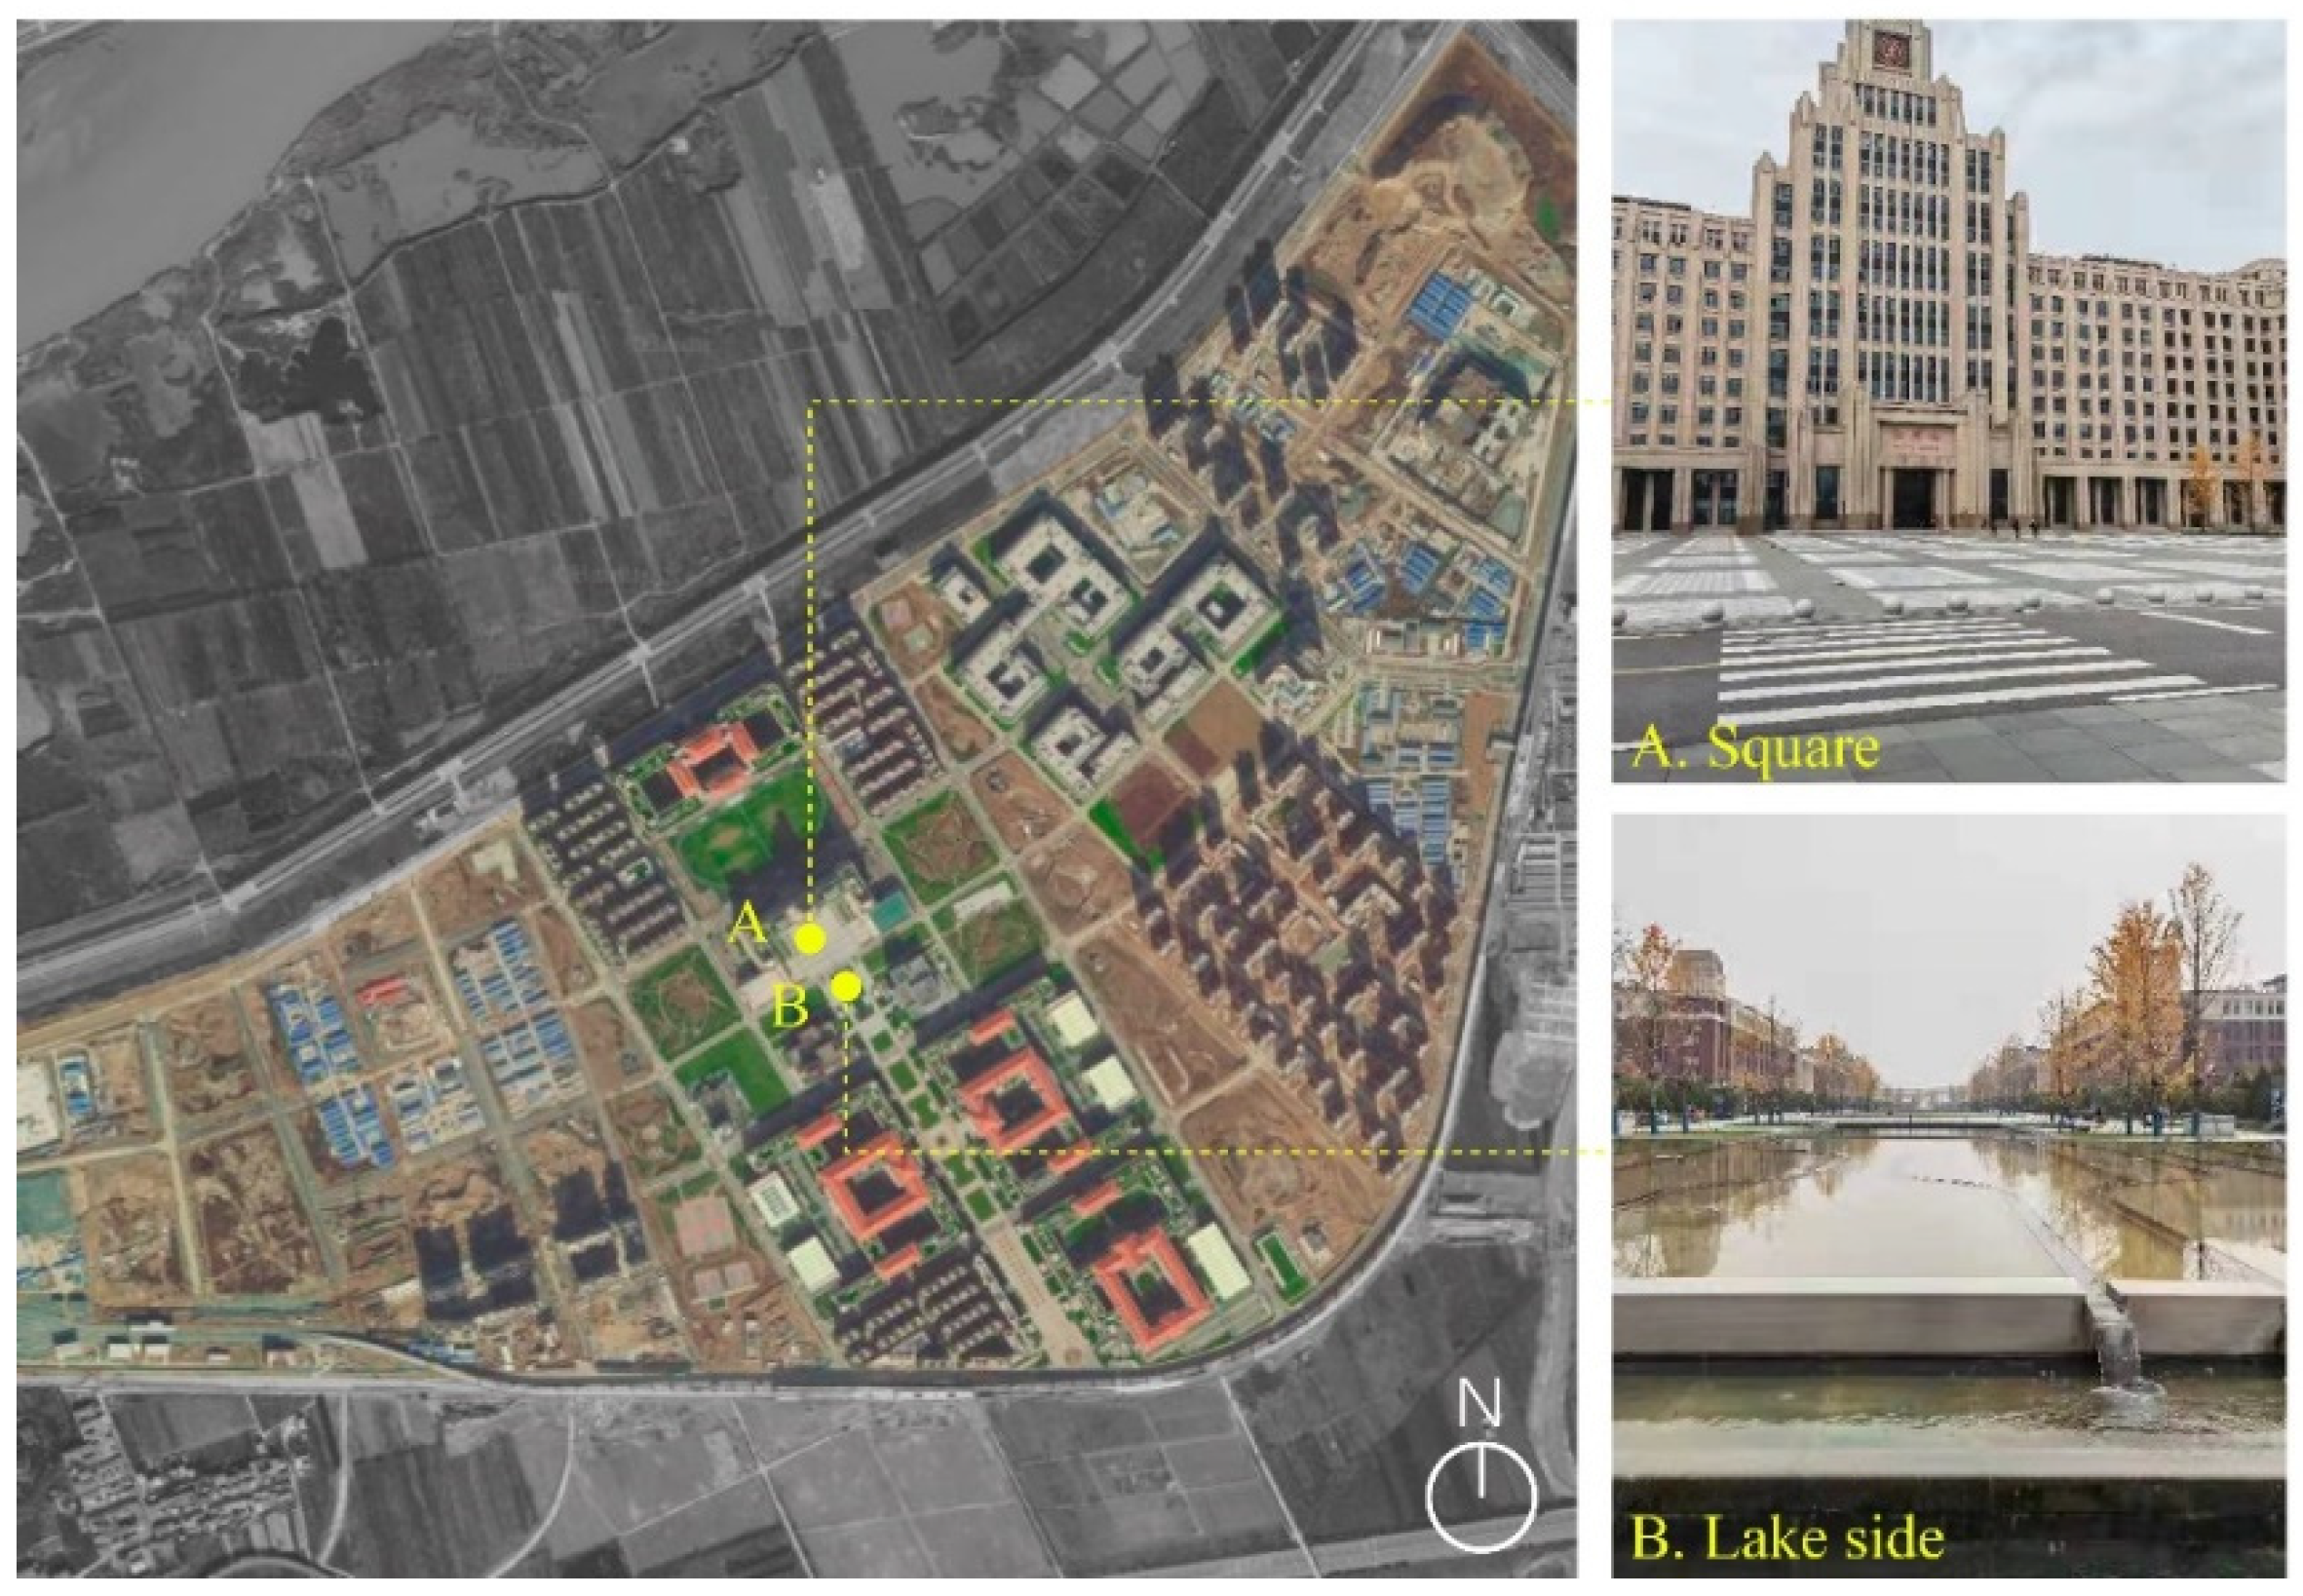
Xi’an (34.26° N, 108.65° E) is the capital city of the northwest province in China and it is located in a cold region (
Figure 1). The research site is the Scientific and Technological Innovation Harbor in Western China, which is located in the periphery of the urban area. The annual mean wind speed in Xi’an is about 2 m/s, and the wind speed is lower in autumn and winter than in spring and summer [
17]. According to typical features and frequency of space usage, two test sites were selected comprising the square and lake side (
Figure 2). The features of these outdoor physical spaces are described in
Table 1.
2.2. Questionnaire Design
The questionnaire contains three parts: (1) Basic information. The basic information collected for the subjects comprised their age, gender, nation, education level, profession, monthly profit, health conditions et al. (2) Outdoor wind perception data. The questions are as follows: (A) What do you think of the wind speed now? (B) Do you think the current wind environment is comfortable? (C) How would you like the wind speed to change now? The corresponding evaluation indexes are wind sensation vote (WSV), wind comfort vote (WCV), and wind expectation vote. WSV was scored using the ASHRAE standard seven-point scale (−3 = very high, −2 = high, −1 = slightly high, 0 = moderate, 1 = slightly low, 2 = low, 3 = very low). WCV was also scored using a seven-point scale (−3 = very uncomfortable, −2 = uncomfortable, −1 = slightly uncomfortable, 0 = moderate, 1 = slightly comfortable, 2 = comfortable, 3 = very comfortable). The wind expectation vote was scored using a three-point scale (−1 = higher, 0 = unchanged, 1 = lower). (3) Investigation environment. The investigator records the survey location, survey time, movement status and dress according to the actual situation, and records the air temperature, humidity, wind speed, global radiation of the current environment according to the measurement instrument. The dress and movement status were converted into clothing insulation and the metabolic rate according to ASHRAE 55-2017 [
18].
2.3. Subjects
The survey began in August 2020 and ended in January 2021, and a total of 838 valid questionnaires were collected, of which 327 were collected at Square and 511 at Lake side (
Table 2). Subjects were mainly students and teachers, which accounted for 94.51% and 4.42%, respectively. The age distribution was mainly concentrated in the age group of 21–25 years old (81.03%). The gender situation showed that there were more males, but there was no significant difference between males and females. The subjects have a relatively high level of education: 81.49% have a master’s degree or above, and 12.4% have a doctoral degree or above. Their monthly income is generally low and they are healthy.
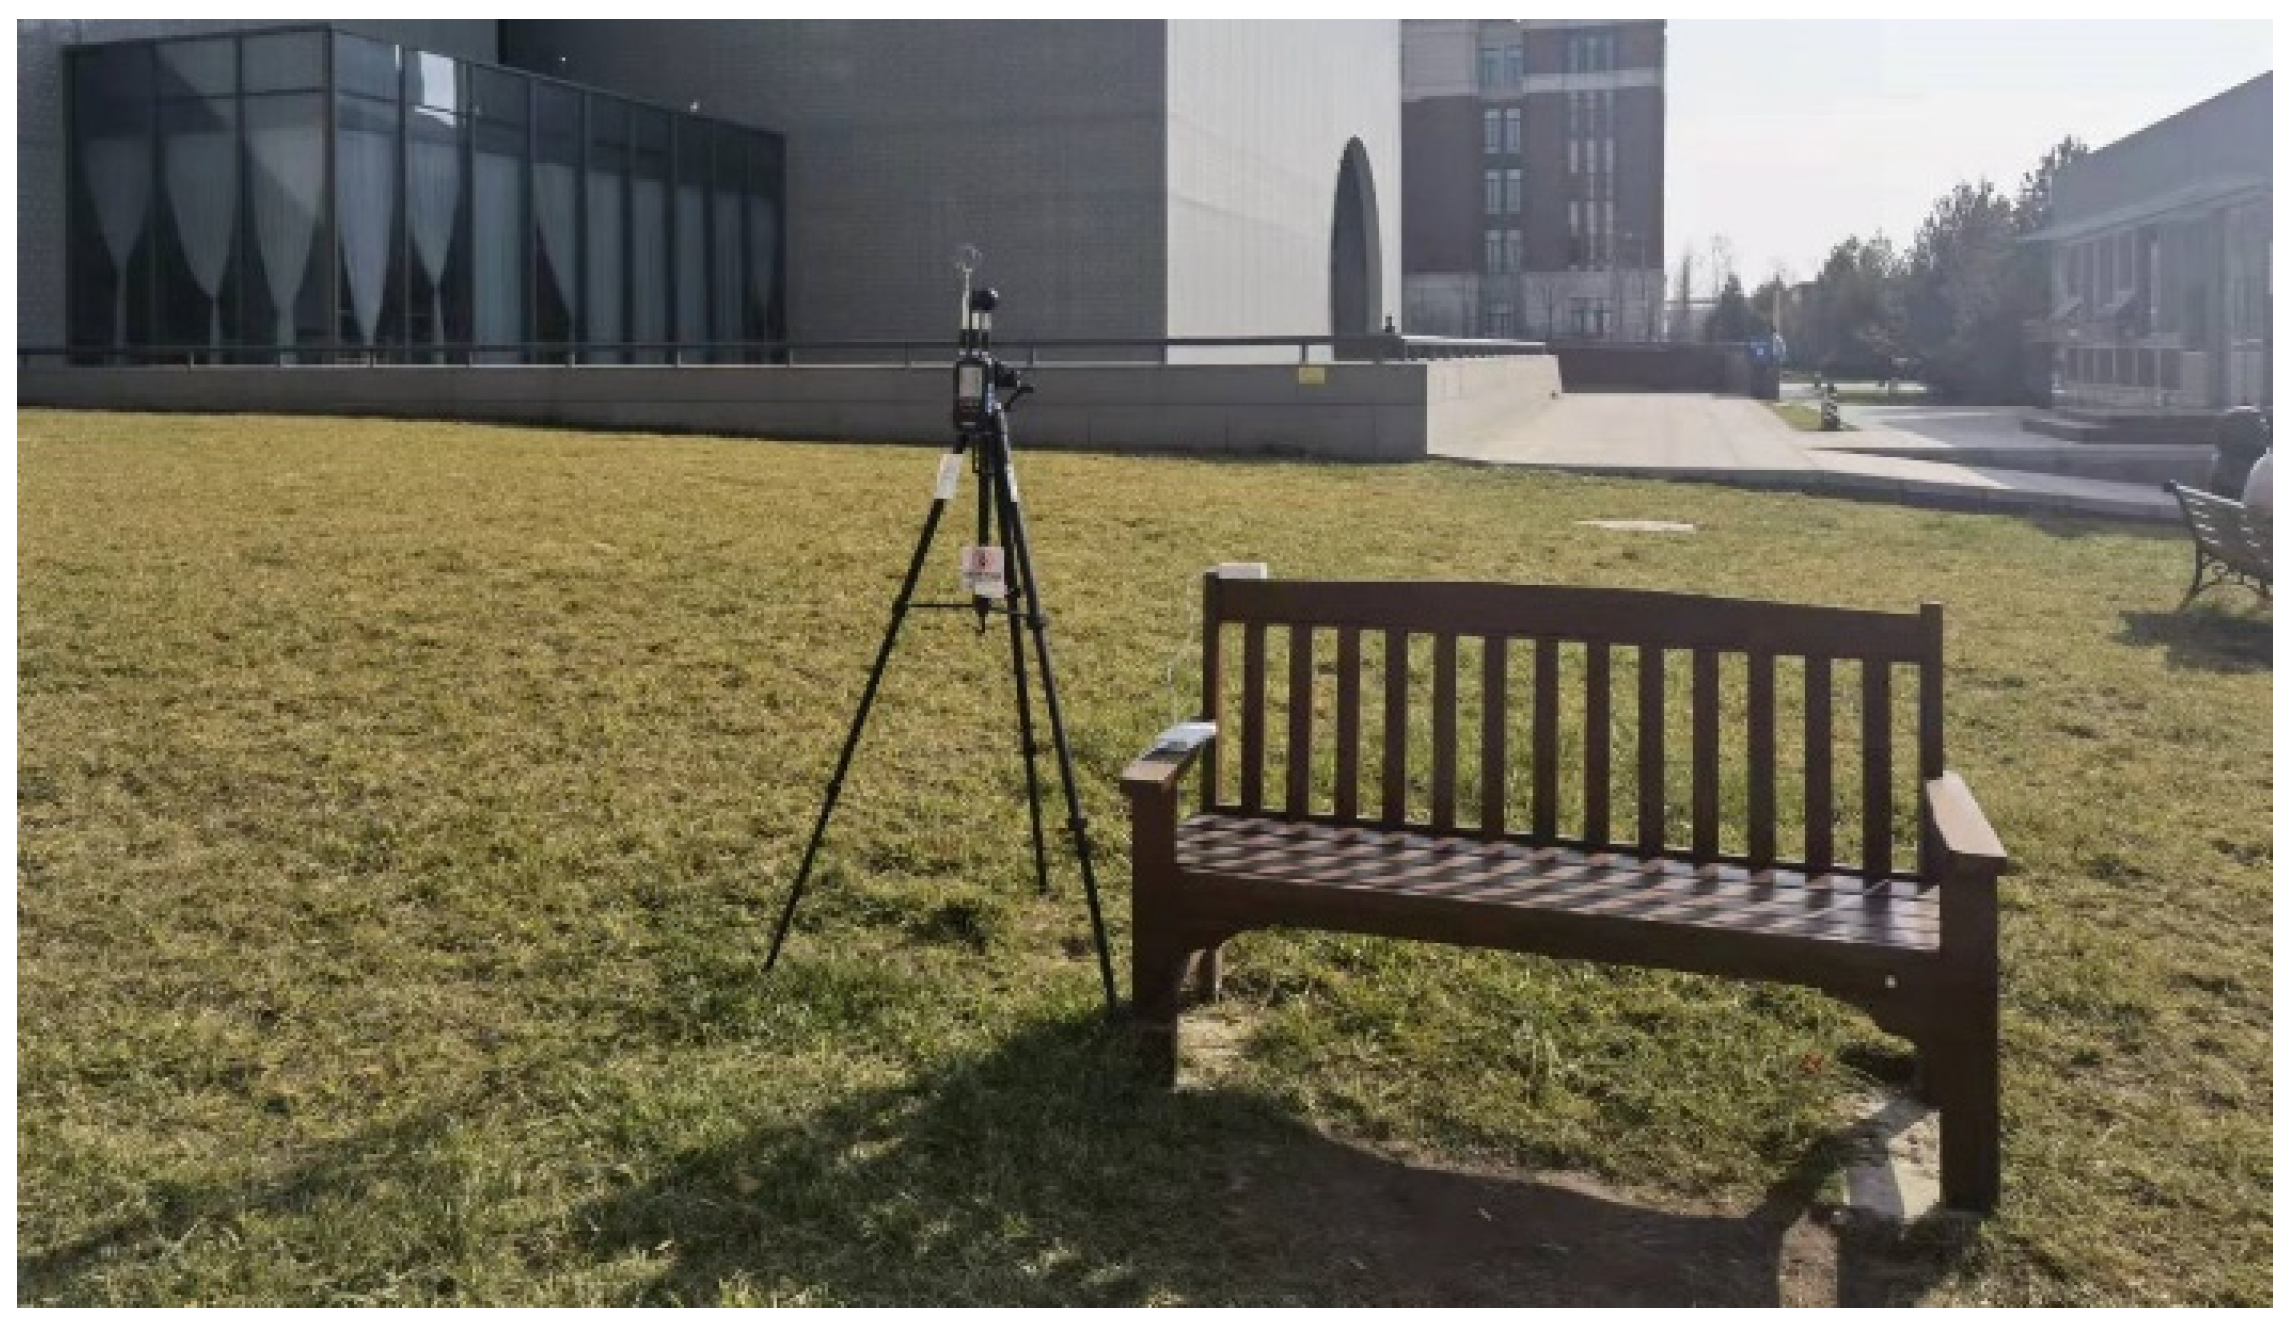
2.4. Meteorological Measurements
Outdoor micrometeorological parameters comprising the air temperature, relative humidity, mean wind speed, and solar radiation were recorded simultaneously when the questionnaire surveys were conducted. The instruments were all positioned 1.5 m above the ground, within 5 meters of the subject. In order to exclude the influence of chance factors, for each group of tests, the test was repeated at least 10 times during the questionnaire survey, and the average was taken as the test result of this group. Rainy or snowy weather was avoided when the questionnaire surveys were conducted. All instruments were compliant with ISO 7726 standard [
19] (
Table 3).
2.5. Procedures
The mean WSV (MWSV) and mean WCV (MWCV) were used to measure the perceived wind comfort level. When MWSV ranged from −1 and 1, the wind was perceived as moderate. The wind was perceived as high when MWSV was below −1 and low when above 1. Similarly, when MWCV was between 2 and 3, the wind was considered comfortable. When MWCV was between −3 and −2, the wind was unacceptable. The wind was considered uncomfortable but acceptable in other cases.
The wind speed that was not considered high or low was defined as the neutral wind speed (Vn). A curve was fitted between the MWSV and wind speed to determine their relationship, and Vn was obtained as the wind speed at which MWSV was zero. The Vn values were used to determine how the perception of wind changed among the seasons.
3. Results
3.1. Data
The data of wind speed (Va), air temperature (Ta), relative humidity (RH) and solar radiation (G) are listed below (
Table 4). The square has higher mean temperature, lower relative humidity, higher mean solar radiation and higher mean wind speed than the pool side, and the standard deviation of data is close.
We calculated the mean wind speed about each research day to simplify the question (
Figure 3). According to the Beaufort wind scale, 74.4% of the wind speed values were at scale 1 (0.30 to 1.49 m/s), while 12.8% were at scale 0 (0 m/s to 0.29 m/s), and the remainder at scale 2 (1.50 to 3.29 m/s, 5.1%) and scale 3 (3.30 m/s to 5.39 m/s, 7.7%). The wind speed did not change significantly during the survey period, excluding fluctuations on a few days. In the square, the wind speed ranged from 0.38 to 4.75 m/s, with an average of 1.35 m/s. At the lake side, the wind speed ranged from 0.10 to 2.93 m/s, with an average of 0.85 m/s. The overall wind speed was higher in the square than at the lake side.
3.2. Wind Comfort
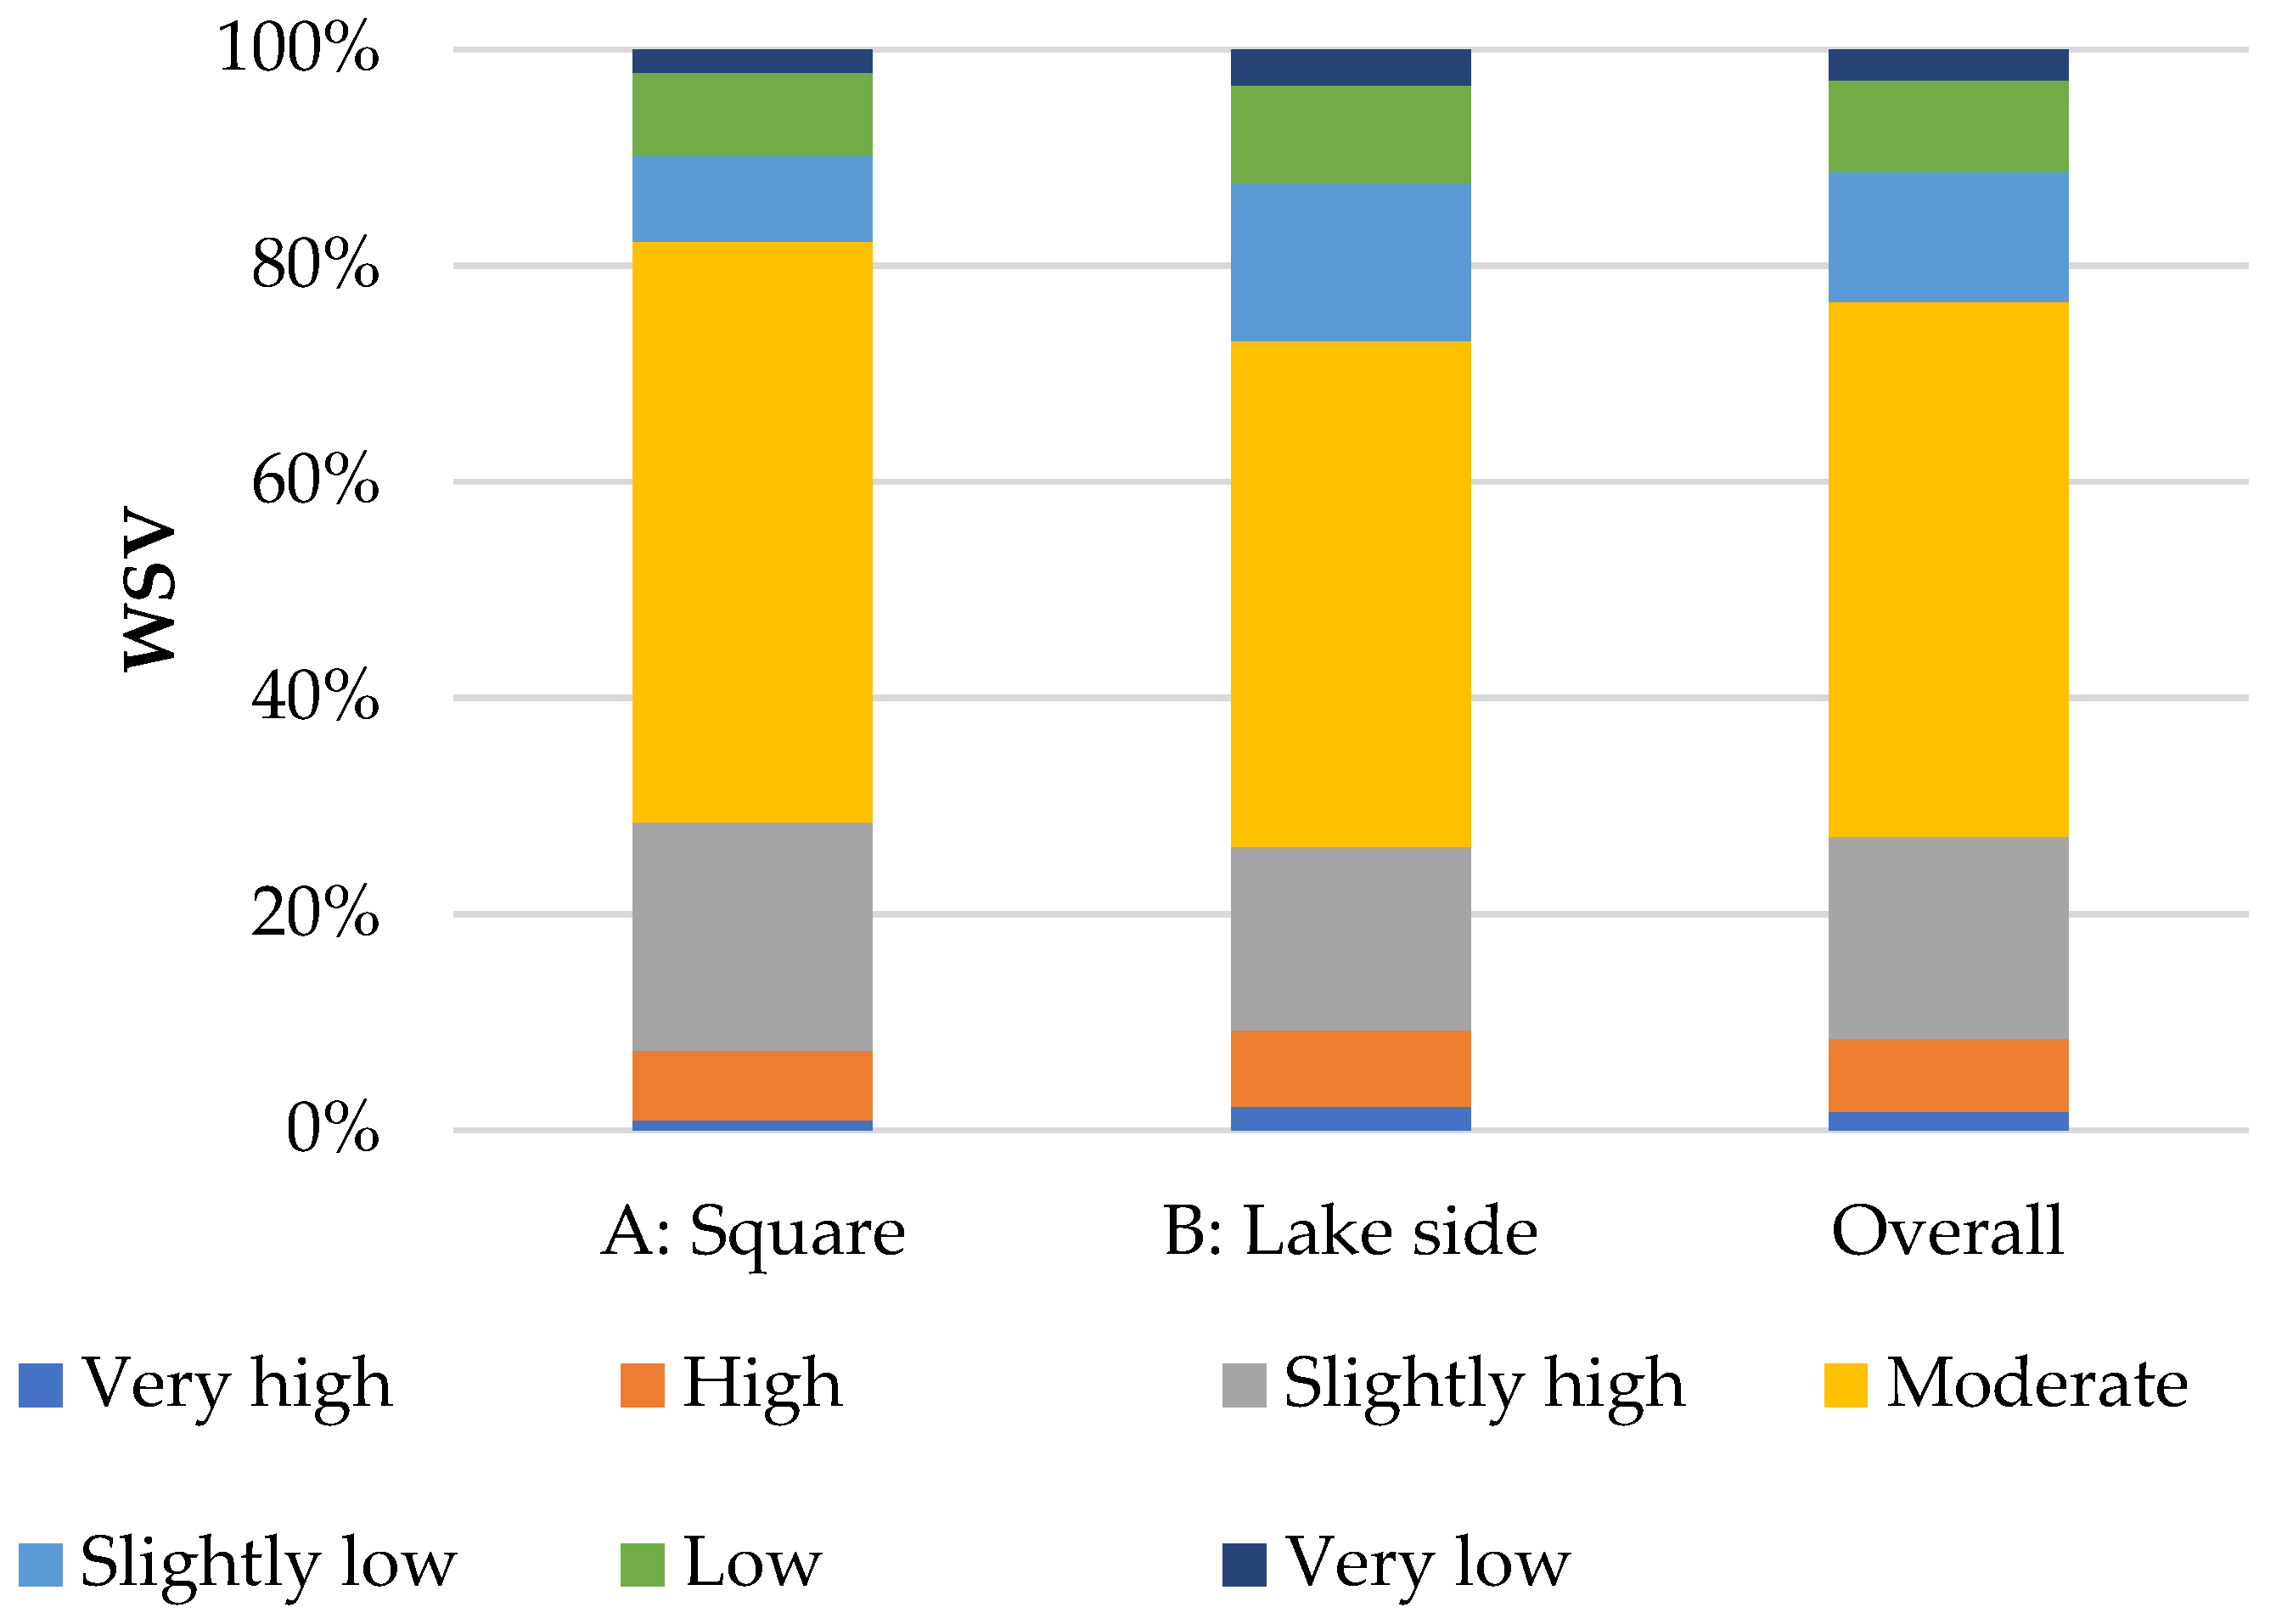
3.2.1. WSV and WCV
The distributions of WSV (
Figure 4) and WCV (
Figure 5) at each site and the overall results were as follows. The WSV was mainly scored as “slightly high”, “moderate”, and “slightly low” (80.19%). In addition, 8.47% of the subjects felt that the wind speed was “high” or “very high” (WSV = 2, −3), whereas 11.34% felt that it was “low” or “very low” (WSV = 2, 3), with a difference of only 2.87%. These results indicate that the overall wind sensation followed a balanced distribution. The combined percentage of votes for “low” and “very low” was 12.33% in the square, and 9.20% for “high” and “very high,” and both of these percentages were greater than those at the lake side, i.e., 9.79% and 6.34%, respectively.
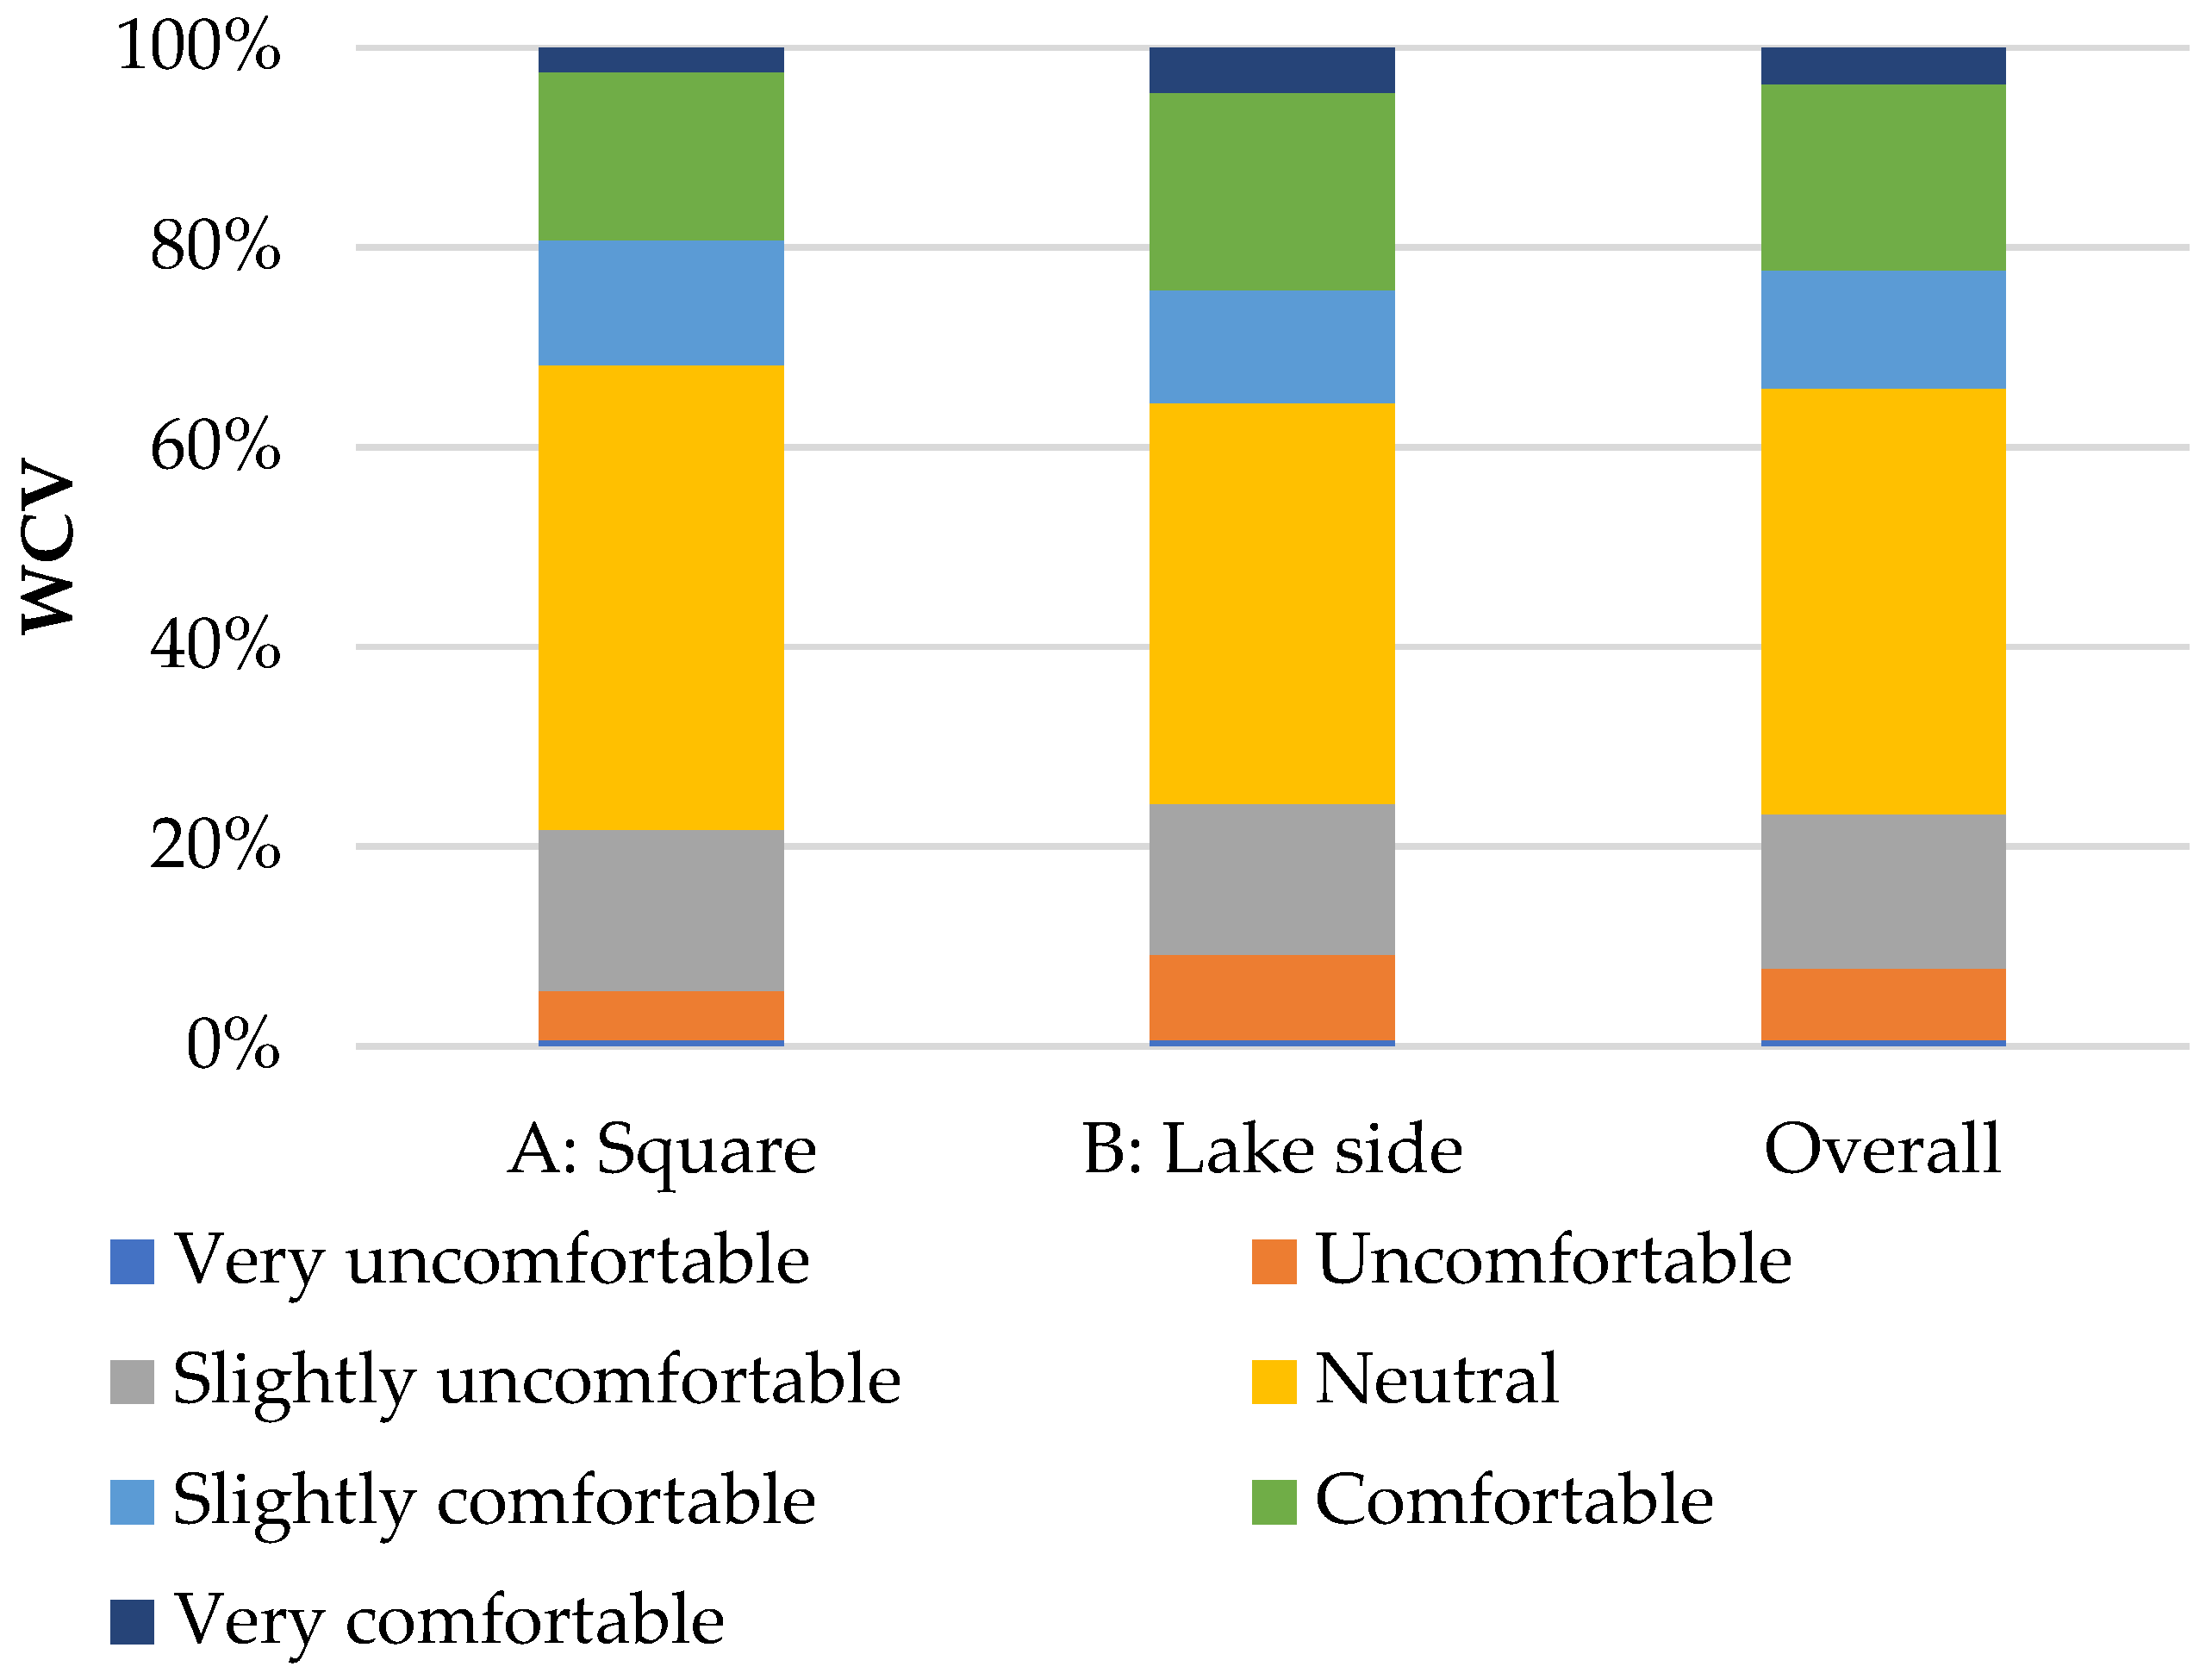
Most of the subjects (69.93%) considered that the wind speed was acceptable (WCV = −1, 0, 1). More subjects considered that the wind speed was comfortable (WCV = 2, 3; 22.32%) than unacceptable (WCV = −2, −3; 7.75%). Moreover, the proportions who considered that the wind speed was “comfortable” or “very comfortable” (24.26%) and as “uncomfortable” or “very uncomfortable” (9.20%) were both greater at the lake side than in the square (19.27% and 5.50%, respectively).
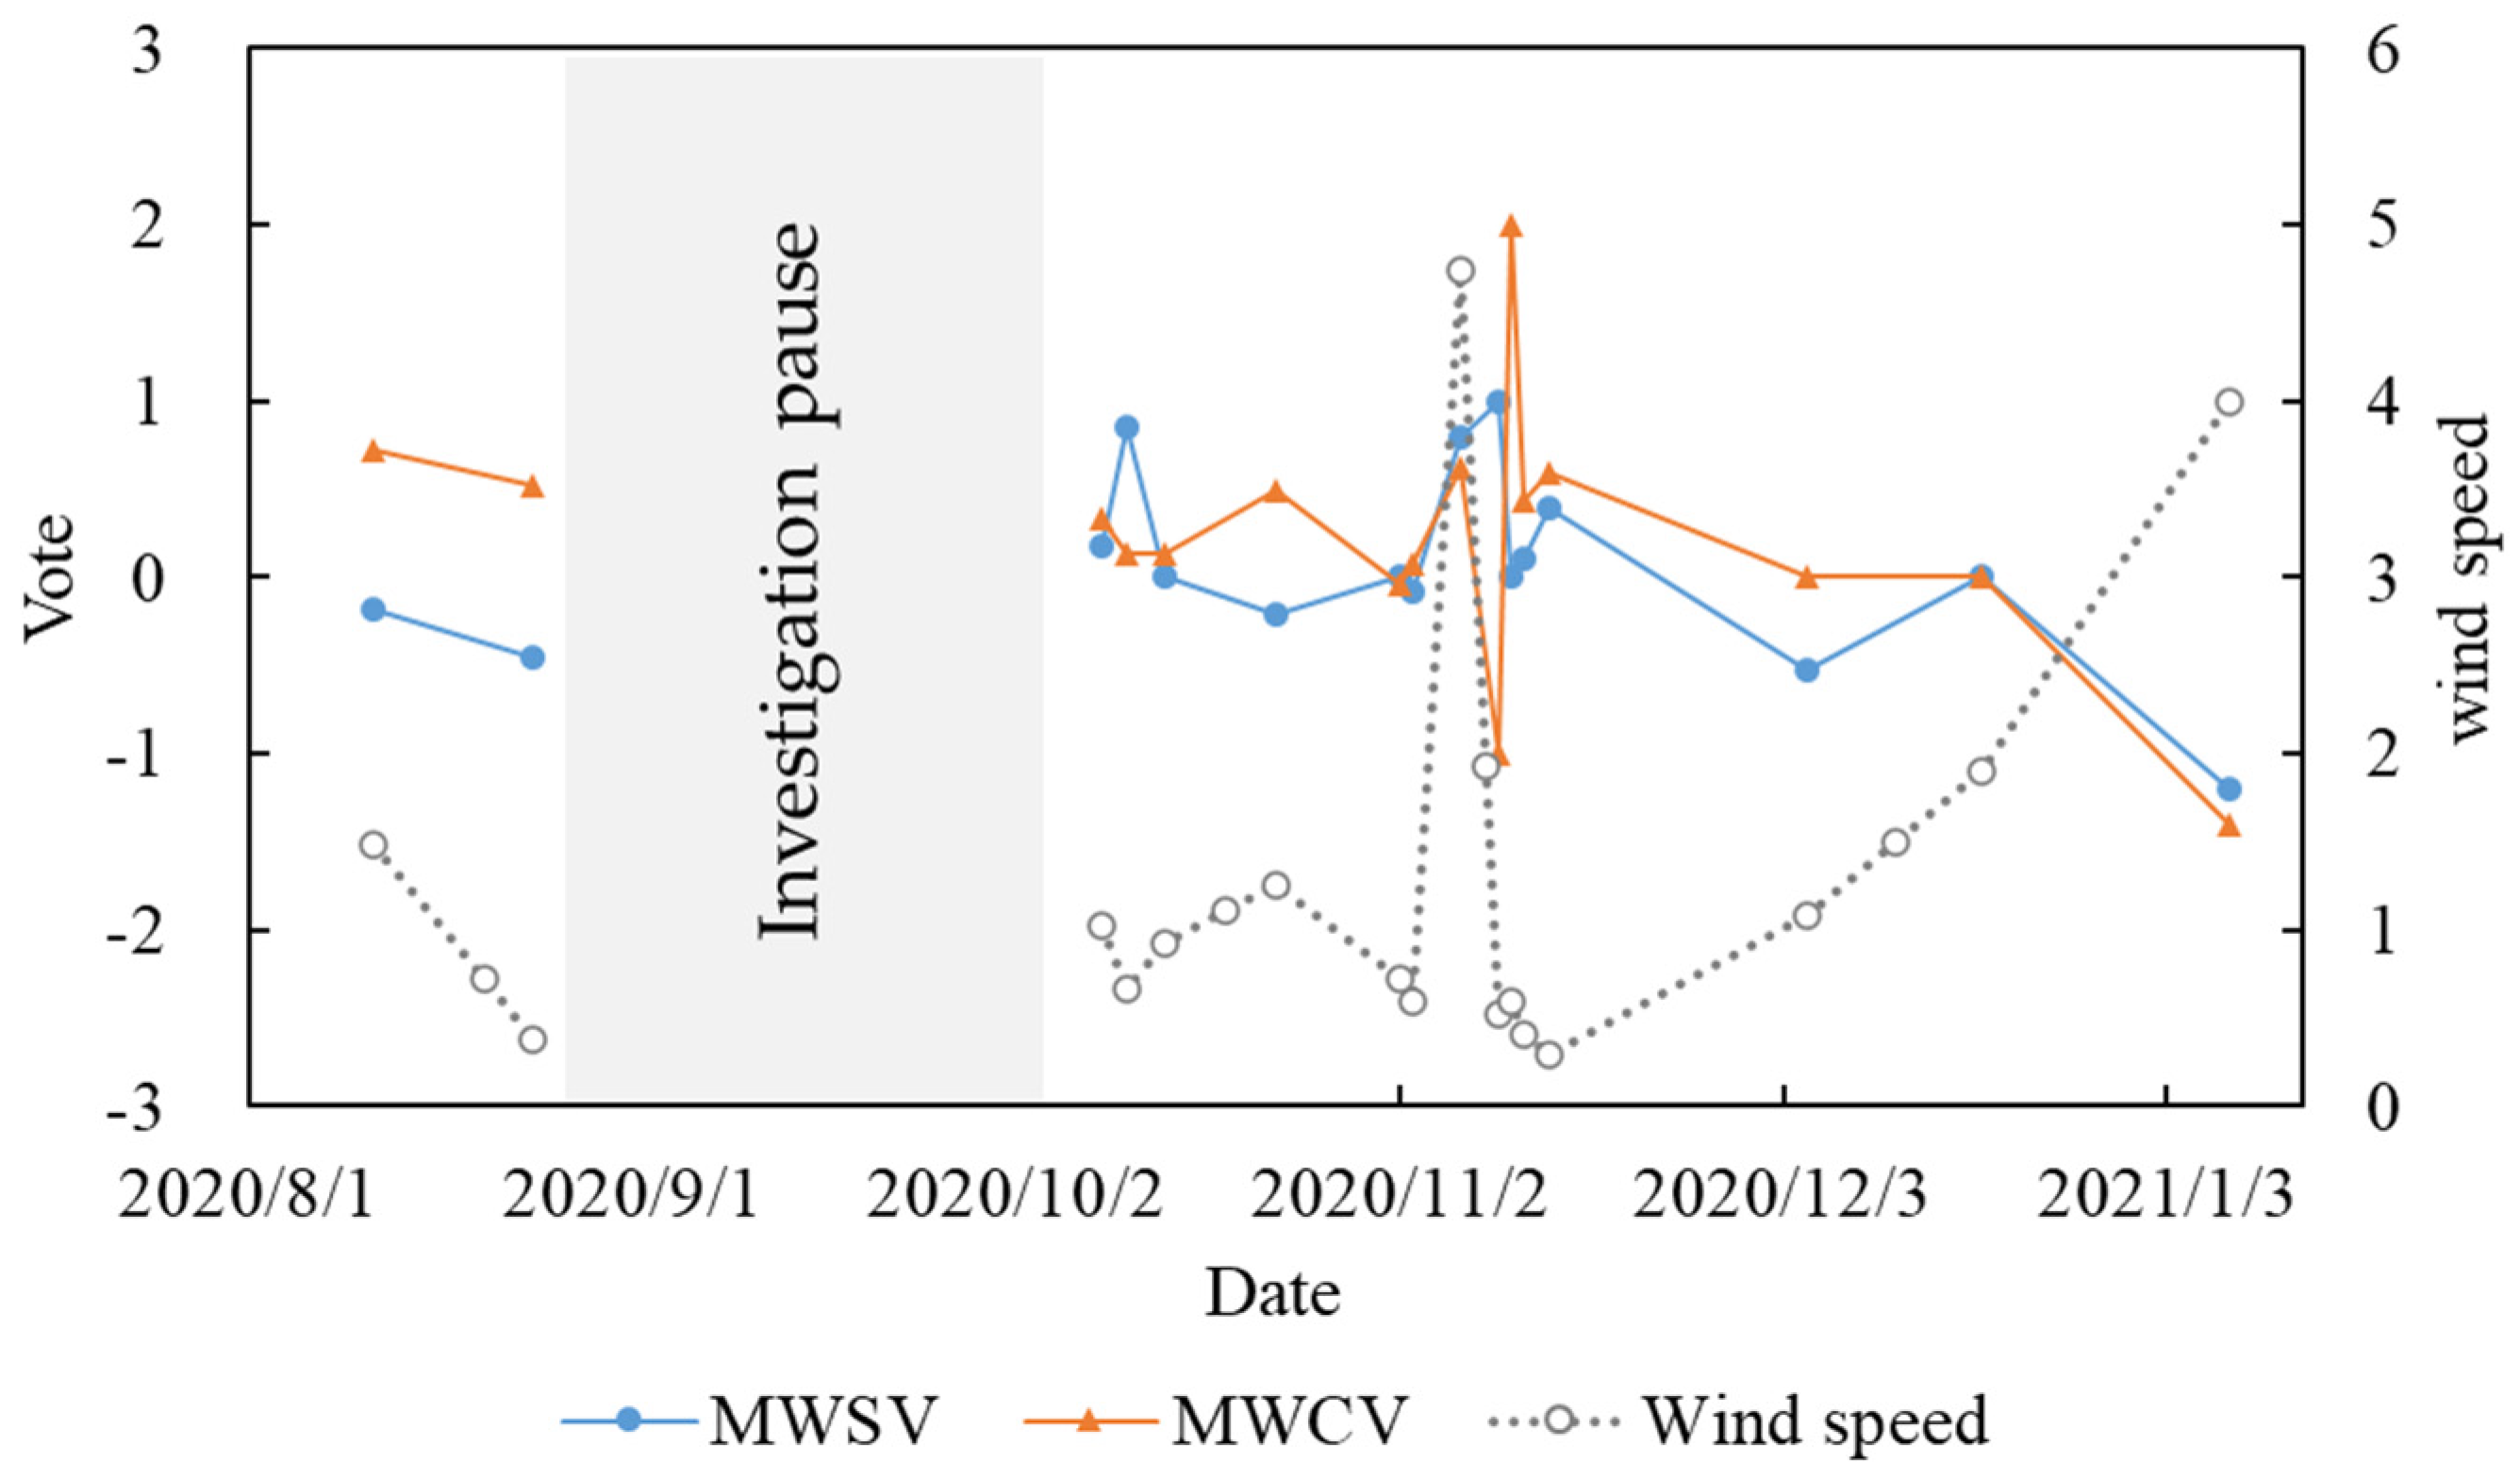
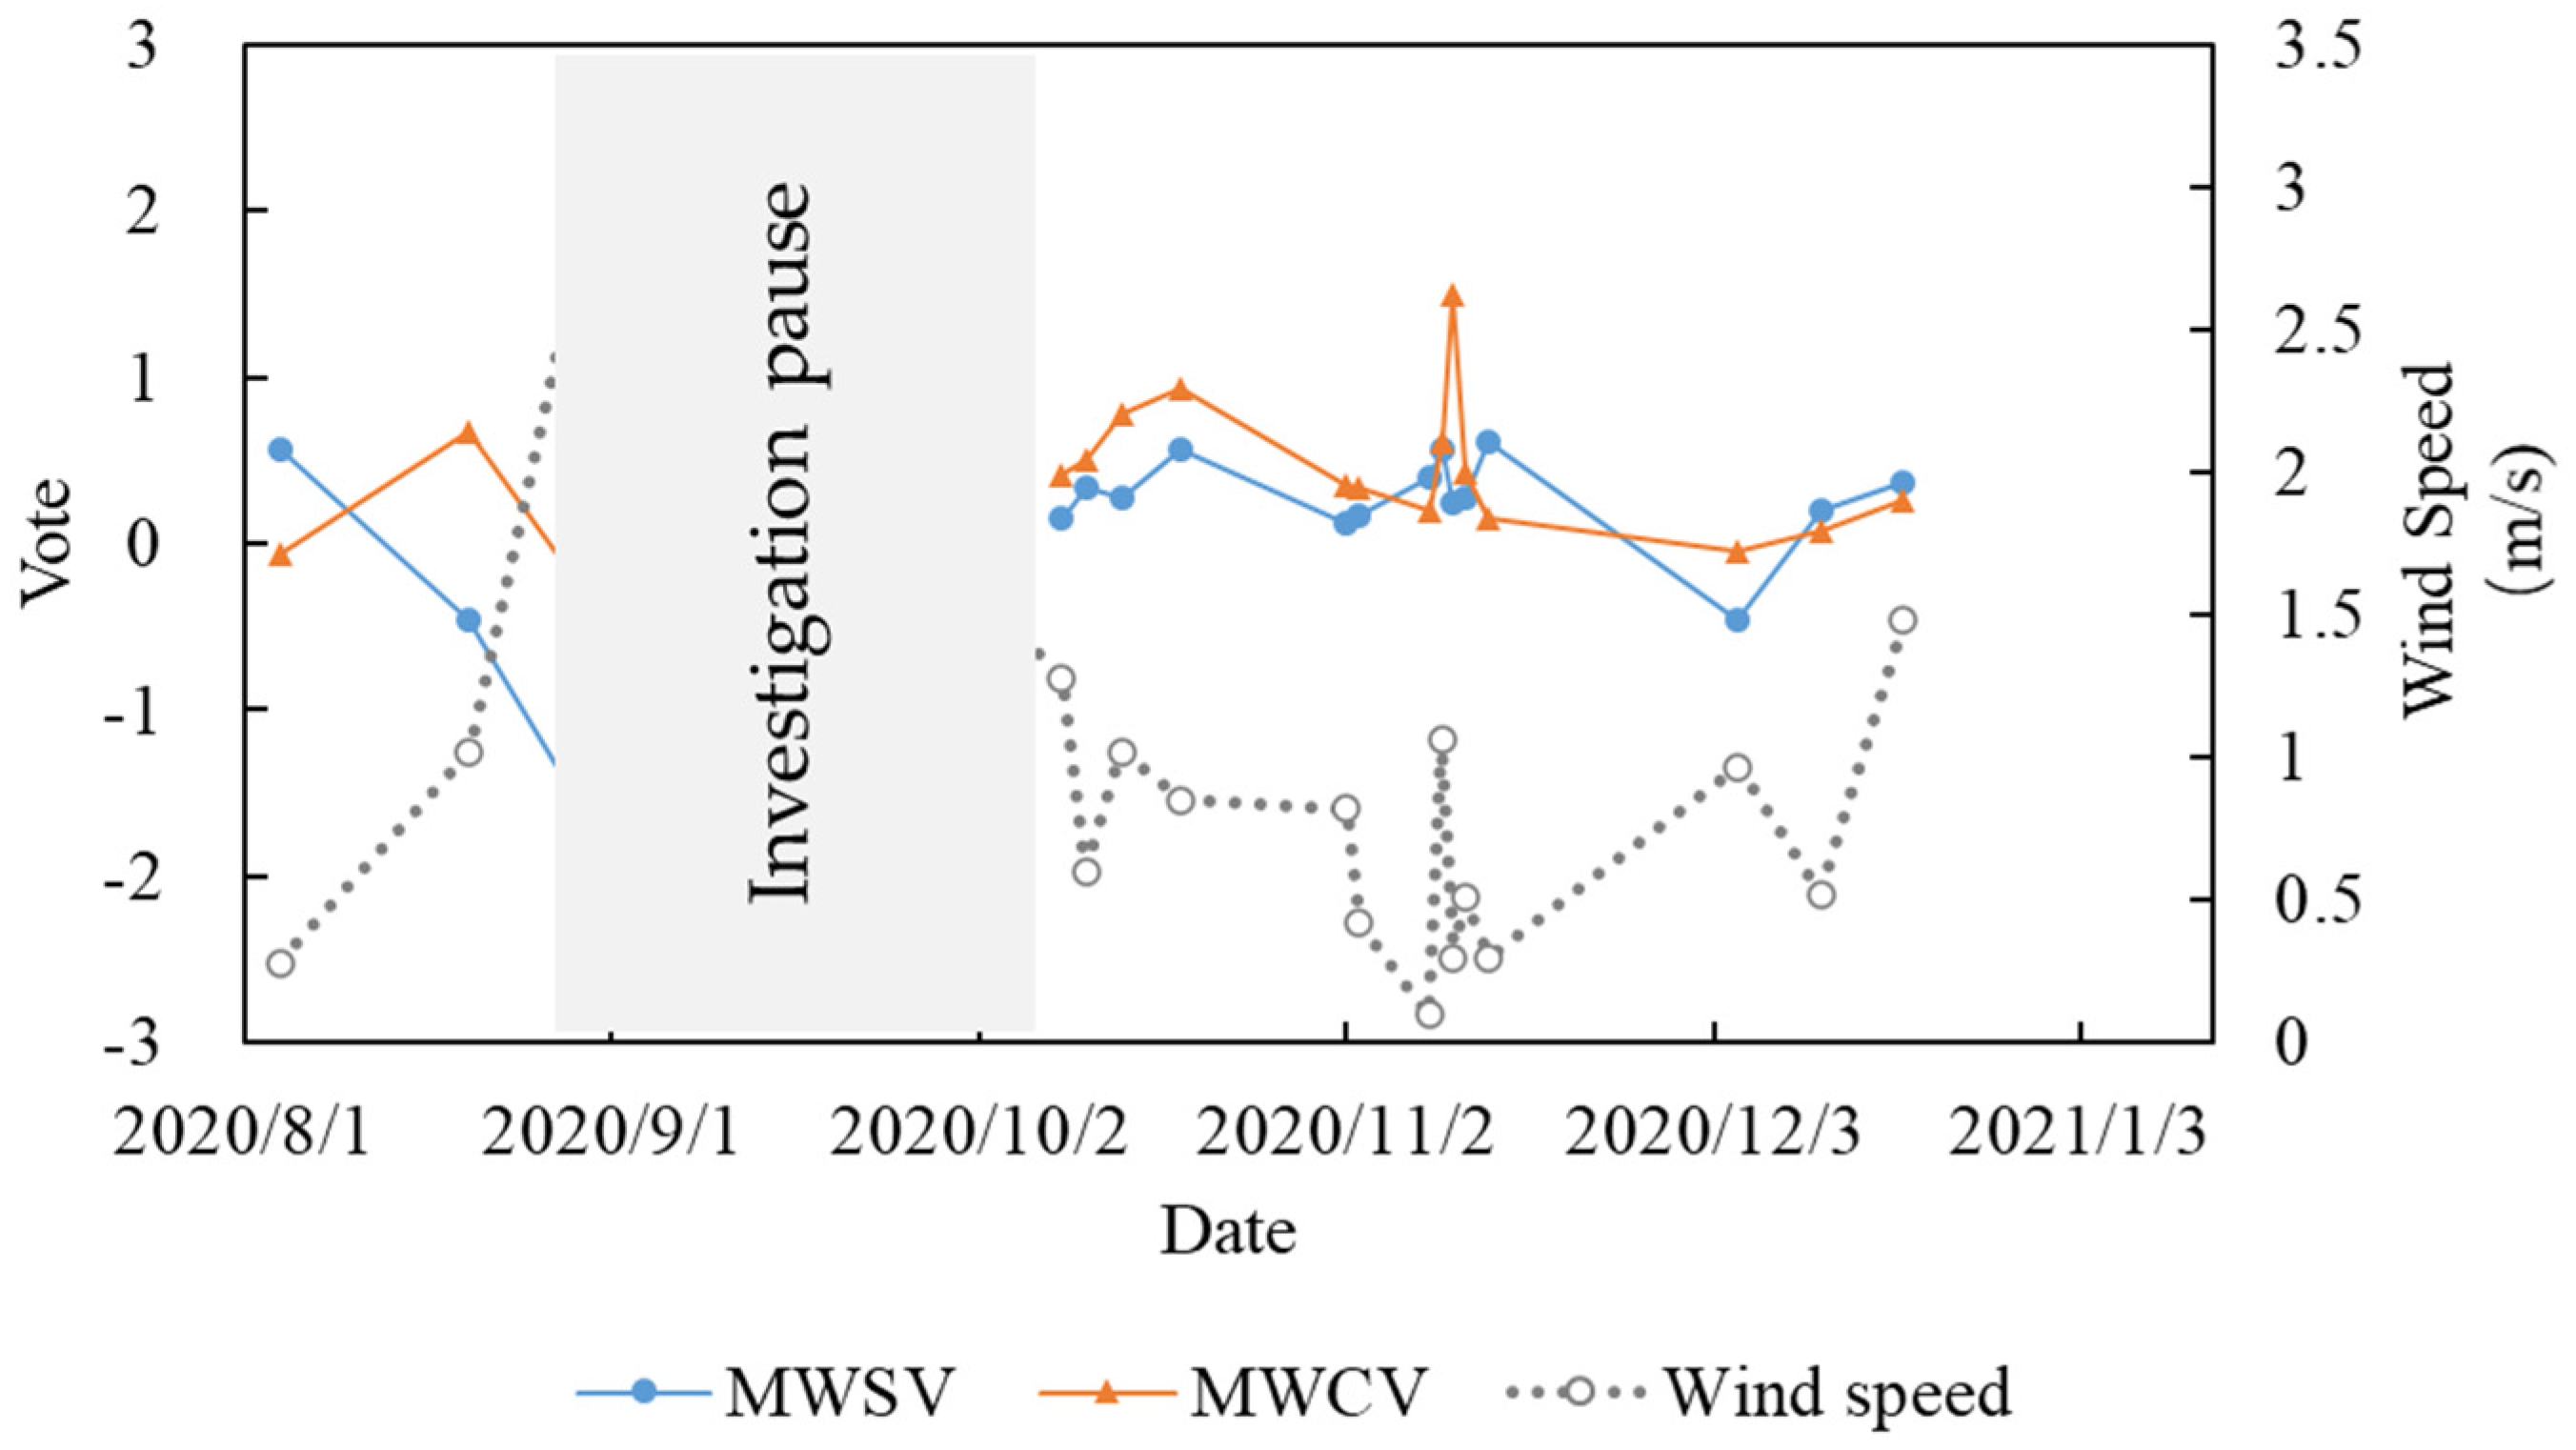
The MWSV and MWCV values in each research date were plotted to analyze the relationships between WSV and WCV, and their effects on the acceptability of the outdoor climate among the subjects (
Figure 6 and
Figure 7). When the MWSV ranged between −1 and 1, the MWCV values at both sites were generally above 0. However, when MWSV was above 1 or below −1, the wind comfort decreased regardless of whether the wind was perceived as higher or lower.
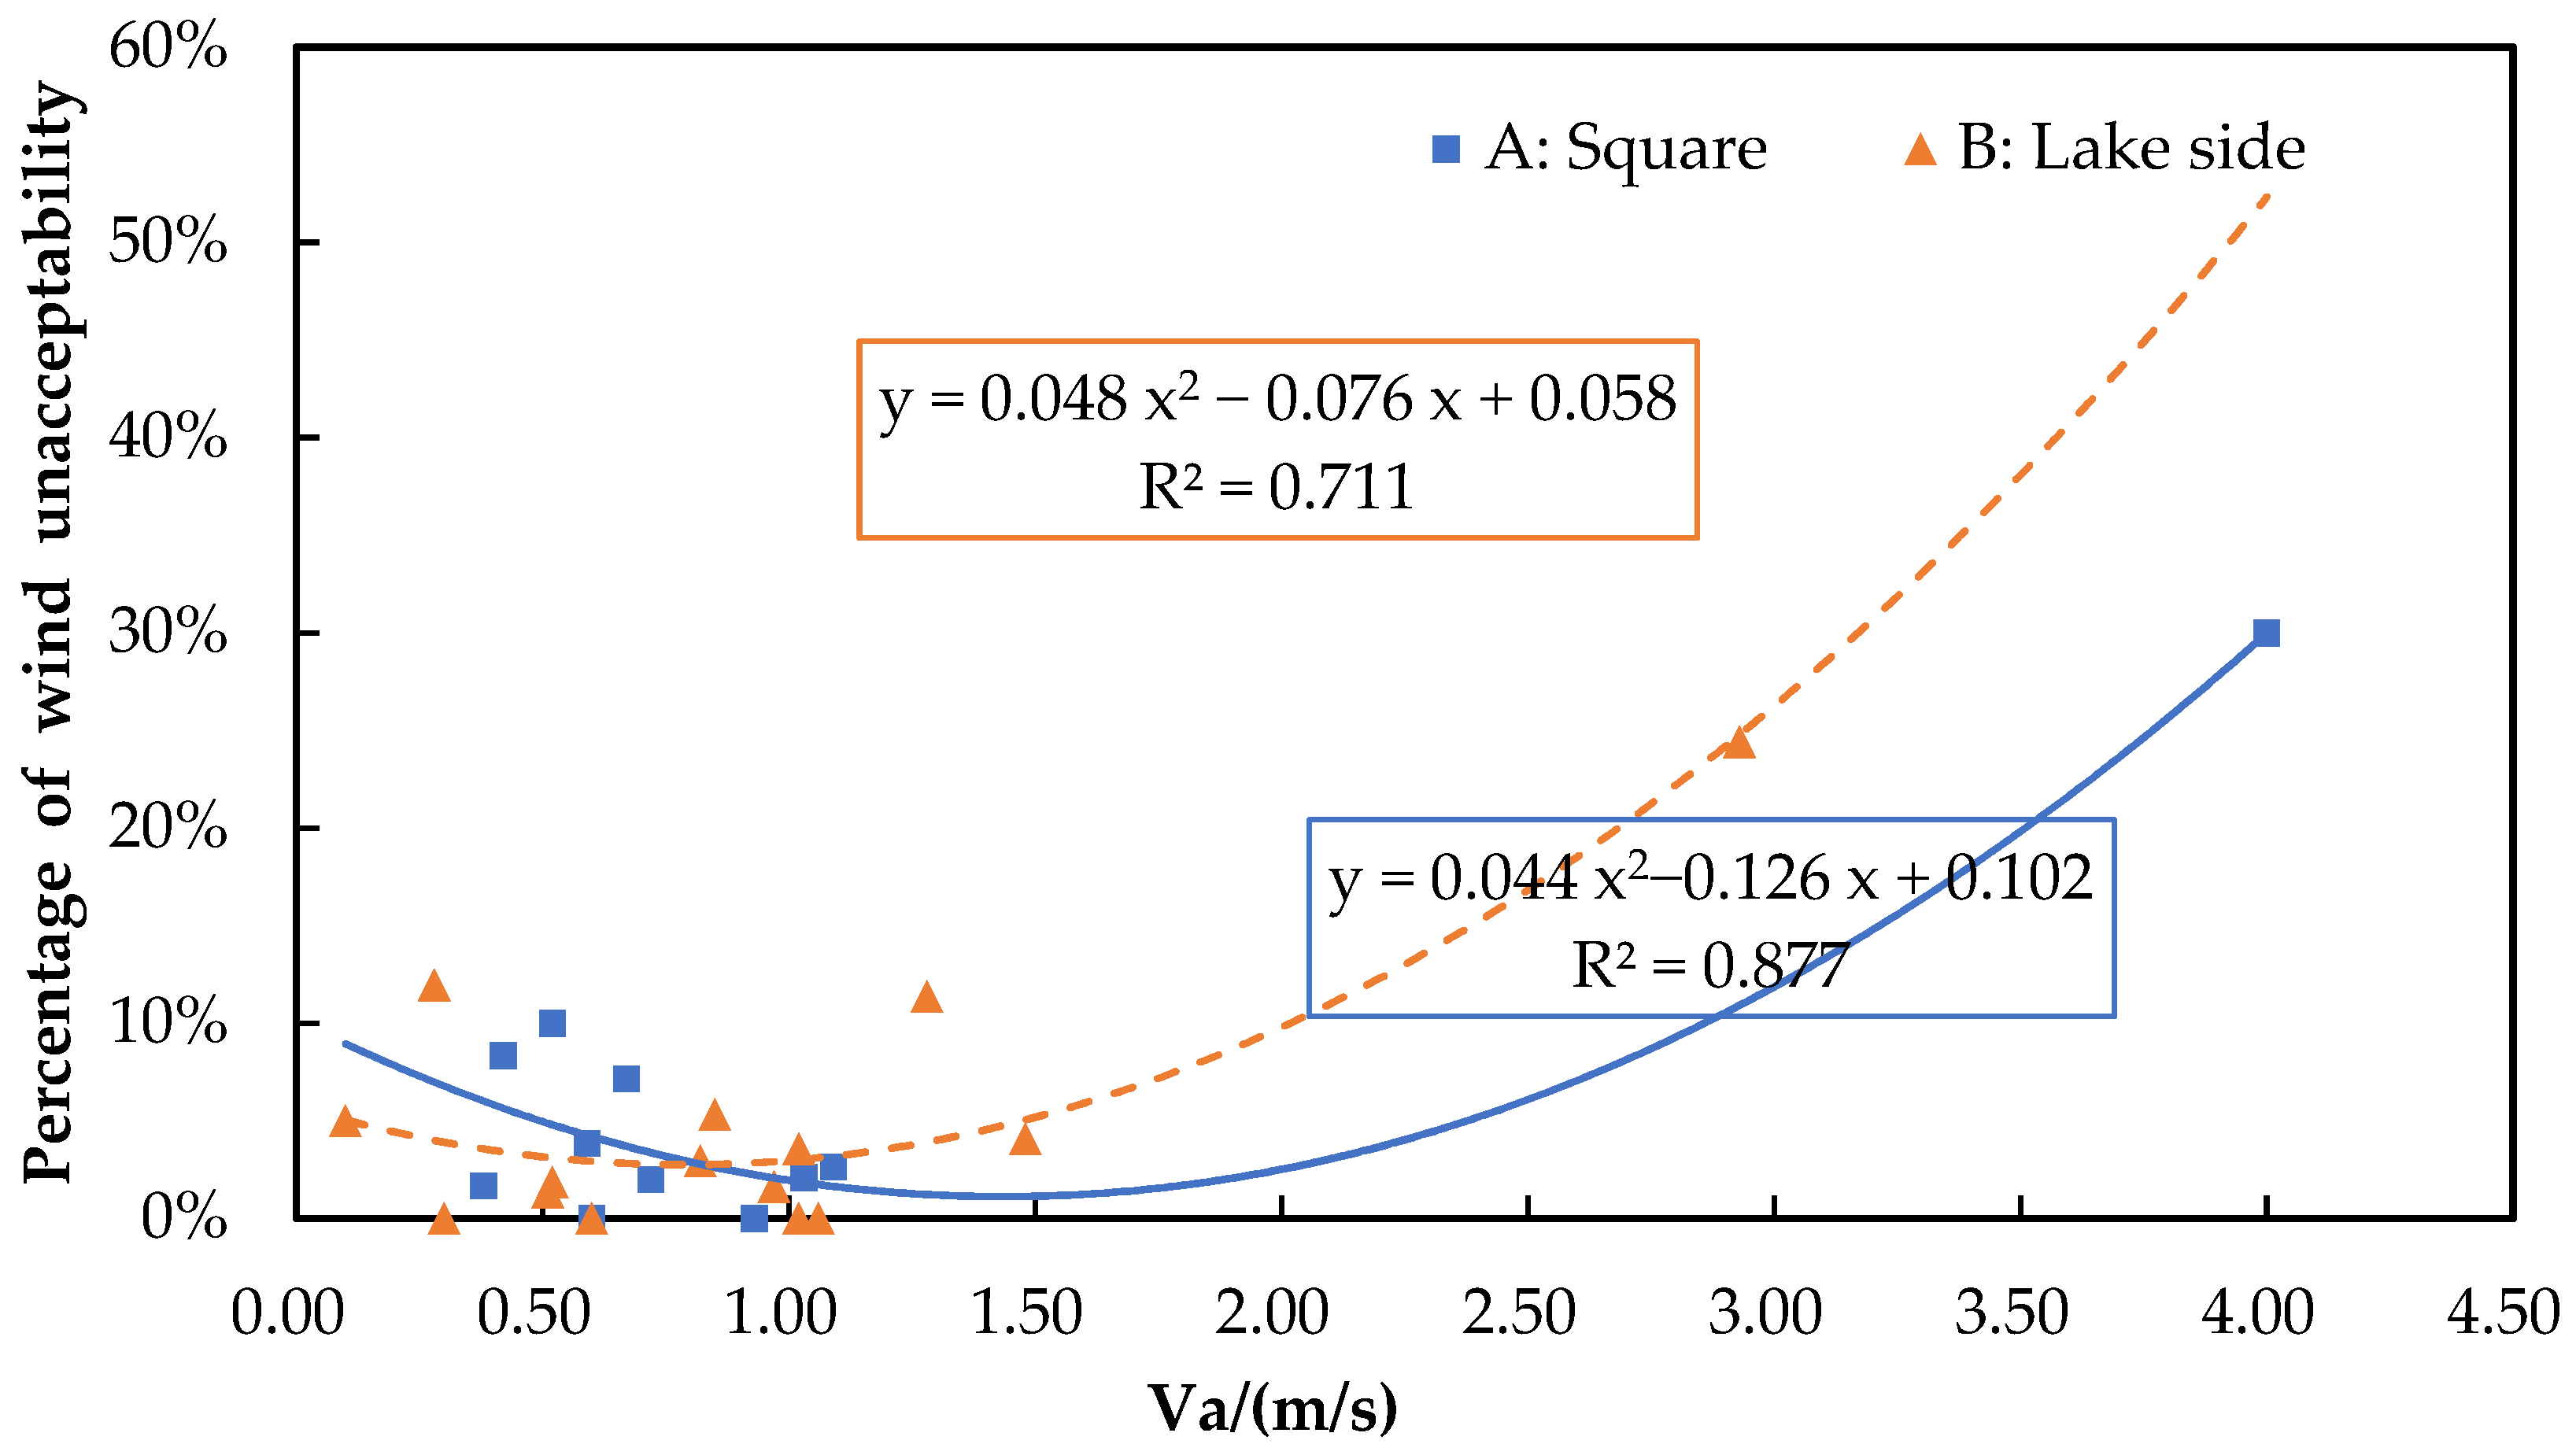
3.2.2. Wind Acceptability Range
The wind acceptability range is an important component of wind comfort criteria, especially in extreme conditions [
20]. In this study, the wind was considered unacceptable when WCV was less than −1 (slightly uncomfortable). The percentage of unacceptable votes in total WCV was calculated for wind acceptability range. The correlations between the wind speed and percentage of unacceptable wind votes at the two sites are shown in
Figure 8. Based on previous studies, the threshold for wind unacceptability was set as 10%, the wind acceptability range is a set of wind speed that falls within the threshold [
21,
22]. Thus, the acceptable wind speed ranges in the square and at the lake side were determined as (0 m/s, 2.02 m/s) and (0.01 m/s, 2.86 m/s), respectively.
3.2.3. Vn in Different Seasons
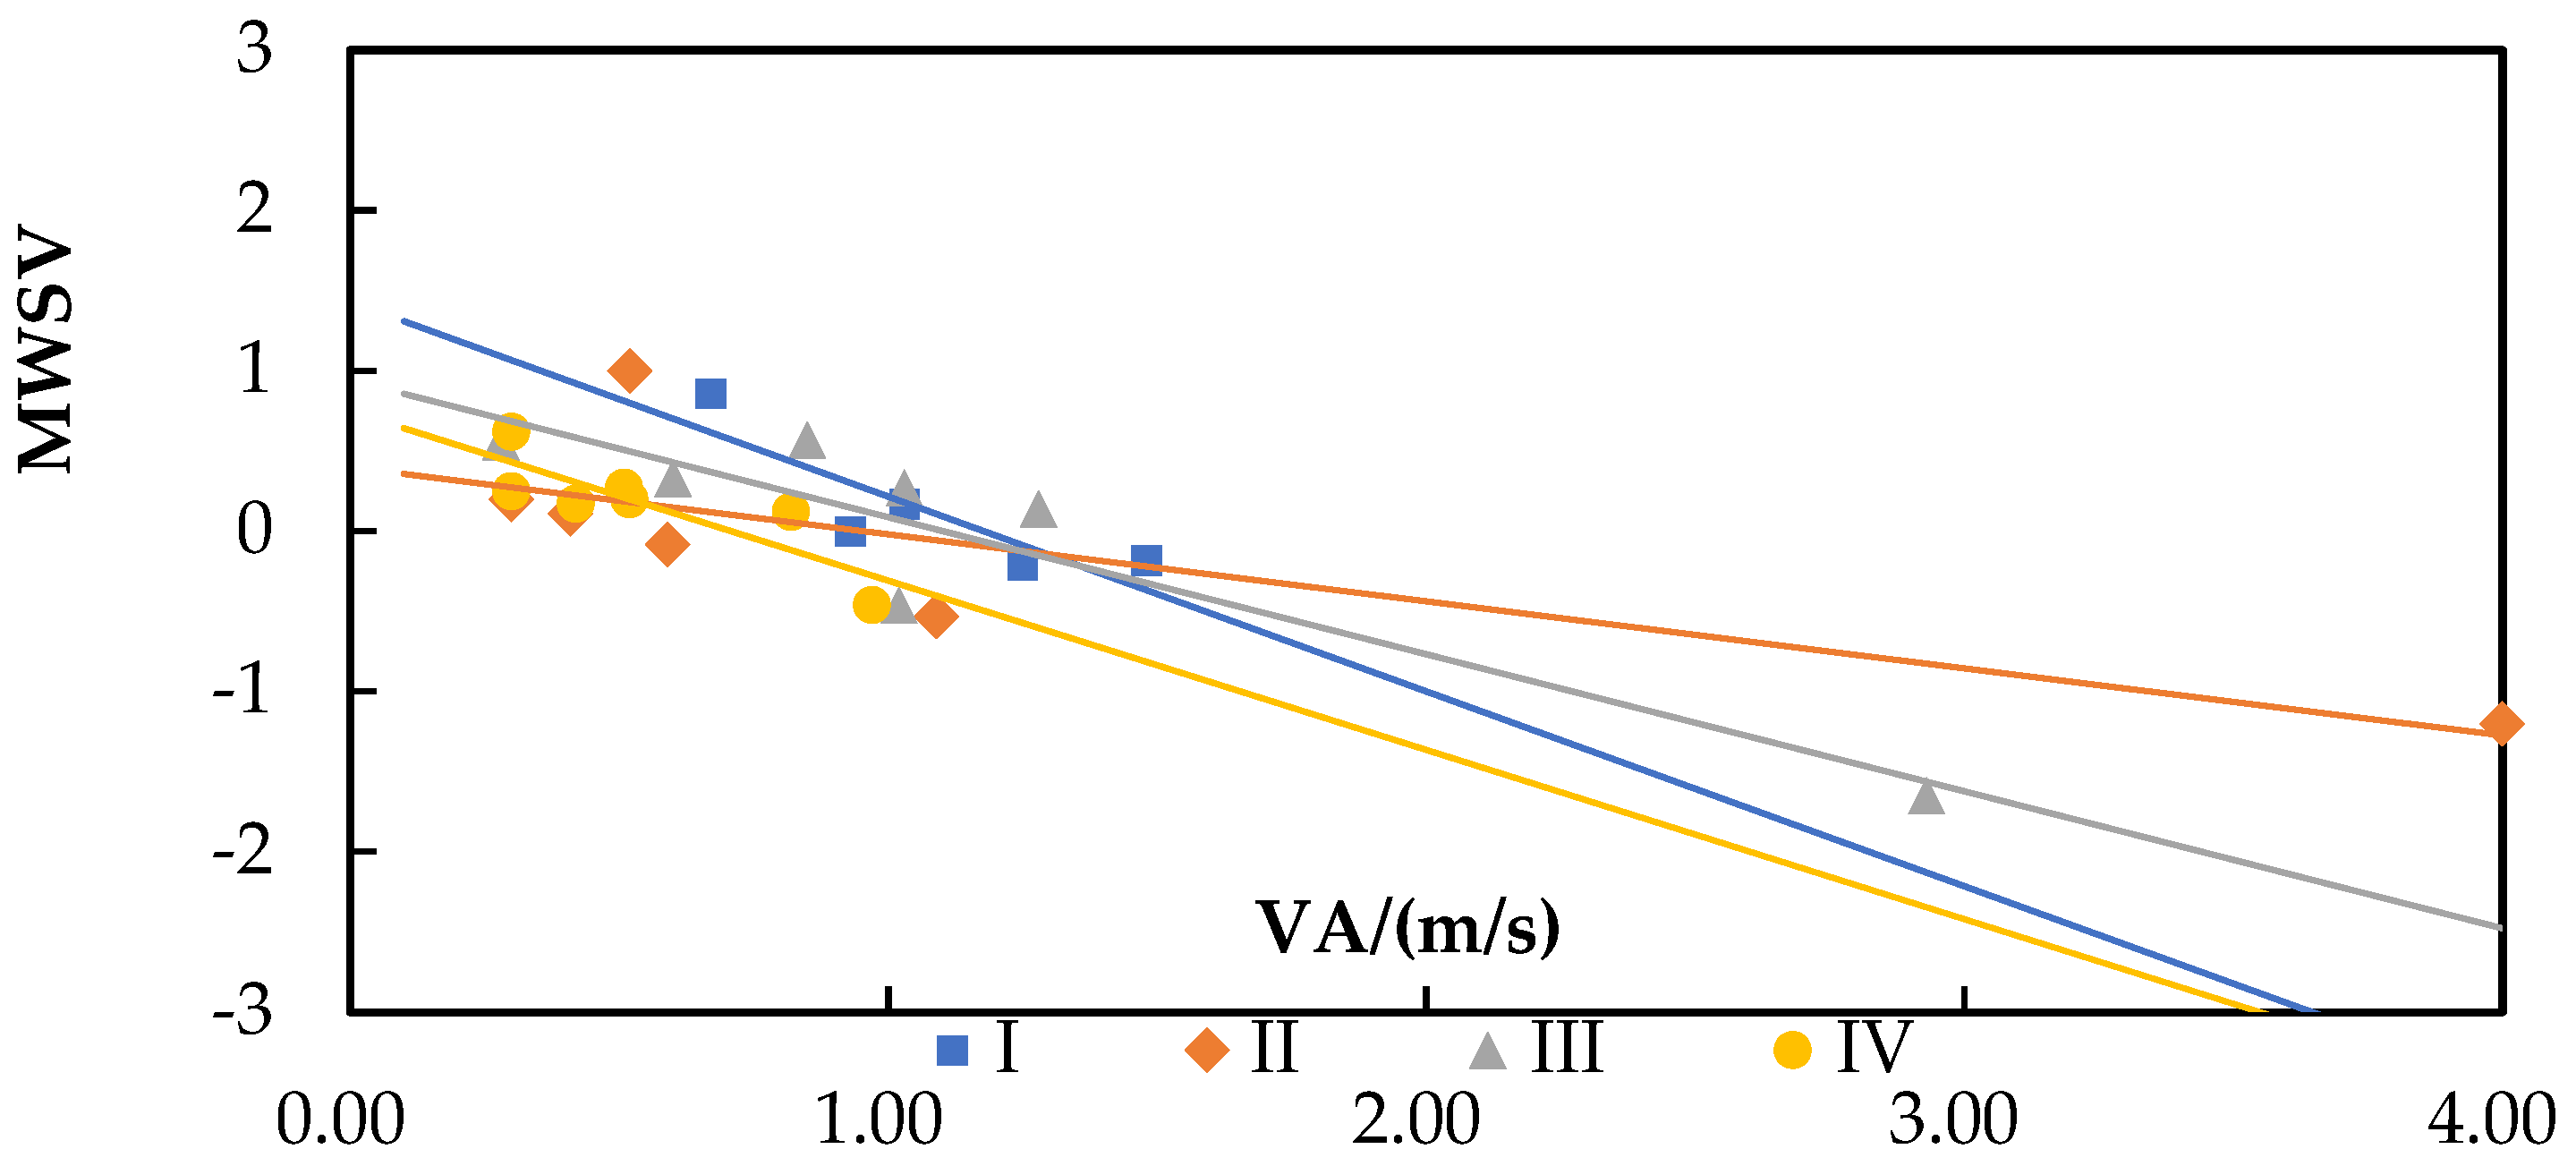
In Xi’an, the transition season from summer to autumn occurs in August and October, and the transition from autumn to winter occurs in November, December, and January. Thus, the data were categorized according to four groups: (I) square in August and October; (II) square in November, December, and January; (III) lake side in August and October; (IV) lake side in November and December. The average air temperatures in the four groups were 24.83 °C, 15.03 °C, 25.50 °C, and 14.60 °C, and the ranges were [19.1 °C, 37.3 °C], [0.9 °C, 28.6 °C], [19.1 °C, 31.3 °C], [7.1 °C, 29.3 °C], respectively. The daily average wind speed and corresponding MWSV are shown in
Figure 9. The relationships between the MWSV and mean wind speed are presented in Equations (I–IV).
After substituting MWSV = 0 into each of the equations above, the corresponding wind speed value was recorded as the neutral wind speed (Vn). The Vn values for groups I, II, III, and IV were determined as 1.18 m/s, 0.95 m/s, 1.10 m/s, and 0.71 m/s, respectively. From late summer to early winter, Vn decreased at the two sites. The absolute value of the slope was significantly smaller in group II (0.418) than the other three groups, and the absolute value of the slope was 0.360 greater in group I (1.215) than group III (0.855). Thus, Vn decreased with the air temperature, and at the same wind speed, the MWSV changed more at the lake side (corresponding to groups II and IV) than in the square.
3.3. Meteorological Parameters and Wind Sensation
Partial correlation analysis was conducted to capture the relationships between the micrometeorological parameters and wind sensation. Other variables were controlled during partial correlation analysis to eliminate their effects.
The wind speed was selected as the main parameter and the air temperature, relative humidity, and solar radiation were the secondary parameters. The partial correlation analysis results are shown in
Table 5. Only the air temperature had a negative correlation with the MWSV in the square. The relationships between each of the parameters and the MWSV were all stronger in the square than at the lake side. Solar radiation had the greatest influence on the wind sensation in the square and the air temperature had the greatest effect at the lake side. The features of the physical spaces at the two sites affected the significance of the relationships between the MWSV and each parameter.
3.4. Wind Adaptation
Wind adaptation can be categorized as physiological adaptation, psychological adaptation, and behavioral adaptation. The data obtained from the questionnaire survey were sued to study the effects of behavioral wind adaptation and psychological wind adaptation on the wind comfort.
3.4.1. Behavioral Adaptation
Behavioral adaptation refers to the adjustments people make through activities or clothing to maintain the balance between the wind perceived on the surface of their body and the external wind environment [
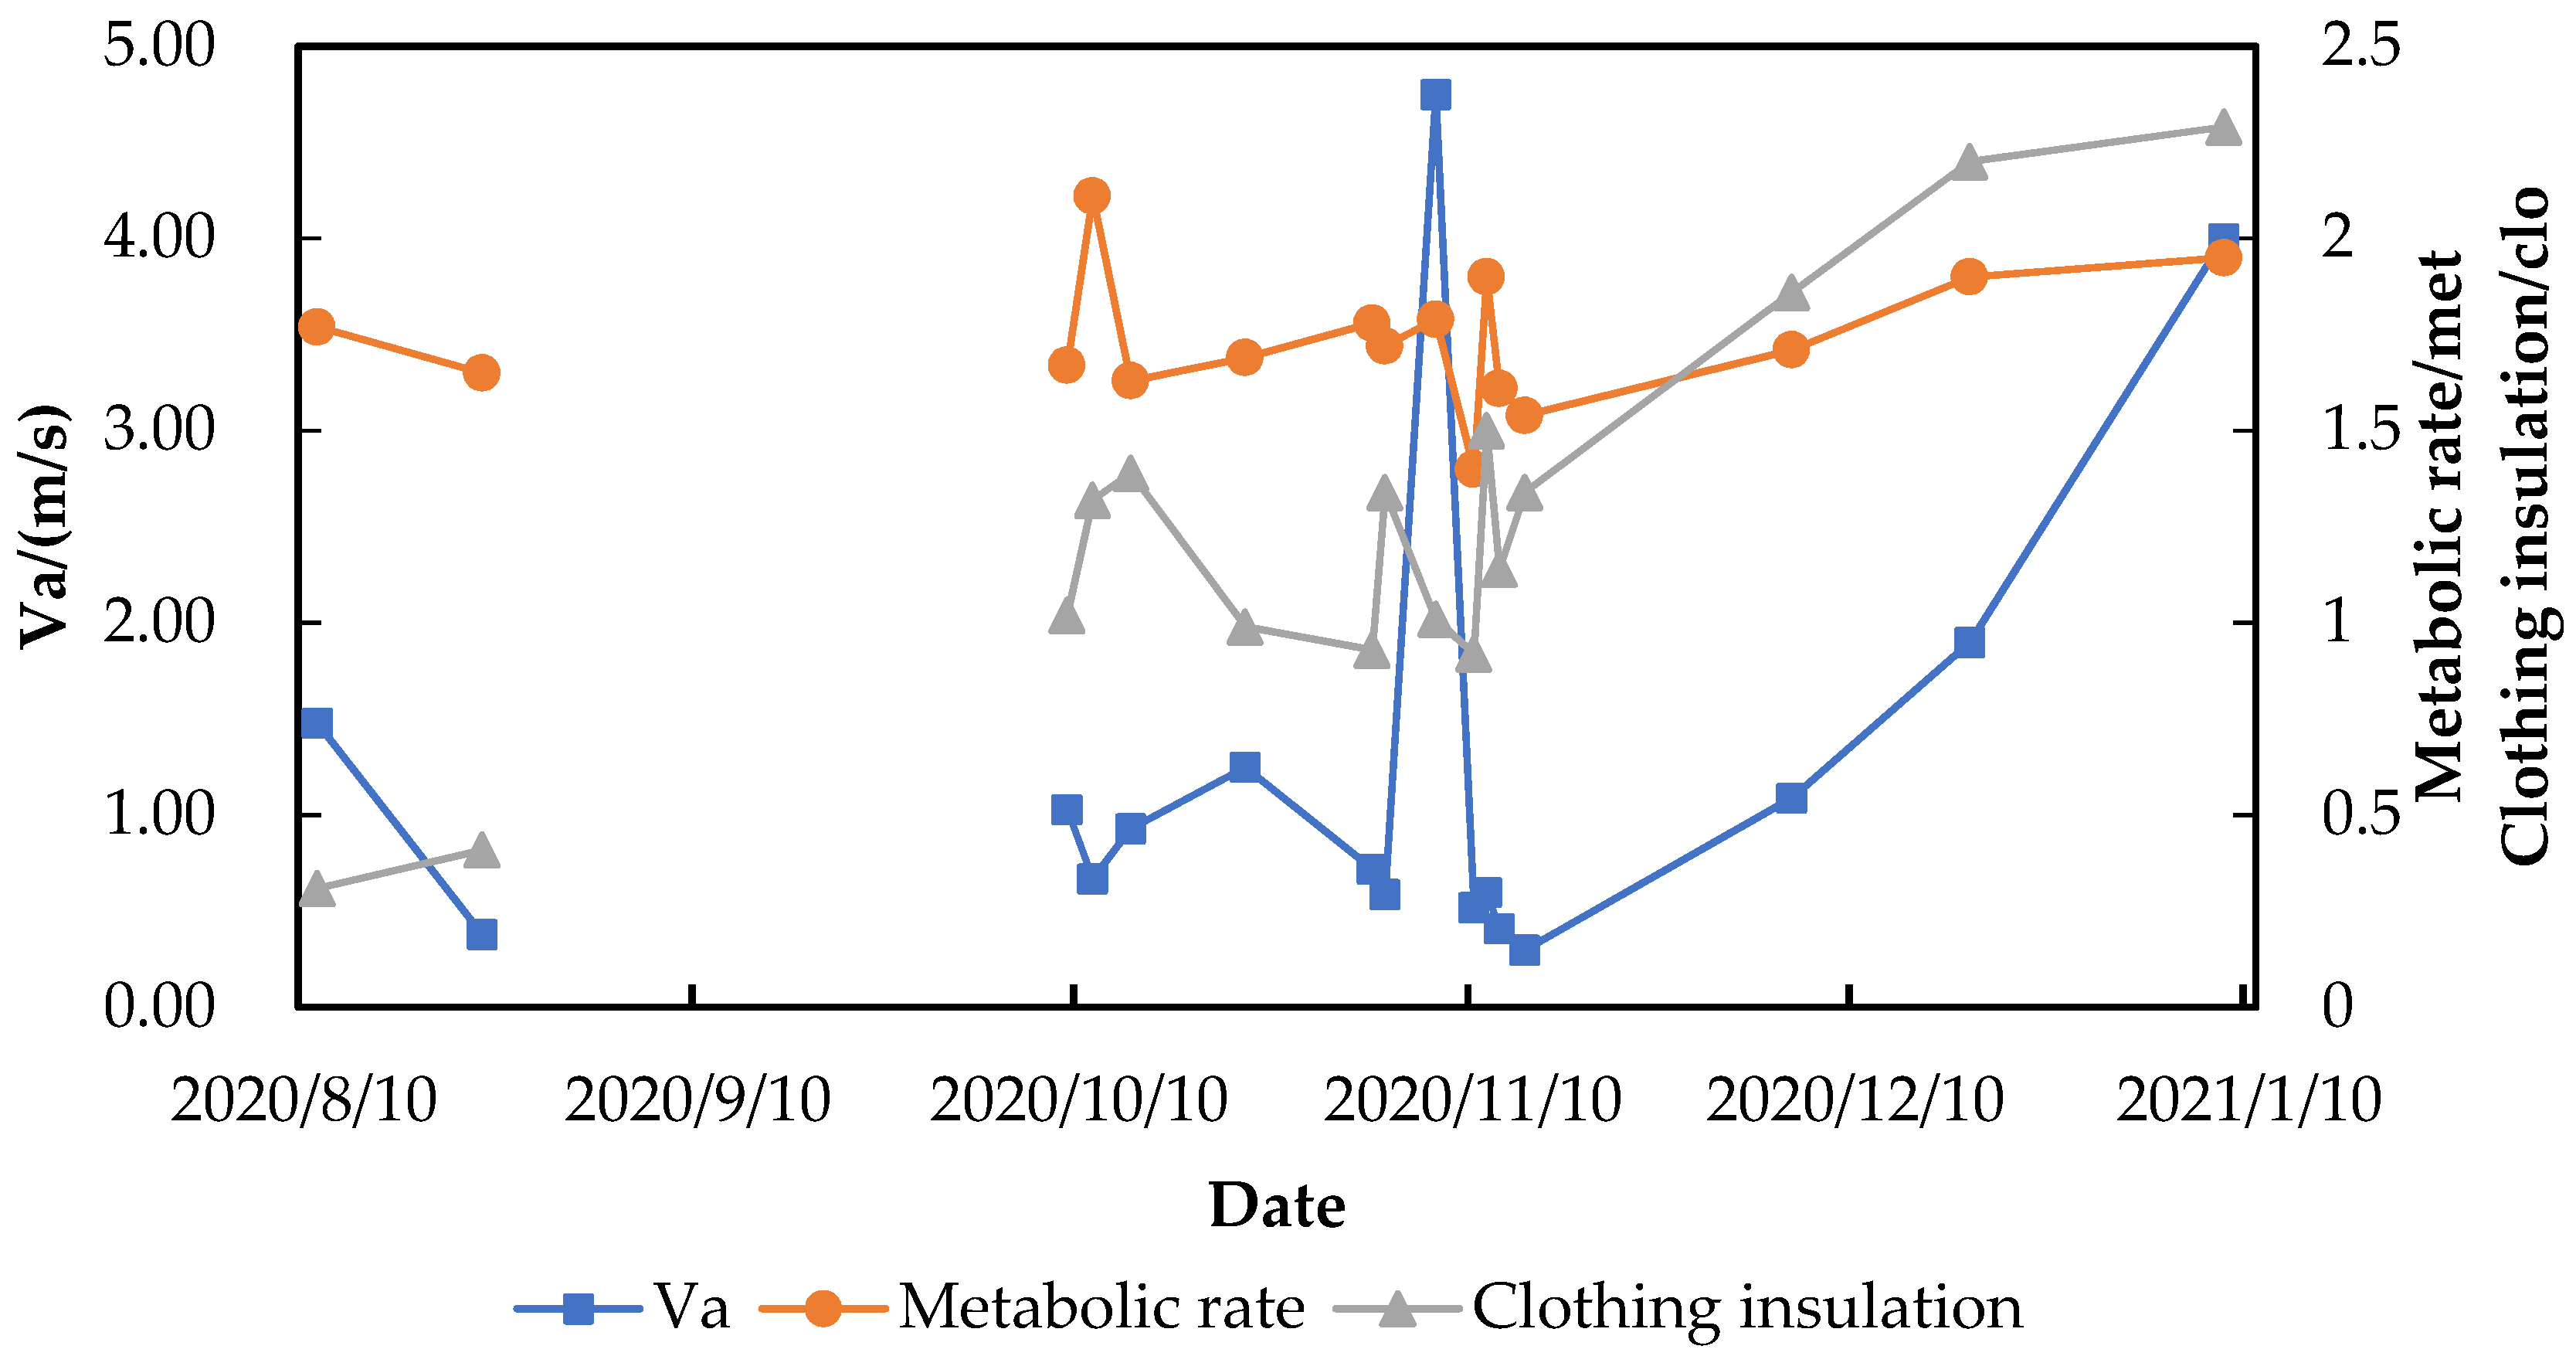
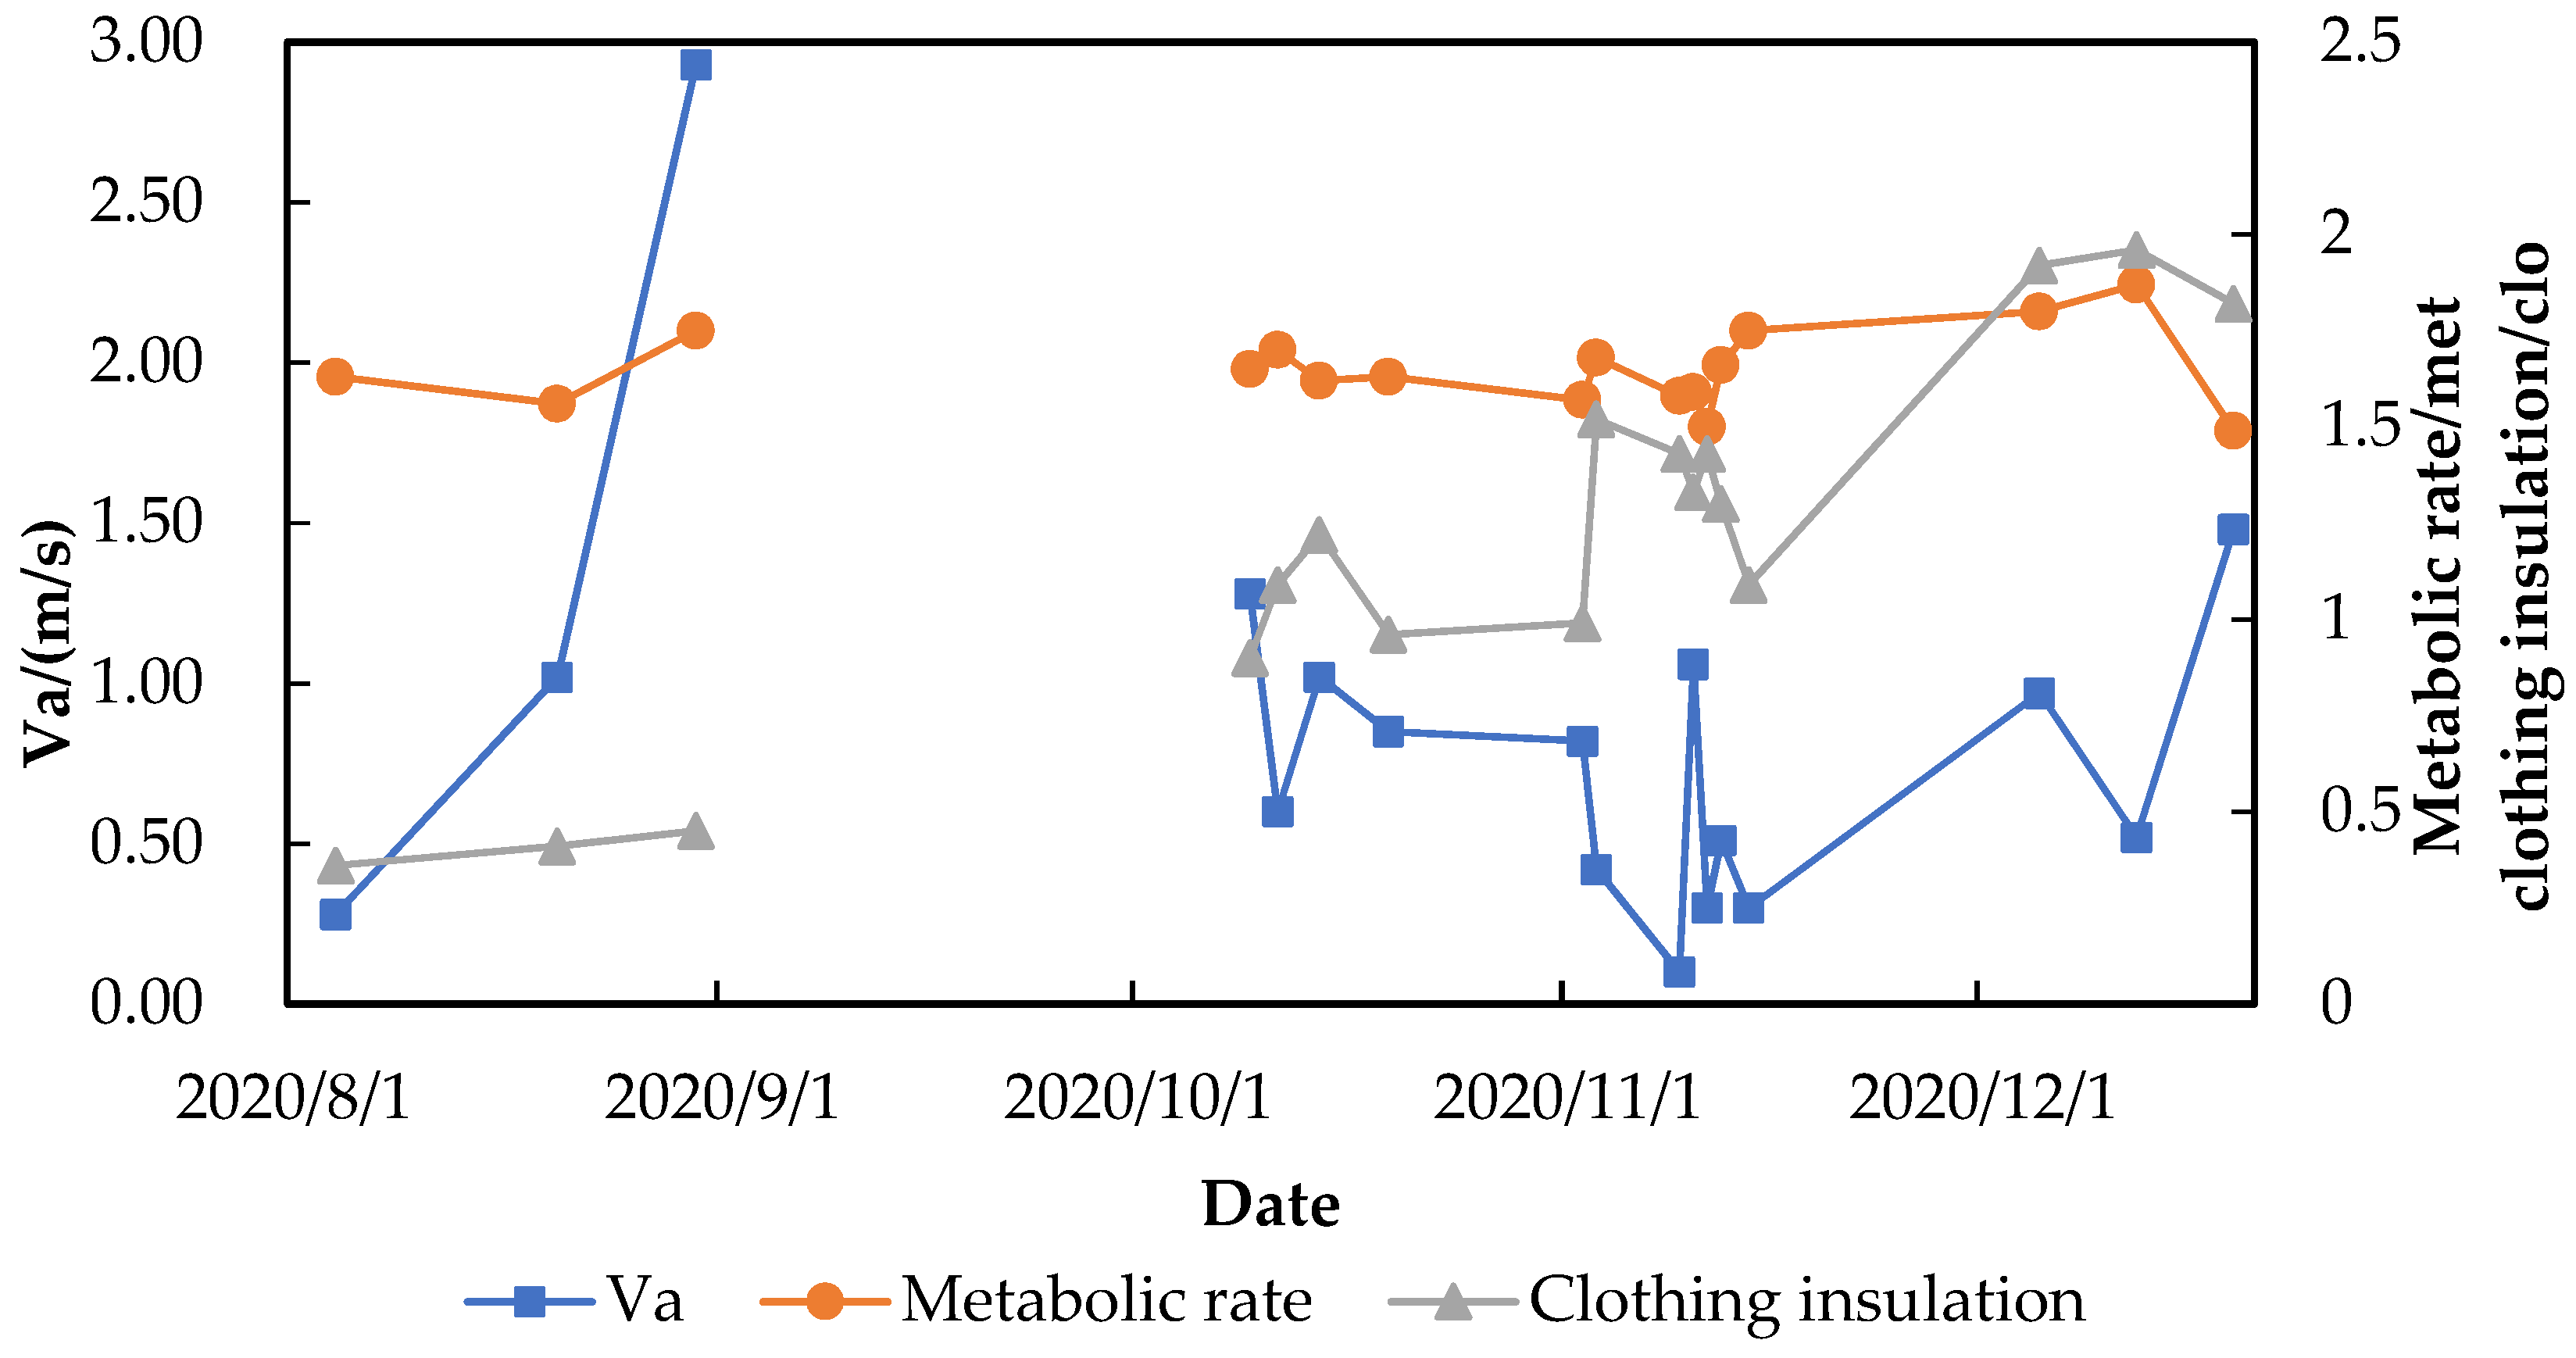
23]. The metabolic rate, clothing insulation, and mean wind speed at the two sites are presented in
Figure 10 and
Figure 11. The average metabolic rate at each site fluctuated between 1.5 met and 2 met. In the square from 10 August to 10 November 2020, the clothing insulation increased from 0.4 clo in the summer to 1 clo in the autumn. From 10 November 2020 to 8 January 2021, clothing insulation also increased from 0.92 clo to 2.29 clo as the wind speed increased. At the lake side, clothing insulation increased from 1.09 clo to 1.96 clo when the wind speed increased from 0.1 m/s to 1.5 m/s. These findings suggest that in the winter as the wind speed increases, people will wear more clothes to protect them from the cold wind, and their metabolic rate have no significant changes.
3.4.2. Psychological Adaptation
Psychological adaptation refers to the decrease in an evoked sensation’s intensity after repeated or periodic exposure to an environmental stressor [
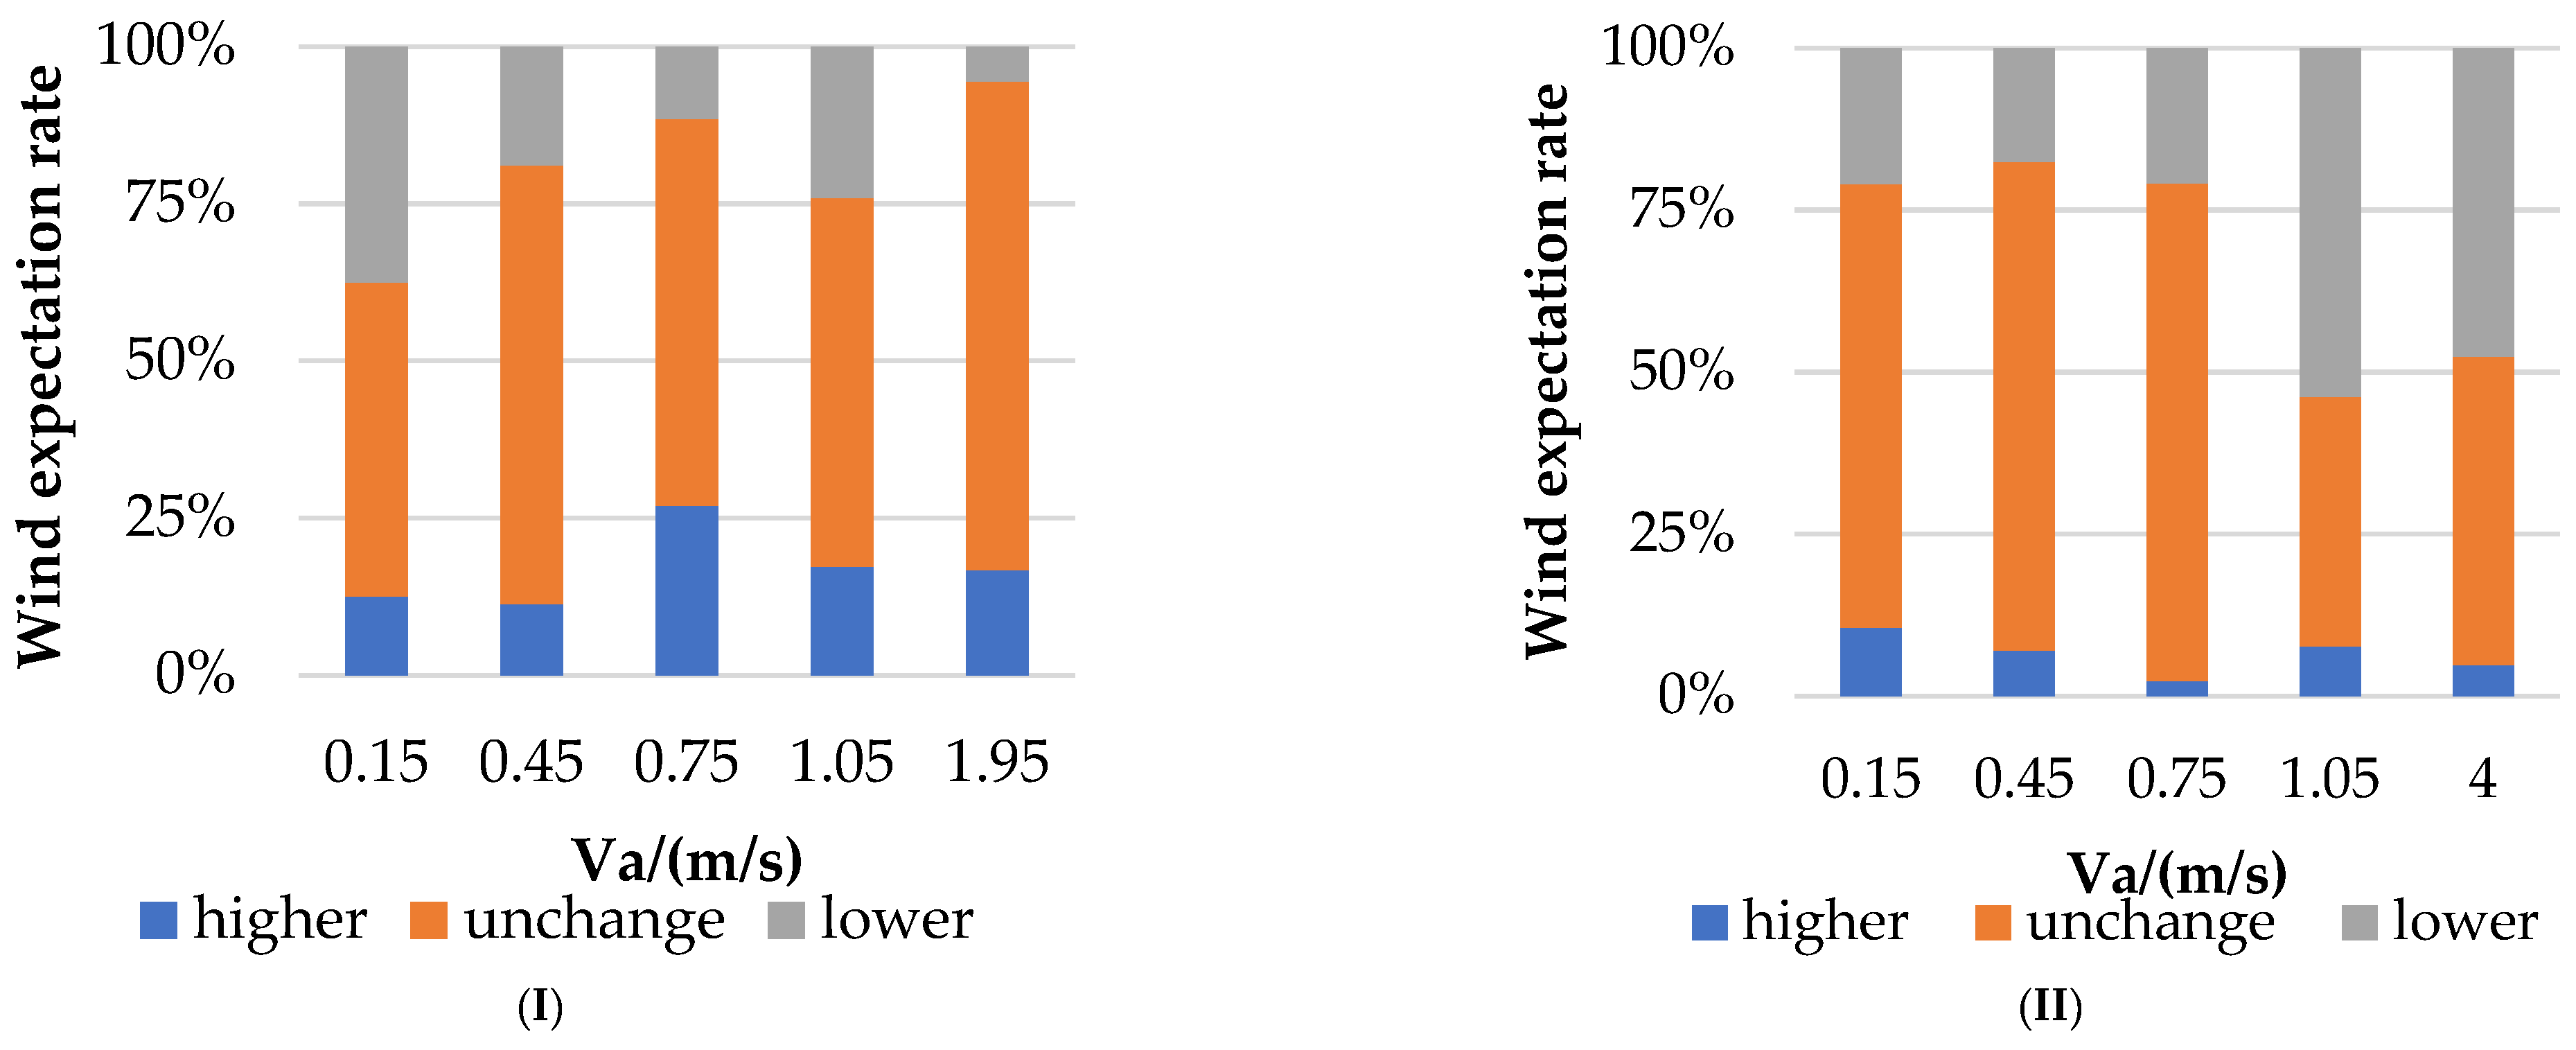
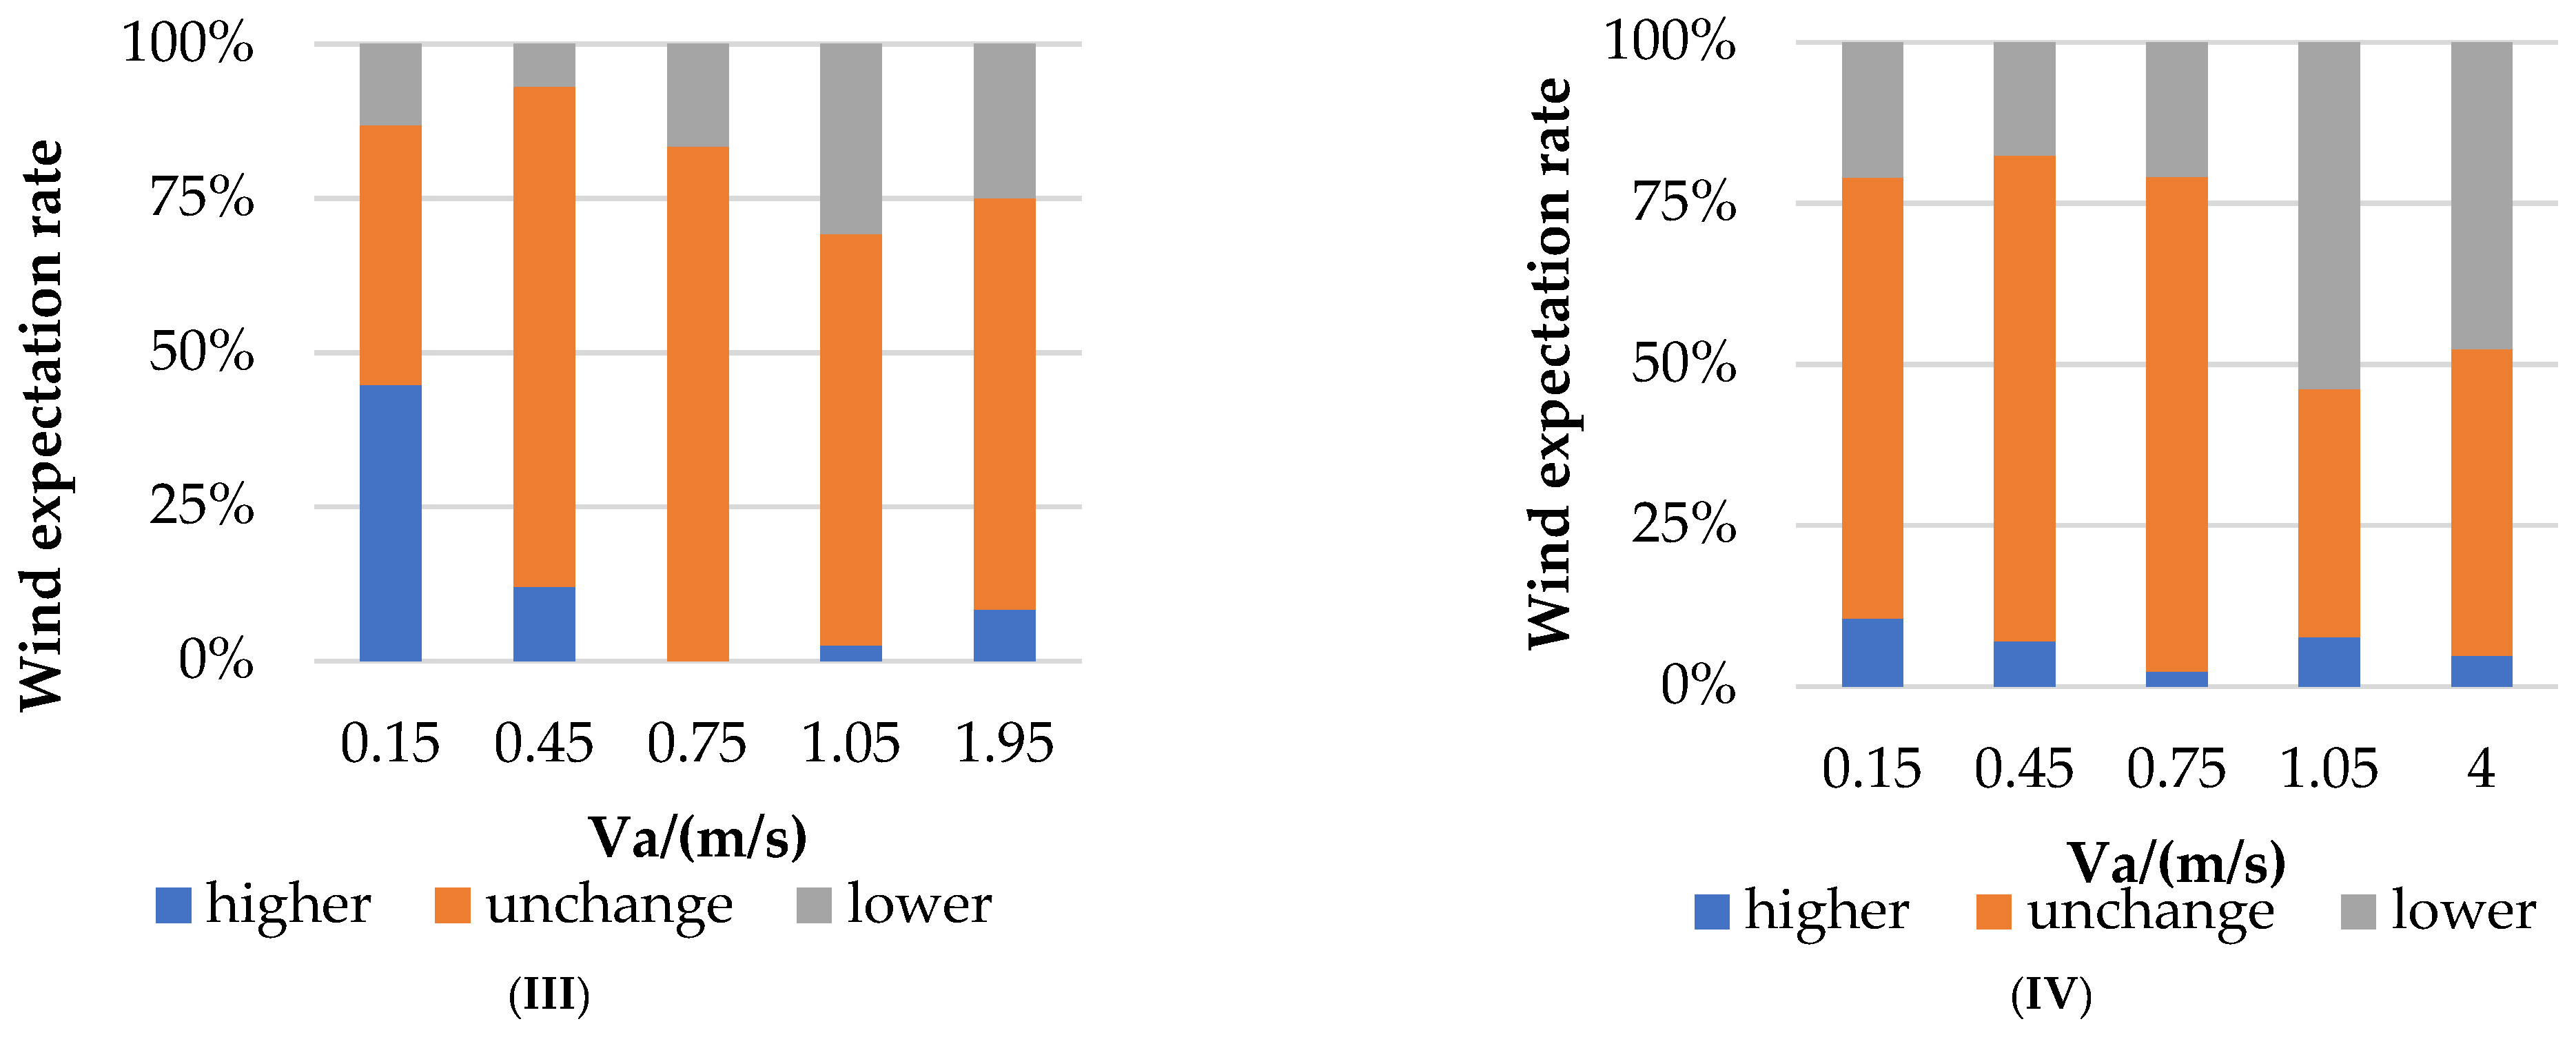
18]. The wind expectations of the four groups (see in Part 3.2.3) in each 0.3 m/s wind speed bin are shown in
Figure 12. When the wind speed was ≥1.05 m/s, 50% of the subjects in group II want the wind speed to be “lower”, but it is only 25% in group I, i.e., half that in group II. When the wind speed was around 0.75 m/s, only 2% of the subjects in group II want the wind speed to be “higher”, which was significantly lower than that in group I (26%). When the wind speed was around 0.15 m/s, 45% of the subjects in group III want the wind speed to be “higher”, but only 14% in group IV want it. The difference among people’s expectation under the same wind speed indicates that people is more adapted to high wind speed in Summer, and more adapted to low wind speed in Winter.
4. Discussion
According to the Results, the overall wind environment in the study cites are stable in most of the research period, differences of the subjective wind perception (namely, wind sensation vote, wind comfort vote and wind expectation) between the two test cites (namely, square and lake side) are mainly caused by other meteorological parameters, especially air temperature and solar radiation. However, meteorological parameters are rarely considering among conventional criteria, thus it is necessary to verify the reliability and validity of the results. We have taken similar studies in different regions for comparation. Harbin, located in severe cold region, and Hong Kong, located in hot and humid region, were chosen to compare with Xi’an.
As for the wind comfort in severe cold region in winter, Harbin was chosen as the research city. Shui et al. had proposed a new wind comfort criteria for cities in severe cold areas [
20]. In winter, when air temperature is below 0 °C and wind speed is above 5 m/s, it is likely to have a chance of frostbite. According to Xin et al. [
21], the thermal sensation vote (TSV) was lower in windy conditions compared with wind-free conditions at the same temperature level, and the influence of the wind increased as the air temperature also increased. In this study, the overall air temperature is above 0 °C and the wind speed below 5 m/s, the wind sensation of the same wind speed in different air temperature is almost the same.
In hot and humid regions, the combination between wind speed and other meteorological parameters matters, especially under extremely high air temperature. Hong Kong was selected for comparation. Du et al [
22] had developed a new criteria for wind comfort in hot and humid region. When the wind speed is below 1.5 m/s and the air temperature is above 30 °C, it is regarded to be unacceptable. As for the thermal sensation, when the air temperature is less than 30 °C during the summer in Hong Kong, a wind speed greater than 2.1 m/s will reduce the TSV caused by solar radiation, but higher wind speeds will exacerbate discomfort when the air temperature exceeds 32 °C [
16]. While in this study, due to less solar radiation wind speed below 1.5 m/s is still within wind acceptable range, even when the air temperature is above 30 °C.
Comparisons of these cities indicate that People in different climatic zones have biased subjective feelings at the same wind speed. The air temperature had a very important effect in the severely cold region, but solar radiation had a greater impact in the hot and humid region. However, there is no clear evidence that relative humidity has a great effect on the wind comfort. As for Xi’an, all the above factors have played a role in affecting people’s wind perception, but none of them appeared to be significantly correlated to it.
5. Conclusions
In this study, a questionnaire survey was conducted to assess the wind comfort in Xi’an and meteorological measurements were also collected. This study aimed to enhance our understanding of the outdoor wind comfort in a cold region of China. The following conclusions can be made based on the results and comparisons with previous studies.
(1) In general, the wind sensation was moderate in this study, where more people considered that the wind speed was “low” (11.34%) compared with those who assessed it as “high” (8.47%). The wind comfort varied as the wind sensation changed at the different test sites. When the WSV ranged between −1 and 1, the wind comfort fluctuated above 1. When WSV was above 1 or below −1, the WCV and degree of wind discomfort were lower.
(2) Seasonal differences were found in wind adaptation among the study subjects. When the wind speed fluctuated within 1 m/s, the clothing insulation increased from 0.4 clo in the summer to 1 clo in the autumn. In addition, the clothing insulation increased to more than 1.5 clo when the wind speed exceeded 1 m/s in the winter. The expectations of wind speeds to be less than 1.05 m/s were greater in the winter than in the summer. Our results indicate that people are more adapted to high wind speed in Summer, and more adapted to low wind speed in Winter.
(3) The acceptable wind ranges for more than 90% of the subjects were (0 m/s, 2.02 m/s) in the square and (0.01 m/s, 2.86 m/s) at the lake side. The Vn values for groups I, II, III, and IV were 1.18 m/s, 0.95 m/s, 1.10 m/s, and 0.71 m/s, respectively. The Vn value decreased as the air temperature decreased.


