Article

An Innovative Modelling Approach Based on Building Physics and Machine Learning for the Prediction of Indoor Thermal Comfort in an Office Building

1
Integrated Environmental Solutions R&D, D01 Dublin, Ireland
2
Laboratoire d’Innovation pour les Technologies des Energies Nouvelles et les Nanomatériaux (CEA-LITEN), Department of Solar Energy, 73370 Le Bourget-du-Lac, France
*
Author to whom correspondence should be addressed.
Buildings 2022, 12(4), 475; https://doi.org/10.3390/buildings12040475
Submission received: 31 December 2021 / Revised: 17 March 2022 / Accepted: 27 March 2022 / Published: 12 April 2022
(This article belongs to the Special Issue Buildings: 10th Anniversary)

Abstract

:
The estimation of indoor thermal comfort and the associated occupant feedback in office buildings is important to provide satisfactory and safe working environments, enhance the productivity of personnel, and to reduce complaints. The assessment of thermal comfort is a difficult task due to many environmental, physiological, and cultural variables that influence occupants’ thermal perception and the way they judge their working environment. Traditional physics-based methods for evaluating thermal comfort have shown shortcomings when compared to actual responses from the occupants due to the incapacity of these methods to incorporate information of various natures. In this paper, a hybrid approach based on machine learning and building dynamic simulation is presented for the prediction of indoor thermal comfort feedback in an office building in Le Bour-get-du-Lac, Chambéry, France. The office was equipped with Internet of Things (IoT) environmental sensors. Occupant feedback on thermal comfort was collected during an experimental campaign. A calibrated building energy model was created for the building. Various machine learning models were trained using information from the occupants, environmental data, and data extracted from the calibrated dynamic simulation model for the prediction of thermal comfort votes. When compared to traditional predictive approaches, the proposed method shows an increase in accuracy of about 25%.

1. Introduction

The prediction of indoor environmental quality (IEQ) levels in office buildings is important for providing satisfactory and safe work environments, to enhance the productivity of personnel, and to reduce complaints [1]. Recent research studies in health, wellbeing, and productivity in buildings show that satisfaction is affected by many different environmental, physical, and psychological factors [2]. For example, a strong connection between daylight and student performance was found in [3], and correlations between productivity levels and indoor thermal conditions for office buildings were found in [4,5]. Studies show that the overall costs associated to people for companies can be divided following the 1-9-90 estimation [6]: one percent of the operative cost is associated to energy, nine percent is associated to building rental costs, and ninety percent is associated to the cost of personnel. This explains why, in recent years, occupant health, comfort, wellbeing, and productivity have been considered among influential factors for performance evaluations from a facility management perspective. Maintaining satisfactory work conditions during the operation of a building can be difficult, as building control strategies should be able to account for different factors affecting thermal and visual comfort and air quality as well as noise, odours, and nuisance. The achievement of holistic control over IEQ is challenging, as it requires advanced evaluation capabilities of the current and future conditions for the occupants and how they interact with the environment [7]. In this context, in order to optimise IEQ, building control approaches need to take into account direct feedback from the occupants as well as a variety of additional decision variables of different natures, which may increase the complexity of the control problem [8].
Thermal comfort is affected by many factors related to the indoor environments and their occupants, such as the physical properties of a space (e.g., air temperature, humidity, solar radiation, surface temperatures, and air speed) [9], ambient and human body parameters, psychological characteristics of the occupants [9,10], gender [11], background, and ethnicity [12]. Reliable thermal comfort models should be able to consider a wide range of inputs and subjective preferences. In recent years, many different techniques have been proposed for the prediction of thermal comfort, such as: mathematical modelling of the heat transfer between the human body and the environment [9]; the coupling of human thermal comfort models with computational fluid dynamics (CFD) analyses [10,13,14,15,16]; Fanger’s physics-based method for the evaluation of the predicted mean vote (PMV) and the predicted percentage of dissatisfied (PPD) [2]; adaptive models that refer to the behavioural, psychological, and physiological adaptation of the humans in an indoor environment over time [17,18]; data-driven applications based on artificial neural networks (ANN) [17]; methods based on fuzzy logic [18]; Bayesian approaches [19]; and methods based on other machine learning (ML) techniques [20]. Overall, thermal comfort models can be classified as physics-based or data-driven approaches. These studies show the difficulties in achieving a holistic approach to thermal comfort and focus on particular areas of interests. Recently, with the proliferation of light, portable, and easy to access and use IoT devices, a large amount of data have been collected from the built environment. Data proliferation from buildings provided the basis for the development of innovative machine learning models. ML models showed the ability of learning complex interactions among the available data, surpassing in accuracy the current comfort calculation methods [21,22]. Given the learning nature of these approaches, they can consider complex phenomena, such as biased decision, as well as personalised preferences, such as direct feedback, making them flexible in terms of targeting large audiences [23]. Among the different ML methods tested in the literature, the random forest (RF) algorithm seems to reach the best performances [24]. Advanced ensemble machine learning (EML) methods have been successfully adopted for thermal perception prediction [25] as well as more recent studies related to the use of deep learning techniques [26]. The use of artificial neural network models has been suggested for thermal comfort and sensation vote prediction in naturally ventilated buildings [27]. Other ML-based methods have been investigated to detect outliers in subjective thermal comfort campaigns by the means of anomaly detection techniques and by quantifying the dissimilarity of the occupants’ votes from their peers under similar thermal conditions [28]. From these studies emerged that one of the main limitations of data-driven models is their dependency on historical data and the challenges in predicting conditions that largely differ from their training environment. The thermal comfort problem has been addressed not only with innovative techniques but also with a focus on testing alternative inputs for the models [29]. As such, a combination of readings of skin temperatures and settings of the personalized heating system as input parameters in personal thermal comfort models have been suggested, with a substantial prediction accuracy improvement compared to the more traditional approaches [30,31]. Nearable and wearable solutions have been implemented to provide additional inputs to personalized predicted models [32] by extending the range of measurements that is possible to collect from users and, therefore, facilitating the investigation and development of personalised scenarios [33]. Individual thermal comfort levels have been suggested, as opposed to average votes, by leveraging more granular and precise data that are able to describe environmental and human factors as inputs [20]. Nevertheless, innovative data collection techniques may be expensive as well as intrusive and require full participation of the occupants.
The prediction of thermal comfort feedback from occupants of a building is a complex problem. Recently, several studies underlined the main limitation of traditional methods to predict thermal comfort, such as the limited accuracy achieved when compared to actual votes from the occupants (41.68–65.5% [2]); the need for dedicated expensive equipment for capturing specific environmental variables; the inability to consider non-physics-related variables (e.g., real feedback, preferences, and behavioural patterns); and the need for time-consuming, costly, and difficult setups, as in the case of CFD analyses. One explanation for the identified validation discrepancies is that traditional methods only leverage a limited set of variables for the calculations. Considering this, several research studies started to address the thermal comfort satisfaction as a holistic concept that encompasses behavioural, physiological, and psychological aspects. From a technical point of view, this translates to the adoption of unconventional methods based on real data, data analysis, and, more recently, machine-learning techniques. Nevertheless, data-driven approaches rely on the available data, which, if it is scarce, may affect the prediction capability of the model. They require expensive equipment and the setup of dedicated data collection campaigns. Hybrid modelling, intended as the combination of data-driven methods and physics-based approaches, is rarely adopted, although it could overcome many shortcomings of the most traditional methods. In recent years, with the rapid diffusion of IoT devices, a large amount of high-resolution data became available from the built environment [20], facilitating the creation of accurate digital twins of buildings, defined here as accurate and calibrated building energy models. When calibrated, digital twin models can be considered as an additional source of information and a virtual asset to assess the environmental quality of a building [34] and to generate scenarios. This is performed by extracting virtual sensor variables from simulations for which the equivalent real variables would be difficult and expensive to measure by sensors (e.g., operative temperature, mean radiant temperature, surface temperature, heat fluxes, etc.) [29]. This approach has not been fully leveraged in the literature. Therefore, the current work contributes to the current literature by focusing on three main objectives:
  • Test the capabilities of ML models when used for predicting the thermal comfort votes of occupants.
  • Combine the use of ML models with physics-based dynamic simulation to leverage virtual sensor variables and to generate dynamic predictions of relevant thermal comfort metrics.
  • Establish a comparison with traditional normative methods for the evaluation of thermal comfort.

2. Materials and Methods

The research methodology presented in this work is based on the combination of data-driven methods and building dynamics simulation techniques for the creation of an accurate predictive model. First, relevant data are collected by organising an occupant comfort experiment in a building case study and by installing a network of IoT sensors to gather relevant environmental information. Then, an accurate calibrated building energy model is generated. The calibrated model is used to satisfy two objectives: (i) to use simulation variables (virtual sensors) to extend the set of predictors of the ML model and (ii) as a client of a co-simulation framework for data exchange between the dynamic energy model and an ML algorithm that is used for dynamic prediction of thermal comfort values. As a result, the scenario evaluation capabilities of the physics-based simulation model can be used to generate data for operational scenarios of the building and can be processed by the ML model trained for this purpose.

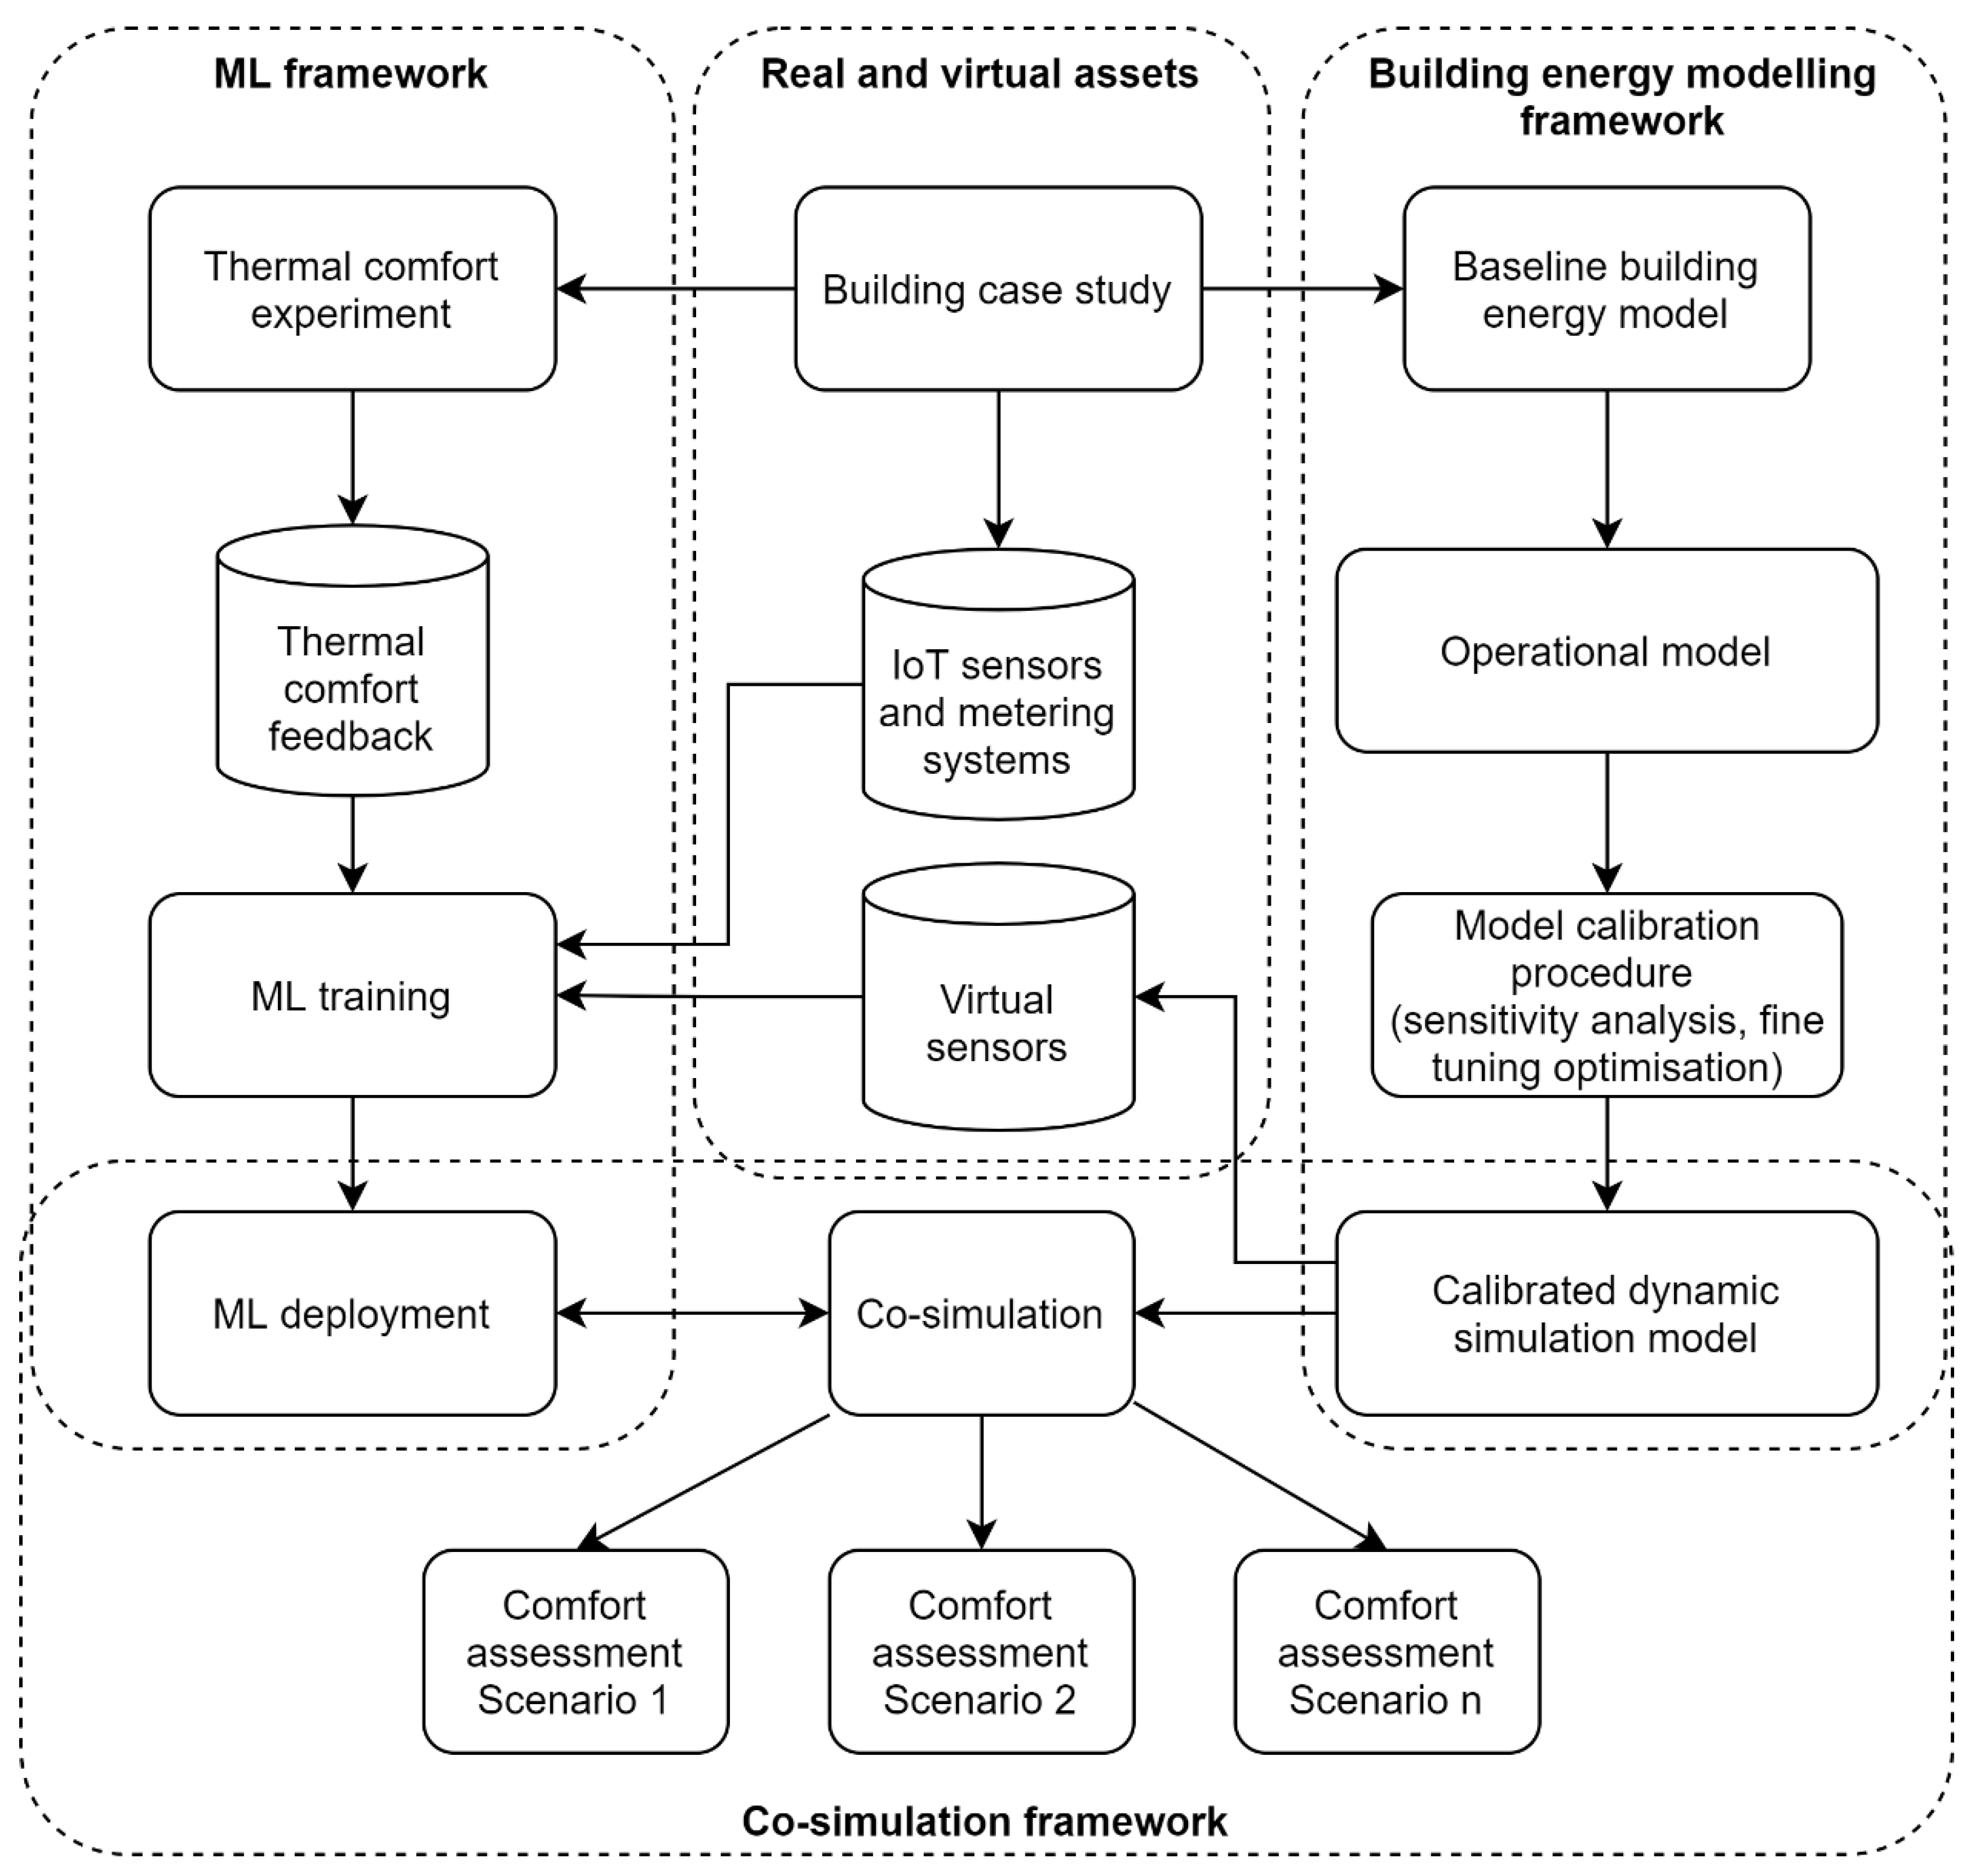
2.1. Methodology Overview and Workflow

Figure 1 shows the different parts of the methodology presented in the current paper. Three major workflows can be identified: (i) a data-driven part related to the training and deployment of a machine learning model starting from the occupant feedback; (ii) a building energy modelling framework based on a physics-based model and the workflow relative to its calibration; and (iii) a co-simulation framework that allows for a robust data exchange between the dynamic simulation model and the ML model. The following sections describe in detail the different parts of the methodology.

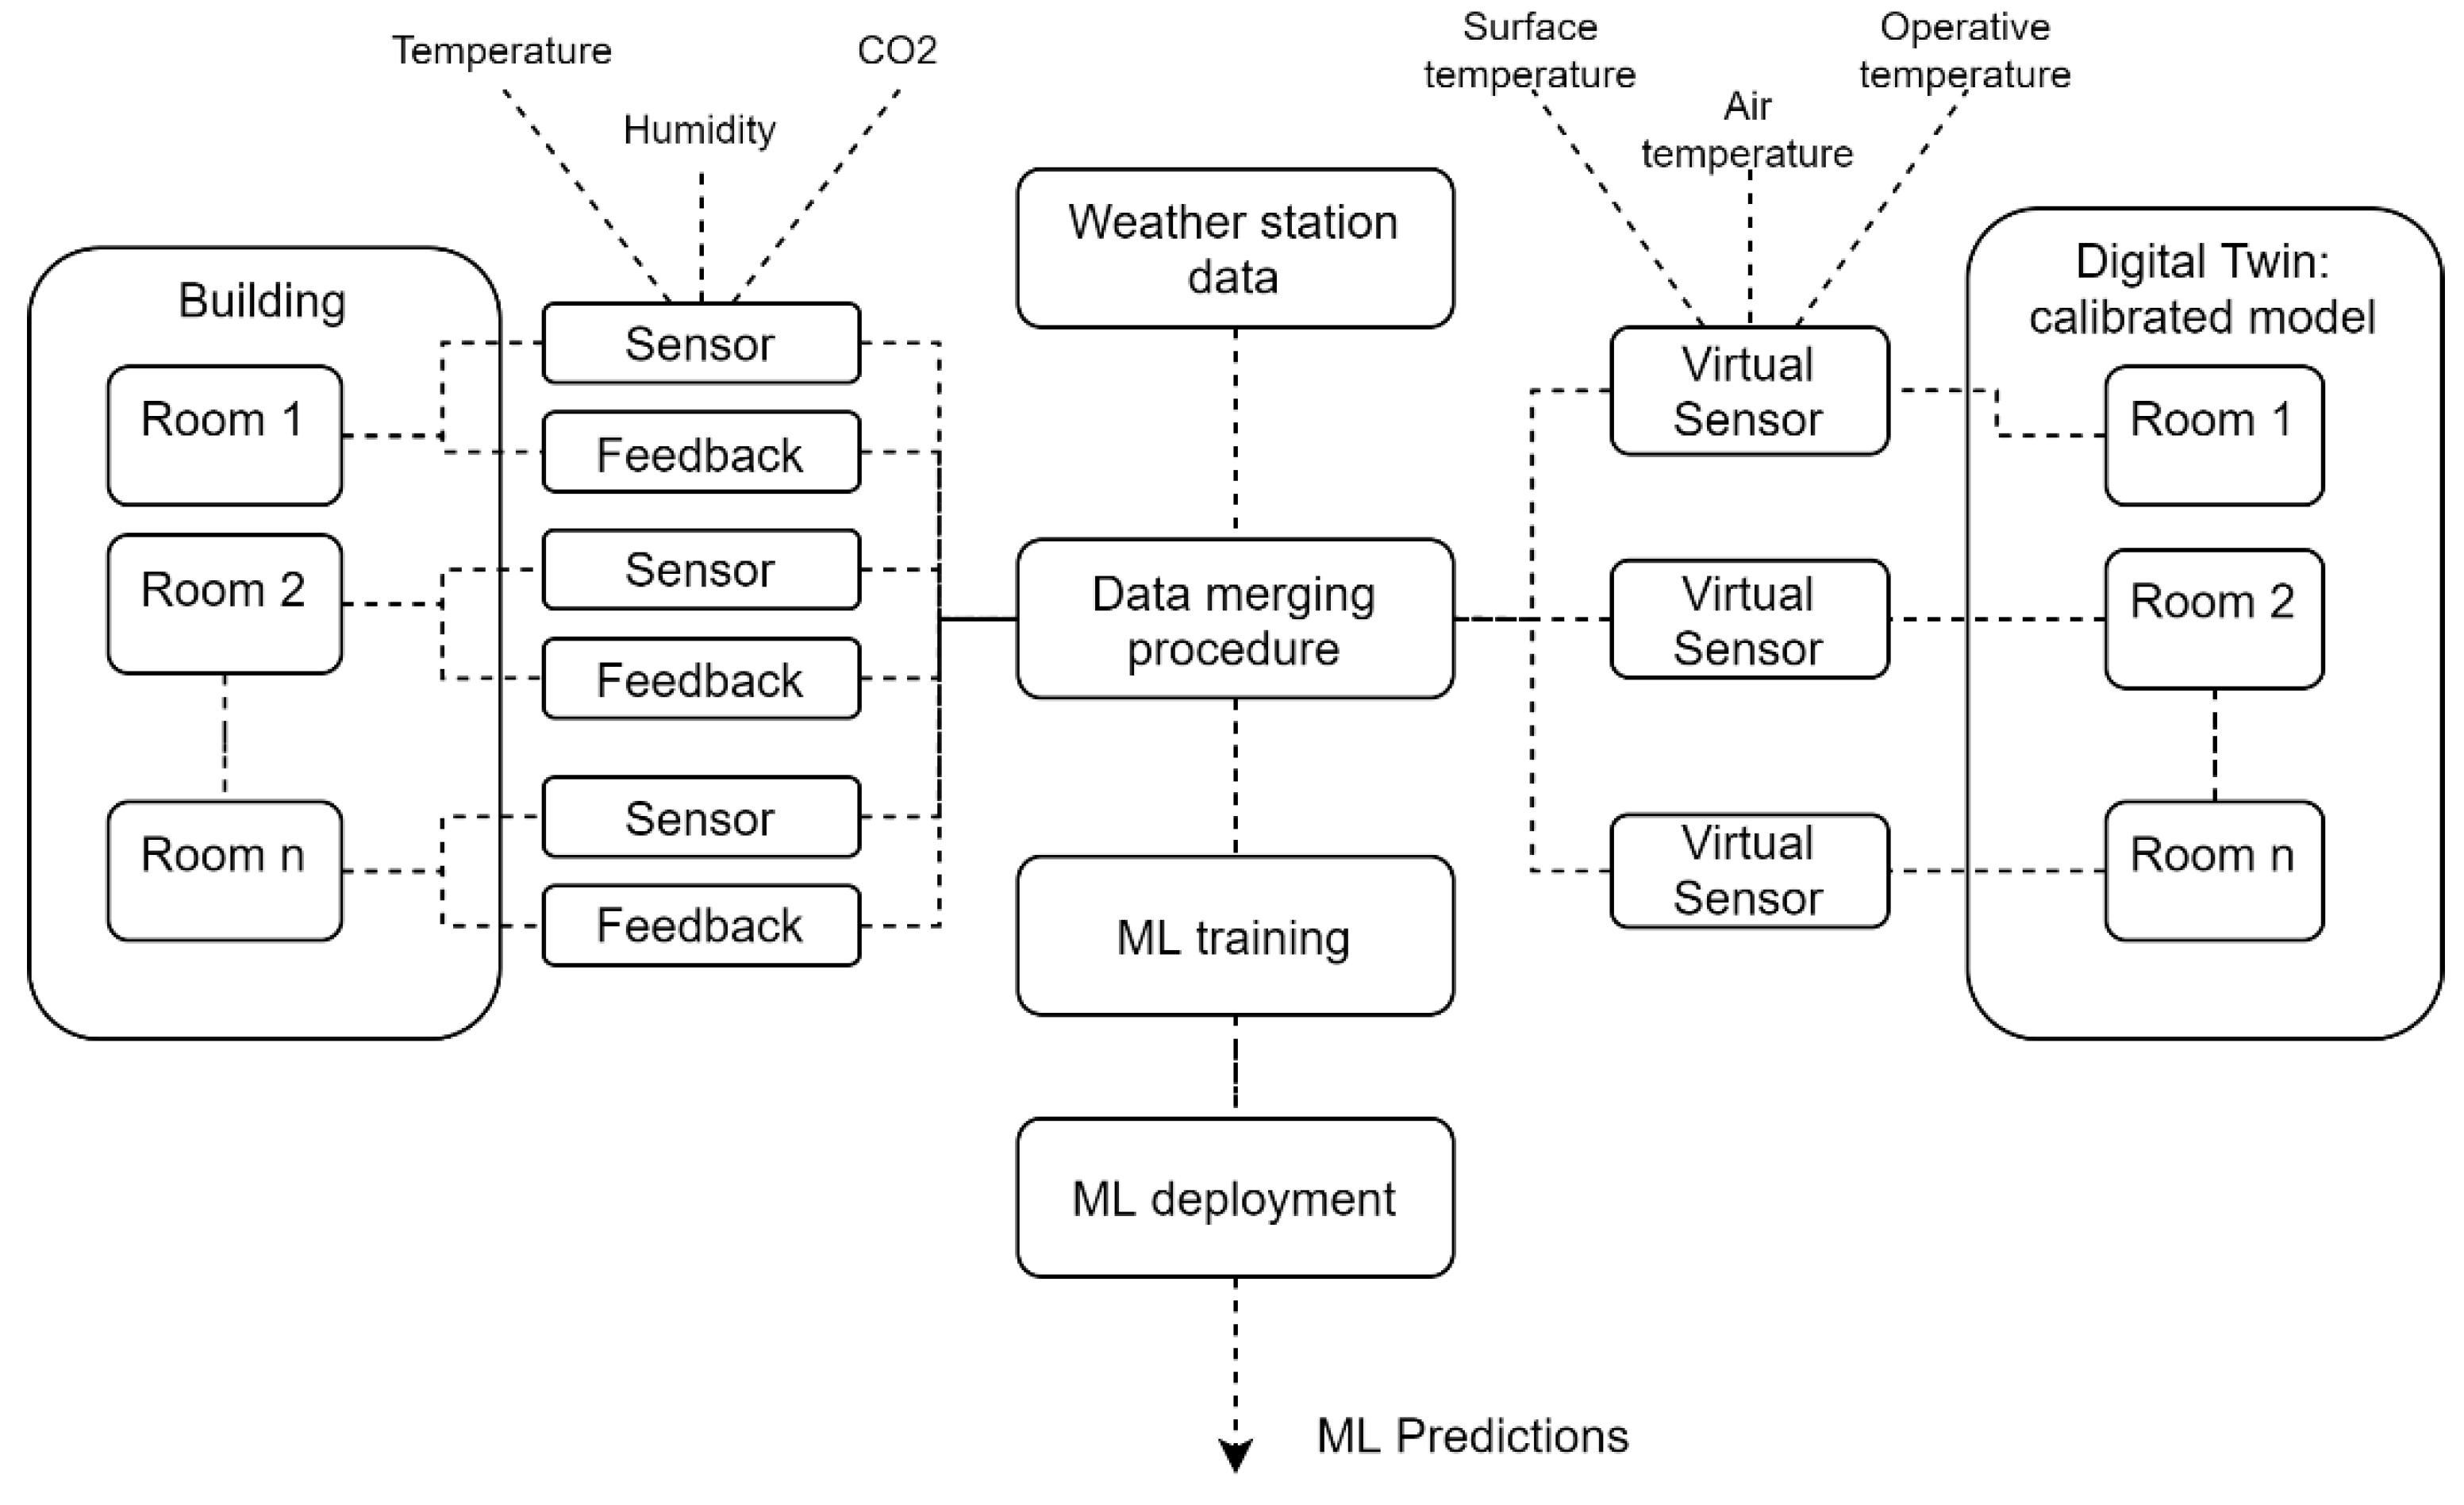
2.2. ML Framework: Thermal Comfort Experiment and Data-Driven Modelling

An innovative data-driven predictive approach for thermal comfort estimation is deployed with the following objectives: (i) investigate a novel method to predict actual thermal comfort votes using ML approaches; (ii) evaluate the accuracy of the models and validate the results; (iii) compare the results of different predictive methods; (iv) identify the most suitable model for the case study; and (v) enable a data exchange mechanism between a dynamic simulation software and the ML model.
The first step to address the research objectives is the setup of a thermal comfort experiment. For this purpose, a data-gathering procedure is required to collect the required inputs for the training of the ML model and for the calibration of the dynamic simulation model. IoT sensors measuring temperature, CO2, and humidity levels as well as data coming from BMS systems and local weather stations are employed in this phase for both the calibration of the energy model and the training of the predictive algorithms. The target variable of the ML model is the comfort vote; therefore, a data collection campaign is required to ensure that comfort feedback votes are collected in different parts of the buildings and during an extensive period. Several thermal comfort devices (tablets) are installed in different rooms of the building to let the users submit their feedback. Once the relevant data are collected, each dataset is pre-processed to remove missing values, to convert/translate different labels, perform imputation, if required, and restructure the dataset in the desired format. Following this, a data merging procedure, summarized in Figure 2, is used to combine the IoT sensor data and the thermal comfort votes as well as the information from the dynamic simulation model. This is achieved by relating the closest date-time stamp of the IoT sensor measurements with the closest feedback vote and simulation result; a tolerance of 30 min is used to map and merge the data. Therefore, for a room, the IoT sensor data, feedback votes, and virtual sensor results coming from the dynamic simulation model are combined in a unique dataset.
Next, feature engineering procedures are implemented to generate the set of predictors for the ML models. The timestamps of the sensor readings are further processed to extract the hour, the day, the day of the week, and the month as numerical values. The thermal comfort votes are classified and divided in a seven or three value scale as recommended by the ASHRAE guidelines for thermal comfort. The thermal comfort scales are reported in Figure 3. The objective of the ML models is to classify the thermal comfort vote on a fixed scale; therefore, the problem falls under the multi-output classification methods. Two different tests are conducted using either seven- or three-value scales to test the accuracy of the different ML methods, with the objective to identify the best-performing approach.
The training of the ML model is performed by splitting the total dataset into training and testing parts. This approach is required to use a part of the historical data for tuning the parameters of the ML models in order to achieve the best predictive results and to have a set of unseen values to validate the model. A 70/30% ratio is used to split the dataset into the training and testing parts. The selection of the best ML model is performed by testing several ML techniques that are commonly used in the literature. The k-neighbours, decision tree, random forest, logistic regression, gradient boosting methods are tested, and their accuracy is recorded for comparison. In order to achieve a more granular evaluation of thermal comfort and to provide continuous results rather than a categorical scale, a regression approach is employed. The method is based on Bayesian modelling and enables the evaluation of the votes of the occupants in a non-deterministic way. This approach is considered more appropriate to reflect the subjective uncertainties related to thermal comfort inputs, the actual comfort model, and the subjective votes of the occupants. To this end, a multi-linear regression method was selected as the right candidate for the problem formulation. A description of the method is reported below, where v indicates the predicted vote, a is the intercept, W (b, c, d, e) are the weights in the equation, and X (x1, x2, x3, x4) are the predictors.
v = a + bx 1 + cx 2 + dx 3 + ex 4 +
v = XW + ε
v ~ N ( XW , σ 2 )
P ( W | v , X ) = P ( v | W , X ) × P ( W , X ) P ( v , X | W i ) dW i
Equation (4) describes the Bayesian formulation that was adopted. The method involves the use of a resampling approach based on the Markov chain Monte Carlo technique with the “no-u-turn” algorithm [35]. The training part of the Bayesian method uses the available historical data to generate the most probable distribution for the weights of the predictors. In this way, by resampling each distribution and providing input parameters, it will be possible to obtain a prediction of the vote. To reflect the non-deterministic philosophy of the method, multiple samplings are used to generate a distribution of the output. This also reflects the idea that it is likely to obtain a distribution of values from multiple people, rather than a single vote. Further analyses of the results allow for the estimation of expected maximum and minimum values of the thermal feedback in those particular conditions.
One of the underlining objectives of the analysis was to simplify the number of predictors for the model. Therefore, five predictors were used: (i) the dry bulb external temperature, (ii) the internal air temperature, (iii) the mean radiant temperature, (iv) the hour of the day, and (v) the month. The mean radiant temperature is a parameter that considers heat transfer by radiation and can be measured with a sensor called a black-globe or globe-thermometer. To adequately calculate the thermal comfort, the mean radiant temperature would ideally be measured considering all the surfaces in the room; however, such an exercise would be complex and costly if carried out continuously in every room of the building. In order to alleviate this issue, the mean radiant temperature is evaluated with the use of the calibrated building energy model. For this purpose, the calibration of environmental variables, such as air temperature, is considered fundamental to obtaining reliable results of other derived measurements for a room. To provide this input to the ML model, the sensor data are combined with the simulation results for that particular room and time. The deployment of the model is facilitated in a co-simulation infrastructure where the dynamic simulation software sends data to the ML model for predictions at each time step as described in Section 2.4. The comparison with the normative methods is achieved by calculating the more traditional thermal comfort metrics, such as the PMV index. This is achieved by leveraging the Python module ‘Pythermalcomfort’. The module is linked to the dynamic simulation software to extract, at each simulation time-step, metrics related to the PMV-PPD method. The ‘true vote’ of the occupants is reconstructed for an entire year. This is achieved by associating the closer value of the vote to the environmental conditions recorded for the building in the case of data gaps. To this end, outdoor temperature, indoor temperature, CO2 concentration, and relative humidity have been used to identify the closest vote to the environmental conditions and remove the data gap.

2.3. Physics-Based Simulation

One of the first steps in the methodology requires the creation of a baseline building energy model. This can be developed using a dynamic simulation software. An extensive data gathering campaign is organised to collect all the relevant data for the generation of the building energy model. This data are leveraged to create a baseline model of the building. The baseline model undergoes a process of calibration that will deliver a representative digital twin of the building. The calibration process is carried out in three major phases: the generation of a baseline model, the development of an operational model, and improvement toward a calibrated and optimized model. In detail, the overall calibration process can be described in several sub-steps. First, an extensive data collection campaign is carried out to gather as much information as possible on the building, with the intent of collecting all the important parameters for the dynamic simulation software. Examples of data collected in this first step are geometry, construction properties, thermal representative templates of the building, schedules of operations, internal gains, occupancy patterns, system information, ventilation and infiltration rates or estimates, detailed heating ventilation and air conditioning (HVAC) network layouts and characteristics, hot/cold water loop components, air side systems, controls, etc… When data are not available, educated guesses and normative values are used in place of default values of the simulation software. The output of the first phase is a baseline model, the results of which are compared to the actual building data for accuracy assessment procedures. Following this, another data collection campaign is performed, this time to define the operation of the building by gathering operational data from building management systems (BMS), IoT, automated metering systems, or smart meters. This additional set of data provides information regarding the dynamic profiles and schedules of systems and occupants. Actual schedules of operations are included in the baseline model in the form of time series data to generate an accurate model of the building. A continuous data stream from sensors and metering systems generates sets of updated schedules and profiles that represent the most recent operational patterns of the building that can be included in the building energy model. This generates the operational model of the building. Accuracy assessments are repeated to establish new accuracy measures for the energy model and to check if they comply with standards such as ASHRAE Guideline 14 [36]. If a higher level of accuracy is required, an additional phase of calibration is carried out with advanced optimisation methods. This is implemented using an optimisation tool that is able to find the best values for a set of uncertain parameters that are identified through sensitivity analysis. The method searches values of uncertain parameters in a large parameter space by minimizing objective functions that are defined using calibration metrics. The objective function considers the error between the metered and simulated data. Equations (5)–(9) describe the list of calibration metrics used by the optimisation tool where the RNRMSE indicates the range- normalised root-mean-square error, which is the main calibration metric considered; the CVRMSE is the coefficient of variation of the root-mean-square error; the NMBE indicates the normalised mean-biased error; and the MAE is the mean absolute error. In the equation, Y and Y ^ indicate the measured and simulated output variables; µ indicates the mean value, and n indicates the total number of points. The user defines variables that are considered of primary importance, such as energy, or secondary importance, such as air temperature and CO2. In this way, the optimisation method is able to account for the importance of different sets of variables that will be optimised at once by minimising the relative objective functions. The use of the RNRMSE variable to perform optimisation provides the possibility to consider variables characterised by different numerical scales in the same optimisation problem. The procedure of fine-tuning by optimisation leads to the creation of a high-fidelity calibrated model that, at this stage, is a reliable emulator of the actual thermal behaviour of the building and its IEQ characteristics and can be used as predictive tool for scenario evaluation.
RNRMSE ( % ) = RMSE range ( Y ) 100 = k = 1 n ( Y k Y k ^ ) 2 n max ( Y ) min ( Y ) 100
CVRMSE ( % ) = RMSE μ 100 = k = 1 n ( Y k Y k ^ ) 2 n p 1 μ 100
NMBE ( % ) = k = 1 n ( Y k Y k ^ ) ( n p ) μ 100
MAE ( % ) = k = 1 n | Y i x i | n
RMSE = k = 1 n ( Y k Y k ^ ) 2 n p 1

2.4. The Co-Simulation Framework

The presented machine learning models described in Section 2.2 are developed for the calculation of comfort metrics. In order to leverage the scenario evaluation capabilities of the dynamic simulation software, a data exchange mechanism is deployed. To enable this, a co-simulation framework is developed to incorporate the ML models with the dynamic simulation software to generate a hybrid physics–ML method. In order to include each model in the co-simulation infrastructure, a four step process is implemented: (1) each room considered should be first calibrated on indoor environmental variables, such as CO2 or air temperature; (2) an ML model is trained on a mixture of synthetic and real data; (3) the ML model is deployed as a stand-alone entity and Python object to be called as a black box model for predictions; and (4) the deployed model is included in the co-simulation environment and fed by the dynamic simulation software, which provides, at each iteration, the required sets of inputs. By using the presented hybrid model, it is possible to fully leverage the dynamic simulation software for the creation of control scenarios for the enhancement of the operation of the building.

3. Results

The following section describes the results of the presented methodology. First, the case study building is described by providing information on the thermal comfort experiment conducted to gather relevant feedback from the occupants. Then, the steps and the results for the creation of the calibrated energy model are described, with particular attention to the validation and comparison with the real data gathered from the metering systems and IoT devices in the building. Next, the results of the training/tuning and validation of the machine learning models are presented.

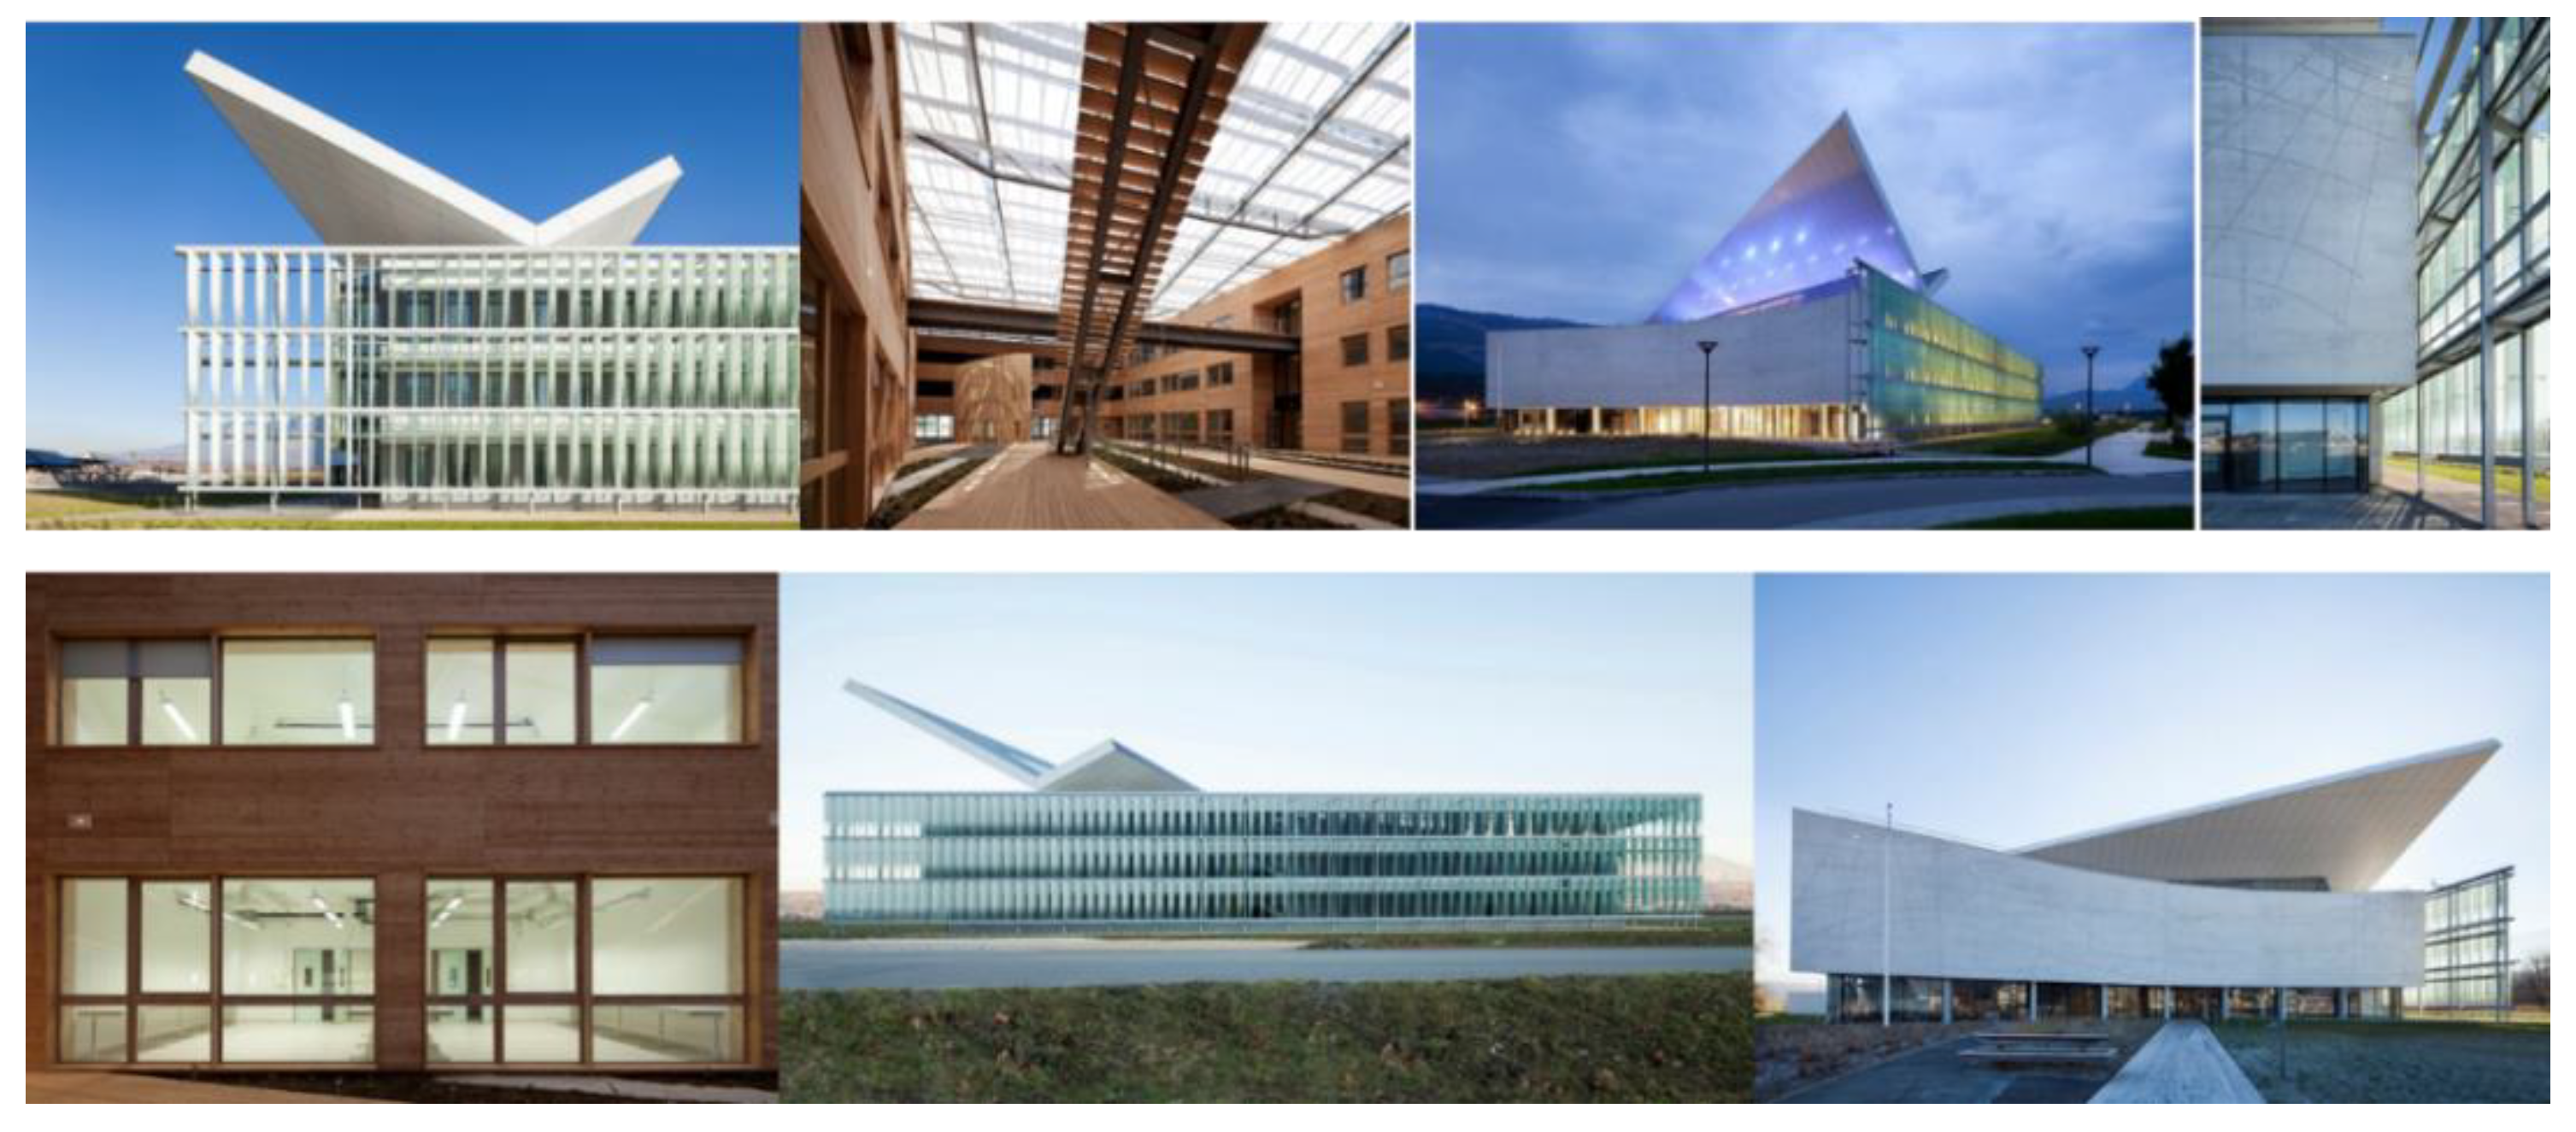
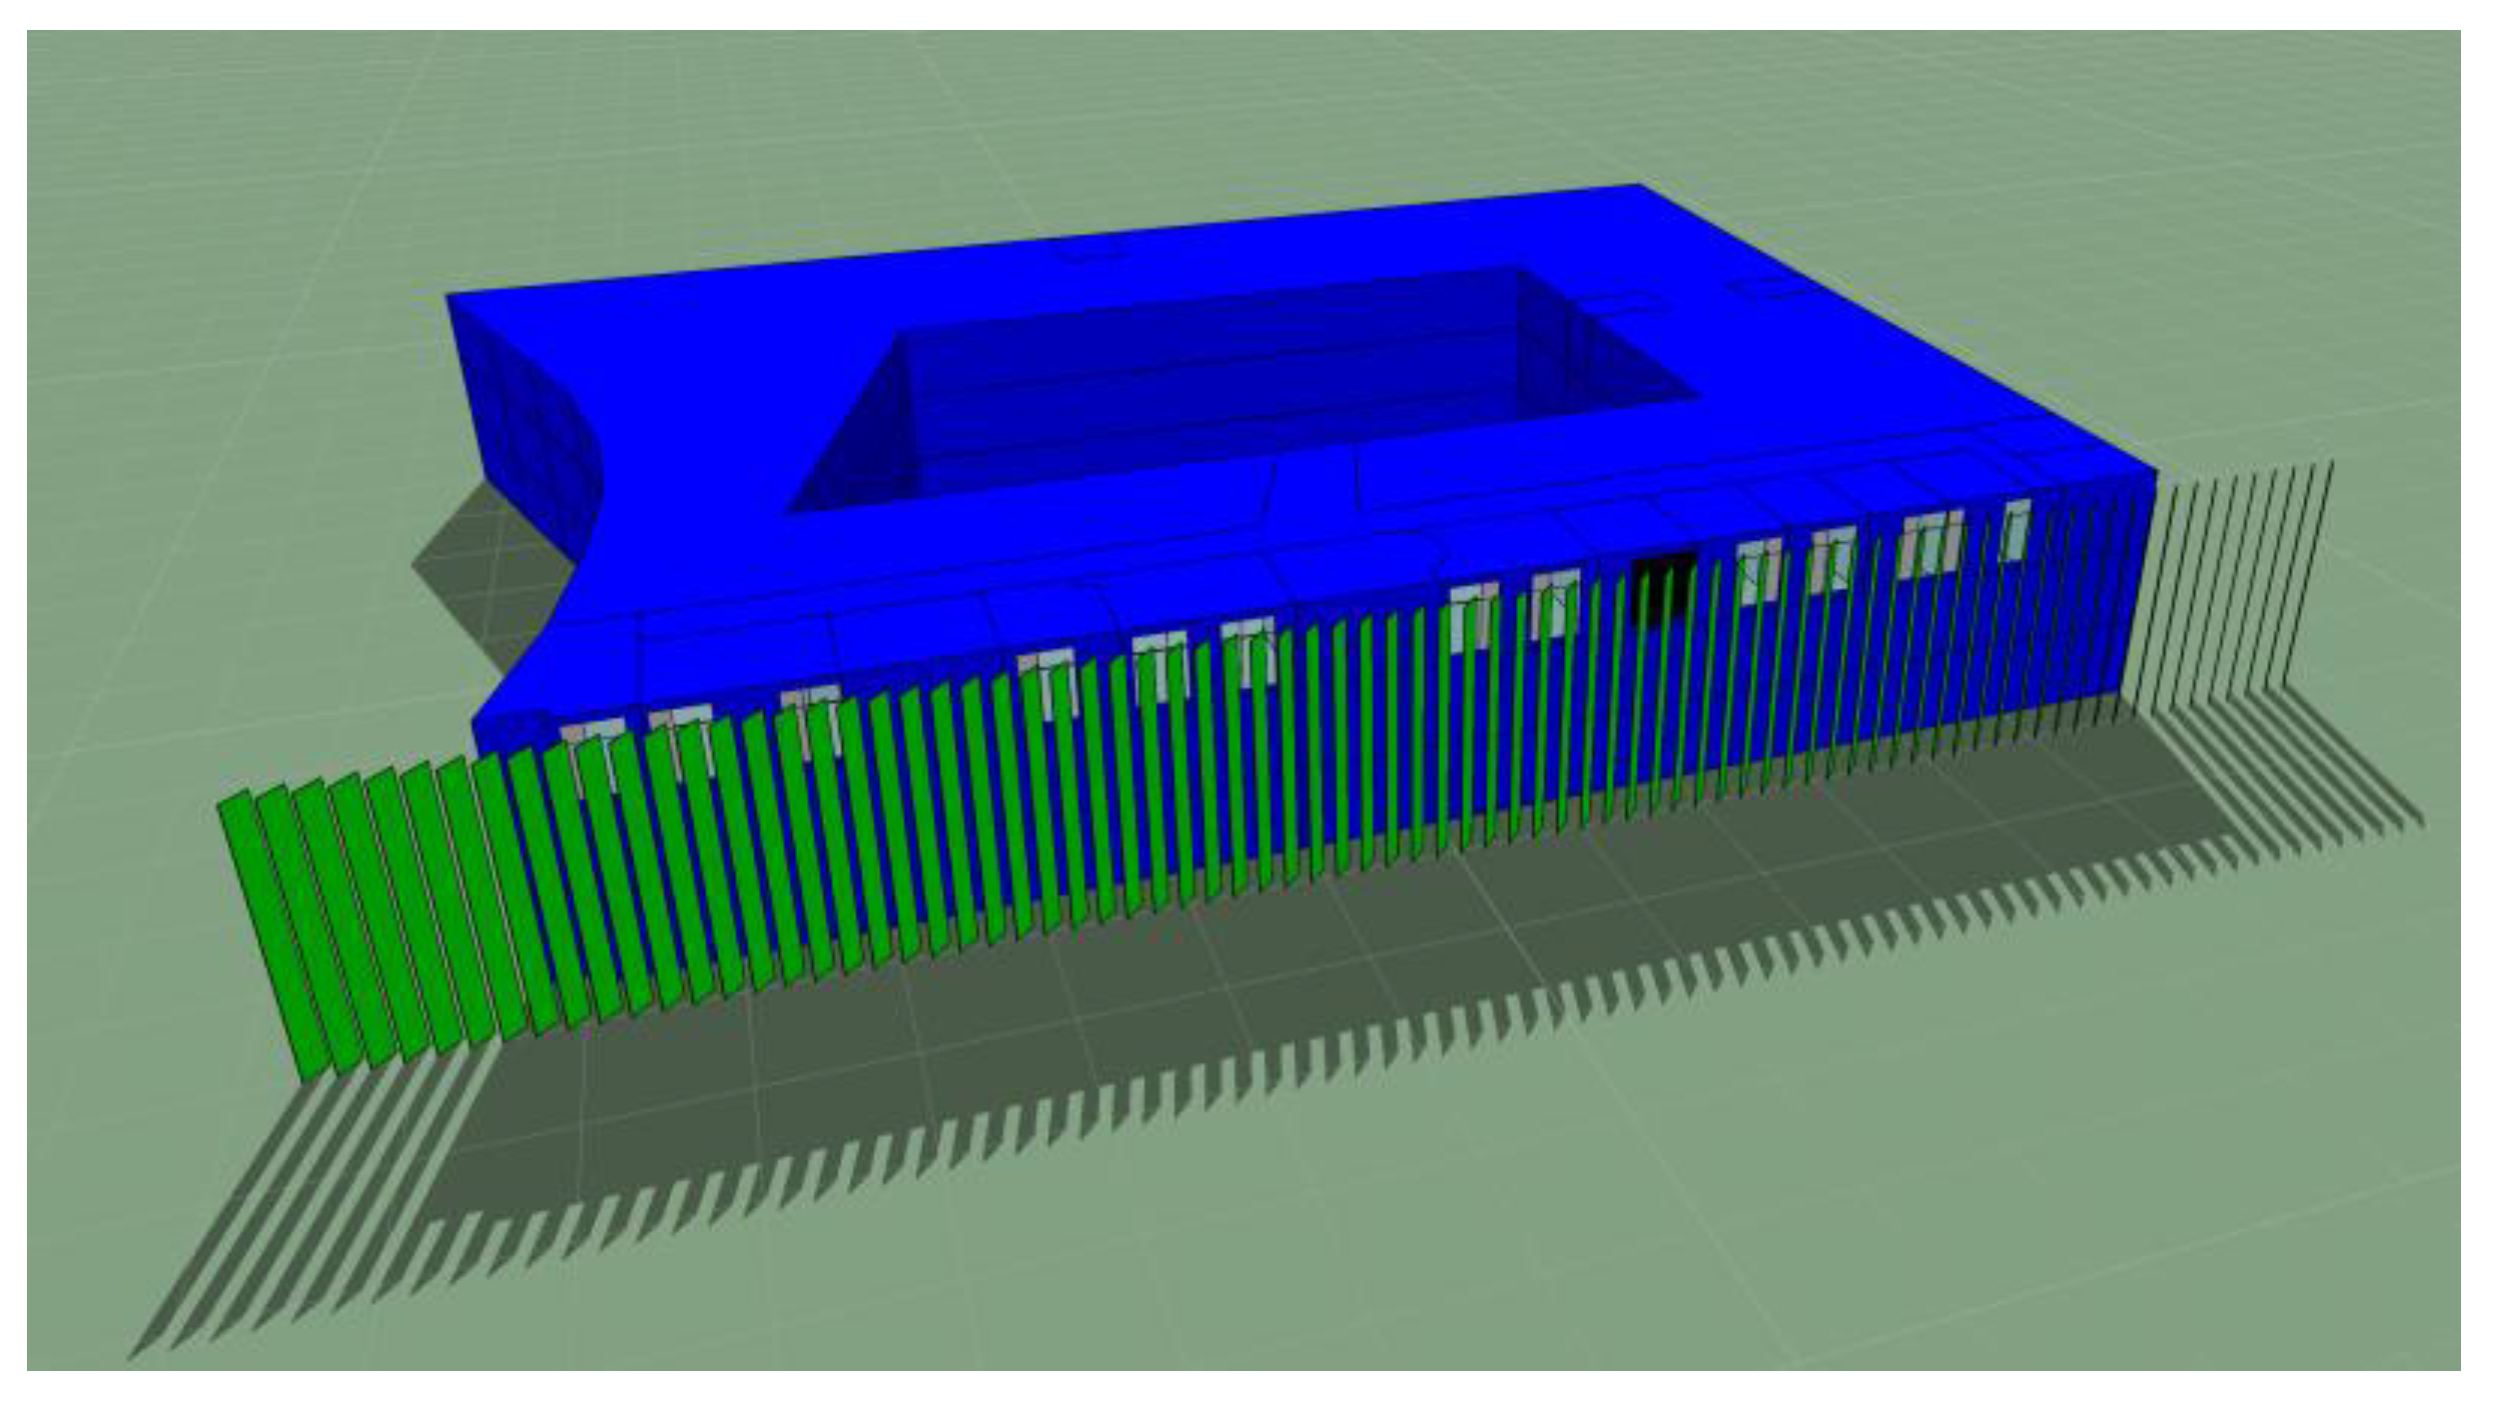
3.1. The Building Case Study: The Helios Building

The Helios building is located at the southern end of the Savoie Technolac science and technology park in the city of Chambéry, France. The building is the headquarters of the National Solar Energy Institute (INES). Delivered in December 2013, the building houses the institute’s laboratories and the directors’ offices as well as the administrative services and training departments, covering an area of 7500 sq.m. Figure 4 shows the building layout. Each room in the building case study is equipped with one or more CO2/T/S Trend series sensors. The CO2/T/S series sensors monitor the carbon dioxide concentration, temperature, and humidity of the air. The space sensors operate with the following technical specifications: a range from 0 to 2000 ppm for the CO2 concentration measurement with an accuracy of ±50 ppm +2% of the measured value; a range of 0 °C to +40 °C with an accuracy of ±3 °C for the temperature values; and a range of 0 to 95 %RH with ±3 % RH accuracy. Each sensor is connected to a Trend IQ3 Controller and to the BMS of the building. The IoT sensors were used for monitoring the openings in each room (windows and doors) as well as to monitor the electric consumption of fans. The z-wave power socket series (Fibaro) was used for electric fan operations.

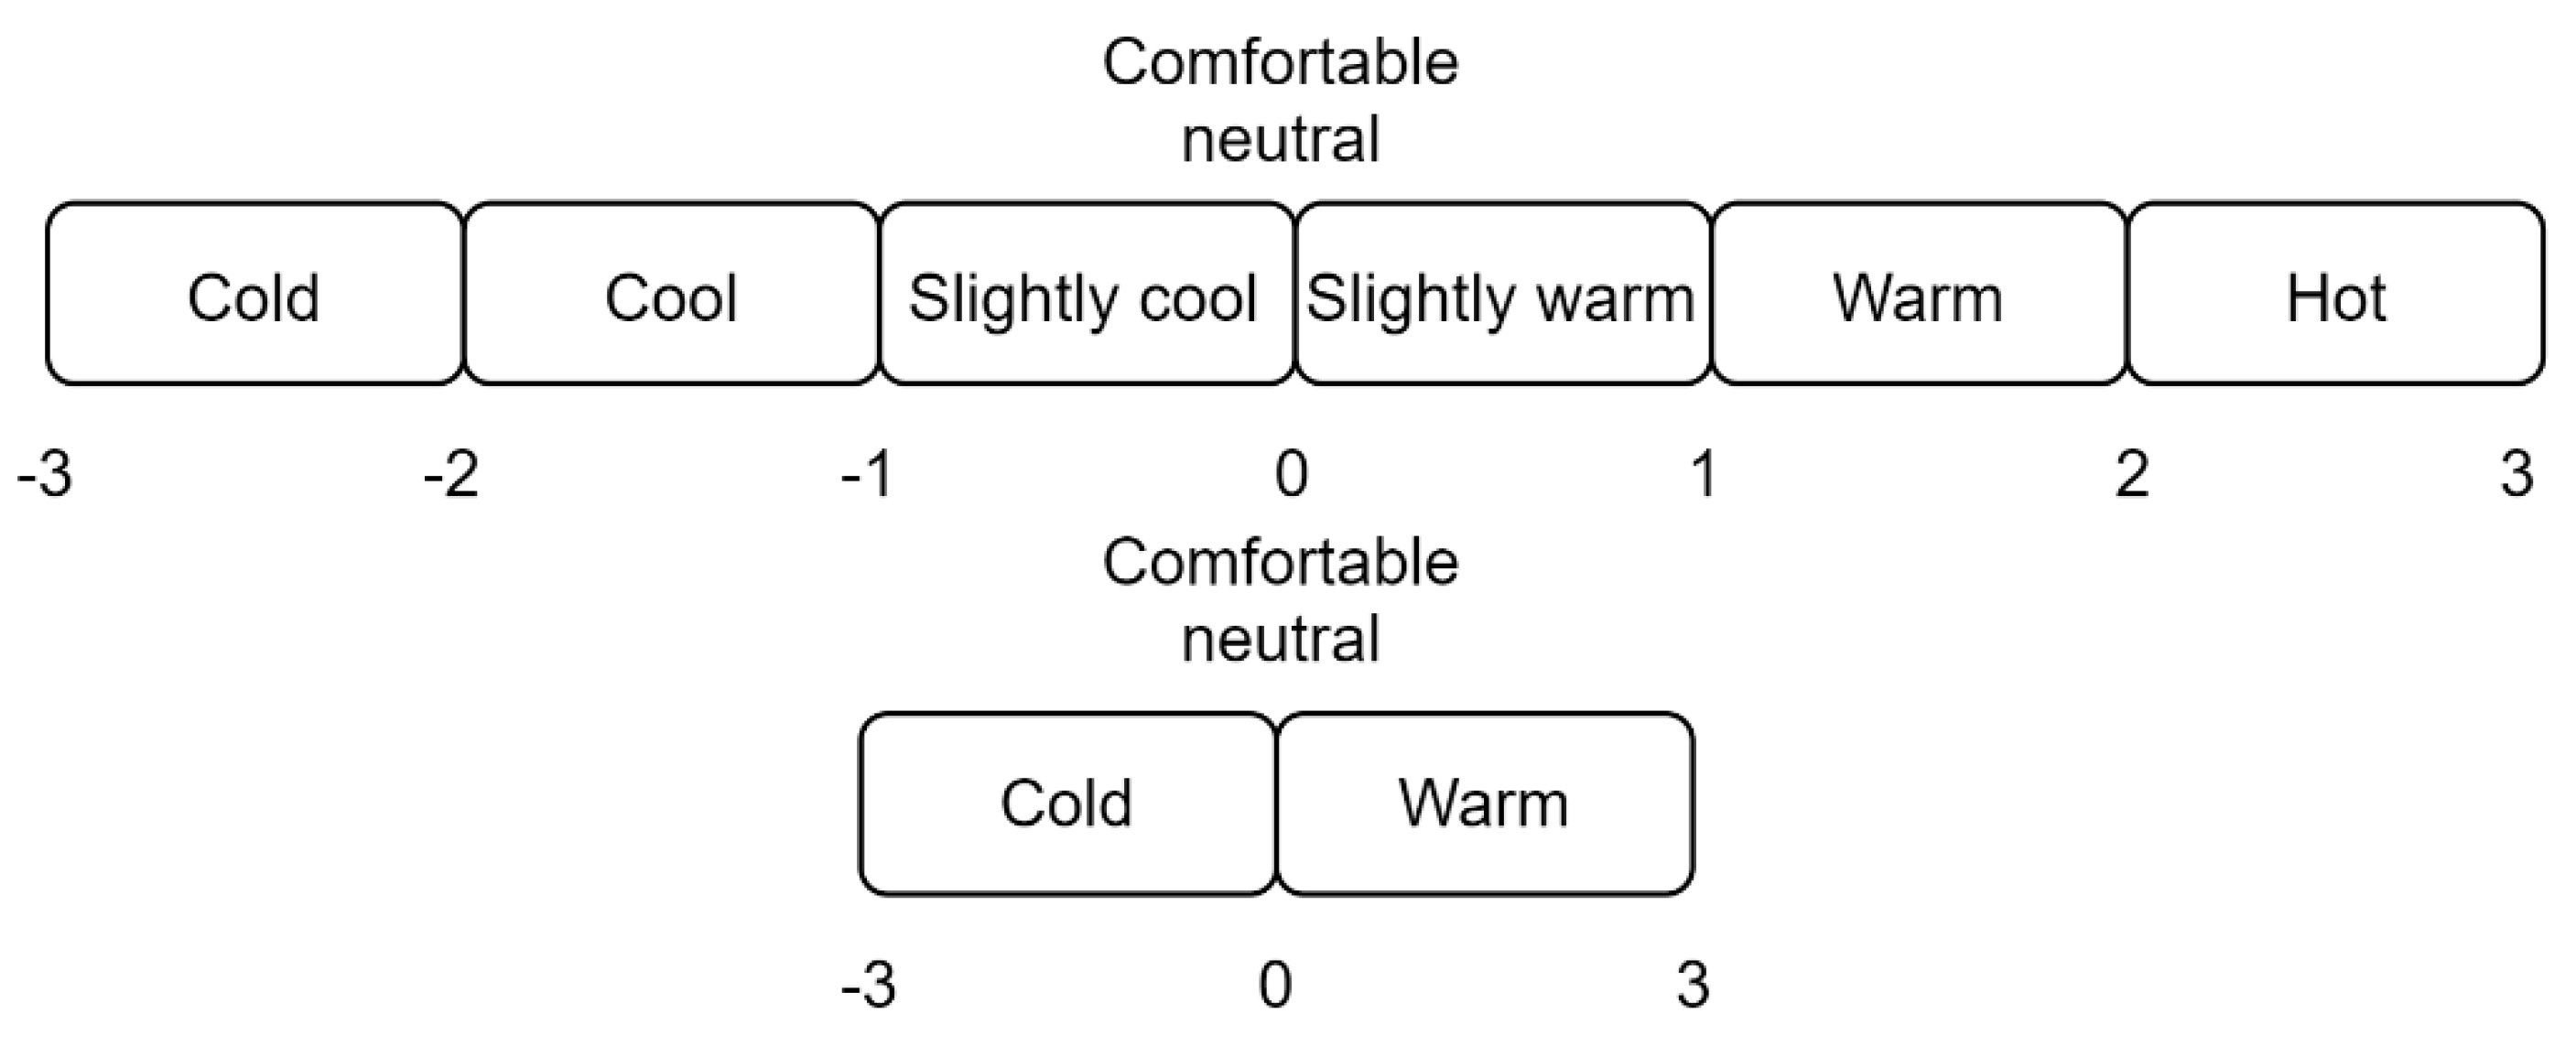
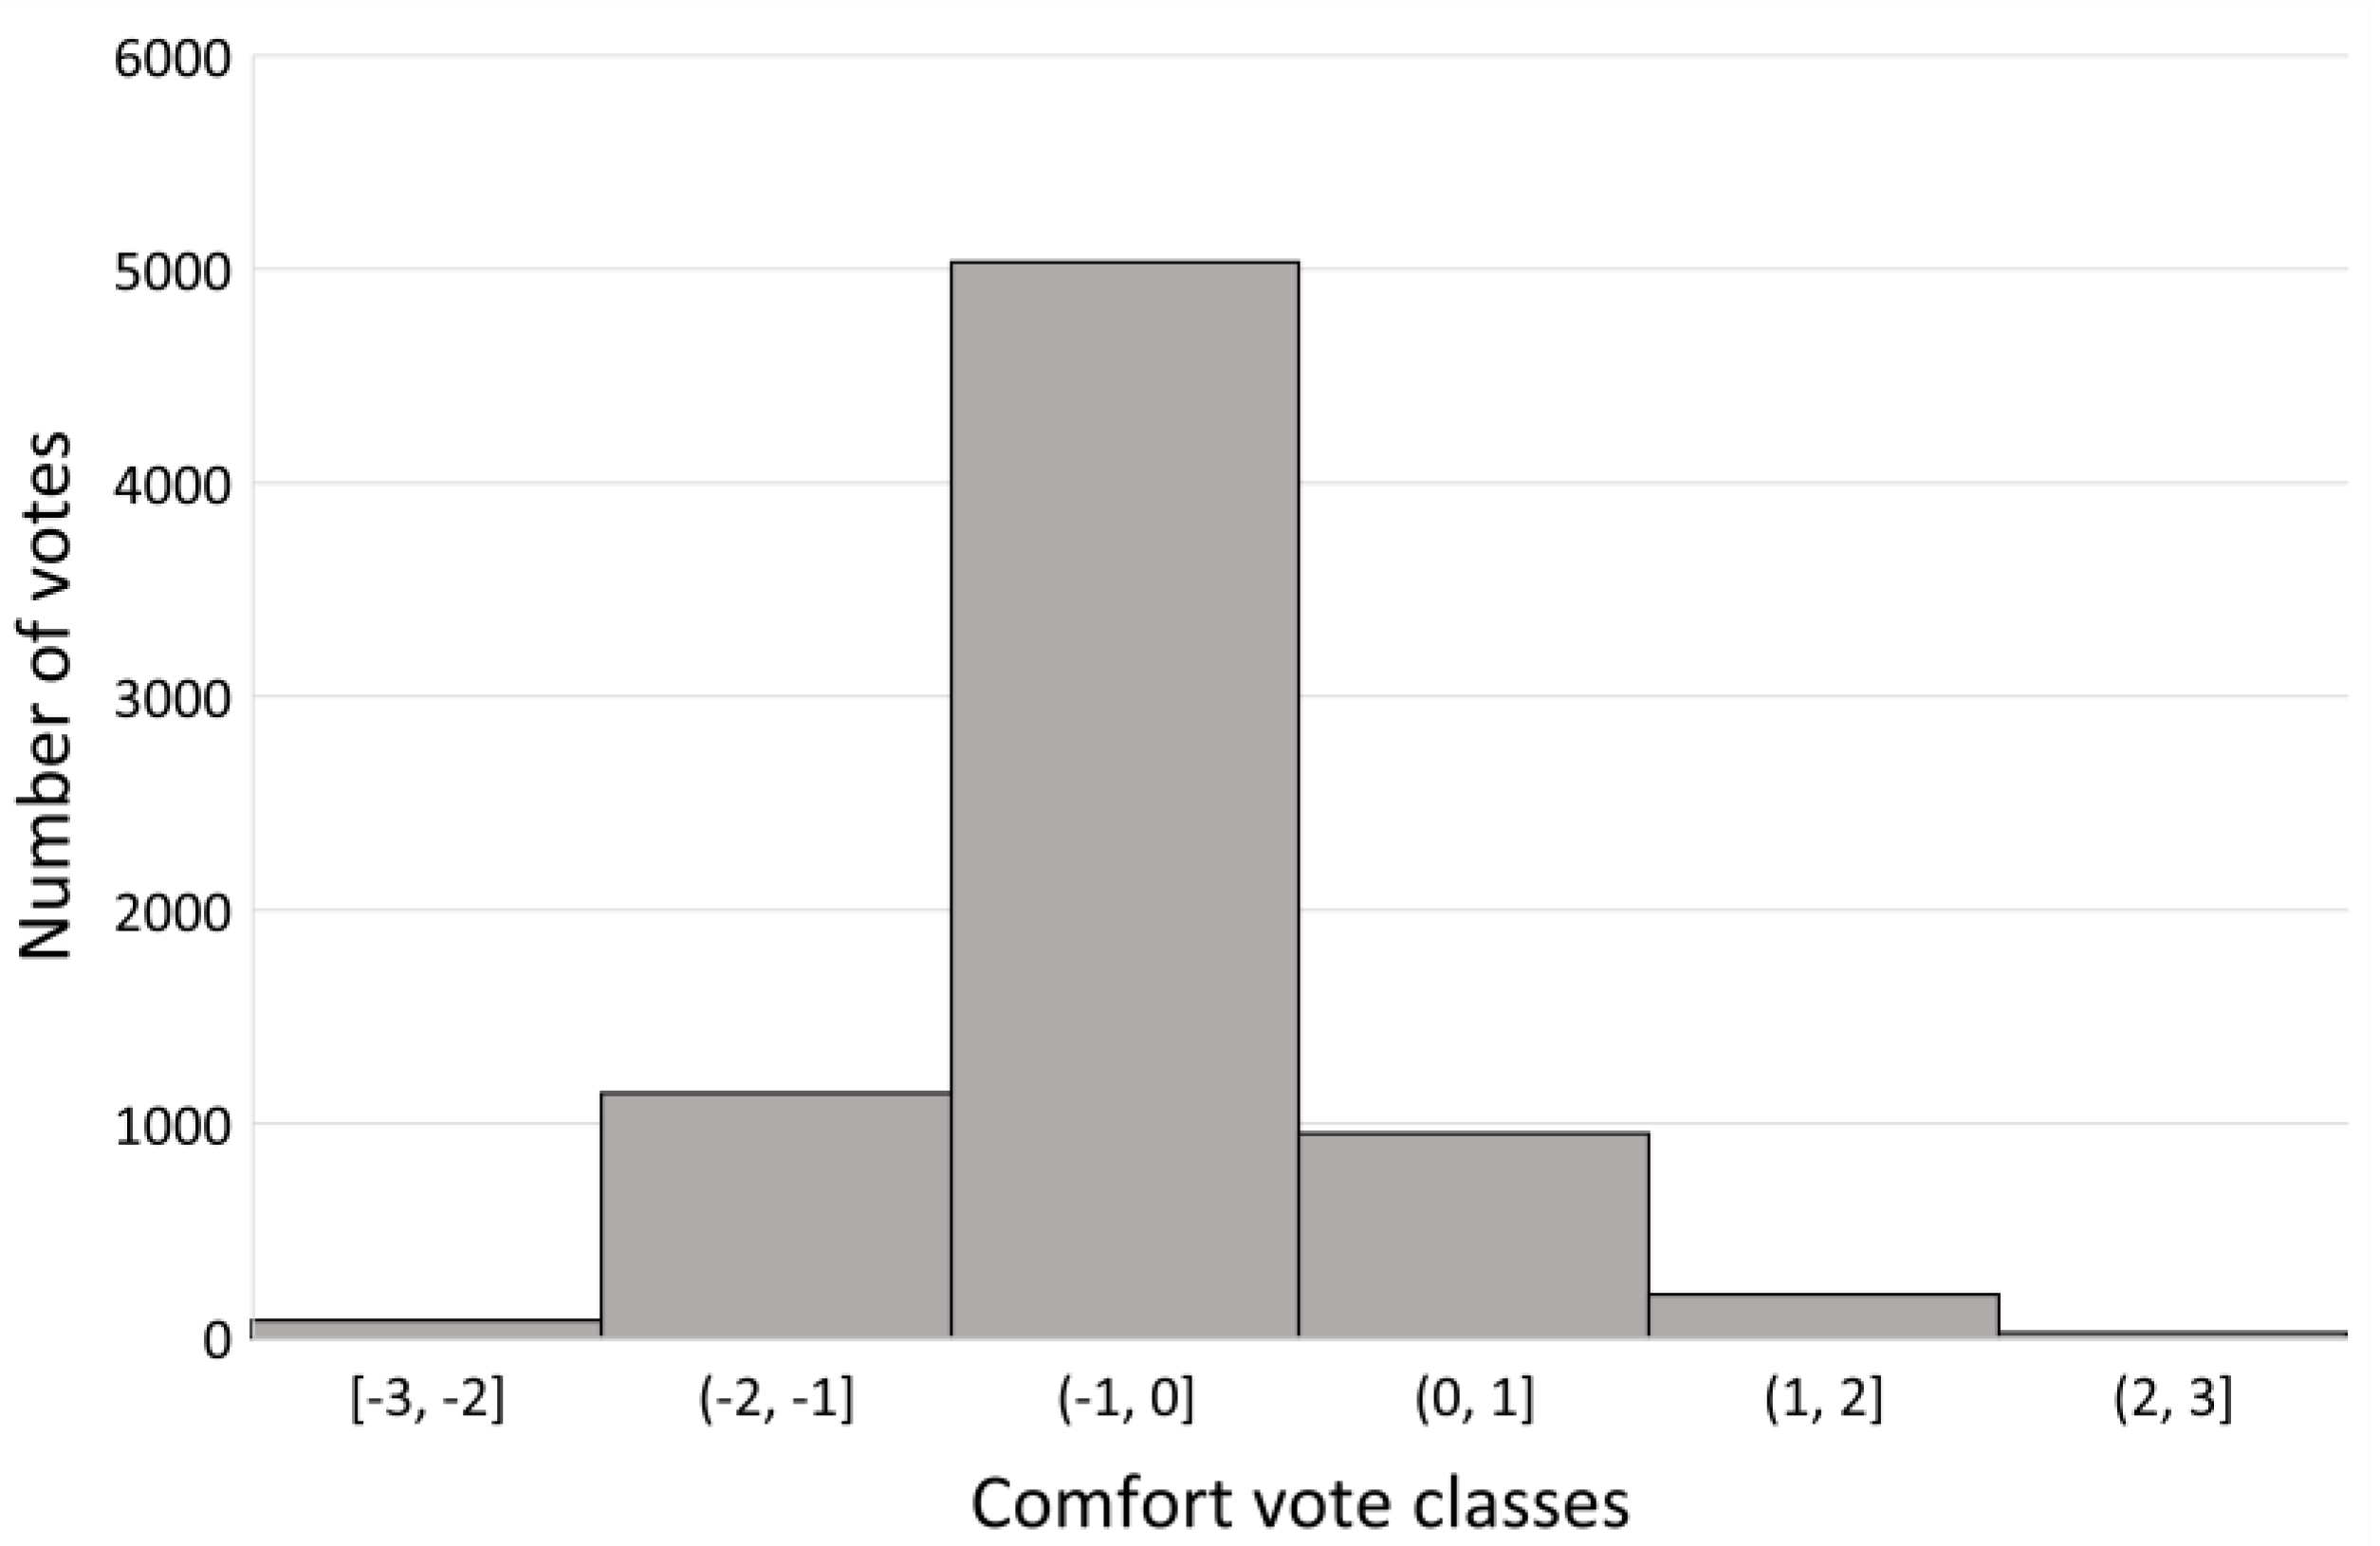
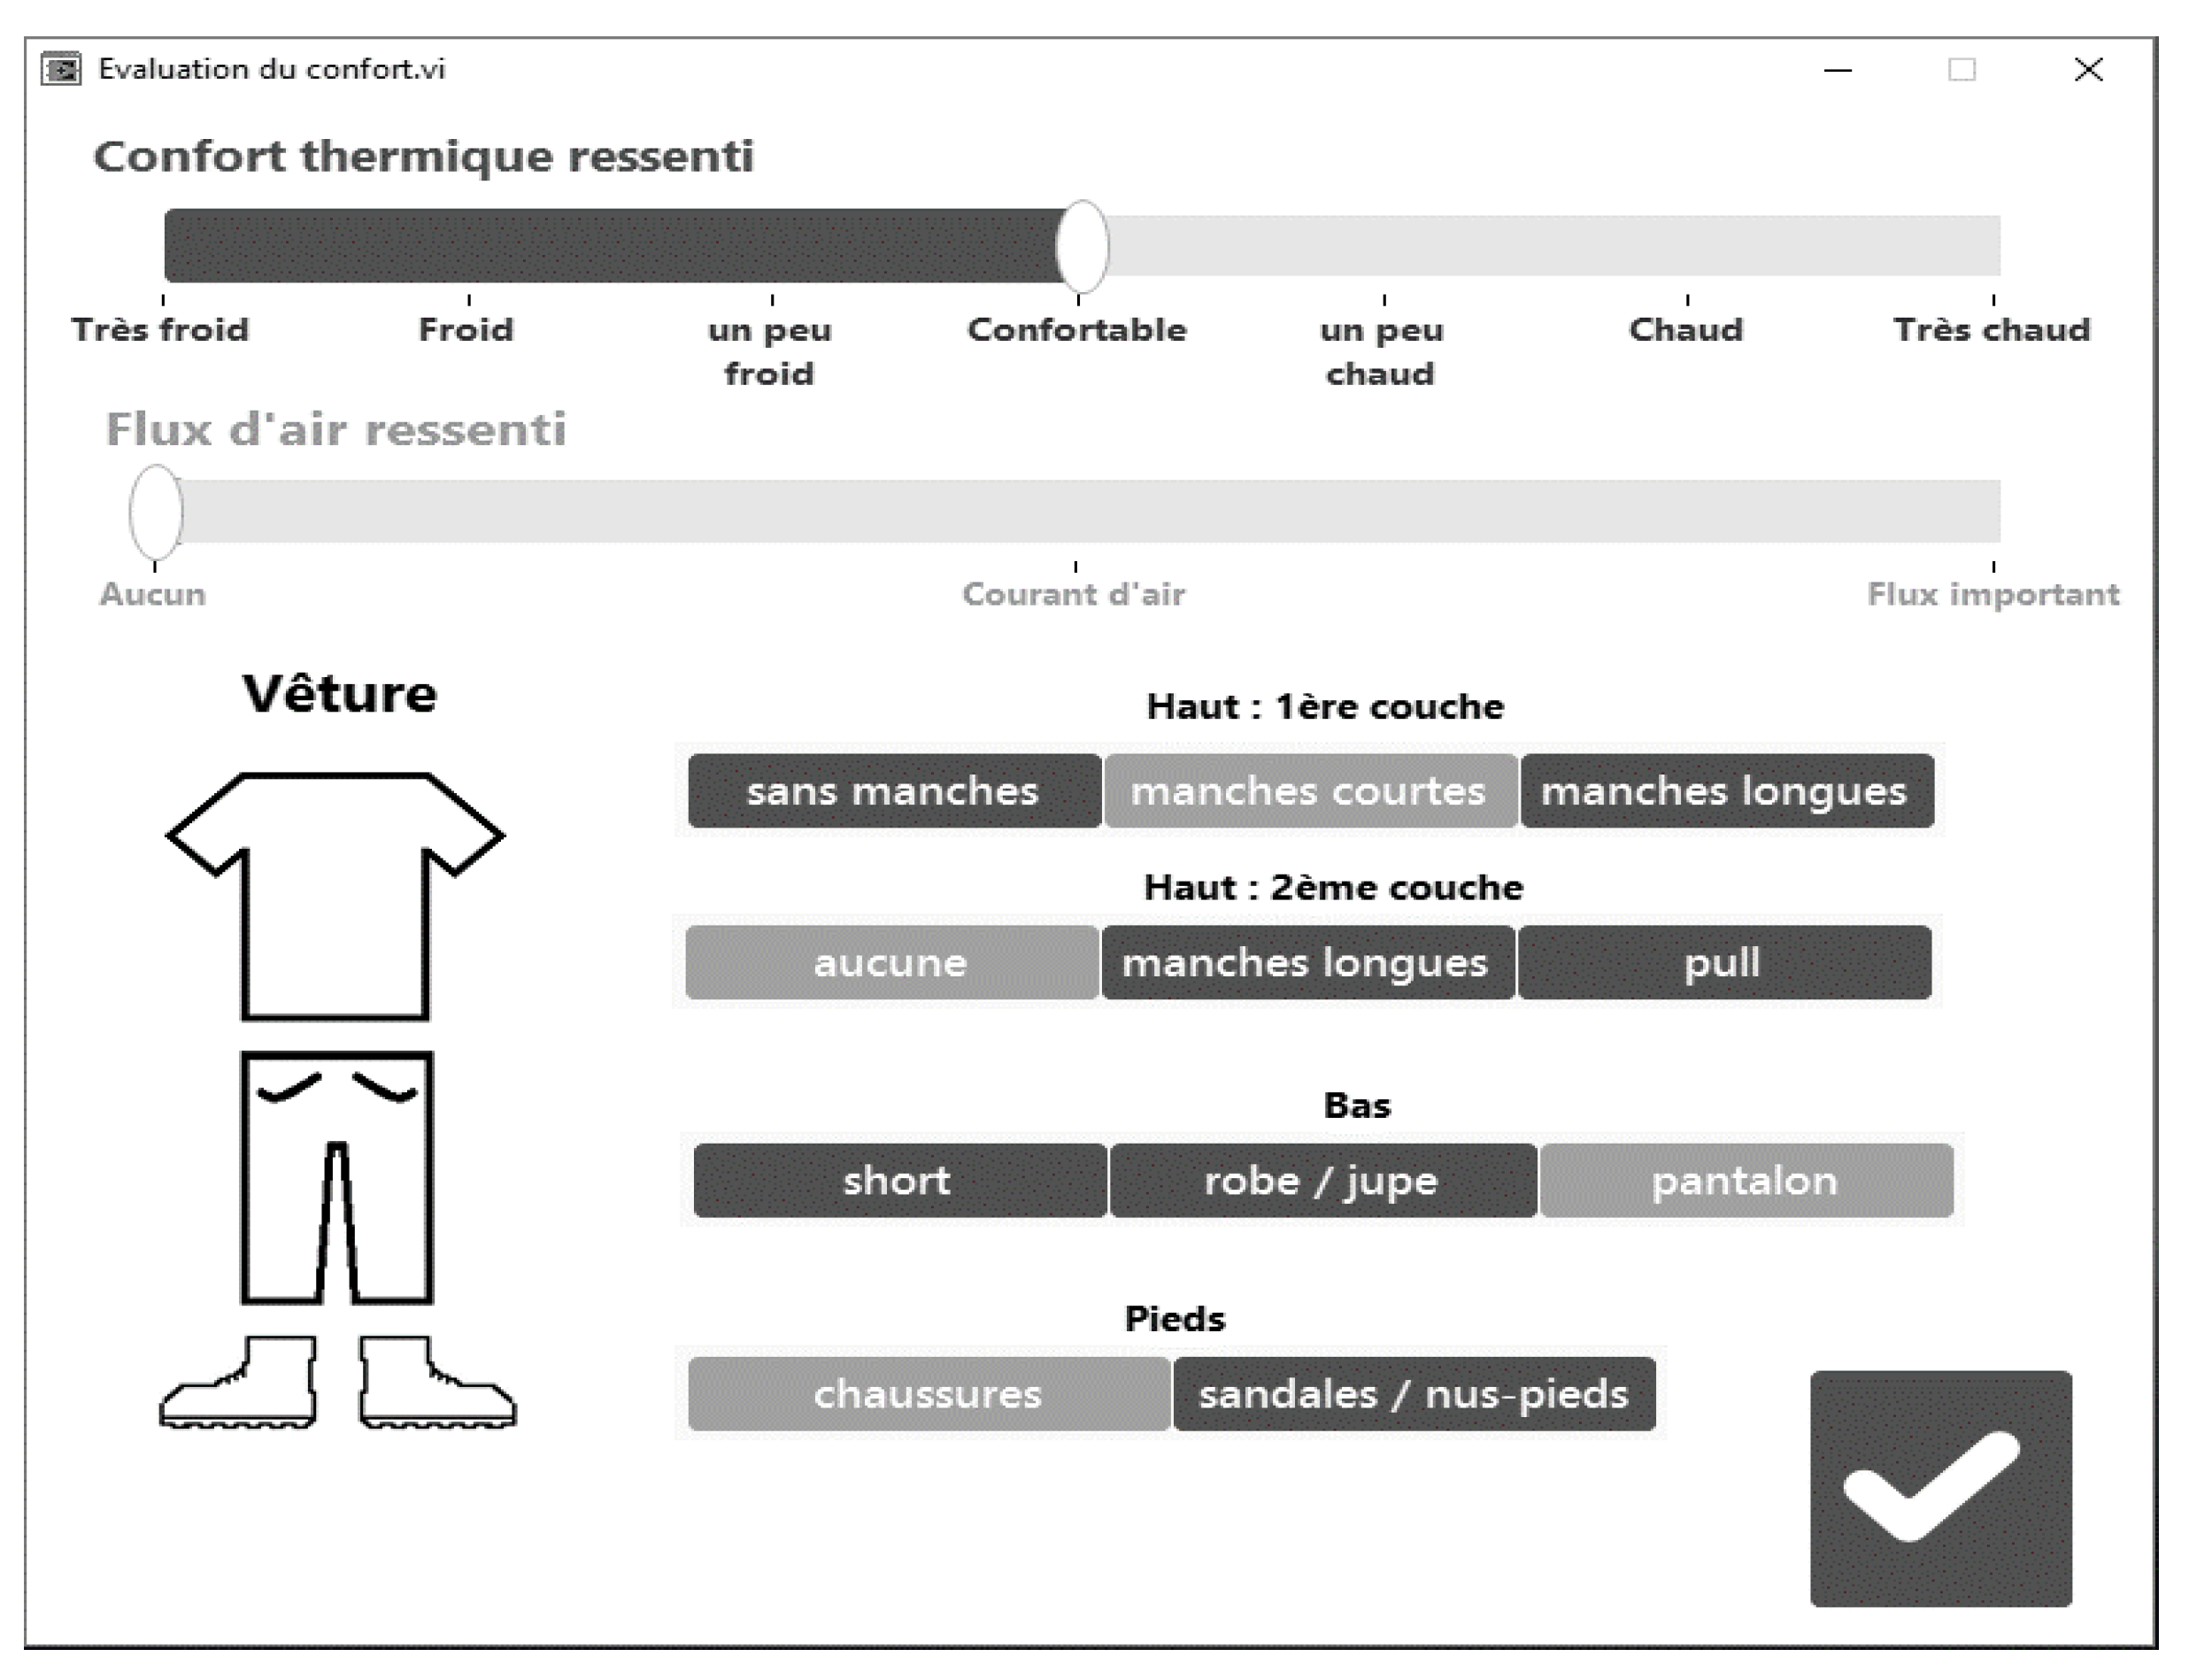
3.2. The Thermal Comfort Experiment

A data collection campaign spanning from July 2018 to June 2019 was conducted to gather thermal comfort votes from the occupants of the building. A thermal comfort feedback device was installed in ten different rooms and was used to collect votes from the occupants. A total of 7430 votes were collected during the duration of the experiment. Figure 5 shows the distribution of the collected votes during the period of analysis. With reference to the ASHRAE seven-value scale for thermal comfort, from an analysis of the collected data, it is possible to summarise that between 1–2% of the total votes were within the range [−3, −2], about 16% of the total were in the range (−2, −1], a majority of 65% were within the range (−1, 0], 13% were in the range (0, 1], about 3% were in the range (1, 2], and less than 1% were in the range (2, 3]. The overall distribution is presented in Figure 5.
Figure 6 and Figure 7 show the scatterplot of the thermal comfort votes and the relative temperature ranges for the indoor and outdoor air temperatures. From the graph, it is possible to evaluate the means and standard deviations of the range of temperatures for each perceived comfort vote for the indoor air temperature. This is reported in Table 1. As expected, there is a positive trend between the mean of the indoor and outdoor air temperature and the comfort vote, while the standard deviation values seem to be larger for the central classes, underlining that what the occupants think to be a neutral and comfortable temperature is more subjective than the extreme votes. A quadratic equation was used to interpolate the data and extract a relationship between the votes and the indoor and outdoor temperatures. The equations are reported in Figure 6 and Figure 7.
From the two quadratic equations, it is possible to extract the comfort temperature for which feedback are equal to value zero. If this is repeated for indoor and outdoor temperatures, the following temperature can be evaluated: 24.73 °C for indoor temperature and 23.25 °C for outdoor temperature. Figure 8 shows the layout of the comfort vote device used by the occupants to submit feedback during the duration of the experiment. The additional following variables were collected from information submitted by the occupants: the thermal comfort vote, perceived air flux, and current outfit. Figure 7b shows the trend of the thermal insulation (clothing) of the occupants related to the outdoor air temperature. From the graph, it is evident that, as the outdoor air temperature increases, insulation levels decrease, indicating that the occupants wear less heavy clothing. The clothing level is the sum of the upper body first and eventual second layer, lower body layer, and feet layer. The clothing level was submitted by each occupant using the feedback app, along with the thermal comfort vote. A second order polynomial equation was extracted from the data and can be used to estimate the expected average temperature once the clothing level has been defined.

3.3. Building Energy Modelling: The Baseline Model

The building energy model was created with the Integrated Environmental Solution’s software Virtual Environment. Building geometry data, such as layout of elevations, floor plans, and sections, were used to accurately reconstruct the geometry of the building as a first step in the modelling procedure. The result of this operation is shown in Figure 9. Weather data were collected from the service Athenium Analytics, which is able to communicate with IES’s iSCAN platform for data storage and analysis. According to the service, the weather station is located 59 km from the building. A variety of additional data were collected to recreate a high-fidelity digital representation of the building, such as the thermal properties of the construction materials, occupancy patterns, lighting fixtures, and equipment usage. The year considered for the simulation was 2018. Air temperature, window opening, door opening, louvre opening, carbon dioxide concentrations, and additional weather variables were gathered from IoT sensors and were used for the creation of the model.
All the relevant internal gains in the building were modelled with accuracy, as it is likely they have a high impact on the resulting air temperature and, therefore, the perceived thermal comfort of the occupants. Therefore, occupancy, equipment, and lighting gains were modelled, starting from the information of each room or data analysis of the IoT sensors, to derive possible schedules of operation. The number of people and their schedules were gathered from the building documentation provided and by interviews. Most of the offices had traditional hours of operation (8:30 -> 17:30) for an office building, with lunch breaks between 12:00 and 13:00 for 50% of occupants and 12:30–13:30 for the other 50%. For all the offices, the sensible and latent heat gains were based on normative values for the relative activity conducted in the room: 70 W/person for sensible heat and 45 W/person for latent heat (as recommended in CIBSE [37], Guide A—Table 6.3—for seated, very light work). It was assumed that lights and equipment have the same schedules, they are on all the time while the space is occupied. For internal gains related to equipment, values of 15 W/m2 were used, while an average value of 9 W/m2 was adopted for the lights, which are values similar to the recommended threshold set in the normative values. After this, the HVAC system was modelled using a wood pellet boiler in combination with a solar heating system to match the current system in the building. The heating-related profiles and setpoints were applied to the model after an accurate analysis of the metered data available for the building. Building openings were modelled, with particular care to reproduce the right amount of fresh air for the naturally ventilated building. For this, the data collected on window and door operations was integrated directly into the model to represent occupant behaviour by the means of time series profiles. Finally, window shadings were modelled for each room in the model. In order to accurately mimic the use of the blinds, opening and closing data were included in the model. The operation of the blinds influences the solar radiation values, and it is likely to have a large impact on the perceived thermal comfort of the occupants.

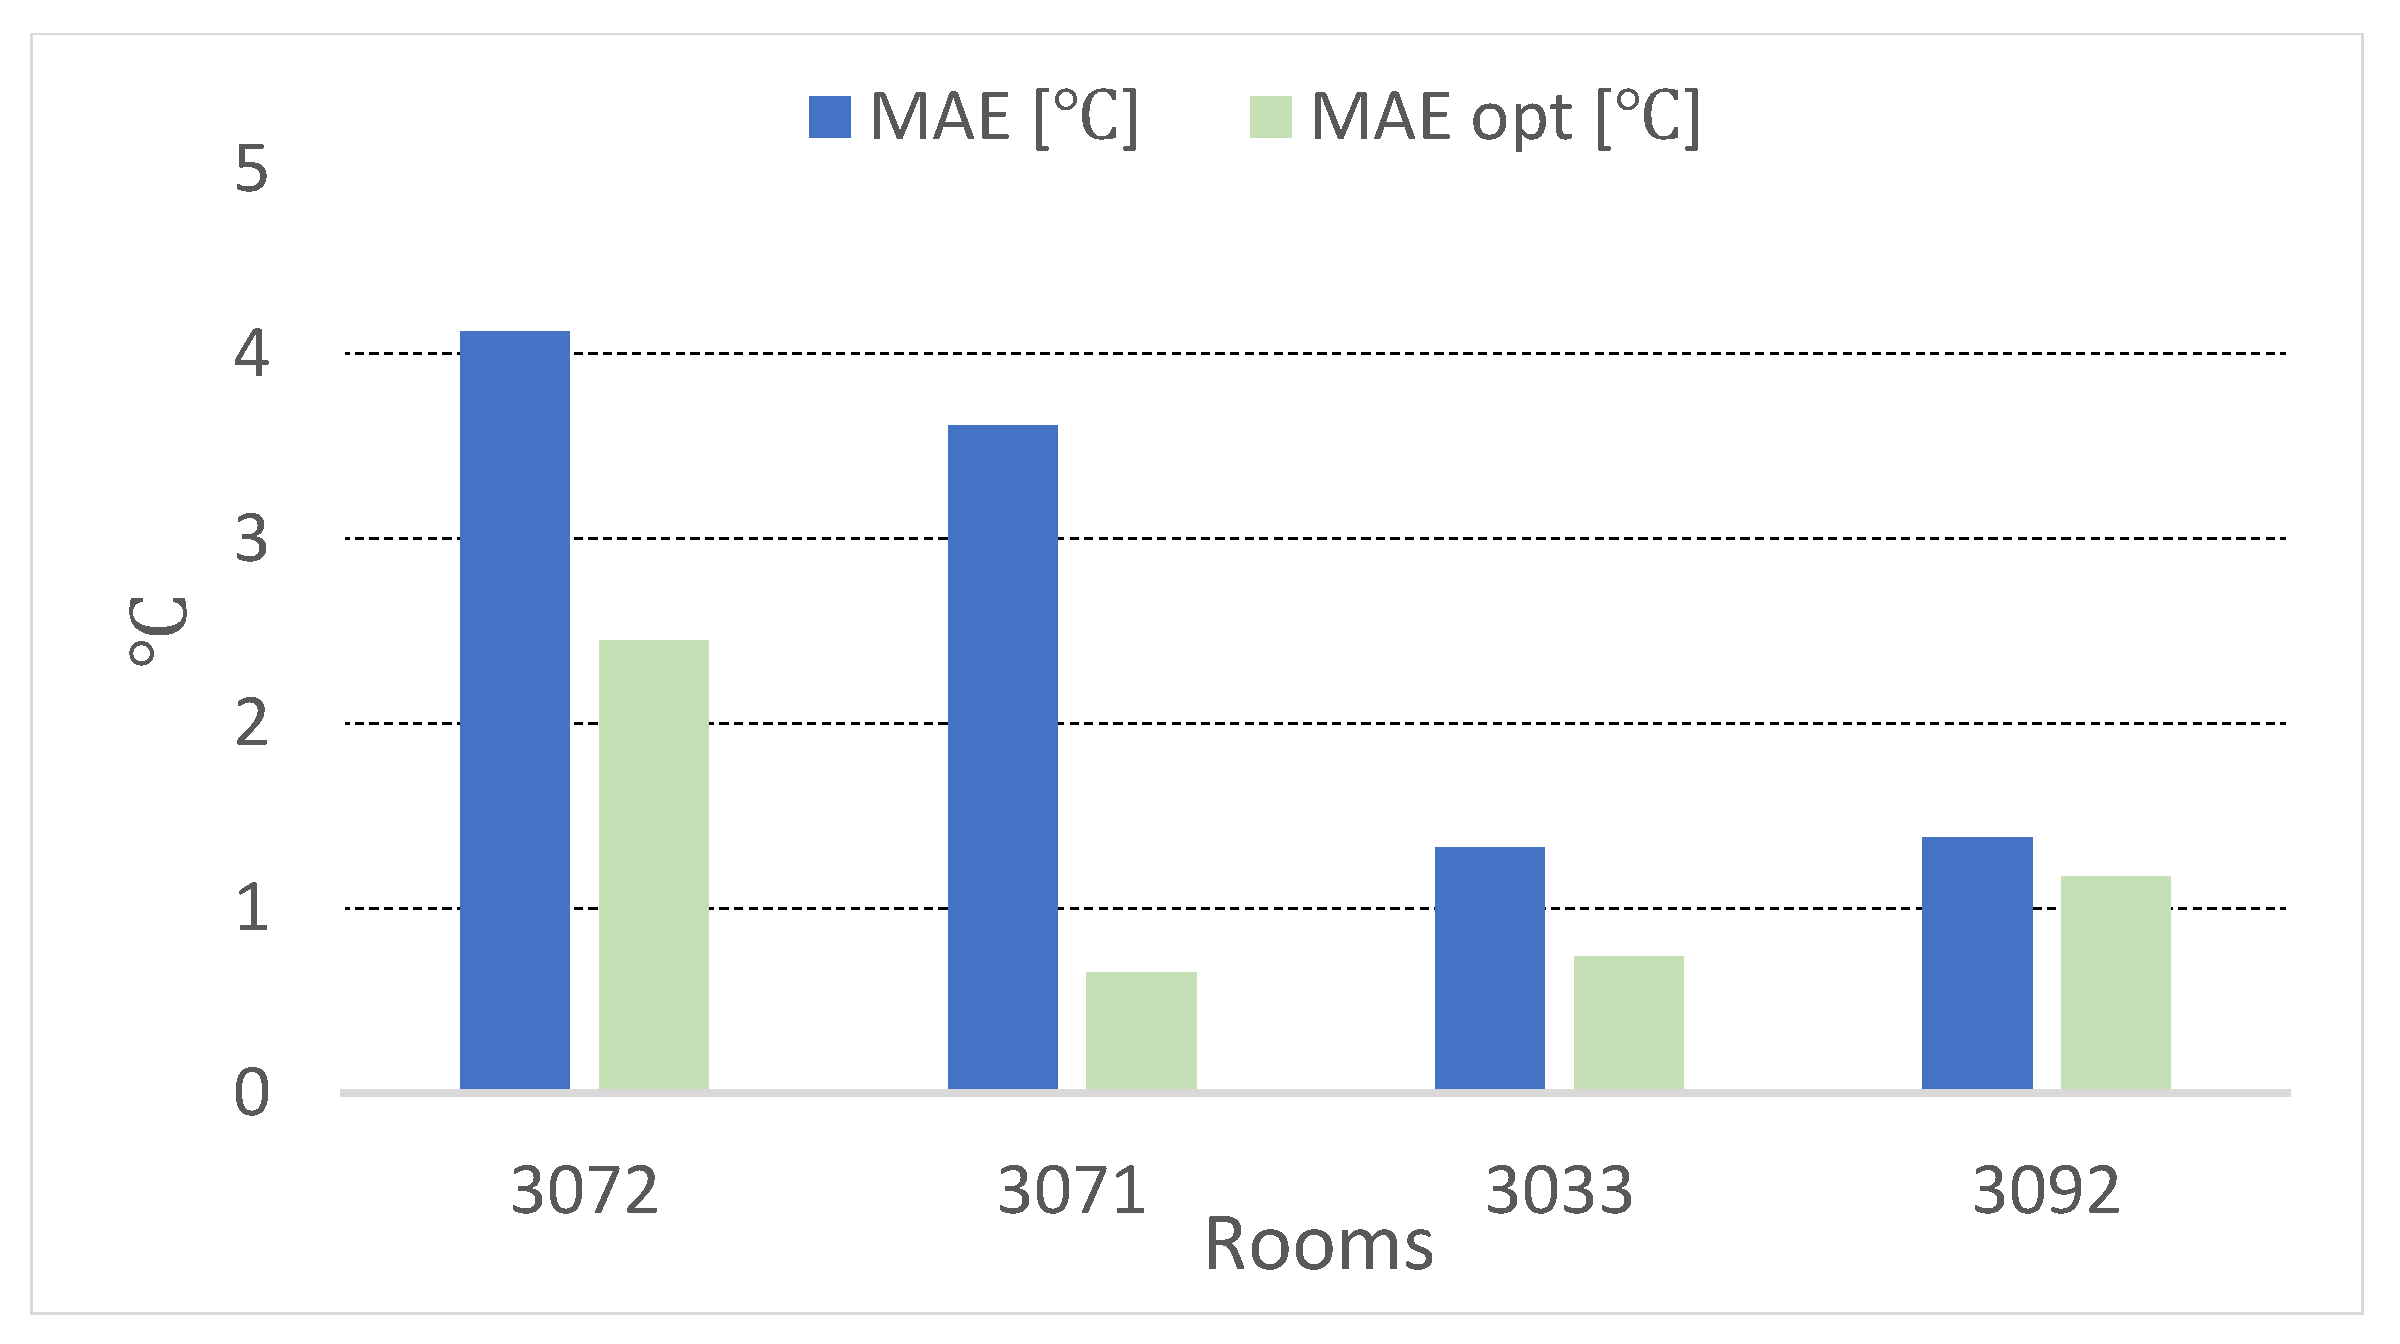
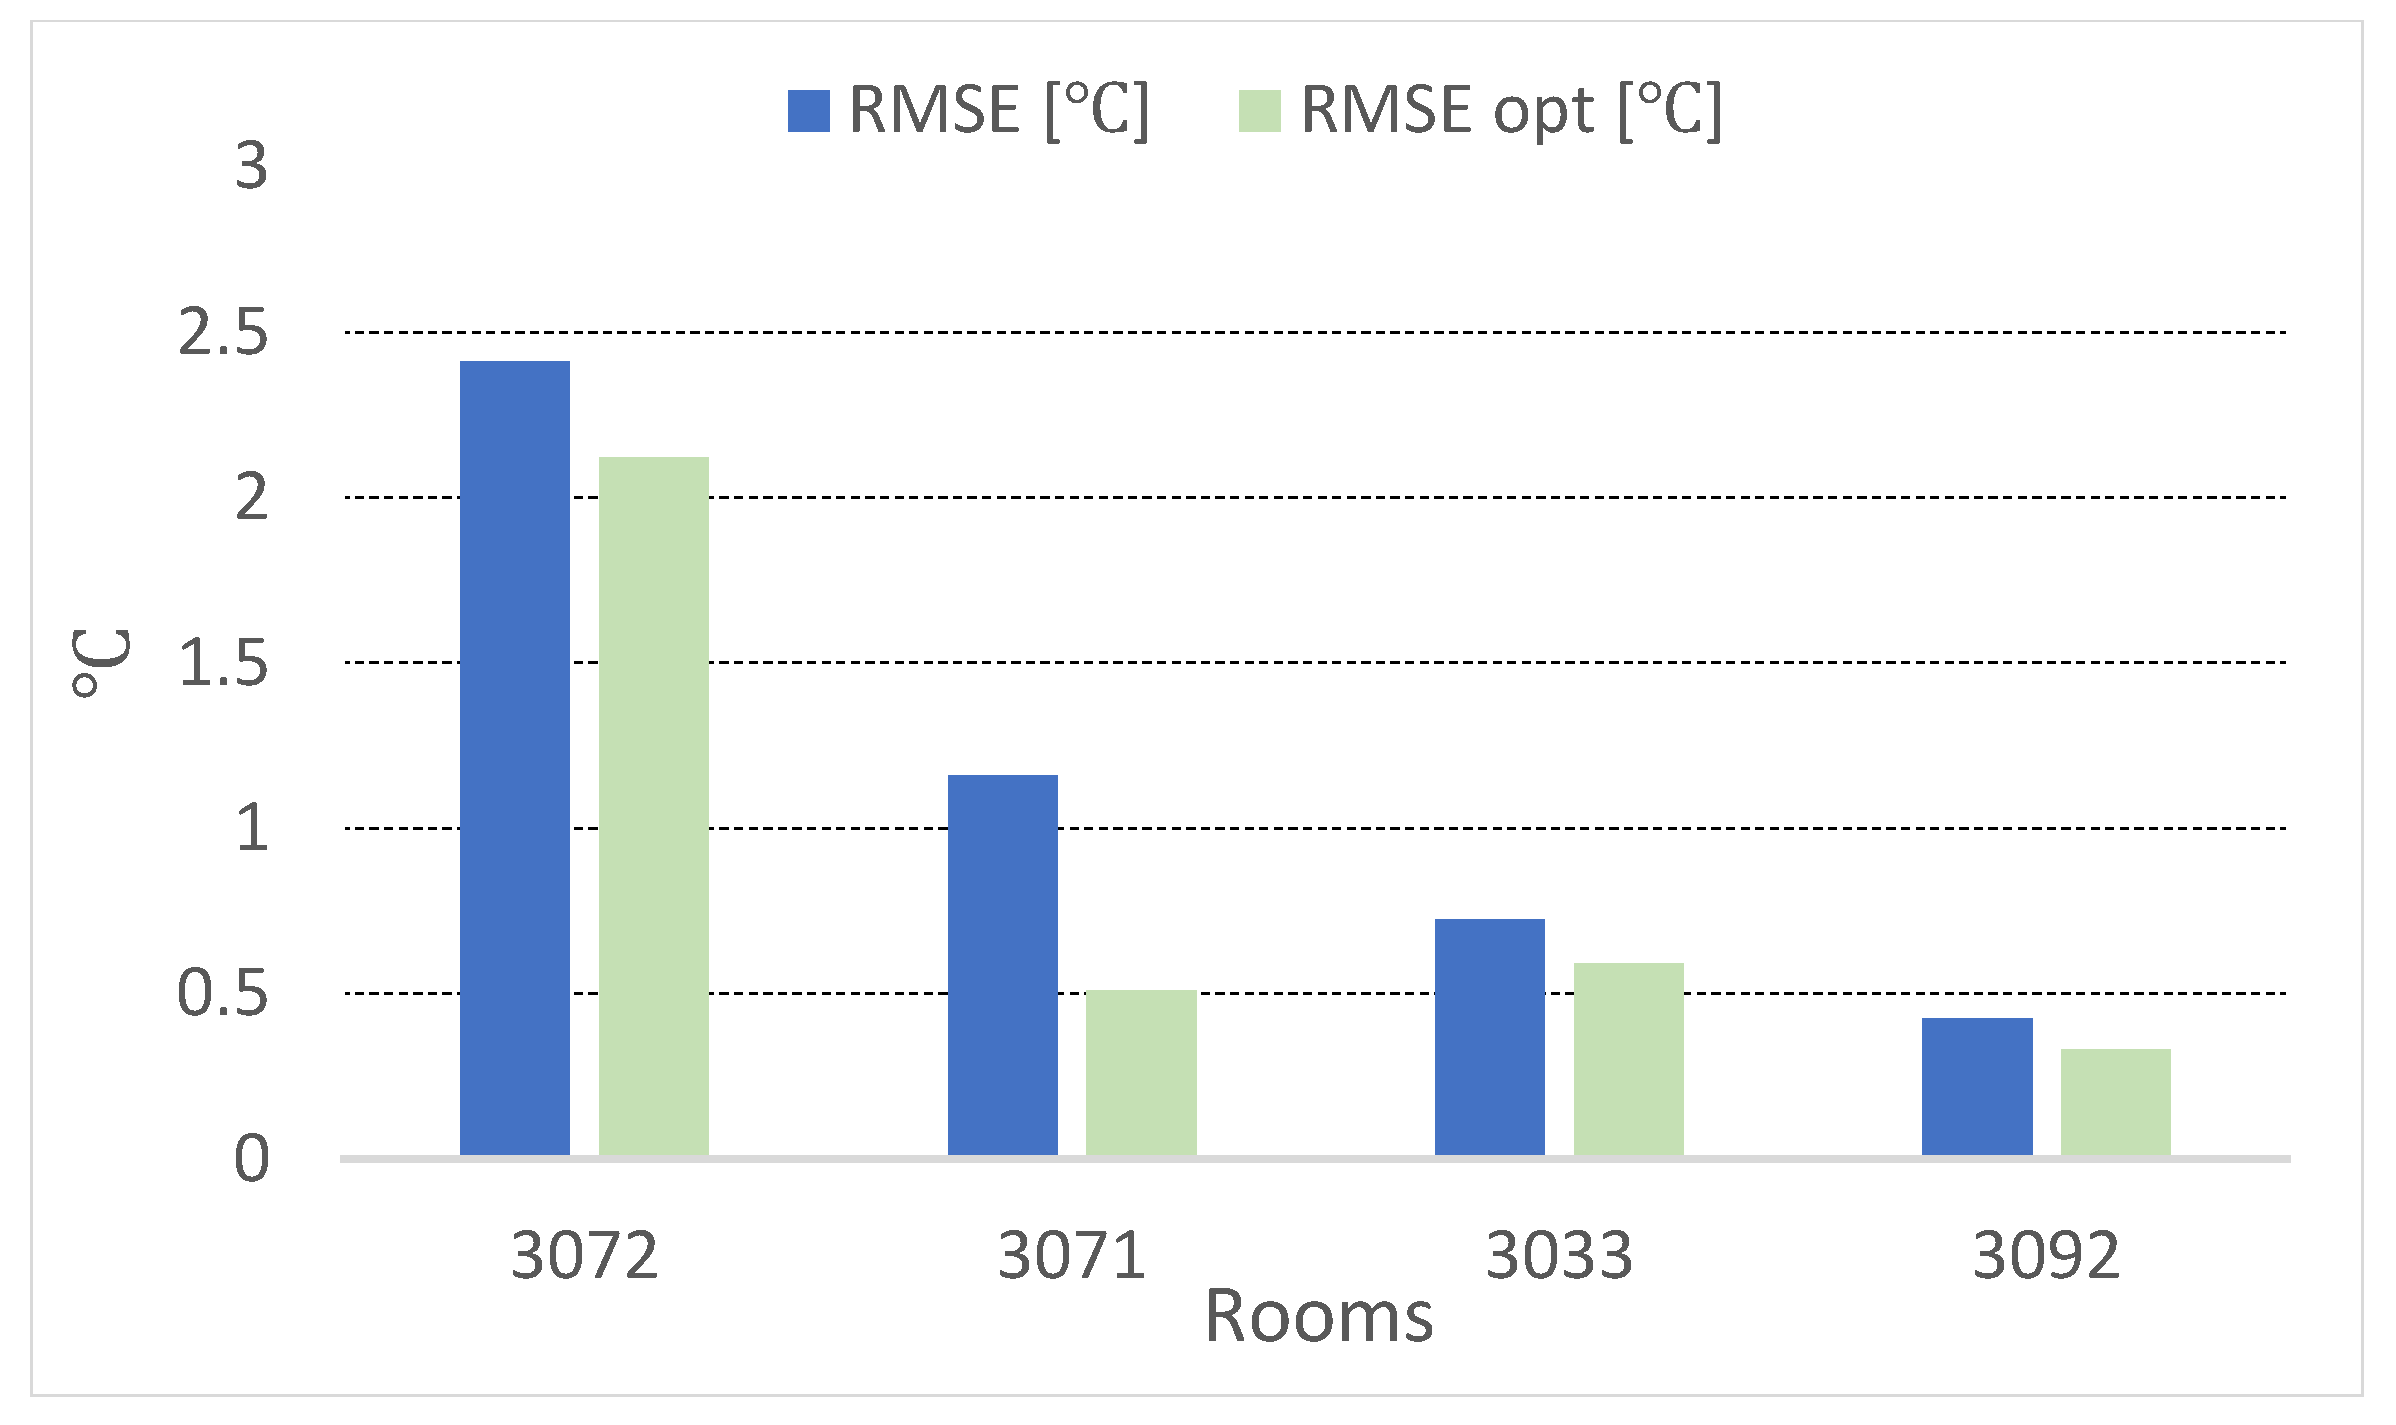
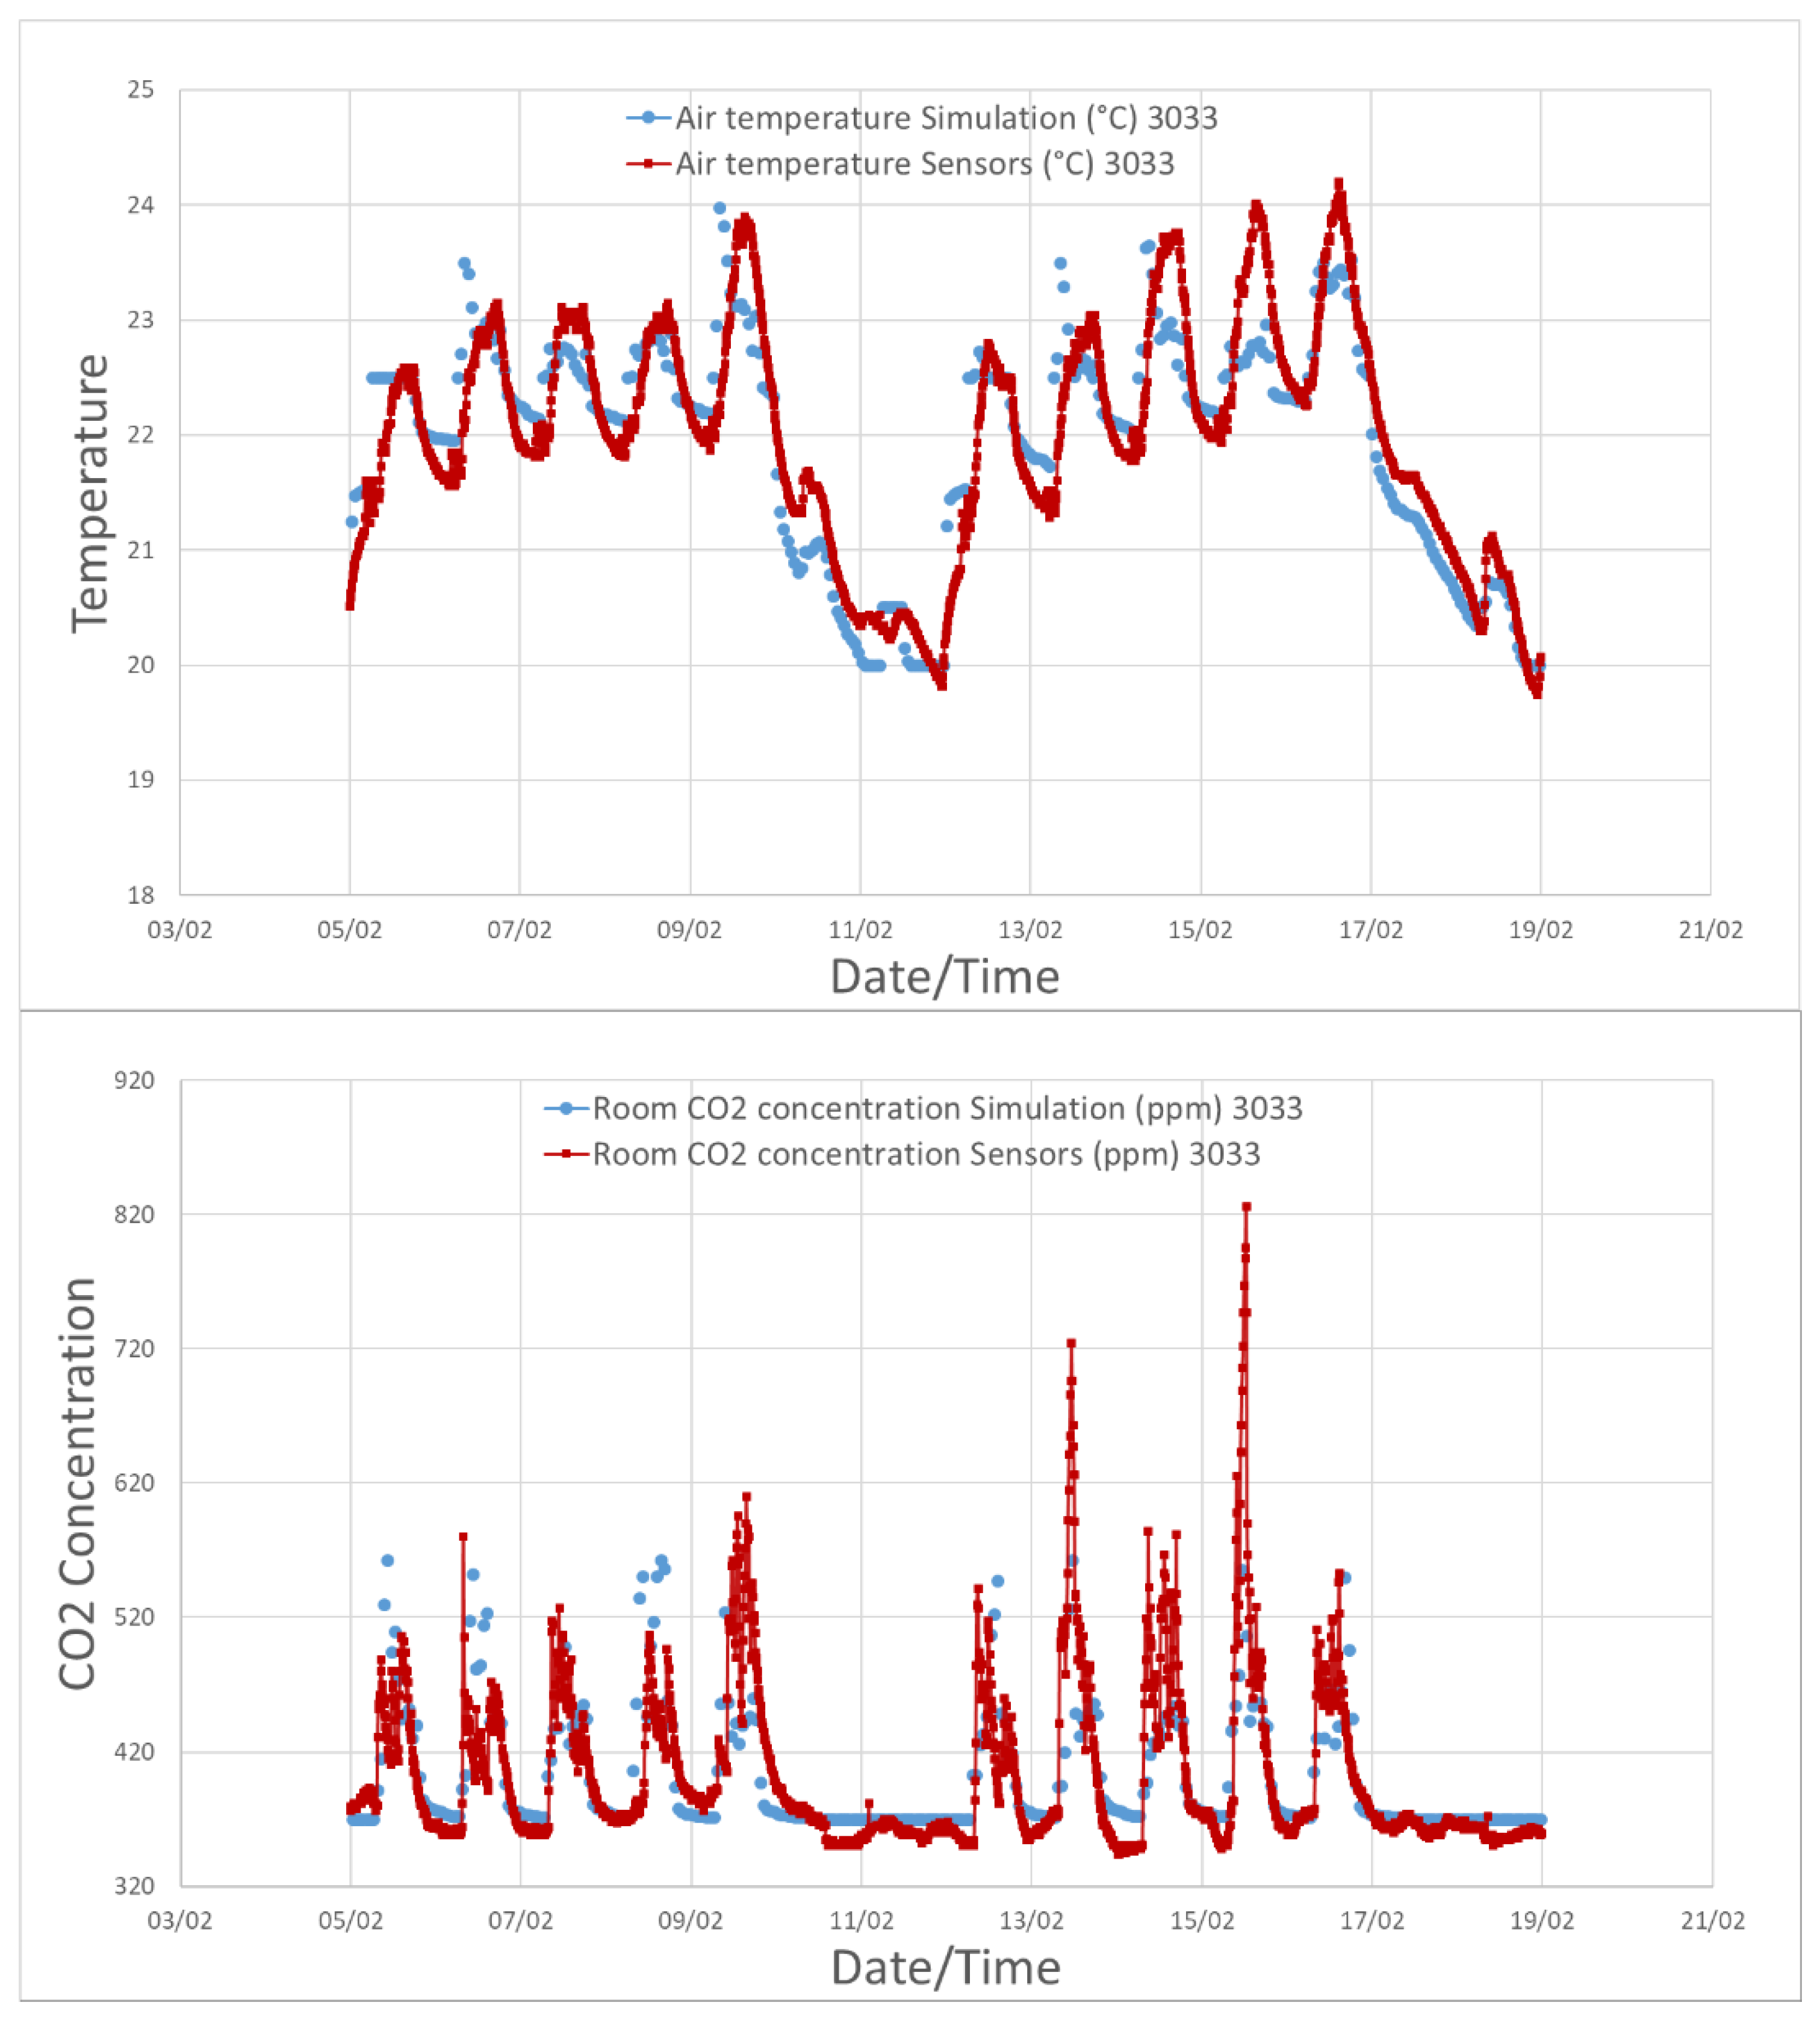
3.4. Model Calibration Results

The calibration of the Helios building was conducted by targeting the building’s environmental variables, and it was validated by comparing the measured data with the simulated data at an hourly timestep resolution. The procedure was conducted as described in Section 2.3. The mean absolute error (MAE) and the root-mean-square error (RMSE) were used as the main metrics for the environmental variables, while the range-normalised root-mean-square error was employed to drive the process of automated parameter tuning via optimisation. As the calibration was completed for the environmental variables, the traditional metrics for calibration, such as the coefficient of variation of the root-mean-square error (CVRMSE) and the normalised mean bias error (NMBE) were not suitable metrics, as they are intended mostly for energy studies. When calibration is driven by IEQ problems, it is recommended that the MAE and RMSE are used in the normative TM63 [37]. TM63 states that most studies indicate sufficient calibration if metrics are less than ~2 °C for air temperature, while there are no other direct indications for CO2 concentrations. One of the main final uses of the model is to simulate different operational control options for the building; therefore, it is essential that the model is as accurate as possible. An optimisation technique based on evolutionary algorithms (NSGA2) was used to automatically fine-tune some of the driving parameters identified by the sensitivity analysis of the model. An example of the results of the calibration by optimisation procedures is shown in Figure 10 below. The triangles indicate the value of the metrics for a given room at the beginning of the calibration procedure. From the figure, it is evident that the minimisation of the calibration error progressively reduces the RMSE (°C) and the MAE (°C) for all the rooms considered.
Table 2 shows the initial values of the calibration metrics at the end of the manual calibration procedure. For the results in rooms of the Helios building, at the end of this procedure, the majority of the values for the metrics MAE and RMSE were below the threshold recommended by TM63. Table 3 summarizes the results of the fine-tuning technique for the four rooms considered for the analysis. Comparing the results from Table 2 and Table 3, it is evident that the fine-tuning procedure is able to further improve the calibration of the model. A visual comparison of the results is provided in Figure 11, Figure 12, Figure 13 and Figure 14.
Figure 15 shows the time series comparison between the internal air temperature and CO2 levels for a single room in the building after the completion of the fine-tuning procedure. Overall, the model is able to accurately predict the two metered variables, especially during the occupied hours that are more relevant to conducting an IEQ-related analysis. Improvements could be achieved by gathering more detailed information for un-occupied hours and the relative schedules and settings of operation of the heating systems as well as the active equipment and real time occupancy values.

3.5. The Thermal Comfort Models: Training and Results

The training and testing of the machine learning models was performed using available methods of the scikit python package [29]. In particular, the available data were split in a 30/70 ratio, where 70% of the total data were used for training, while the remaining 30% were used for testing. A fine-tuning approach and best algorithm searching method was performed for each algorithm using a 10-fold cross validation technique on the training dataset. The grid search method was used for testing many different combinations of the tuning parameters of each algorithm. The best predictors for each method were selected and compared to each other to evaluate their performance.
Table 4 summarises the validation results achieved with different ML techniques on the seven-value scale for the prediction of the thermal comfort votes in the Helios building. From the accuracy results, it is evident that the random forest approach and the gradient boosting classifier achieved the best results. The accuracy value was calculated as the average value across the different classes. A more granular analysis of the results shows that predictive models in classes with a larger amount of feedback achieved better results, as there were more historical values for the training. On the other hand, classes with fewer values, such as the extreme of the scale, were difficult to predict, as there were not enough instances to accurately train the model. To address this problem, class balancing approaches are recommended to unify the prediction accuracy of the model.
The results of the ML models evaluated on a three-value scale are reported in Table 5. The random forest approach and the gradient boosting method achieved higher performances in this case as well. Overall, the accuracy of the model was higher across the classes of the scale, as a less granular classification was required.
Figure 16 shows the results of predictive Bayesian model when compared with the actual comfort values submitted by the occupants. The predictions are for a continuous value scale, which constitutes a more challenging task compared to class prediction as analysed in the examples before. The image shows the expected accuracy of the model for an acceptable maximum error. The graph can be interpreted considering the following example: if an error of ±0.4 with respect to the actual vote is accepted on the thermal comfort scale, the model is able to generate a distribution that can include the actual vote with 76% accuracy. In this example, an acceptable error of ±0.4 on the ASHRAE scale for thermal comfort (−3, +3) indicates that the true vote of the occupant lies within a range of size ±0.4 from the predicted value of the ML model.

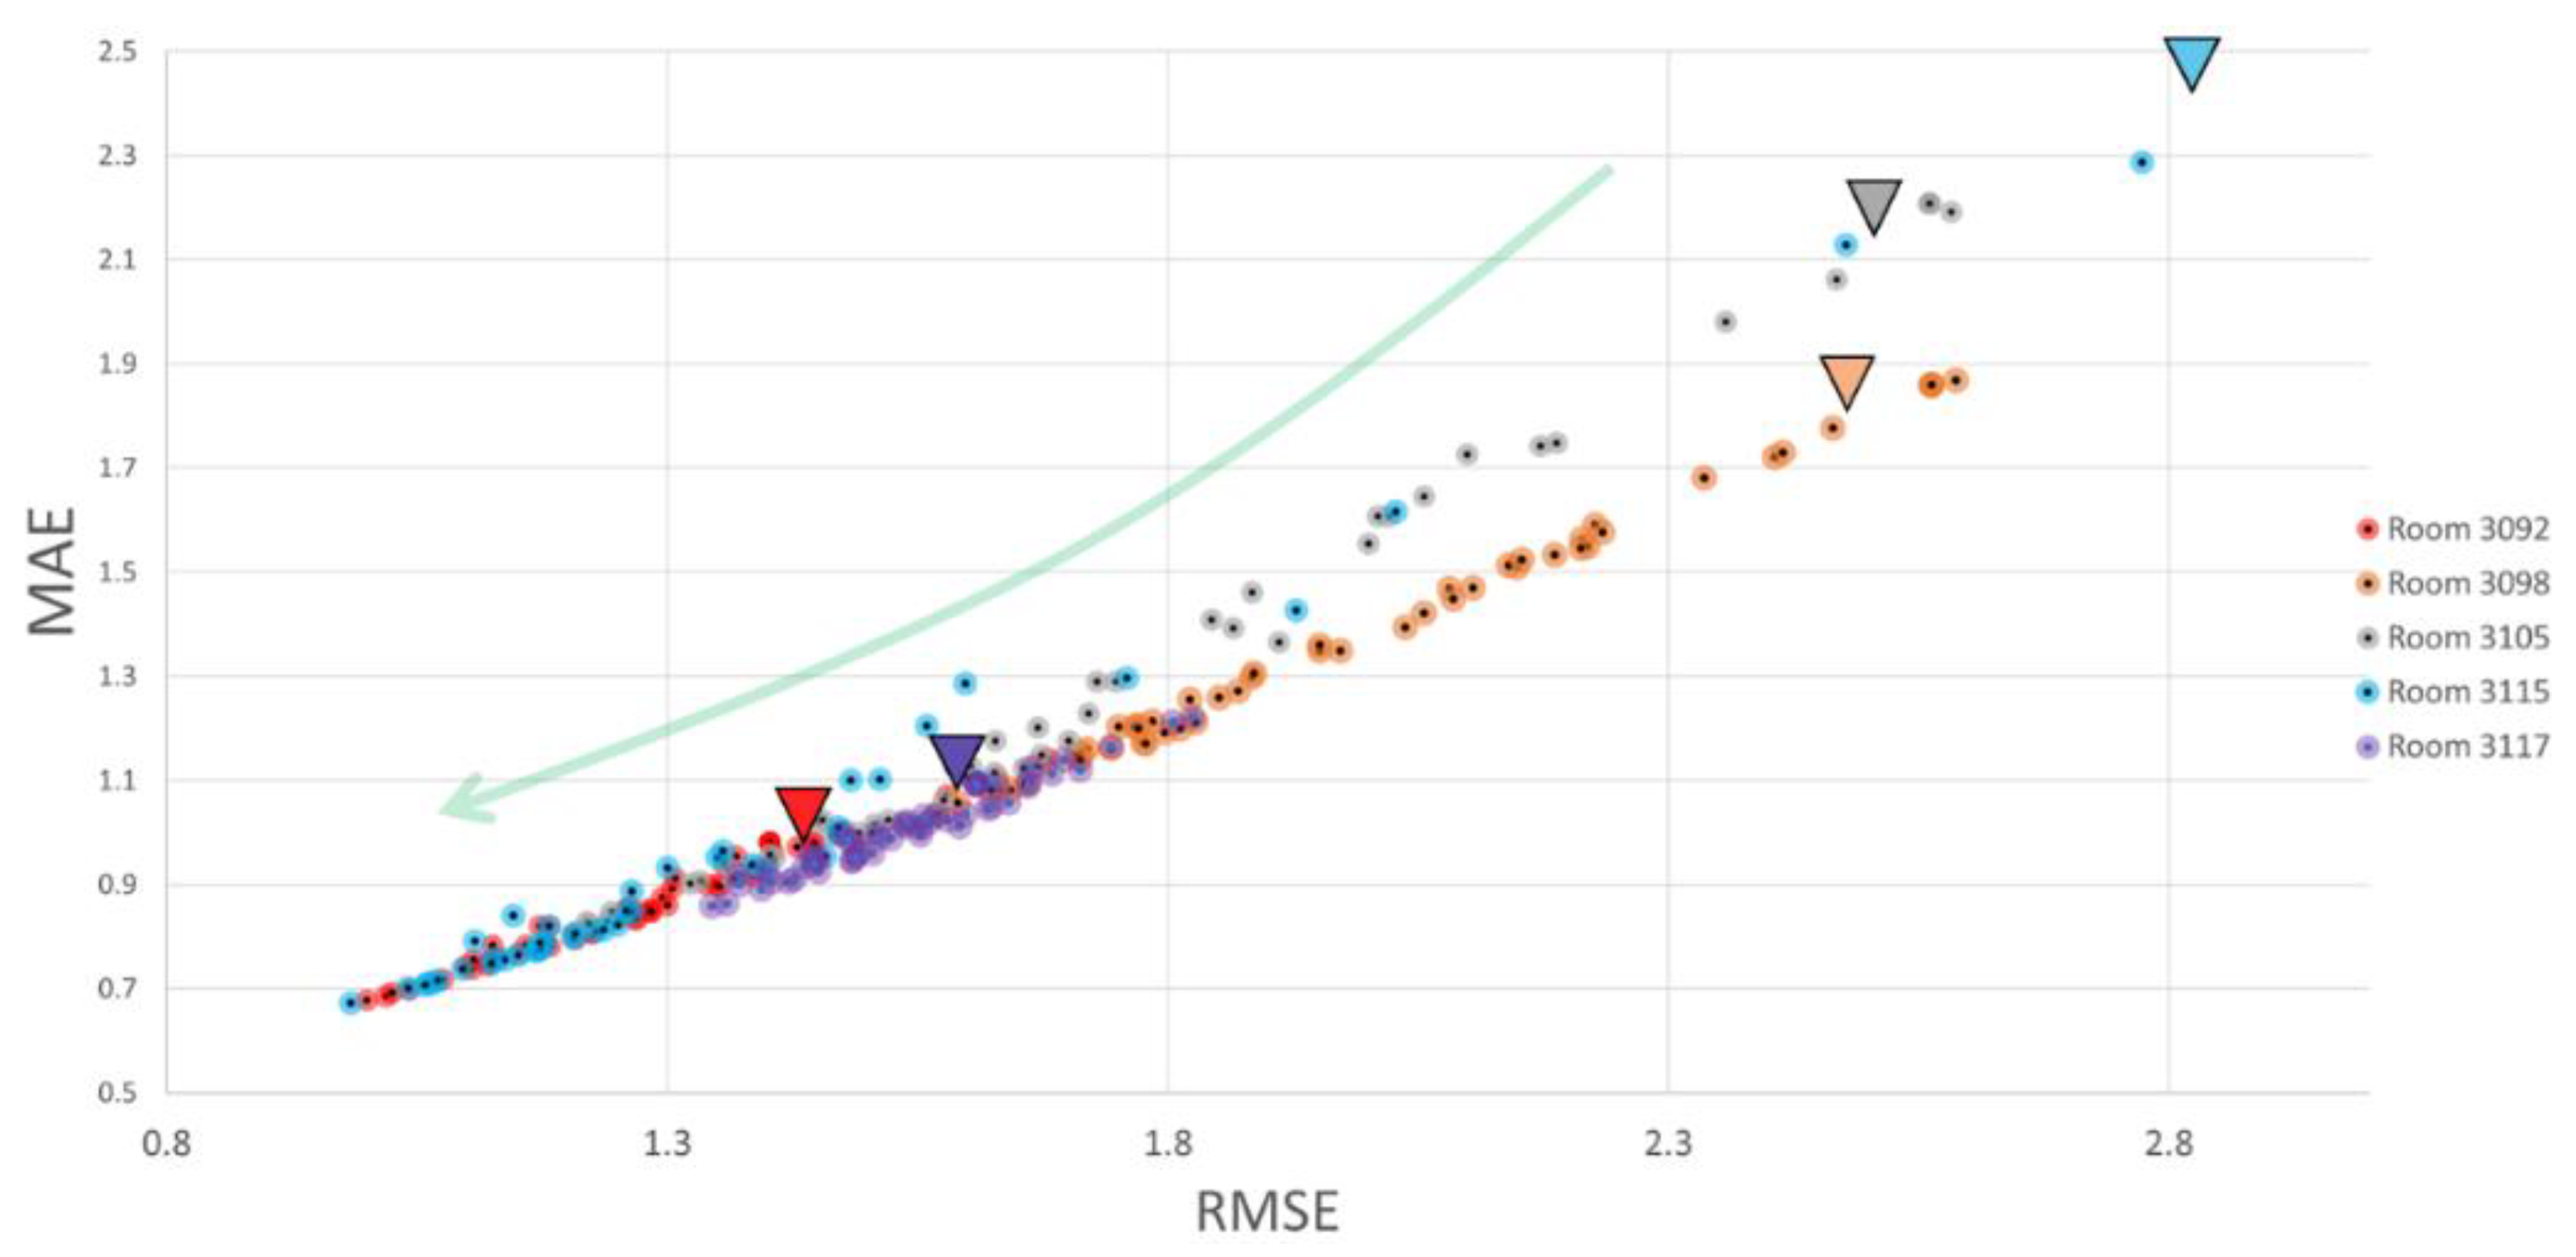
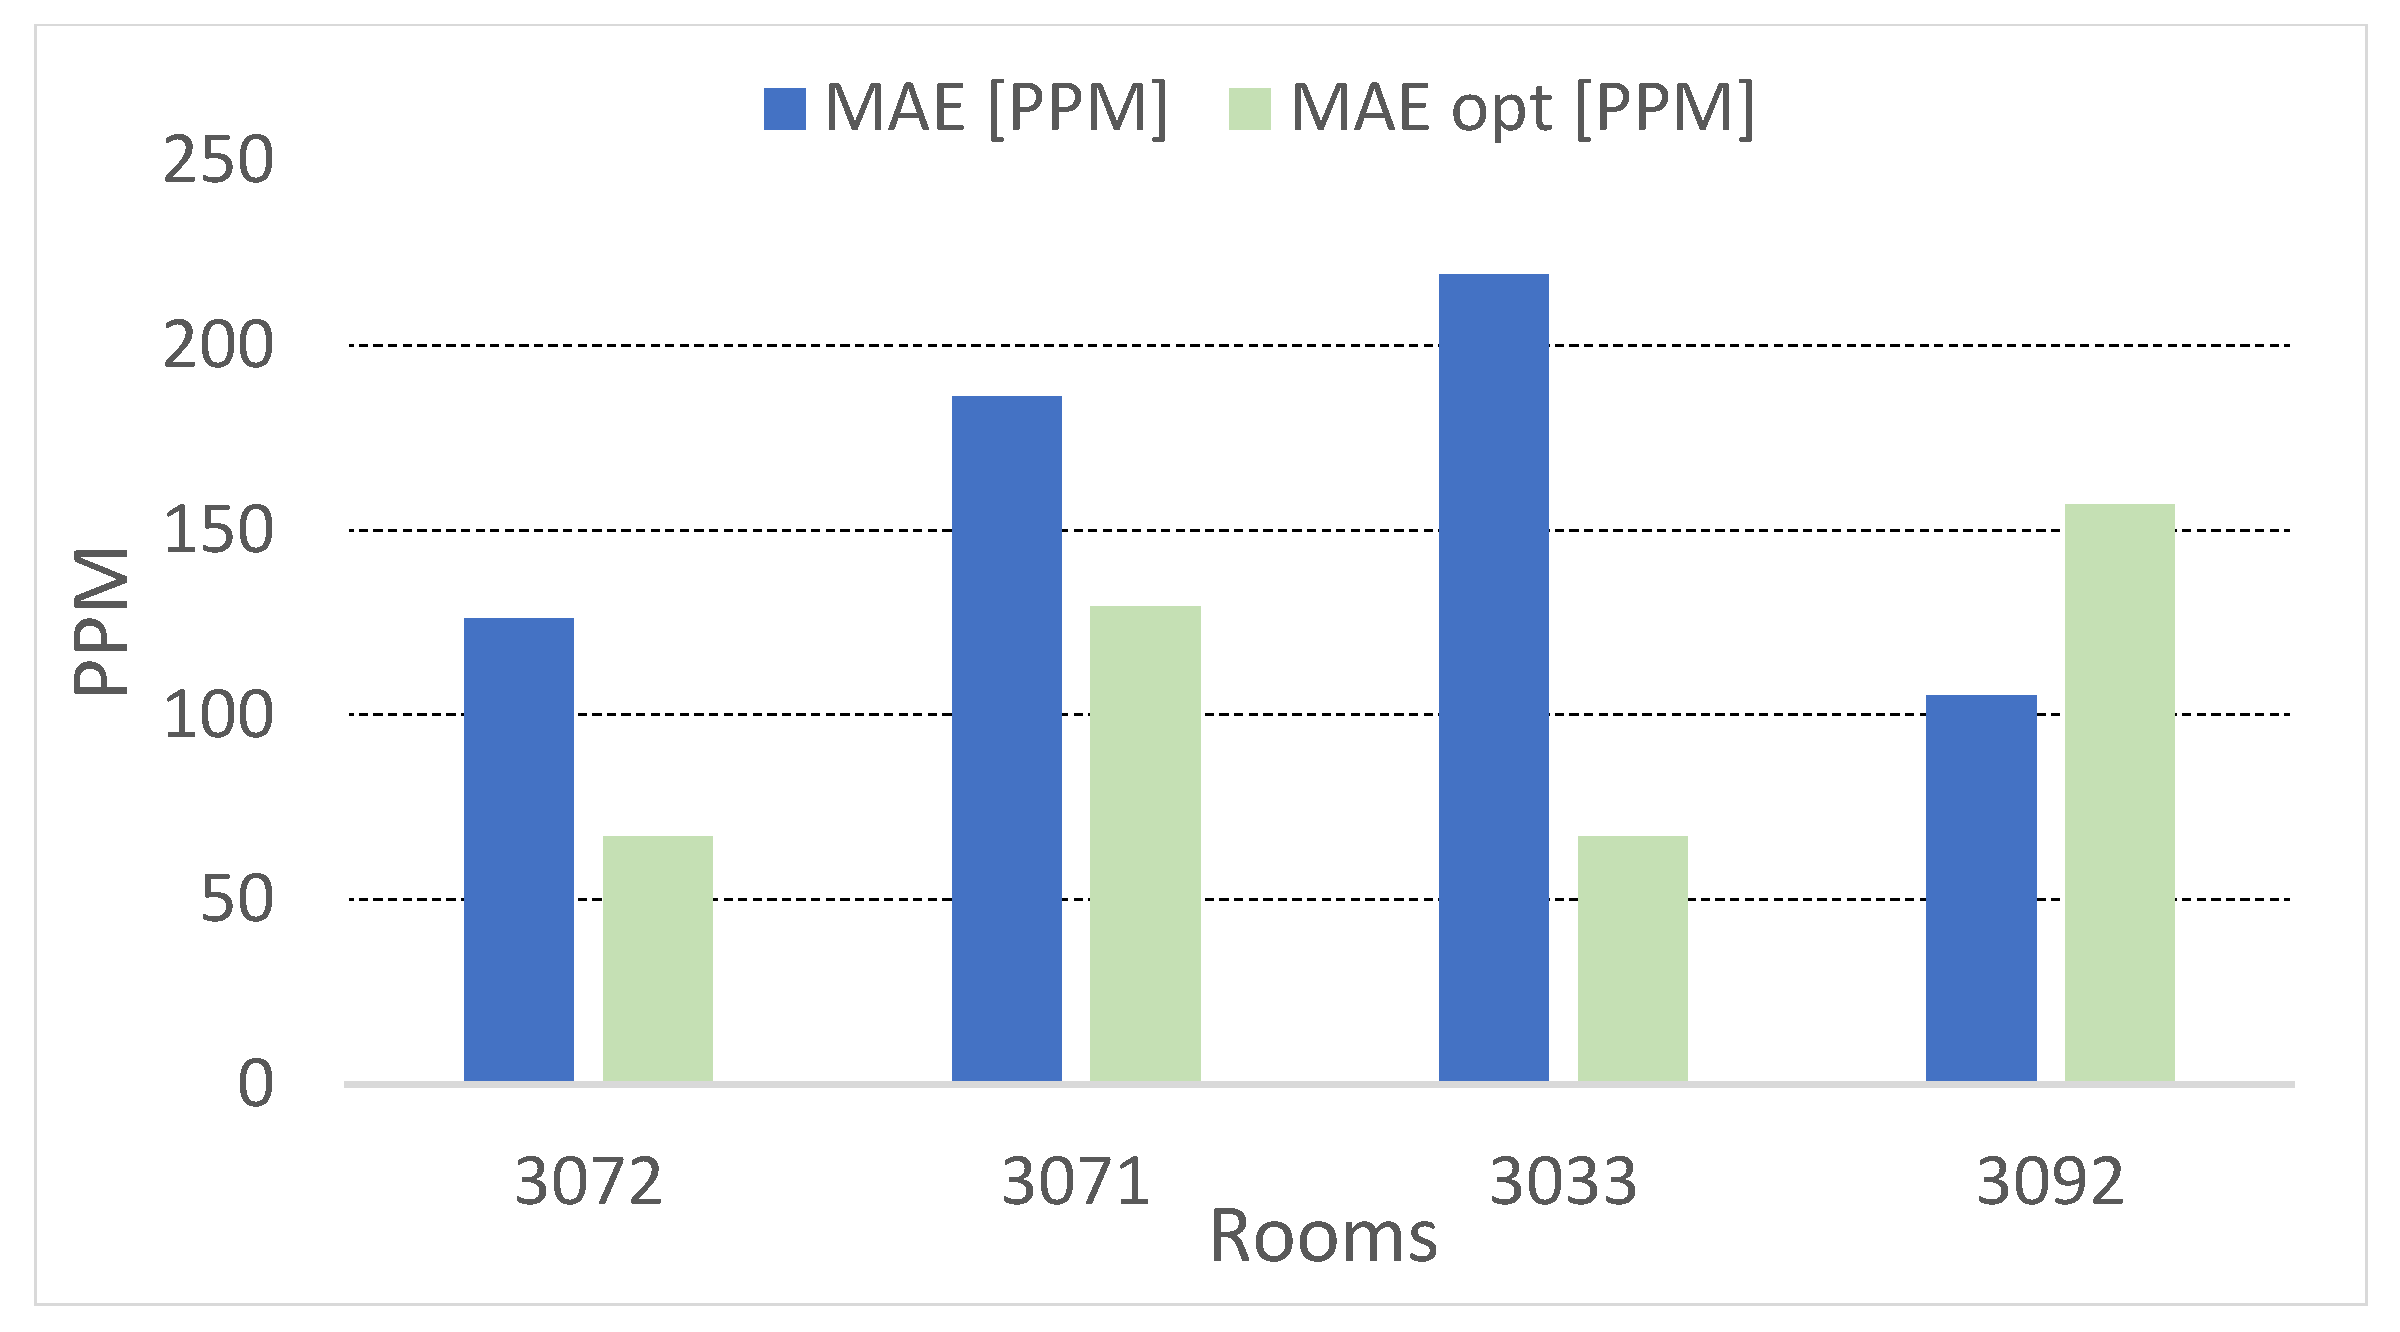
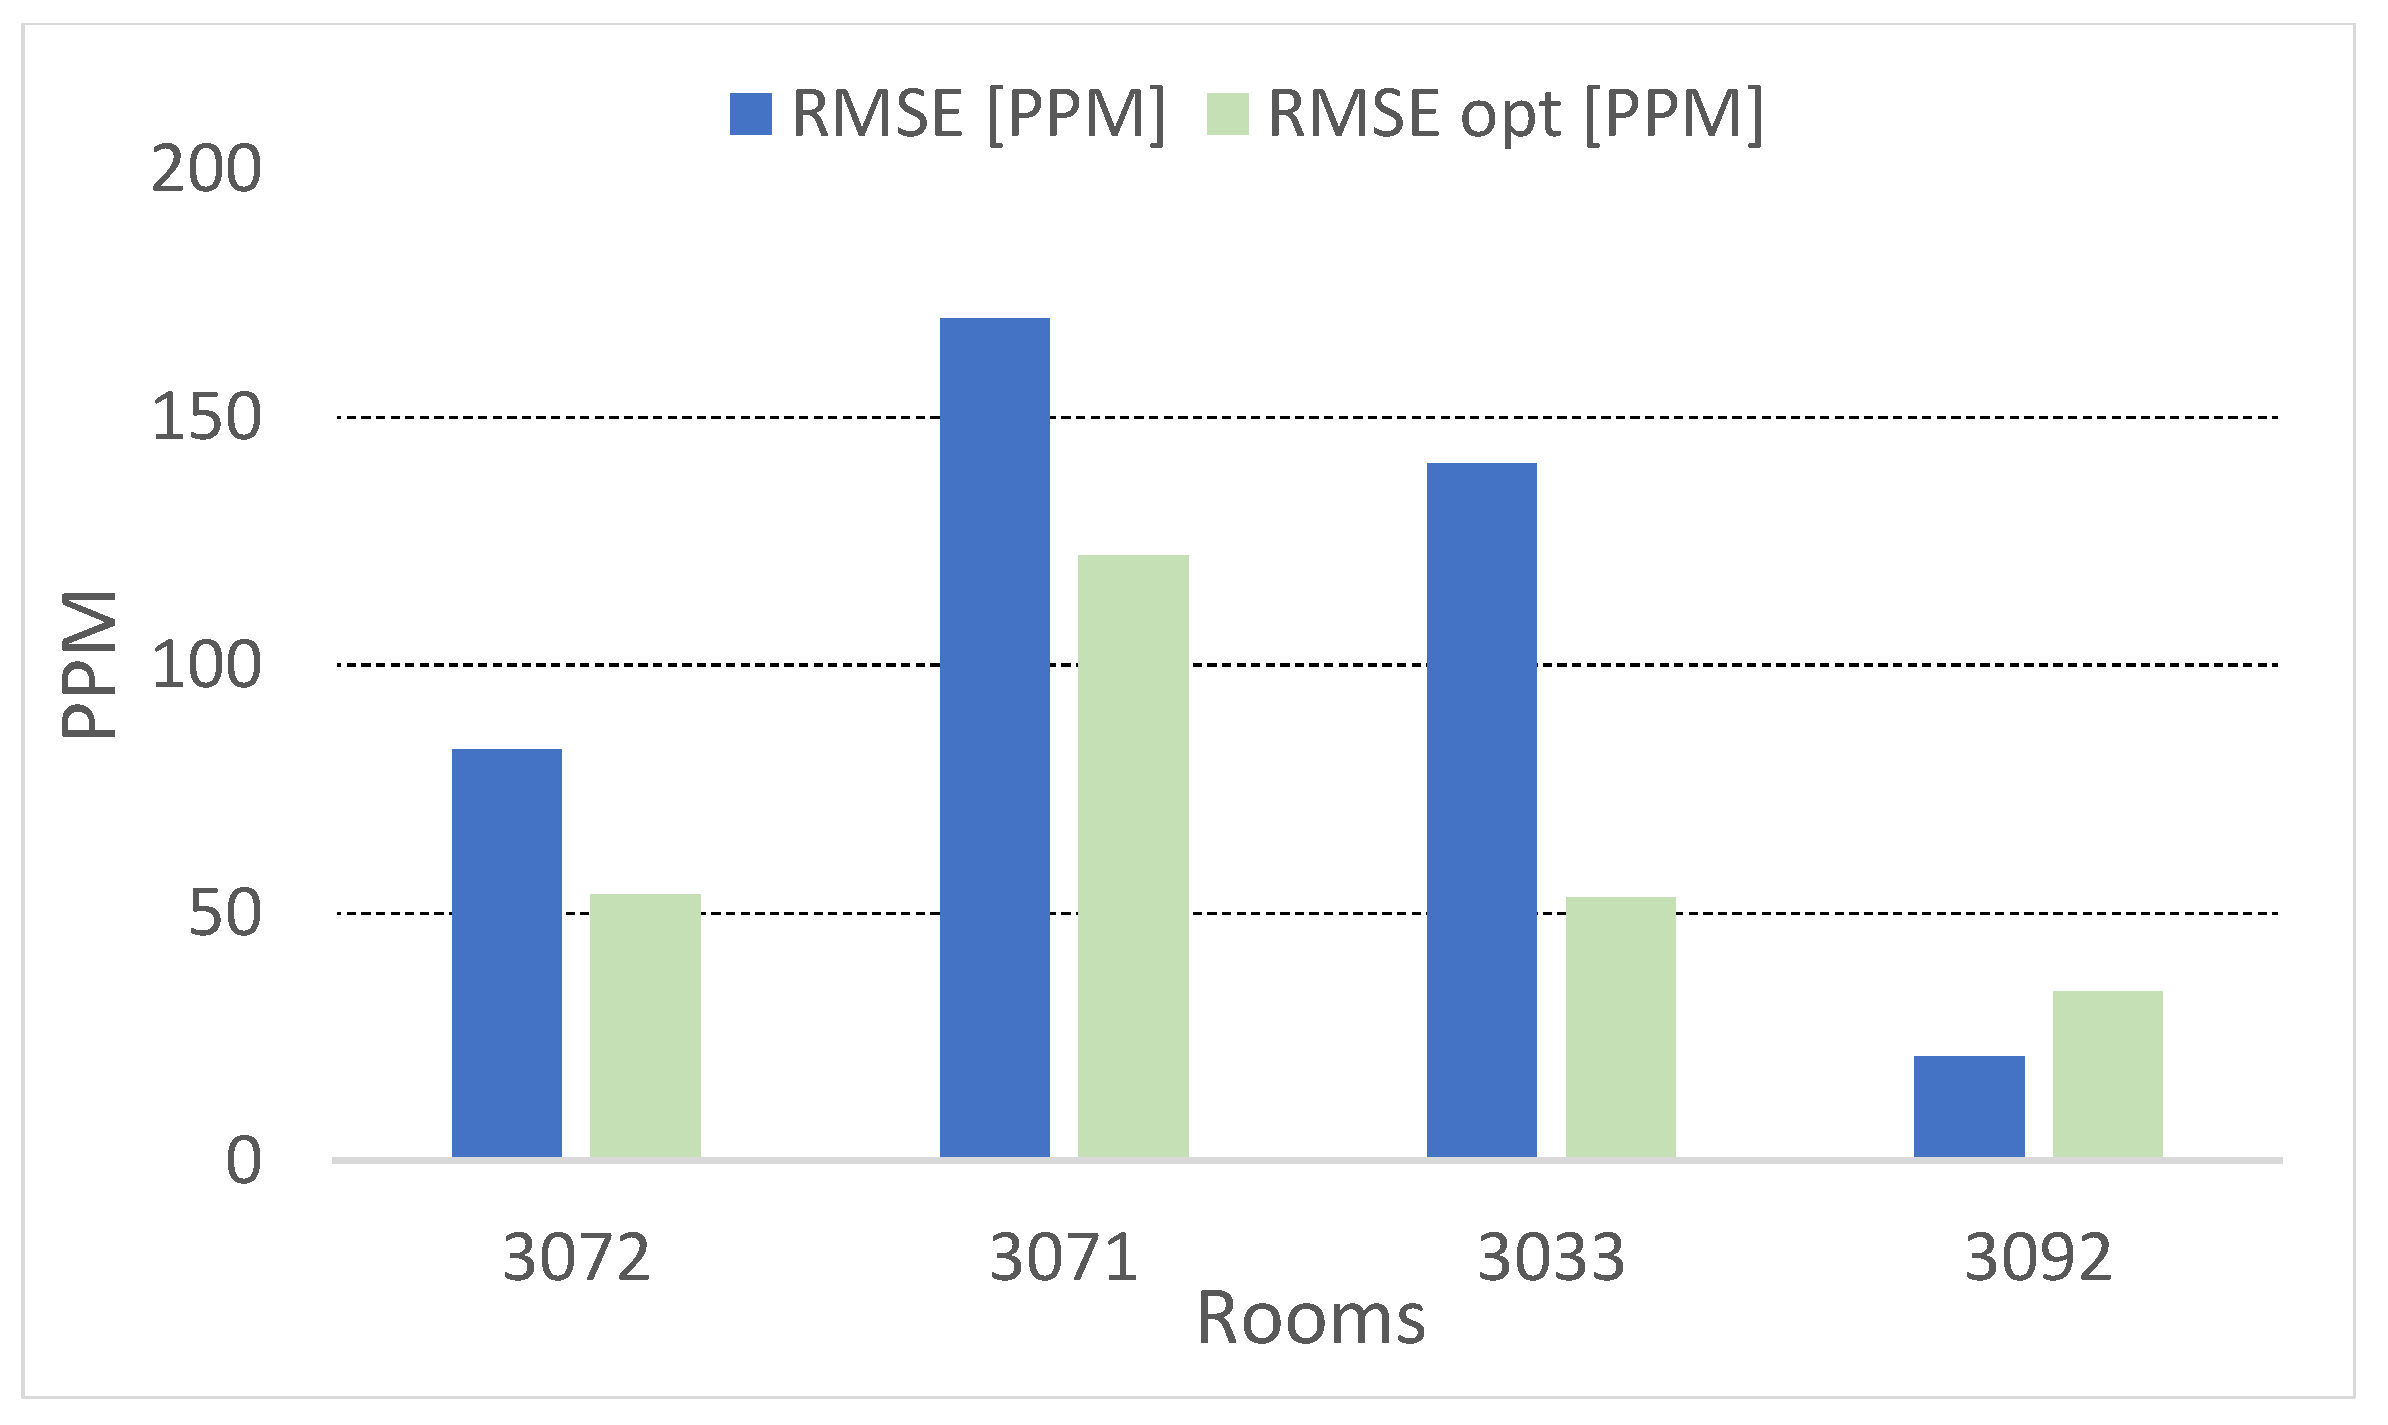
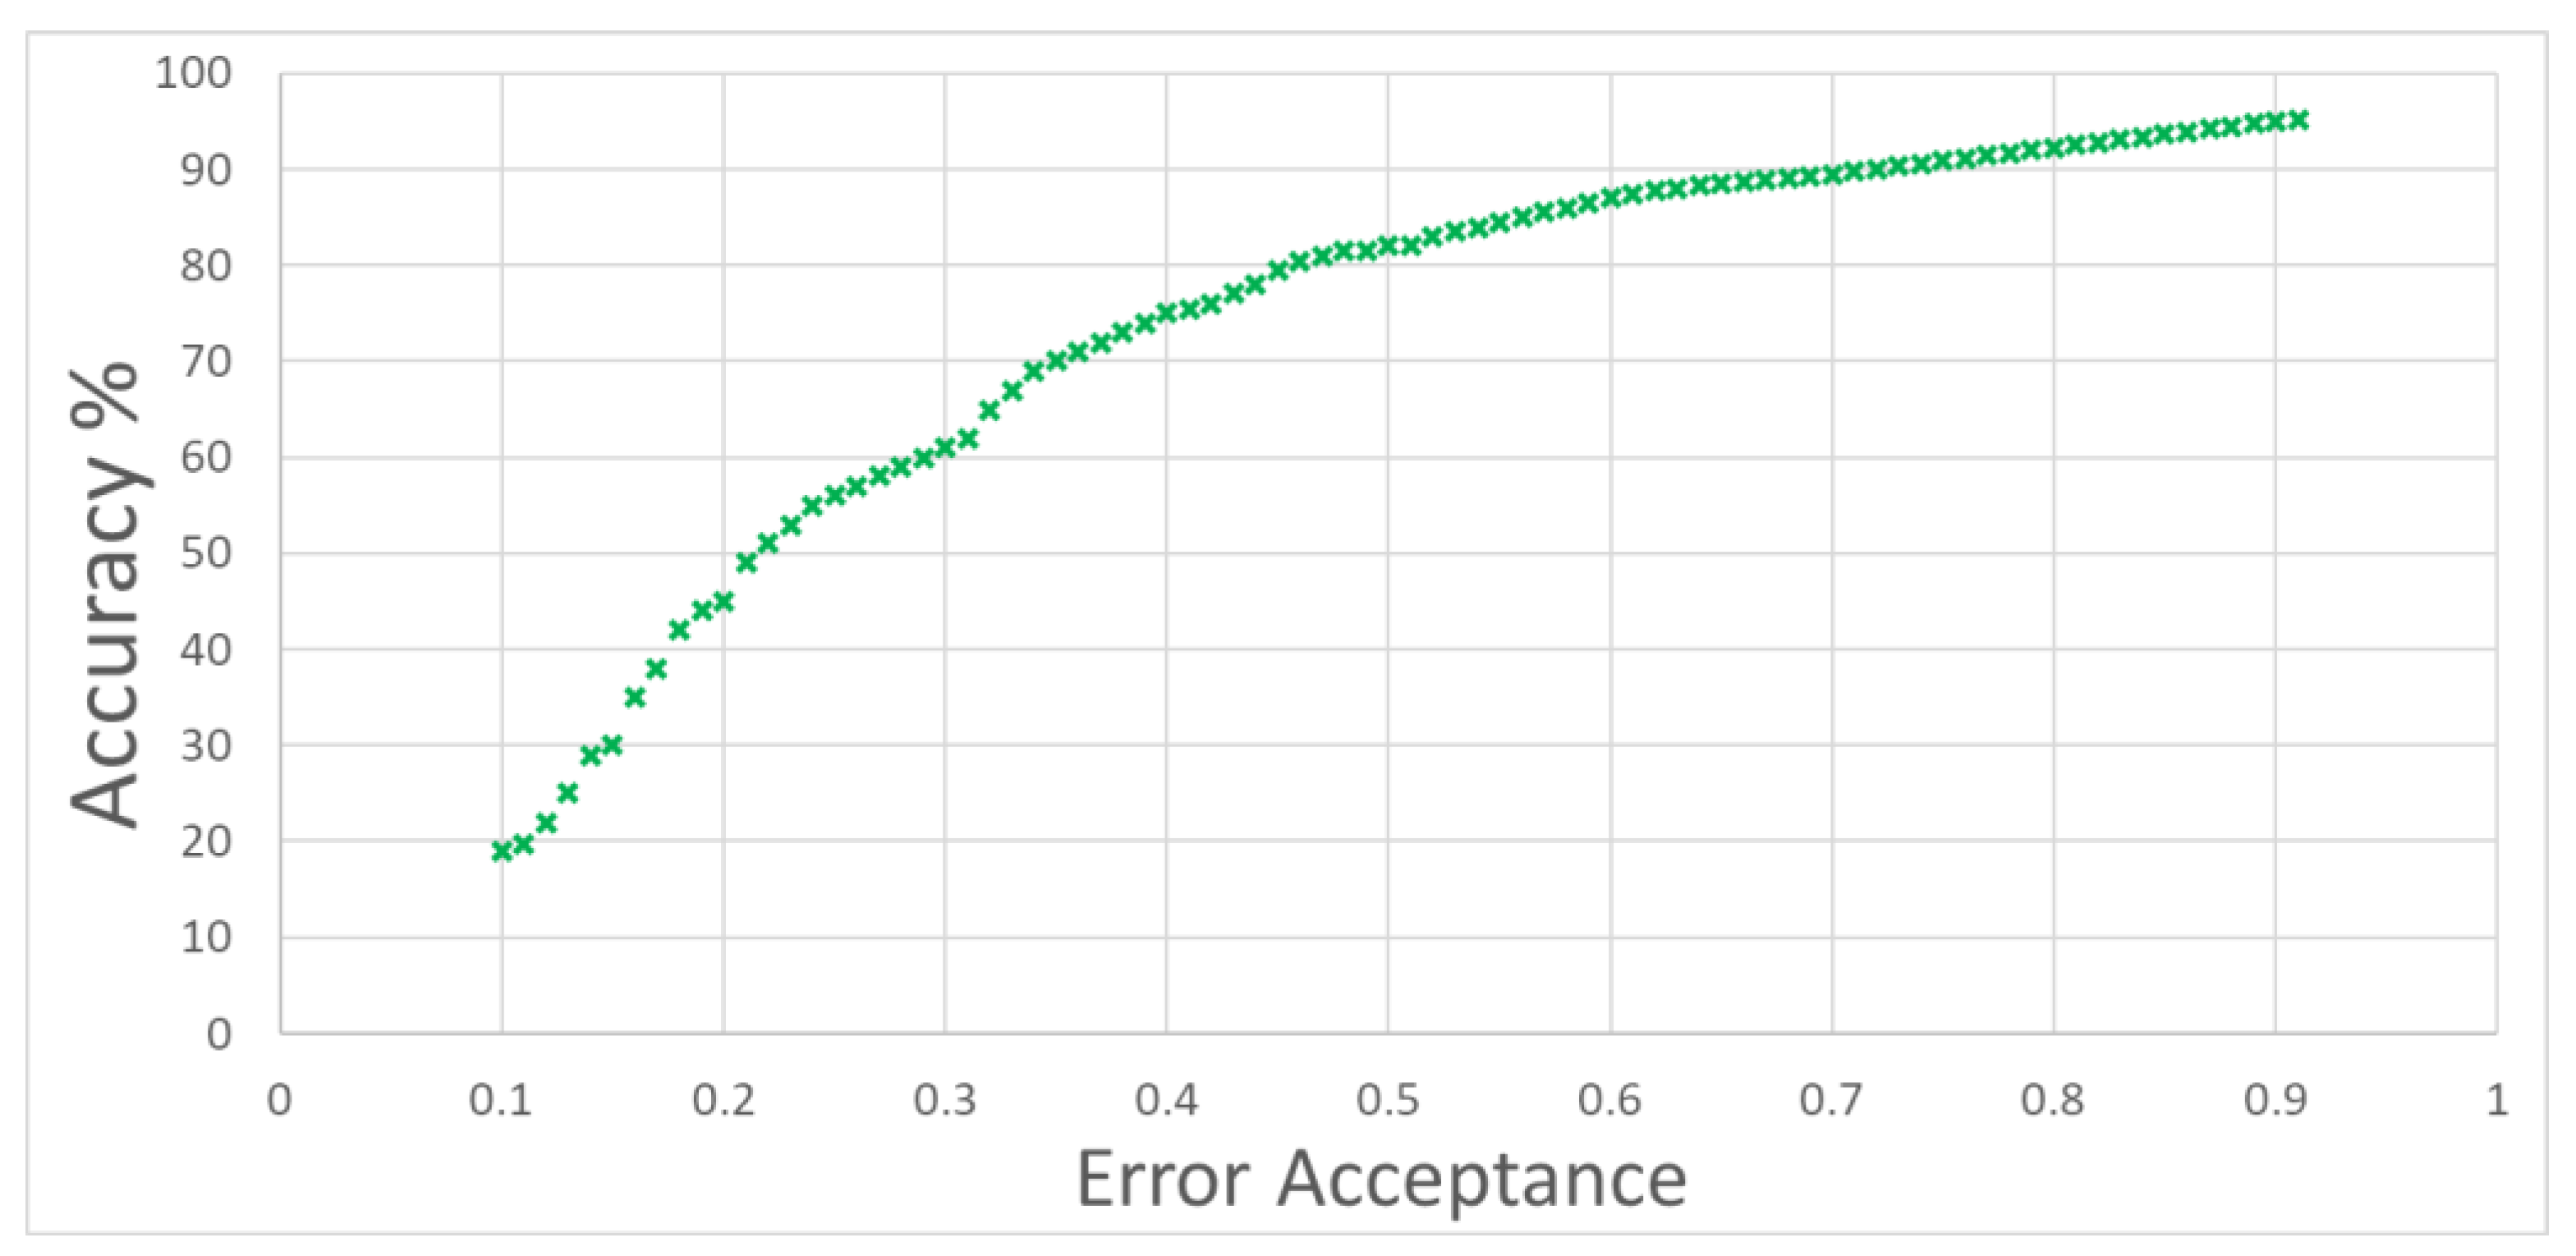
3.6. Accuracy and Comparison

Figure 17 shows the results of the comparison between the reconstructed true vote of the occupants (as explained in Section 2), the PMV calculations, and the ML prediction for the thermal comfort for an entire year (2019). The PMV calculations and the ML predictions were calculated using the co-simulation technique for the year of analysis. An analysis of the results shows that the PMV–PPD model significantly overestimates the comfort votes starting in spring and for the entire summer months and underestimates the severity of the votes in the winter months. It is clear from these results that the PMV–PPD model would be insufficient for informing control algorithms compared to the developed ML prediction algorithm. The ML vote predictions effectively follow the true vote trend for the entire year. In particular, the model is able to predict values on the warm part of the scale as well on the cold part for each day of the year for the occupied hours. It is also important to note that the ML model seems to be less accurate at predicting thermal comfort votes on the extreme hot or cold end of the scale. This is because few training instances were available for extreme votes from the occupants to accurately train the model. For this reason, the adoption of balancing techniques may be required to further improve the results. Figure 18 shows the comparison of the predictions of the PMV method and the machine learning method when compared to the true vote over five working days. In the image, it is possible to identify the minimum and maximum derived from the distributions generated by the machine learning model. A comparison of the results shows the overpredictions of the PMV model for the considered days in April.
The Bayesian ML model produces ranges of predictions that are comparable to the actual vote from the occupants. Generally, the maximum and minimum values of the ML prediction always include the true vote from the occupants for the period of analysis. This information can be used to predict the expected thermal comfort range and to inform optimum building controls. In the context of optimizing thermal comfort, setpoints and heating/cooling operation may be controlled in order to maintain predicted thermal comfort within the predicted ranges.

4. Discussion

The results of model calibration show the reliability of the proposed methodology to facilitate the creation of digital representations of the real office building. In particular, the multi-step calibration methodology and the continuous data gathering and integration into the simulation model allow for the evolution of the baseline model over time to an operational and finally to an optimized model that accurately represents the actual physical behaviour of the building. The use of data analysis for the creation of actual schedules of operations at the building and system levels enables a more accurate representation of the building. The automatic optimization procedure based on the automatic fine-tuning of the modelling parameters further shortens the gap between the real building and the simulated one. The comparison between Table 2 and Table 3 reveals the improvements in terms of the metrics achieved with the final fine-tuning procedure. The final outcome of the procedure shows that values of the me trics are mostly within the suggested ranges, and, therefore, the model can be considered calibrated for the variables under analysis. From a visual perspective, Figure 5 shows the quality of the results when compared to the actual metered data. The final model is very capable of reproducing the behaviour of the real building for the considered IEQ variables and, therefore, is suitable to be used as an additional source of training data for the machine learning approaches.
The validation of the different machine learning models deployed for this study underlines the capacity of these techniques to produce more reliable results compared to traditional thermal comfort studies. In this regard, classification models trained on a seven-value scale show a top accuracy of about 69%, which constitutes an improvement of about 20–25% with respect to the traditional PMV method (45–50% accuracy). When the model is trained on a smaller scale (three-value) the top accuracy is about 85%. In both cases, the random forest approach seems to be the most accurate method of prediction. A linear Bayesian implementation of the predictive approach allowed the model to consider a continuous scale rather than a categorical scale, increasing the granularity of the response of the prediction to the entire spectrum of possible continuous values (−3, +3). In this case, the accuracy of the model is dependent on the acceptable range of error. For example with an error acceptance of ±0.4, the model shows an accuracy of about 76%. In addition, the Bayesian approach of generating a distribution of possible values intrinsically takes into account the uncertainties related to the measurements, the model, and subjective decision of the occupants, providing a much more realistic figure of the thermal sensation of the room. Moreover, by generating maximum and minimum boundaries, it is suitable to be integrated into control methods that act on air temperature set points.
The connection between the calibrated energy simulation model and the machine learning predictive approach allows for generating data in different scenarios. This approach takes the most useful features of the two methods and combines them together. On one side, it uses the scenario evaluation approach of the physics-based simulation, and, on the other, it uses the predictive capabilities of the ML model that was directly trained on occupant feedback. The result is the possibility to generate realistic thermal comfort feedback by simulating different scenarios in the energy model. This is very useful for a control mechanism, as it provides the possibility of changing settings in the model before performing any change in the operation of the real building. By using this approach, it was possible to generate thermal comfort data for an entire year of simulation.

5. Conclusions

The prediction of thermal comfort feedback in office buildings is a difficult task that generally is approached using physics-based calculations derived from a number of environmental variables. Thermal comfort was found to be related to a number of subjective and personal judgements of the occupants of the building. Machine learning models that are trained on actual data inherit personal judgments, skewed preferences, and personalised feedback as well as historical trends. Therefore, underlining the information captured in the actual data can be learnt and used for future predictions. In this work, the capabilities of the ML models when used for predicting thermal comfort votes from occupants were tested. The results show that different configurations of the ML models are able to capture personal preferences of the occupant, overcoming the main limitations of traditional methods. When compared to normative approaches, such as the PMV method, the ML algorithms reduced the prediction error by at least 25%, reaching a top accuracy of almost 70% on a seven-value scale and about 85% on a three-value scale. The use of Bayesian modelling allowed for a more realistic response in terms of the possible ranges of thermal comfort, with minimum and maximum limits of acceptability, and enabled the possibility of predicting thermal comfort on a continuous value scale rather than being discretized in three or seven values. When physics-based simulation and ML data-driven model are combined, the new modelling technique constitutes a useful predictive tool for testing different control strategies and operations of the building before applying them in the real one. In addition, by merging the two modelling techniques, it was possible to extract additional information for the training of the ML algorithms from the calibrated building energy model, such as the mean radiant temperature. The use of ML techniques is important for taking into account many occupant-related variables for thermal comfort. Nevertheless, some limitations should be taken into account. ML model accuracy and precision is directly related to the available data. Missing data limits the quality of the predictive models. For this reason, for extreme vote classes it is important either to gather a sufficient number of training samples or to use advanced balancing techniques that are able to generate synthetic data from the available ones. In future work, several pre-processing techniques could be tested on the training dataset for balancing purposes as well as the extraction of additional variables from the calibrated building energy model as additional predictors. In conclusion, the union of building physics modelling and machine learning techniques generates a hybrid modelling approach that showed several advantages. This can be leveraged to create tailored predictive models for testing building control routines as well as optimised operational scenarios as testing options before being applied on the actual building.

Author Contributions

Conceptualization, G.T.; data curation, G.T., R.F. and P.B.; formal analysis, G.T., R.F. and D.N.; funding acquisition, D.N.; methodology, G.T.; project administration, D.N.; resources, P.B. and D.N.; software, G.T. and R.F.; supervision, G.T. and P.B.; validation, G.T. and R.F.; visualization, G.T.; writing—original draft, G.T.; writing—review and editing, G.T., R.F., P.B. and D.N. All authors have read and agreed to the published version of the manuscript.

Funding

This research was funded by the H2020 iBECOME project, grant number 894617.

Institutional Review Board Statement

Not applicable.

Informed Consent Statement

Not applicable.

Conflicts of Interest

The authors declare no conflict of interest. The funders had no role in the design of the study; in the collection, analyses, or interpretation of data; in the writing of the manuscript, or in the decision to publish the results.

References

  1. Mallawaarachchi, H.; De Silva, L.; Rameezdeen, R. Modelling the relationship between green built environment and occupants’ productivity. Facilities 2017, 35, 170–187. [Google Scholar] [CrossRef]
  2. Van Hoof, J.; Mazej, M.; Hensen, J.L.M. Thermal comfort: Research and practice. Front. Biosci. 2010, 15, 765–788. [Google Scholar] [CrossRef] [PubMed] [Green Version]
  3. Yacine, S.M.; Noureddine, Z.; Piga, B.E.A.; Morello, E.; Safa, D. Towards a new model of light quality assessment based on occupant satisfaction and lighting glare indices. Energy Procedia 2017, 122, 805–810. [Google Scholar] [CrossRef] [Green Version]
  4. Lan, L.; Wargocki, P.; Lian, Z. Quantitative measurement of productivity loss due to thermal discomfort. Energy Build. 2011, 43, 1057–1062. [Google Scholar] [CrossRef]
  5. Lan, L.; Lian, Z.; Pan, L. The effects of air temperature on office workers’ well-being, workload and productivity-evaluated with subjective ratings. Appl. Ergon. 2010, 42, 29–36. [Google Scholar] [CrossRef]
  6. Parkinson, T.; Parkinson, A.; de Dear, R. Continuous IEQ monitoring system: Context and development. Build. Environ. 2019, 149, 15–25. [Google Scholar] [CrossRef] [Green Version]
  7. Larsen, T.S.; Rohde, L.; Jønsson, K.T.; Rasmussen, B.; Jensen, R.L.; Knudsen, H.N.; Witterseh, T.; Bekö, G. IEQ-Compass—A tool for holistic evaluation of potential indoor environmental quality. Build. Environ. 2020, 172, 106707. [Google Scholar] [CrossRef]
  8. Gao, G.; Li, J.; Wen, Y. DeepComfort: Energy-Efficient Thermal Comfort Control in Buildings Via Reinforcement Learning. IEEE Internet Things J. 2020, 7, 8472–8484. [Google Scholar] [CrossRef]
  9. Djongyang, N.; Tchinda, R.; Njomo, D. Thermal comfort: A review paper. Renew. Sustain. Energy Rev. 2010, 14, 2626–2640. [Google Scholar] [CrossRef]
  10. Cheng, Y.; Niu, J.; Gao, N. Thermal comfort models: A review and numerical investigation. Build. Environ. 2012, 47, 13–22. [Google Scholar] [CrossRef]
  11. Karjalainen, S. Thermal comfort and gender: A literature review. Indoor Air 2012, 22, 96–109. [Google Scholar] [CrossRef] [PubMed]
  12. Rupp, R.F.; Vásquez, N.G.; Lamberts, R. A review of human thermal comfort in the built environment. Energy Build. 2015, 105, 178–205. [Google Scholar] [CrossRef]
  13. Alizadeh, M.; Sadrameli, S.M. Numerical modeling and optimization of thermal comfort in building: Central composite design and CFD simulation. Energy Build. 2018, 164, 187–202. [Google Scholar] [CrossRef]
  14. Croitoru, C.; Nastase, I.; Bode, F.; Meslem, A.; Dogeanu, A. Thermal comfort models for indoor spaces and vehicles—Current capabilities and future perspectives. Renew. Sustain. Energy Rev. 2015, 44, 304–318. [Google Scholar] [CrossRef]
  15. Halawa, E.; Van Hoof, J. The adaptive approach to thermal comfort: A critical overview. Energy Build. 2012, 51, 101–110. [Google Scholar] [CrossRef]
  16. Ioannou, A.; Itard, L.; Agarwal, T. In-situ real time measurements of thermal comfort and comparison with the adaptive comfort theory in Dutch residential dwellings. Energy Build. 2018, 170, 229–241. [Google Scholar] [CrossRef]
  17. Palladino, D.; Nardi, I.; Buratti, C. Artificial neural network for the thermal comfort index prediction: Development of a new simplified algorithm. Energies 2020, 13, 4500. [Google Scholar] [CrossRef]
  18. Menyhárt, J.; Kalmár, F. Investigation of thermal comfort responses with fuzzy logic. Energies 2019, 12, 1792. [Google Scholar] [CrossRef] [Green Version]
  19. Mui, K.W.; Tsang, T.W.; Wong, L.T. Bayesian updates for indoor thermal comfort models. J. Build. Eng. 2020, 29, 101117. [Google Scholar] [CrossRef]
  20. Salamone, F.; Belussi, L.; Currò, C.; Danza, L.; Ghellere, M.; Guazzi, G.; Lenzi, B.; Megale, V.; Meroni, I. Integrated method for personal thermal comfort assessment and optimization through users’ feedback, IoT and machine learning: A case study. Sensors 2018, 18, 1602. [Google Scholar] [CrossRef] [Green Version]
  21. Wang, Z.; Wang, J.; He, Y.; Liu, Y.; Lin, B.; Hong, T. Dimension analysis of subjective thermal comfort metrics based on ASHRAE Global Thermal Comfort Database using machine learning. J. Build. Eng. 2020, 29, 101120. [Google Scholar] [CrossRef] [Green Version]
  22. Farhan, A.A.; Pattipati, K.; Wang, B.; Luh, P. Predicting individual thermal comfort using machine learning algorithms. In Proceedings of the 2015 IEEE International Conference on Automation Science and Engineering (CASE), Gothenburg, Sweden, 24–28 August 2015; pp. 708–713. [Google Scholar]
  23. Pritoni, M.; Salmon, K.; Sanguinetti, A.; Morejohn, J.; Modera, M. Occupant thermal feedback for improved efficiency in university buildings. Energy Build. 2017, 144, 241–250. [Google Scholar] [CrossRef]
  24. Luo, M.; Xie, J.; Yan, Y.; Ke, Z.; Yu, P.; Wang, Z.; Zhang, J. Comparing machine learning algorithms in predicting thermal sensation using ASHRAE Comfort Database II. Energy Build. 2020, 210, 109776. [Google Scholar] [CrossRef]
  25. Wu, Z.; Li, N.; Peng, J.; Cui, H.; Liu, P.; Li, H.; Li, X. Using an ensemble machine learning methodology-Bagging to predict occupants’ thermal comfort in buildings. Energy Build. 2018, 173, 117–127. [Google Scholar] [CrossRef]
  26. Zhang, W.; Hu, W.; Wen, Y. Thermal comfort modeling for smart buildings: A fine-grained deep learning approach. IEEE Internet Things J. 2019, 6, 2540–2549. [Google Scholar] [CrossRef]
  27. Kim, J.; Zhou, Y.; Schiavon, S.; Raftery, P.; Brager, G. Personal comfort models: Predicting individuals’ thermal preference using occupant heating and cooling behavior and machine learning. Build. Environ. 2018, 129, 96–106. [Google Scholar] [CrossRef] [Green Version]
  28. Tang, S.; Shelden, D.R.; Eastman, C.M.; Pishdad-bozorgi, P.; Gao, X. Automation in Construction A review of building information modeling (BIM) and the internet of things (IoT) devices integration: Present status and future trends. Autom. Constr. 2019, 101, 127–139. [Google Scholar] [CrossRef]
  29. Aivaliotis, P.; Georgoulias, K.; Arkouli, Z.; Makris, S. Methodology for enabling digital twin using advanced physics-based modelling in predictive maintenance. Procedia CIRP 2019, 81, 417–422. [Google Scholar] [CrossRef]
  30. Park, J.Y.; Nagy, Z. Comprehensive analysis of the relationship between thermal comfort and building control research—A data-driven literature review. Renew. Sustain. Energy Rev. 2018, 82, 2664–2679. [Google Scholar] [CrossRef]
  31. Drgoňa, J.; Picard, D.; Kvasnica, M.; Helsen, L. Approximate model predictive building control via machine learning. Appl. Energy 2018, 218, 199–216. [Google Scholar] [CrossRef]
  32. Chaudhuri, T.; Soh, Y.C.; Li, H.; Xie, L. Machine learning based prediction of thermal comfort in buildings of equatorial Singapore. In Proceedings of the 2017 IEEE International Conference on Smart Grid and Smart Cities (ICSGSC), Singapore, 23–26 July 2017; pp. 72–77. [Google Scholar]
  33. Liu, S.; Schiavon, S.; Das, H.P.; Jin, M.; Spanos, C.J. Personal thermal comfort models with wearable sensors. Build. Environ. 2019, 162, 106281. [Google Scholar] [CrossRef] [Green Version]
  34. Shahinmoghadam, M.; Natephra, W.; Motamedi, A. BIM- and IoT-based virtual reality tool for real-time thermal comfort assessment in building enclosures. Build. Environ. 2021, 199, 107905. [Google Scholar] [CrossRef]
  35. Chong, A.; Poh Lam, K. A Comparison of MCMC Algorithms for the Bayesian Calibration of Building Energy Models. In Proceedings of the 15th International Conference of IBPSA—Building Simulation 2017, San Francisco, CA, USA, 7–9 August 2017; pp. 494–503. [Google Scholar]
  36. ASHRAE Guideline 14-2014 Measurement of Energy, Demand, and Water Savings; ASHRAE: Atlanta, GA, USA, 2014; Volume 4, pp. 1–150.
  37. Jain, N.; Burman, E.; Mumovic, D.; Davies, M. Operational Performance: Building Performance Modelling and Calibration for Evaluation of Energy in-Use; CIBSE TM63: London, UK, 2020. [Google Scholar]
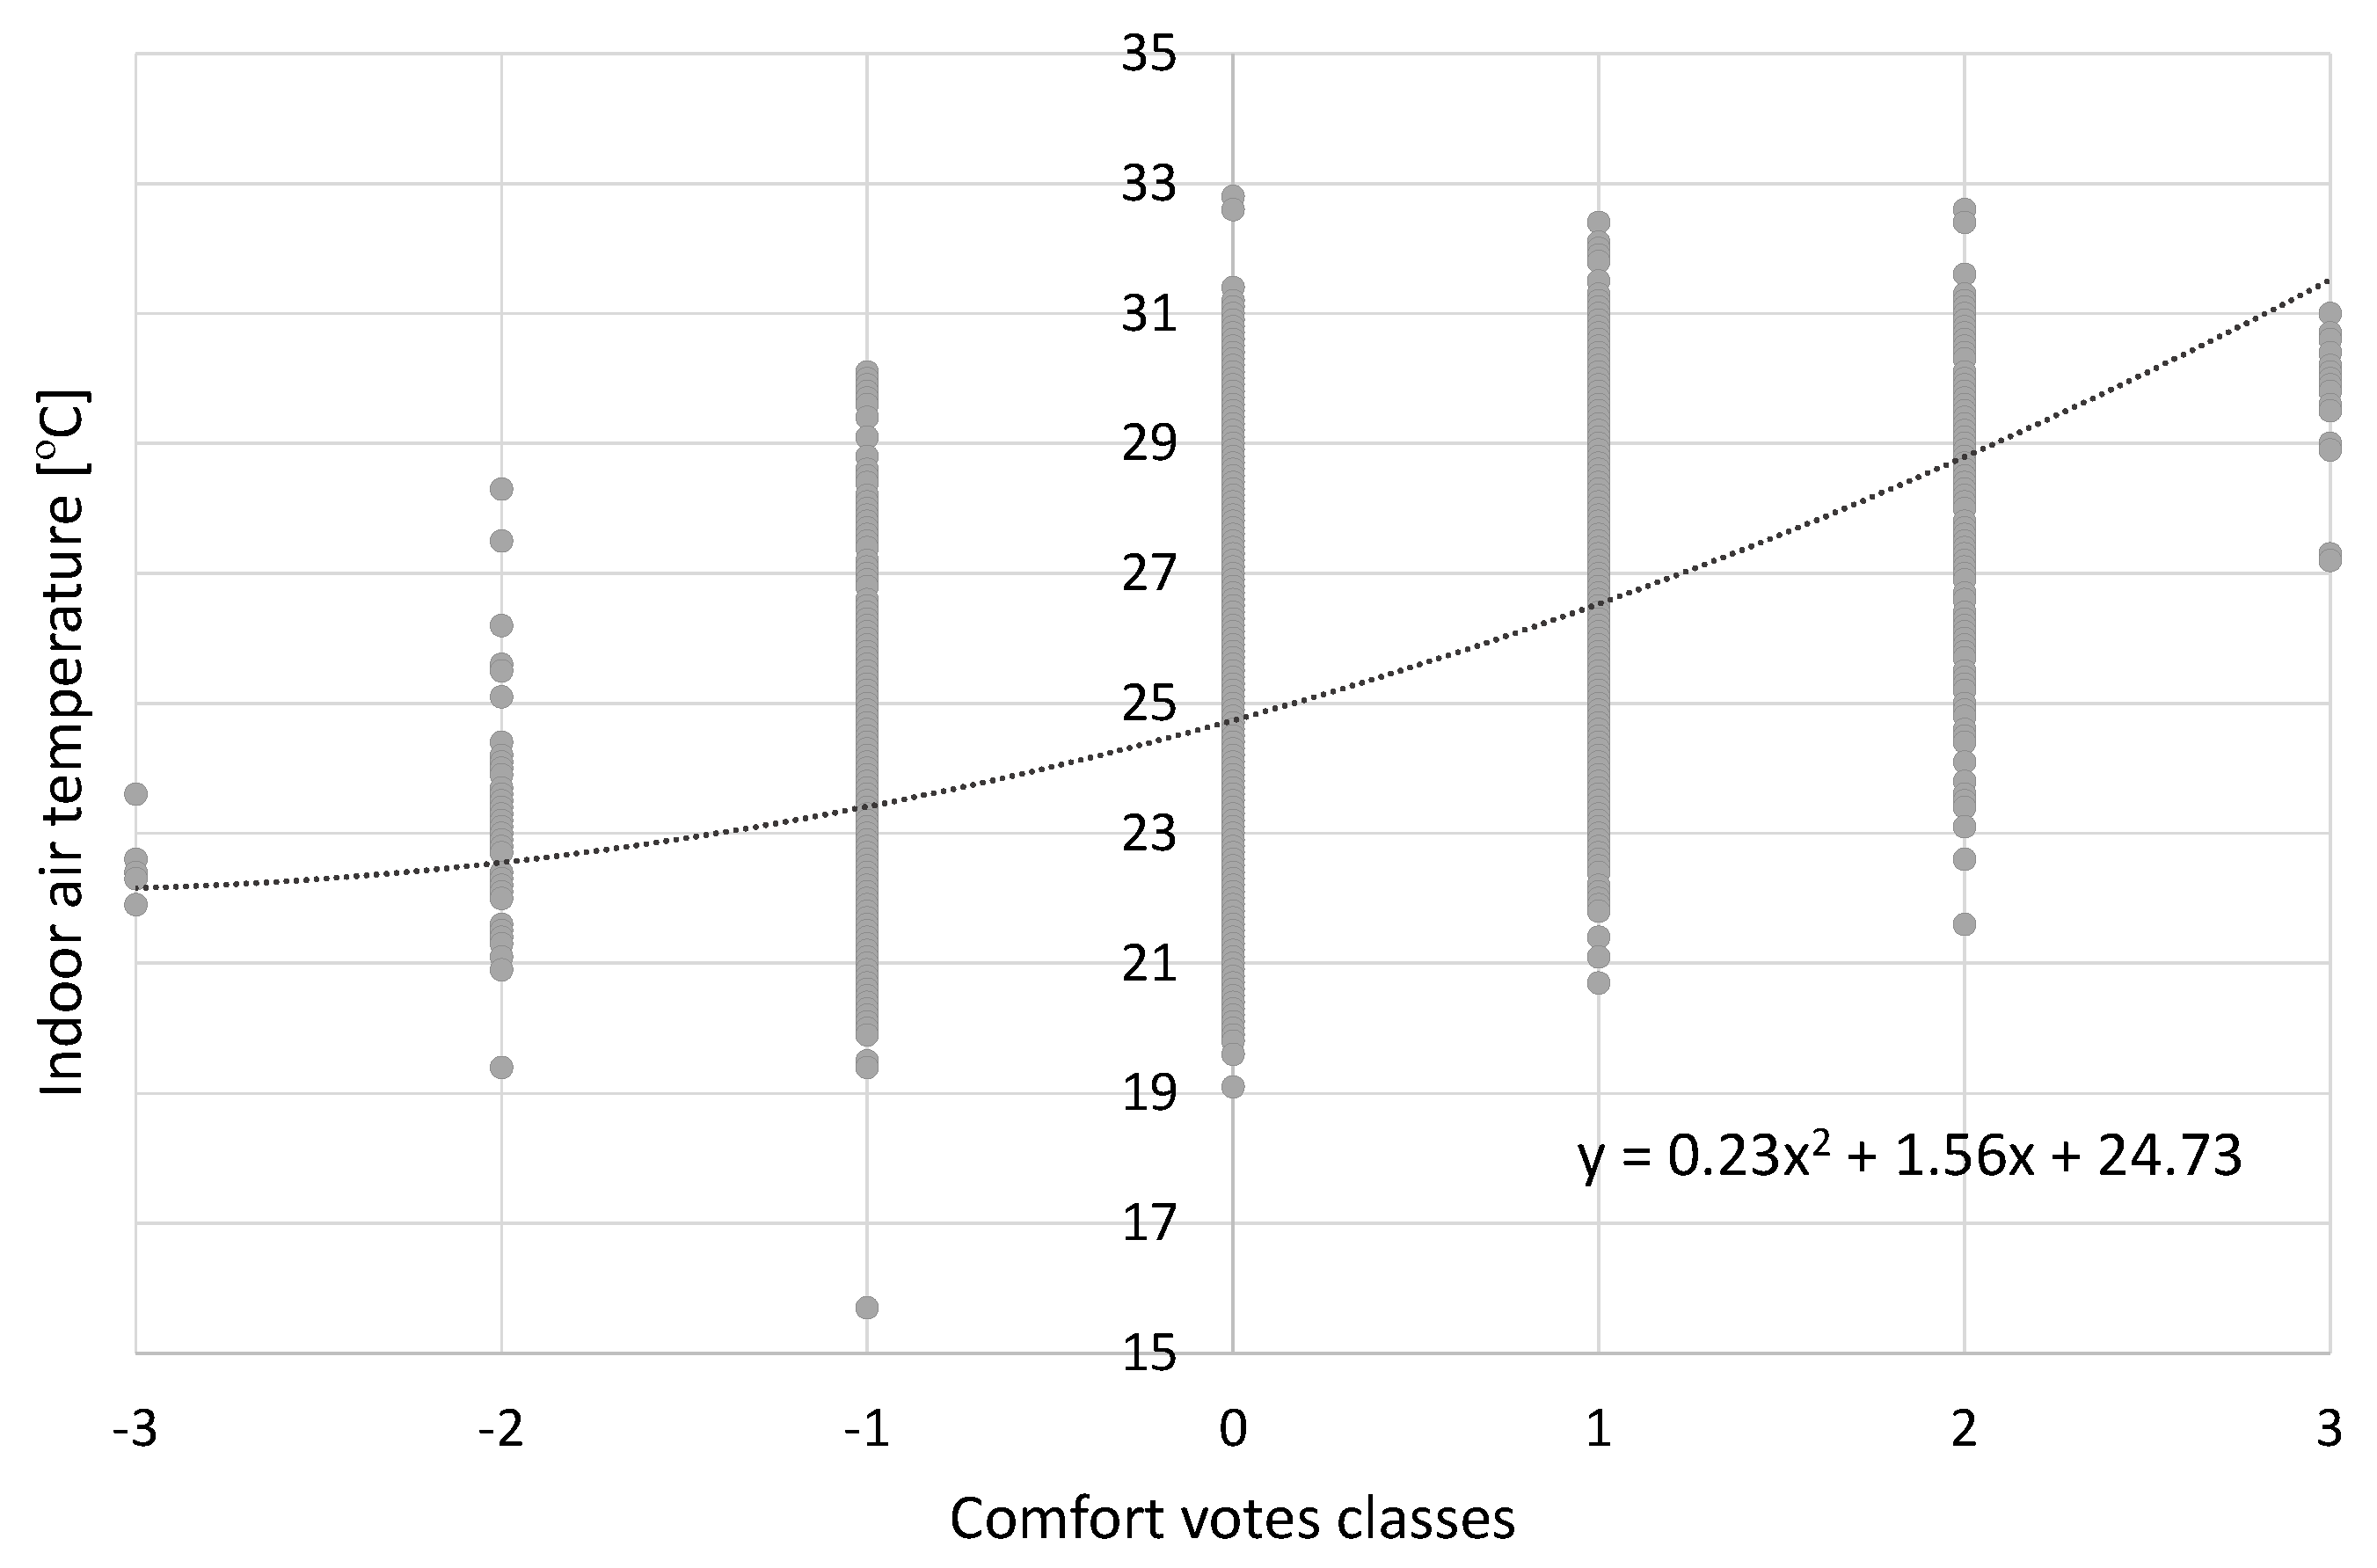
Figure 1. Methodology diagram.
Buildings 12 00475 g001
Figure 2. Data merging procedure.
Buildings 12 00475 g002
Figure 3. Seven- and three-value thermal comfort scales.
Buildings 12 00475 g003
Figure 4. The Helios building.
Buildings 12 00475 g004
Figure 5. Distribution of the comfort votes collected in the Helios building during the period from July 2018 to June 2019.
Buildings 12 00475 g005
Figure 6. Indoor air temperature and thermal comfort votes scatter plot.
Buildings 12 00475 g006
Figure 7. (a) Outdoor air temperature and thermal comfort votes scatter plot; (b) Clothing level and outdoor air temperature.
Buildings 12 00475 g007
Figure 8. UI of the thermal comfort vote device.
Buildings 12 00475 g008
Figure 9. IESVE model of the building.
Buildings 12 00475 g009
Figure 10. Results of the optimisation procedures and progressive improvements of the calibration metrics for 5 rooms in the Helios building. The triangles represent the values of the calibration metrics at the beginning of the optimisation procedure.
Buildings 12 00475 g010
Figure 11. Mean absolute error for the CO2 concentration: comparison calibrated model vs. optimized model.
Buildings 12 00475 g011
Figure 12. Root-mean-square error of the CO2 concentration: comparison calibrated model vs. optimized model.
Buildings 12 00475 g012
Figure 13. Mean absolute error for the air temperature: comparison calibrated model vs. optimized model.
Buildings 12 00475 g013
Figure 14. Root-mean-square error for the air temperature: comparison calibrated model vs. optimized model.
Buildings 12 00475 g014
Figure 15. Comparison between the air temperature measurements in one room of the Helios building and the output of the simulation across 2 weeks in winter.
Buildings 12 00475 g015
Figure 16. Prediction accuracy of the Bayesian multi-linear regression model under various error acceptance thresholds.
Buildings 12 00475 g016
Figure 17. Comparison between the true comfort vote, the PMV evaluation, and the ML model results.
Buildings 12 00475 g017
Figure 18. Comparison of the votes from the occupants with the ML model predictions and the normative PMV approach.
Buildings 12 00475 g018
Table 1. Means and standard deviations of temperatures for each thermal comfort vote range.
Vote Range−3−2−10123
Mean22.5623.0723.5024.6327.128.2129.7
Standard deviation0.561.351.682.042.212.080.93
Table 2. Calibration results for three rooms of the Helios building for the period January–March 2018.
RoomVariableMAE (°C, PPM)RMSE (°C, PPM)
3072Air temperature (°C)4.122.41
3072CO2 (PPM)126.1383.01
3071Air temperature (°C)3.611.16
3071CO2 (PPM)186.12169.93
3033Air temperature (°C)1.330.725
3033CO2 (PPM)219.2140.7
3092Air temperature (°C)1.380.425
3092CO2 (PPM)105.1520.98
Table 3. Calibration metrics after fine-tuning with optimisation for various rooms of the Helios building for the period January–March 2018.
RoomVariableMAE (°C, PPM)RMSE (°C, PPM)
3072Air temperature (°C)2.452.12
3072CO2 (PPM)67.2053.78
3071Air temperature (°C)0.650.51
3071CO2 (PPM)129.45122.13
3033Air temperature (°C)0.740.59
3033CO2 (PPM)67.0153.19
3092Air temperature (°C)1.170.33
3092CO2 (PPM)156.8434.17
Table 4. Accuracy results achieved by different ML techniques.
ML ClassifierAccuracy
K-Neighbours Classifier62%
Decision Tree Classifier56%
Random Forest Classifier69%
Logistic Regression62%
Gradient Boosting Classifier66%
Table 5. Accuracy of various ML models in a three-value thermal comfort scale.
ML ClassifierAccuracy
K-Neighbors Classifier78%
Decision Tree Classifier79%
Random Forest Classifier84%
Logistic Regression77%
Gradient Boosting Classifier81%
Publisher’s Note: MDPI stays neutral with regard to jurisdictional claims in published maps and institutional affiliations.

