Article

Low-Cost Thermohygrometers to Assess Thermal Comfort in the Built Environment: A Laboratory Evaluation of Their Measurement Performance

1
Construction Technologies Institute, National Research Council of Italy (ITC-CNR), 20098 San Giuliano Milanese, MI, Italy
2
Department of Architecture and Industrial Design, Università degli Studi della Campania “Luigi Vanvitelli”, 81031 Aversa, CE, Italy
3
Department of Civil and Environmental Engineering, Northwestern University, Evanston, IL 60208, USA
4
Department of the Built Environment, National University of Singapore (NUS), Singapore 119077, Singapore
*
Author to whom correspondence should be addressed.
Buildings 2022, 12(5), 579; https://doi.org/10.3390/buildings12050579
Submission received: 17 March 2022 / Revised: 22 April 2022 / Accepted: 26 April 2022 / Published: 29 April 2022
(This article belongs to the Special Issue Thermal Comfort in Built Environment)

Abstract

:
A thermohygrometer is an instrument that is able to measure relative humidity and air temperature, which are two of the fundamental parameters to estimate human thermal comfort. To date, the market offers small and low-cost solutions for this instrument, providing the opportunity to bring electronics closer to the end-user and contributing to the proliferation of a variety of applications and open-source projects. One of the most critical aspects of using low-cost instruments is their measurement reliability. This study aims to determine the measurement performance of seven low-cost thermohygrometers throughout a 10-fold repeatability test in a climatic chamber with air temperatures ranging from about −10 to +40 °C and relative humidity from approximately 0 to 90%. Compared with reference sensors, their measurements show good linear behavior with some exceptions. A sub-dataset of the data collected is then used to calculate two of the most used indoor (PMV) and outdoor (UTCI) comfort indexes to define discrepancies between the indexes calculated with the data from the reference sensors and the low-cost sensors. The results suggest that although six of the seven low-cost sensors have accuracy that meets the requirements of ISO 7726, in some cases, they do not provide acceptable comfort indicators if the values are taken as they are. The linear regression analysis suggests that it is possible to correct the output to reduce the difference between reference and low-cost sensors, enabling the use of low-cost sensors to assess indoor thermal comfort in terms of PMV and outdoor thermal stress in UTCI and encouraging a more conscious use for environmental and human-centric research.

1. Introduction

Temperature and relative humidity are two of the most important parameters in physics. Since the introduction of the first thermometer to measure air temperature and hygrometer to measure humidity in the seventeenth [1] and sixteenth centuries [2], respectively, they have been used for research purposes in various fields. To date, thermohygrometers, devices equipped with both a thermometer and a hygrometer, are used not only for research purposes but also as the core of projects developed by non-experts. In this context, the users are more and more close to electronics in a simple and fast way due to the proliferation of several shared projects where they are the end-users and the developers of both hardware and software [3].
The Do-It-Yourself (DIY) paradigm is increasing, and the reason for which people make things themselves is well explained in [4], where the authors also present a holistic view of how DIY creations are often based on the Internet of Things (IoT) paradigm, a web of things that are always connected to a communication-enabled network [5]. In [4], the close connection between DIY and IoT is clear. In addition, the increasing number of shared projects in online community platforms (e.g., OpenMaterials, Instructables, Make Magazine, Thingiverse) demonstrates how it is easy to share and talk about DIY projects and IoT applications. People can easily create and show their “smart things” on such platforms, protecting their knowledge and creativity using Creative Commons licenses [4]. The open-source approach has a profound impact on modern technology development and our society as a whole [5,6,7]. DIY and IoT gradually increase, becoming the third wave of the information industry revolution, after computers and the Internet [8]. In addition, with the increasing number of smart things, we are gradually entering the era of intelligent IoT [8,9], where the usual huge amount of data acquired by “smart things” is used to train machine learning algorithms or, more generally, to develop AI applications. The synergy between IoT and AI is discussed in [10], demonstrating a great success in complex and large-scale real-life applications.

1.1. Reliability of Temperature and Relative Humidity Low-Cost Sensors

The reliability of low-cost sensors used to measure air temperature and relative humidity is an issue that has not yet been considered in the development and practical applications of low-cost sensors, especially when used for wearables applications for thermal comfort assessment in a human-centered perspective. According to a recent review on wearable devices for environmental monitoring [11], it is possible to see that in most of the cases where the thermal aspect is considered a key issue (e.g., [12,13,14,15,16]), no information is provided on how the data obtained with the developed solutions were compared with reference sensors. Only in one case [17] a data comparison of the developed solutions with reference sensors was carried out, which did not yield outstanding results (see Figures 7 and 8 in [17]).
The reliability of low-cost sensors was investigated in [18,19]. In the first case, machine learning techniques were used to demonstrate that the reliability of low-cost sensors could be improved. The second study investigated the reliability and economic feasibility of a remote sensing system for measuring temperature and relative humidity. Based on these premises and considering other studies from different fields of building science [20,21], in which the data from low-cost sensors are compared with those from professional sensors, we describe a method by which the performance of seven low-cost thermohygrometers was compared with that of professional sensors. This method can be applied wherever the development of low-cost systems for measuring air temperature and relative humidity is an important issue.

1.2. Thermal Comfort in a Human-Centered Perspective

The measurement of relative humidity and air temperature is an important issue that is applied to thermal comfort assessment, which is an issue already considered relevant in recent studies [22]. The main research is directed to reducing a building’s energy consumption while increasing occupant satisfaction and productivity [23]. Over the years, various aspects of the problem have been analyzed, and several solutions have been proposed. A recent study shows how IoT approaches are applied to physical environments to improve user satisfaction [24]. Another study described in [25,26] reports the results of an application in real working conditions of a framework for the assessment of thermal comfort as perceived by users. The framework considers psychophysical conditions, user’s feedback and environmental data collected by an IoT-based solution. It also enables the analysis of all data using parametric models and Machine Learning (ML) techniques. In this way, it is possible to overcome the limitations of physically based models by considering several factors related to human sensation and the complex state of mind involved in thermal comfort perception [27]. Thermohygrometers are also combined with other sensors to assess the indoor thermal comfort of users affected by health diseases [28]. A comprehensive list of studies investigating thermal effects through wearables can be found in [11] and in Section 3 of [29], where the results of 46 dynamic thermal comfort experiments have been analyzed, reporting how cyclical changes in metabolic rate and thermal conditions can have a major impact on thermal perception.
In the outdoor built environment, thermohygrometers have been used to collect data from the pedestrian perspective using, for example, a bike helmet [13,30] a backpack [31], a smart band [18], or clips attached to workers’ shoes [14], to monitor urban microclimatic conditions, e.g., to study how different urban configurations and architectural design can affect the urban microclimate, or to understand the Urban Heat Island (UHI) effects on human thermal perception in the hottest seasons.
It can be seen from these studies that assessing human responses to indoor and outdoor environmental stimuli using a human-centered approach is becoming increasingly popular in the scientific community. The trend is due to three main reasons:
  • Each user has their perception when exposed to certain environmental stimuli;
  • Each user has their own behavioral, physiological, and psychological responses to environmental stimuli;
  • Each user has an environmental quality preference, which depends not only on the environmental stimuli but also on other external factors (e.g., gender, age, culture, expectations).
The use of thermohygrometers in a human-centered perspective still encounters some limitations. The main aspects being considered are power consumption and the influence of human breathing or sweating humidity, which could have a negative impact on the measurement of air temperature and relative humidity as well as on the general assessment of thermal comfort. The discussion section considers these aspects and defines some future directions for research in this area. Some other aspects not considered in this research but that are also of increasing interest due to the introduction of the EU’s General Data Protection Regulation (GDPR) [32] are privacy and data security concerns related to the use of human-centered environmental monitoring systems [33,34].

1.3. Thermal Comfort in a Multi-Domain Perspective

In addition, other factors are contributing to the increasing number of human-centered experiments in real settings (e.g., field studies or living labs). First is the possibility of measuring multiple simultaneous stimuli. The environment to which people are exposed presents multiple and interactive factors that make it even more challenging to understand the cause and effect between environmental exposures and human responses [24,26,27,35]. In multi-domain studies, it is challenging to conduct laboratory experiments due to time-consuming experimental design and expensive hardware [36]. In contrast, human-centered experiments conducted in fields or in living labs could offer the possibility to measure multiple and co-existing stimuli simultaneously. Second, there is the possibility of measuring the environment and human responses for an extended time. The consideration of cyclic changes in human metabolic rate and thermal perception when considering users in their daily real environment is gaining attention for thermal comfort assessment [29,37]. These changes in metabolic rate make it possible to understand the effect of core body temperature variations on thermal perception [29]. As a consequence, extended environmental and human response measurements would allow understanding the principle of thermal alliesthesia, which has been identified as the ability of a stimulus to be perceived as pleasant or unpleasant depending on the subject’s internal state [38]. Finally, the spatial context of a building where the user is immersed can be considered for improving the accuracy of the model used for occupants’ indoor thermal preferences prediction [38,39,40].
The multi-domain, high spatial and temporal resolution measurements of environmental stimuli can then feed human-centric and automated control measures to improve thermal comfort. As highlighted in [40,41], the need for such measurements requires the use of low-cost, IoT-based environmental sensors. In turn, their use can help establish educational, residential and commercial buildings as living laboratories for the integration of innovative sensing, data analytics and automated control methods [39].
In the age of ubiquitous and connected technologies, there is perhaps a largely overlooked opportunity to acquire and use responses in real-world settings where people reside and go about their daily lives without confining studies to a specific time and laboratory location. It could have a positive impact on thermal [42] and indoor air quality [43] research.
In this context, it is evident that there is a need to consider accurate and low-cost solutions for monitoring environmental variables that can be used as an alternative to expensive hardware to understand how environmental variables, such as the air temperature and relative humidity, could have a dominant influence on the changes in comfort perception of different categories of users during their daily lives. The goal of this paper is to help the development of such environmental monitoring solutions throughout the evaluation of the performance of commercial low-cost thermohygrometers. To this end, we have developed a system capable of recording data from seven thermohygrometers and defined a procedure to evaluate their performance compared to a reference device in a controlled environment. The ultimate goal is to evaluate the overall performance of the low-cost sensors and the difference of indexes for the evaluation of indoor (PMV) and outdoor thermal comfort (UTCI) calculated with low-cost and reference sensors.

2. Materials and Methods

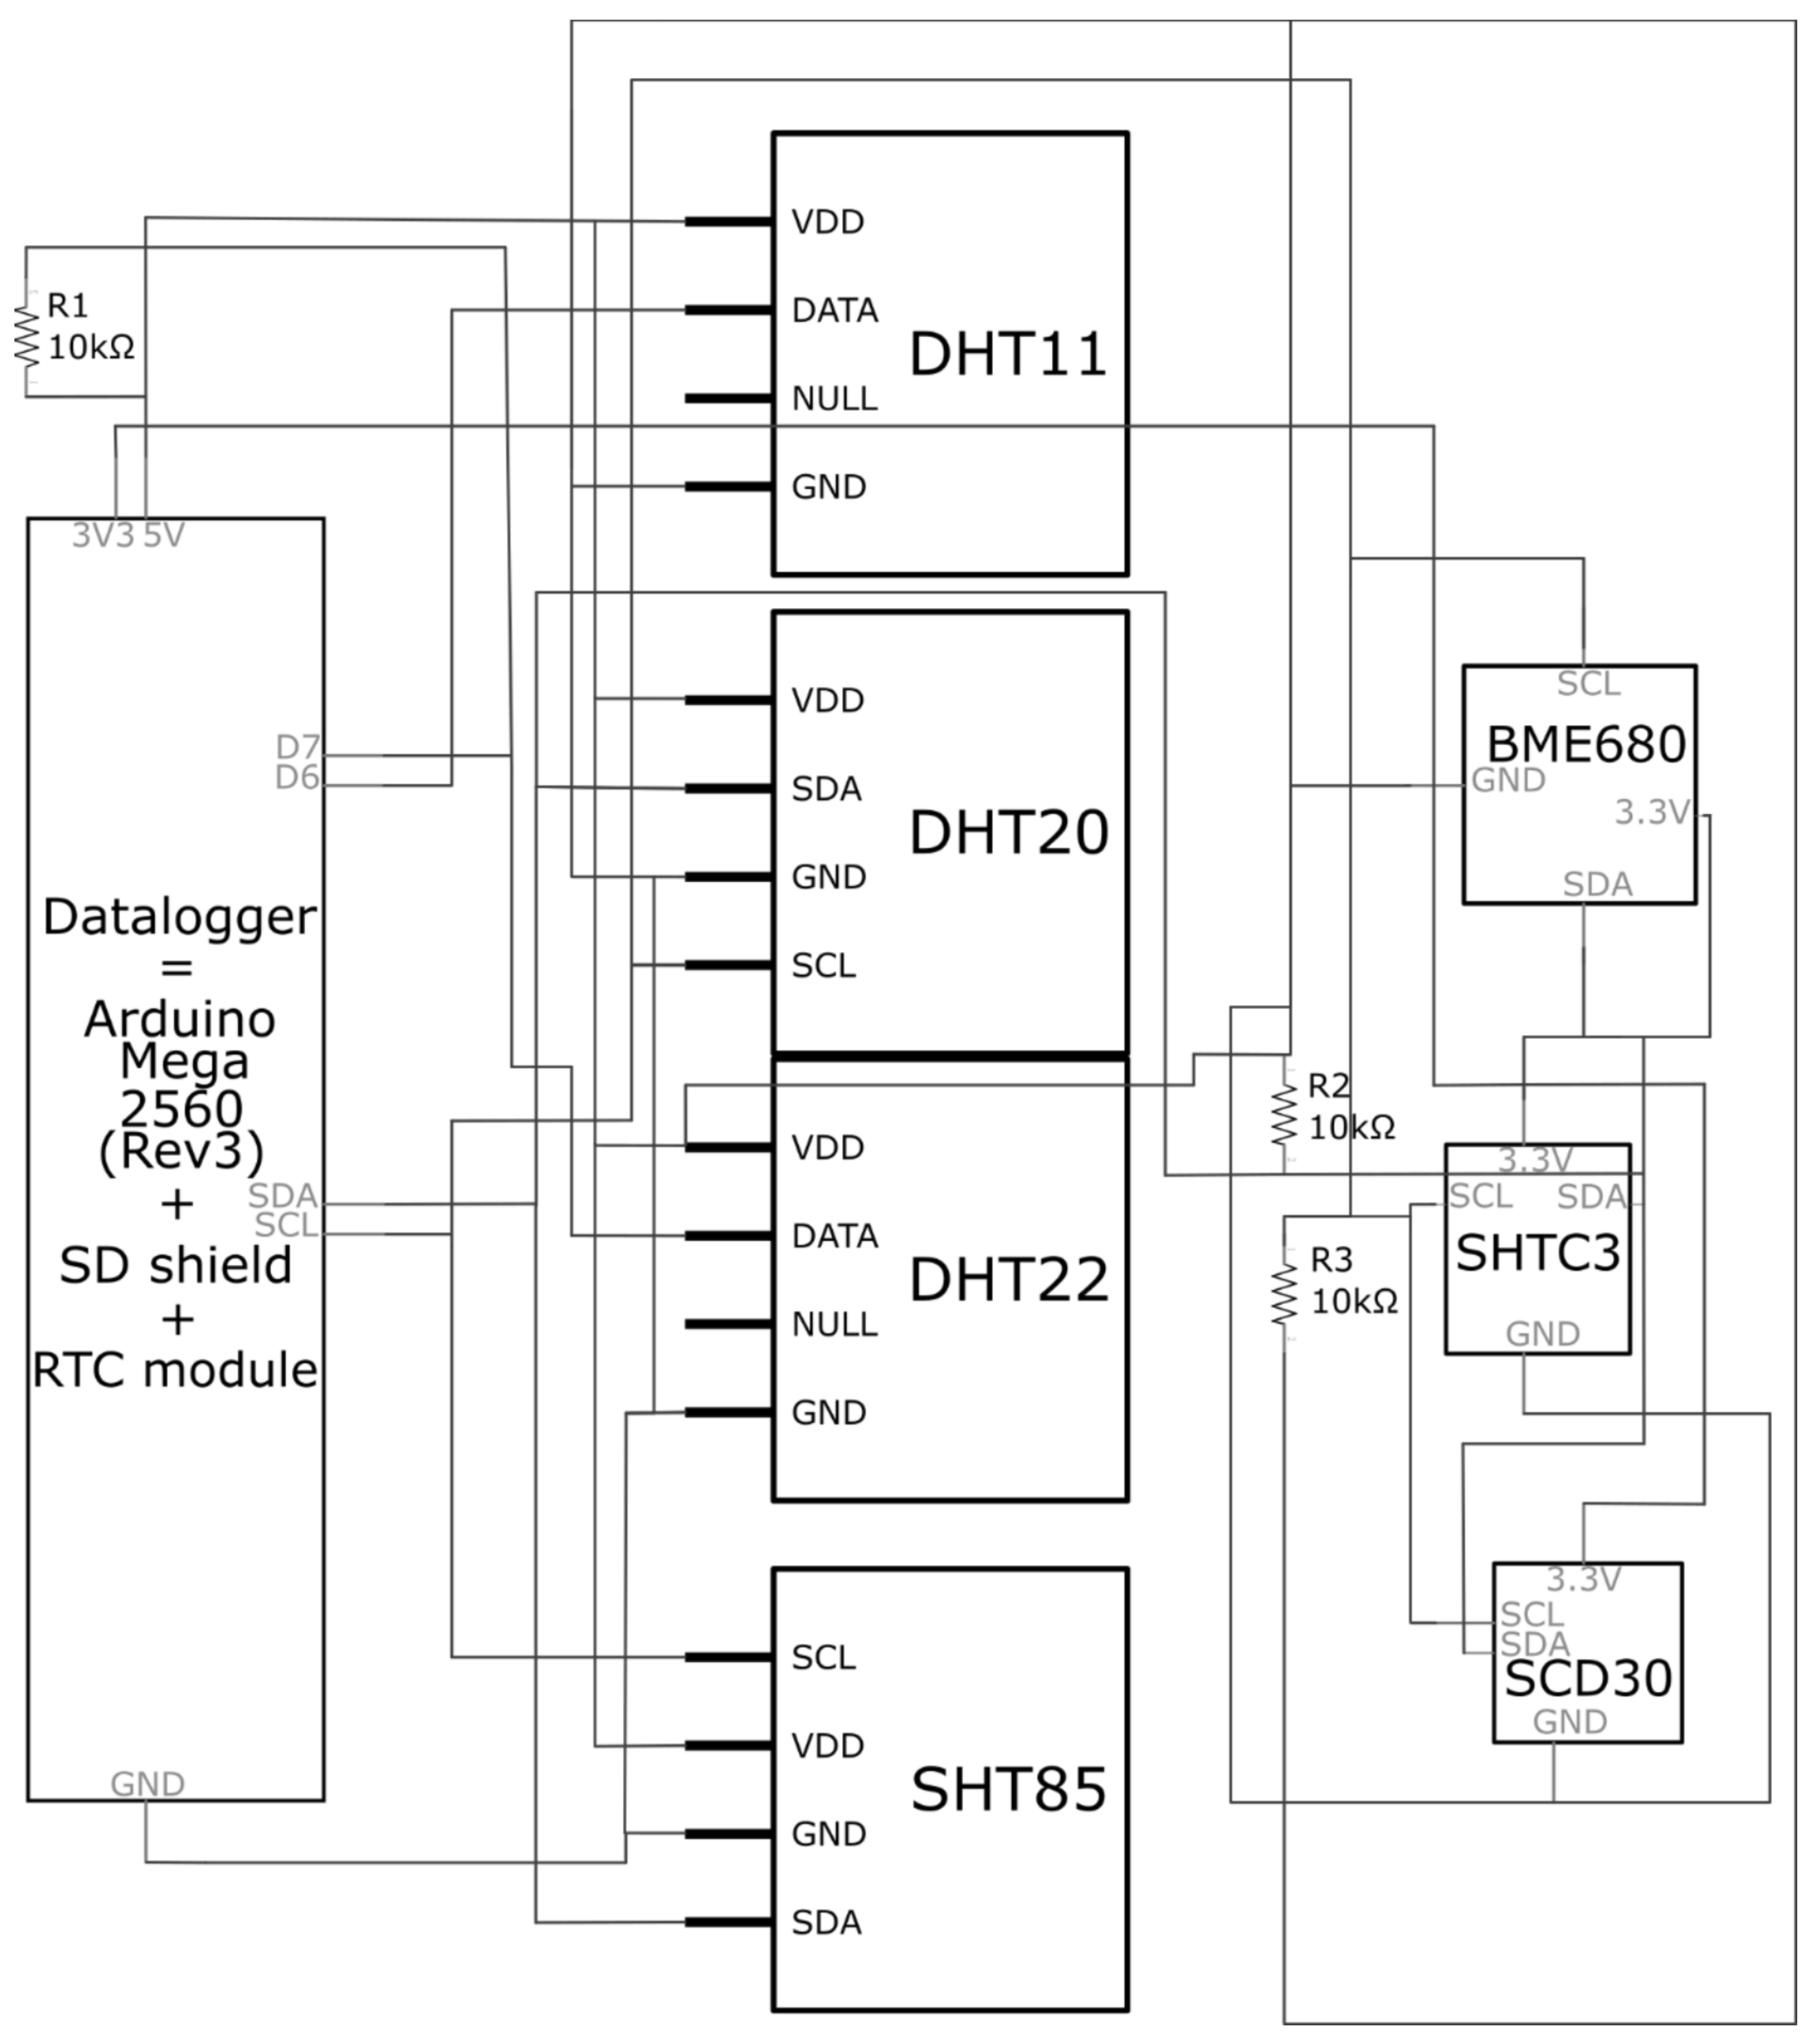
2.1. Hardware and Software Configuration

The low-cost hardware (Figure 1) consists of the following main components:
  • Arduino Mega 2560 Rev3;
  • Arduino Wireless SD shield;
  • RTC module based on DS1307 chip;
  • DHT22 air temperature and relative humidity sensor;
  • DHT11 air temperature and relative humidity sensor;
  • DHT20 air temperature and relative humidity sensor;
  • SHT85 air temperature and relative humidity sensor;
  • SHTC3 air temperature and relative humidity sensor;
  • SCD30 sensor for CO2 concentration, air temperature and relative humidity;
  • BME680 sensor for pressure, air temperature and relative humidity.
The Arduino MEGA PCB is based on the ATmega2560 microcontroller. The board has 54 inputs/outputs (14 of which can be used as Pulse-Width Modulation—PWM outputs), 16 analogue inputs, 4 Universal Asynchronous Receiver-Transmitter (UART), a 16 MHz quartz, a USB connection, a power supply socket, an In-Circuit Serial Programming (ICSP) port and a reset button [44].
The Wireless SD shield allows data to be stored on the Micro SD card located in the on-board slot. It also enables wireless communication [45]. The Real-Time Clock (RTC) module was developed based on the DS1307 Integrated Circuit (IC) from Maxim. The DS1307 IC is a low consumption Binary-Coded Decimal (BCD) clock with 56 bytes of RAM, which is powered by a buffer battery. Addresses and data are transmitted serially via the bidirectional I2C bus. The clock/calendar provides information about seconds, minutes, hour, day, month and year. The end of the month is automatically adjusted for months with less than 31 days, including correction for leap years. The clock can operate in 24 h and 12 h format with AM/PM display. The DS1307 has a built-in power sensor that detects a power failure and automatically activates the power supply via the backup battery [46].
Table 1 reports the technical characteristics of all sensors used in the research.
Except for the DHT11, all sensors were chosen as they have a similar measuring range and accuracy for air temperature and relative humidity. In particular, for air temperature, the accuracy and measurement range corresponds to the standard ISO 7726 (measurement range 10 ÷ 40 °C, accuracy at least ±0.5 °C), while the standard for air humidity specifies the measurement range 0.5 ÷ 3 kPa (water vapor partial pressure) with an accuracy of ±0.15 kPa. In terms of relative humidity, this accuracy can be calculated considering a temperature value of 20 and 35 °C and a standard value for pressure (1013.25 hPa) and is ±6% and ±3%, respectively, which is in line with the values of the sensors considered. It may not be entirely clear to the reader why a DHT11 sensor with low accuracy and reduced measurement range of Ta (Table 1) was compared with the other sensors. This sensor was considered mainly because of its popularity with researchers (Figure 2), considering two sources: Google Scholar and Scopus. In the first case, the commercial name of the device was linked to the word “sensor” to avoid misunderstandings in the search (e.g., DHT22 sensor), which was limited to the article type. In the second case, a simple query was used, searching the commercial name of the device under the title, abstract and keywords in combination with “AND sensor” (e.g., TITLE-ABS-KEY (DHT22 AND sensor)). Scopus allows also us to verify how the DHT11 sensor is very popular among researchers, and it is active mainly in the research areas of computer science and engineering.
For the proper use of these sensors, some libraries were used to facilitate the definition of scripts, in particular, the Wire library to consider all the components based on an I2C communication protocol [56]; the SD library [57] to implement the data logging function; the RTC library [58] to control date and time; and the DHT libraries to control the DHT11 and DHT22 [59], DHT20 [60], SHT85 [61], SHTC3 [62], SCD30 [63] and BME680 [64] sensors.
The low-cost hardware was installed in a cardboard box and wired to the Arduino Mega 2560 rev3 and the RTC module. Four reference sensors were installed around the low-cost sensors.
In order to evaluate the behavior of the sensors as they are positioned on the surface of the cardboard box and to detect any systematic instrumental errors under real working conditions, e.g., due to local temperature increases [65], an analysis was carried out using a portable infrared camera (Figure 3), the Fluke Ti410 Pro, whose optical system is sensitive to infrared radiation with a wavelength in the range of 7.5–14 μm. This range is where materials commonly used in electronics radiate energy and thus exhibit their thermal behavior. The analysis was carried out after 1 h of operation in an environment where the air temperature was set at 19 °C.
In all sensors, the area of interest is characterized by the presence of sensitive elements. In 6 out of 7 sensors, there is no real problem of overheating. In the case of SCD30, which is used to monitor CO2 concentration and Ta/RH, overheating occurs with an average temperature about 2 °C higher than that of the other sensors and those of the surrounding areas. It is likely that the air temperature data monitored by this instrument are influenced by a bias. It is possible to check that this local overheating does not spread to the sensitive area of the other sensors.
The system was set up in a GENVIRO-030 climatic chamber (Figure 4), which allows controlling the temperature and relative humidity in the ranges −40 to 180 °C and 10 to 98%, respectively, over the internal volume of 30 L. The temperature profile used for the test, which lasted about 6 days, is between −10 and 40 °C. The relative humidity is between 0 and 90%. The ranges of air temperature and relative humidity are consistent with most of the studies described in [66], where an overview of controlled experiments and facilities (test rooms) is provided to study human comfort in buildings. In this way, it is possible to compare, in a controlled environment, the environmental data collected by low-cost sensors with those of a reference device. For this purpose, four thermo-hygrometric sensors of the same type were used as reference devices, forming a guard ring. When the air temperature and relative humidity monitored by these four sensors were almost the same, we considered that the small volume containing the low-cost sensors could guarantee the same environmental conditions so that an inhomogeneous distribution of air temperature and relative humidity within the chamber can be ruled out [67].
Each reference sensor consists of an RTD air temperature sensor 1/3DIN Pt100 connected to a four-wire line and a relative humidity sensor consisting of a thin film that changes its capacitance linearly with relative humidity.

2.2. Data Processing and Analysis

To understand the performance of thermohygrometer sensors, two parameters are considered. The first is the coefficient of determination, which is known as R2 [68]. It ranges from 0 to 1, with higher values indicating a good relationship between the two sensors. The second is the Root Mean Square Error (RMSE), which is used to evaluate the error between the sensors [69]. It always takes non-negative values, with lower RMSE values indicating a better fit to the data.
All data are collected at a sampling rate of 10 s, and the average value of 1 min is recorded on a storage medium. The entire measurement period covered just under 6 days. The data from the low-cost sensors and the reference sensors are merged into a single database. For the analysis described in Section 3, a Python script was used, with Seaborn [70] and Matplotlib [71] for visualization, SciPy [72], which is usually used in combination with Numpy [73], a package used in this case to calculate the coefficient of determination R2 [74] and the Scikit-learn metric to calculate the RMSE [69]. Pandas [75] was used to enable the provision data structure, while Pythermalcomfort [76,77] was used to calculate PMV [78,79] and UTCI [80], which are two of the most used indices to determine the indoor and outdoor Thermal Comfort (TC), respectively. The first index is used to determine TC in indoor spaces equipped with HVAC systems or naturally ventilated and depends on the values of air temperature and relative humidity, among other subjective and objective variables [25]. The second index depends on air temperature, relative humidity and other environmental variables and predefined subjective parameters and is a thermal index defined in the framework of the COST—action 730 for evaluating outdoor thermal stress, which is based on the multi-node thermoregulation model ‘Fiala’ [80,81].
To understand the effects of air temperature and relative humidity monitored by the different devices considered, two scenarios were defined:
  • Scenario 1: air-conditioned indoor spaces in winter and PMV calculation;
  • Scenario 2: outdoor climate in summer and UTCI calculation.

3. Results

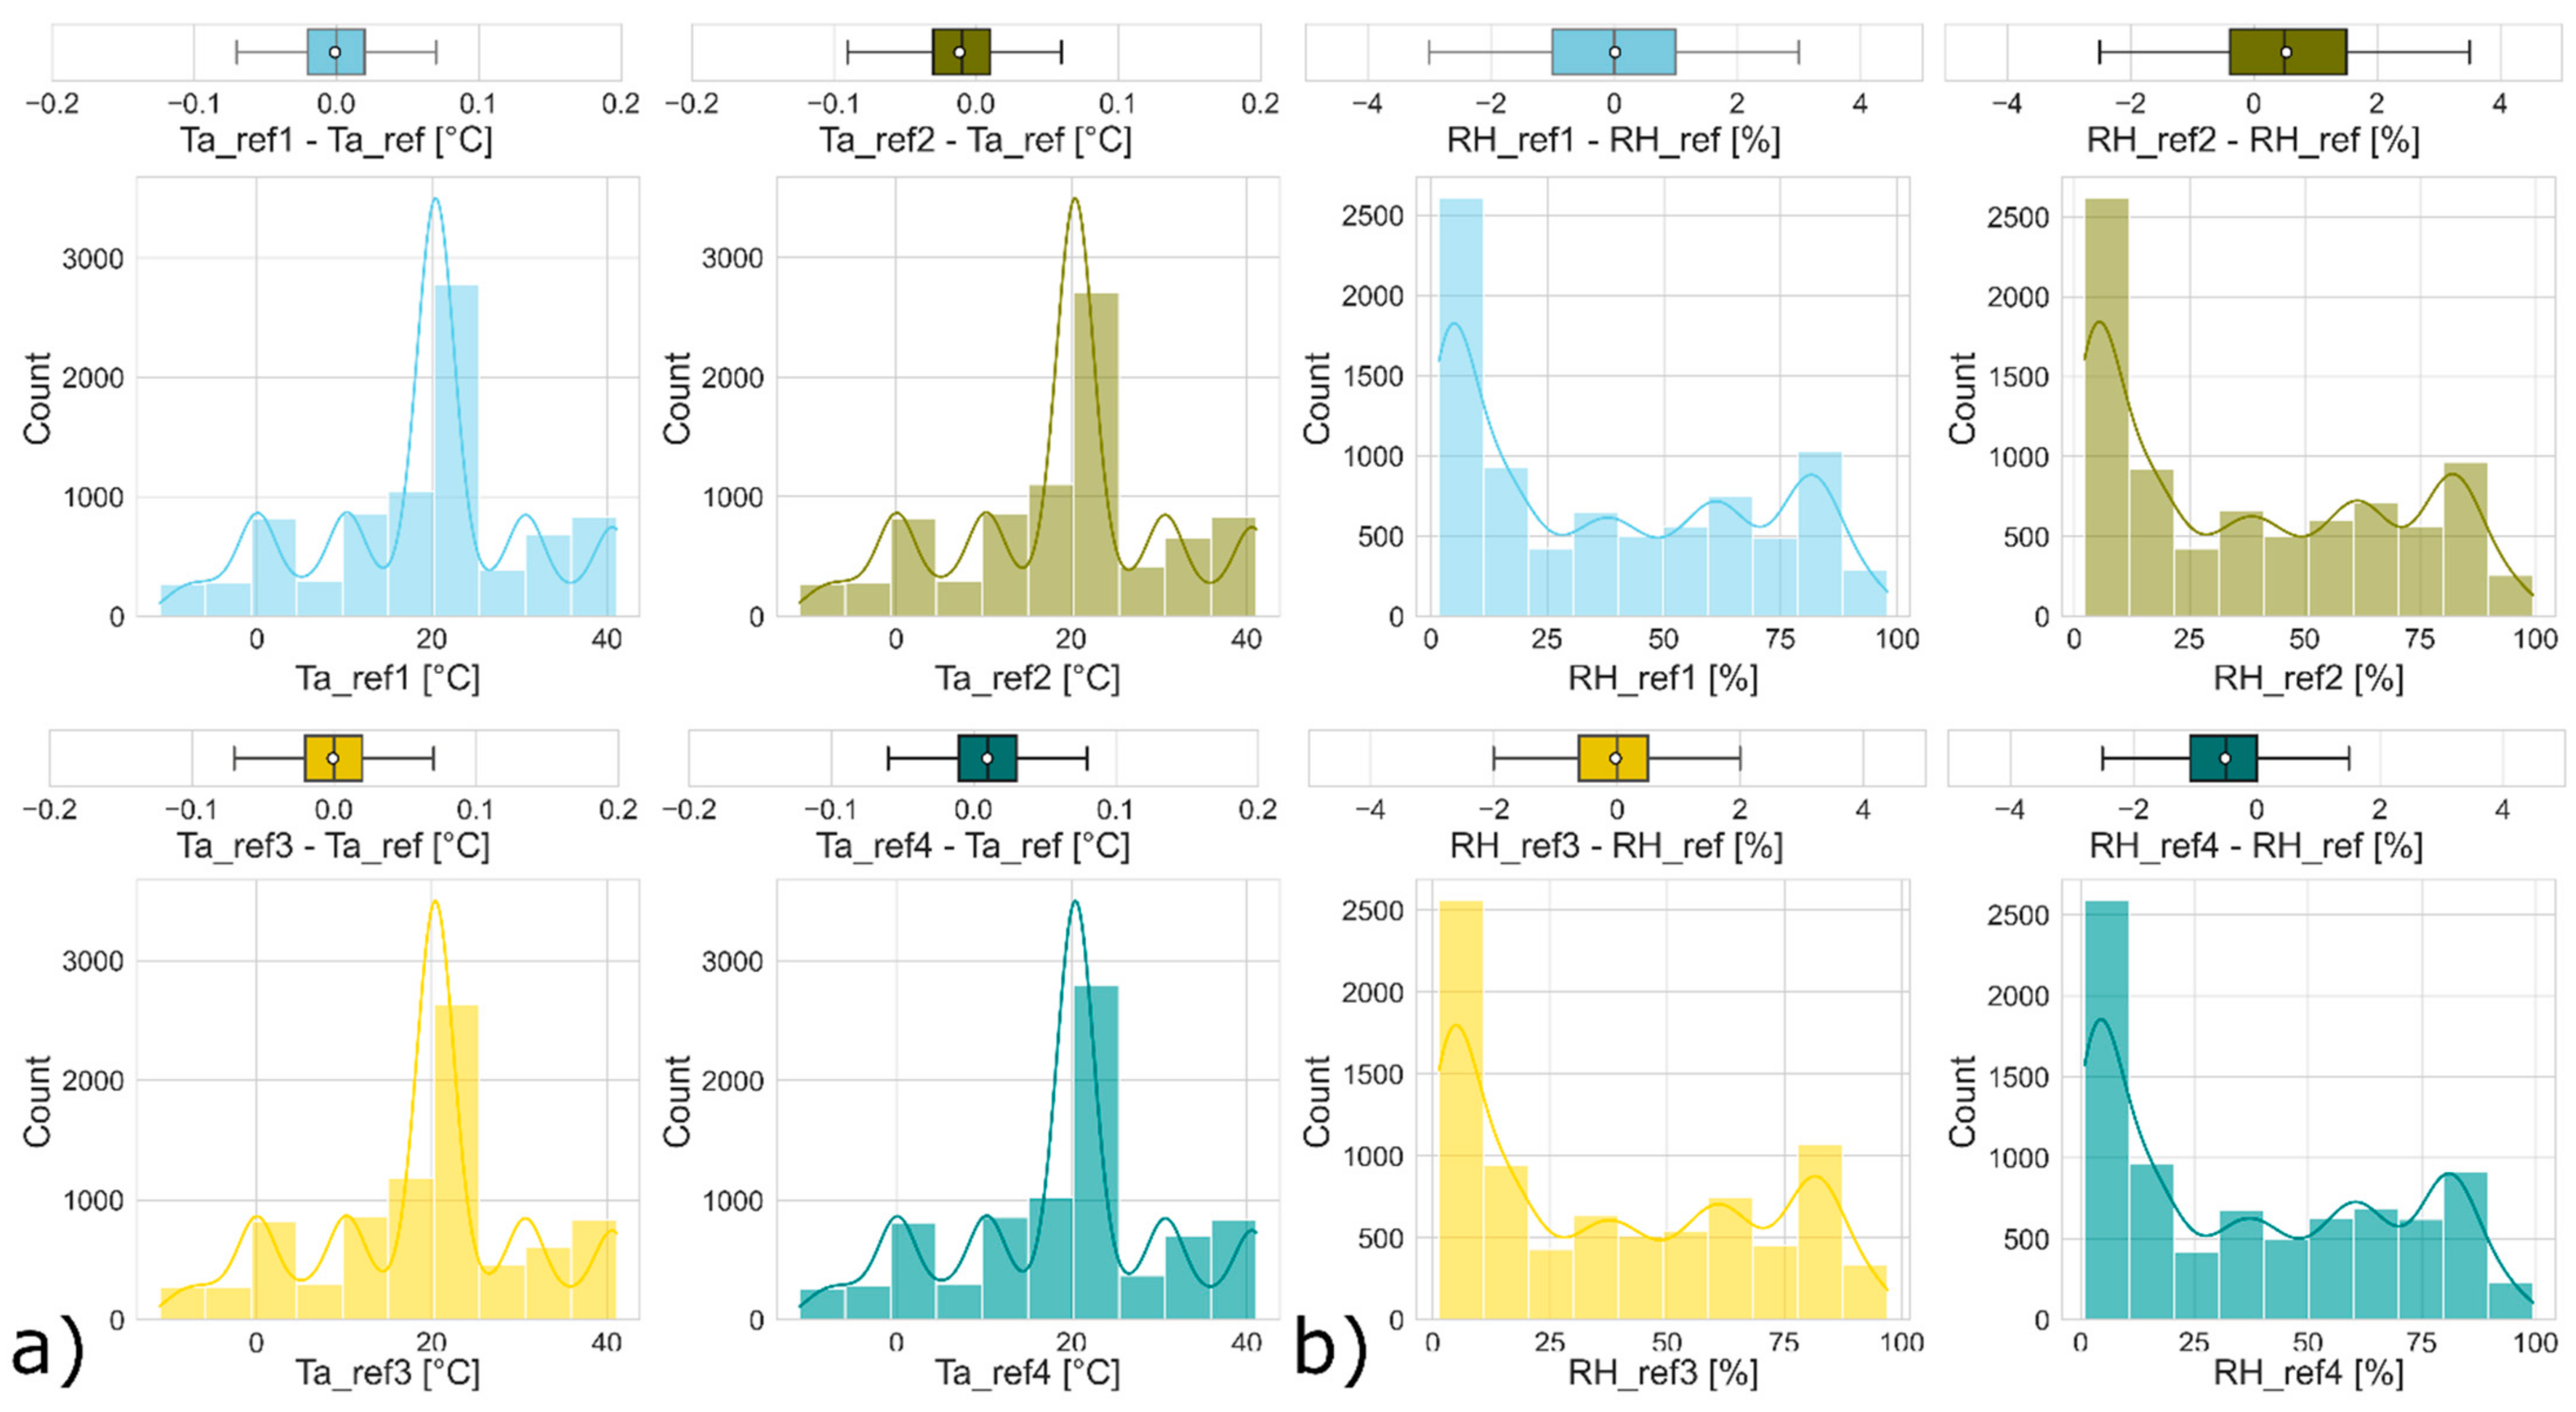
3.1. Air Temperature and Relative Humidity of the Four Reference Sensors

The results show that the relative humidity (RH) and the air temperature (Ta) in the volume where the low-cost sensors are installed are almost constant by looking at the values monitored by the four reference sensors. Figure 5 shows the boxplot of the absolute difference between the value measured by each of the four sensors and the average reference value as well as the histplot of Ta and RH recorded with the reference sensors.
From Figure 5, it is possible to verify that the values of Ta and RH measured by the four reference sensors are almost the same. For this reason, in the next sections, we refer to the average value of air temperature (Ta_ref) and the average of relative humidity (RH_ref), which were determined from the monitoring data of the four reference instruments, as a reference.

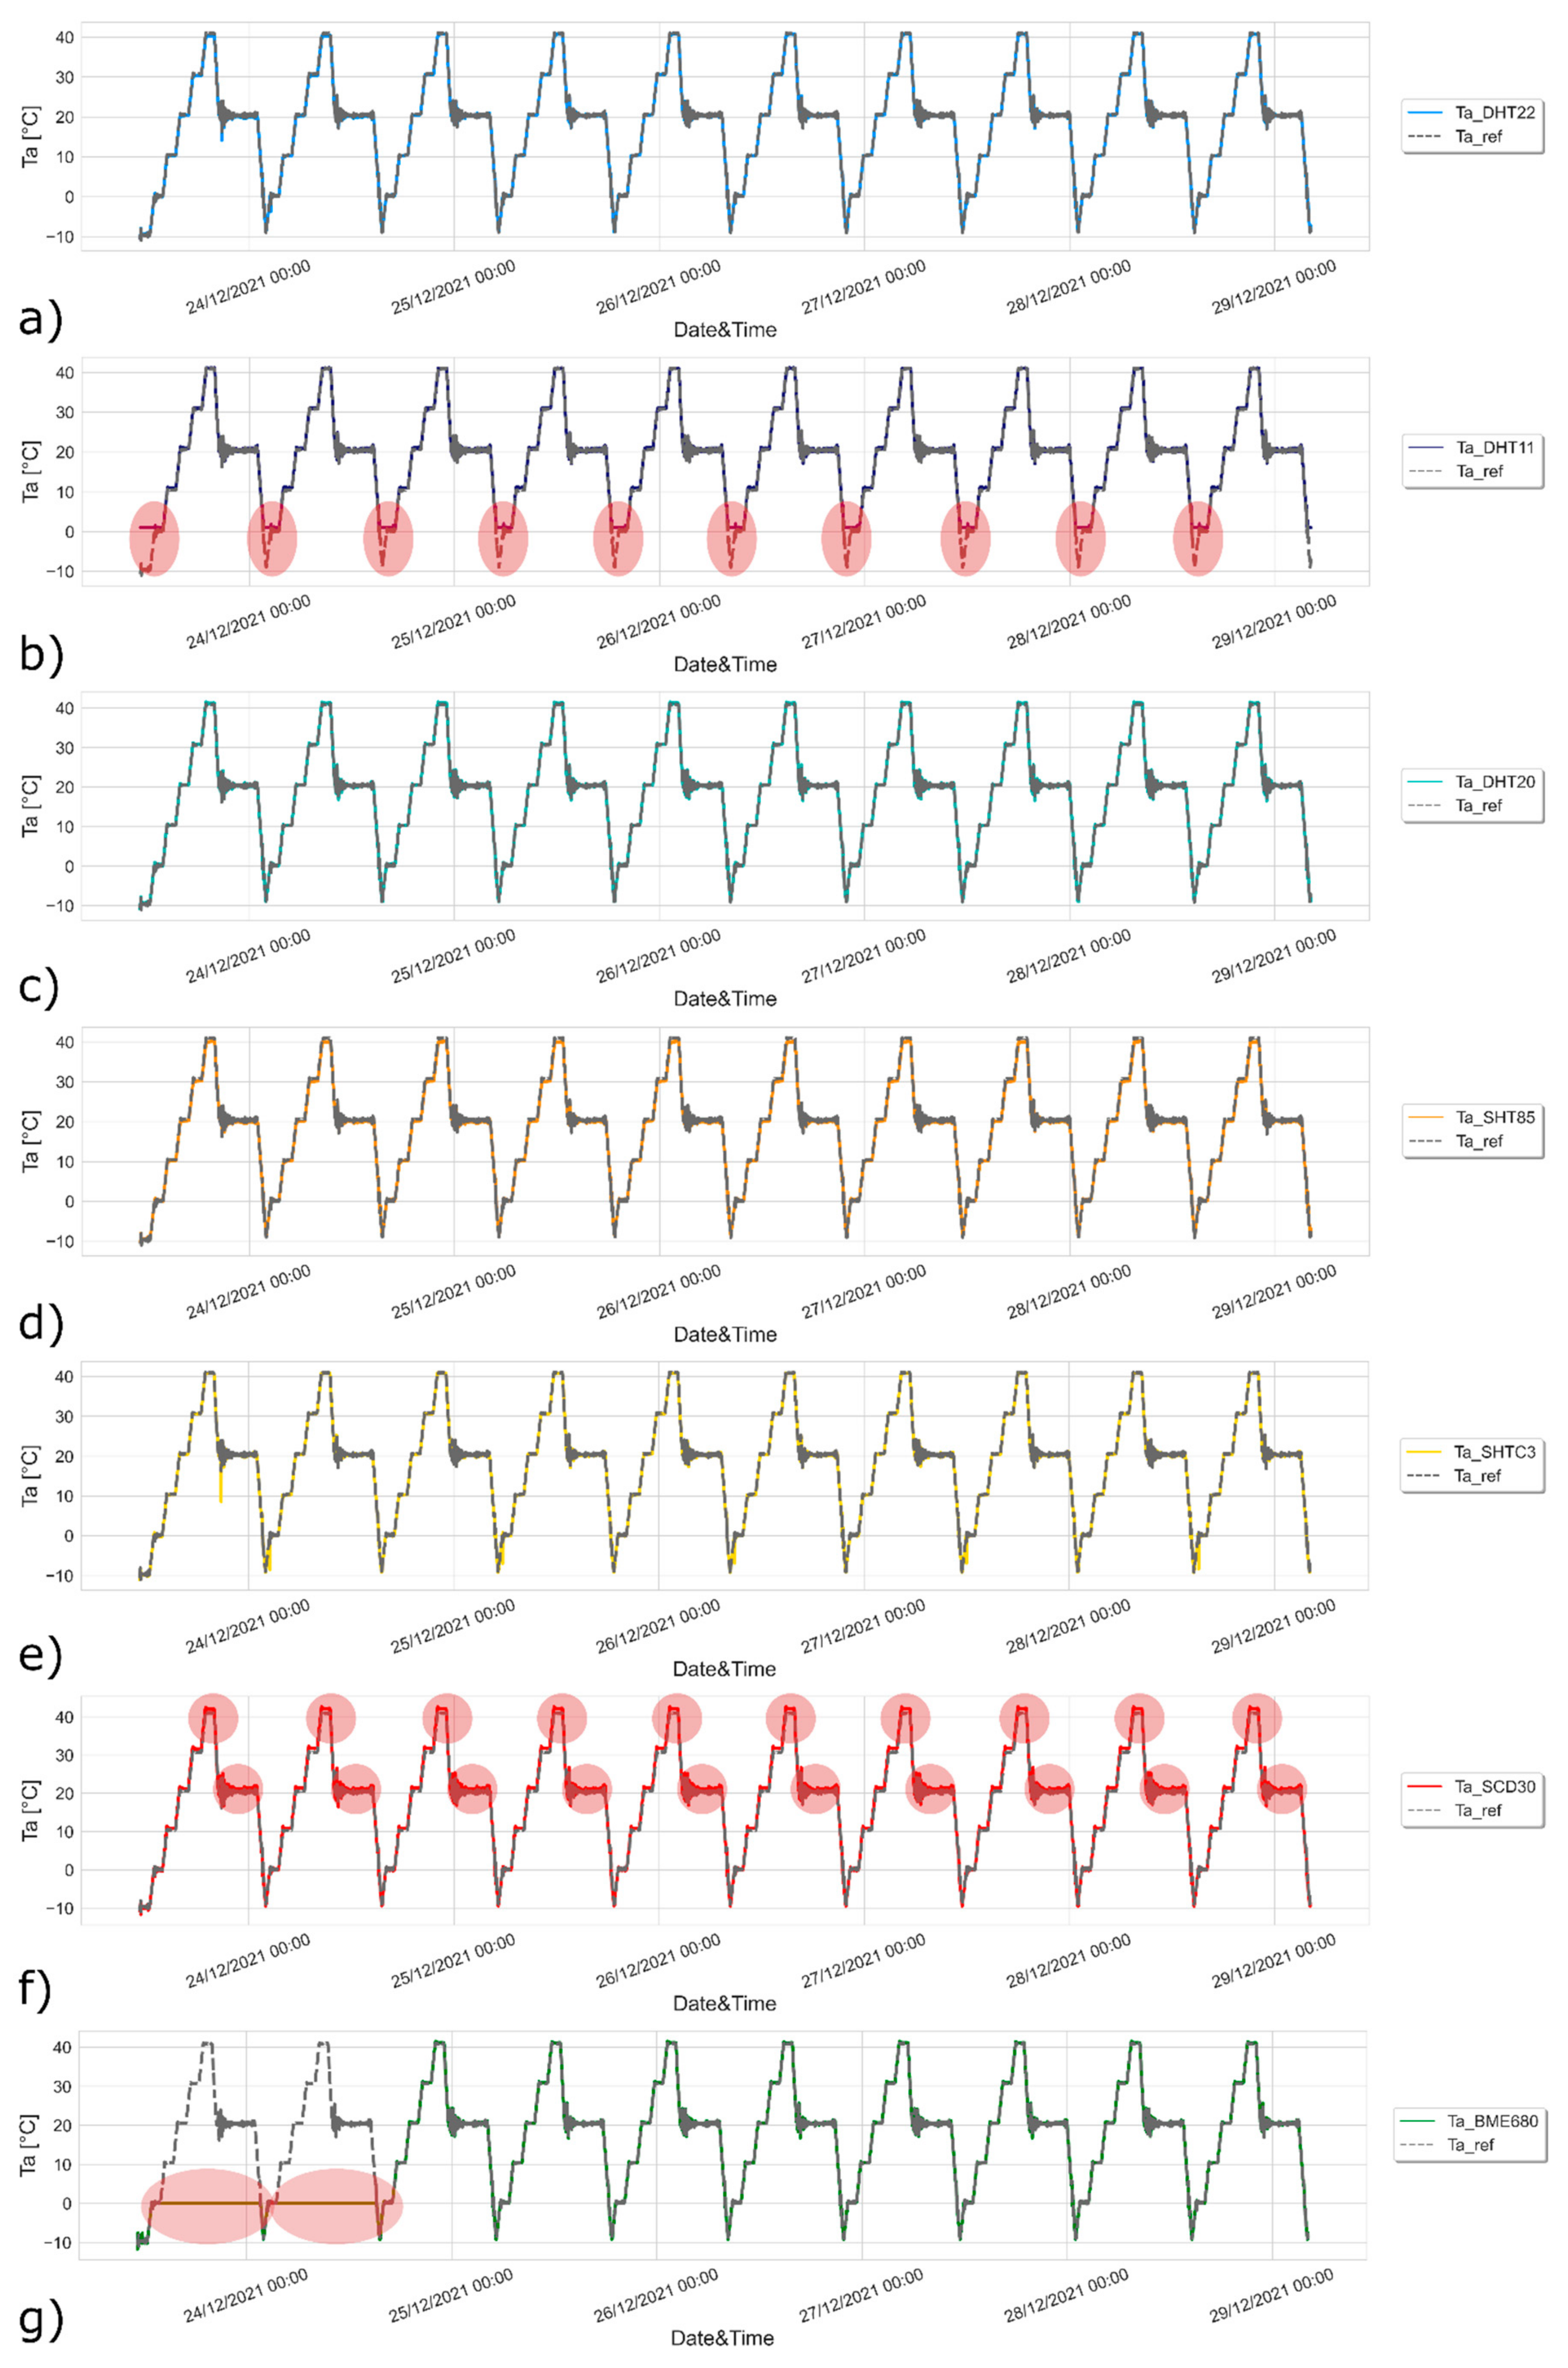
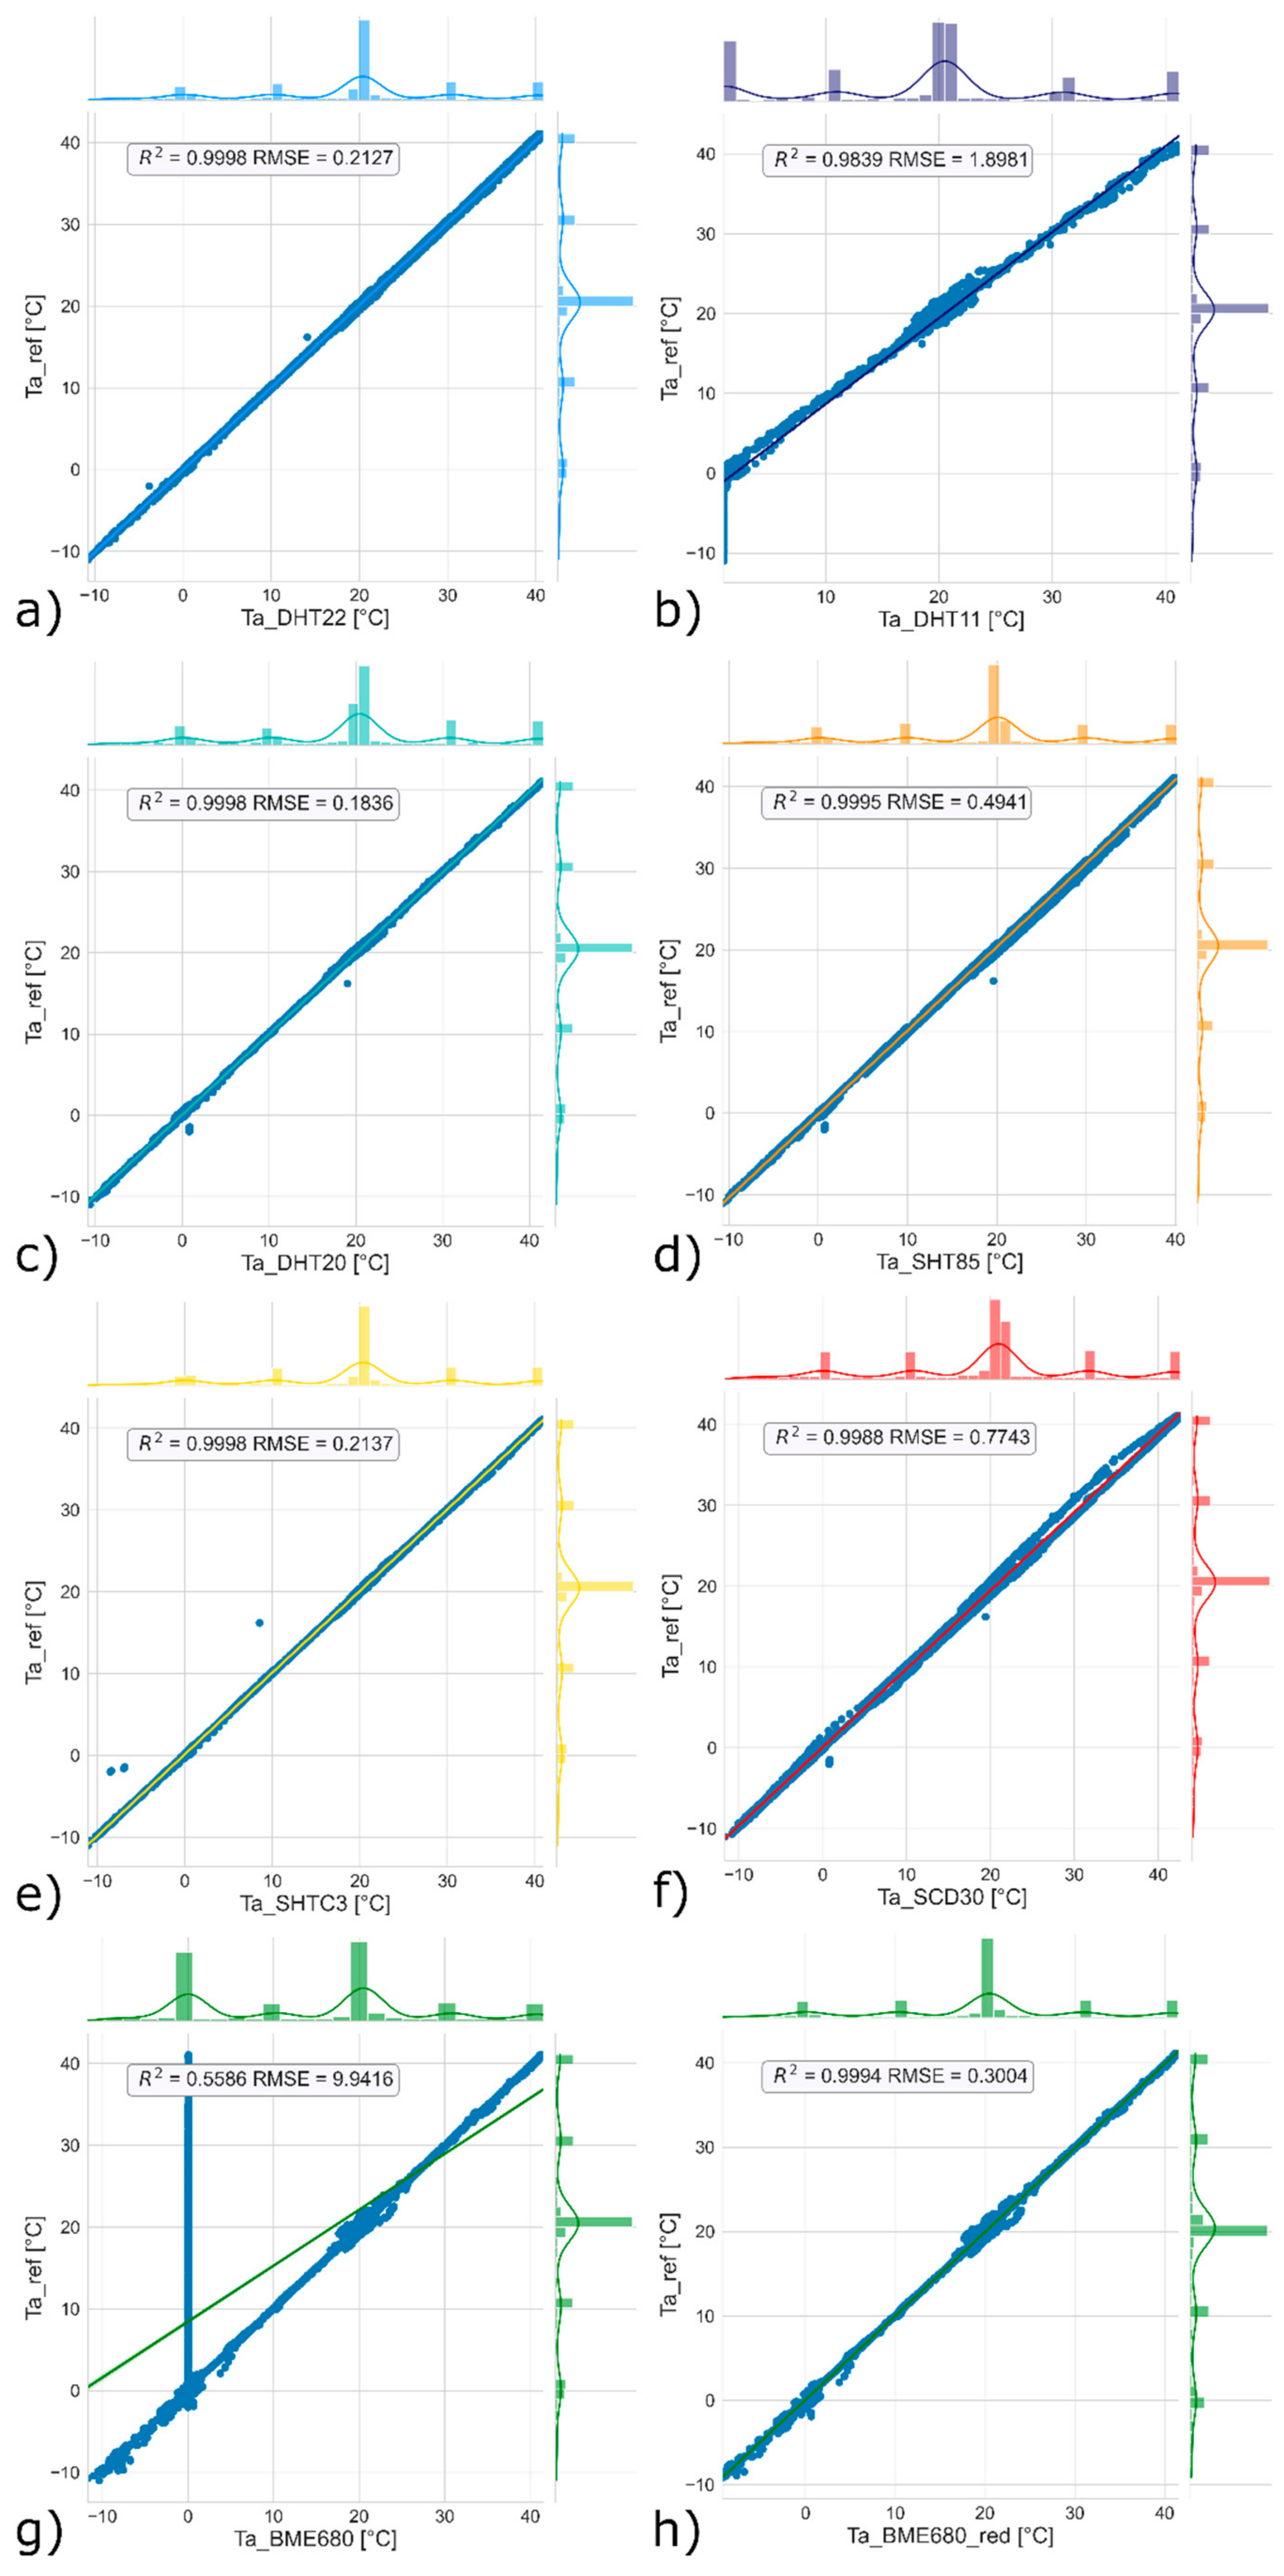
3.2. Results of Test Lab of Air Temperature from Low-Cost Sensors

Figure 6 shows the profiles of Ta_ref and that provided by the low-cost thermohygrometers. We chose to show the pairwise profiles of the reference sensor with each of the low-cost sensors to avoid not understanding the behavior of each sensor due to the overlap of the lines, which would inevitably reduce the ability to read the graphs.
The sensors were exposed to temperatures between −10 and 40 °C. The air temperature profiles of all low-cost sensors match those of Ta_ref, except for Figure 6b, where the DHT11 could not record the negative values of air temperature. In the first cycle of Figure 6e, the SHTC3 sensor records an anomaly. The same is true for the first two cycles of the BME680 sensor in Figure 6g. We do not understand the reason for this anomaly, but for a better understanding of the overall behavior of the BME680, we decided to exclude the first two cycles when determining the correlation between the reference instrument and this sensor (BME680_red). As expected in the analysis of IR, the SCD30 sensor records higher air temperature data than the reference values. Other than these anomalies, all sensors appear to follow the reference profile correctly without recording any deviation, even at the end of the tenth cycle.
Figure 7 shows the pairwise comparison of air temperature between the reference and the values recorded by the low-cost sensors.
The low-cost sensors were compared using the methods described previously in Section 2.2. The results show a good linear relationship between the low-cost sensors and the reference value, except in Figure 7g, where the low R2 values and high RMSE are due to the anomalies in the first two cycles (Figure 6g). The statistics in Figure 7, expressed as R2 and RMSE, show that DHT20 (Figure 7e) achieves the best results (R2 = 0.9999, RMSE = 0.1836) and slightly outperforms DHT22 (R2 = 0.9999, RMSE = 0.2127), SHTC3 (R2 = 0.9998, RMSE = 0.2137), BME680_red (R2 = 0.9994, RMSE = 0.3004), SHT85 (R2 = 0.9995, RMSE = 0.4941), and SCD30 (R2 = 0.9988, RMSE = 0.7743). The DHT11 recorded the worst results with the lowest R2 (0.9839) and the highest RMSE (1.8981).

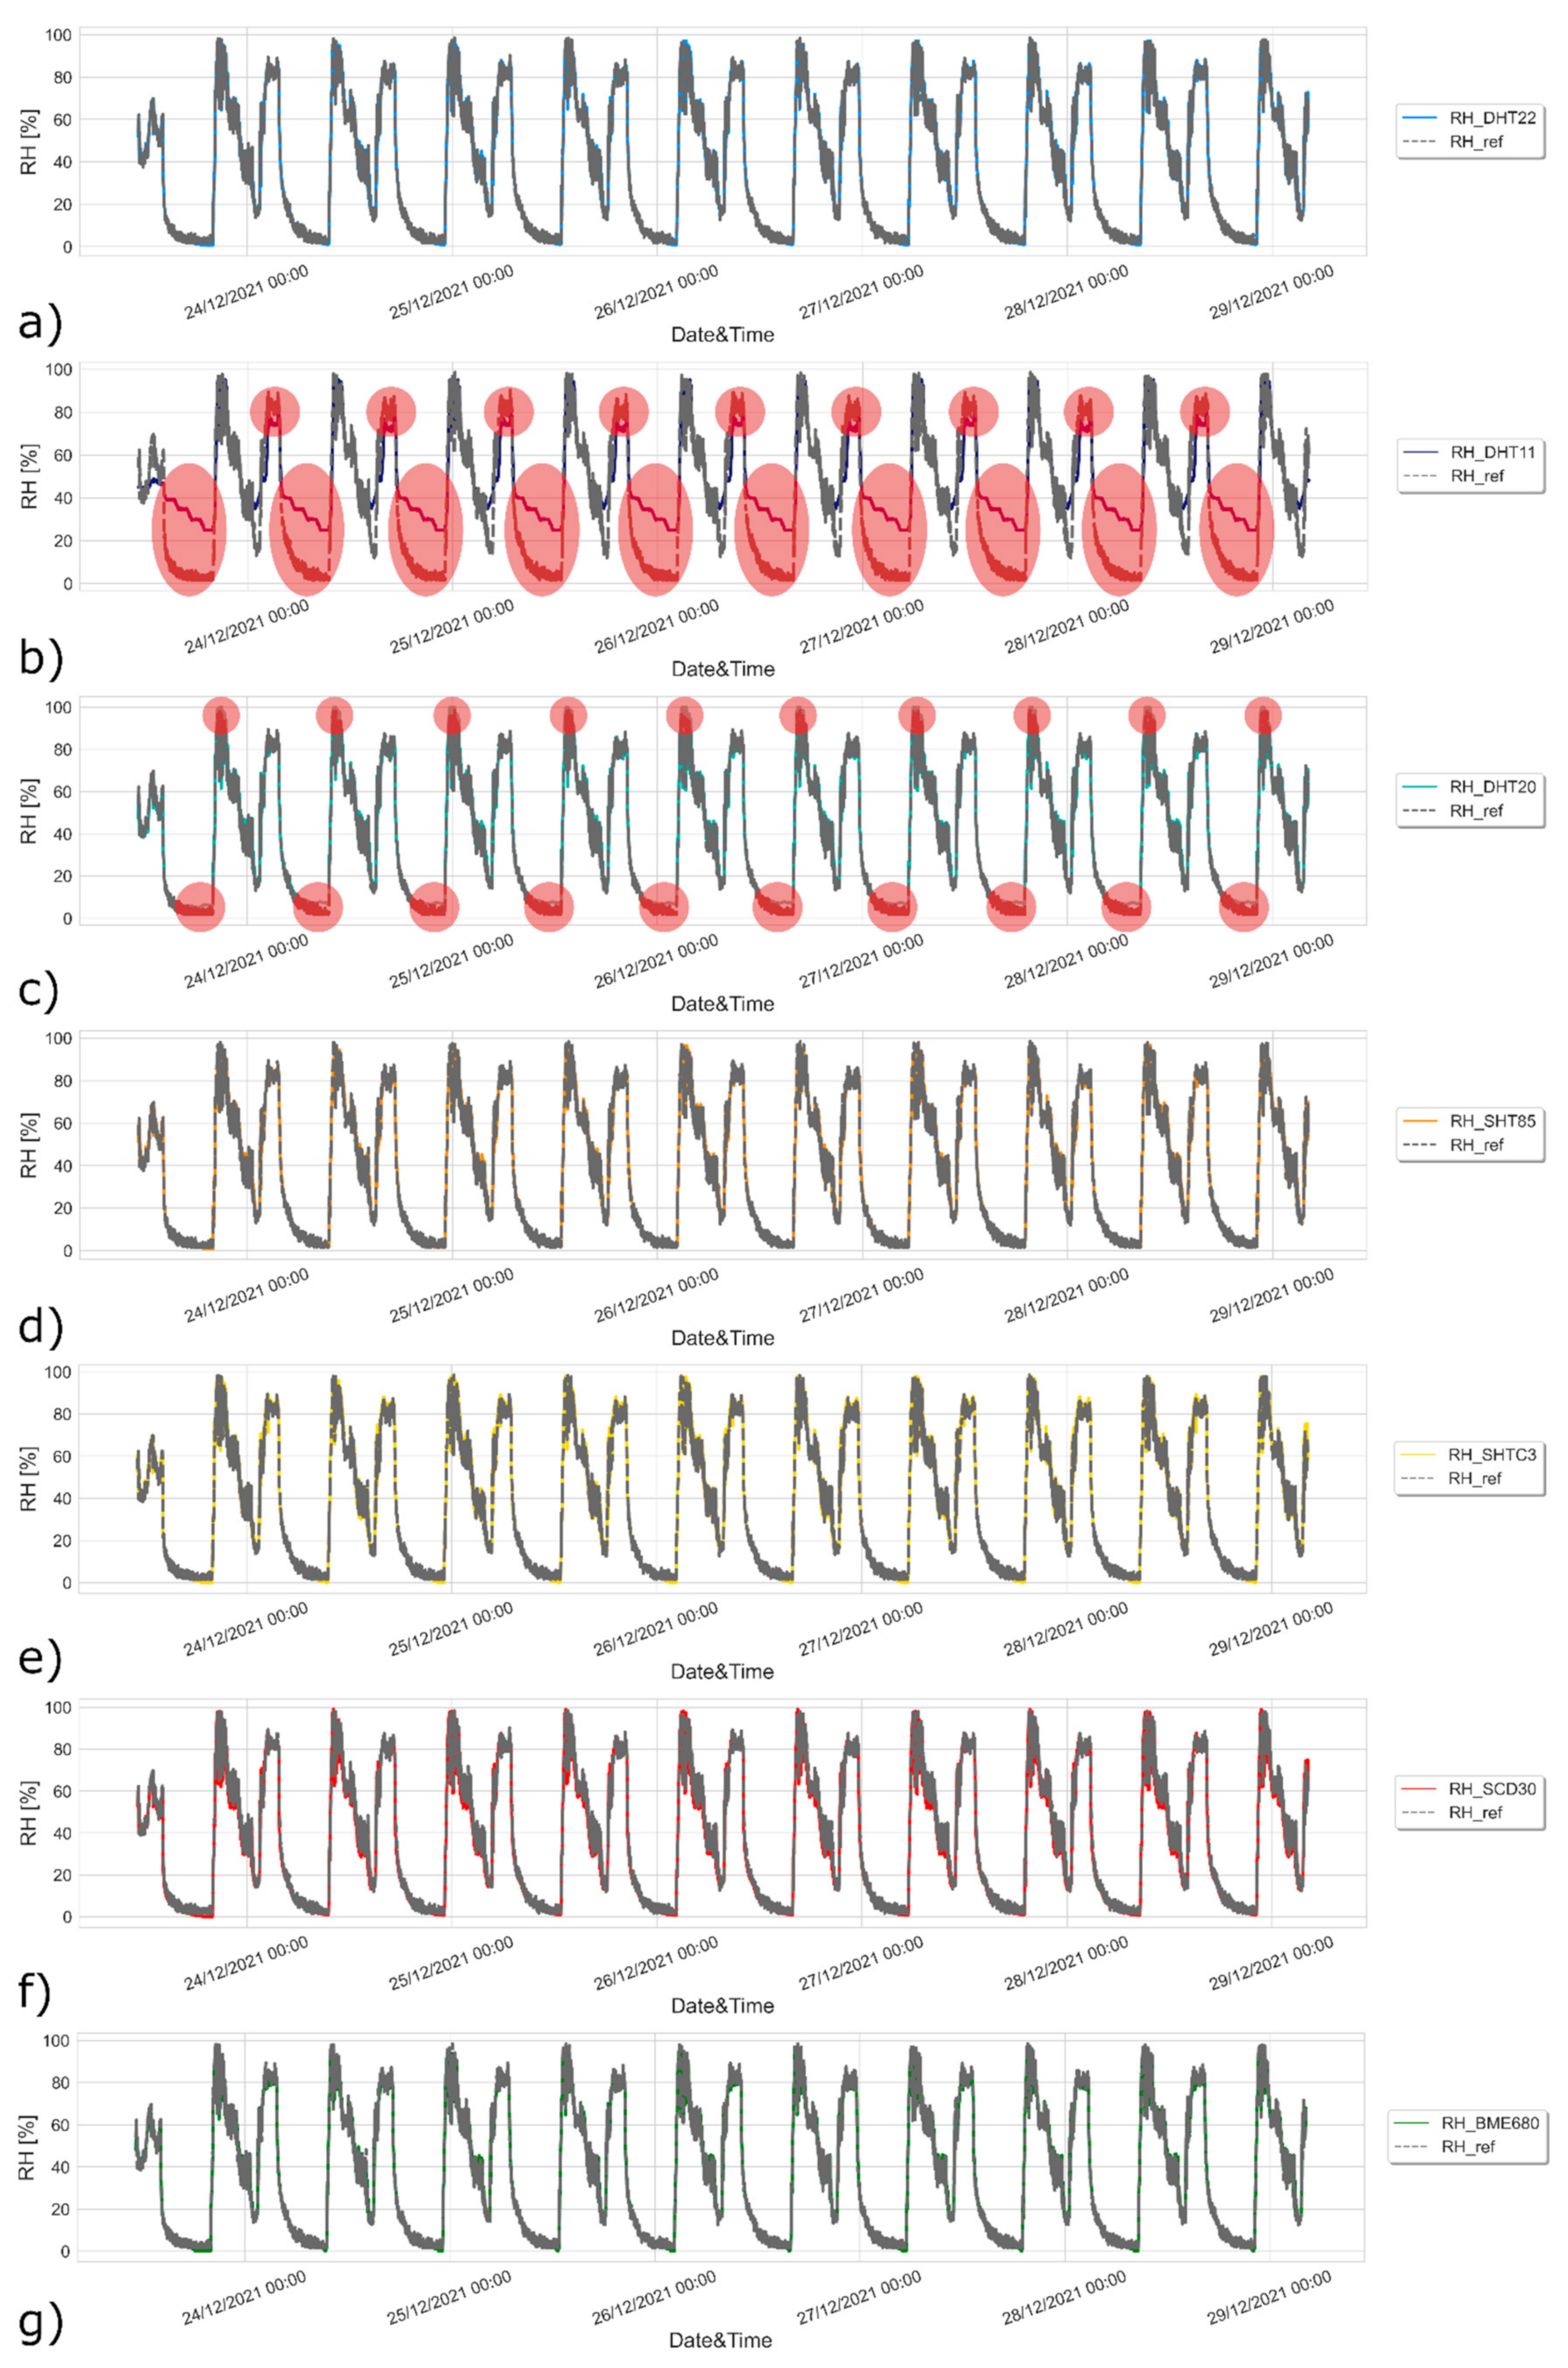
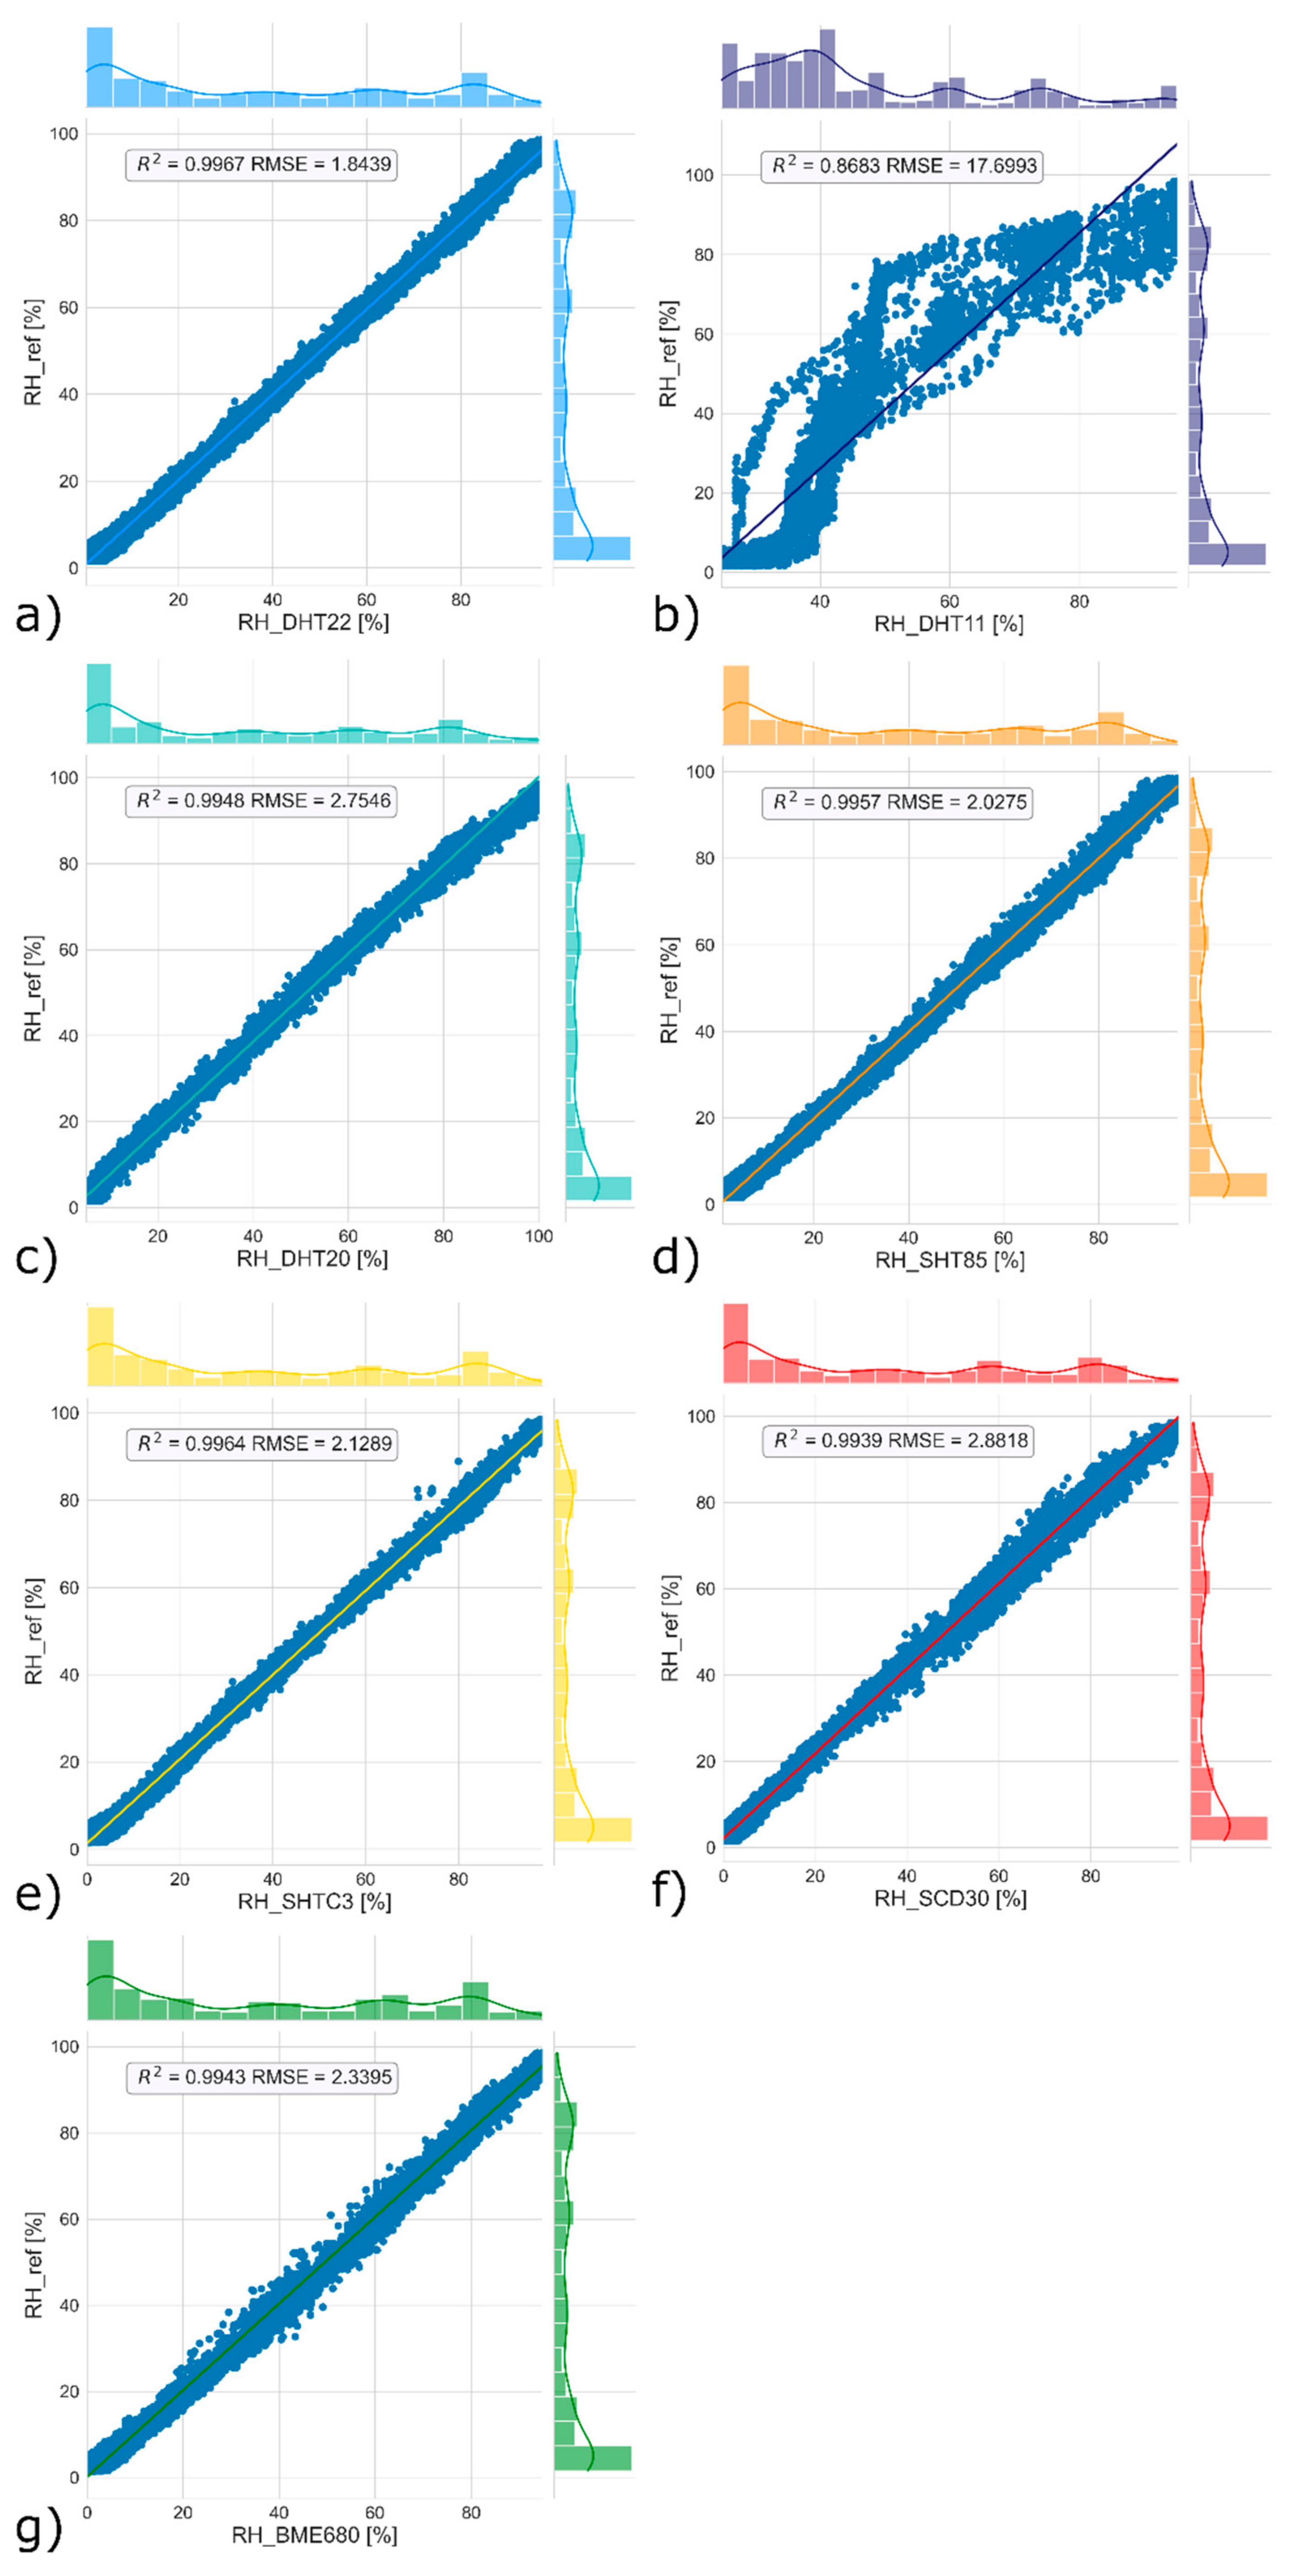
3.3. Results of Test Lab of Relative Humidity from Low-Cost Sensors

The same approach was used for relative humidity measurements. Figure 8 shows RH_ref compared with the relative humidity values monitored by the seven low-cost thermohygrometers.
The sensors were exposed to relative humidity ranging from nearly 0% to nearly 100%. The relative humidity profiles of the low-cost sensors are consistent with those monitored by RH_ref, except for Figure 8b, where the DHT11 records a range of deviations. The same is true for the DHT20 (Figure 8c), which does not seem to be able to follow both the lowest and highest values from RH_ref. All other sensors follow the reference profile correctly without recording any deviation, even at the end of the tenth cycle.
Figure 9 shows the pairwise comparison of relative humidity values monitored by the reference instrument and the seven low-cost sensors.
In this case, each sensor’s low-cost values show lower alignment than the air temperature values (Figure 7). In this case, DHT22 achieves the best results with the highest R2 (0.9970) and lowest RMSE (1.7396). It is followed by SHTC3 (R2 = 0.9968, RMSE = 2.0304), SHT85 (R2 = 0.9961, RMSE = 1.9492), BME680 (R2 = 0.9947, RMSE = 2.2615), SCD30 (R2 = 0.9942, RMSE = 2.8180), DHT20 (R2 = 0.9951, RMSE = 2.7351) and DHT11 (R2 = 0.8687, RMSE = 17.7272). The poor performance of the DHT11 is influenced by the measurement range of relative humidity, which is between 20 and 90%, and also by the accuracy of 5%.

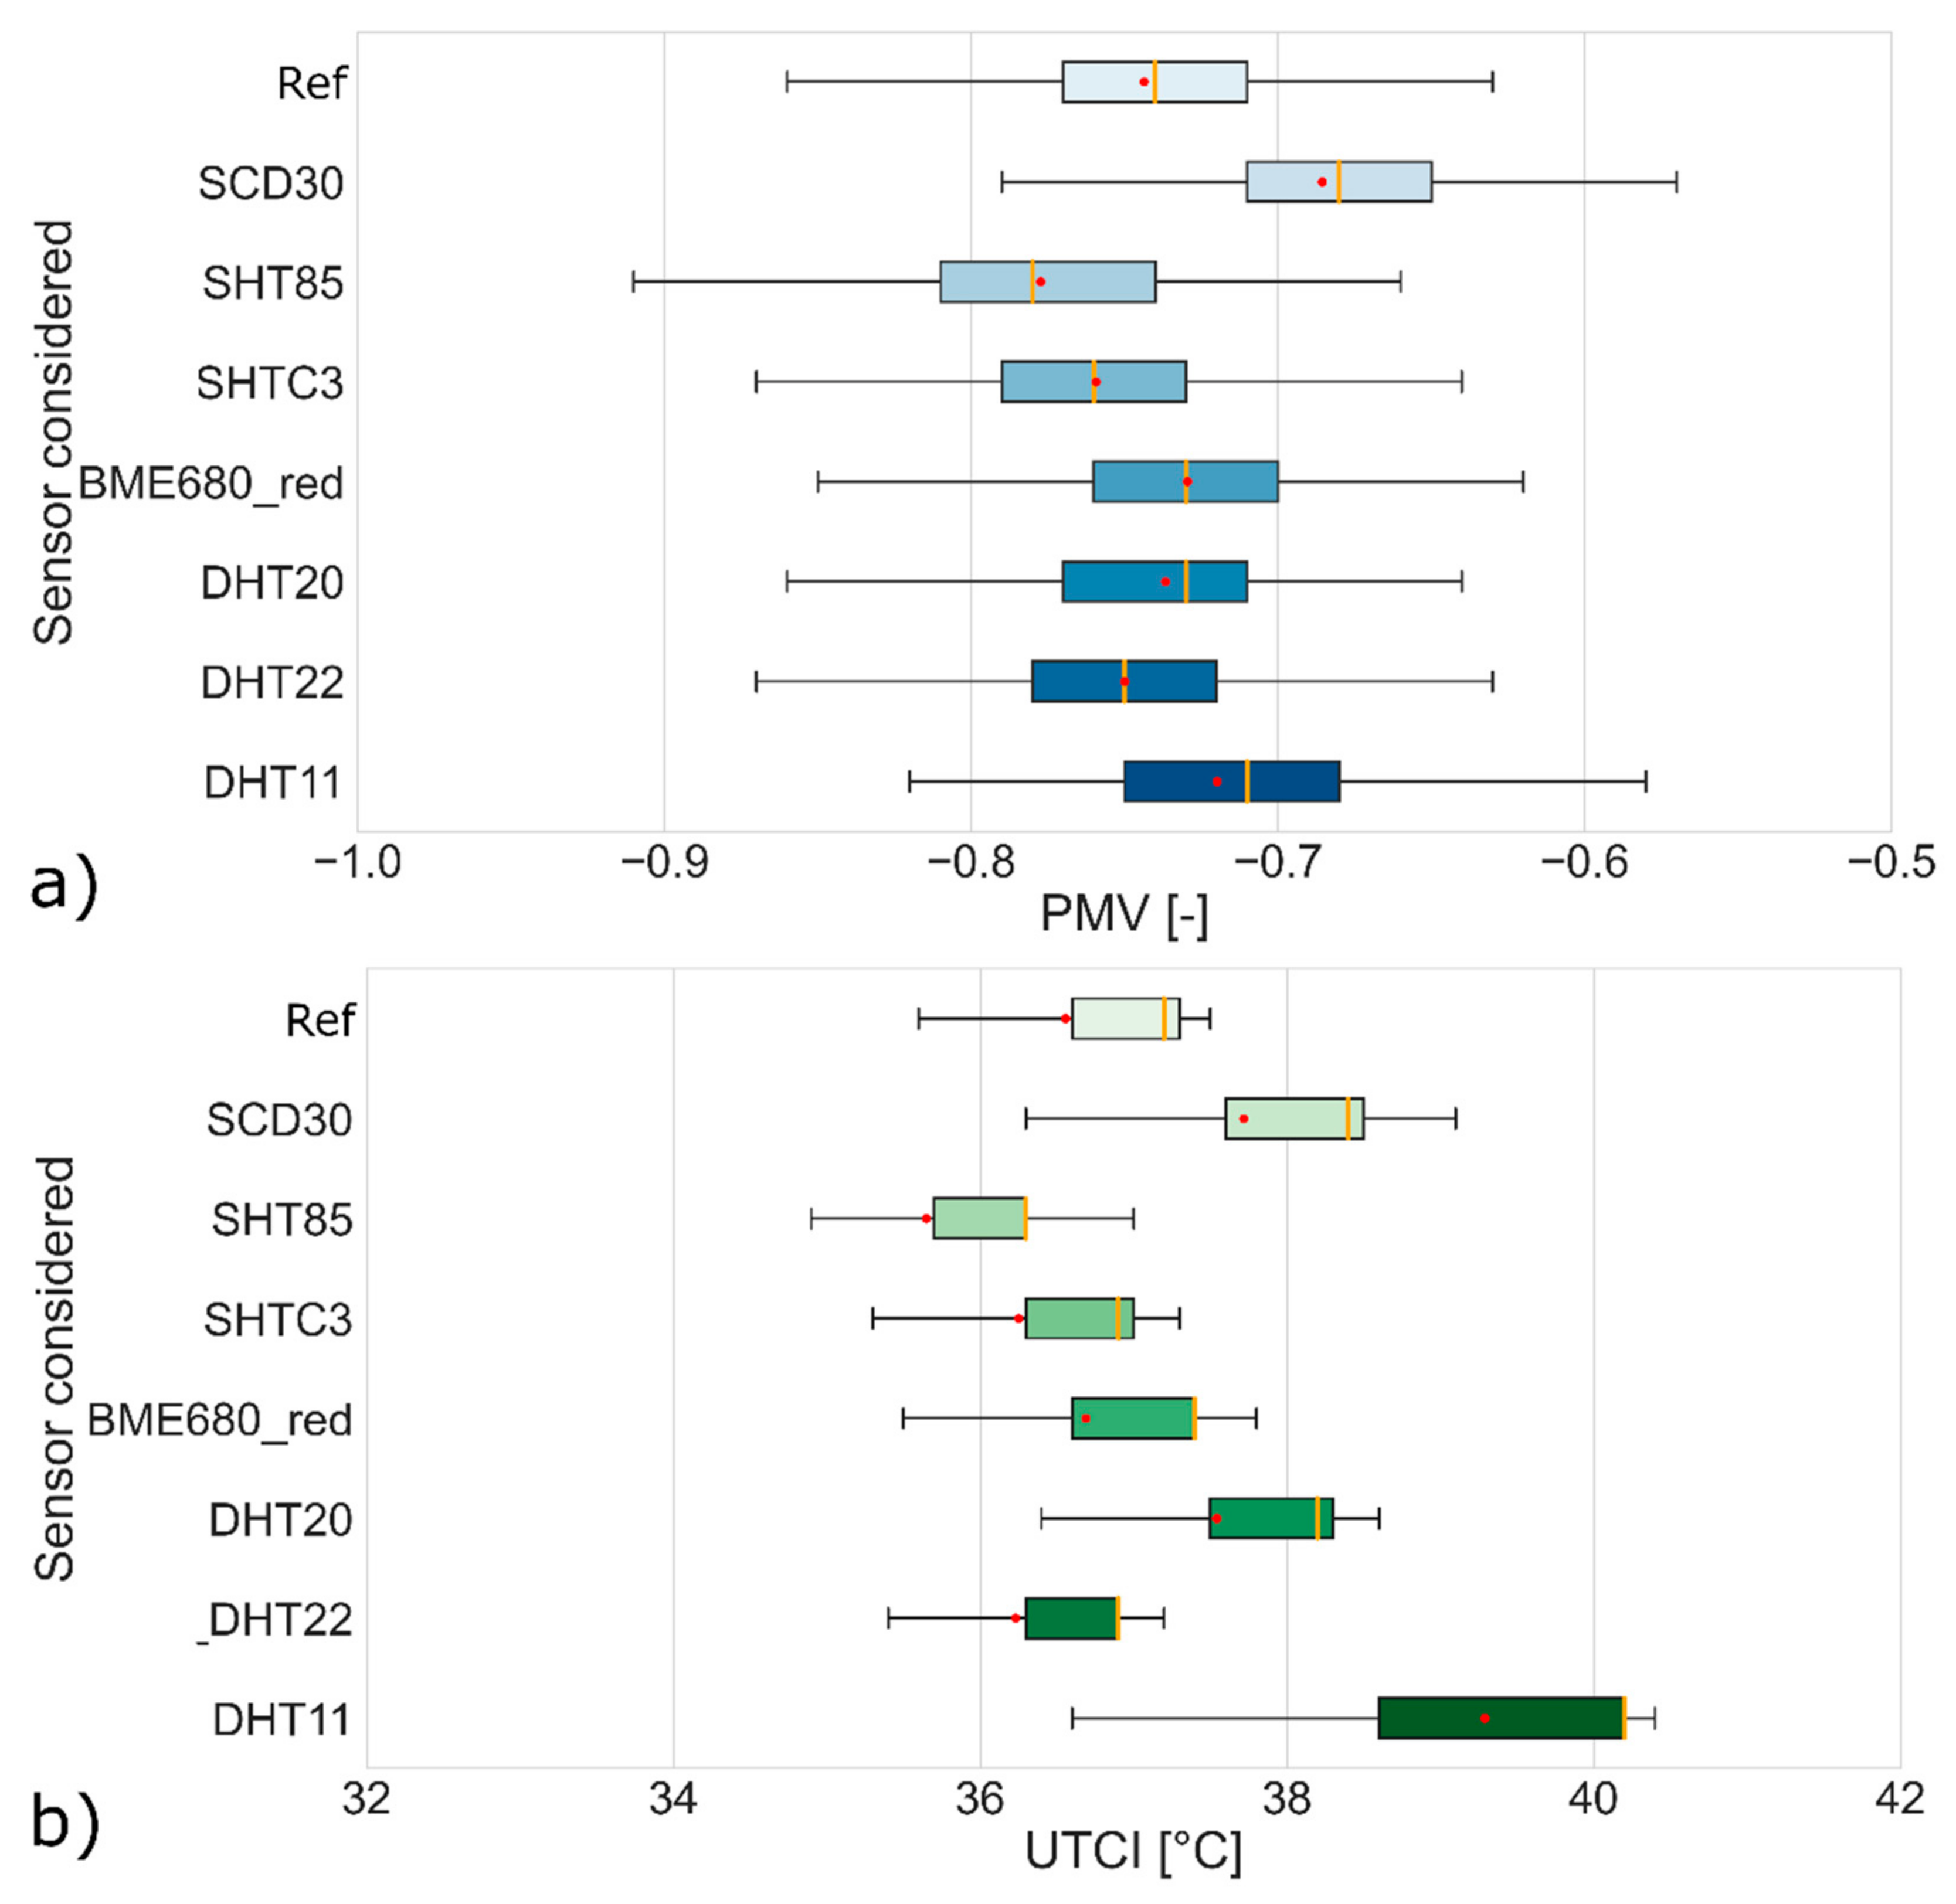
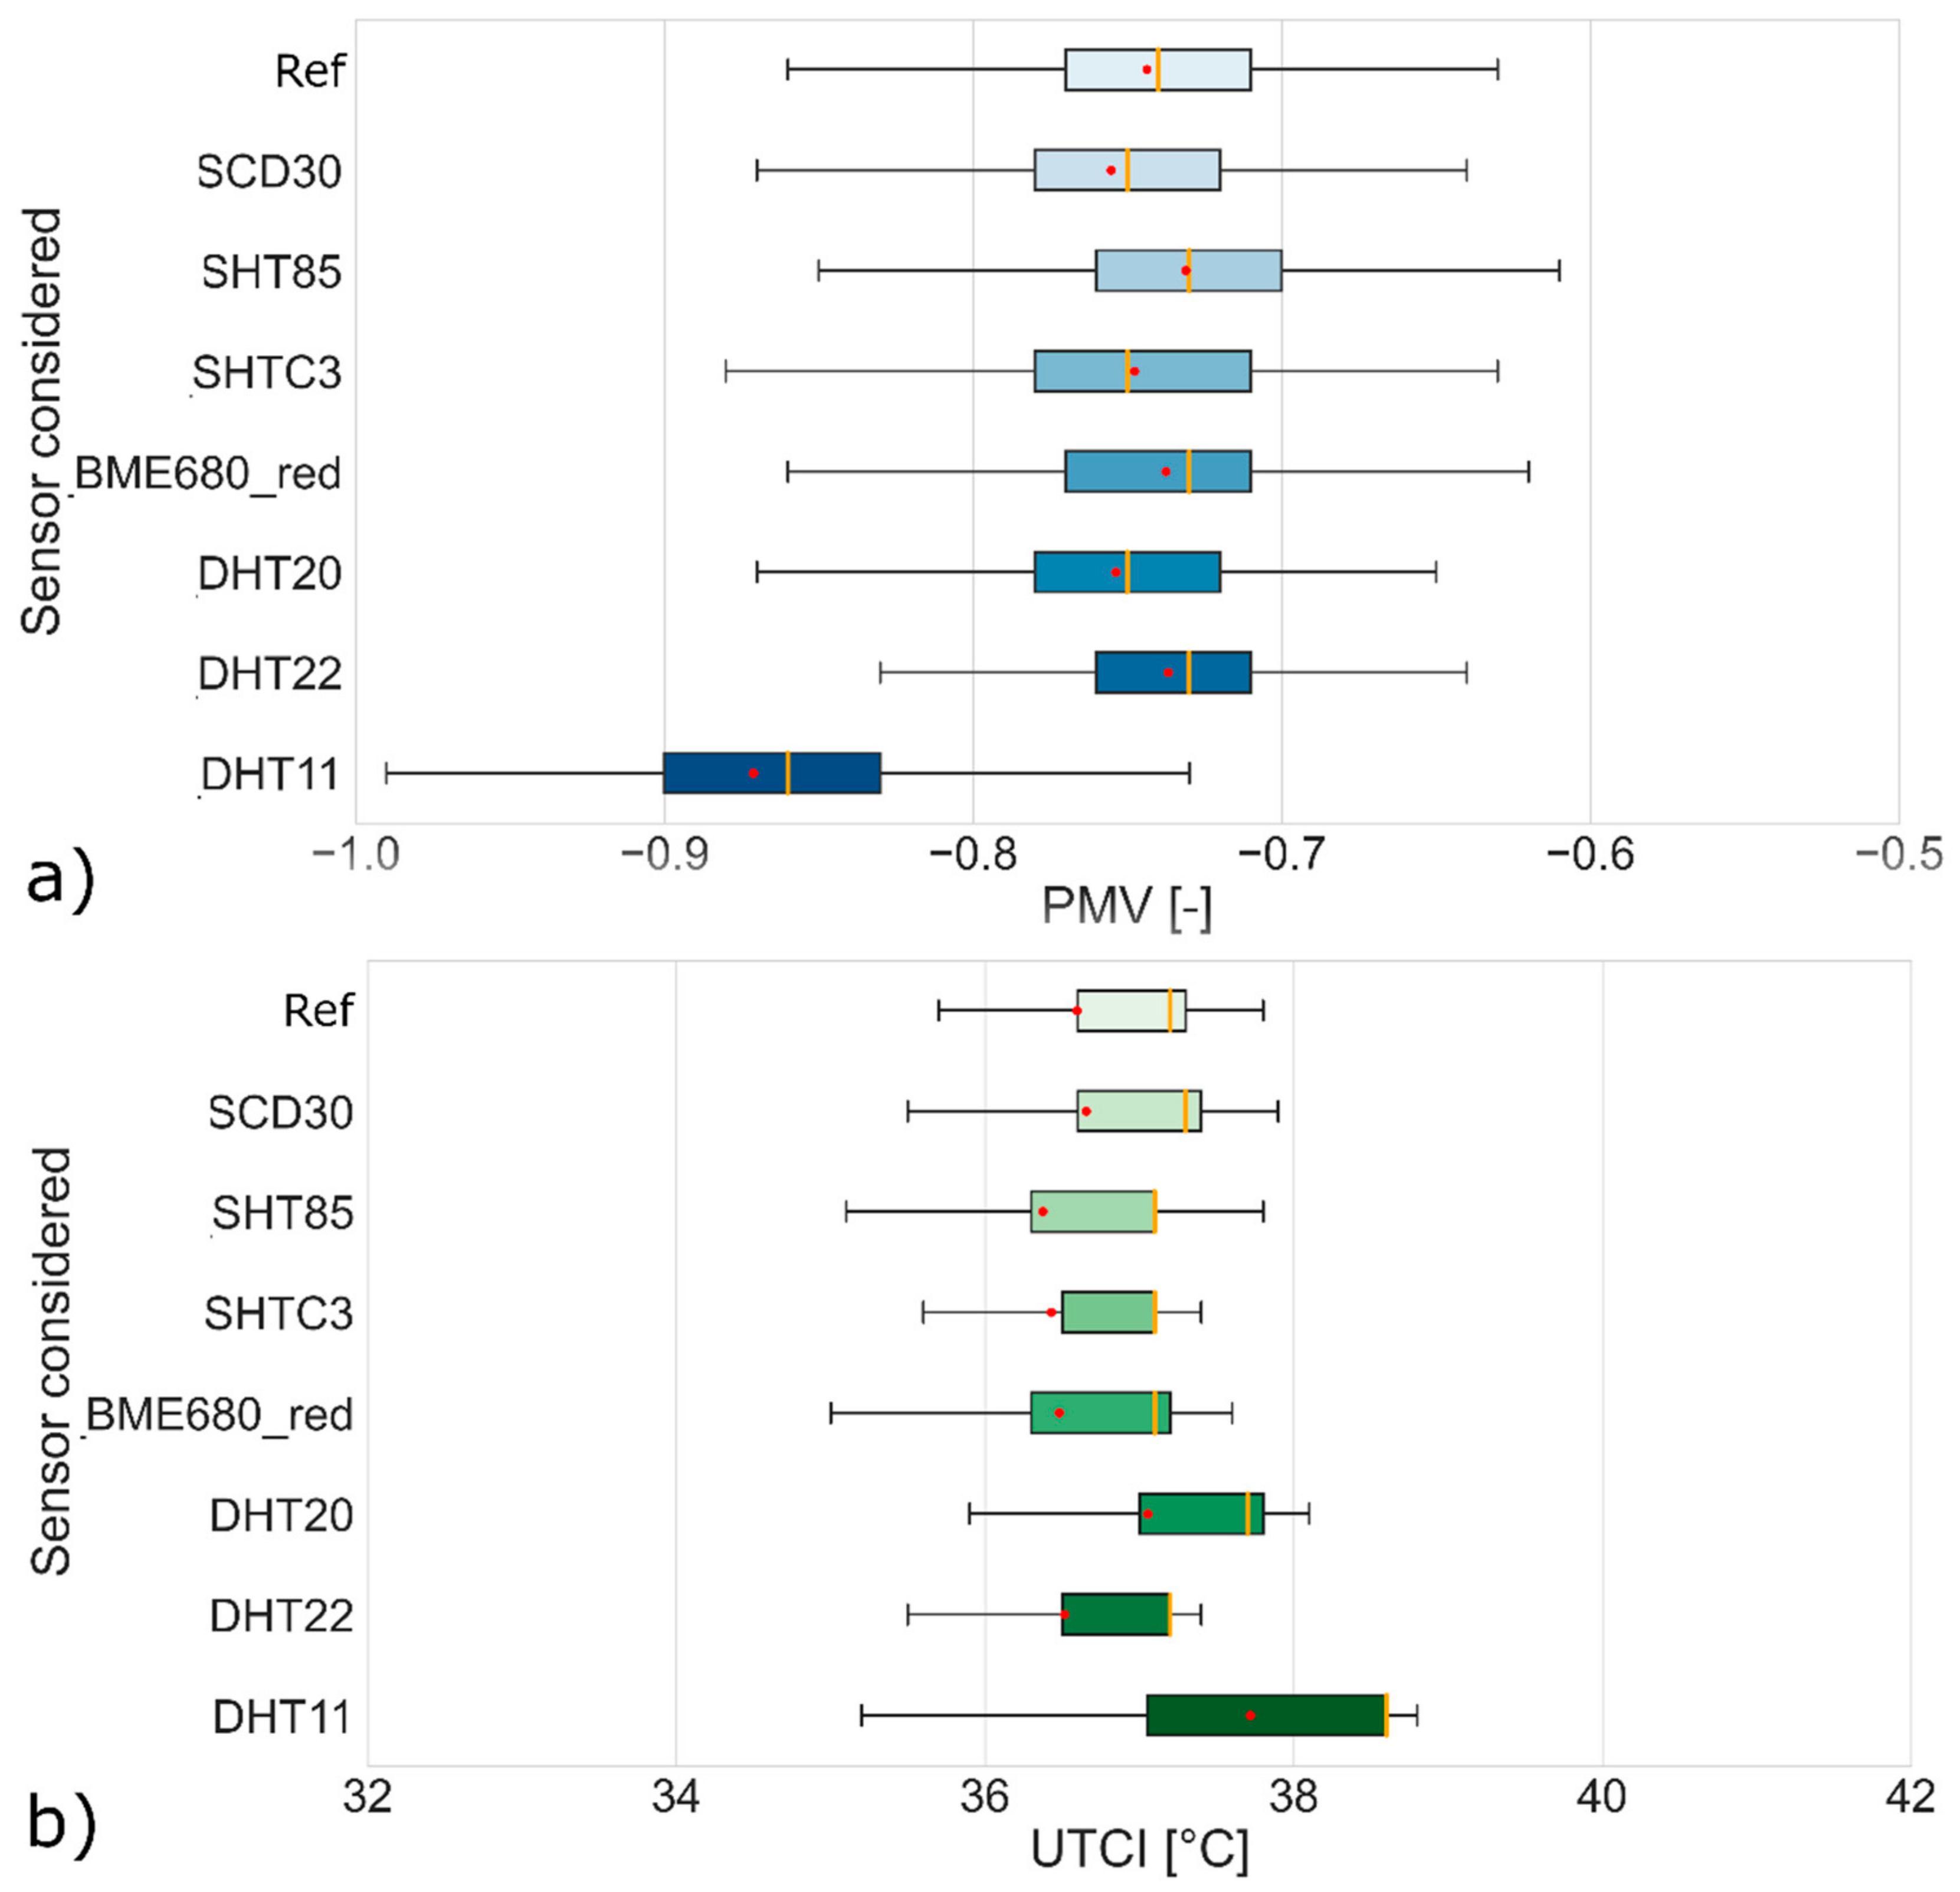
3.4. Thermal Comfort Index Comparison

To calculate PMV and UTCI, two different partial data sets derived from the previous data set were considered for the performance evaluation. Table 2 shows the data considered for the different scenarios. Scenario 1 refers to the most common indoor air temperature and relative humidity data during winter. Scenario 2 refers to typical summer conditions that are most relevant for developing adaptation strategies [82] in urban areas, also considering the increase in global average temperature that could have significant impacts on human health during the summer season [83,84,85,86].
Figure 10 shows the boxplot of PMV or UTCI, depending on the scenario, calculated based on different values defined considering the data given in the previous Table 2.
Figure 10 shows that the seven low-cost sensors do not seem reliable enough in these scenarios except for DHT22, BME680 and SHTC3. The pairwise comparison between the average values derived from the reference sensors and the seven low-cost sensors yielded a linear relationship. For this reason, it might be useful to correct the values of air temperature and relative humidity to better fit the reference values with a simple linear regression and then recalculate PMV and UTCI. Figure 11 shows the correct values, calculated from the raw values of the low-cost sensors to follow the trend of the reference sensor. The new pair list of values, verified considering the criteria of the two scenarios described in Table 2, are then considered to recalculate the new boxplots.
The most important results of this study can be summarized according to the following points:
  • The main steps of a procedure for evaluating low-cost sensors in a controlled environment by direct comparison with reference sensors were described; they can be summarized as follows:
    • A guard ring of reference sensors must be considered around the sensors to be analyzed to eliminate possible spatial differences in the measured variables. The desired accuracy for these sensors could be at least ±0.2 °C for air temperatures and at least ±3% for relative humidity for thermal comfort assessment.
    • The plane on which the different sensors are placed should be as small as possible to avoid spatial differences in the measured variables.
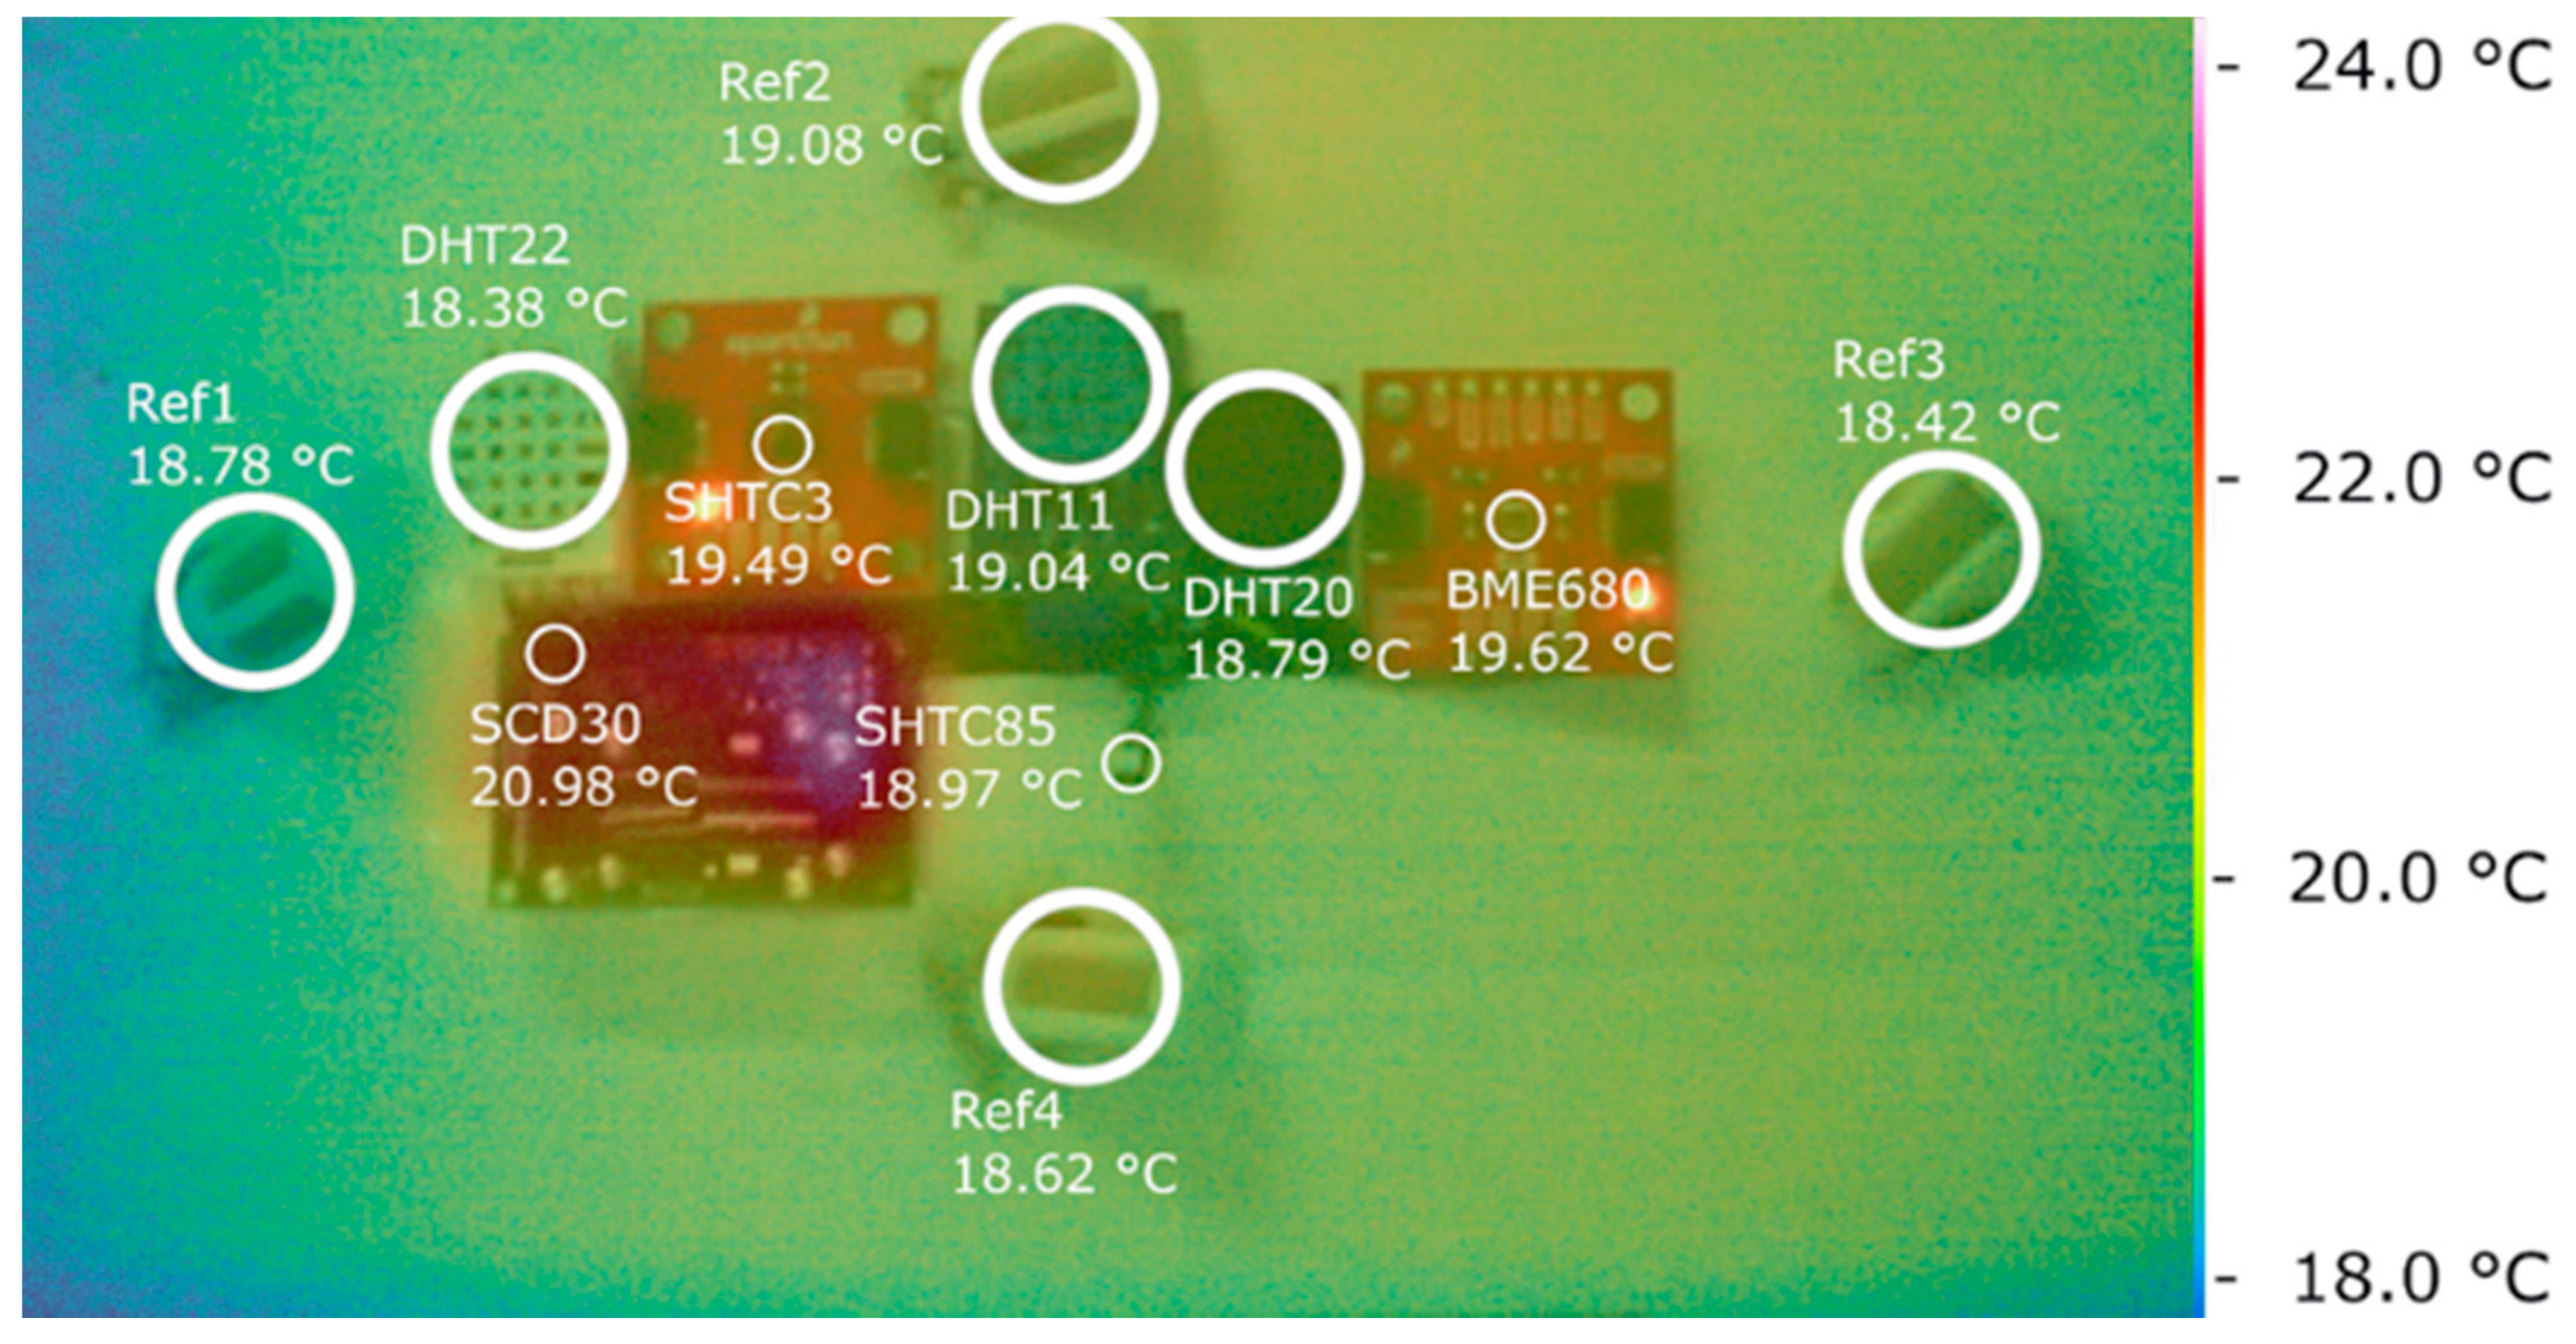
    • Consider possible hot spots as well, the presence of which should be checked with a thermographic camera when the sensors are working, and determine the position of the reference sensors to avoid overheating effects.
    • Determine the ranges of air temperature and relative humidity that are consistent with the scope of the research.
    • Define the number of cycles in the climatic chamber in accordance with the scope of the research. If is not possible to carry out the analysis for longer periods, it would be useful to repeat the test for a shorter period before and after the research study.
    • Compare the performance of the low-cost sensors with the average values recorded by the reference sensors, and possibly apply a simple regression analysis to better match the raw data from low-cost sensors with that of reference sensors.
  • Low-cost sensors are not necessarily less accurate than professional sensors, but they need more attention and initial calibration;
  • Except for DHT11, low-cost sensors have an extremely linear behavior compared to professional sensors, and if you determine the regression equation, the derived results in terms of PMV and UTCI can be very satisfactory for all the sensors considered.

4. Discussion

This study focuses on the calibration procedure performed for the seven low-cost thermohygrometers. However, there are other aspects to consider when defining a wearable based on these types of sensors. For example, the power consumption of the different sensors is a limiting factor that could affect the battery life when using this instrument. Table 3 shows the values from the datasheet.
The SHTC3 sensor outperforms the other sensors in terms of the lowest power consumption. On the other hand, the SCD30 and BME680 sensors have the highest power consumption because they can also measure some parameters related to air quality.
Regarding connectivity and data accessibility, the sensors selected above can only monitor environmental parameters. The high potential is related to the extensive possibilities of connecting to a microprocessor or microcontroller that can be equipped with all kinds of connectivity (e.g., Bluetooth, WiFi, LoRa, etc.). Another aspect we have not considered is the influence of human breathing or sweating humidity, which could interfere with the measurement of humidity, depending on the position of the sensor near the human body. These three aspects can be considered in more detail in future development.
The main limitations of this study are: since the test was conducted in a single climate chamber and with a single set of reference sensors, we decided not to test several sensors of the same type, also considering similar approaches from other fields of building science [20,21]. Consequently, it was not possible to consider systematic errors that could occur. Secondly, the type of sensors we considered in the analysis does not include all commercially available sensors. However, the proposed procedure could be reproduced, for example, in a round-robin test, overcoming these limitations. As for the measurement cycles of about 6 days, it would be possible to extend this period to consider a longer measurement period, depending on the extent of the research. It would be better to repeat the comparison of the selected low-cost sensor according to the proposed procedure before and after the research study to check and correct any possible deviation in the recorded values.
As previously reported, the standard ISO 7726 defines the metrological characteristics of the sensors used to assess the ergonomics of the thermal environment. It is therefore not necessary to introduce new permissible errors. In the study carried out, it was found that six of the seven low-cost sensors, although having an accuracy that meets the requirements of ISO 7726, do not provide acceptable comfort indicators in some cases, as shown in Figure 10. For this reason, the use of such a procedure (which, as previous studies have shown, is not used at all) is recommended in order to always check and, if necessary, correct the behavior of low-cost sensors or exclude unreliable sensors in order to obtain reliable measurements, as shown in Figure 11.

5. Conclusions

The research study focused on testing and evaluating the performance of seven low-cost thermohygrometers in a controlled environment, defining a method that can be easily replicated. The sensors used for the test were chosen because they are low-cost, have similar technical characteristics, except for the DHT11, and were very popular among researchers. They were exposed to air temperatures ranging from about −10 to +40 °C and relative humidity from approximately 0 to 90%. The results show a good linear relationship between the low-cost sensors and the reference values, and the linear slope is equal to 1 in most cases. Compared to PMV and UTCI values calculated with reference sensors, the best sensor was the DHT22. However, the difference with the other is minimal, except for the DHT11 sensor, which had some limitations in terms of accuracy in monitoring air temperature and relative humidity, which was already indicated in the technical characteristics. For this reason, while considering the high popularity of this sensor among researchers, we do not recommend its use in assessing the environmental quality of the built environment.
We can conclude that apart from the use of such low-cost sensors for the “classical” characterization of comfort, the relatively low cost, the practicality and the very high linear behavior allow a massive use in new devices (e.g., wearables, if aspects of power consumption and the influence of human breath or sweat moisture could be considered in future development, or nearables [25], if these issues were neglected) to define new models of comfort that consider the subjective perception of the users and the environmental conditions near the users themselves.

Author Contributions

Conceptualization, F.S., M.M. and S.S.; methodology, F.S. and M.M.; data acquisition and analysis, F.S.; writing—original draft preparation, F.S.; writing—review and editing, F.S., M.M., S.S., L.D., G.C. and C.M. All authors have read and agreed to the published version of the manuscript.

Funding

This research received no external funding.

Institutional Review Board Statement

Not applicable.

Informed Consent Statement

Not applicable.

Data Availability Statement

Not applicable.

Conflicts of Interest

The authors declare no conflict of interest.

References

  1. Temperature scales and temperature fixed points. In The Art of Cryogenics; Elsevier: Amsterdam, The Netherlands, 2008; pp. 175–191.
  2. Schurer, K. Comparison of Sensors for Measurement of Air Humidity. In Properties of Water in Foods; Springer: Dordrecht, The Netherlands, 1985; pp. 647–660. [Google Scholar]
  3. Fox, S. Third Wave Do-It-Yourself (DIY): Potential for prosumption, innovation, and entrepreneurship by local populations in regions without industrial manufacturing infrastructure. Technol. Soc. 2014, 39, 18–30. [Google Scholar] [CrossRef]
  4. Roelands, M.; Plomp, J.; Mansilla, D.C.; Velasco, J.R.; Salhi, I.; Lee, G.M.; Crespi, N.; dos Santos, F.V.; Vachaudez, J.; Bettens, F.; et al. The DiY Smart Experiences Project. In Architecting the Internet of Things; Springer: Berlin/Heidelberg, Germany, 2011; pp. 279–315. [Google Scholar]
  5. Gubbi, J.; Buyya, R.; Marusic, S.; Palaniswami, M. Internet of Things (IoT): A vision, architectural elements, and future directions. Futur. Gener. Comput. Syst. 2013, 29, 1645–1660. [Google Scholar] [CrossRef] [Green Version]
  6. Kim, T.; Shin, D.-H. Social platform innovation of open source hardware in South Korea. Telemat. Inform. 2016, 33, 217–226. [Google Scholar] [CrossRef]
  7. Pearce, J.M. Open-Source Lab: How to Build Your Own Hardware and Reduce Research Costs. In Open-Source Lab; Elsevier: Amsterdam, The Netherlands, 2014. [Google Scholar] [CrossRef]
  8. Chu, M.; Song, Y. Analysis of network security and privacy security based on AI in IOT environment. In Proceedings of the 2021 IEEE 4th International Conference on Information Systems and Computer Aided Education (ICISCAE), Dalian, China, 24–26 September 2021; pp. 390–393. [Google Scholar]
  9. Xin, Z. Research on Network Security and Privacy Protection in the Background of Big Data. Netw. Secur. Technol. Appl. 2020, 518–521. [Google Scholar] [CrossRef]
  10. Tzafestas, S.G. Synergy of IoT and AI in Modern Society: The Robotics and Automation Case. Robot. Autom. Eng. J. 2018, 3, 1–15. [Google Scholar] [CrossRef]
  11. Salamone, F.; Masullo, M.; Sibilio, S. Wearable Devices for Environmental Monitoring in the Built Environment: A Systematic Review. Sensors 2021, 21, 4727. [Google Scholar] [CrossRef]
  12. Zeng, S.; Sun, H.; Park, C.; Zhang, M.; Zhu, M.; Yan, M.; Chov, N.; Li, E.; Smith, A.T.; Xu, G.; et al. Multi-stimuli responsive chromism with tailorable mechanochromic sensitivity for versatile interactive sensing under ambient conditions. Mater. Horiz. 2020, 7, 164–172. [Google Scholar] [CrossRef]
  13. De Vecchi, R.; Ripper, J.D.S.C.; Roy, D.; Breton, L.; Marciano, A.G.; De Souza, P.M.B.; Corrêa, M.D.P. Using wearable devices for assessing the impacts of hair exposome in Brazil. Sci. Rep. 2019, 9, 13357. [Google Scholar] [CrossRef] [Green Version]
  14. Wang, S.; Richardson, M.B.; Wu, C.Y.H.; Cholewa, C.D.; Lungu, C.T.; Zaitchik, B.F.; Gohlke, J.M. Estimating Occupational Heat Exposure from Personal Sampling of Public Works Employees in Birmingham, Alabama. J. Occup. Environ. Med. 2019, 61, 518–524. [Google Scholar] [CrossRef]
  15. Antolín, D.; Medrano, N.; Calvo, B.; Pérez, F. A wearable wireless sensor network for indoor smart environment monitoring in safety applications. Sensors 2017, 17, 365. [Google Scholar] [CrossRef]
  16. Nakayoshi, M.; Kanda, M.; Shi, R.; de Dear, R. Outdoor thermal physiology along human pathways: A study using a wearable measurement system. Int. J. Biometeorol. 2015, 59, 503–515. [Google Scholar] [CrossRef] [PubMed]
  17. Frampton, T.H.; Tiele, A.; Covington, J.A. Development of a Personalised Environmental Quality Monitoring System (PONG). IEEE Sens. J. 2021, 21, 15230–15236. [Google Scholar] [CrossRef]
  18. Vajs, I.; Drajic, D.; Gligoric, N.; Radovanovic, I.; Popovic, I. Developing Relative Humidity and Temperature Corrections for Low-Cost Sensors Using Machine Learning. Sensors 2021, 21, 3338. [Google Scholar] [CrossRef]
  19. Moghavvemi, M.; Ng, K.E.; Soo, C.Y.; Tan, S.Y. A reliable and economically feasible remote sensing system for temperature and relative humidity measurement. Sens. Actuators A Phys. 2005, 117, 181–185. [Google Scholar] [CrossRef]
  20. Demanega, I.; Mujan, I.; Singer, B.C.; Anđelković, A.S.; Babich, F.; Licina, D. Performance assessment of low-cost environmental monitors and single sensors under variable indoor air quality and thermal conditions. Build. Environ. 2021, 187, 107415. [Google Scholar] [CrossRef]
  21. Mei, H.; Han, P.; Wang, Y.; Zeng, N.; Liu, D.; Cai, Q.; Deng, Z.; Wang, Y.; Pan, Y.; Tang, X. Field Evaluation of Low-Cost Particulate Matter Sensors in Beijing. Sensors 2020, 20, 4381. [Google Scholar] [CrossRef] [PubMed]
  22. Zhao, Q.; Lian, Z.; Lai, D. Thermal comfort models and their developments: A review. Energy Built Environ. 2021, 2, 21–33. [Google Scholar] [CrossRef]
  23. Tanabe, S.-I.; Haneda, M.; Nishihara, N. Workplace productivity and individual thermal satisfaction. Build. Environ. 2015, 91, 42–50. [Google Scholar] [CrossRef]
  24. Uzelac, A.; Gligoric, N.; Krco, S. A comprehensive study of parameters in physical environment that impact students’ focus during lecture using Internet of Things. Comput. Hum. Behav. 2015, 53, 427–434. [Google Scholar] [CrossRef]
  25. Salamone, F.; Belussi, L.; Currò, C.; Danza, L.; Ghellere, M.; Guazzi, G.; Lenzi, B.; Megale, V.; Meroni, I. Integrated method for personal thermal comfort assessment and optimization through users’ feedback, IoT and machine learning: A case study. Sensors 2018, 18, 1602. [Google Scholar] [CrossRef] [Green Version]
  26. Salamone, F.; Belussi, L.; Currò, C.; Danza, L.; Ghellere, M.; Guazzi, G.; Lenzi, B.; Megale, V.; Meroni, I. Application of IoT and Machine Learning techniques for the assessment of thermal comfort perception. Energy Procedia 2018, 148, 798–805. [Google Scholar] [CrossRef]
  27. Mackey, C.W. Pan Climatic Humans: Shaping Thermal Habits in an Unconditioned Society. Ph.D. Thesis, Massachusetts Institute of Technology, Cambridge, MA, USA, 2015. [Google Scholar]
  28. Dieffenderfer, J.; Goodell, H.; Mills, S.; McKnight, M.; Yao, S.; Lin, F.; Beppler, E.; Bent, B.; Lee, B.; Misra, V.; et al. Low-Power Wearable Systems for Continuous Monitoring of Environment and Health for Chronic Respiratory Disease. IEEE J. Biomed. Health Inform. 2016, 20, 1251–1264. [Google Scholar] [CrossRef] [PubMed]
  29. Vellei, M.; de Dear, R.; Inard, C.; Jay, O. Dynamic thermal perception: A review and agenda for future experimental research. Build. Environ. 2021, 205, 108269. [Google Scholar] [CrossRef]
  30. Pioppi, B.; Pigliautile, I.; Pisello, A.L. Data collected by coupling fix and wearable sensors for addressing urban microclimate variability in an historical Italian city. Data Brief 2020, 29, 105322. [Google Scholar] [CrossRef]
  31. Cureau, R.J.; Pigliautile, I.; Pisello, A.L. A New Wearable System for Sensing Outdoor Environmental Conditions for Monitoring Hyper-Microclimate. Sensors 2022, 22, 502. [Google Scholar] [CrossRef]
  32. European Union Complete Guide to GDPR Compliance. Available online: https://gdpr.eu (accessed on 21 January 2022).
  33. De Capitani di Vimercati, S.; Genovese, A.; Livraga, G.; Piuri, V.; Scotti, F. Privacy and security in environmental monitoring systems. In Computer and Information Security Handbook; Elsevier: Amsterdam, The Netherlands, 2013; pp. 835–853. [Google Scholar]
  34. Ramos, J.L.H.; Skarmeta, A. Security and Privacy in the Internet of Things: Challenges and Solutions; IOS Press: Amsterdam, The Netherlands, 2020; ISBN 978-1-64368-053-8. [Google Scholar]
  35. Iachini, T.; Maffei, L.; Masullo, M.; Senese, V.P.; Rapuano, M.; Pascale, A.; Sorrentino, F.; Ruggiero, G. The experience of virtual reality: Are individual differences in mental imagery associated with sense of presence? Cogn. Process. 2019, 20, 291–298. [Google Scholar] [CrossRef]
  36. Coulby, G.; Clear, A.; Jones, O.; Godfrey, A. A Scoping Review of Technological Approaches to Environmental Monitoring. Int. J. Environ. Res. Public Health 2020, 17, 3995. [Google Scholar] [CrossRef]
  37. Schweiker, M.; Ampatzi, E.; Andargie, M.S.; Andersen, R.K.; Azar, E.; Barthelmes, V.M.; Berger, C.; Bourikas, L.; Carlucci, S.; Chinazzo, G.; et al. Review of multi-domain approaches to indoor environmental perception and behaviour. Build. Environ. 2020, 176, 106804. [Google Scholar] [CrossRef]
  38. Cabanac, M. Sensory Pleasure. Q. Rev. Biol. 1979, 54, 1–29. [Google Scholar] [CrossRef]
  39. Vellei, M.; Chinazzo, G.; Zitting, K.M.; Hubbard, J. Human thermal perception and time of day: A review. Temperature 2021, 8, 320–341. [Google Scholar] [CrossRef]
  40. Abdelrahman, M.M.; Chong, A.; Miller, C. Personal thermal comfort models using digital twins: Preference prediction with BIM-extracted spatial–temporal proximity data from Build2Vec. Build. Environ. 2022, 207, 108532. [Google Scholar] [CrossRef]
  41. Ulpiani, G.; Nazarian, N.; Zhang, F.; Pettit, C.J. Towards a Living Lab for Enhanced Thermal Comfort and Air Quality: Analyses of Standard Occupancy, Weather Extremes, and COVID-19 Pandemic. Front. Environ. Sci. 2021, 9, 9. [Google Scholar] [CrossRef]
  42. Miranda, M.T.; Romero, P.; Valero-Amaro, V.; Arranz, J.I.; Montero, I. Ventilation conditions and their influence on thermal comfort in examination classrooms in times of COVID-19. A case study in a Spanish area with Mediterranean climate. Int. J. Hyg. Environ. Health 2022, 240, 113910. [Google Scholar] [CrossRef] [PubMed]
  43. Pietrogrande, M.C.; Casari, L.; Demaria, G.; Russo, M. Indoor Air Quality in Domestic Environments during Periods Close to Italian COVID-19 Lockdown. Int. J. Environ. Res. Public Health 2021, 18, 4060. [Google Scholar] [CrossRef] [PubMed]
  44. Arduino Mega 2560 Rev3—Arduino Official Store. Available online: https://store.arduino.cc/products/arduino-mega-2560-rev3 (accessed on 26 January 2022).
  45. Arduino Wireless SD Shield|Arduino Documentation|Arduino Documentation. Available online: https://docs.arduino.cc/retired/shields/arduino-wireless-sd-shield (accessed on 26 January 2022).
  46. DS1307 Datasheet. Available online: https://cdn.sparkfun.com/datasheets/BreakoutBoards/DS1307.pdf (accessed on 26 January 2022).
  47. DHT22 Temperature and Humidity Sensor. Available online: https://www.adafruit.com/product/385 (accessed on 26 January 2022).
  48. DHT11 Temperature and Humidity Sensor. Available online: https://www.microbot.it/documents/mr003-005-2_datasheet.pdf (accessed on 26 January 2022).
  49. DHT20 Temperature and Humidity Sensor. Available online: https://cdn.sparkfun.com/assets/8/a/1/5/0/DHT20.pdf (accessed on 26 January 2022).
  50. SHT85 Temperature and Humidity Sensor. Available online: https://create.arduino.cc/projecthub/sd9martins/sht85-arduino-temperature-and-humidity-sensor-6e727d (accessed on 26 January 2022).
  51. SHTC3 Temperature and Humidity Sensor. Available online: https://github.com/sparkfun/SparkFun_SHTC3_Arduino_Library (accessed on 26 January 2022).
  52. SCD30 Temperature, Humidity and CO2 Concentration Sensor. Available online: https://cdn.sparkfun.com/assets/4/8/8/7/7/Sensirion_CO2_Sensors_SCD30_Datasheet.pdf (accessed on 26 January 2022).
  53. BME680 Temperature, Humidity, Pressure and Air Quality Sensor. Available online: https://cdn.sparkfun.com/assets/8/a/1/c/f/BME680-Datasheet.pdf (accessed on 26 January 2022).
  54. Reference Sensor Case. Available online: http://www.nesasrl.eu/media/pdf/TAI.pdf (accessed on 14 February 2022).
  55. Technical Data of the Reference Sensor. Available online: http://www.nesasrl.eu/media/pdf/UTAI.pdf (accessed on 9 February 2022).
  56. Arduino Wire Library. Available online: http://arduino.cc/en/reference/wire (accessed on 28 January 2022).
  57. SD Library. Available online: https://www.arduino.cc/en/reference/SD%0Ahttps://www.arduino.cc/en/Tutorial/Datalogger (accessed on 28 January 2022).
  58. RTC Library. Available online: https://github.com/adafruit/RTClib (accessed on 29 January 2022).
  59. DHT11 and 22 Library. Available online: https://github.com/adafruit/DHT-sensor-library (accessed on 29 January 2022).
  60. DHT20 Library. Available online: https://github.com/DFRobot/DFRobot_DHT20 (accessed on 29 January 2022).
  61. SHT85 Library. Available online: https://github.com/RobTillaart/SHT85 (accessed on 29 January 2022).
  62. SHTC3 Library. Available online: https://github.com/adafruit/Adafruit_SHTC3 (accessed on 29 January 2022).
  63. SCD30 Library. Available online: https://github.com/sparkfun/SparkFun_SCD30_Arduino_Library (accessed on 29 January 2022).
  64. BME680 Library. Available online: https://github.com/Zanduino/BME680 (accessed on 29 January 2022).
  65. Salamone, F.; Danza, L.; Meroni, I.; Pollastro, M. A Low-Cost Environmental Monitoring System: How to Prevent Systematic Errors in the Design Phase through the Combined Use of Additive Manufacturing and Thermographic Techniques. Sensors 2017, 17, 828. [Google Scholar] [CrossRef] [Green Version]
  66. Pisello, A.L.; Pigliautile, I.; Andargie, M.; Berger, C.; Bluyssen, P.M.; Carlucci, S.; Chinazzo, G.; Deme Belafi, Z.; Dong, B.; Favero, M.; et al. Test rooms to study human comfort in buildings: A review of controlled experiments and facilities. Renew. Sustain. Energy Rev. 2021, 149, 111359. [Google Scholar] [CrossRef]
  67. Ramezani, B.; Tadeu, A.; Jesus, T.; Brett, M.; Mendes, J. Evaluation of the thermofluidic performance of climatic chambers: Numerical and experimental studies. Fluids 2021, 6, 433. [Google Scholar] [CrossRef]
  68. Coefficient of Determination R2, Scikit-Learn Webpage. Available online: https://scikit-learn.org/stable/modules/model_evaluation.html#r2-score-the-coefficient-of-determination (accessed on 27 January 2022).
  69. Root Mean Squared Error RMSE, Scikit-Learn Webpage. Available online: https://scikit-learn.org/stable/modules/generated/sklearn.metrics.mean_squared_error.html (accessed on 27 January 2022).
  70. Seaborn Python Package. Available online: https://seaborn.pydata.org/ (accessed on 29 January 2022).
  71. Matplotlib Python Package. Available online: https://matplotlib.org/ (accessed on 29 January 2022).
  72. Scipy Python Package. Available online: https://scipy.org/ (accessed on 29 January 2022).
  73. Numpy Python Package. Available online: https://numpy.org/ (accessed on 29 January 2022).
  74. Coefficient of Determination R2, Numpy Calculation, Keras Webpage. Available online: https://www.kite.com/python/answers/how-to-calculate-r-squared-with-numpy-in-python (accessed on 27 January 2022).
  75. Pandas Python Package. Available online: https://pandas.pydata.org/pandas-docs/stable/index.html (accessed on 29 January 2022).
  76. Tartarini, F.; Schiavon, S. pythermalcomfort: A Python package for thermal comfort research. SoftwareX 2020, 12, 100578. [Google Scholar] [CrossRef]
  77. Pythermalcomfort Python Package Repository. Available online: https://github.com/CenterForTheBuiltEnvironment/pythermalcomfort (accessed on 29 January 2022).
  78. Fanger, P. Calculation of Thermal Comfort, Introduction of a Basic Comfort Equation. ASHRAE Trans. 1967, 73, III.4.1–III.4.20. [Google Scholar]
  79. Ole Fanger, P.; Toftum, J. Extension of the PMV model to non-air-conditioned buildings in warm climates. Energy Build. 2002, 34, 533–536. [Google Scholar] [CrossRef]
  80. Bröde, P.; Błazejczyk, K.; Fiala, D.; Havenith, G.; Holmér, I.; Jendritzky, G.; Kuklane, K.; Kampmann, B. The universal thermal climate index UTCI compared to ergonomics standards for assessing the thermal environment. Ind. Health 2013, 51, 16–24. [Google Scholar] [CrossRef] [PubMed] [Green Version]
  81. Fiala, D.; Havenith, G.; Bröde, P.; Kampmann, B.; Jendritzky, G. UTCI-Fiala multi-node model of human heat transfer and temperature regulation. Int. J. Biometeorol. 2012, 56, 429–441. [Google Scholar] [CrossRef] [PubMed] [Green Version]
  82. Hoffmann, P.; Krueger, O.; Schlünzen, K.H. A statistical model for the urban heat island and its application to a climate change scenario. Int. J. Climatol. 2012, 32, 1238–1248. [Google Scholar] [CrossRef]
  83. Luo, M.; Lau, N. Increasing Heat Stress in Urban Areas of Eastern China: Acceleration by Urbanization. Geophys. Res. Lett. 2018, 45, 45. [Google Scholar] [CrossRef]
  84. García-Herrera, R.; Díaz, J.; Trigo, R.M.; Luterbacher, J.; Fischer, E.M. A Review of the European Summer Heat Wave of 2003. Crit. Rev. Environ. Sci. Technol. 2010, 40, 267–306. [Google Scholar] [CrossRef]
  85. Sulikowska, A.; Wypych, A. Summer temperature extremes in Europe: How does the definition affect the results? Theor. Appl. Climatol. 2020, 141, 19–30. [Google Scholar] [CrossRef] [Green Version]
  86. Setiawati, M.D.; Jarzebski, M.P.; Gomez-Garcia, M.; Fukushi, K. Accelerating Urban Heating under Land-Cover and Climate Change Scenarios in Indonesia: Application of the Universal Thermal Climate Index. Front. Built Environ. 2021, 7, 65. [Google Scholar] [CrossRef]
Figure 1. The hardware setup consists of an Arduino Mega with a wireless SD shield and RTC module on the left, which allows the system to be equipped with data logging functions, and all seven sensors considered in the middle and right part of the figure.
Buildings 12 00579 g001
Figure 2. Popularity of sensors considered among researchers in terms of published articles—absolute value; source: Google Scholar and Scopus (January 2022).
Buildings 12 00579 g002
Figure 3. Fusion of visible and IR images of low-cost sensors and the 4 reference sensors setup with average values for considered areas.
Buildings 12 00579 g003
Figure 4. System positioned in the climatic chamber.
Buildings 12 00579 g004
Figure 5. Boxplot of the absolute difference between values recorded by each low-cost sensor and Ta_ref, the average values (where the white dot indicates the mean value and the black line indicates the median) and histplot of the four reference sensors: (a) Air temperature (Ta); (b) Relative humidity (RH).
Buildings 12 00579 g005
Figure 6. Pairwise comparison of air temperature profiles between reference sensor and: (a) DHT22, (b) DHT11, (c) DHT20, (d) SHT85, (e) SHTC3, (f) SCD30, (g) BME680. Differences in line plots between tested and reference sensors are highlighted in each subplot with a semi-transparent red ellipsoid.
Buildings 12 00579 g006
Figure 7. Pairwise comparison of air temperature values between reference sensor and: (a) DHT22, (b) DHT11, (c) DHT20, (d) SHT85, (e) SHTC3, (f) SCD30, (g) BME680, (h) BME680_red.
Buildings 12 00579 g007
Figure 8. Pairwise comparison of relative humidity profiles between reference sensor and: (a) DHT22, (b) DHT11, (c) DHT20, (d) SHT85, (e) SHTC3, (f) SCD30, (g) BME680. Differences in line plots between tested and reference sensors are highlighted in each subplot with a semi-transparent red ellipsoid.
Buildings 12 00579 g008
Figure 9. Pairwise comparison of relative humidity values between reference sensor and: (a) DHT22, (b) DHT11, (c) DHT20, (d) SHT85, (e) SHTC3, (f) SCD30, (g) BME680.
Buildings 12 00579 g009
Figure 10. Boxplot with raw data: (a) Scenario 1; (b) Scenario 2. The red dot represents the mean value while the orange line represents the median.
Buildings 12 00579 g010
Figure 11. Boxplot with derived values from the adoption of linear regression: (a) Scenario 1; (b) Scenario 2. The red dot represents the mean value while the orange line represents the median.
Buildings 12 00579 g011
Table 1. Reports the technical characteristics of all sensors used in the research.
Sensor Name [Ref.]Range MeasurementResolutionAccuracyResponse TimeWorking TemperaturePhysical SizeApproximate Price
DHT22
[47]
Ta: −40 ÷ 80 °C
RH: 0 ÷ 100%
Ta: 0.1 °C
RH: 0.1%
Ta: ±0.5 °C
RH: ±2%
--15.1 × 25.1 × 7.7 mm10 €
DHT11
[48]
Ta: −0 ÷ 50 °C
RH: 20 ÷ 90%
-Ta: ±2 °C
RH: ±5%
--17.78 × 26.67 × 7.7 mm5 €
DHT20
[49]
Ta: −40 ÷ 80 °C
RH: 0 ÷ 100%
Ta: 0.1 °C
RH:0.1%
Ta: ±0.5 °C
RH: ±3%
<8 s-12.6 × 16.10 × 5.8 mm5 €
SHT85
[50]
Ta: −40 ÷ 105 °C
RH: 0÷100%
Ta: 0.01 °C
RH: 0.01%
Ta: ±0.1 °C
RH: ±1.5%
Ta: >2 s
RH: 8 s
-4.9 × 17.8 × 2.1 mm35 €
SHTC3
[51]
Ta: −40 ÷ 125 °C
RH: 0 ÷ 100%
Ta: 0.01 °C
RH: 0.01%
Ta: ±0.2 °C
RH: ±2%
Ta: <5 s
RH: 8 s
-25.4 × 25.4 × 5 mm10 €
SCD30
[52]
Ta: −40 ÷ 70 °C
RH: 0 ÷ 100%
Ta: 0.01 °C
RH: 0.01%
Ta: ±(0.4 °C + 0.023 × (T [°C] – 25 °C))
RH: ±3%
Ta: >10 s
RH: 8 s
23.4 × 35 × 7 mm60 €
BME680
[53]
Ta: − 40 ÷ 85 °C
RH: 0 ÷ 100%
Ta: 0.01 °C
RH: 0.008%
Ta: ±0.5 °C
RH: ±3%
Ta: >10 s
RH: 8 s
-25.4 × 25.4 × 5 mm20 €
Ref
[54,55]
Ta: −40 ÷ 80 °C
RH: 0 ÷ 100%
Ta: 0.015 °C
RH: 0.1%
Ta: ±0.1 a 0 °C
RH: ±2%
Ta: <60 s
RH: <100 s
Ta: −40 ÷ 80 °C12 × 73 mm450 €
Table 2. Scenario and related variables considered.
Variable (U.M.)DescriptionScenario 1: IndoorsScenario 2: Outdoors
-Selection criteria19 °C < Ta_ref < 21 °C
35% < RH_ref < 55%
Ta_ref > 35 °C
Ta, dry bulb air temperature (°C)Count565691
Mean20.4340.03
Dev. st.0.221.59
RH, relative humidity (%)Count565 691
Mean42.11 3.30
Dev. st.5.153.64
V, air velocity (m/s)-0.11
Tr, mean radiant temperature (°C)-2135
Iclo, clothing insulation (clo)-1Default as defined by UTCI clothing model
Met, metabolic rate (met)-1Fixed value as defined by UTCI model: 2.32
Table 3. Power consumption.
SensorSupply
Voltage
[V]
Max Supply
Current
[mA]
Max Power
Consumption
[mW]
DHT2251.57.5
DHT1152.512.5
DHT2050.984.9
SHT8551.57.5
SHTC33.30.92.9
SCD303.375247.5
BME6803.31239.6
Publisher’s Note: MDPI stays neutral with regard to jurisdictional claims in published maps and institutional affiliations.

