1. Introduction
Research related to the colonization of extra-terrestrial bodies, including the Moon, is an important part of modern science efforts. Since the 1960s, around the world, procedures have been prepared (and improved) which should result in the preparation of various construction technologies that can be executed on the Moon [
1,
2]. One of the ways to make construction technologies suitable for the Moon or Mars is by preparing building materials from local raw materials (i.e., from the soil). The lunar soil is planned to be used as a basic material for protecting structures against radiation, meteorites, and thermal differences, filling 3D printed hollow elements, concrete components, etc. [
3,
4,
5]. The production of concrete-like material, which will be based on lunar rock, is the goal of long-term research by multiple teams [
6,
7,
8,
9]. It is worth considering that current construction experience is limited to the conditions on Earth. The conditions for material preparation and construction will be different on the Moon [
7,
8], due to a lack of atmosphere, extreme temperatures, and low gravitation. One of the options available in the world of construction research is the use of lunar soil simulants (LSS) [
10,
11,
12]. Previously, research has been done on an alternative in a similar ilmenite lunar aggregate simulant (LAS) [
13]. Published results have shown that the lunar ilmenite aggregate has desired properties and its production is feasible.
Closely related to the development of lunar composite materials is the improvement of non-destructive testing (NDT), which would be even more important on the Moon than it is on Earth. One of the promising NDT approaches for future lunar building materials is electrical-resistant measurements. Such measurements could provide valuable information on porosity, pore adhesion, permeability, water and gas diffusion, water content in pores, hardening, and hydration processes [
14,
15,
16,
17,
18,
19] of lunar concrete-like materials. Resistance plays an important role in the analysis of the durability of concrete structures on Earth and represents the quality of concrete [
19,
20,
21]. It should be noted that the research does not deal with the behavior of cement hydration under zero gravity but will take this into account in the future [
22].
Therefore, in this article, an analysis of electrical resistance was performed on prismatic samples of cement composites based on ordinary aggregate and lunar aggregate simulant. The first objective of the research program was to evaluate the relationship between electrical resistance and properties related to elementary strength. The second objective was to compare the results between the volumetric resistance and the surface resistance of a cement composite in the form of prismatic samples. This knowledge may be of great importance in future research related to space exploration. Since the correlation of basic properties with electrical properties is suitable for tests conducted in a vacuum, in the authors’ opinion, lunar building materials should be first tested using common NDT methods. There is a need to investigate the specifics and differences, even with ordinary NDT testing procedures. If current procedures are not suitable for lunar building materials and conditions, alternative test methods must be introduced and tested.
2. Materials
The subject of the investigation is a cement composite based on a lunar aggregate simulant. As a reference, ordinary sand-based cement composite was used. Ilmenite (titanium dioxide) sourced from the Baltic coast was chosen as LAS. It is a mineral with the idealized formula FeTiO
3. The ilmenite was obtained using magnetic separation. The ilmenite collected was kept in a freshwater tank for two weeks before being washed multiple times. In this way, the ilmenite particles used as LAS in the research program were free of any sulfate or chloride pollution. The procedure to source ilmenite and prepare LAS was thoroughly presented in a previous publication [
13]. Due to magnetic separation, LAS consisted only of ilmenite particles [
13].
This mineral is commonly present in lunar regolith and earth rocks. Ilmenite is a very dense and inert material, crushed and washed by seawater into sand-sized particles. The granulometric properties of the collected ilmenite are summarized in
Table 1, together with the properties of standardized sand and lunar soil brought about by the Apollo 11 mission. The mechanical properties of a cement compound based on LAS were thoroughly described in a previous publication [
13].
For the analysis of the proposed lunar aggregate, cement composites were cast using standardized sand and LAS. The sand used in the research program was CEN and is a quartz sand containing at least 98% silica particles. There is no natural sand available, which fulfills the particle size distributions according to EN 196-1. Therefore, CEN sand is an artificial product. It consists of several different sand-type fractions which are blended in defined portions. The particles are generally isometric and rounded in shape. A standardized mortar (used to test the properties of the cement) was used: water (225 g), cement (450 g), and standardized sand (1350 g). Because there is a difference in the density of the two aggregates, the amount of LAS needed for one dose was calculated by volume. LAS mortar: water (225 g), cement (450 g), and LAS (2394 g). Sand was completely replaced by LAS. Each batch was created using a standard mortar mixer. The mortars were prepared using the standard dosing, mixing, and the compaction procedure was used for the cement mortar tests. The mixing procedure consists of five stages. The first stage is to mix water and binder for 30 s and with 140 revolutions per minute. The second stage consists of simultaneous dosing aggregate (e.g., sand) and mixing with 140 rev./min. The third stage is to mix all mortar ingredients with a high speed of 285 rev./min. The fourth stage covers the 90 s break in mixing, which is dedicated to cleaning the walls of the mixing container and moving all the mortar remains to the bottom-center part of the mixing container. The last stage of mixing covers mixing with a speed of 285 rev./min. Three 40 mm × 40 mm × 160 mm prism samples were formed from each batch. Compaction was carried out using a jolting apparatus (two layers—60 jolts per layer). After 24 h, they were removed from the mold and tightly wrapped in a polyethene film. Samples were stored at +21 °C ± 1 °C. Prismatic samples were used for multiple tests. Strength-related tests were carried out on mature samples of the same age as resistivity tests. The samples were tested 2 years after casting to avoid the influence of any ongoing chemical activity associated with hardening of the mortars.
3. Experimental Methods
The experimental program was set up to combine destructive testing (DT) and non-destructive testing (NDT) so that relationships and correlations could be easily evaluated. The process of using samples for surface resistivity, volumetric resistivity, flexural test, and compressive strength is shown in
Figure 1.
3.1. Surface Resistivity
A Wenner probe was selected to measure electrical resistance (see
Figure 2). This measurement is based on the AASHTO T385 [
23]. A detailed description of this NDT method was provided in a previous paper [
24,
25]. This NDT method is an easily repeatable test. The results can be determined at various locations on the surface of a sample. The samples were fully saturated because they were stored in water. The preparation of samples for testing is not difficult. The samples are just pulled out of the water, the surface is dried, and the resistance is measured.
However, the results achieved using this method of testing can be characterized by relatively large variations caused by the heterogeneity of the test material and the use of rather uncontrollable contact conditions. In the case in question, four readings were obtained from each sample, resulting in a total of 12 measurements.
A cylinder sample is used as standard, but in this case, a prismatic sample was analyzed. Due to this, it is possible to obtain a ratio factor between volumetric and surface resistivity, which is established only for cylindrical samples.
3.2. Volumetric Resistivity
The RCON instrument [
26] was used to determine volumetric resistance according to ASTM C1760-12 [
27]. In
Figure 3, a harnessed laboratory setup is presented. Measurement is simple and fast. The volumetric electrical resistivity can be calculated using the registered resistivity and the size of the sample. In this case, four measurements were made on each of the samples.
3.3. Flexural and Compressive Strength
Flexural strength was determined according to the standard procedure using a prismatic sample (
Figure 1) [
28]. Flexural strength is a measure of an unreinforced concrete beam or slab to resist bending failure. Therefore, this parameter is very important for the design and structural analysis of structures.
The compressive strength was subsequently tested using the remaining half of the samples according to the standard [
29]. Measurements were made on a standard laboratory compression machine. The results were obtained from all available samples. Statistical parameters such as mean and standard deviation were evaluated.
4. Results and Discussion
4.1. Flexural and Compressive Strength
The difference in the result of the flexural strength between sand mortar and ilmenite mortar is approximately 20% (see
Figure 4a). However, the compressive strength difference is only 9% (see
Figure 4b). The standard deviation of the sand mortars was greater for both tests compared to the ilmenite mortars.
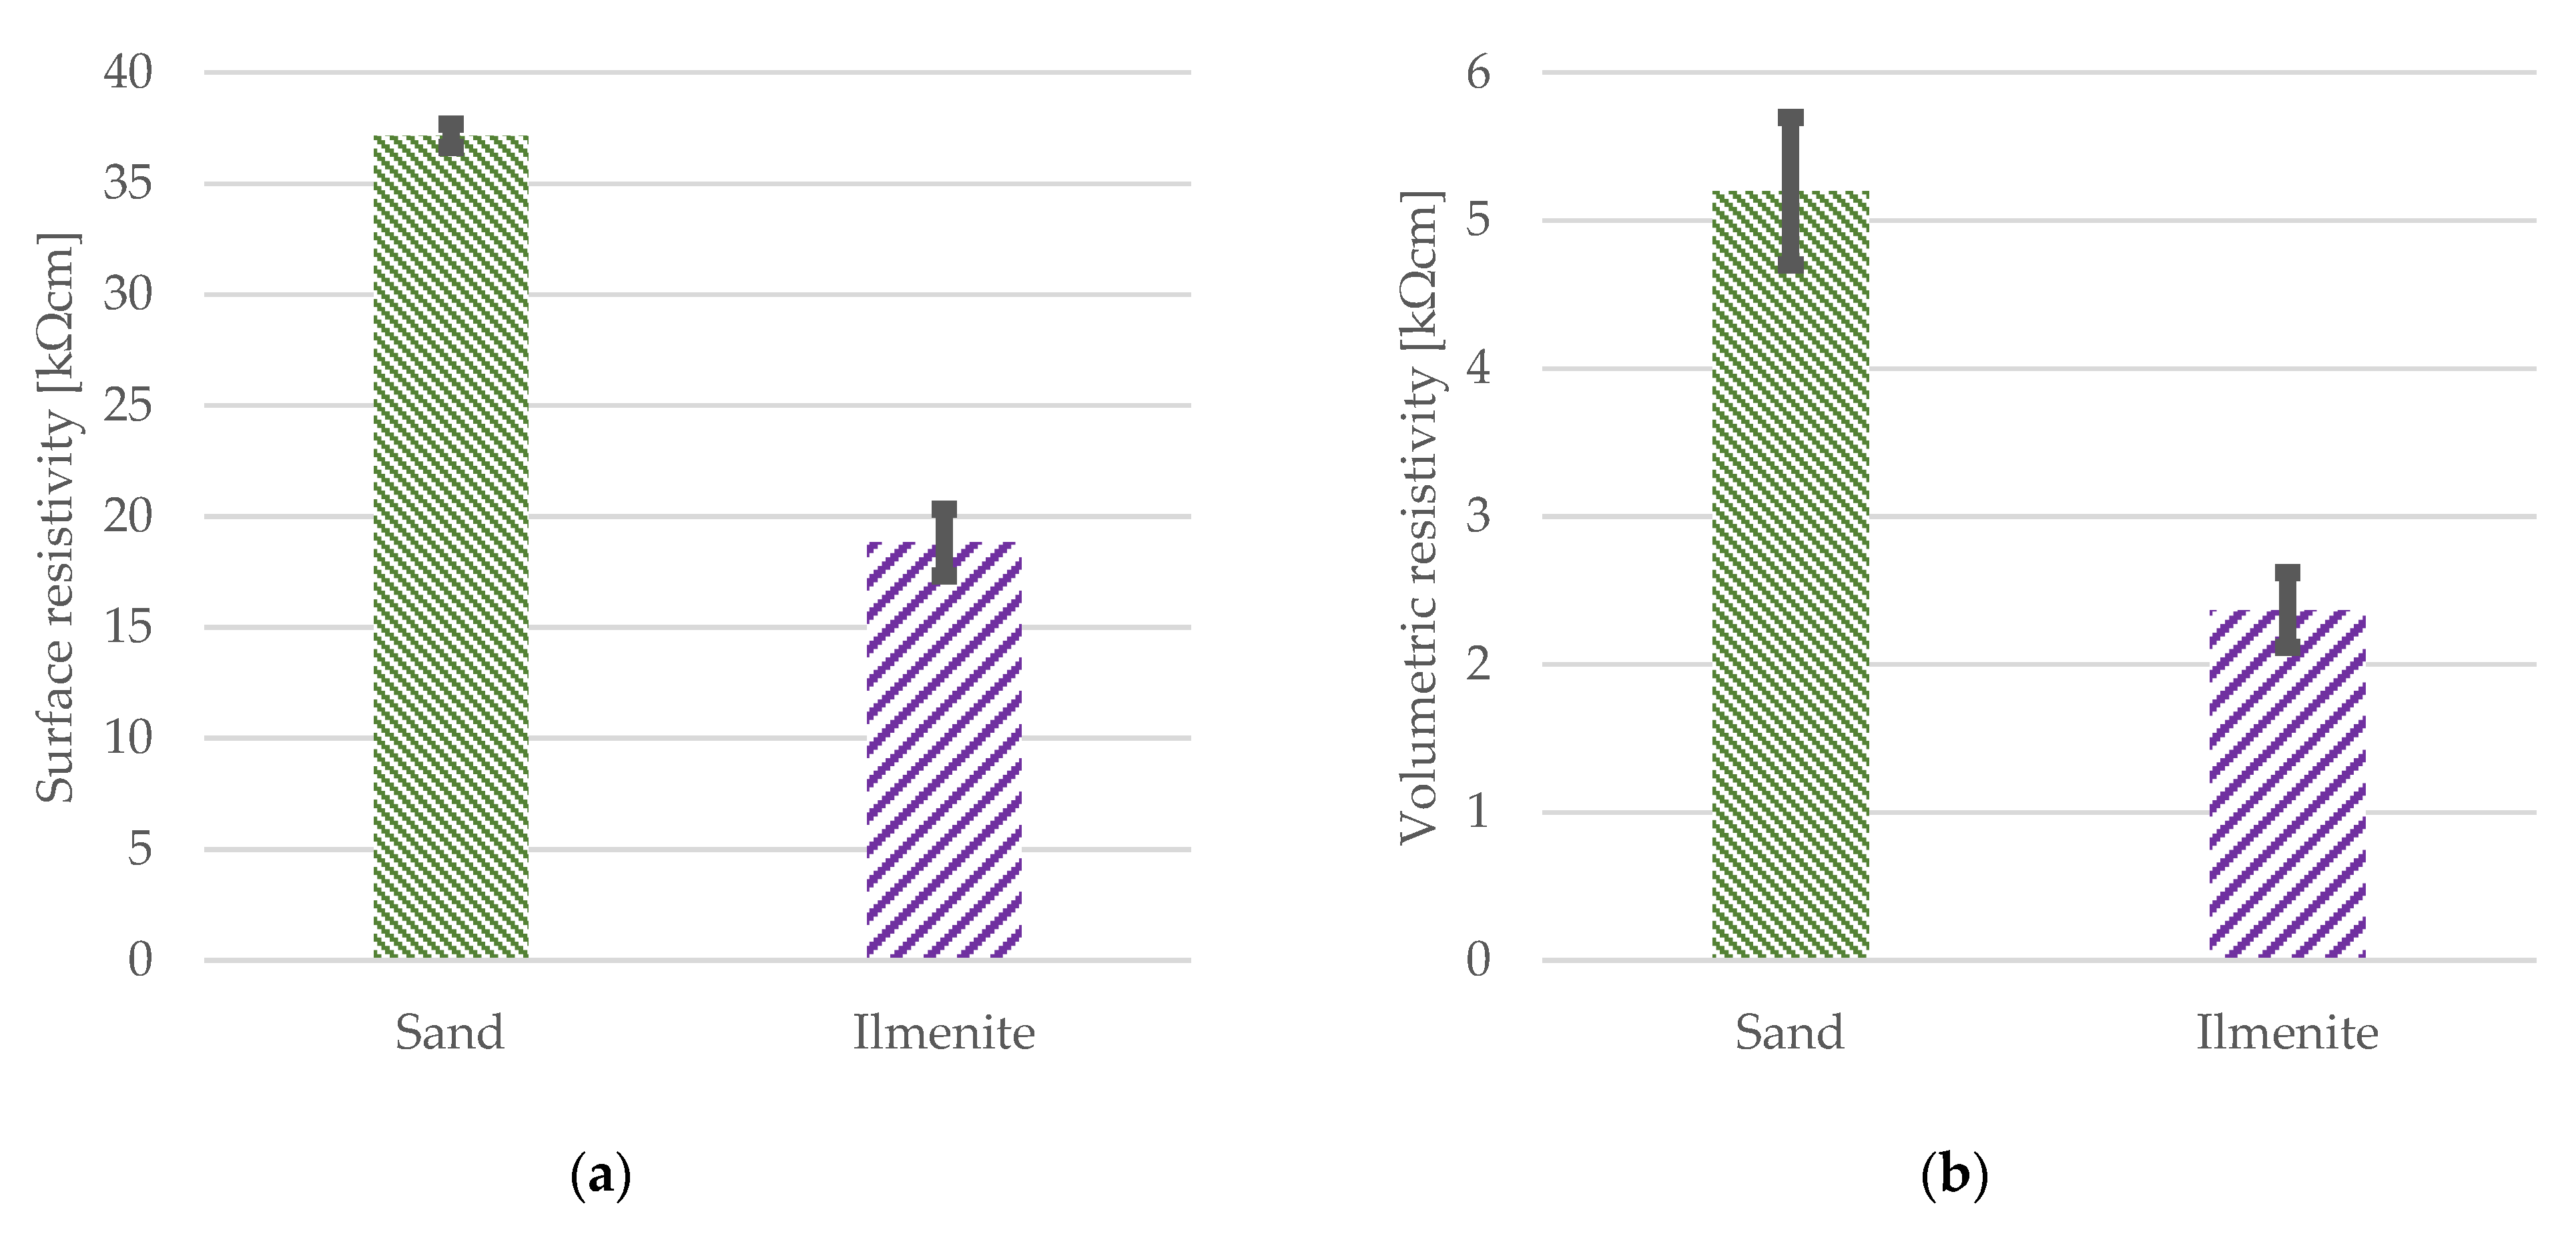
4.2. Surface and Volumetric Resistivity
For surface and volumetric resistivity, LAS samples were found to be characterized by having approximately half the resistance of a sand mortar (see
Figure 5).
It should be noted that the surface resistivity results here are not converted to bulk resistivity from the relation for the sample shape. This is unexpected, mainly from the point of view of density. Ilmenite is characterized by a density significantly higher than that of standardized sand. In the literature, composite materials have higher electrical resistance at higher strengths and lower resistance at lower strength [
30]. This phenomenon is also observed here. Another very important parameter is the ratio between the electrical resistivity of the bulk and the surface. This parameter is related to the geometry of the samples. In this case, it must be considered for 40 mm × 40 mm × 160 mm prismatic samples.
Table 2 shows the results of these ratios for mortar with sand and ilmenite. One can see that sand mortar is characterized by a ratio approximately 10% lower compared to ilmenite mortar.
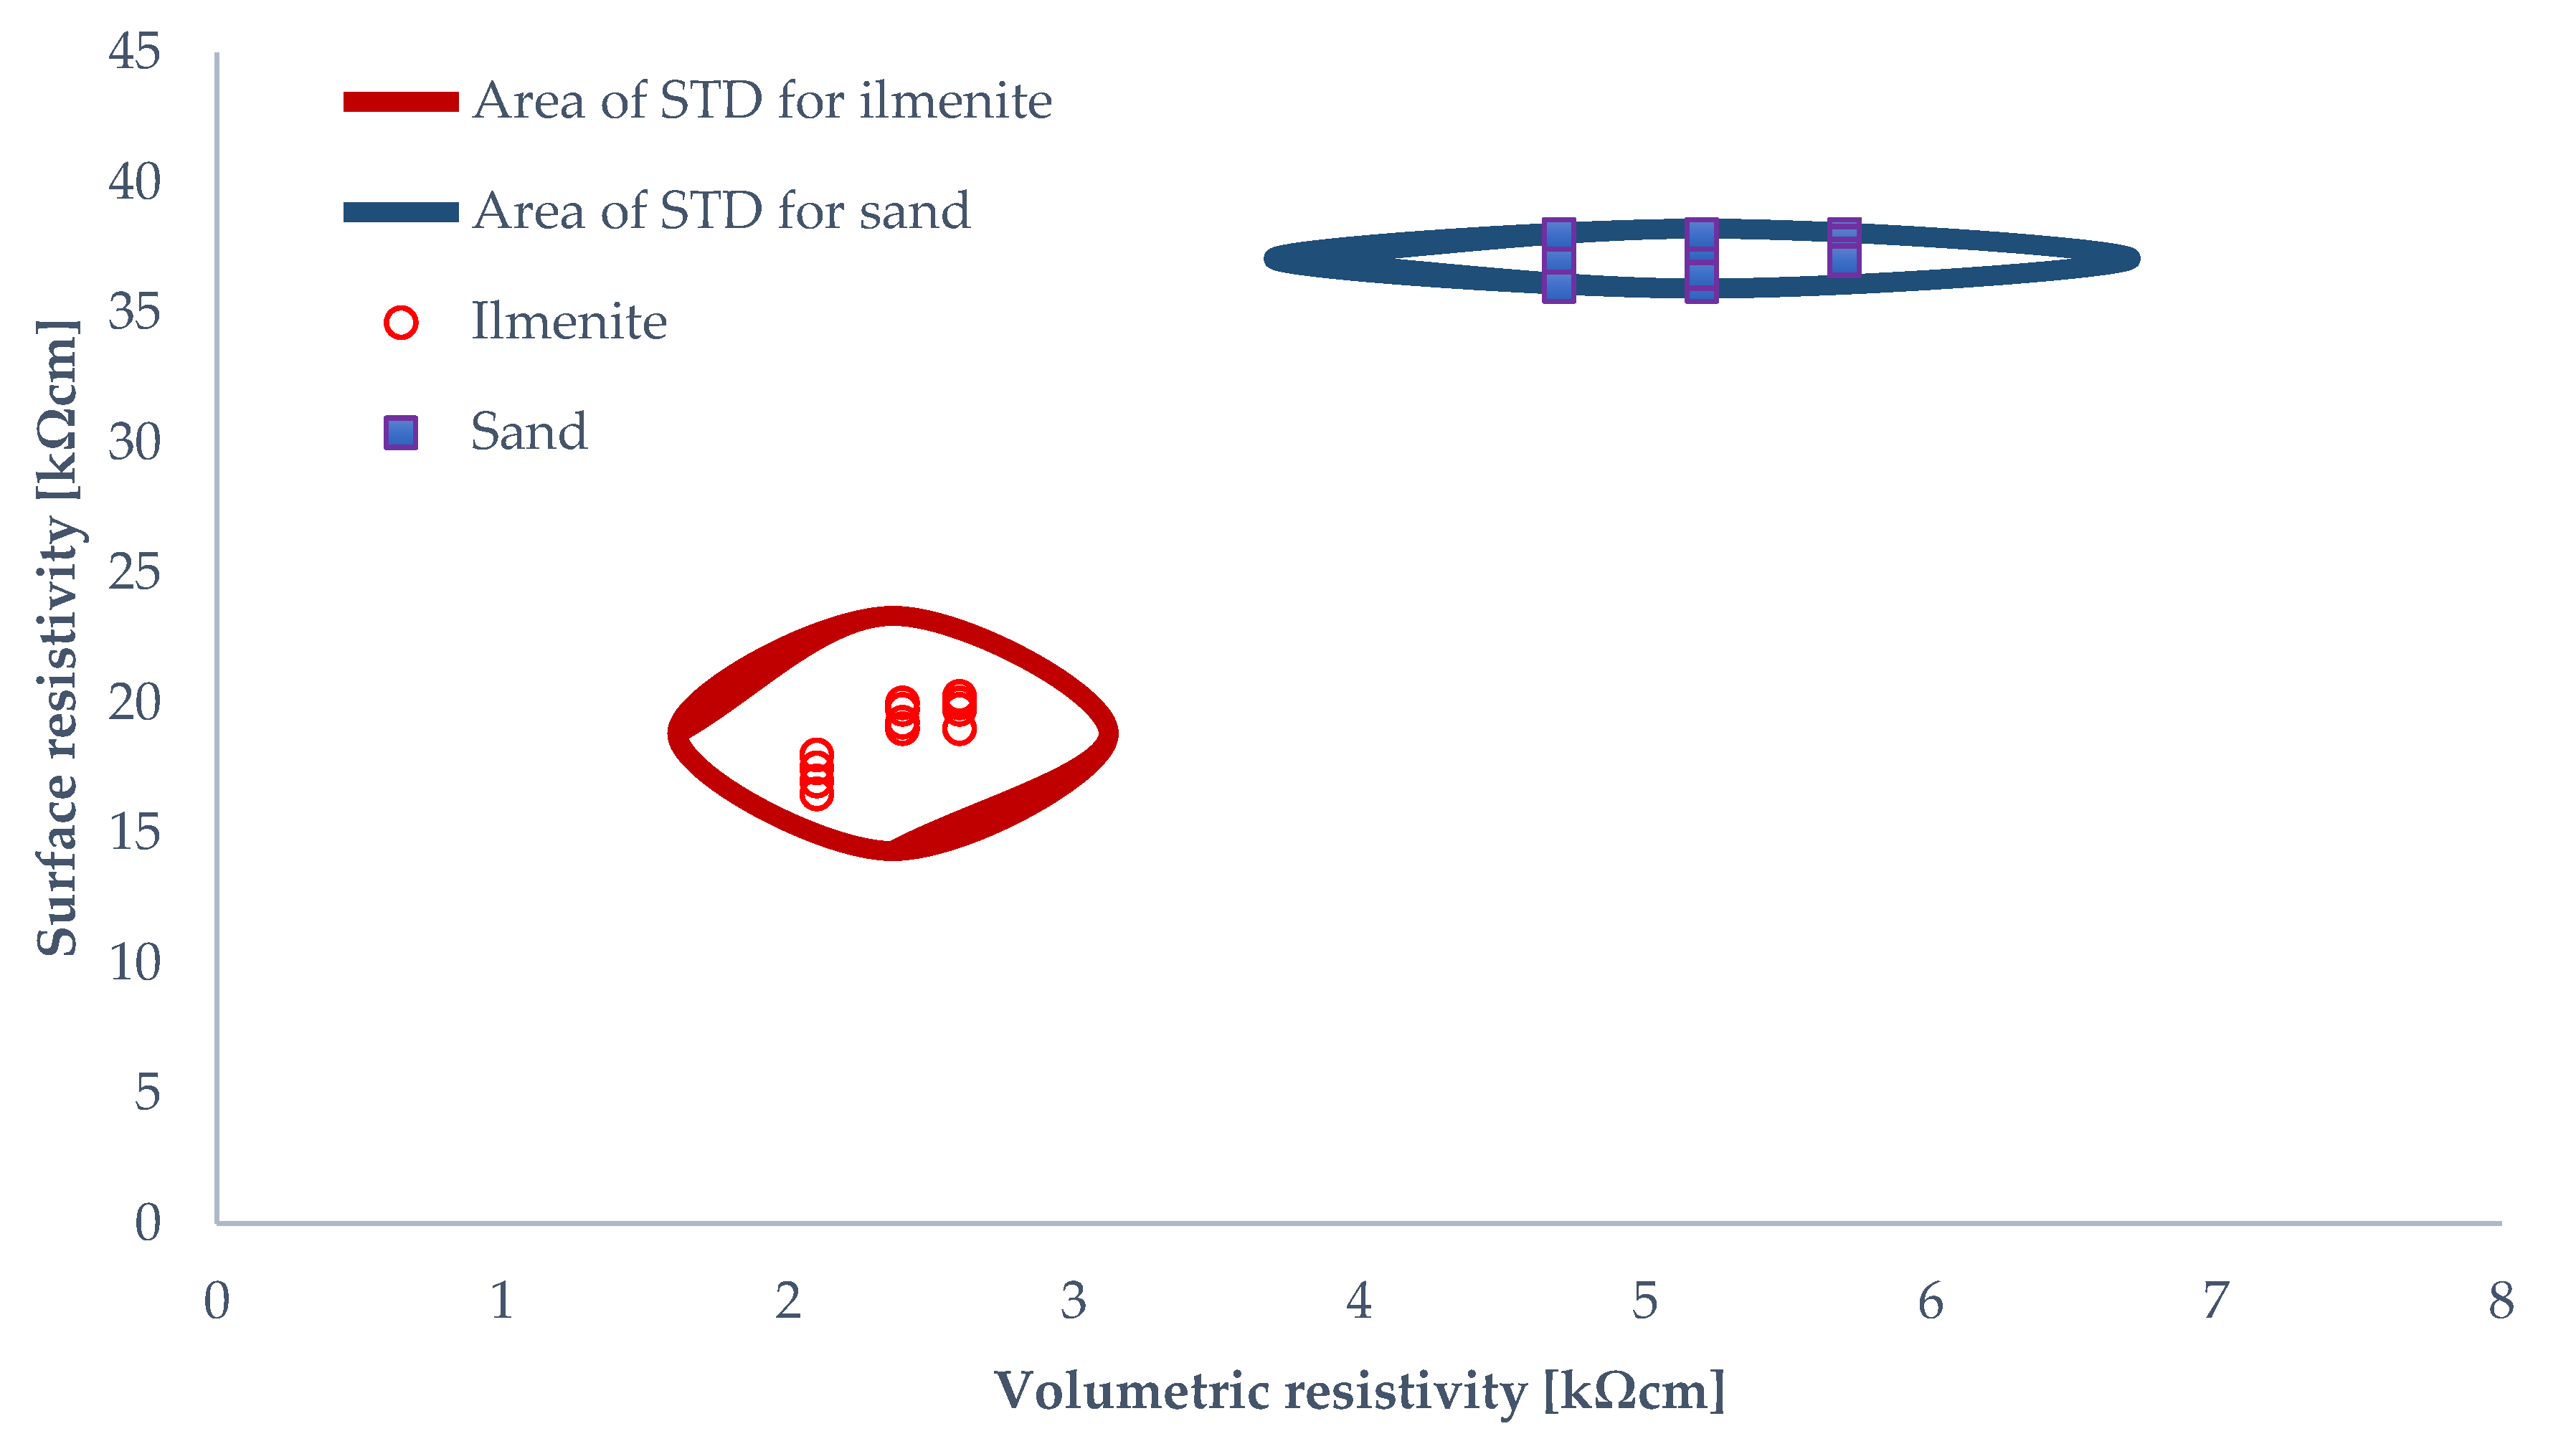
4.3. Correlation of Results
Correlation graphs for the measured values were presented as additional results. The results of the bulk and surface electrical resistivity were first analyzed (see
Figure 6). The means and standard deviations of both quantities were calculated. In
Figure 6, the regions bounded by three times the standard deviation related to both parameters are marked. Sand has a relatively wide dispersion of bulk electrical resistivity. On the contrary, the surface electrical resistivity shows very little variance. When the results of the ilmenite measurements are viewed, the region of three times the standard deviation is quite regular. For both materials, it is important that the measured data are in the region of no exceptions.
Other results are the correlations of bulk resistivity and compressive strength in
Figure 7. The measured data are in the deviation edge area.
As a final result,
Figure 8 shows the correlation and standard deviation region for bulk resistivity and density. Ilmenite has a lower resistivity despite the higher density. All the graphs show that the mortar made of sand and ilmenite behaves differently.
5. Conclusions
This work presented the application of a well-established electrical resistivity measurement to a new material prepared from lunar aggregate simulants. An experimental investigation procedure combining destructive and non-destructive methods was presented. The electrical resistivity of two different tests was compared with elementary methods for determining the strength.
One limitation of the results is the fact that we do not have enough information about the behavior of rocks on the Moon due to the reduced gravity and vacuum. These results represent a step forward in the upcoming colonisation of space, which will need support in the form of structural reliability assessment of proposed concepts of lunar habitats. Further research is needed, especially on larger prisms and standard elements, on the durability and fatigue of concrete composites based on ilmenite aggregate.
The use of electrical resistivity readings is fast, and its correlation with the strength parameters can give an idea about the quality of the material. Such a method is very practical in conditions with a harsh environment due to its simplicity and duration. Therefore, it is practical under vacuum or near-vacuum conditions. However, the lack of moisture would make the resistivity of the material very high. Therefore, higher magnitudes will be expected in the case of moon structures exposed to vacuum, and a test of the resistivity in the vacuum chamber is necessary as the next step to verify that the number of ions in the pore structure is sufficient to conduct the electricity.
Author Contributions
Conceptualization, P.L., P.K. and J.K.; methodology, P.L., P.K. and J.K.; formal analysis, P.L.; investigation, J.K.; resources, P.K. and J.K.; data curation, P.L.; writing—original draft preparation, P.L.; writing—review and editing, P.K. and J.K.; visualization, P.L.; supervision, P.K. and J.K.; project administration, P.K.; funding acquisition, P.L. All authors have read and agreed to the published version of the manuscript.
Funding
Financial support from VŠB-Technical University of Ostrava by means of the Czech Ministry of Education, Youth and Sports through the Institutional support for conceptual development of science, research, and innovations for the year 2022 as well as through the project: Science without borders 2.0 (Nr. CZ.02.2.69/0.0/0.0/18_053/0016985) is gratefully acknowledged. This research was also partially funded by National Science Centre (Poland) grant number DEC-2020/38/E/ST8/00527 Regolith harvesting on Moon surface: Excavation and beneficiation in low gravity environments.
Institutional Review Board Statement
Not applicable.
Informed Consent Statement
Not applicable.
Data Availability Statement
Not applicable.
Conflicts of Interest
The authors declare no conflict of interest.
References
- Benaroya, H.; Bernold, L. Engineering of Lunar Bases. Acta Astronaut. 2008, 62, 277–299. [Google Scholar] [CrossRef]
- Ruess, F.; Schaenzlin, J.; Benaroya, H. Structural Design of a Lunar Habitat. J. Aerosp. Eng. 2006, 19, 133–157. [Google Scholar] [CrossRef]
- Cesaretti, G.; Dini, E.; De Kestelier, X.; Colla, V.; Pambaguian, L. Building Components for an Outpost on the Lunar Soil by Means of a Novel 3D Printing Technology. Acta Astronaut. 2014, 93, 430–450. [Google Scholar] [CrossRef]
- Grugel, R.N. Integrity of Sulfur Concrete Subjected to Simulated Lunar Temperature Cycles. Adv. Space Res. 2012, 50, 1294–1299. [Google Scholar] [CrossRef]
- Pinheiro, A.S.; Da Costa, Z.M.; Bell, M.J.V.; Anjos, V.; Reis, S.T.; Ray, C.S. Thermal Characterization of Glasses Prepared from Simulated Compositions of Lunar Soil JSC-1A. J. Non-Cryst. Solids 2013, 359, 56–59. [Google Scholar] [CrossRef] [Green Version]
- Katzer, J.; Kobaka, J. Combined Non-Destructive Testing Approach to Waste Fine Aggregate Cement Composites. Sci. Eng. Compos. Mater. 2009, 16, 277–284. [Google Scholar] [CrossRef]
- Katzer, J. Median Diameter as a Grading Characteristic for Fine Aggregate Cement Composite Designing. Constr. Build. Mater. 2012, 35, 884–887. [Google Scholar] [CrossRef]
- Sik Lee, T.; Lee, J.; Yong Ann, K. Manufacture of Polymeric Concrete on the Moon. Acta Astronaut. 2015, 114, 60–64. [Google Scholar] [CrossRef]
- Toutanji, H.A.; Evans, S.; Grugel, R.N. Performance of Lunar Sulfur Concrete in Lunar Environments. Constr. Build. Mater. 2012, 29, 444–448. [Google Scholar] [CrossRef]
- Ray, C.S.; Reis, S.T.; Sen, S.; O’Dell, J.S. JSC-1A Lunar Soil Simulant: Characterization, Glass Formation, and Selected Glass Properties. J. Non-Cryst. Solids 2010, 356, 2369–2374. [Google Scholar] [CrossRef]
- Arslan, H.; Sture, S.; Batiste, S. Experimental Simulation of Tensile Behavior of Lunar Soil Simulant JSC-1. Mater. Sci. Eng. A 2008, 478, 201–207. [Google Scholar] [CrossRef]
- Wallace, W.T.; Taylor, L.A.; Liu, Y.; Cooper, B.L.; McKay, D.S.; Chen, B.; Jeevarajan, A.S. Lunar Dust and Lunar Simulant Activation and Monitoring. Meteorit. Planet. Sci. 2009, 44, 961–970. [Google Scholar] [CrossRef] [Green Version]
- Zarzycki, P.K.; Katzer, J. A Proposition for a Lunar Aggregate and Its Simulant. Adv. Space Res. 2020, 65, 2894–2901. [Google Scholar] [CrossRef]
- Whiting, D.A.; Nagi, M.A. Electrical Resistivity of Concrete—A Literature Review; Portland Cement Association: Skokie, IL, USA, 2003; p. 57. [Google Scholar]
- Andrade, C.; D’Andrea, R.; Rebolledo, N. Chloride Ion Penetration in Concrete: The Reaction Factor in the Electrical Resistivity Model. Cem. Concr. Compos. 2014, 47, 41–46. [Google Scholar] [CrossRef]
- Veselý, V.; Konečný, P.; Lehner, P.; Pieszka, D.; Žídek, L. Electrical Resistivity and Ultrasonic Measurements during Sequential Fracture Test of Cementitious Composite. Frat. Integrita Strutt. 2014, 30, 263–272. [Google Scholar] [CrossRef] [Green Version]
- Abad Zapico, L. Experimental Investigation on Electrical Resistivity of SFRC. Master’s Thesis, Chalmers University of Technology, Gothenburg, Sweden, 2015. [Google Scholar]
- Cosoli, G.; Mobili, A.; Tittarelli, F.; Revel, G.M.; Chiariotti, P. Electrical Resistivity and Electrical Impedance Measurement in Mortar and Concrete Elements: A Systematic Review. Appl. Sci. 2020, 10, 9152. [Google Scholar] [CrossRef]
- Azarsa, P.; Gupta, R. Electrical Resistivity of Concrete for Durability Evaluation: A Review. Adv. Mater. Sci. Eng. 2017, 2017, 8453095. [Google Scholar] [CrossRef] [Green Version]
- Horňáková, M.; Lehner, P. Relationship of Surface and Bulk Resistivity in the Case of Mechanically Damaged Fibre Reinforced Red Ceramic Waste Aggregate Concrete. Materials 2020, 13, 5501. [Google Scholar] [CrossRef]
- Tran, Q. Investigation of Durability and Compressive Strength of HPC Mixtures and Modeling the Corrosion Initiation Time through the Electrical Resistivity; California State University: Long Beach, CA, USA, 2015. [Google Scholar]
- Neves, J.M.; Grugel, R.N.; Scheetz, B.E.; RadljDska, A. Experimental Investigation of Cement Hydration in Gravity-Free Environment. In Proceedings of the International Congress on the Chemistry of Cement, Prague, Czech Republic, 16–20 September 2019. [Google Scholar]
- AASHTO T358; AASHTO T358—Standard Method of Test for Surface Resistivity Indication of Concrete’s Ability to Resist Chloride Ion Penetration. AASHTO: Washington, DC, USA, 2013.
- Lehner, P.; Turicová, M.; Konečnỳ, P. Comparison of Selected Methods for Measurement of the Concrete Electrical Resistance to Chloride Penetration. ARPN J. Eng. Appl. Sci. 2017, 12, 937–944. [Google Scholar]
- Lehner, P.; Konečný, P.; Ponikiewski, T.; Konecny, P.; Ponikiewski, T. Experimental and Numerical Evaluation of SCC Concrete Durability Related to Ingress of Chlorides. AIP Conf. Proc. 2018, 176, 150012. [Google Scholar]
- Manual for RCON Giatec Scientific. Available online: https://www.giatecscientific.com/products/concrete-ndt-devices/rcon-bulk-resistivity/ (accessed on 28 April 2021).
- Test, C.C.; Cabinets, M.; Rooms, M.; Test, C.C.; Drilled, T.; Ag, C. ASTM Standard C1760; Standard Test Method for Bulk Electrical Conductivity of Hardened Concrete. ASTM: West Conshohocken, PA, USA, 2012; Volume i, pp. 1–5.
- EN 12390-5; Testing Hardened Concrete—Part 5: Flexural Strength of Test Specimens. European Committee for Standardization: Brussels, Belgium, 2009; pp. 1–22.
- EN 12390-3; Testing Hardened Concrete Part 3: Compressive Strength of Test Specimens. European Committee for Standardization: Brussels, Belgium, 2002.
- Hrabová, K.; Lehner, P.; Ghosh, P.; Konečný, P.; Teplý, B. Sustainability Levels in Comparison with Mechanical Properties and Durability of Pumice High-Performance Concrete. Appl. Sci. 2021, 11, 4964. [Google Scholar] [CrossRef]
| Publisher’s Note: MDPI stays neutral with regard to jurisdictional claims in published maps and institutional affiliations. |
© 2022 by the authors. Licensee MDPI, Basel, Switzerland. This article is an open access article distributed under the terms and conditions of the Creative Commons Attribution (CC BY) license (https://creativecommons.org/licenses/by/4.0/).


