Article

Assessment of Strength Reduction Factor on Concrete Moment Frames According to the New Venezuelan Seismic Code

by
Ramón Mata-Lemus
1,
Ahmad Idrees-Rustom
2,
Javier Sánchez-Rodríguez
2,
Ronald Torres-Moreno
2,
Eduardo Nuñez-Castellanos
1,* and
Guillermo Bustamante-Laissle
1
1
Departamento de Ingeniería Civil, Universidad Católica de la Santísima Concepción, Concepción 4030000, Chile
2
Materials and Structural Models Institute, Faculty of Engineering, Universidad Central de Venezuela, Caracas 1051, Venezuela
*
Author to whom correspondence should be addressed.
Buildings 2022, 12(3), 255; https://doi.org/10.3390/buildings12030255
Submission received: 21 December 2021 / Revised: 14 February 2022 / Accepted: 16 February 2022 / Published: 22 February 2022
(This article belongs to the Collection Advanced Concrete Structures in Civil Engineering)

Abstract

:
Nonlinear static analysis is a validated tool for the seismic evaluation of existing and new structures, specifically for reinforced concrete buildings. In order to assess the performance of reinforced concrete frames designed according to the new Venezuelan seismic code, configurations of low-, medium-, and high-rise concrete buildings are subjected to 20 different load patterns considering the nonlinear behavior according to FEMA P695. A total of 140 concrete frame models were analyzed using modal response spectrum analysis and nonlinear static pushover analysis. The parameters considered for analyzing the models were the response reduction factor (R), the overstrength factor (RΩ), and the ductility factor (Rµ). The results showed a performance controlled by ductile failure mechanisms in low-rise models unlike combined failure mechanisms with columns with plastic hinge in high-rise models. Reduction factor values between 4 and 14 were obtained. In addition, the pushover curves were affected by the load patterns; therefore, it was necessary to identify the representative patterns, refusing the rest of the patterns. A statistical adjustment was performed using a log-normal distribution. The strength reduction factor specified in the new Venezuelan code was higher than the values obtained for the 95% confidence levels according to the distribution assumed in the reinforced concrete frames models. Finally, the strength reduction factor more representative is R = 4.

1. Introduction

The static pushover analysis is a validated tool for the seismic evaluation of existing and new structures. The expectation is that the pushover analysis will offer adequate information on the seismic demands imposed by the design ground motion on the structural system [1]. Furthermore, the seismic evaluation of buildings will require the use of its nonlinear response. The nonlinear response can be estimated from pushover analysis, also referred to as nonlinear static analysis. In this method, the structure is subjected to incremental lateral loads, and the nonlinear behavior is obtained from the analysis by updating the stiffness matrix at each load increment [2]. Other analysis methods, such as incremental dynamic analysis (IDA), require input accelerograms for high intensities, which are rare in the databases, while scaling of generated accelerograms with a simple increment of the scaling acceleration is not appropriate. Additionally, the IDA is by its nature time-consuming and not straightforward [3].
The quantification of damage to structures subjected to earthquakes is an interesting issue that researchers have attempted to study. Whereas many damage indices have been introduced based on nonlinear dynamic analysis, the computational effort, calculus complicacy, and time-consuming nature of this analysis are the main drawbacks to the widespread use of these indices [4]. For this reason, the use of pushover analysis is a procedure mainly employed to obtain the nonlinear response of structures. A brief summary of the use of the pushover analysis is presented below.
The research conducted in [5] studied the pushover procedure on asymmetric, single-story, reinforced concrete buildings using inelastic dynamic eccentricities. In this study, the floor lateral forces of the pushover procedure were applied eccentrically to the mass centers. A six-story, asymmetric, torsionally sensitive, reinforced concrete building was examined to verify the proposed pushover procedure relative to the results of nonlinear dynamic analysis. The results obtained indicate that the proposed pushover procedure can predict the seismic ductility demands at the flexible and stiff sides. The study performed in [6] researched the seismic behavior of irregularly unreinforced masonry buildings, focused on evaluating higher modes. The results showed that the method was able to simulate correctly the seismic behavior of irregular masonry buildings.
On the other hand, the research performed in [7] proposed an enhanced pushover analysis method that applied distributed horizontal and vertical inertial forces to simulate the behavior of underground structures. The results showed that the proposed method can correctly predict the structure’s peak axial force, bending moment, and displacement under the combined action of the horizontal and vertical ground motions. Past seismic events have highlighted the vulnerability of masonry towers that have exhibited severe structural and nonstructural damage or even collapse. The investigation performed in [8] studied those aspects by exploring the limitations and possibilities of conceiving pushover analysis in the finite element method environment. Three representative geometrical towers, adopting three different materials and five different load patterns, were investigated in this study. The load pattern’s role and the necessity of the displacement-like control approach for the pushover analysis were exploited. This paper highlights the overestimation of the load-bearing capacity when force controls are implemented.
In the research performed in [9], large-scale E-Defense shaking table tests were performed using a 3 × 3 pile group in dry sand layers to clarify the dynamic lateral pile behavior in a group. To evaluate the pile response in a group, a new static pushover analysis of pile groups considering soil deformation in the vicinity of piles was developed. The estimated pile response showed reasonable agreements with the experimental results obtained. The proposed method could help better estimate pile response during earthquakes.
The research conducted in [3] studied incremental modal pushover analysis (IMPA), and a pushover-based approach already proposed and applied to buildings by the same authors was revised and proposed for bridges (IMPA beta). Pushover analysis considers the effects of higher modes on the structural response. The change in the input spectrum required by IMPA is simple. The results obtained showed a good adjustment on IDA analysis. The evaluation of the maximum and cumulative responses is an important issue for the seismic design of new base-isolated buildings. In the research performed in [10], predictions of the maximum and cumulative responses of a 14 story reinforced concrete base, isolated building using pushover analyses were completed. The results showed that the responses predicted by the proposed pushover analyses had acceptable accuracy.
A new lateral load pattern was presented in [11] to improve the accuracy of conventional pushover analysis (CPA) procedures for evaluating the seismic behaviors of asymmetrical, multistory plan buildings. The results indicated that the new lateral load pattern agreed well with the NTHA procedure. The proposed SPA procedure shows its efficiency and overcomes the limitations of current extended pushover methods to assess the seismic responses of asymmetrical-plan structures.
According to the research performed in [12], a new seismic design method for regular space steel frames using inelastic pushover analysis was completed. An advanced static finite element analysis that considers geometrical and material nonlinearities and member and frame imperfections is used in this method. A numerical example dealing with the seismic design of a bay in both horizontal directions and a three-story steel moment-resisting frame is presented to illustrate the method and demonstrate its advantages.
The research conducted in [13] proposed an improved pushover analysis model for the pile group foundation with consideration of the pile group effect. The improved model uses simplified springs to simulate the soil lateral resistance, side friction, and tip resistance. A case study for the pile group foundation of a simple supported railway bridge with a 32 m span was conducted by numerical analysis. It was shown that the ultimate lateral force of the pile group was not determined by the yielding force of the single one in these piles. Therefore, the pile group effect is essential for the seismic performance evaluation of the railway bridge with pile group foundation.
An investigation performed in [4] focused on the quantification of the damage in shear wall reinforced concrete frames based on pushover analysis as a procedure that can reproduce the behavior of structures from elastic to failure. To confirm the validity of the proposed relations, the values of the Park and Ang damage index of three new SWRCFs were learned when utilizing nonlinear dynamic analysis and, again, applying the introduced relations. Consequently, for the simplicity of nonlinear static pushover analysis compared to nonlinear dynamic analysis, the study of this technique has been the subject of many investigations in recent years, which obtained good results [14].
Indonesia has frequently suffered from major earthquake damage over the past 50 years. There are thousands of buildings in earthquake regions that still need seismic evaluation and rehabilitation. The research conducted in [15] describes a proposal to obtain a basic seismic index using pushover analysis. Its adjustment to determine a seismic demand index by considering seismic hazards in Indonesia was carried out using the capacity spectrum method. The proposal of the seismic index method can be useful in determining the performance index of existing structures. The study conducted in [16] focused on quantifying the seismic response parameters of steel diagrid structural systems. FEMA P695 [17] recommends a methodology for establishing seismic performance factors (SPFs). The results showed that the R factors obtained through the SPA procedure for steel diagrid systems were conservative, and the proposed method simplified the prediction of the collapse capacity of diagrid models.
The reduction in the seismic demand in the seismic design of building structures based on the inelastic and structural capacity of the structures was performed using the reduction factor (R). According to FEMA P695 [17], the relationship between maximum base shear force from the elastic analysis and design base shear is generally known as the reduction factor. Furthermore, factors, such as ductility achieved by the system, fundamental period, hysteretic model, damping factor, and the P-delta effect, are strongly influential in the determination of the R factor [18].
As mentioned above, it is evident that the use of pushover analysis in the evaluation of the performance of structures is currently a reliable and widely used method. Furthermore, numerous proposals in asymmetric structures, different materials (masonry, steel), and underground structures have been studied for improving their application. However, for concrete frame structures without irregularities, the methods established in the current codes are a valid alternative. For this reason, it was used in this research as a nonlinear analysis technique. Finally, none of the studies mentioned above provide parameters for the quantification of seismic design, which are necessary for structural engineers responsible for carrying out the designs.
In this research, the nonlinear static analysis (pushover) method was used in the seismic assessment of reinforced concrete frames designed according to the new Venezuelan code COVENIN 1756-1 [19] to quantify the response reduction factor (R), the overstrength factor (RΩ), and the ductility factor (Rµ). Subsequently, these factors were compared with similar factors established in the Venezuelan code [19]. Therefore, it was possible to identify the most representative load pattern to evaluate designs made with the response reduction factors established in the Venezuelan code.
The methodology used follows the procedures established in FEMA P695 [17]. Finally, due to the complexity in obtaining typical seismic records of Venezuelan earthquakes, nonlinear dynamic analysis was not performed in this investigation. For this purpose, reinforced concrete frames were evaluated with 2, 4, 8, 12, 16, 20, and 24 story levels subjected to 20 different load patterns according to ATC-40 [20], FEMA 356 [21], and Khoshnoudian et al. [22]. A total of 140 models were analyzed, and the results obtained are reported and discussed in the next sections.

2. Design of Concrete Moment Frames

Linear analysis is the most important analysis method used to perform the seismic design and evaluation of reinforced concrete buildings. A linear analysis was performed according to ASCE 41 [23], which allowed for the assessment of building structures employing linear methods such as the modal response spectrum analysis. In this sense, the concrete moment frames (CMFs) designed in this paper were explored according to [19] using a modal response spectrum analysis in the elastic range. In addition, the structural elements were designed complying with the specifications of ACI 318 [24] and the new Venezuelan code [19].

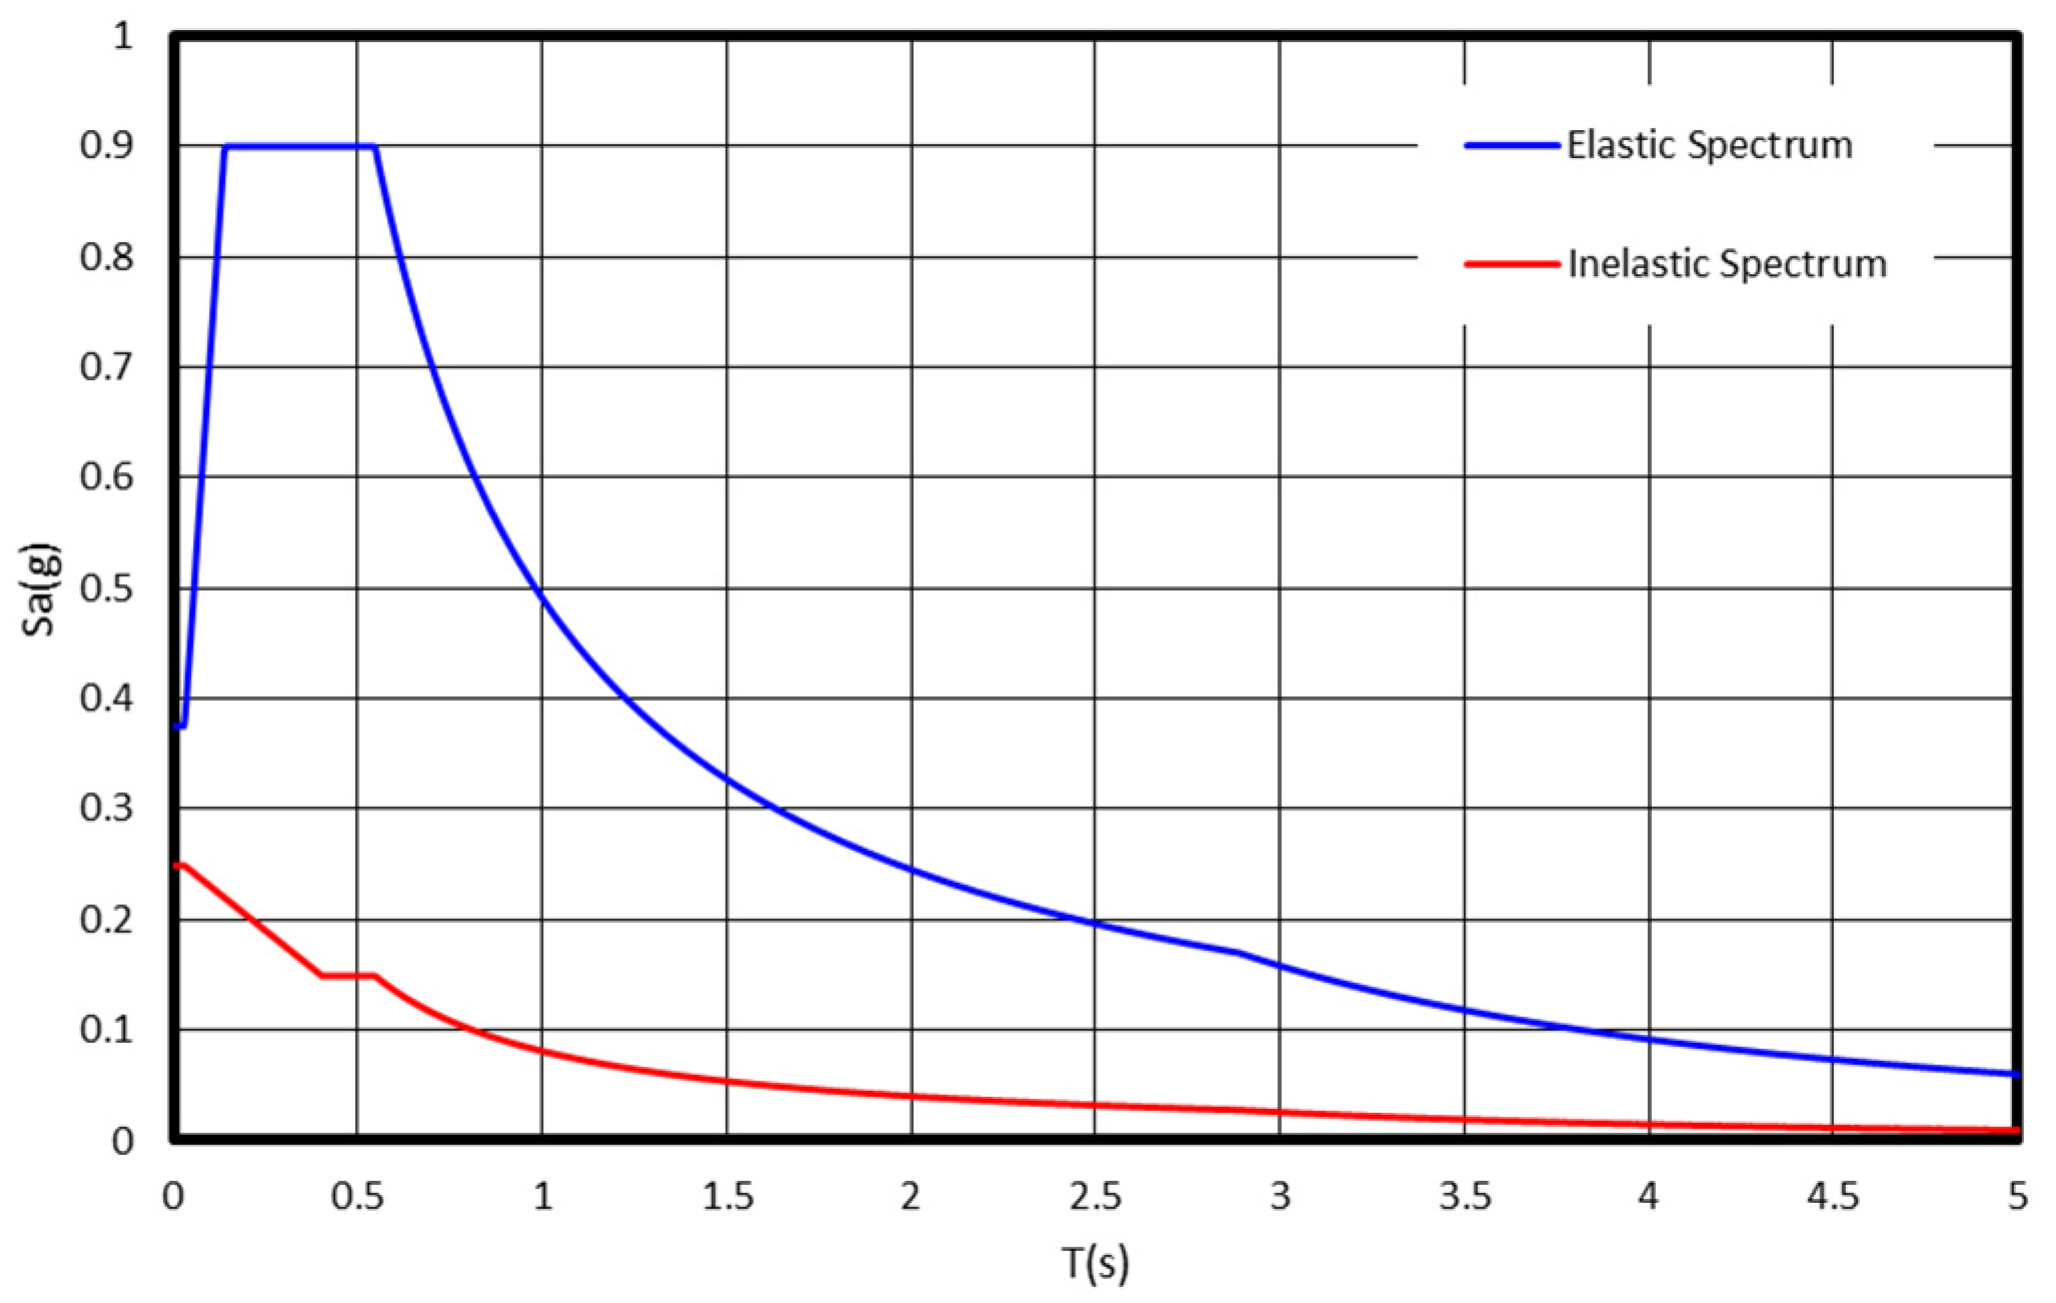
2.1. Response Spectrum Analysis

A seismic design with modal response spectrum analyses (MRSAs) of the prototype models was performed according to COVENIN 1756-1 [19]. Loads, load combinations, story drift limits, and the design spectrum were obtained from this standard. The characteristics of the models, loads, and results are described here. The MRSA is an approach commonly used in routine design. The results of an MRSA design are dependent of the response reduction factor (R), which permits to suitably scale the elastic response spectrum, obtaining the design response spectrum. In Figure 1, both spectra curves in terms of Sa/g versus T are reported, where the acceleration (Sa) was normalized by the acceleration of gravity (g) versus the period of the structure (T).
Furthermore, the response reduction factor value established in COVENIN 1756-1 [19] for concrete buildings with special moment frames is R = 6, assuming compliance with the seismic design detailing correspondence to the special level. The MRSA is based on vibration modes, eigenvalue and elastic behavior. The importance of each mode depends on the participative mass and the number of modes to be considered. The number of modes must be sufficient to reach 90% of the total mass on each main direction and the complete quadratic combination rule (CQC) was applied.

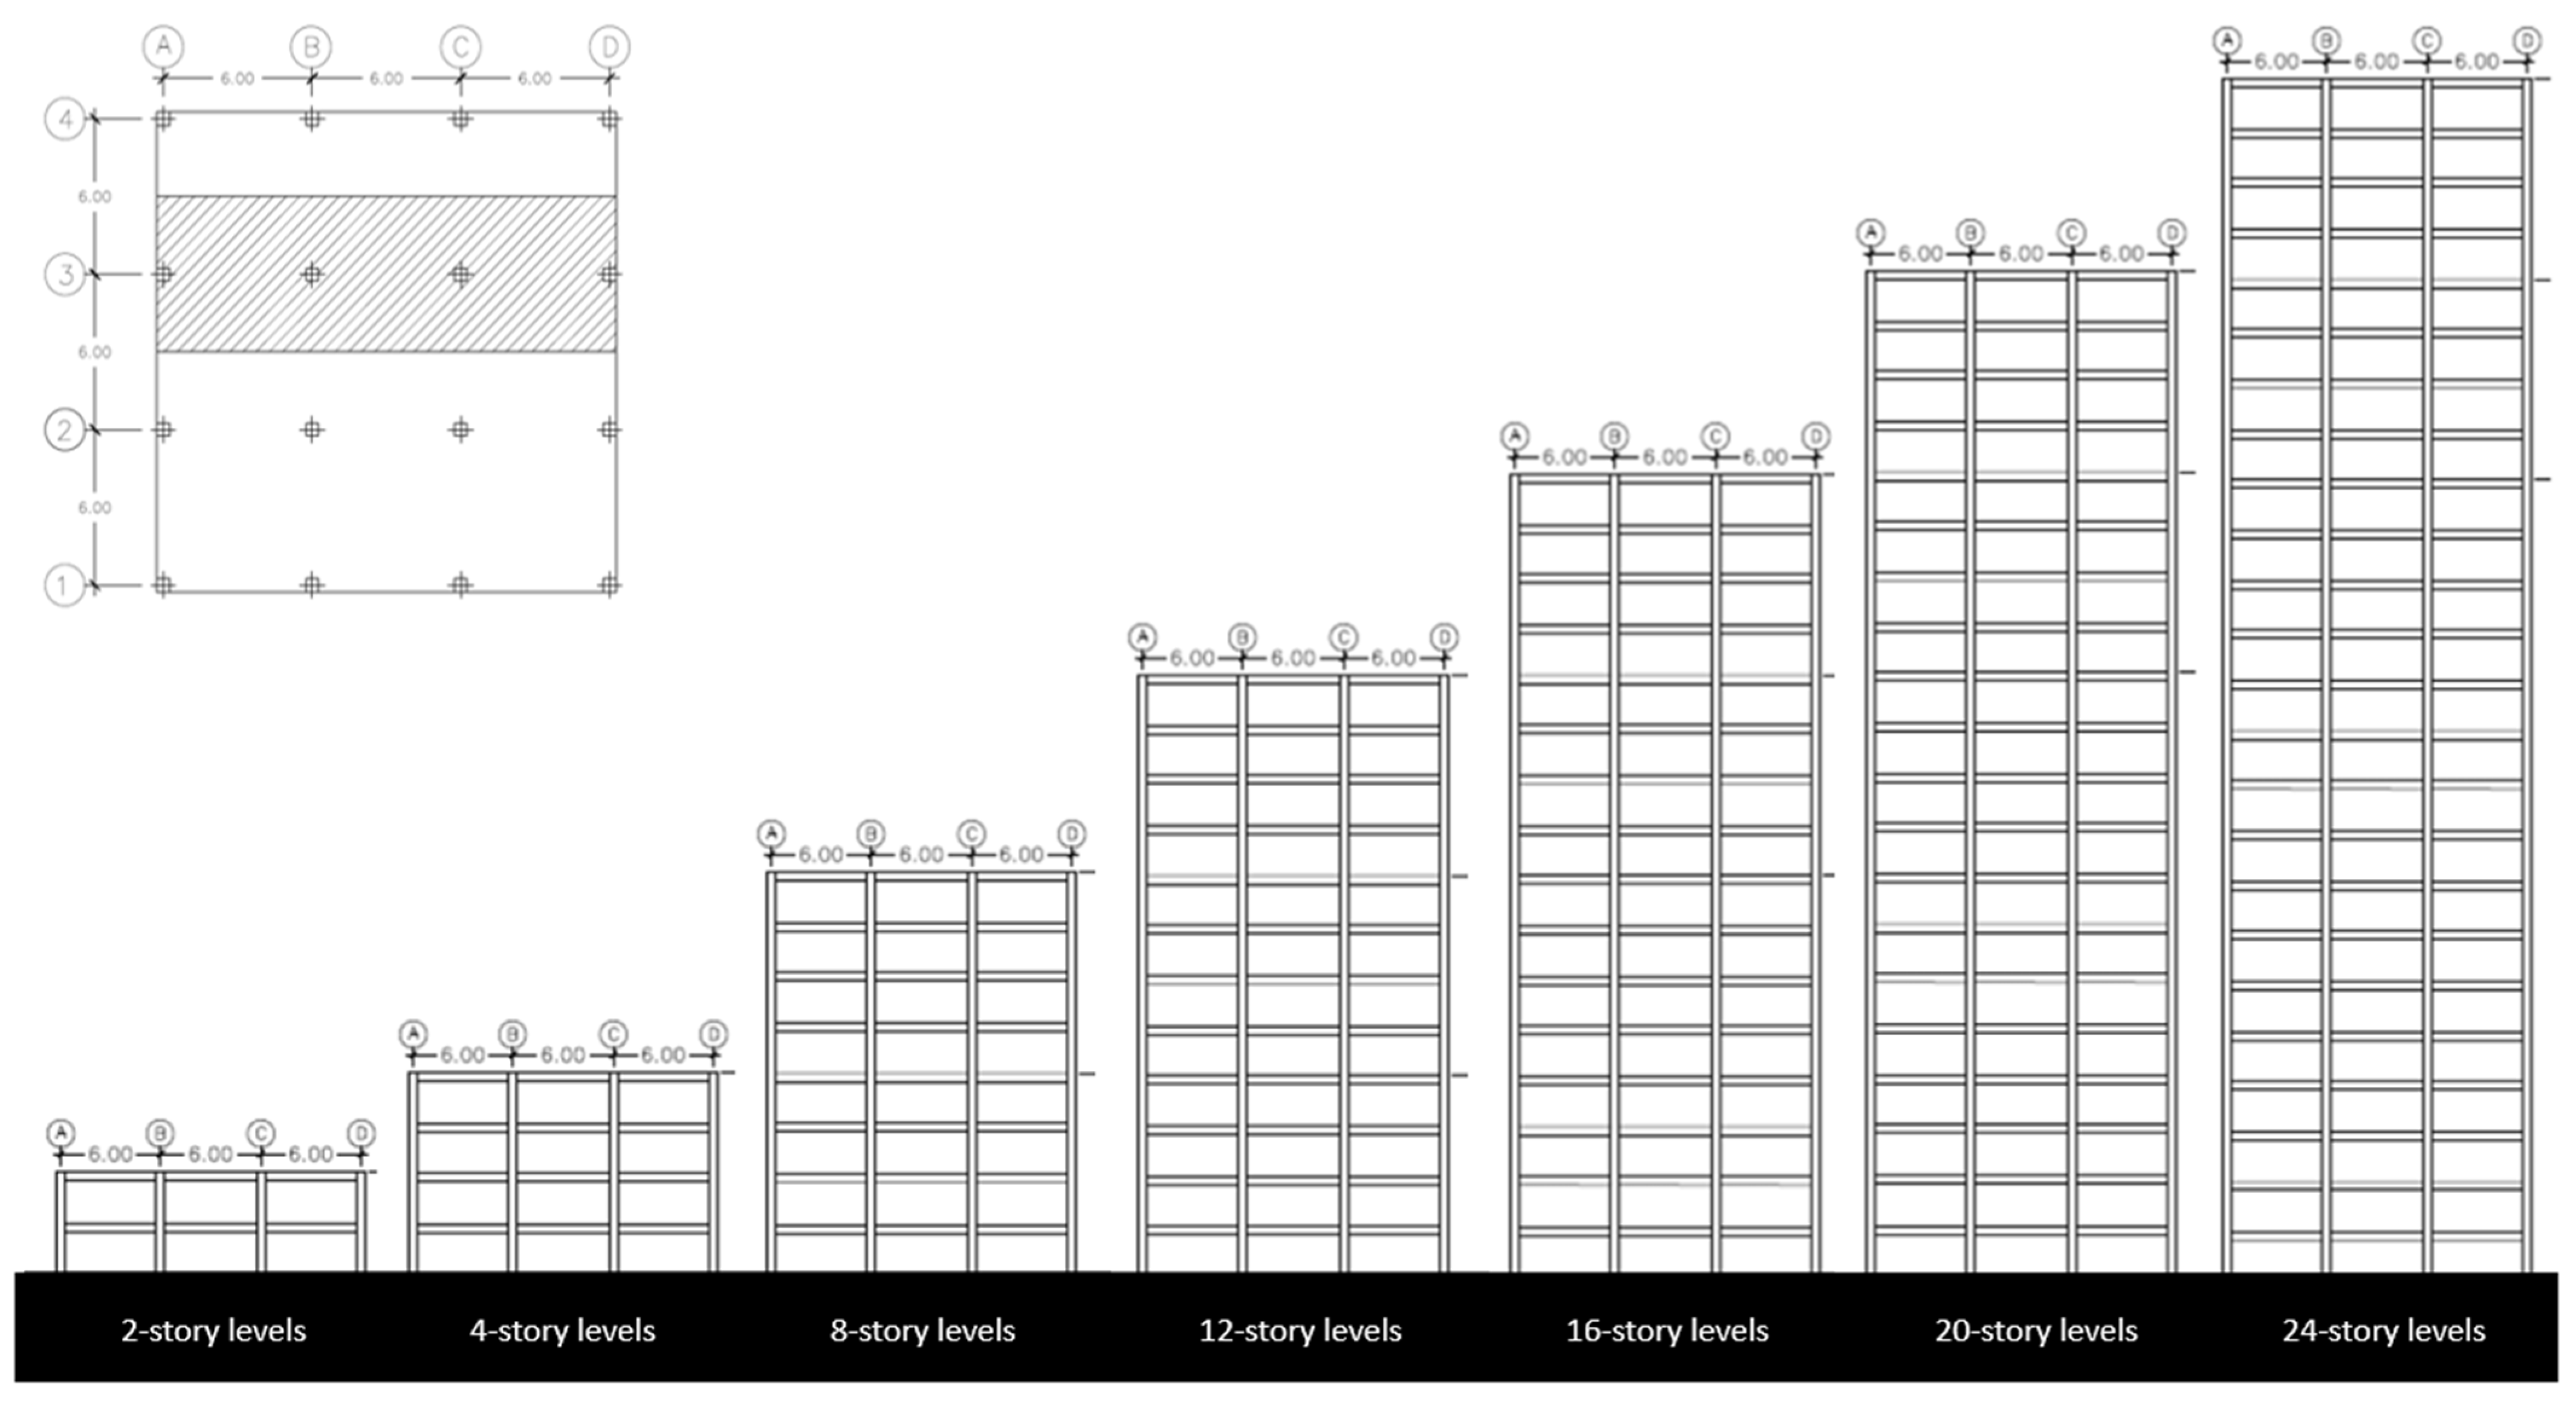
2.2. Description of the Numerical Model

The models studied were obtained from plane frames contained in a 3D configuration. In Venezuela, the typical residential or office building configurations are concrete moment frames with 3 spans in a direction with a length of 3–6 m. In this case, the models assumed were configured from concrete moment frames with 3 spans in the longitudinal direction for 6 m and different story levels (typical story height = 3.00 m). In Figure 2, a schematic view of the plane models is shown. The concrete moment frames were modeled using the software SAP2000 v23 [25]. The members were modeled using frame elements with two end nodes and six degrees of freedom per node. The base connections were idealized as fully restrained base columns and the loads distributed along of beam elements. The second-order effects were considered with P-delta plus large displacements analysis, introducing a previous nonlinear case. All load cases were analyzed from this P-delta case. A concrete compressive strength of 25 MPa with a Young’s modulus of E = 24,000 MPa and a grade 60 steel reinforcement with E = 200,000 MPa were assumed in all numerical models.
According to ASCE 41 [23] and Birely et al. [26], the stiffnesses of the cracked beams, columns, and joints must be appropriately modeled, because these stiffnesses determine the resulting building periods, base shear, story drifts, and internal force distributions. Therefore, for a strong-column/weak-beam design, a full rigid offset length was used in columns, and no rigid offsets were used in the beams.
The floor and roof dead loads consisted of the weights of the concrete members and concrete slab (ribbed slab concrete with a thickness of 0.25 m ≈ 3 kN/m2). Superimposed dead loads were taken as 3.6 kN/m2 for floors and 1.2 kN/m2 for the roof, equivalent to electrical, plumbing, and miscellaneous dead loads. The design live load (unreduced) was 3 kN/m2 for floors and 1 kN/m2 for the roof, according to the Venezuelan code. The mass source was considered as 100% dead loads and 50% live loads. Regarding seismic loads, one seismic zone (Ao = 0.3 g) and one soil type B was adopted, with Vs30 between 850 and 1300 m/s.

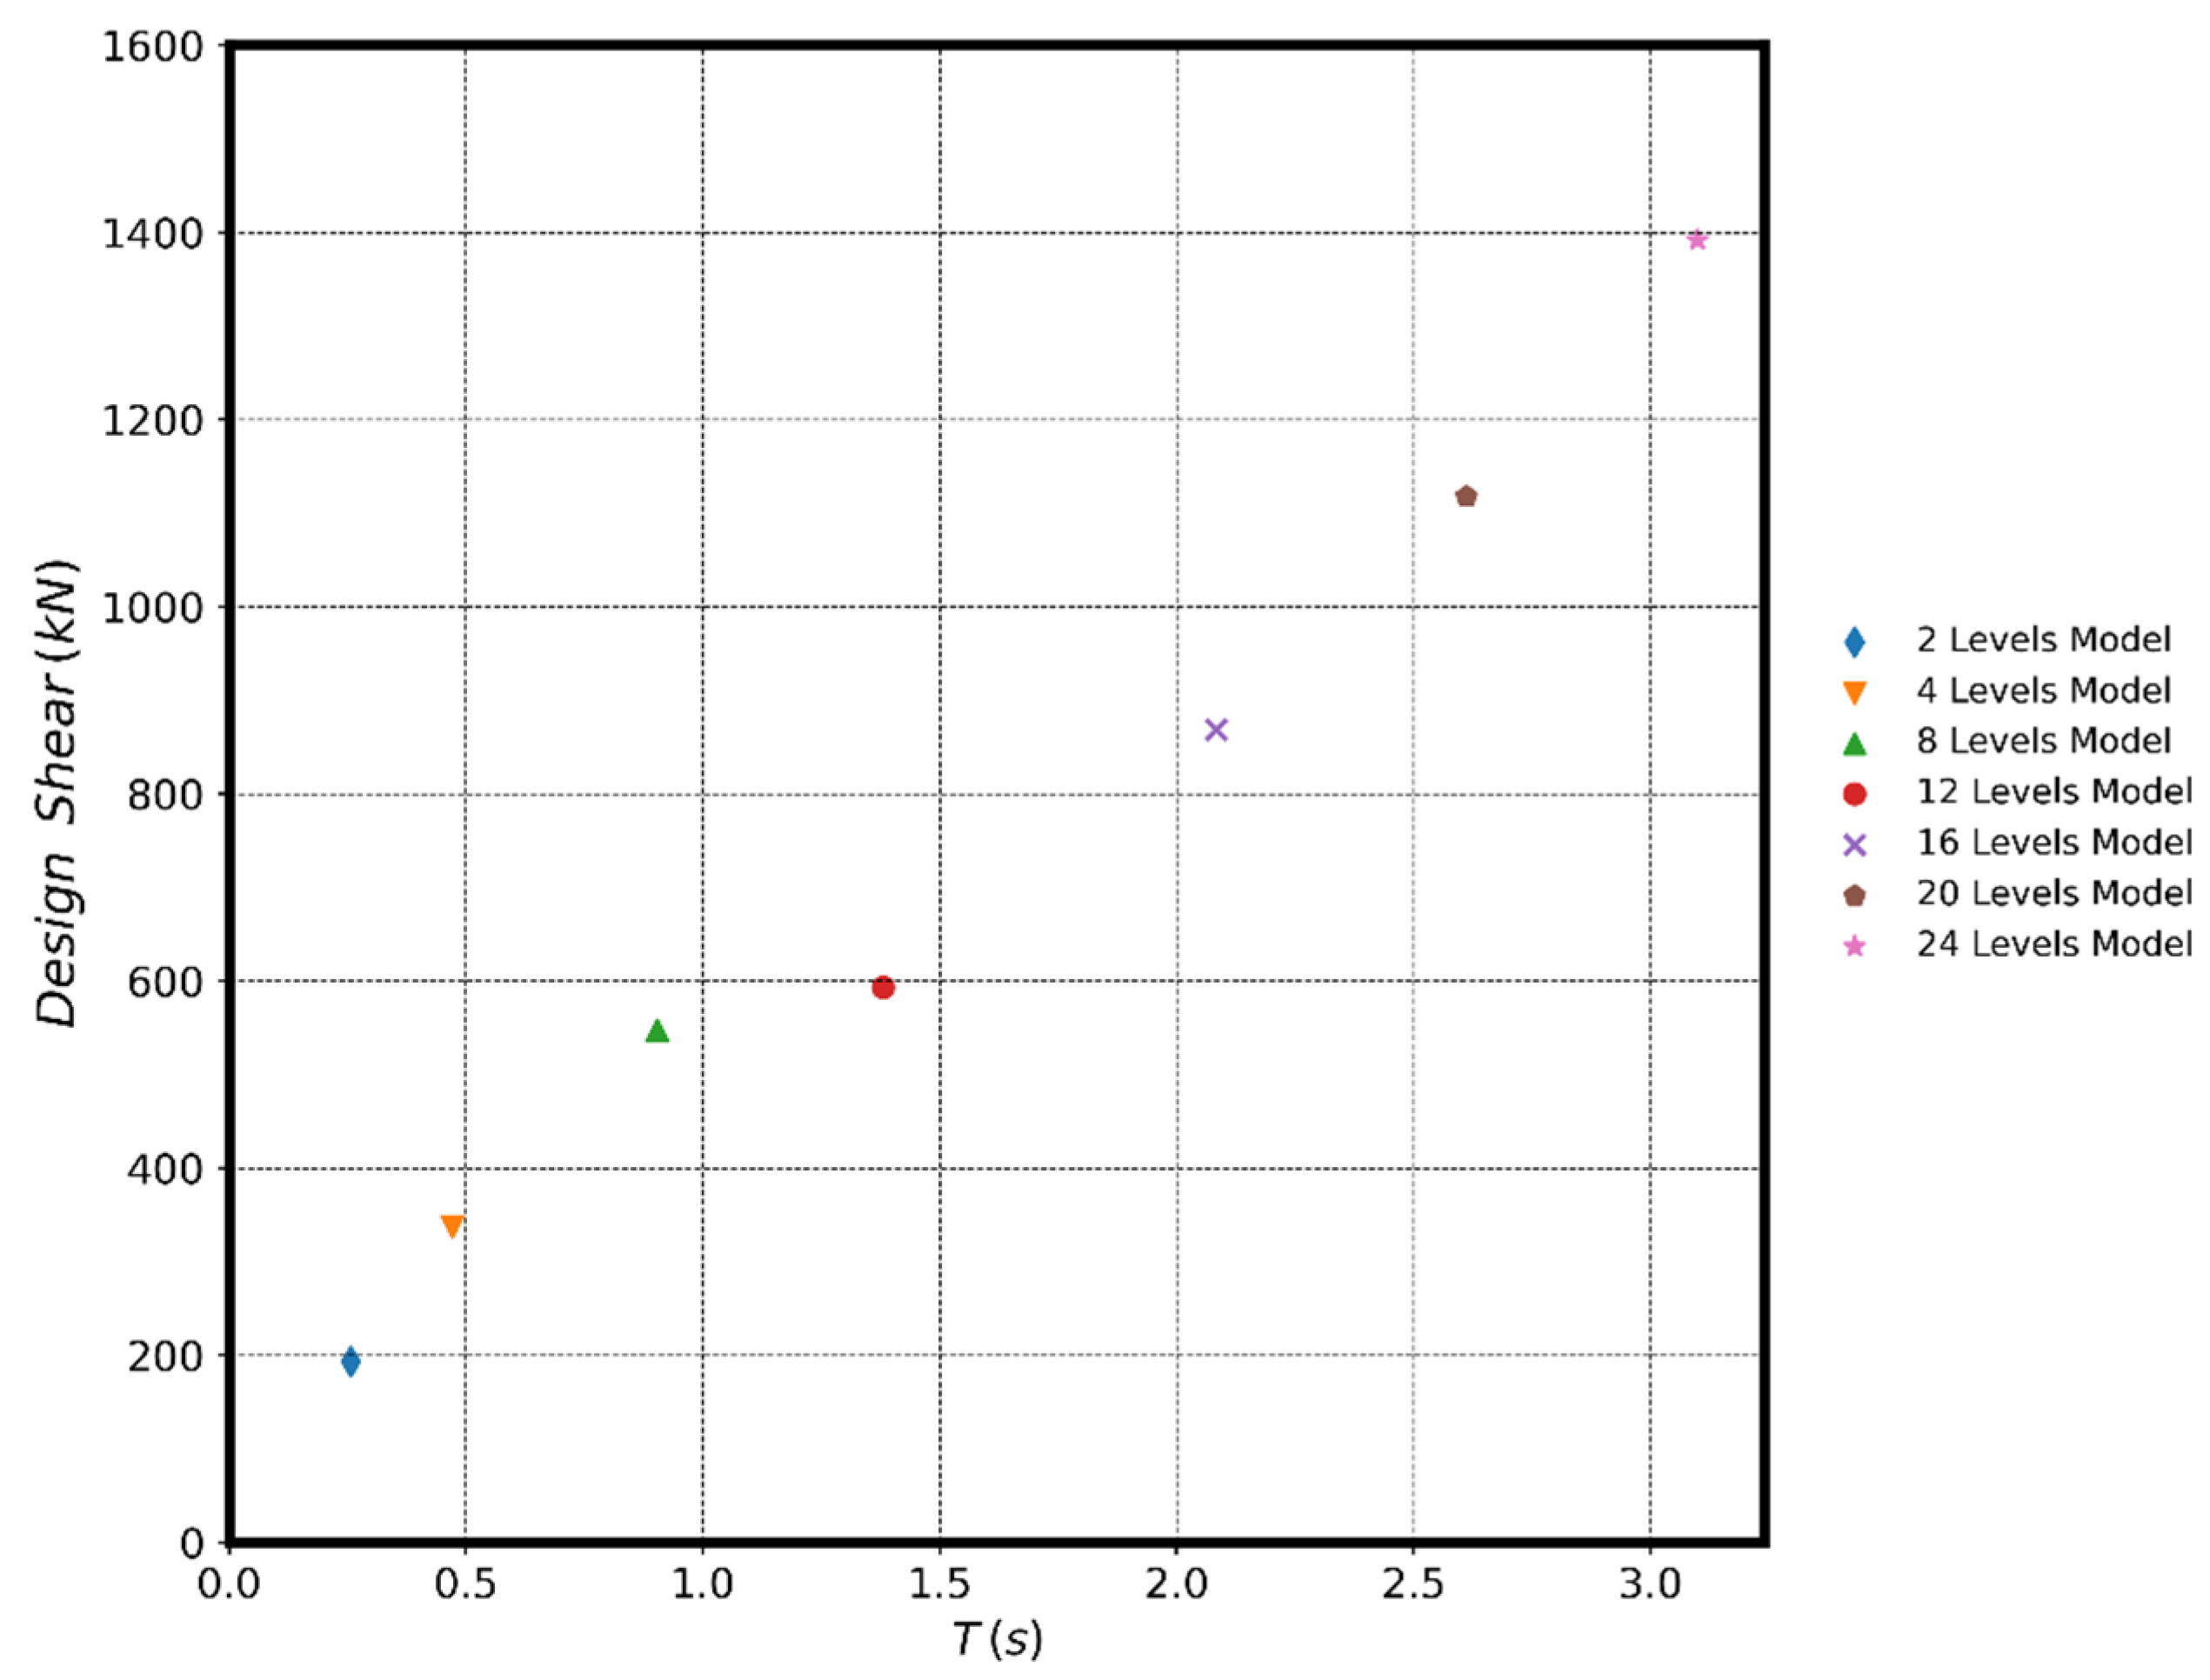
2.3. Results of the Response Spectrum Analysis

The sizes of members (i.e., beams and columns) and the longitudinal and transverse steel reinforcement bars obtained from the design according to ACI 318 [24] and COVENIN 1756-1 [19] are reported in Table 1. In general, the column section was optimized for every 3 stories considering the commercial lengths of steel bars and their splices.
Furthermore, the design shear–period relationship for the models is shown in Figure 3. In this figure, a linear relationship of 0.1 s/level (approximately) was obtained. These values are similar to the relationships mentioned by ASCE 41 [23] in concrete frame buildings.

3. Nonlinear Static Analysis

The nonlinear pushover analysis is a tool that has mainly been used to evaluate the seismic response of building structures. The advantage of the nonlinear pushover analysis is that it is efficient for obtaining the structural response at different levels of demand as is specified in [14,27,28,29]. The application of a static load pattern distributed along the height of the structure, which monotonically increases until the global collapse mechanism of the structure, is performed in the nonlinear static pushover analysis method. Finally, the structural response is obtained from the capacity curve, which is a force–displacement relationship usually reported in terms of base shear versus roof displacement (measured on a control node) [14].

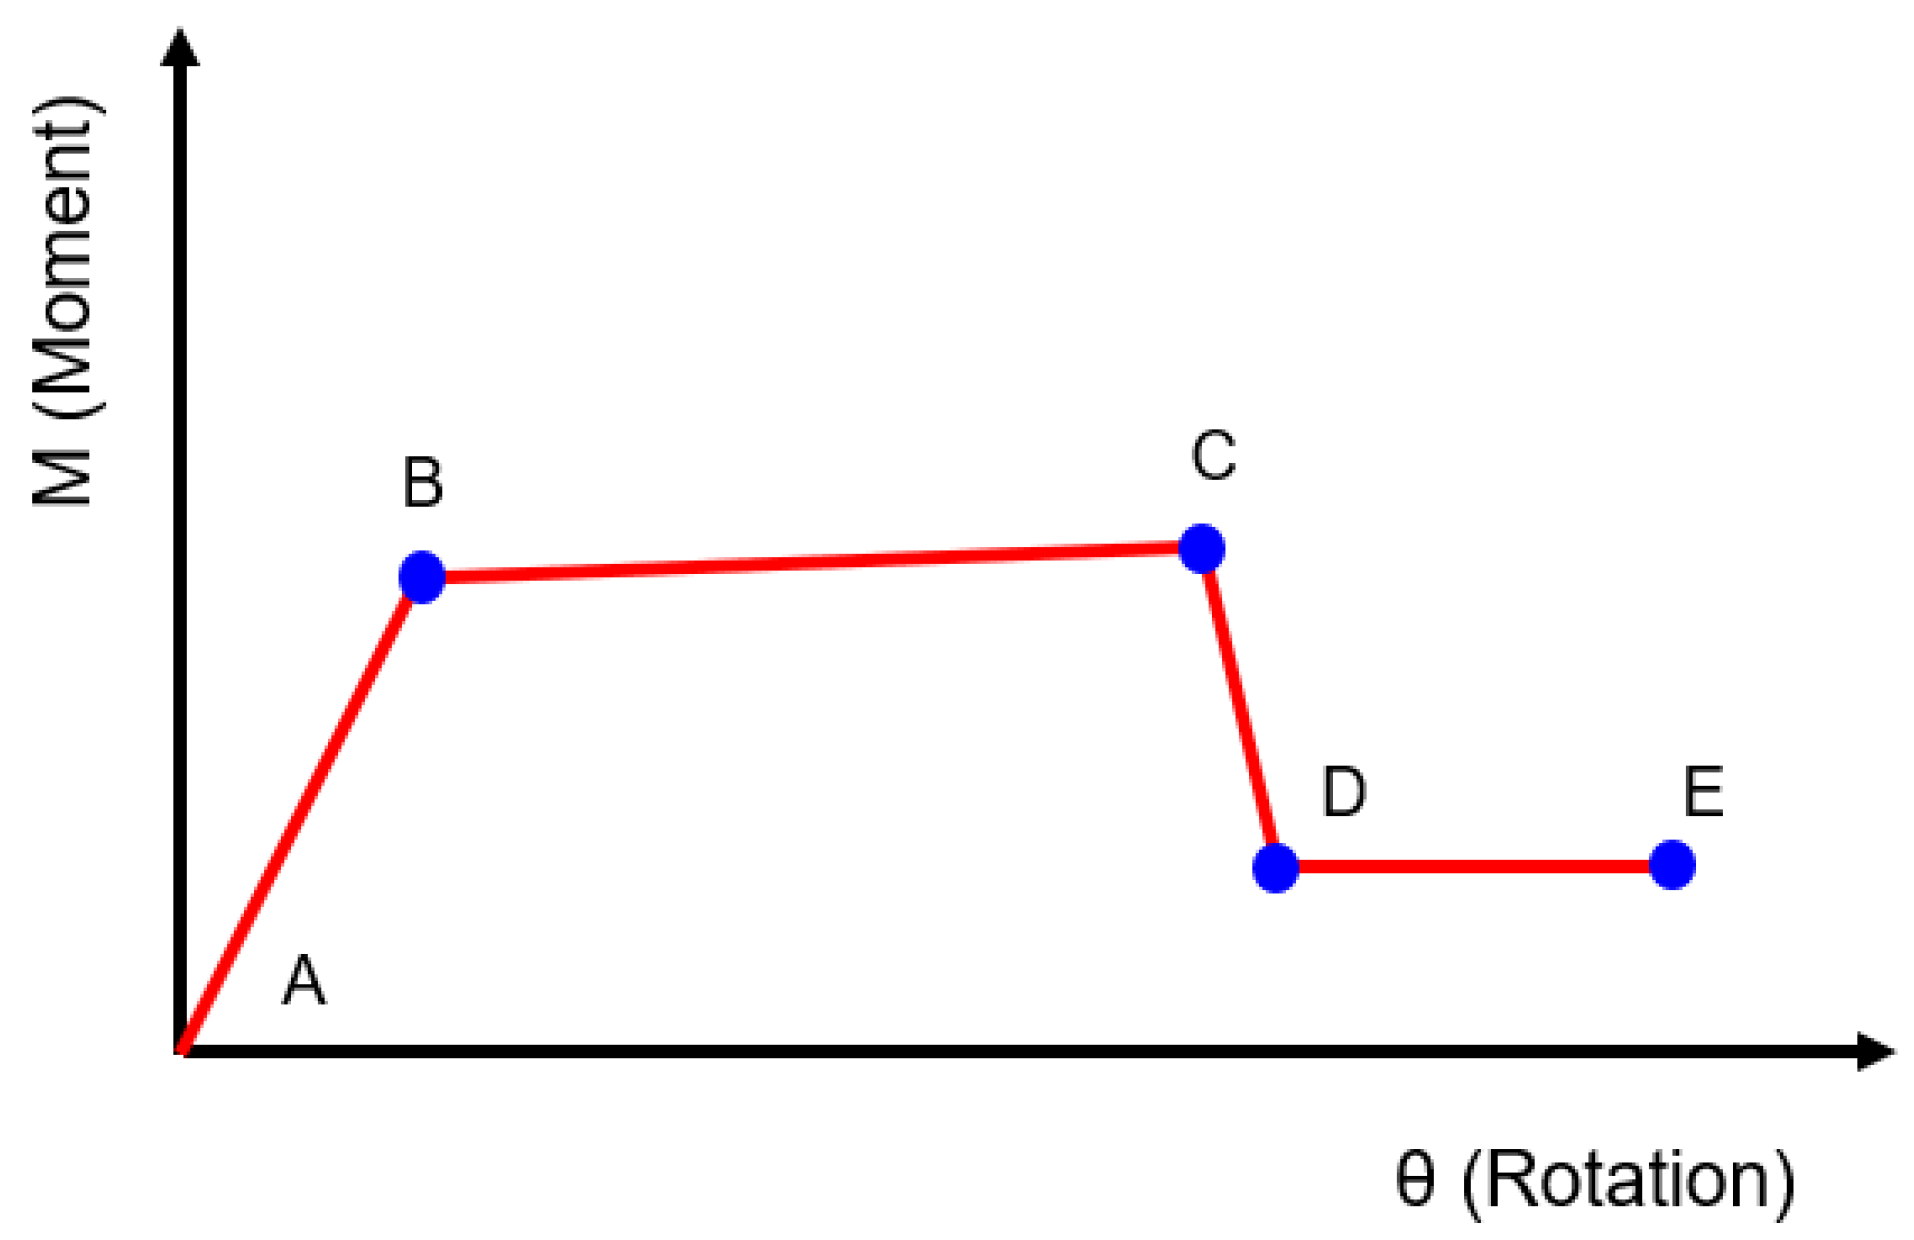
3.1. Numerical Model

The nonlinear behavior was evaluated from the numerical models before being performed in the seismic design, considering plastic hinges defined as a concentrated damage hinge type in members according to ASCE 41 [23] (see Figure 4). Hinges considering P–M3 interactions (axial–primary moment, for 2D plane models) were used in column members ASCE 41 [23]. On the other hand, the plastic hinge in beam members according to the moment–rotation (M-θ) relationship established in ASCE 41 [23] was used. These models of concentrated damage have been verified by numerous tests and are recognized by ASCE 41 [23], allowing their use in new building structures. The P-delta effects were considered in the nonlinear pushover form to solve the equilibrium equations in deformed position.
Concrete moment frames with 2, 4, 8, 12, 16, 20, and 24 story levels were loaded laterally with different patterns according to:
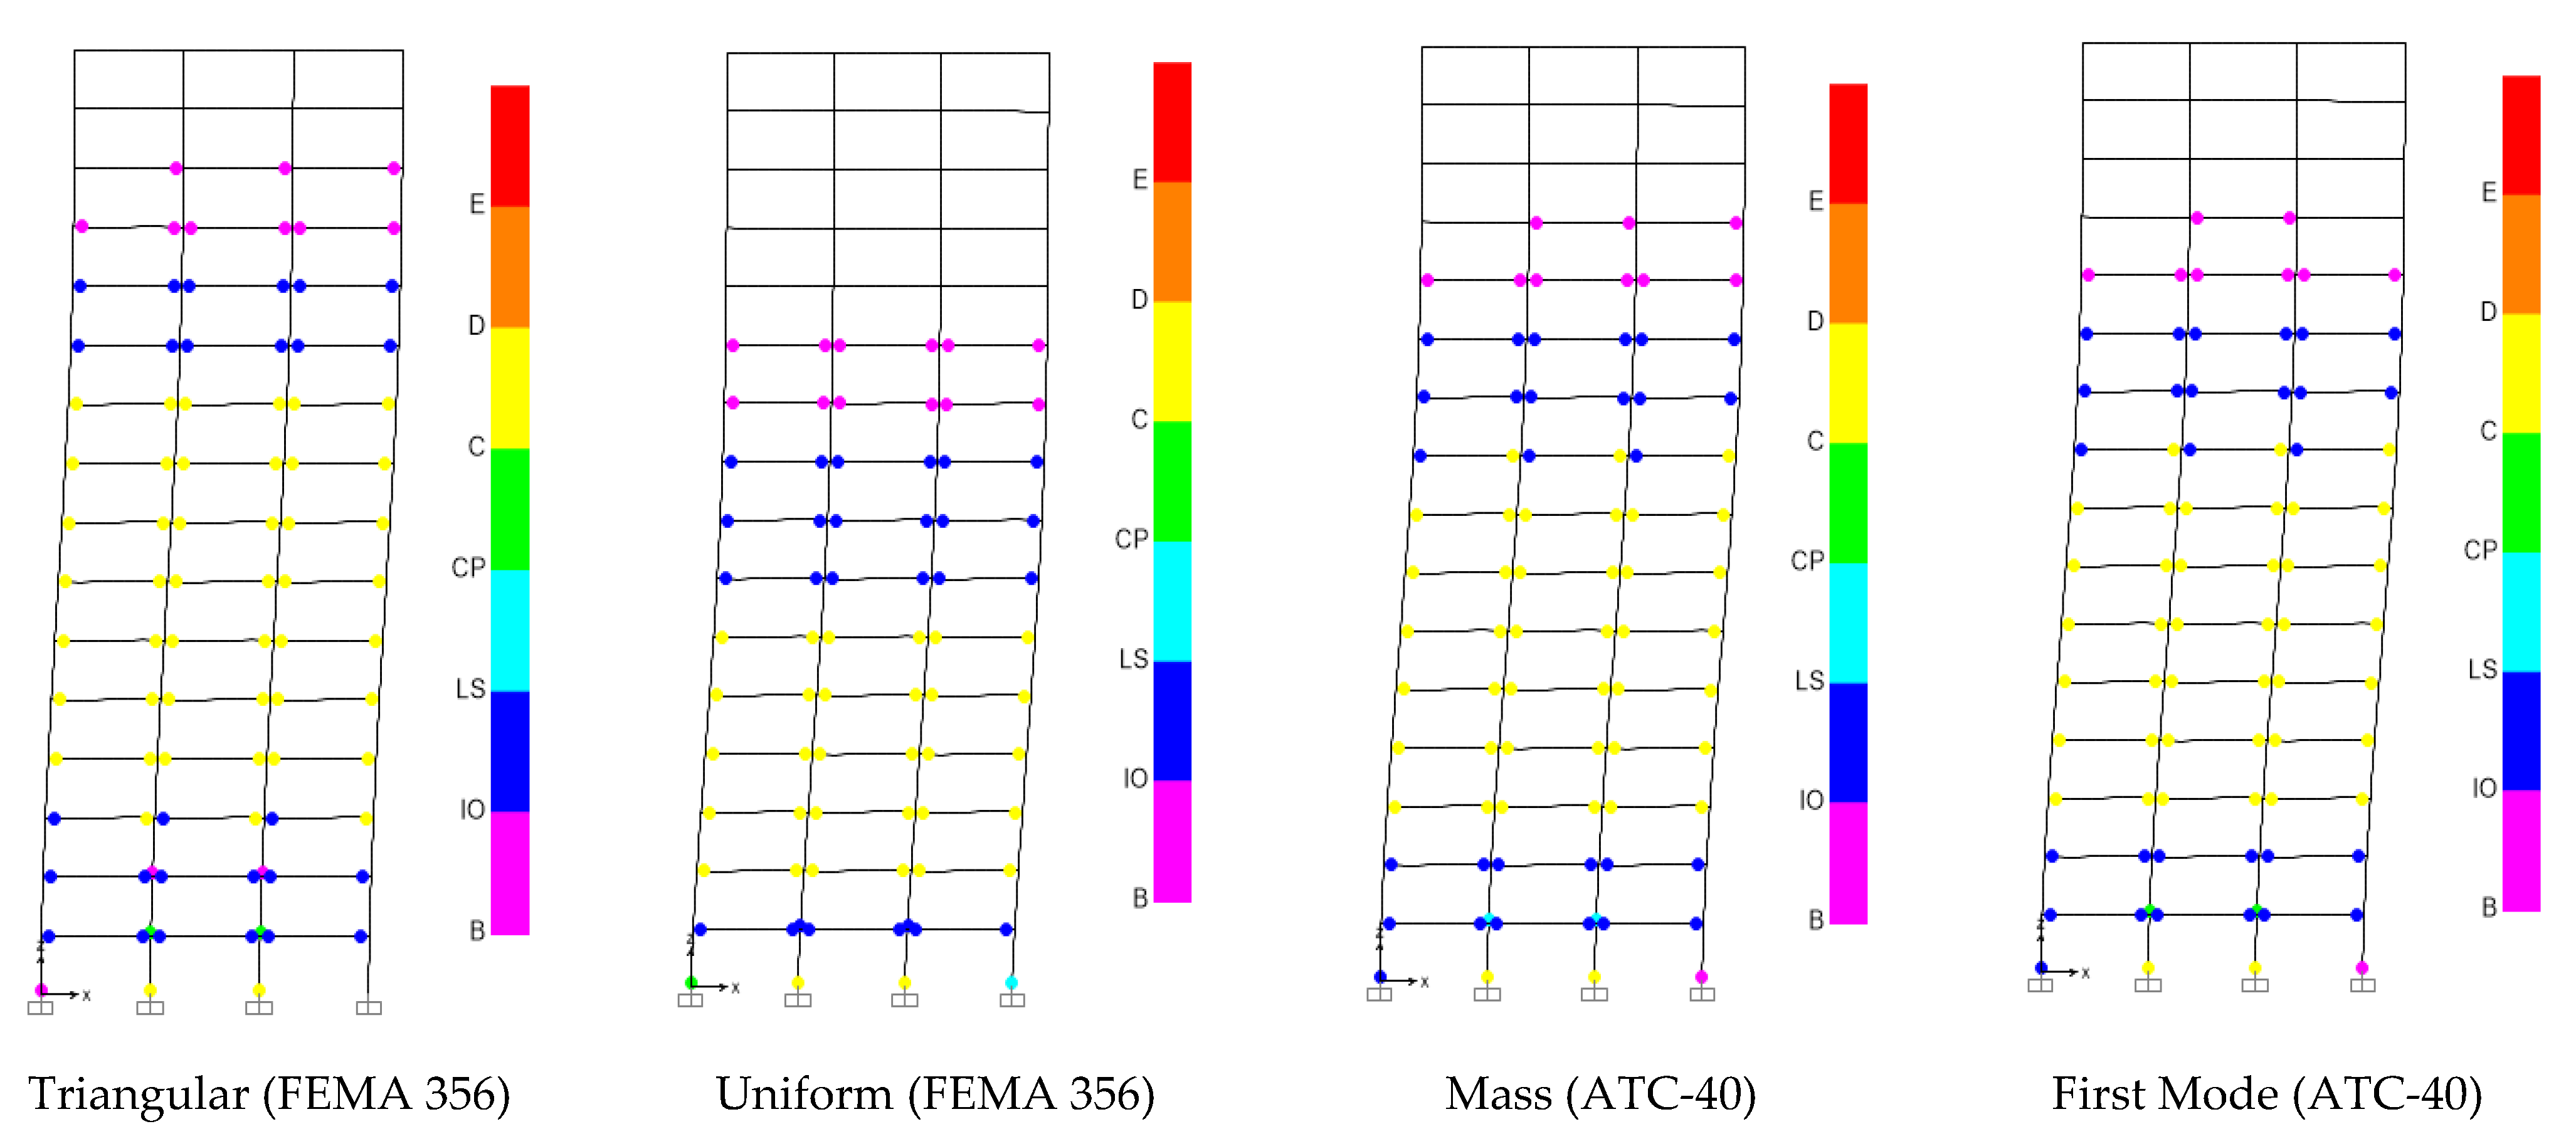
  • FEMA 356 [21]: triangular and uniform load patterns;
  • ATC-40 [20]: proportional to the first mode and proportional to mass load patterns;
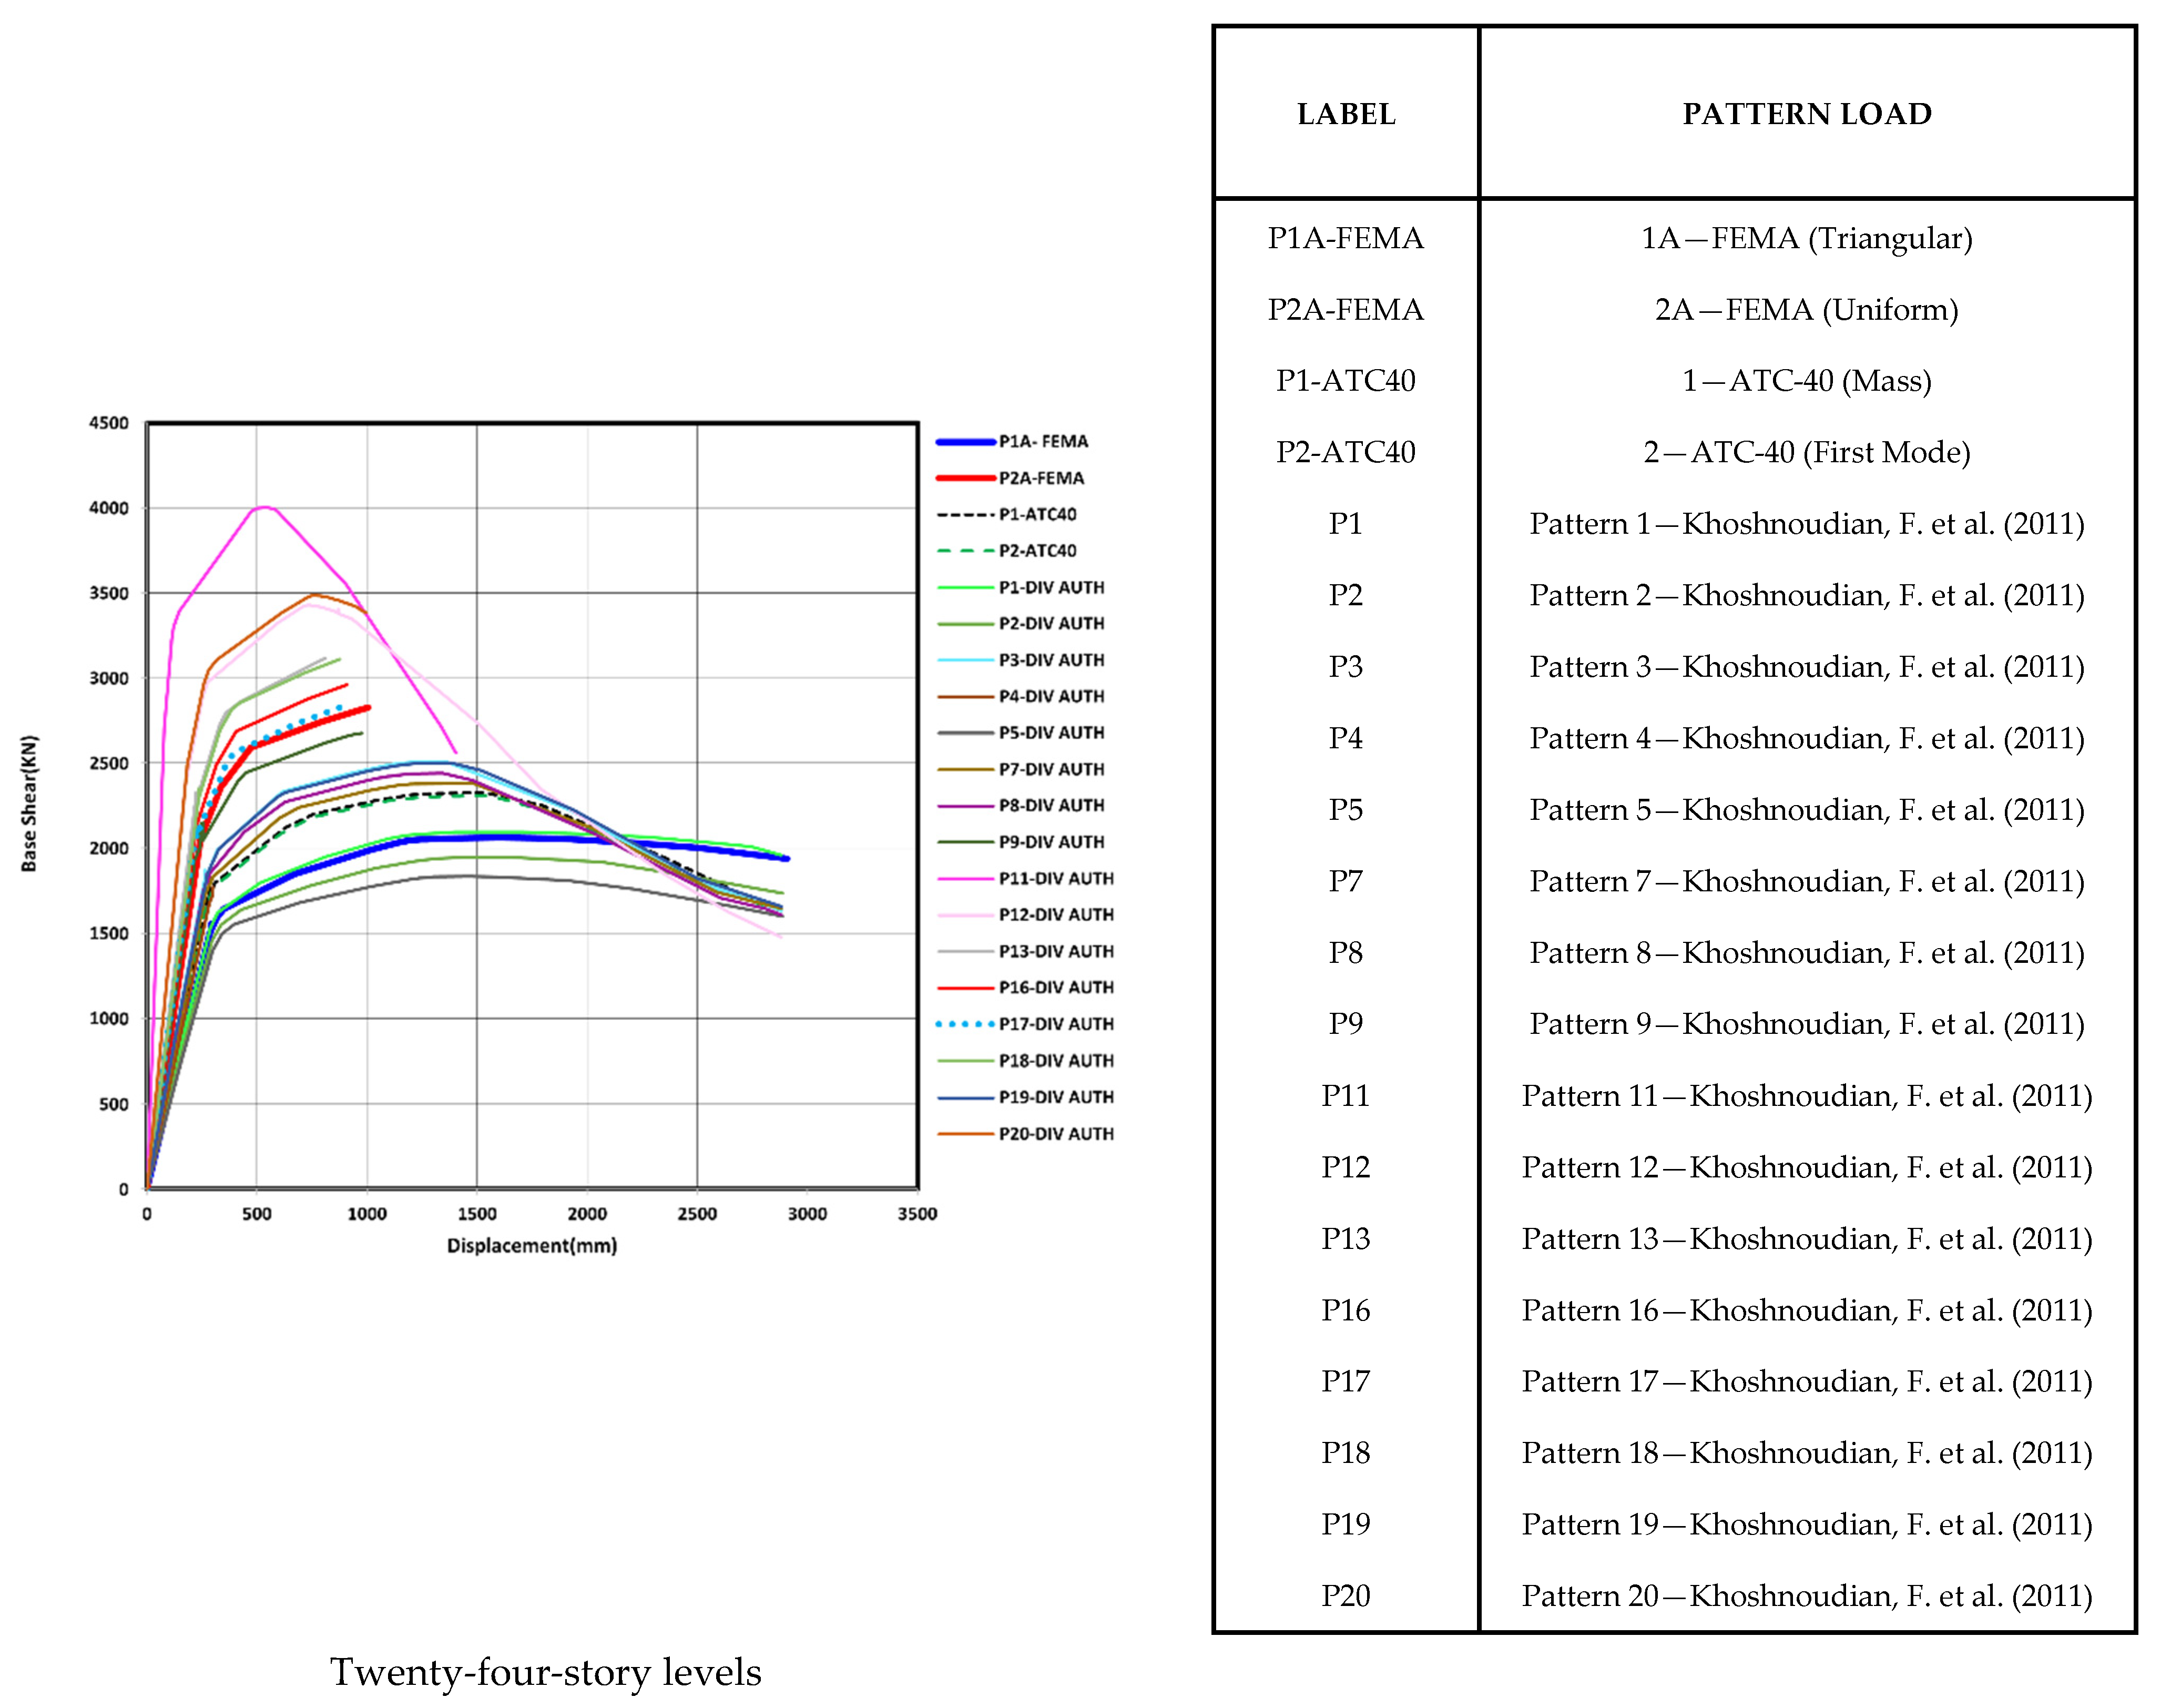
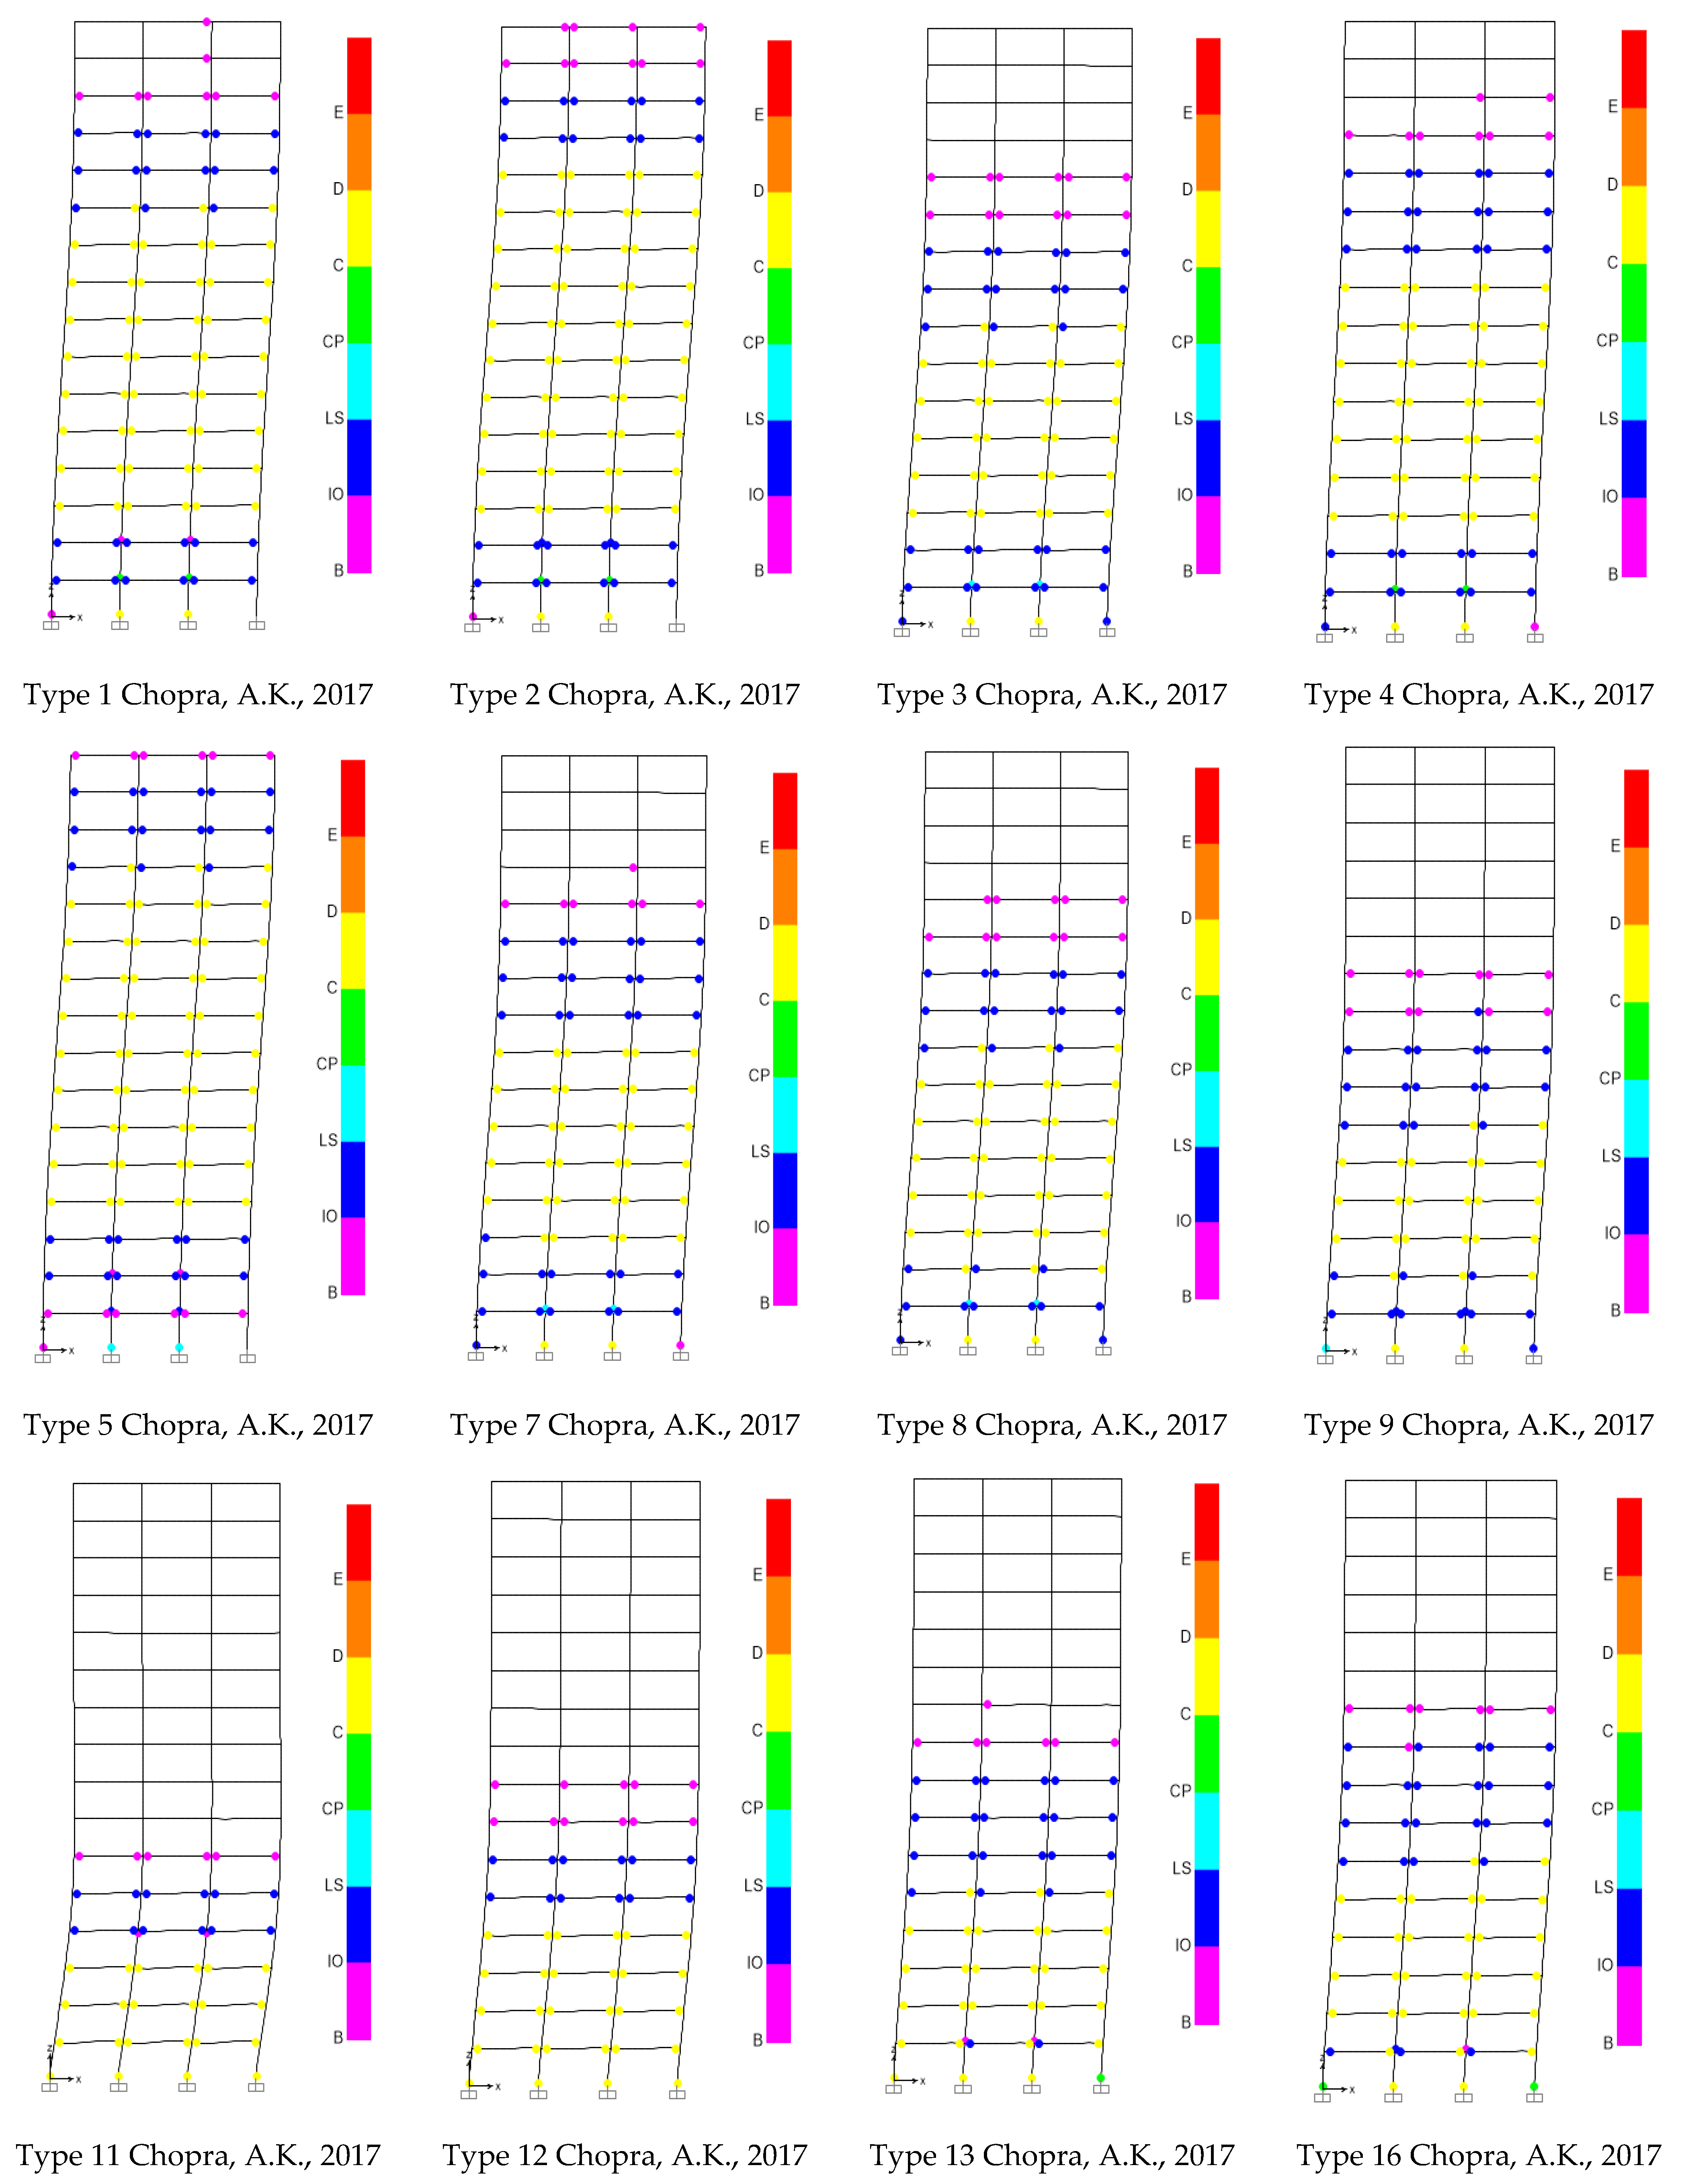
  • New proposed load patterns performed by Khoshnoudian et al. [22]: Load patterns of 1–20. However, negative forces were obtained with the load patterns 6–10–14–15; therefore, these load patterns were not applied in this study.
As result of the analysis of the seven buildings subjected to the 20 load patterns mentioned behavior, a total of 140 models were evaluated.

3.2. Nonlinear Pushover Analysis

The main approach to the evaluation of the seismic performance of concrete moment frames was performed using nonlinear static pushover analyses according to FEMA P695. The different load patterns explained above were applied for each level of the structures. Uniformly distributed loads due to the fact of gravitational loads were applied to the beams. The target displacement was based on the coefficient method, according to ASCE 41 [23]. On the other hand, the capacity curves were defined as the base shear–displacement curves of a single degree-of-freedom (SDOF) oscillator, equivalent to the 3D structure. The performance point was obtained from the application of the coefficient method described in ASCE 41 [23]. Seismic design parameters, such as the strength reduction factor R = Rμ × RΩ, were determined, where Rμ = Ve/Vmax is the ductility reduction factor, and RΩ = Vmax/Vd is the overstrength of the structure. Finally, the ductility factor μ = Δmax/Δy was obtained, dividing the maximum displacement by the yield displacement.

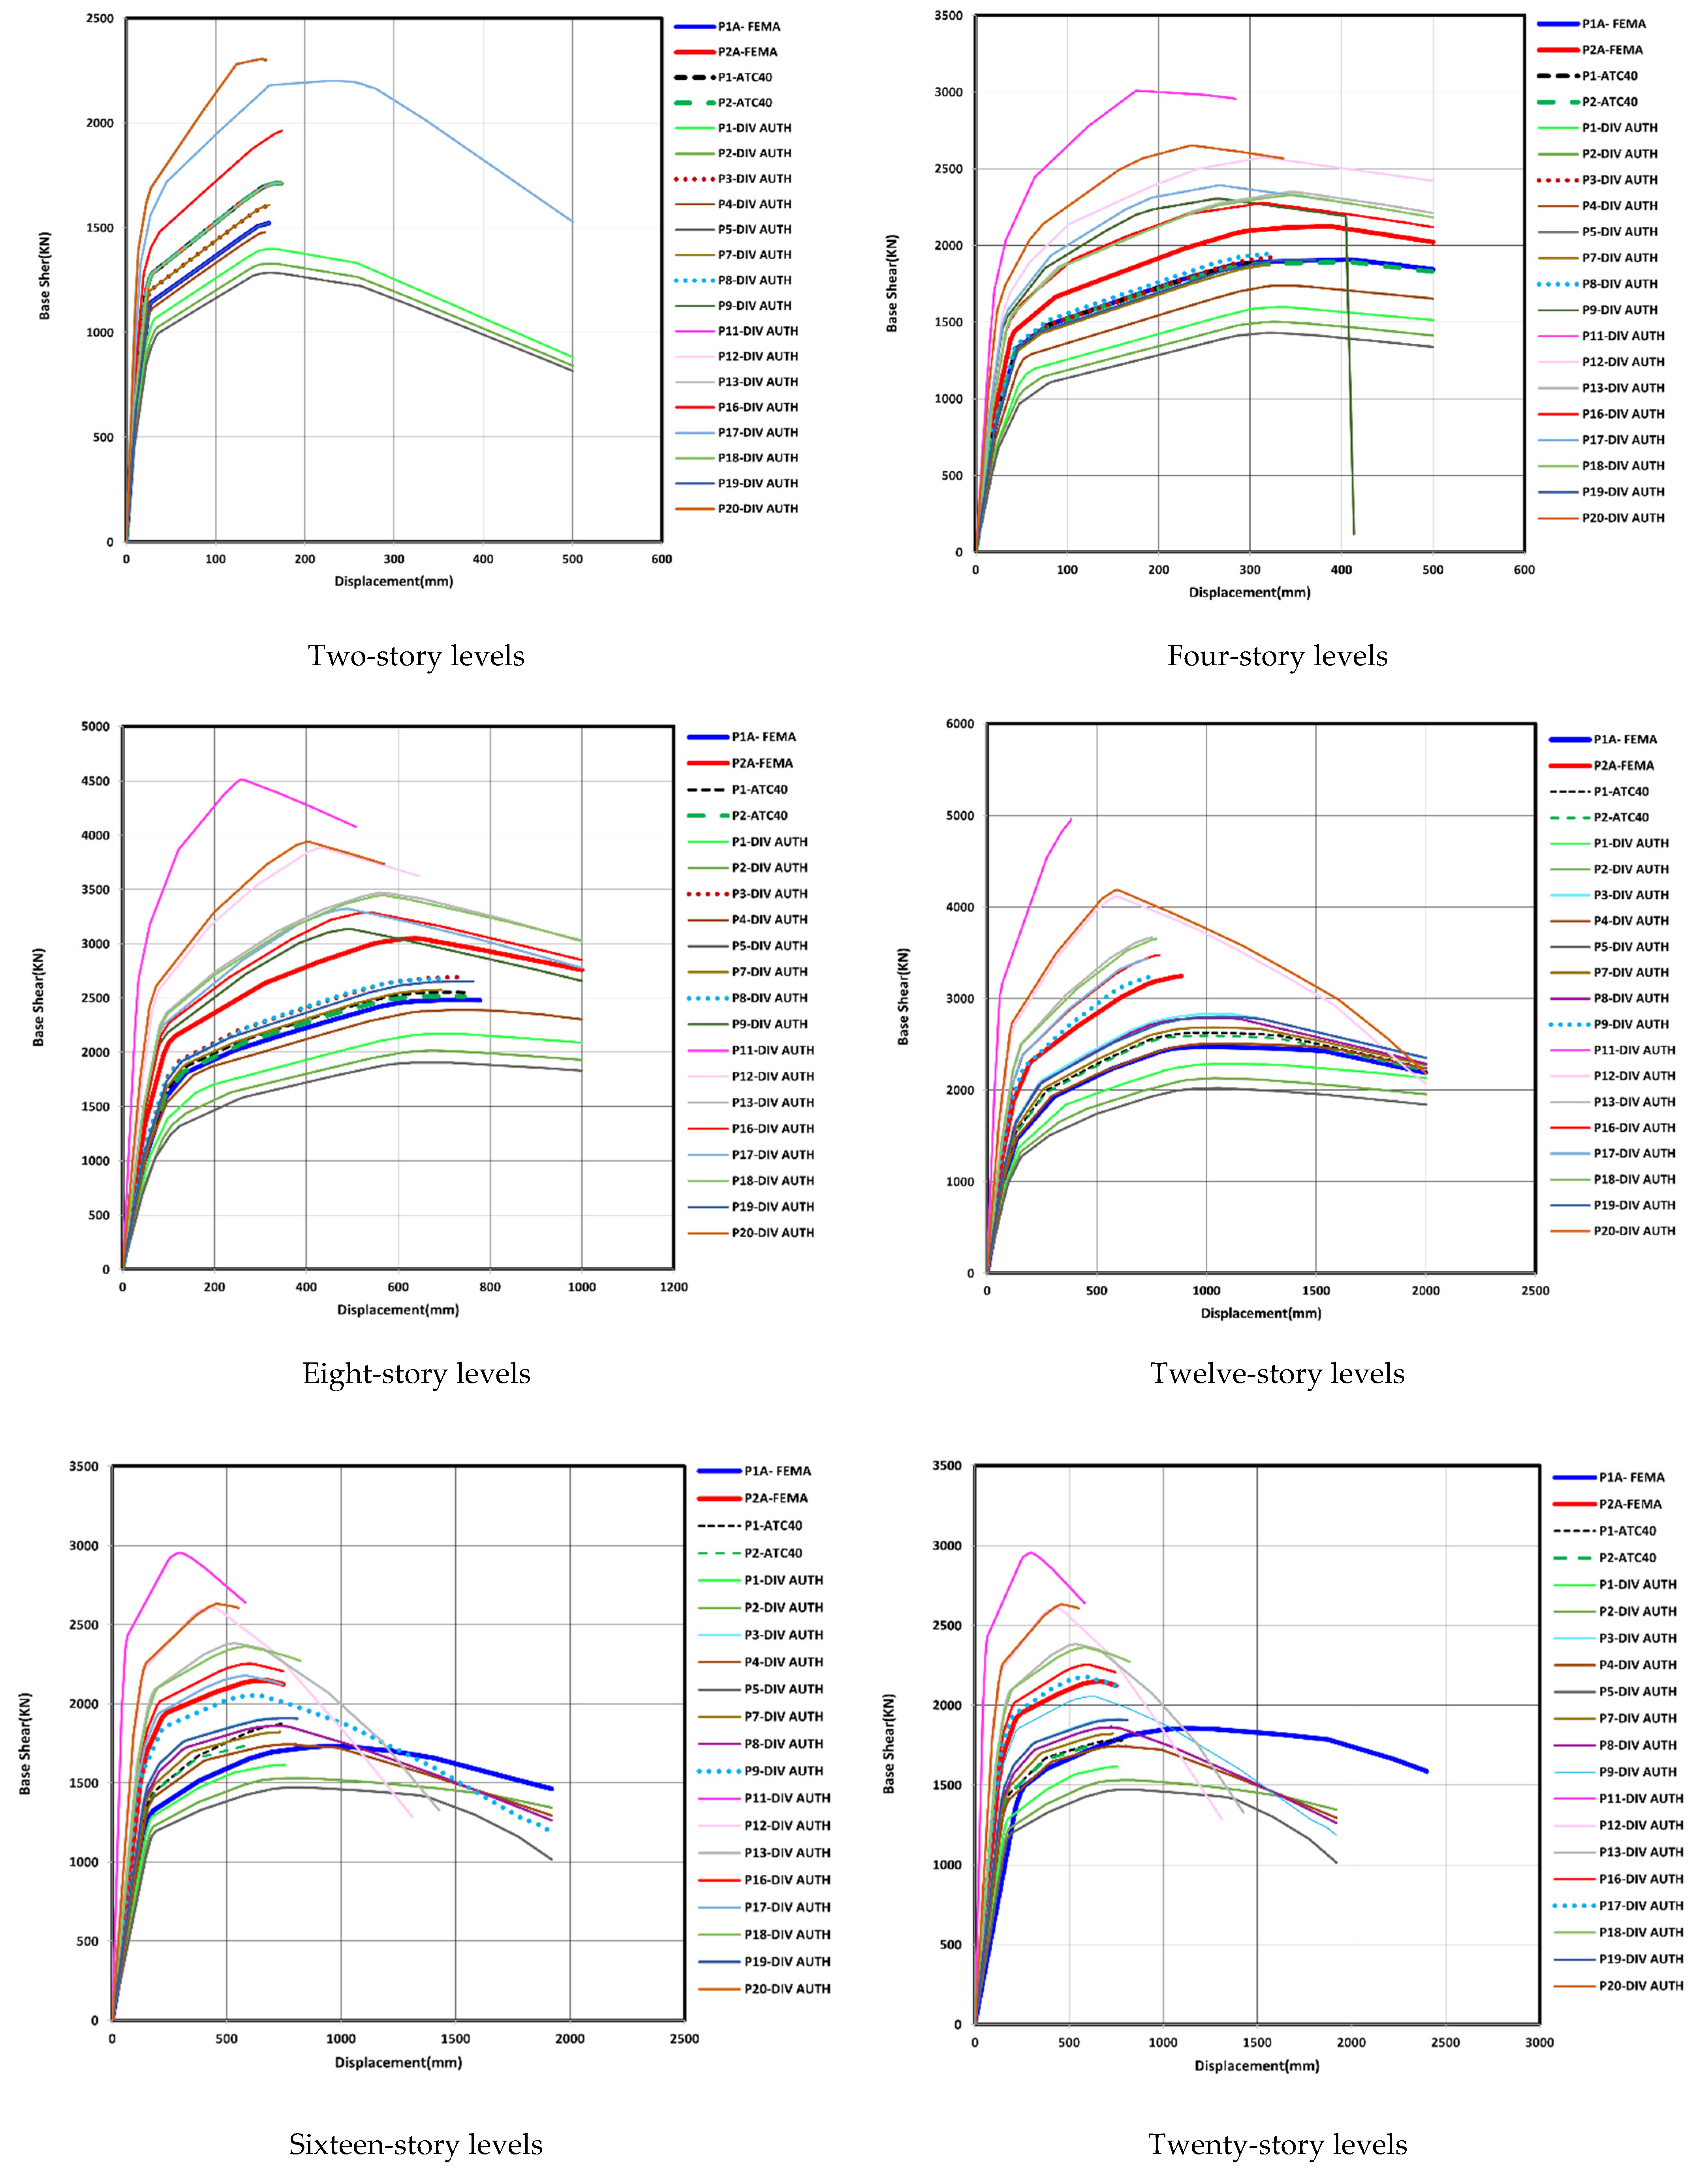
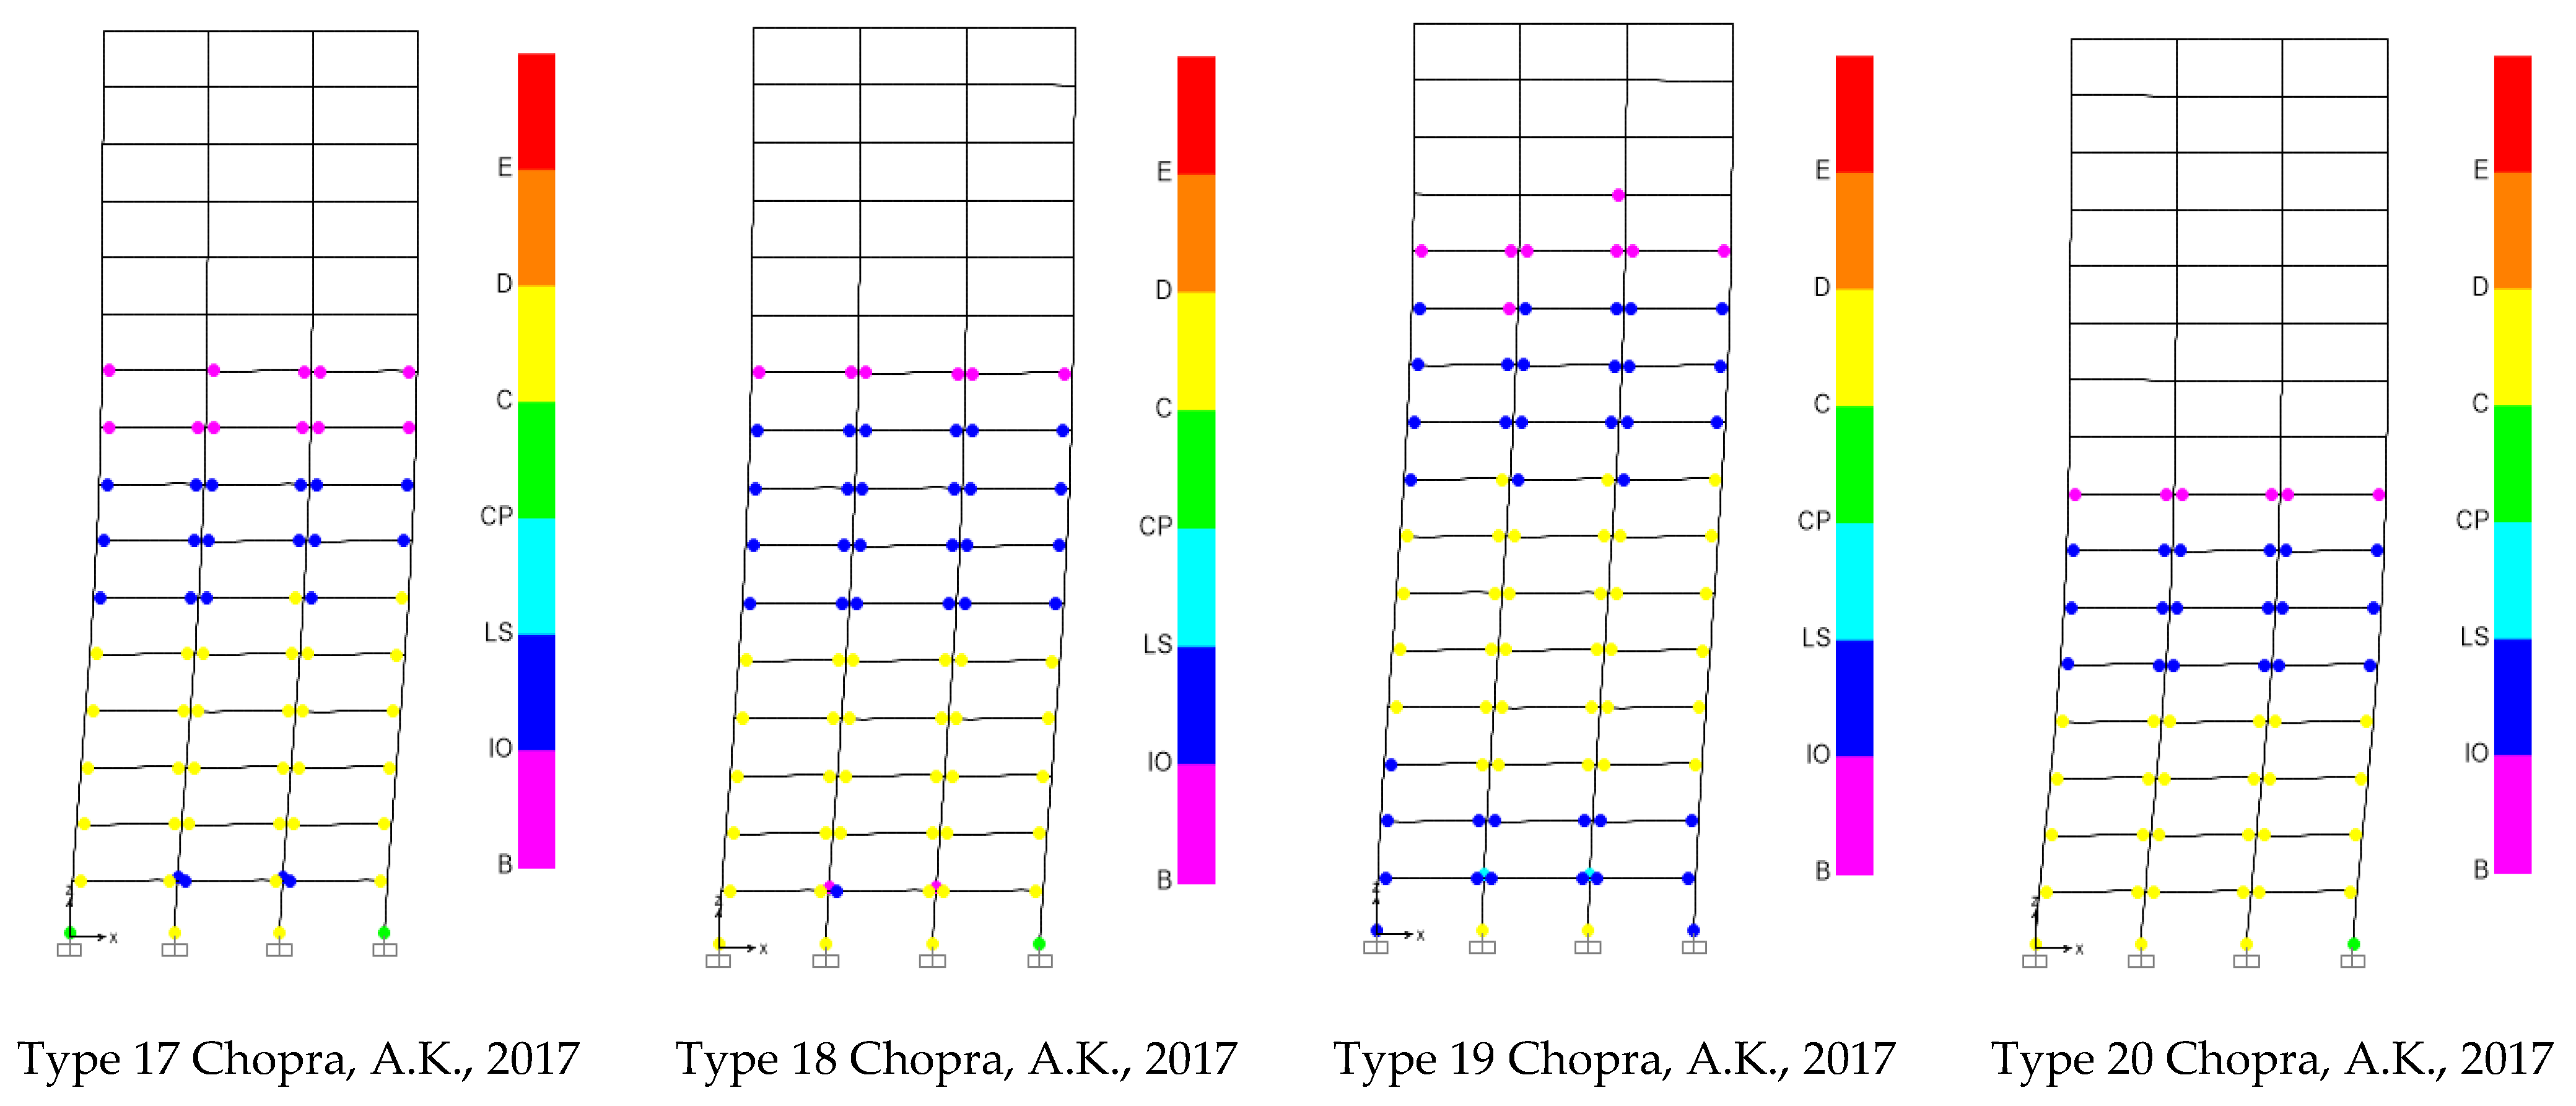
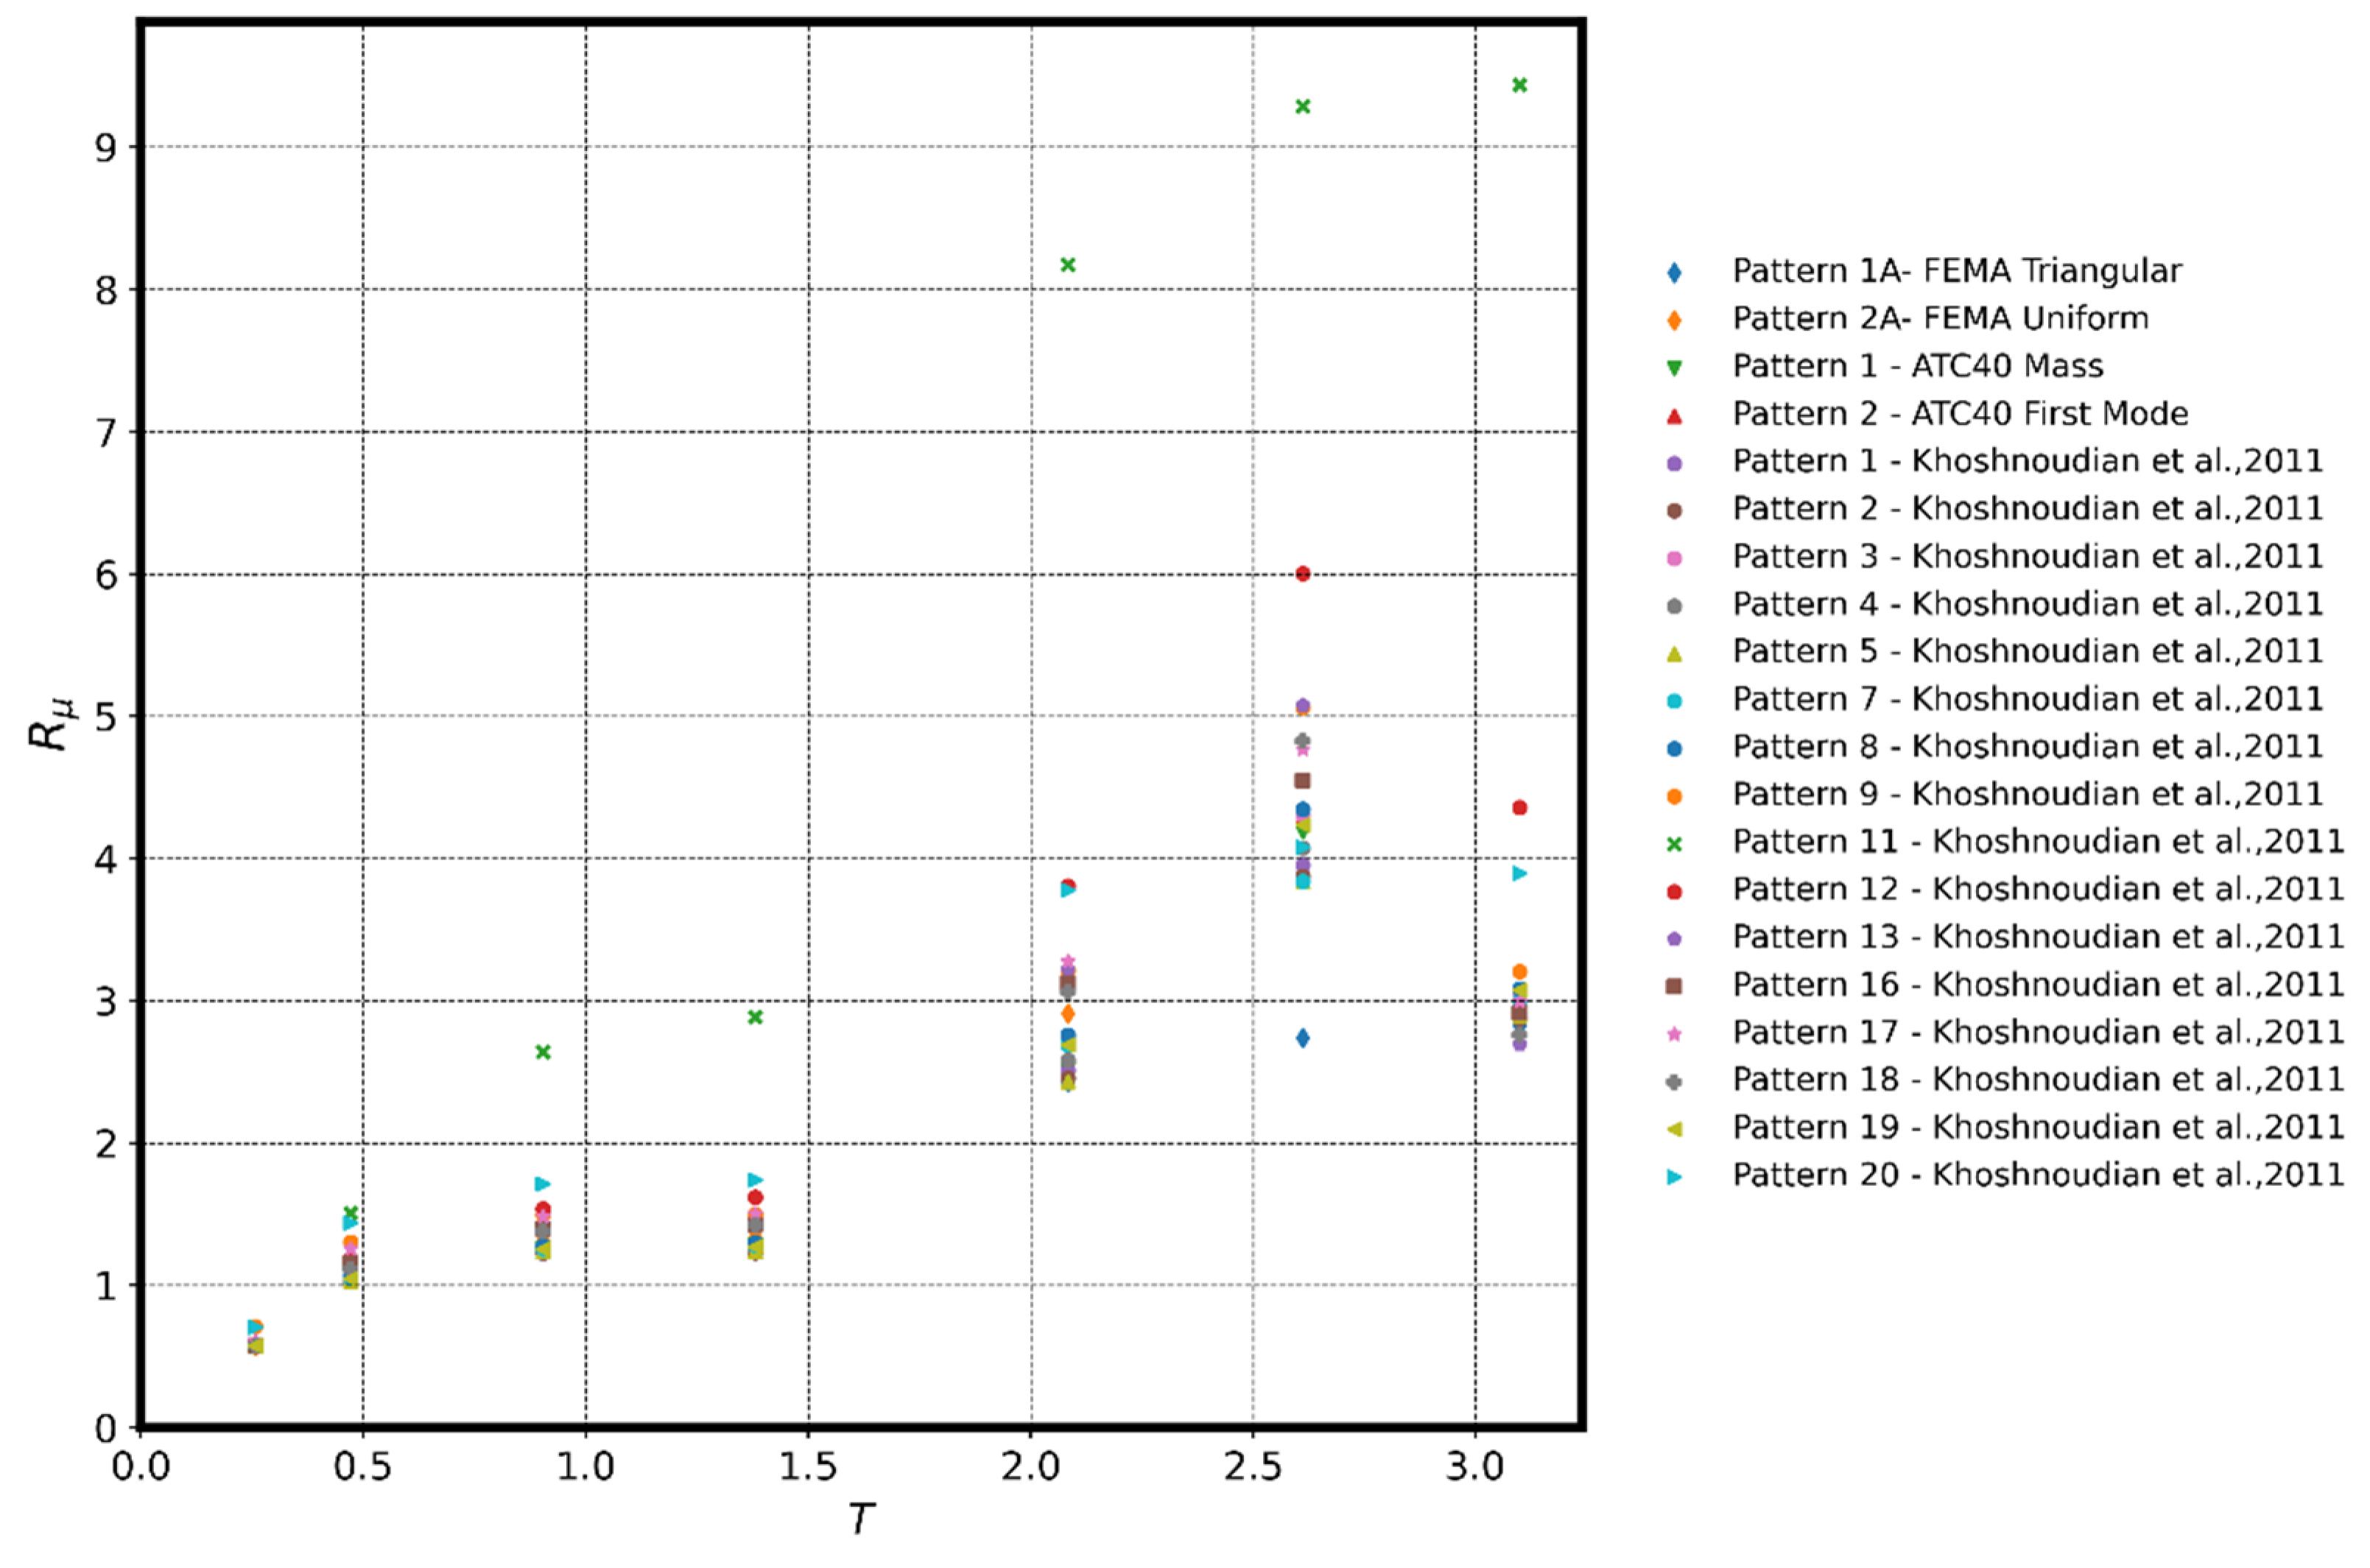
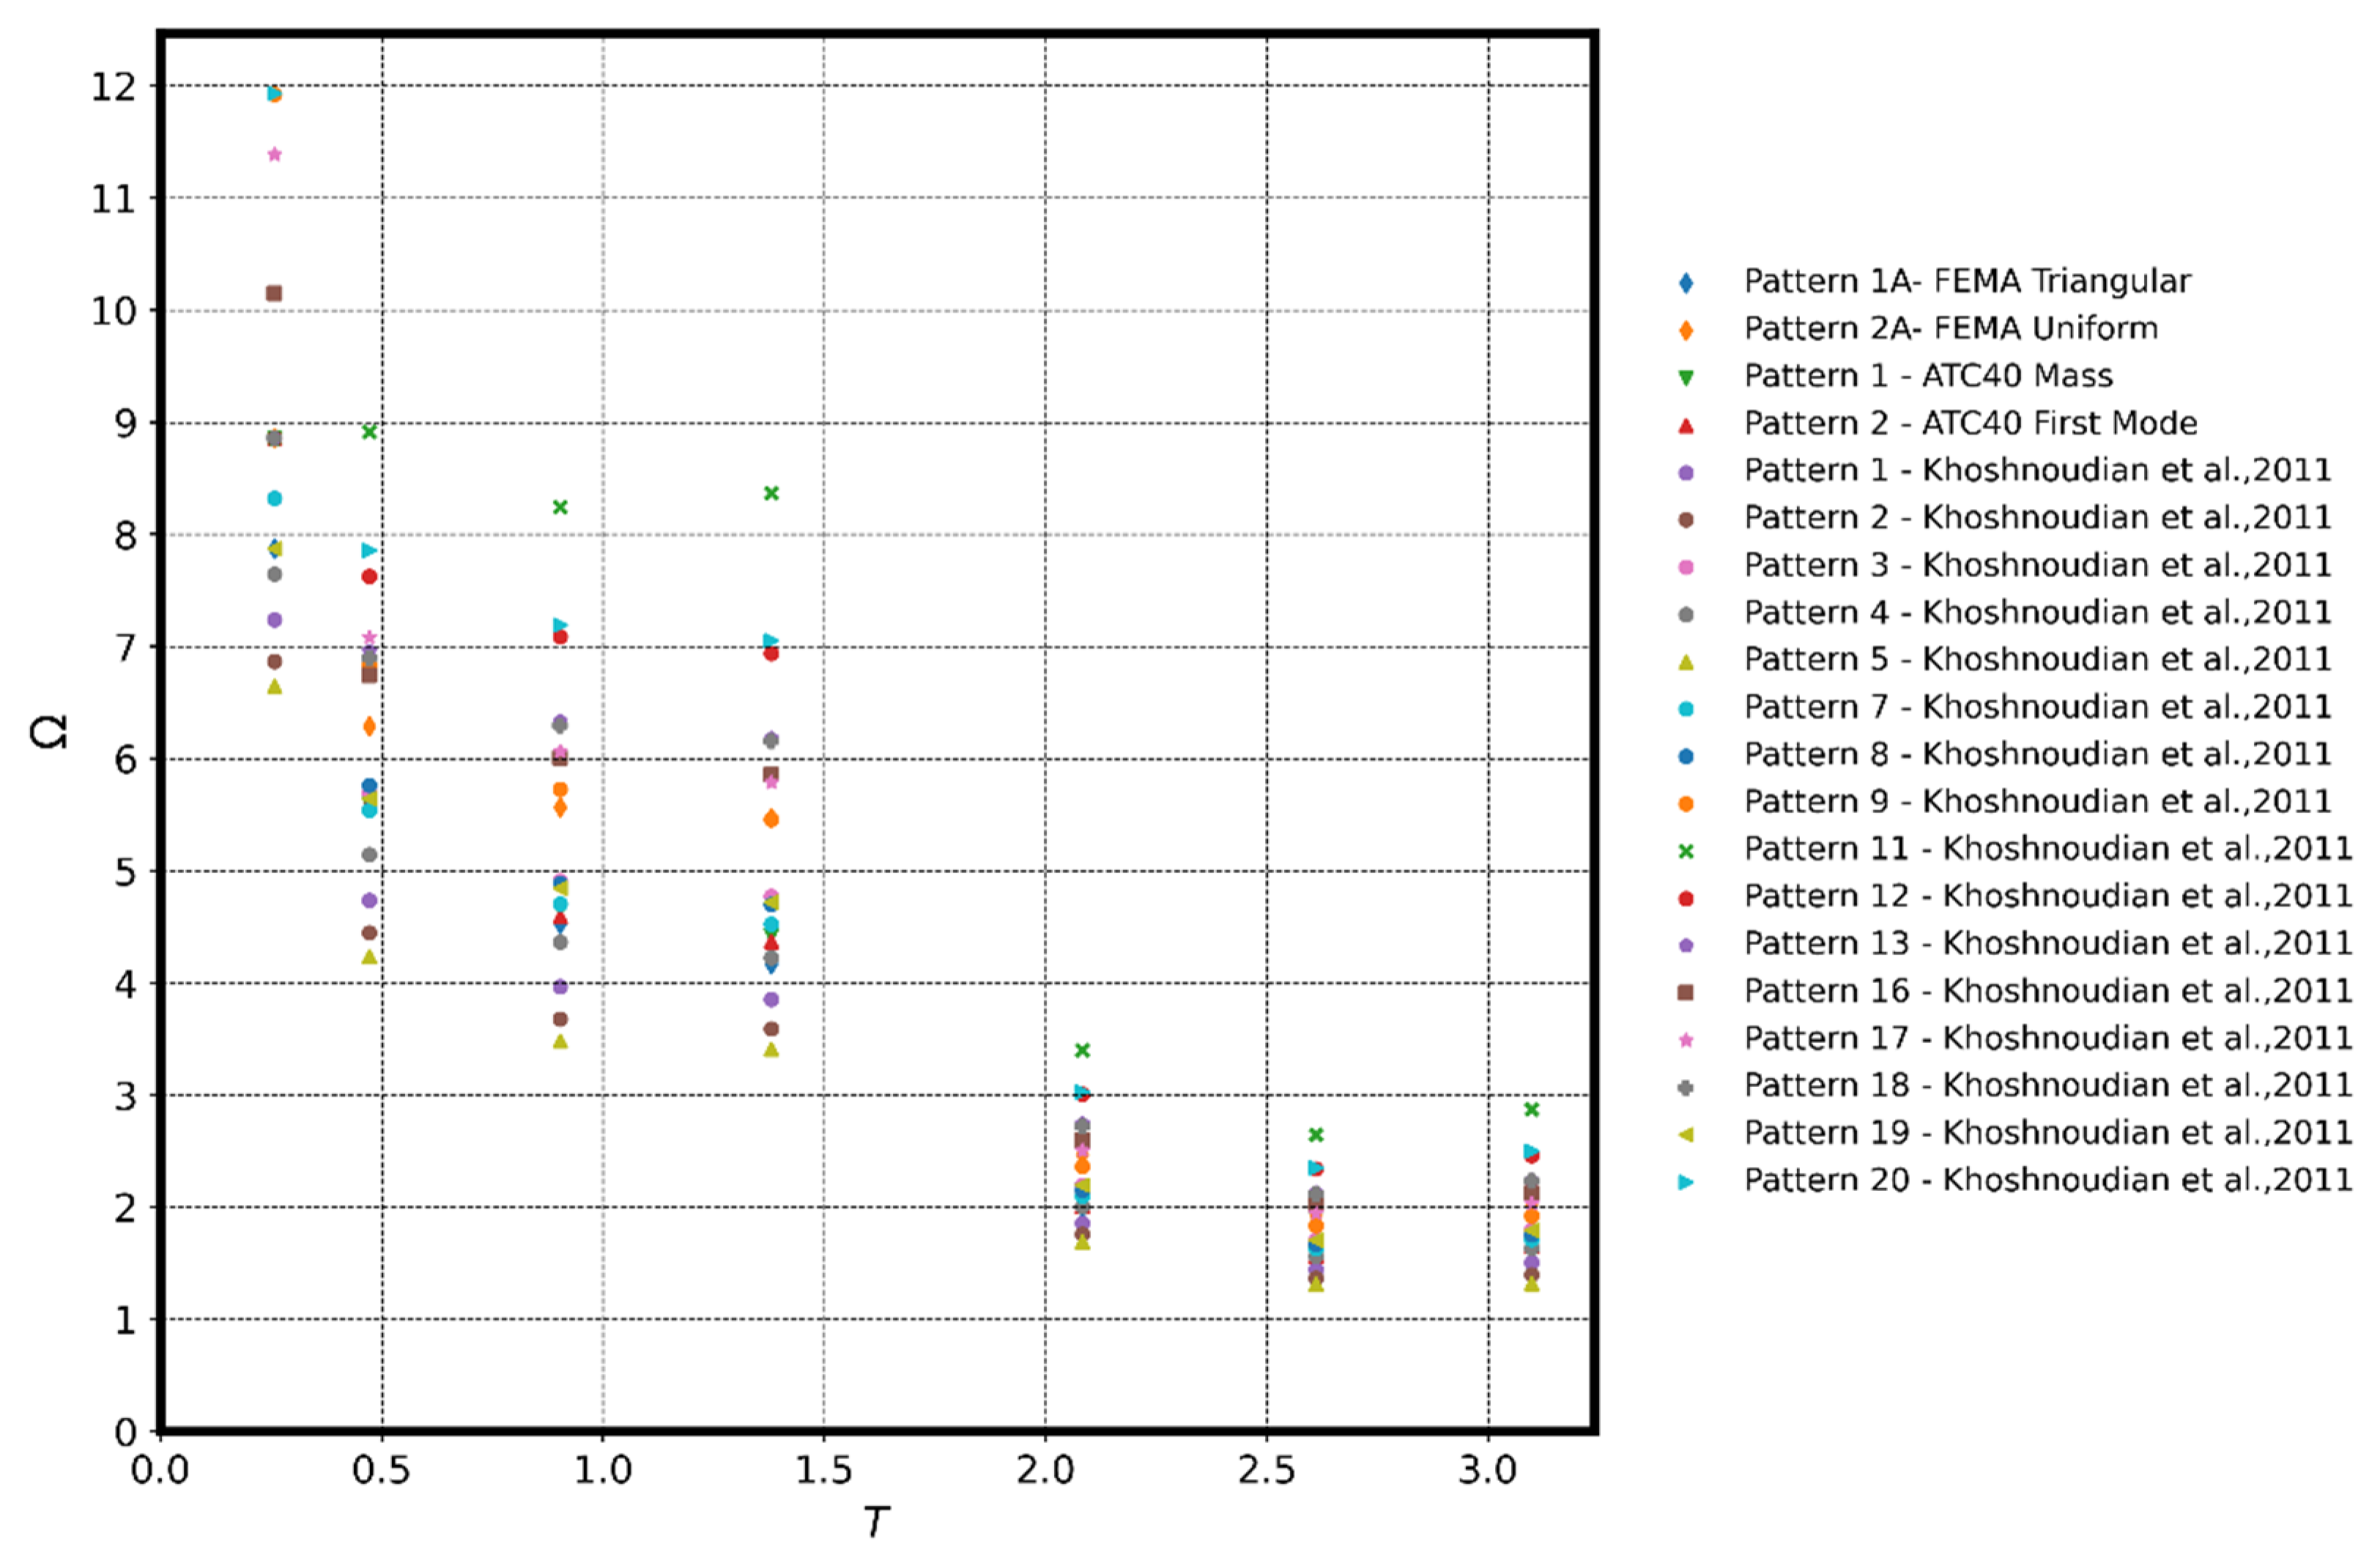
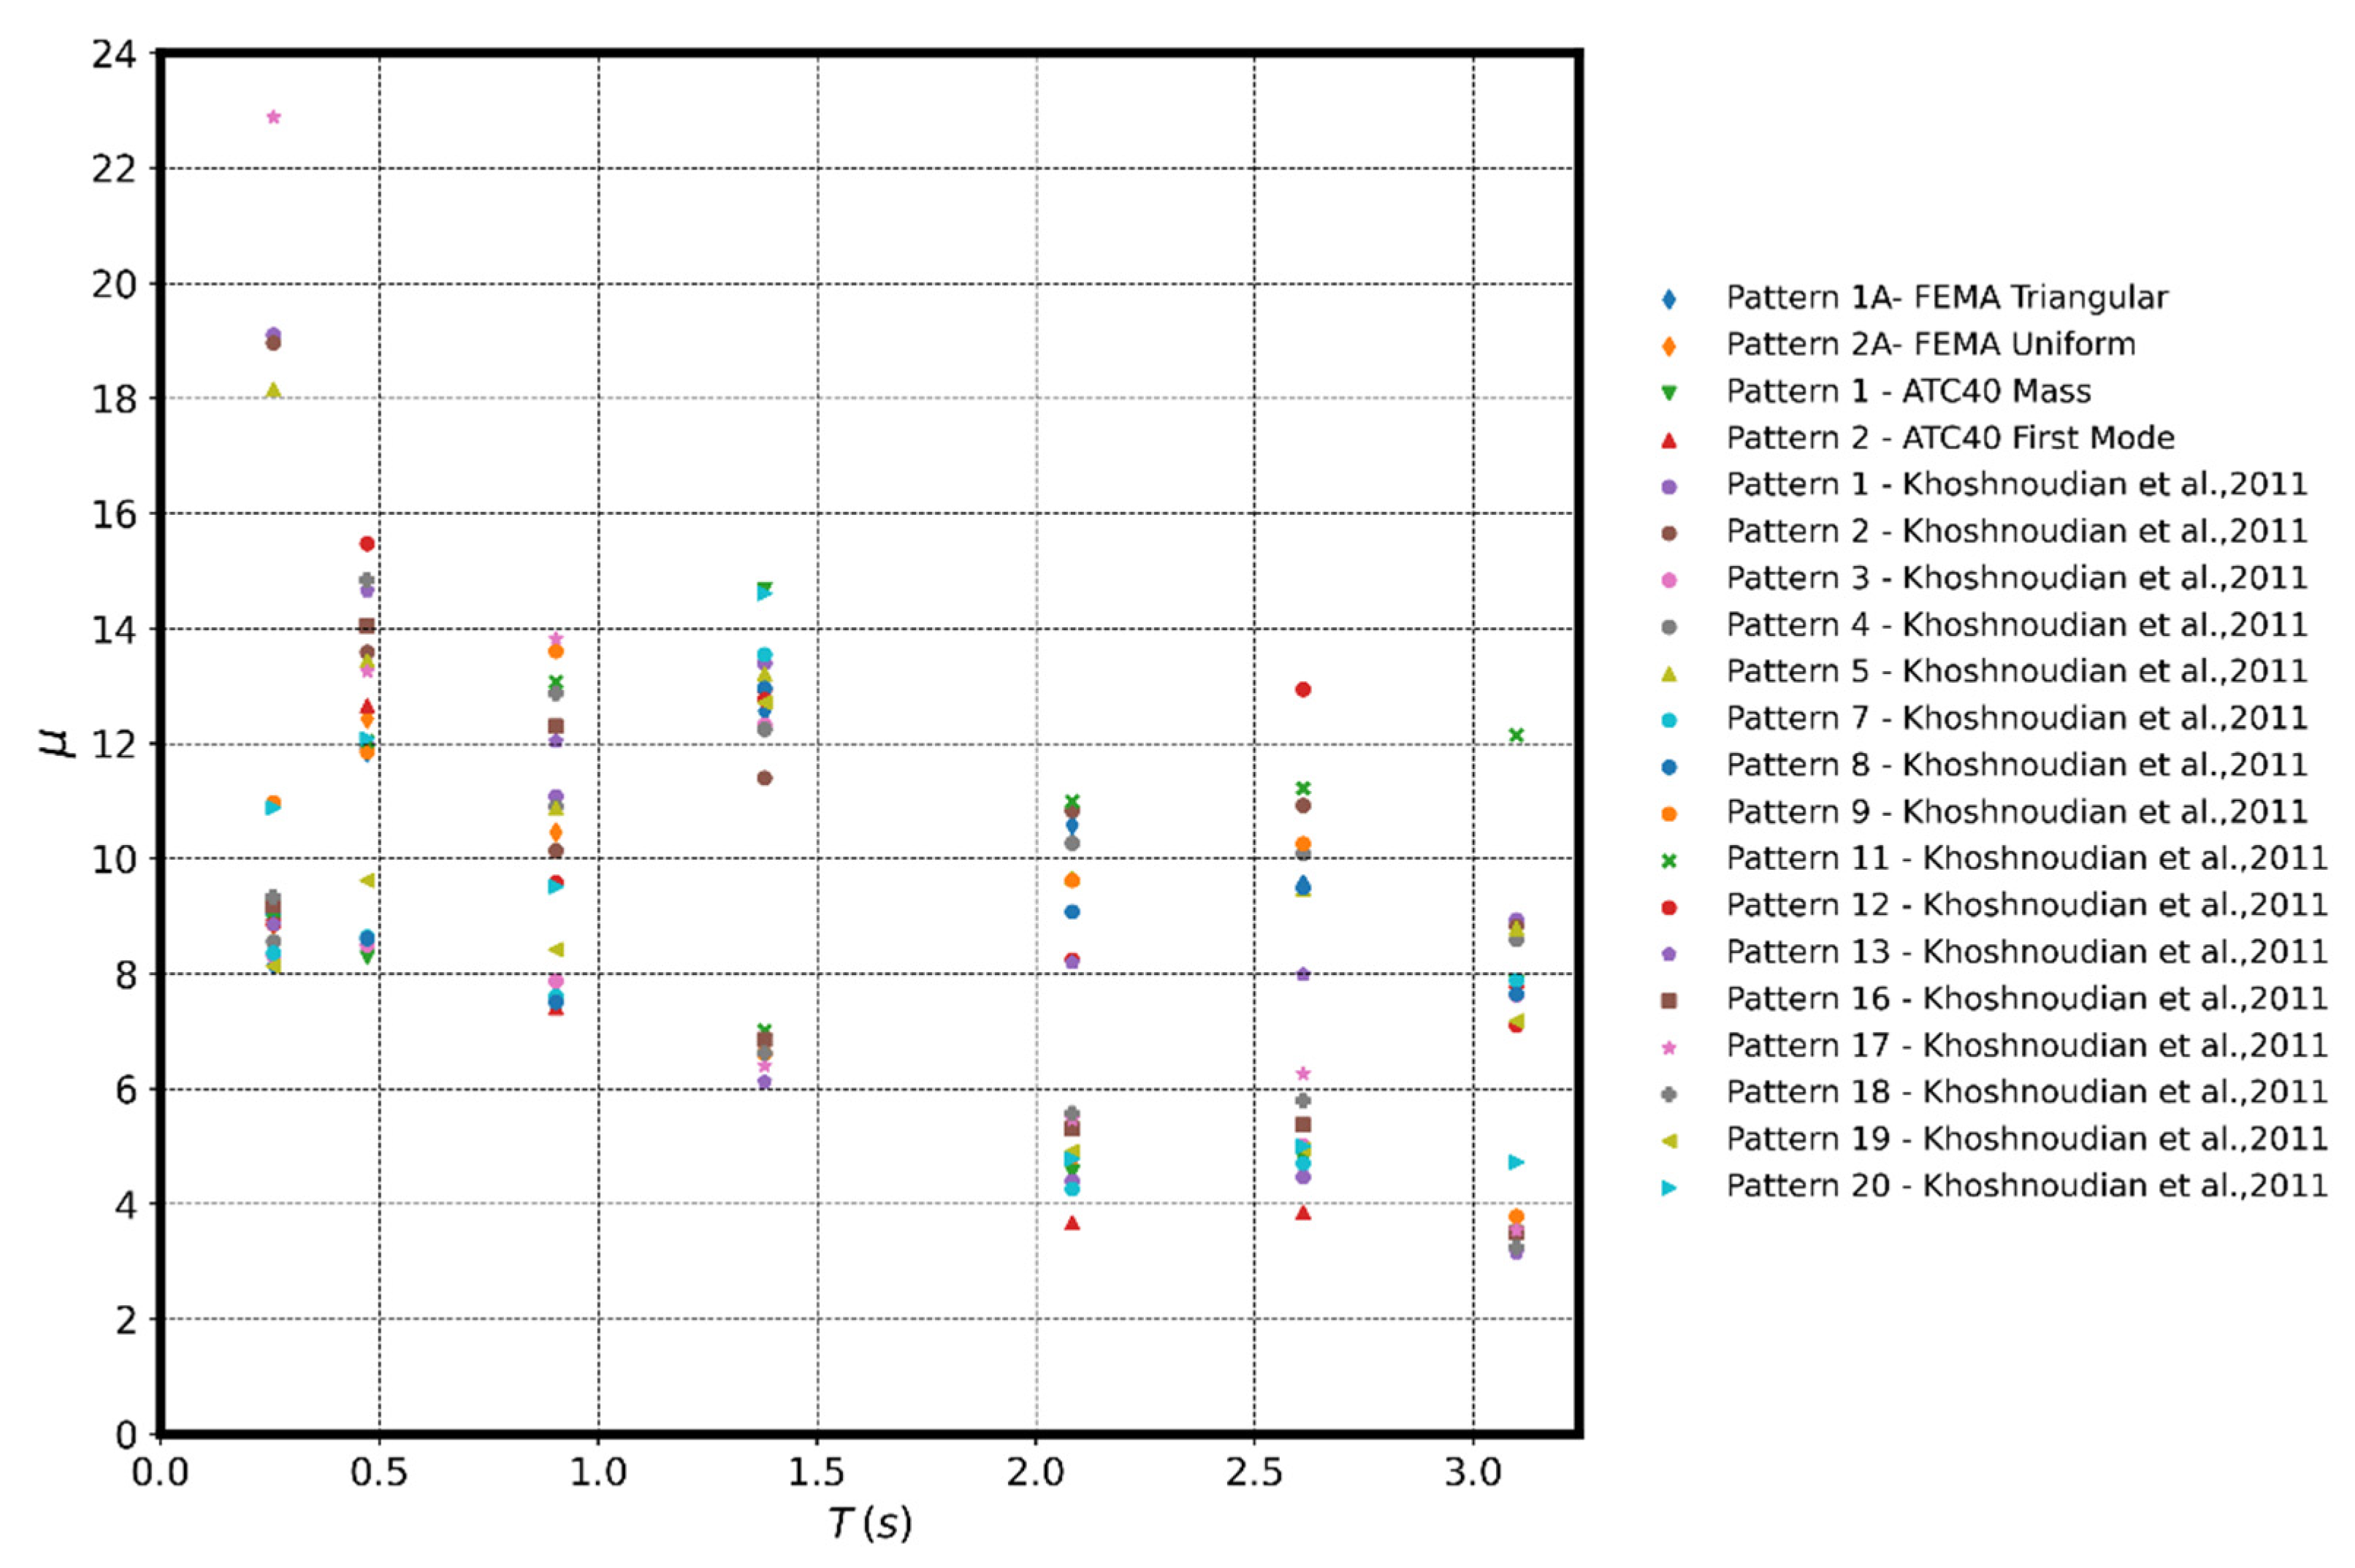
3.3. Results of the Pushover Analysis

The capacity curves from nonlinear static analysis are shown in Figure 5. The load patterns. P3 and P8, reached good adjustments in two-story CMF models, similar to the results obtained in [22] and the typical FEMA-356 and ATC-40 load patterns. Similar behaviors were obtained for the load patterns, P3 and P8, which reached good adjustments in four-story and eight-story CMF models, validated in [22]. This performance was similar to the typical FEMA-356 (except the uniform load pattern in both cases) and ATC-40 load patterns. These patterns are recommended in pushover analysis of low-rise buildings.
Furthermore, the load pattern, P9, reached good adjustments in the 12 story and 16 story CMF models, similar to the results obtained in [22] and the typical FEMA-356 and ATC-40 load patterns. The performance was similar to the typical FEMA-356 (except the triangular load pattern) and ATC-40 load patterns. These patterns are recommended in pushover analysis of low-rise and mid-rise buildings. Finally, a higher elastic behavior was obtained for the P17 load patterns in the 20 story and 24 story models, allowing to attain similar behaviors as the triangular FEMA load pattern.
The inelastic displacements resulting from the pushover analysis (∆ip) were compared with the design displacement obtained from the modal response spectrum analysis (∆i = Cd × ∆e). The ∆i values were similar to the ∆ip values given from the patterns P1A, P2A (FEMA), P1, and P2 (ATC-40). In addition, the patterns 3, 4, 8, 9, 11, 16, 17, and 20, according to [22], showed notable differences in comparison to ∆i ons the order of 35%.
Furthermore, the failure mechanisms in the models (uniquely for 16 story levels, because of the big number of data) according to the load patterns are shown in Figure 6. As shown in Figure 6, different failure mechanisms were obtained. In this sense, three failure mechanisms could be obtained: ductile, brittle, and combined failure mechanisms. The ductile failure mechanism was derived from plastic hinges in the beams. The brittle failure mechanism was represented by plastic hinges in the columns, and the combined failure mechanism was the combination between both failure mechanisms, but with hinges in the base of the columns. In the 16 story models, failure mechanisms without a clear trend were obtained. However, the failure mechanisms of the P9 load patterns were similar to the FEMA-365 uniform load pattern model, which is consistent with that mentioned above. Additionally, excessive ductile behavior was reached by the models with the P1(P1A)–P2–P5 load patterns, but this behavior was not completely representative of the real performance of CMF buildings [22]. Column hinges in models with 2, 4, 8, and 12 story levels were obtained uniquely for the load patterns 11 and 20, evidencing a non-desirable failure mechanism. The models that had 16, 20, and 24 story levels that were subjected to load patterns 11–12–13–17–18–20 developed column hinges.
In general, the beam hinges and ductile mechanisms were obtained in the models with 2, 4, 8, and 12 story levels subjected to the load patterns of FEMA 356 and ATC-40. Similar results were developed in the patterns 1–2–3–4–5–7–8, according to [22]. In high-rise models, a combined mechanism was obtained.
In Figure 7, the values of the ductility factor are shown for different periods. The R values increased as the story levels increased; therefore, the number of elements with the ability to perform inelastic incursions increased with number of stories. Average value ranges from 1.2 to 1.6 were obtained in the models with 2, 4, and 8 stories, while for the models with 12, 16, 20, and 24 stories, the average values ranging between 3 and 4.2 were obtained.
On the other hand, the overstrength values are shown in Figure 8. The values between 6 and 8.5 were reached in the models with 2, 4, 8, and 12 stories, while for the models with 16, 20, and 24 stories, they reached values between 1.9 and 2.5. Consequently, low-rise buildings designed according to [19,23] reached higher overstrength values. Moreover, understanding the concept of ductility as the scalar derived from the ultimate displacement divided by yielding displacement, the ductility average values in the range of 9–12 were obtained in the models with 2, 4, 8, and 12 stories. In addition, for the models with 16, 20, and 24 stories, the ductility values that achieved a range between 5 and 8 are shown in Figure 9.

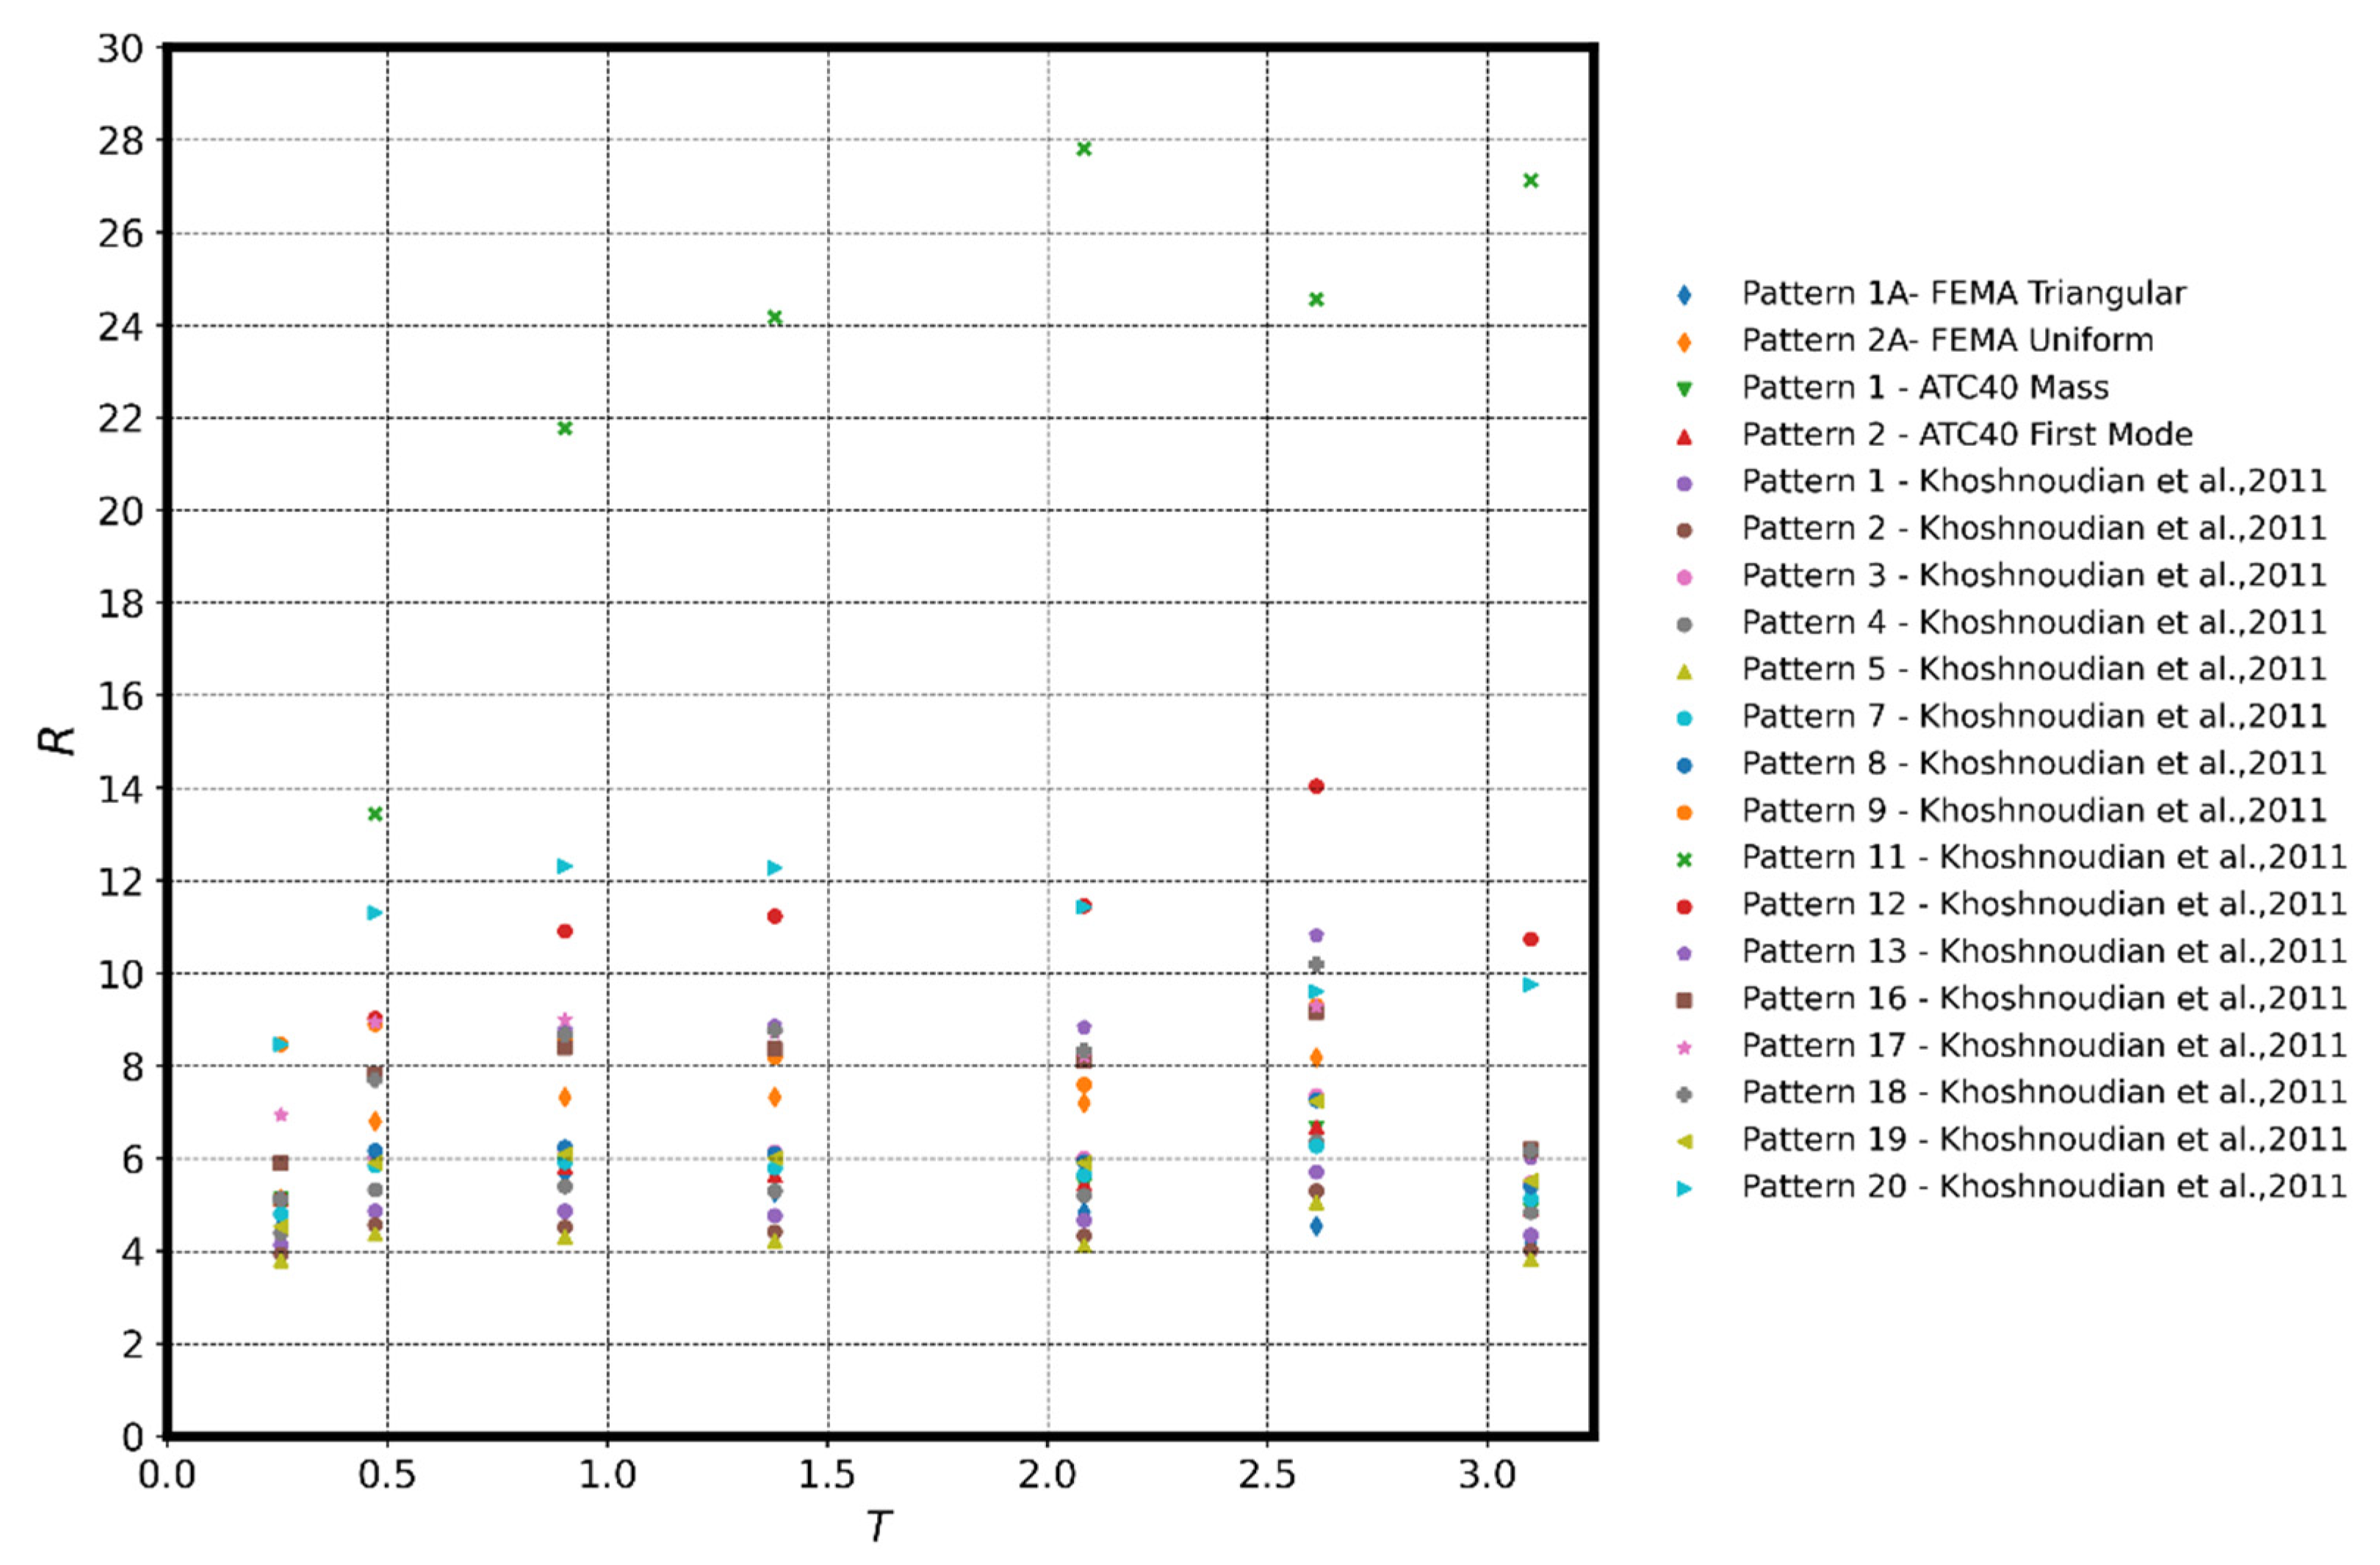
4. Comparison of Reduction Strength Factors Subjected to Lateral Load Patterns

One of the most important parameters in the seismic design of buildings is the strength reduction factor R. The reduction of seismic demand is deemed in the analysis when ductility and overstrength are provided to the structure. In Figure 10, R values ranging between 4 and 8 were obtained in all cases. In some cases, values higher than R = 14 for the P11 load pattern were reached, which are not representative of the behavior of the CMF structures. The strength reduction factor is controlled by the overstrength in models up to 12 stories and controlled by ductility factor for the models up to 24 stories. From Figure 10, it can be seen that the predominant R factor values for all models are at least 4 up to 6, for the standards established in FEMA 356 [21], FEMA 440 [27], and ATC-40 [20], as well as for the patterns 1, 3, 5, 7, 8, 9 [22]. The approximations obtained were similar to the normative values given in [19]. However, the pushover curves, shown previously, show that the relationship between the designed target displacement and the elastic displacement (Cd) did not agree with the normative values specified [19]. Therefore, a pattern that does not allow the objective values of the standard to be achieved will not allow an adequate evaluation of a structure using the static pushover analysis.
In Figure 11, a statistical fit was performed for the R values obtained. The R values were adjusted to a log-normal distribution, showing a 95% confidence interval when the R values were adjusted to R = 4. This adjustment reached a lower value in comparison to the value for R = 6 established in the Venezuelan standard for concrete moment frames. The value of R = 6 was adjusted to a confidence interval in order to 50% as shown in Figure 12.

5. Conclusions

In this research, the seismic assessment of reinforced concrete frames designed according to the new Venezuelan code COVENIN 1756-1 was performed. The quantification of design parameters, such as strength reduction factor (R), the overstrength factor (RΩ), and the ductility factor (Rµ), were obtained from the nonlinear analysis pushover according to FEMA P695, considering different load patterns. Subsequently, these factors were compared with similar factors established in the Venezuelan code. The main conclusions are listed as follow:
  • A linear adjustment in designed models was obtained, except in the range between 1 and 1.5 s where a plateau was observed. This evidence can be derived from the rigidity transition zone between medium-rise and high-rise buildings;
  • The overstrength factor (RΩ) obtained for low-rise and medium-rise frames reached values between 3.5 and 12, while for high-rise frames, values under 3 were obtained. In comparison to RΩ = 3 established in the Venezuelan code COVENIN 1756-1 for concrete moment frames, the values obtained were adjusted for high-rise buildings;
  • The FEMA and ATC-40 patterns allowed to obtain RΩ values closer to the median of distribution from the analyzed patterns, demonstrating that not all patterns studied were representative for concrete moment frames with different stories;
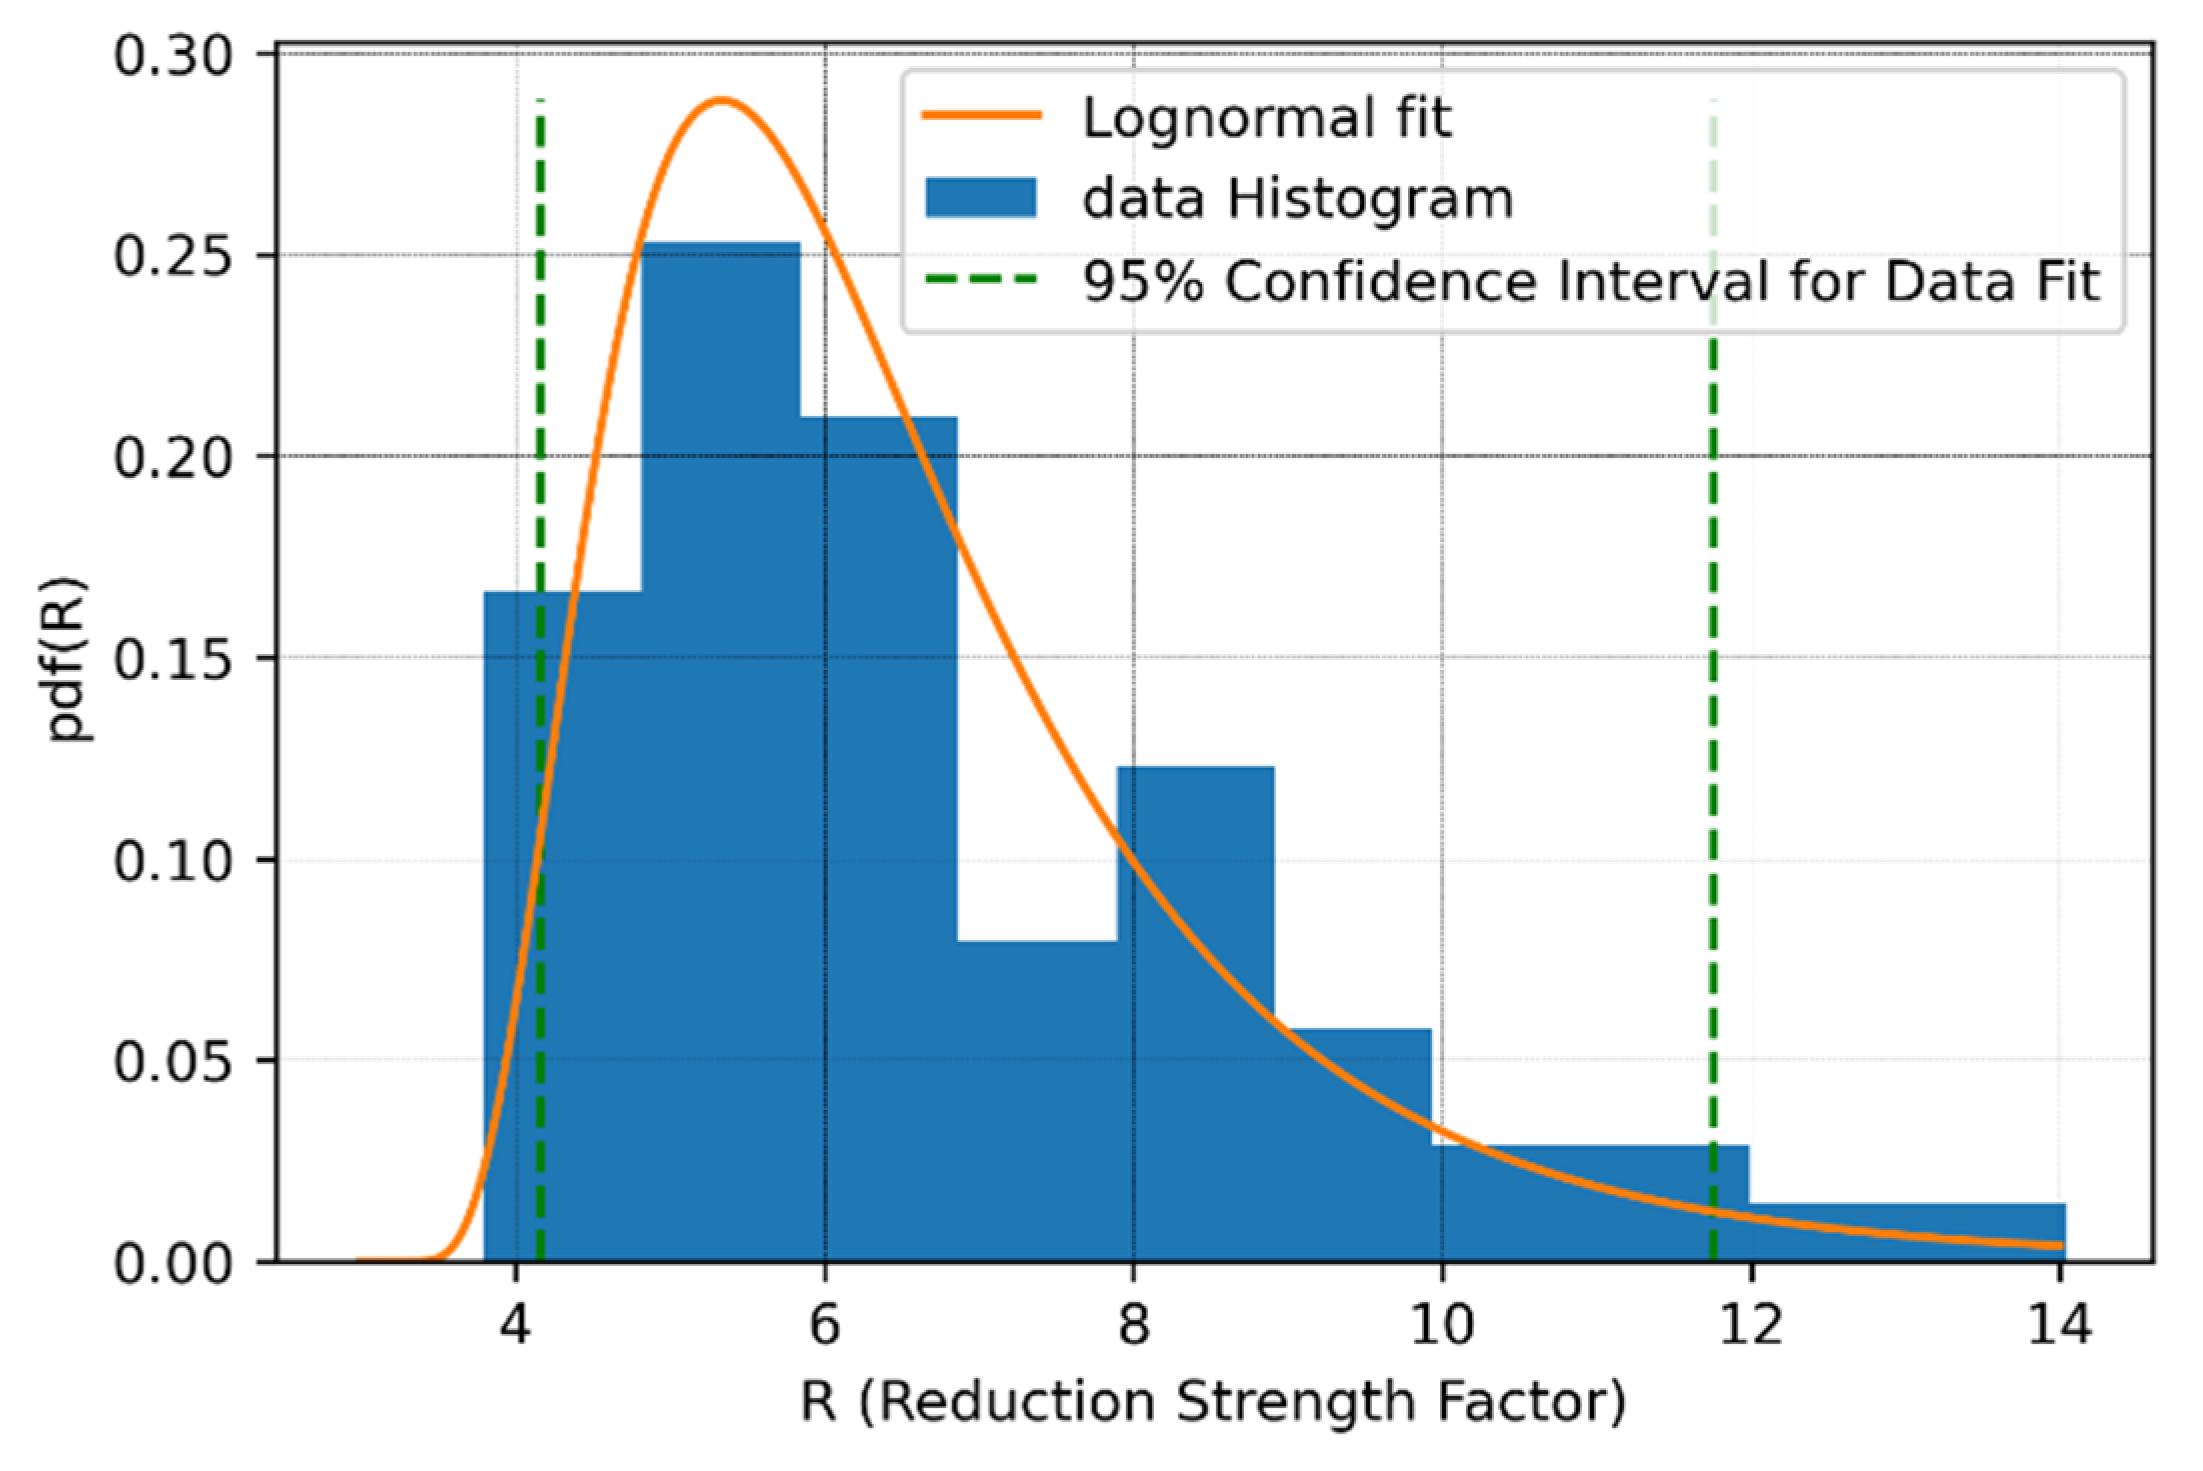
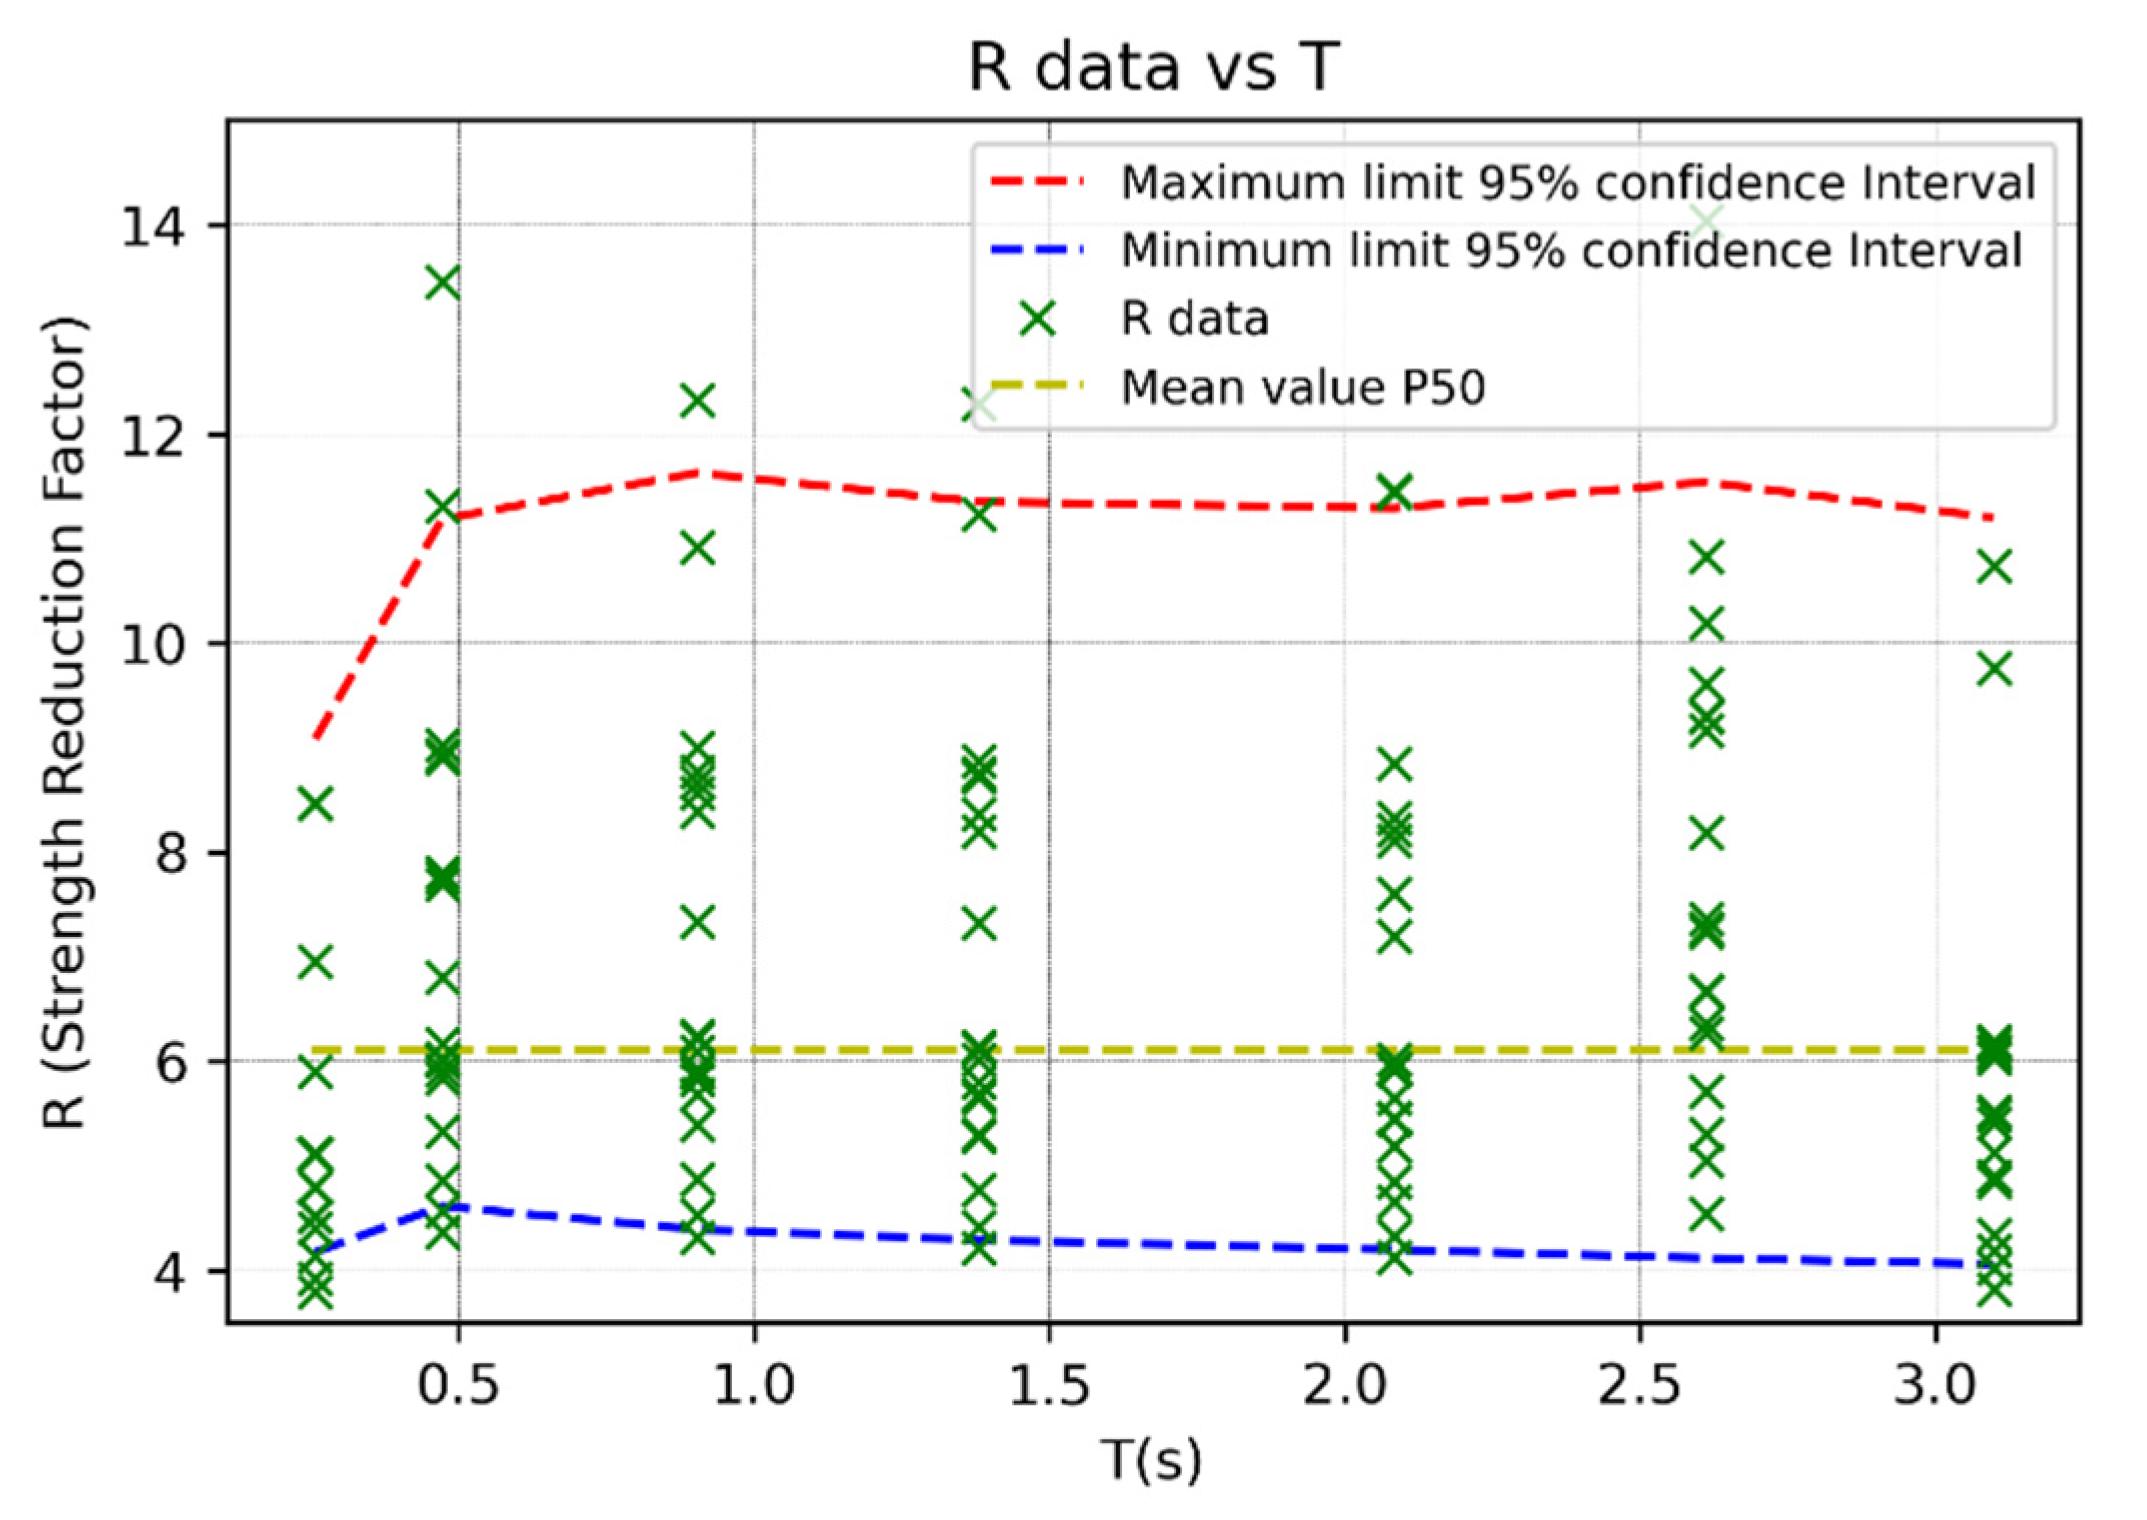
  • The strength reduction factor (R) obtained for all models analyzed reaches the values between 3.8 and 14. In comparison to R = 6 established in Venezuelan code COVENIN 1756-1 for concrete moment frames, obviously the pattern 11 was not deemed because is not representative to the models studied;
  • Load patterns 8, 9, 11, 16, 17 according to [22] did not show representative behaviors according to the R values obtained for these patterns, mainly due to the fact that these models reached Rµ values not consistent with the failure mechanism obtained. Likewise, the pushover curve for these patterns showed a behavior meanly controlled by overstrength and not for inelastic incursion;
  • The load patterns were dependent on the configurations of the structures. In this sense, the load patterns specified by ATC-40 and the triangular of FEMA-356 were more adjusted to low-rise buildings, while for medium-rise or high-rise buildings the uniform patterns were more representative. This was verified with the patterns proposed in the literature review, where patterns that concentrate higher forces in lower zones are more representative of high-rise structures;
  • The failure mechanisms obtained in low-rise buildings were mainly ductile and reached mechanisms combined with column failure for high-rise buildings despite complying with the design provisions according to ACI-318. This was mainly due to the high axial load levels and second-order effects that modified the behavior of the columns;
  • The strength reduction factor specified in the new Venezuelan code was higher than the values obtained for the 95% confidence levels according to the distribution obtained in the reinforced concrete frame models studied.

Author Contributions

Conceptualization, E.N.-C. and R.T.-M.; methodology, E.N.-C. and R.T.-M.; software, R.M.-L., A.I.-R. and J.S.-R.; validation, E.N.-C. and R.T.-M.; formal analysis, R.M.-L., A.I.-R., and J.S.-R.; investigation, E.N.-C. and R.T.-M.; writing—original draft preparation, E.N.-C.; writing—review and editing, E.N.-C. and R.M.-L.; visualization, G.B.-L., E.N.-C. and R.M.-L.; supervision, E.N.-C. and R.T.-M.; project administration, E.N.-C. and G.B.-L. All authors have read and agreed to the published version of the manuscript.

Funding

This research received no external funding.

Institutional Review Board Statement

Not Applicable.

Informed Consent Statement

Informed consent was obtained from all subjects involved in the study.

Data Availability Statement

The data presented in this study are available on request from the corresponding author.

Conflicts of Interest

The authors declare no conflict of interest.

References

  1. Krawinkler, H.; Seneviratna, G.D.P.K. Pros and cons of a pushover analysis of seismic performance evaluation. Eng. Struct. 1998, 20, 452–464. [Google Scholar] [CrossRef]
  2. Sullivan, T.; Saborio-Romano, D.; O′Reilly, G.; Welch, D.; Landi, L. Simplified pushover analysis of moment resisting frame structures. J. Earthq. Eng. 2021, 25, 621–648. [Google Scholar] [CrossRef]
  3. Bergami, A.V.; Nuti, C.; Lavorato, D.; Fiorentino, G.; Briseghella, B. IMPAβ: Incremental modal pushover analysis for bridges. Appl. Sci. 2020, 10, 4287. [Google Scholar] [CrossRef]
  4. Habibi, A.; Samadi, M.; Izadpanah, M. Practical relations to quantify the amount of damage of SWRCFs using pushover analysis. Adv. Concr. Construction. 2020, 10, 271–278. [Google Scholar]
  5. Bakalis, A.; Makarios, T.; Athanatopoulou, A. Inelastic dynamic eccentricities in pushover analysis procedure of multi-story RC buildings. Buildings 2021, 11, 195. [Google Scholar] [CrossRef]
  6. Azizi-Bondarabadi, H.; Mendes, N.; Lourenco, P. Higher mode effects in pushover analysis of irregular masonry buildings. J. Earthq. Eng. 2021, 25, 1459–1493. [Google Scholar] [CrossRef]
  7. Jiang, J.; Xu, C.; El Naggar, H.; Du, X.; Xu, Z.; Assaf, J. Improved pushover method for seismic analysis of shallow buried underground rectangular frame structure. Soil Dyn. Earthq. Eng. 2021, 140, 106363. [Google Scholar] [CrossRef]
  8. Shehu, R. Implementation of pushover analysis for seismic assessment of masonry towers: Issues and practical recommendations. Buildings 2021, 11, 71. [Google Scholar] [CrossRef]
  9. Tamura, S.; Ohno, Y.; Shibata, K.; Funahara, H.; Nagao, T.; Kawamata, Y. E-Defense shaking test and pushover analyses for lateral pile behavior in a group considering soil deformation in vicinity of piles. Soil Dyn. Earthq. Eng. 2021, 142, 106529. [Google Scholar] [CrossRef]
  10. Fujii, K.; Mogi, Y.; Noguchi, T. Predicting maximum and cumulative response of a base-isolated building using pushover analysis. Buildings 2020, 10, 91. [Google Scholar] [CrossRef]
  11. Qu, C.; Zhou, Y. A new lateral load pattern for pushover analysis of asymmetric-plan structures. J. Vibroeng. 2020, 22, 1113–1125. [Google Scholar] [CrossRef]
  12. Vasilopoulos, A.; Kamaris, G. Seismic design of space steel frames using advanced static inelastic (pushover) analysis. Soil Dyn. Earthq. Eng. 2020, 29, 194–218. [Google Scholar] [CrossRef]
  13. Zhang, Y.; Chen, X.; Zhang, X.; Ding, M.; Wang, Y.; Liu, Z. Nonlinear response of the pile group foundation for lateral loads using pushover analysis. Earthq. Struct. 2020, 19, 273–286. [Google Scholar]
  14. Mwafy, A.; Elnashai, A. Static pushover versus dynamic collapse analysis of RC buildings. Eng. Struct. 2001, 23, 407–424. [Google Scholar] [CrossRef]
  15. Kurniawandy, A.; Nakazawa, S. A Proposal of seismic index for existing buildings in Indonesia using pushover analysis. J. Eng. Technol. Sci 2020, 52, 310–330. [Google Scholar]
  16. Seyedkazemi, A.; Rofooei, F. Comparison of static pushover analysis and IDA-based probabilistic methods for assessing the seismic performance factors of diagrid structures. Sci. Iran. 2020, 28, 124–137. [Google Scholar]
  17. Quantification of building seismic performance factors. In FEMA P695; US Department of Homeland Security, FEMA: Washington, DC, USA, 2009.
  18. Chopra, A.K. Dynamics of Structures, Theory and Applications to Earthquake Engineering, 4th ed.; Pearson Education Limited: London, UK, 2017. [Google Scholar]
  19. Comisión Venezolana de Normas Industriales, Fodenorca. Construcciones Sismorresistentes. In Norma Venezolana COVENIN 1756-1:2019; Comisión Venezolana de Normas Industriales, Fodenorca: Caracas, Venezuela, 2019. [Google Scholar]
  20. ATC 40; Seismic Evaluation and Retrofit of Concrete Buildings; Applied Technology Council: Redwood City, CA, USA, 1996.
  21. FEMA 356; Prestandard and Commentary for the Seismic Rehabilitation of Buildings; Federal Emergency Management Agency: Washington, DC, USA, 2000.
  22. Khoshnoudian, F.; Mestri, S.; Abedinik, F. Proposal of lateral load pattern for pushover analysis of RC buildings. Comput. Methods Civ. Eng. 2011, 2, 169–183. [Google Scholar]
  23. ASCE 41; Seismic Evaluation and Rehabilitation of Existing Buildings; American Society of Civil Engineers: Reston, VA, USA, 2017.
  24. ACI 318; Building Code Requirements for Structural Concrete (ACI 318-19) and Commentary (ACI 318R-19); American Concrete Institute: Farmington Hills, MA, USA, 2019.
  25. SAP2000 v23; Computer and Structures, Inc.: Berkeley, CA, USA, 2000.
  26. Birely, A.C.; Lowes, L.N.; Lehman, D.E. Linear analysis of concrete frames considering joint flexibility. ACI Struct. J. 2012, 109, 381–391. [Google Scholar]
  27. FEMA 440; Improvement of Nonlinear Static Seismic Analysis Procedures; Applied Technology Council: Redwood City, CA, USA, 2005.
  28. Ruggieri, S.; Uva, G. Accounting for the spatial variability of seismic motion in the pushover analysis of regular and irregular RC buildings in the new Italian building code. Buildings 2020, 10, 177. [Google Scholar] [CrossRef]
  29. Takeda, T.; Sozen, M.; Nielsen, N. Reinforced concrete response to simulated earthquakes. ASCE J. Struct. Div. 1970, 96, 2557–2573. [Google Scholar] [CrossRef]
Figure 1. Response spectra according to COVENIN 1756-1 (2019).
Buildings 12 00255 g001
Figure 2. Schematic view of the plane frame models studied.
Buildings 12 00255 g002
Figure 3. Design shear versus period for the models analyzed.
Buildings 12 00255 g003
Figure 4. Typical moment–rotation curve for reinforced concrete according to ASCE 41 [23].
Buildings 12 00255 g004
Figure 5. Nonlinear static pushover curves.
Buildings 12 00255 g005aBuildings 12 00255 g005b
Figure 6. Failure mechanisms in the 16 story models according to different load patterns.
Buildings 12 00255 g006aBuildings 12 00255 g006bBuildings 12 00255 g006c
Figure 7. Ductility reduction factor versus period for different patterns.
Buildings 12 00255 g007
Figure 8. Overstrength factor versus period for different patterns.
Buildings 12 00255 g008
Figure 9. Ductility factor versus period for different patterns.
Buildings 12 00255 g009
Figure 10. Strength reduction factor versus period for different patterns.
Buildings 12 00255 g010
Figure 11. Statistical adjustment of the R factor.
Buildings 12 00255 g011
Figure 12. Maximum and minimum limits of the confidence interval.
Buildings 12 00255 g012
Table 1. Variations of the beams and columns designed according to COVENIN 1756-1 (2019).
ModelLevelElementb (cm)h (cm)Aslong (cm2)Astop (cm2)Asbot (cm2)Asv (cm2)
2 Story levels1Column505062.08 5.08
1Beam4060 14.2514.32.13
2Column505062.08 5.08
2Beam4060 8.558.61.42
4 Story levels1Column606062.08 5.08
1Beam4060 17.117.12.84
2–3Column505062.08 5.08
2– 3Beam4060 17.117.12.84
4Column505062.08 5.08
4Beam4060 8.558.62.13
8 Story levels1–4Column808093.12 6.35
1–4Beam4060 25.3525.42.13
5–7Column707093.12 6.35
5–7Beam4060 19.419.42.13
8Column707093.12 6.35
8Beam4060 11.6411.62.13
12 Story levels1–8Column9090121.68 7.62
1– 8Beam4060 25.3525.42.13
9–11Column707093.12 7.62
9–11Beam4060 19.419.42.13
12Column707093.12 7.62
12Beam4060 11.6411.62.13
16 Story levels1–4Column9090101.4 5.08
1–4Beam4060 30.7315.52.84
5 to 9Column808077.6 5.08
5–9Beam4060 30.715.52.84
9–12Column707057 5.08
9–12Beam4060 30.715.52.84
13–15Column707057 5.08
13–15Beam4060 27.1619.42.84
16Column707057 5.08
16Beam4060 11.411.42.13
20 Story levels1–4Column100100121.68 7.62
1–4Beam4060 43.2521.82.84
5–11Column9090101.4 5.08
5–11Beam4060 43.2521.82.84
12Column9090101.4 5.08
12Beam4060 35.4925.42.84
13Column808077.6 5.08
13Beam4060 35.4925.42.84
14Column808077.6 5.08
14Beam4060 35.4925.42.84
15–19Column707057 5.08
15–19Beam4060 30.7315.52.84
20Column707057 5.08
20Beam4060 11.411.42.84
24 Story levels1–6Column110110121.68 7.62
1–6Beam4060 49.5125.42.84
7Column100100121.68 7.62
7Beam4060 49.525.42.84
8Column100100121.68 7.62
8Beam4060 49.525.42.84
9–11Column9090101.4 5.08
9–11Beam4060 49.525.42.84
12–18Column9090101.4 5.08
12–18Beam4060 43.2521.82.84
19Column808077.6 5.08
19Beam4060 35.4925.42.84
20–23Column808077.6 5.08
20–23Beam4060 30.7315.52.84
24Column707057 5.08
24Beam4060 11.411.42.13
Publisher’s Note: MDPI stays neutral with regard to jurisdictional claims in published maps and institutional affiliations.

