Article

Behavior of One-Way Reinforced Concrete Slabs with Polystyrene Embedded Arched Blocks

by
Ali Hussein Ali Al-Ahmed
1,
Falah Hasan Ibrahim
2,
Abbas AbdulMajeed Allawi
1 and
Ayman El-Zohairy
3,*
1
Department of Civil Engineering, University of Baghdad, Baghdad 17001, Iraq
2
Ministry of Education, Baghdad 17001, Iraq
3
Department of Engineering and Technology, Texas A&M University-Commerce, Commerce, TX 75429, USA
*
Author to whom correspondence should be addressed.
Buildings 2022, 12(3), 331; https://doi.org/10.3390/buildings12030331
Submission received: 21 January 2022 / Revised: 5 March 2022 / Accepted: 8 March 2022 / Published: 10 March 2022
(This article belongs to the Collection Advanced Concrete Structures in Civil Engineering)

Abstract

:
This study presents experimental and numerical investigations on seven one-way, reinforced concrete (RC) slabs with a new technique of slab weight reduction using polystyrene-embedded arched blocks (PEABs). All slabs had the same dimensions, steel reinforcement, and concrete compressive strength. One of these slabs was a solid slab, which was taken as a control slab, while the other six slabs were cast with PEABs. The main variables were the ratio of the length of the PEABs to the length of the slab (lp/L) and the ratio of the height of the PEABs to the total slab depth (hP/H). The minimum decrease in the ultimate load capacity was about 6% with a minimum reduction in the slab weight of 15%. In contrast, the maximum decrease in the ultimate load capacity was about 24% with a maximum reduction in the slab weight of 40%. Moreover, the mode of failure changed from flexure to shear failure, especially for those slabs with an lP/L ratio equal to one. The geometric and material non-linearity was adopted in the proposed finite element (FE) model to simulate the slabs with PEABs using Abaqus software. Good agreement was obtained between the developed FE and experimental results.

1. Introduction

Slabs are pivotal members for any structural building to make spaces. Their role is necessary for roof and floor constructions and decks of bridges. In this context, slab construction may take various forms, such as ribbed slabs, cast-in-situ solid, and precast units. Aside from this, they can extend in one or two directions to transport their loads to concrete beams, walls, steel beams, and columns. In 2000, voided slabs were introduced as a novel way to minimize the self-weight by effectively replacing a large volume of concrete with inserts [1]. The voided concrete slabs are a system that removes the non-working or excess concrete from the structural slab and replaces it with void formers. These void formers are usually made out of plastic or any recycled materials. A variety of shapes can be used for the void formers depending on the design of the slab. Spheres, boxes, ellipsoids, and toroids are the common shapes of voids [2,3,4]. The voids are usually placed in a grid-like arrangement, temporarily supported by a framework, which is eventually enveloped in concrete. The voids are commonly located between the top and bottom reinforcement meshes along the span. When a load starts acting on a voided slab, the compressive force tends to be fully captured by the concrete above the void while the tensile force is captured by the steel in tension zones. The reduction in self-weight of voided slabs is found to be in the range of 20% to 30% compared to a similar, solid slab [5,6,7,8,9,10]. In general, the concept of voided slabs using other types of voids is still in the process of being studied. The arched shape void is one of them. The arch was originally used in construction of a footbridge [11].
During the last decays, numerous analytical and experimental studies were conducted to investigate the effect of voids embedded in concrete slabs in aspects of their materials and geometry [12,13,14,15]. Generally, the main focus of these studies was on the reductions in weight, as well as the flexural and shear strength. Voids, thin web, and thin flanges were considered the weak points of the hollow-core slab. The structural damages in these hollow-core units were not repaired or strengthened [12]. The deflections, as well as the concrete compressive strains, under service load were a little higher than those of an equivalent, solid slab [13]. Voided slab specimens with spherical and cuboid shapes of voids were prepared and tested, which were manufactured using recycled polypropylene. The flexural stiffness of voided specimens was approximately 50% less in comparison to solid slabs of identical dimensions and reinforcement at the yield stage [16].
Currently, research on polystyrene-embedded arched blocks is very limited. This manuscript adds valuable test data for voided slabs with polystyrene-embedded arched blocks. From this source and the latest studies in this field of voided slabs, this study presents experimental and numerical investigations on seven one-way, reinforced concrete (RC) slabs with a new technique of slab weight reduction using polystyrene-embedded arched blocks (PEABs). All slabs had the same dimensions, steel reinforcement, and concrete compressive strength. One of these slabs was a solid slab, which was taken as a control specimen, while the other six slabs were cast with PEABs. The main variables were the ratio of the length of the PEABs to the length of the slab (lp/L) and the ratio of the height of the PEABs to the total slab depth (hP/H). The geometric and material non-linearity was adopted in the proposed finite element (FE) model to simulate the slabs with PEABs, using Abaqus software. Validations of the developed FE model were obtained using the experimental data.

2. Experimental Work

2.1. Material Specifications

According to the testing program, crushed coarse and fine aggregate, ordinary Portland cement (Type I), and tap water were used for casting all tested specimens. The concrete mix design was intended to give a compressive strength of 40 MPa [C40]. However, the compressive strength of concrete (fc’) at 28 days was 37.2 MPa. Steel bars of ϕ 8 mm, having yield stress (fy) and ultimate strength (fu) of 543 MPa and 636 MPa, respectively, were used for the top curved and straight reinforcement (see Figure 1), while steel bars of ϕ 10 mm, having yield stress and ultimate strength of 618 MPa and 691 MPa, respectively, were used for the bottom reinforcement. Furthermore, high-density polystyrene blocks, having a unit weight of 16.7 kg/m3, were used to fabricate the arched voids within the tested slabs.

2.2. Description of the Specimens’ Parameters

The experimental study included testing seven RC slabs under two-line loading up to failure. Each specimen had a total length of 2100 mm, a clear span (L) of 2000 mm, a width of 570 mm, and an overall depth (H) of 250 mm. The control specimen (solid slab), which was denoted as SD, was prepared without PEABs. The remaining specimens were prepared with different depths and lengths of PEABs. The PEABs were used with a constant width of 500 mm; different lengths (lP) of 1000 mm, 1500 mm, and 2000 mm; and different heights (hP) of 135 mm and 170 mm. The length and height of the PEABs were determined as ratios of the slab length and thickness, respectively. The heights of the PEABs were taken as 0.7 and 0.54 of the slab thickness, whereas the lengths of the PEABs were taken as 0.5, 0.75, and 1.0 of the slab length. These parameters were selected to avoid premature failures due to the shortage in the mass of concrete. Table 1 summarizes the details of the seven RC slabs according to the type of slab (solid or voided), length, and height of the PEABs.

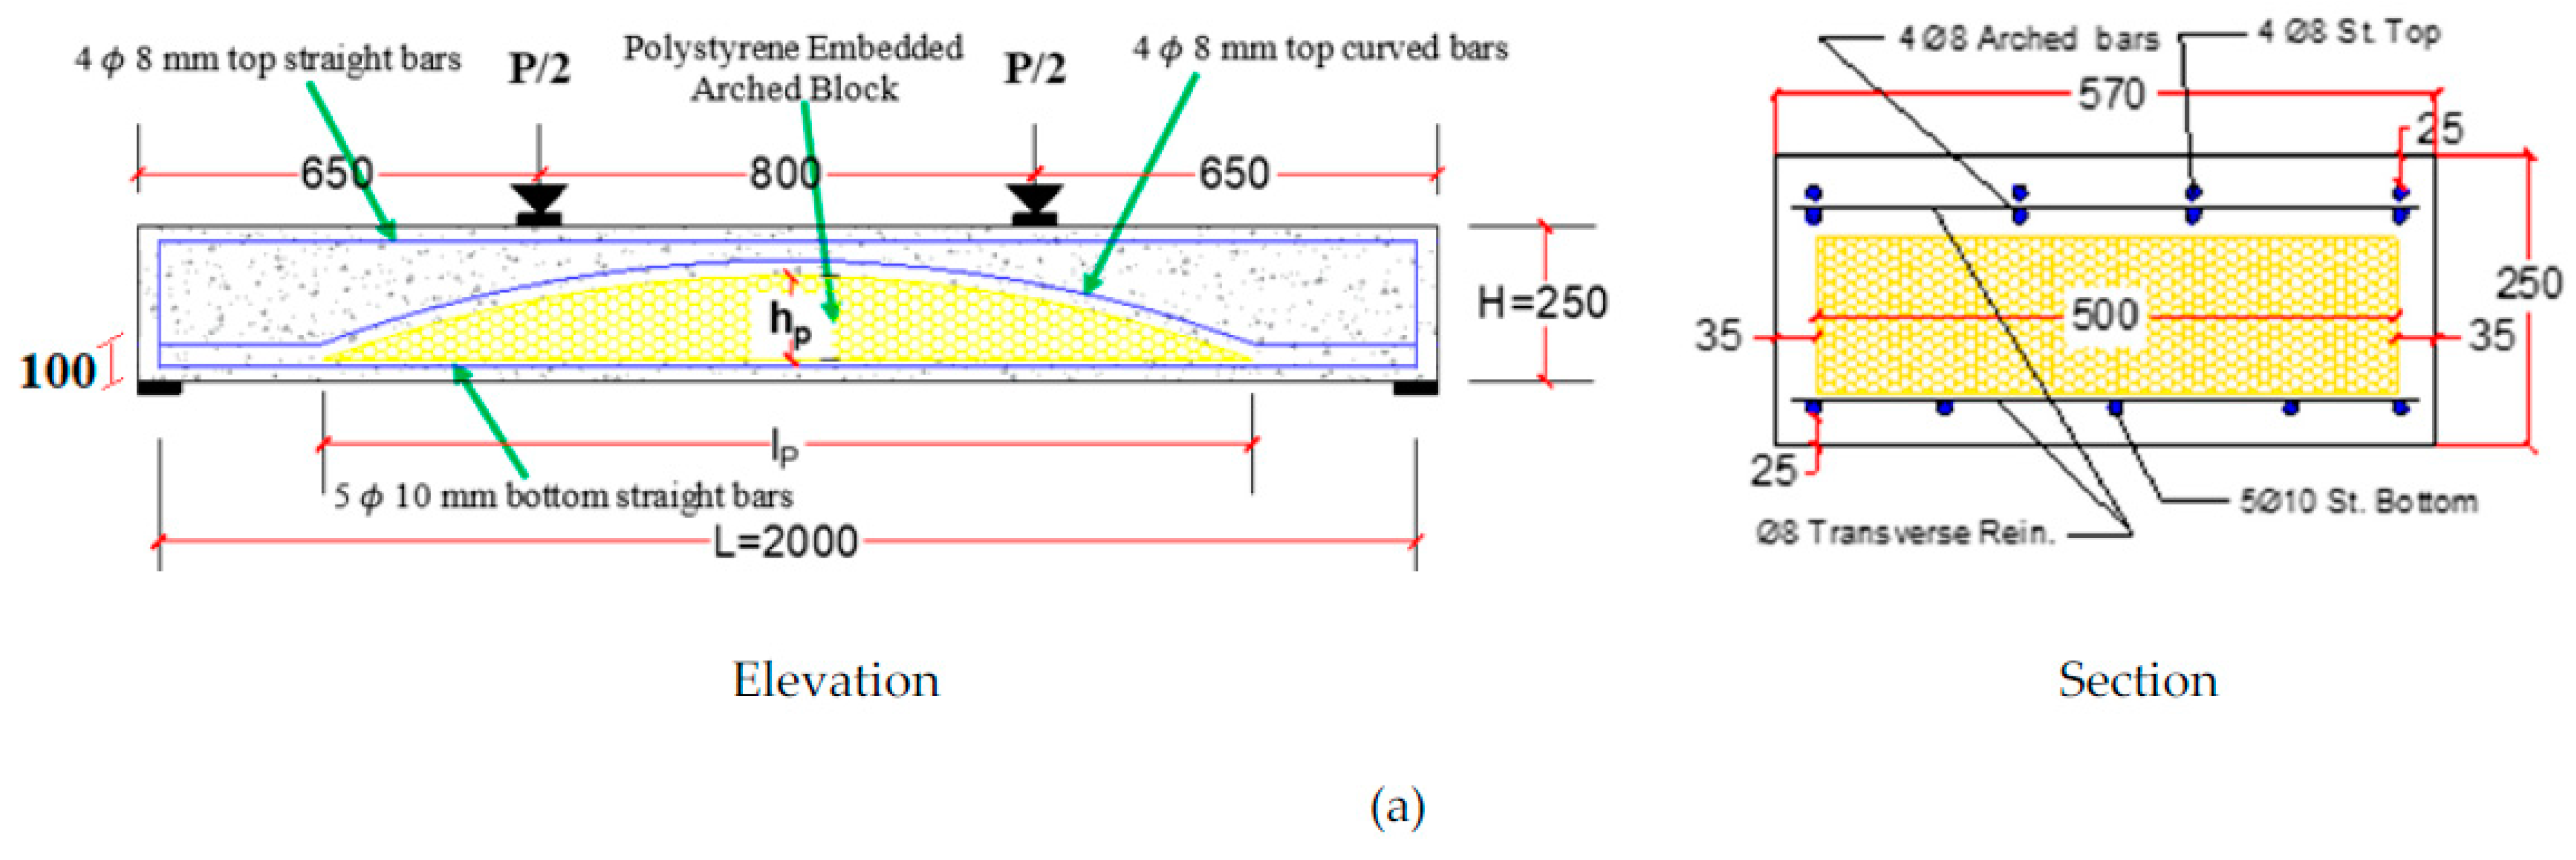
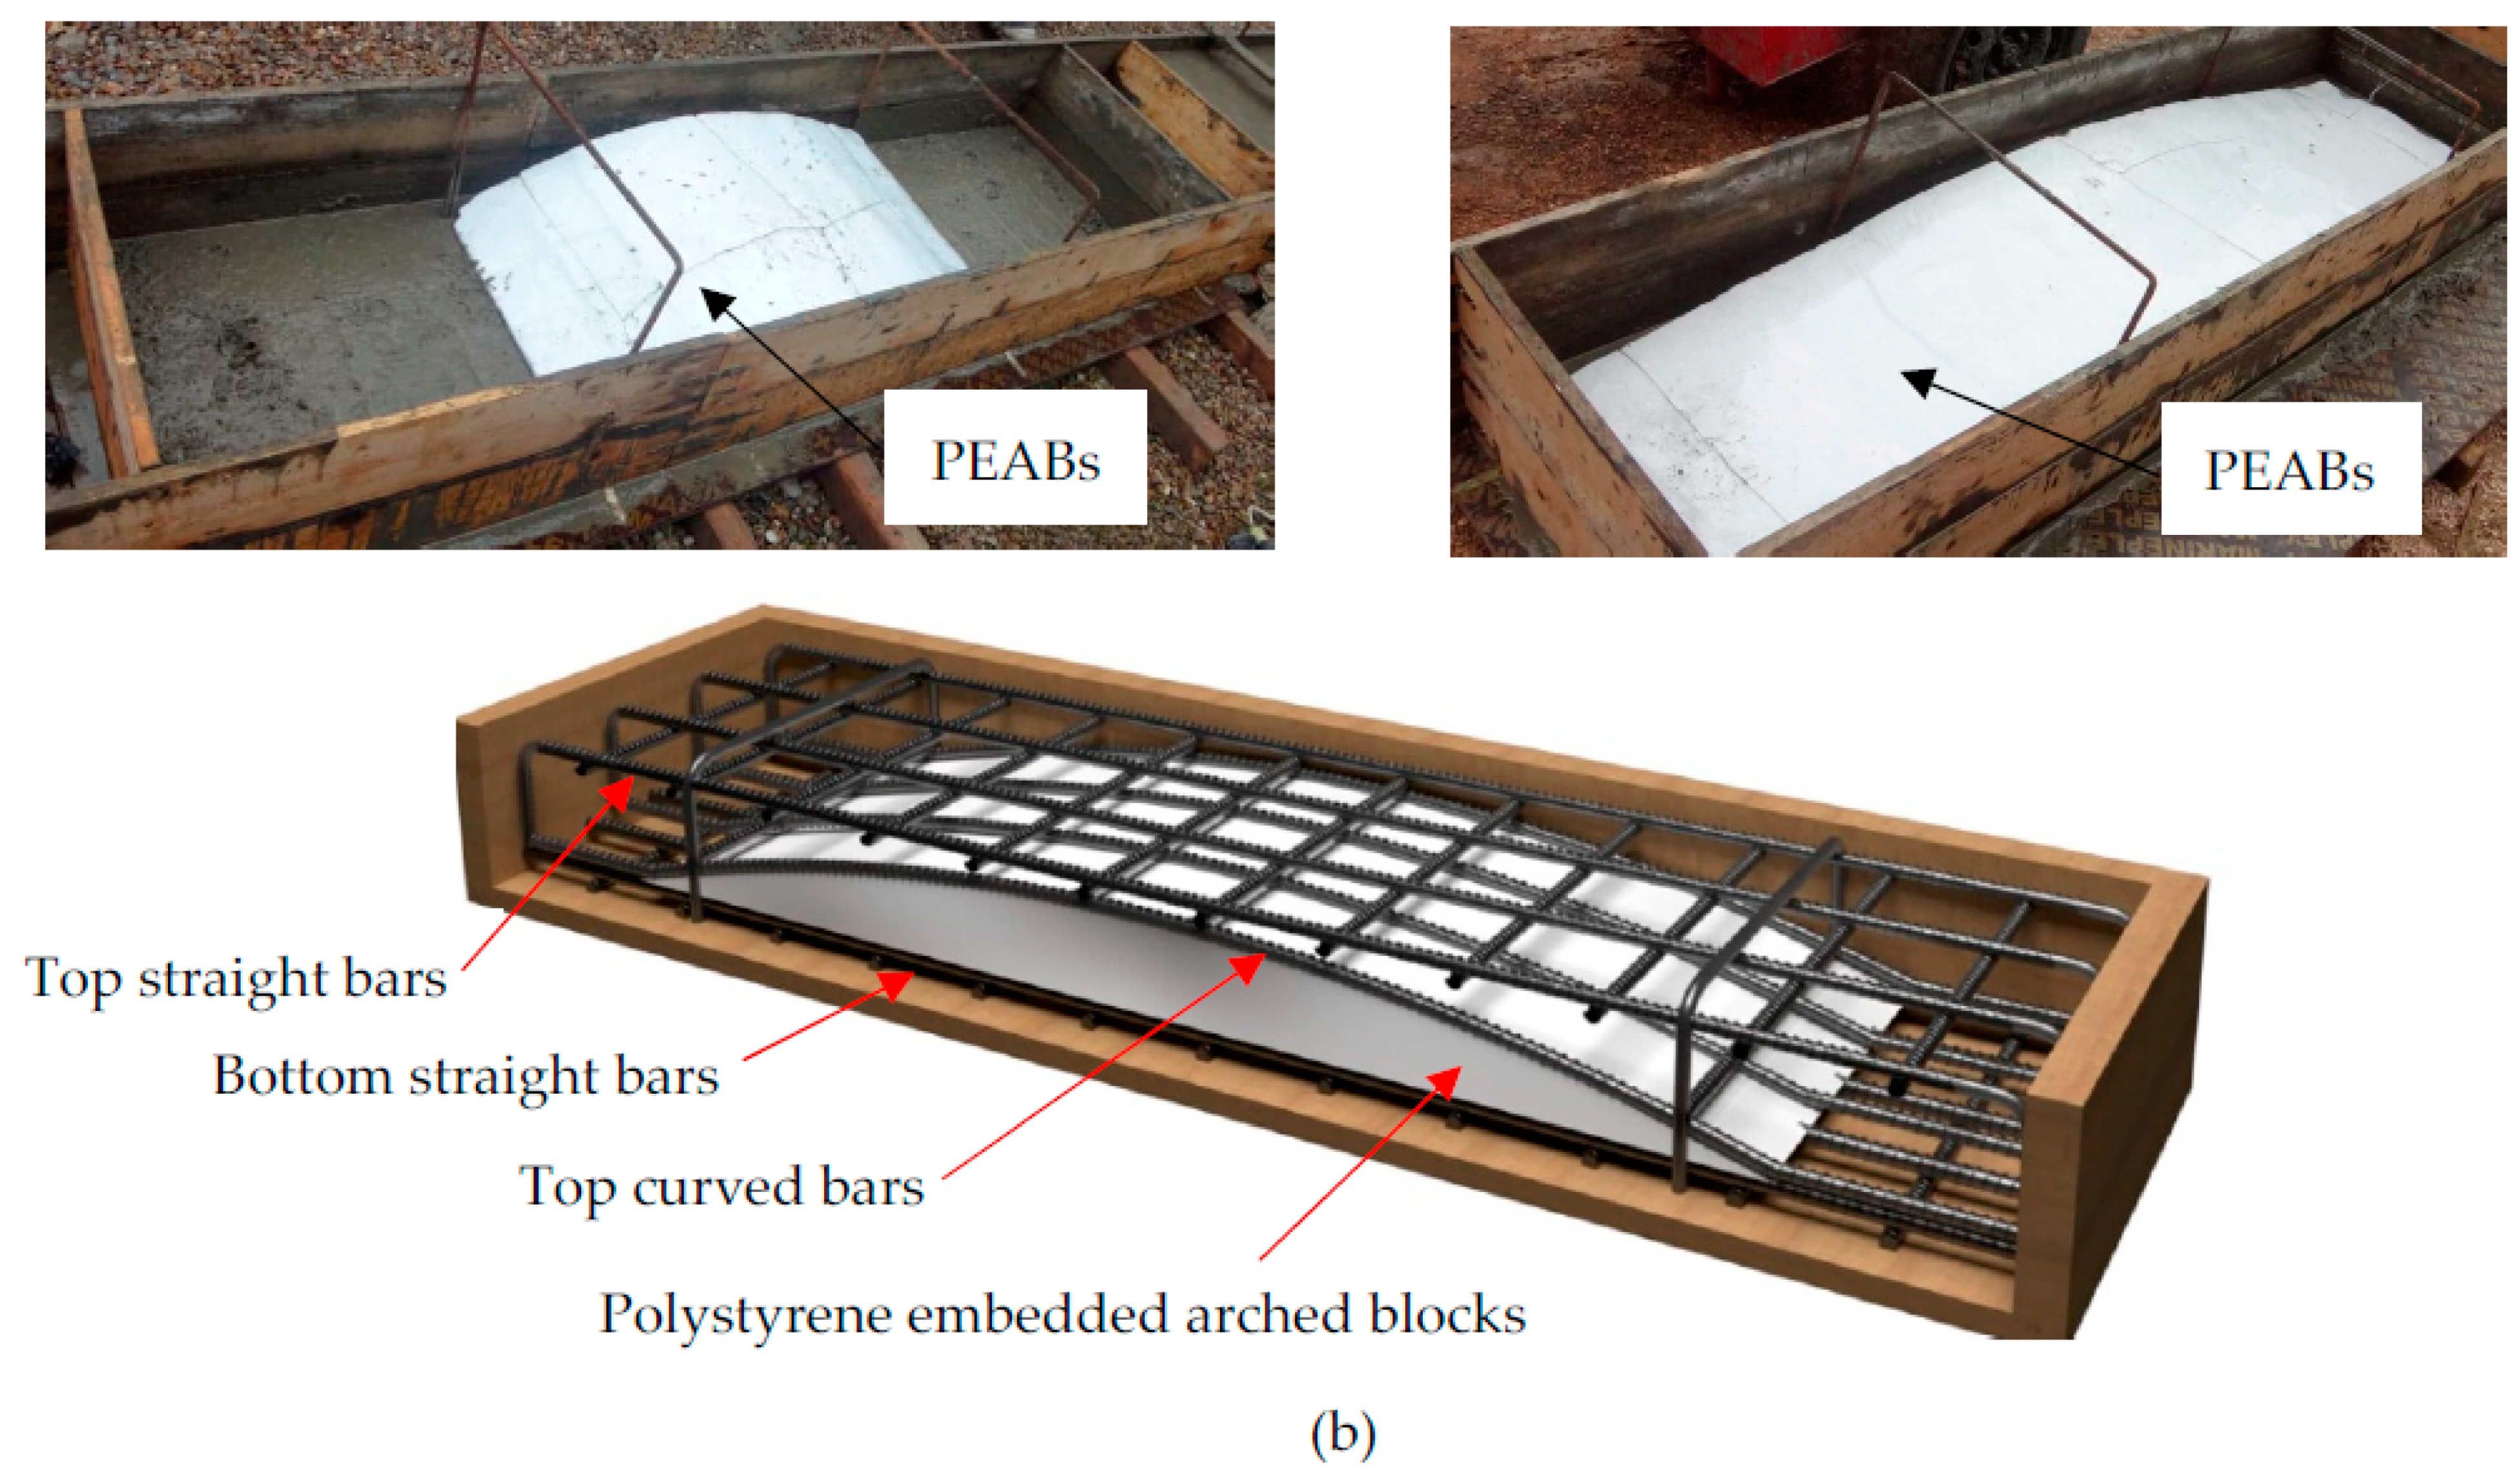
2.3. Details of the Tested Specimens

For the tested specimens with PEABs, longitudinal reinforcement of 5 ϕ 10 mm bars was used as bottom reinforcement, while the top reinforcement consisted of 8 ϕ 8 mm bars and was distributed as four straight top bars plus four arched bars, as shown in Figure 1. It is worthwhile to mention that the four arched bars took the same curvature shape of the PEABs within the slab. On the other hand, 12 ϕ 8 mm bars were distributed transversely as bottom and top reinforcement across the slab width of each specimen. To ensure constant, homogenous concrete compressive strength, all the seven specimens were cast on the same day using the same concrete batch and under the same curing conditions.

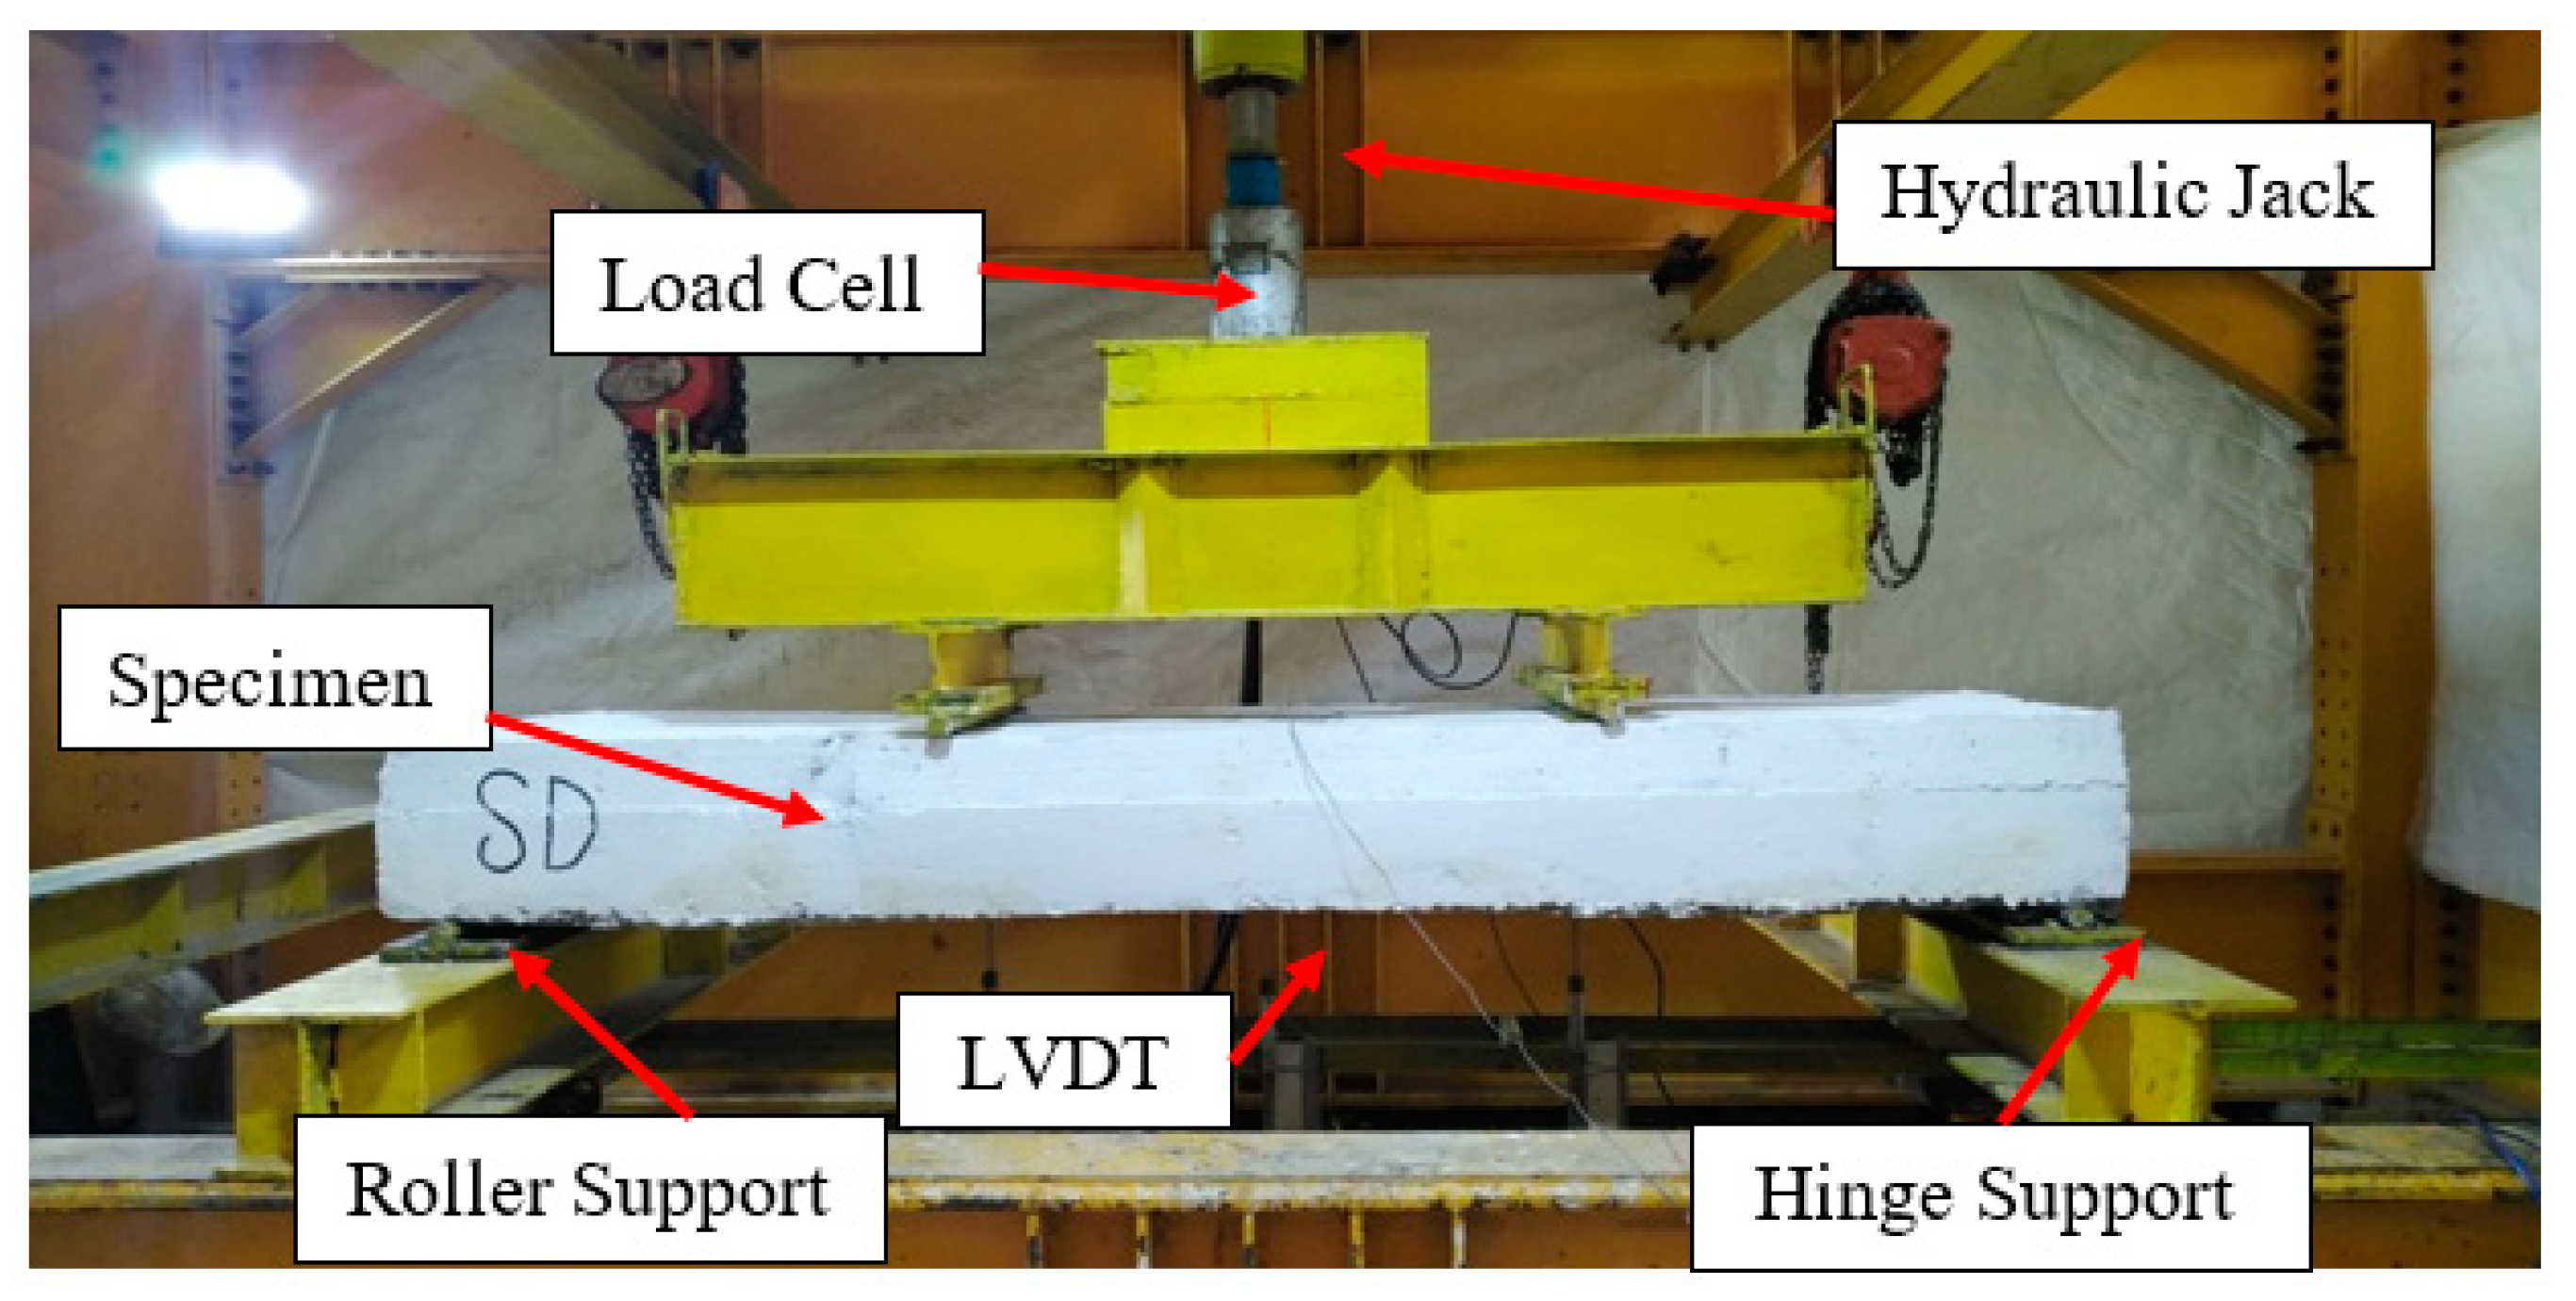
2.4. Testing Setup and Instrumentations

All the specimens were tested under simply supported conditions (hinge and roller supports) and two-line monotonic loading, as described in Figure 2. A hydraulic jack with a capacity of 1000 kN was used to perform the laboratory tests. A load cell with 1000 kN capacity was used to measure the applied load, which was increased gradually at an increment of 5 kN/min. The load was applied using one hydraulic jack and distributed using a spreader beam. The distance between the two lines of loading was 800 mm. An LVDT was used to record the vertical downward deflection at the mid-span of each specimen. Moreover, the compressive strains in the top fibers of concrete at the mid-spans of each specimen were recorded using strain gauges.

3. Findings of the Test Results and Discussions

The ultimate load capacities, modes of failure, load–deflection responses, and strains in concrete were observed during loading and are discussed below.

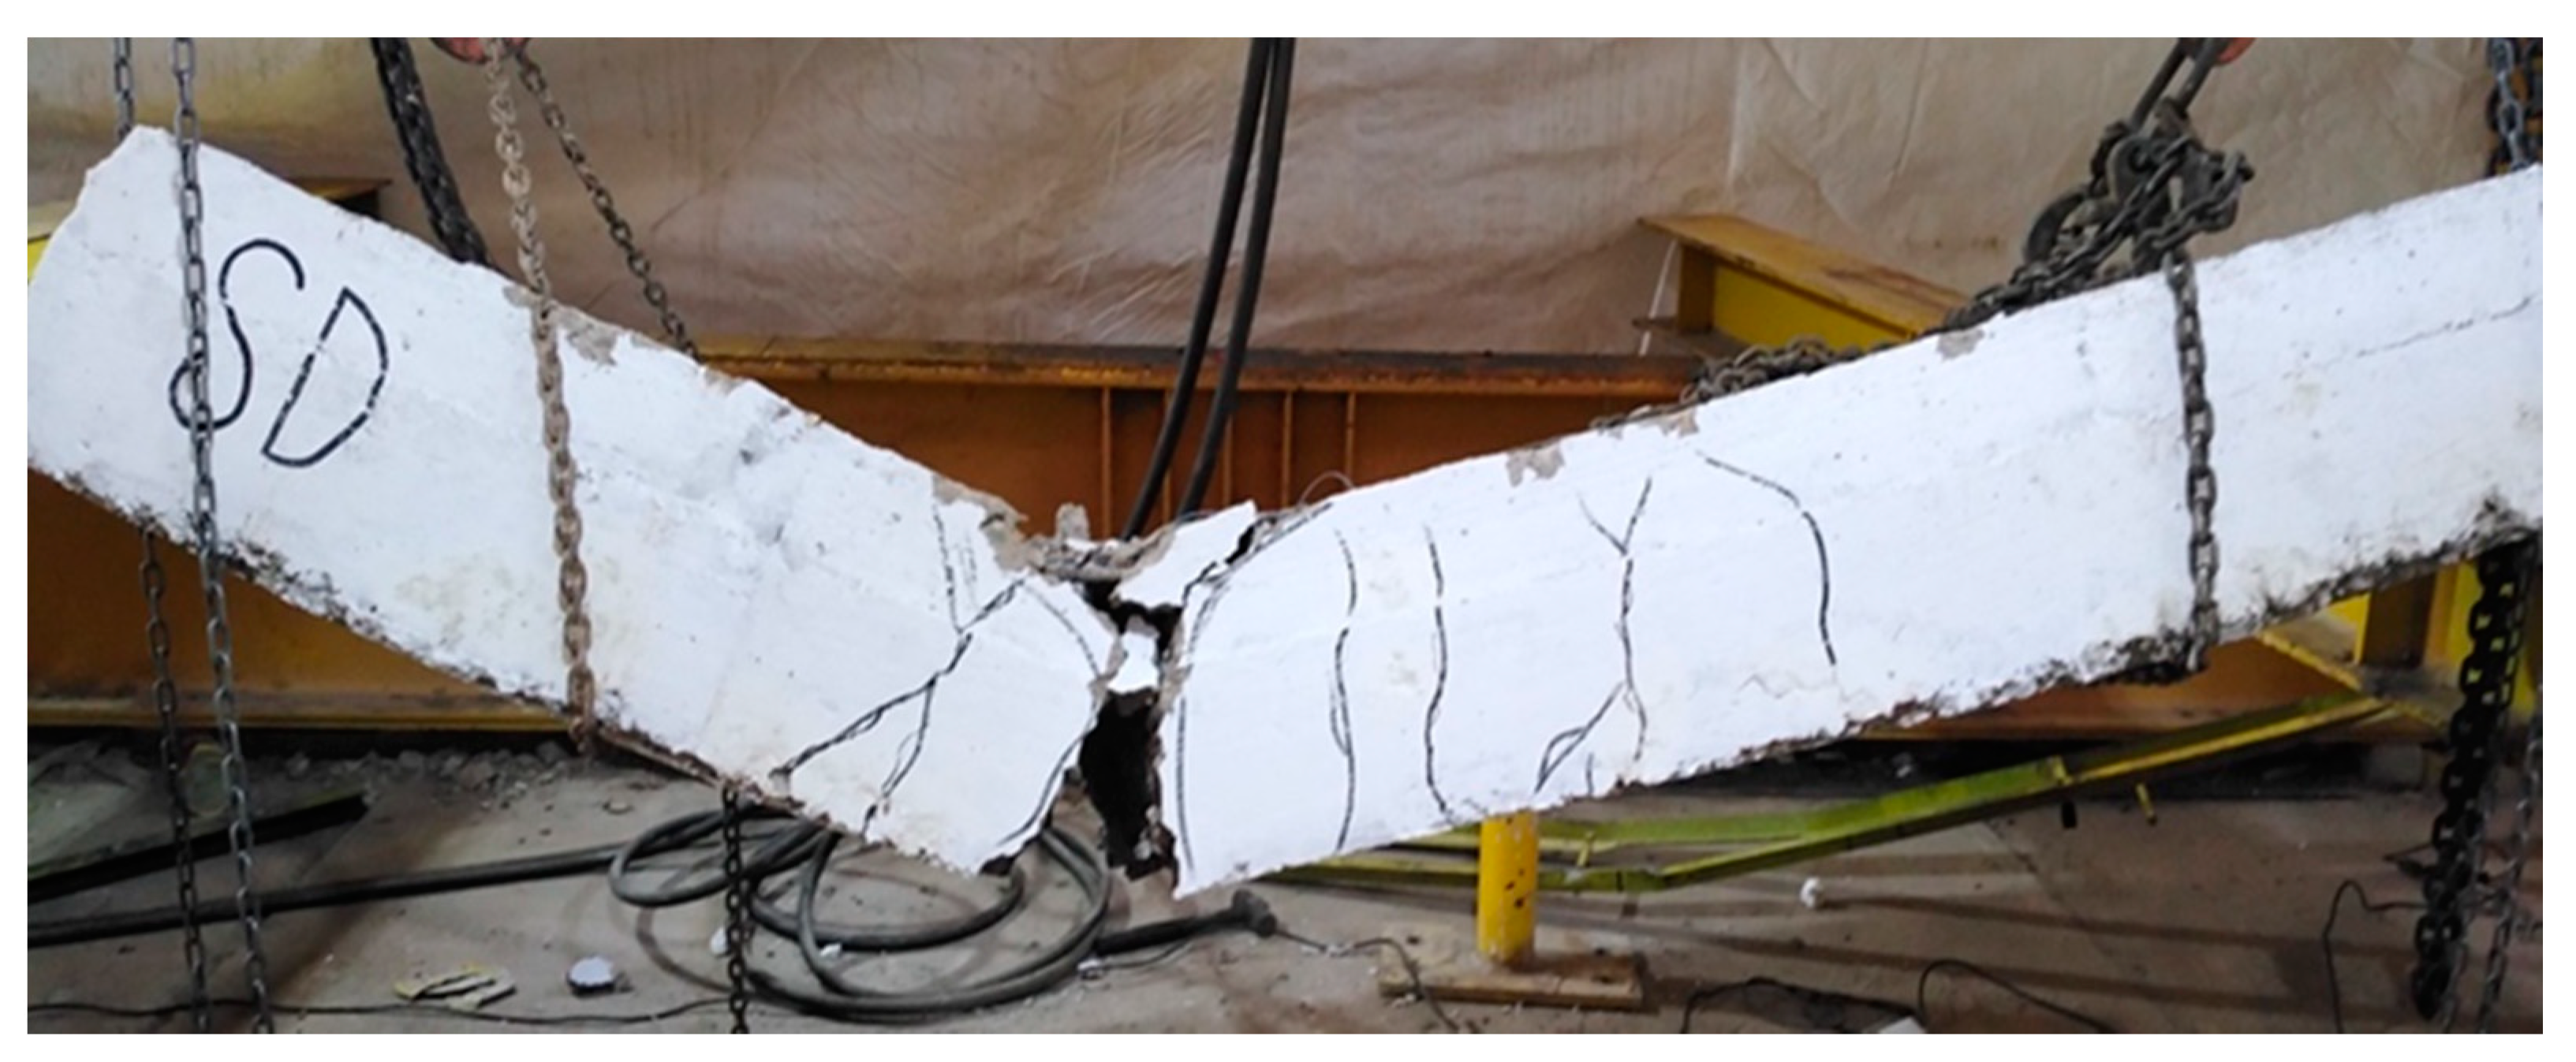
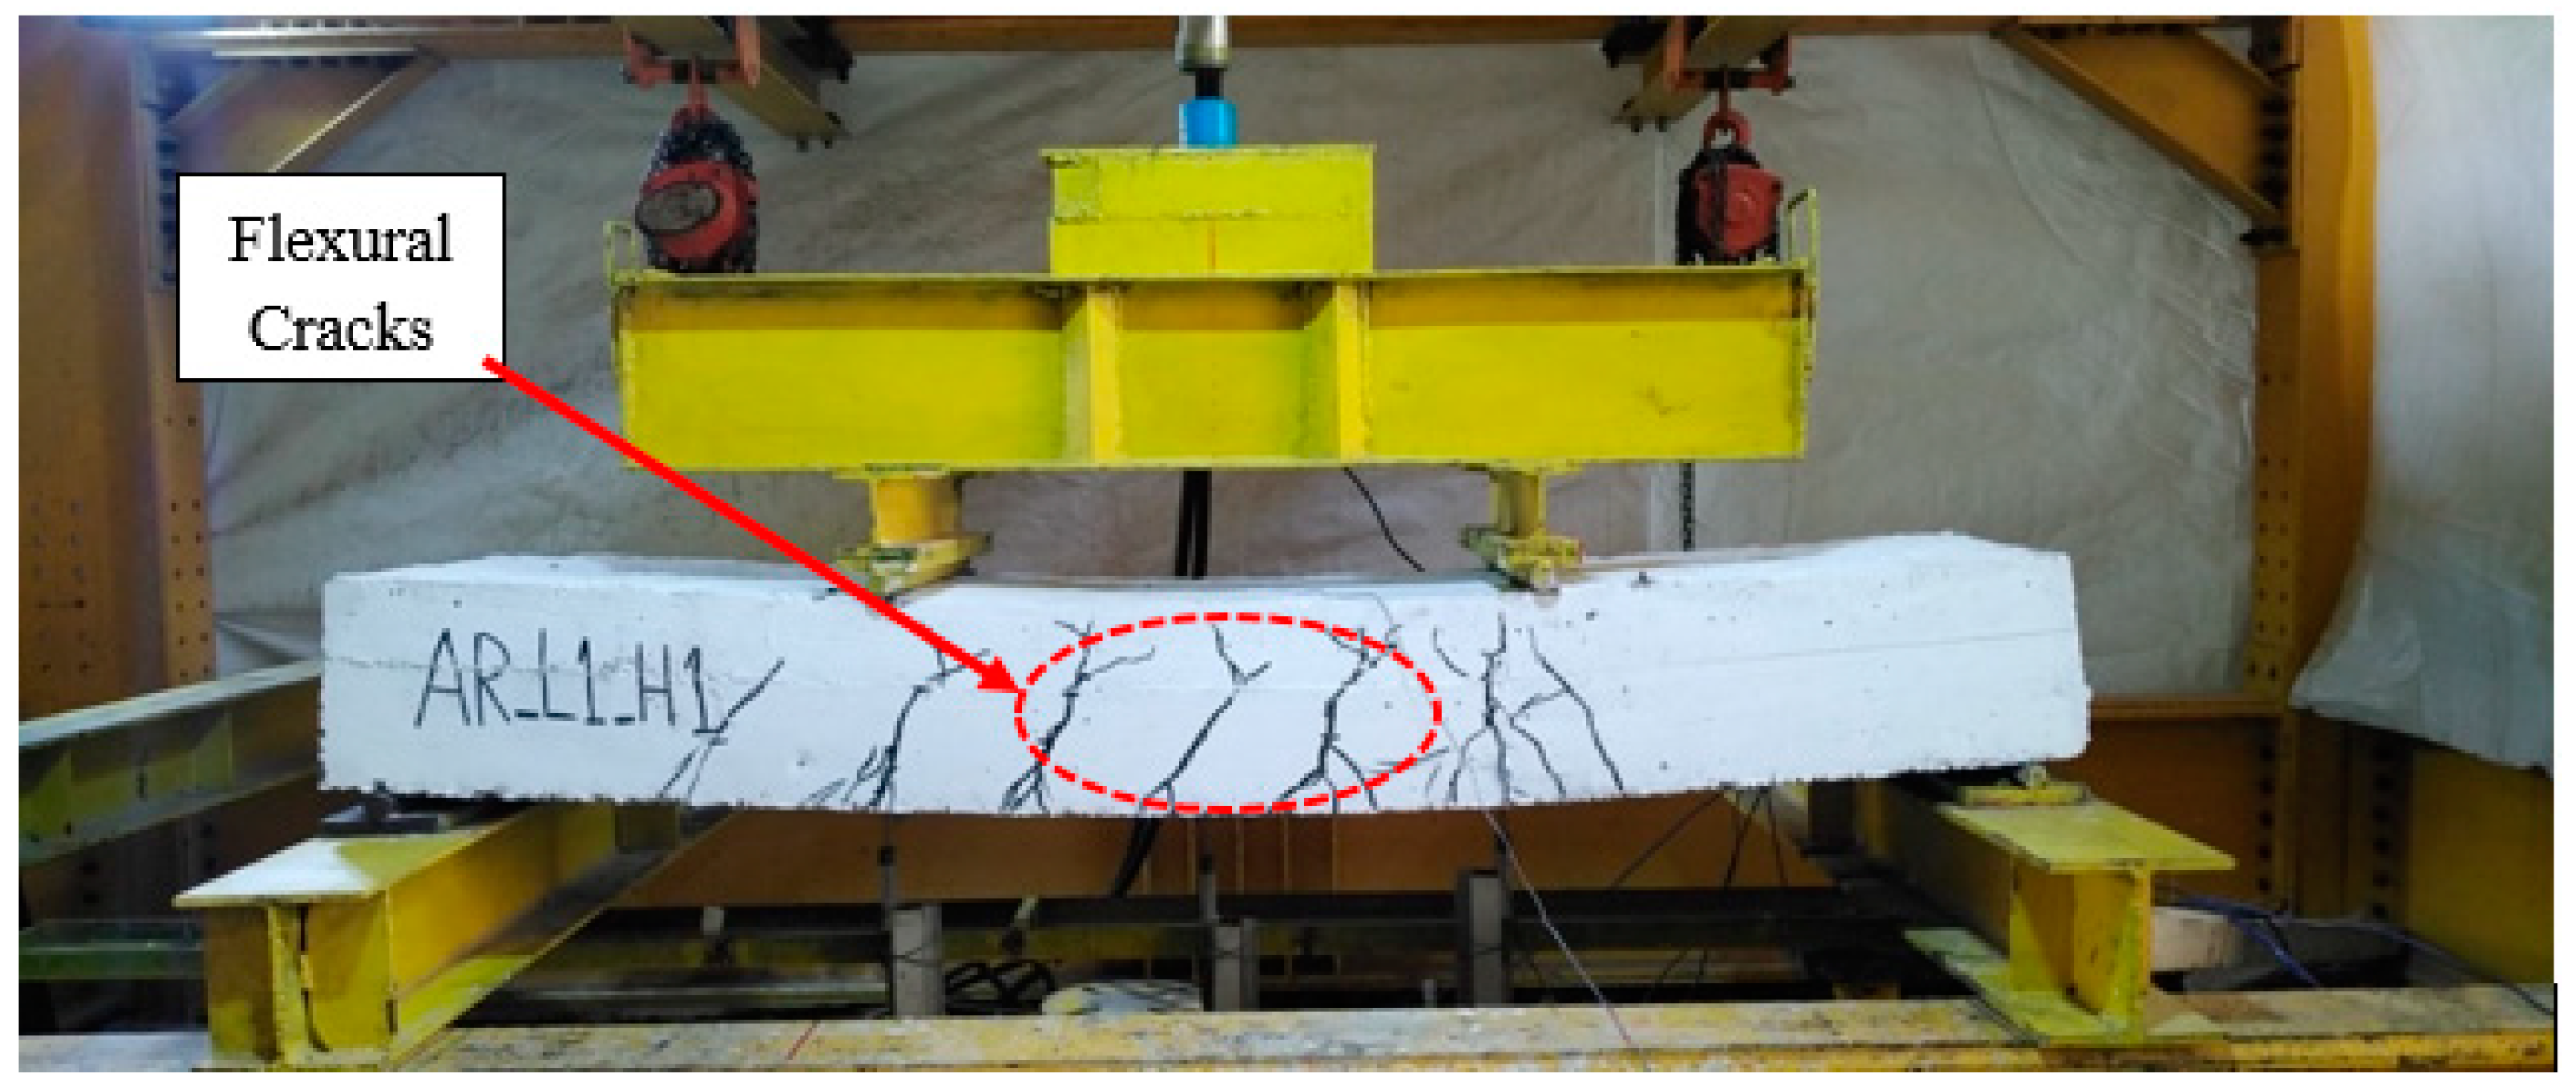
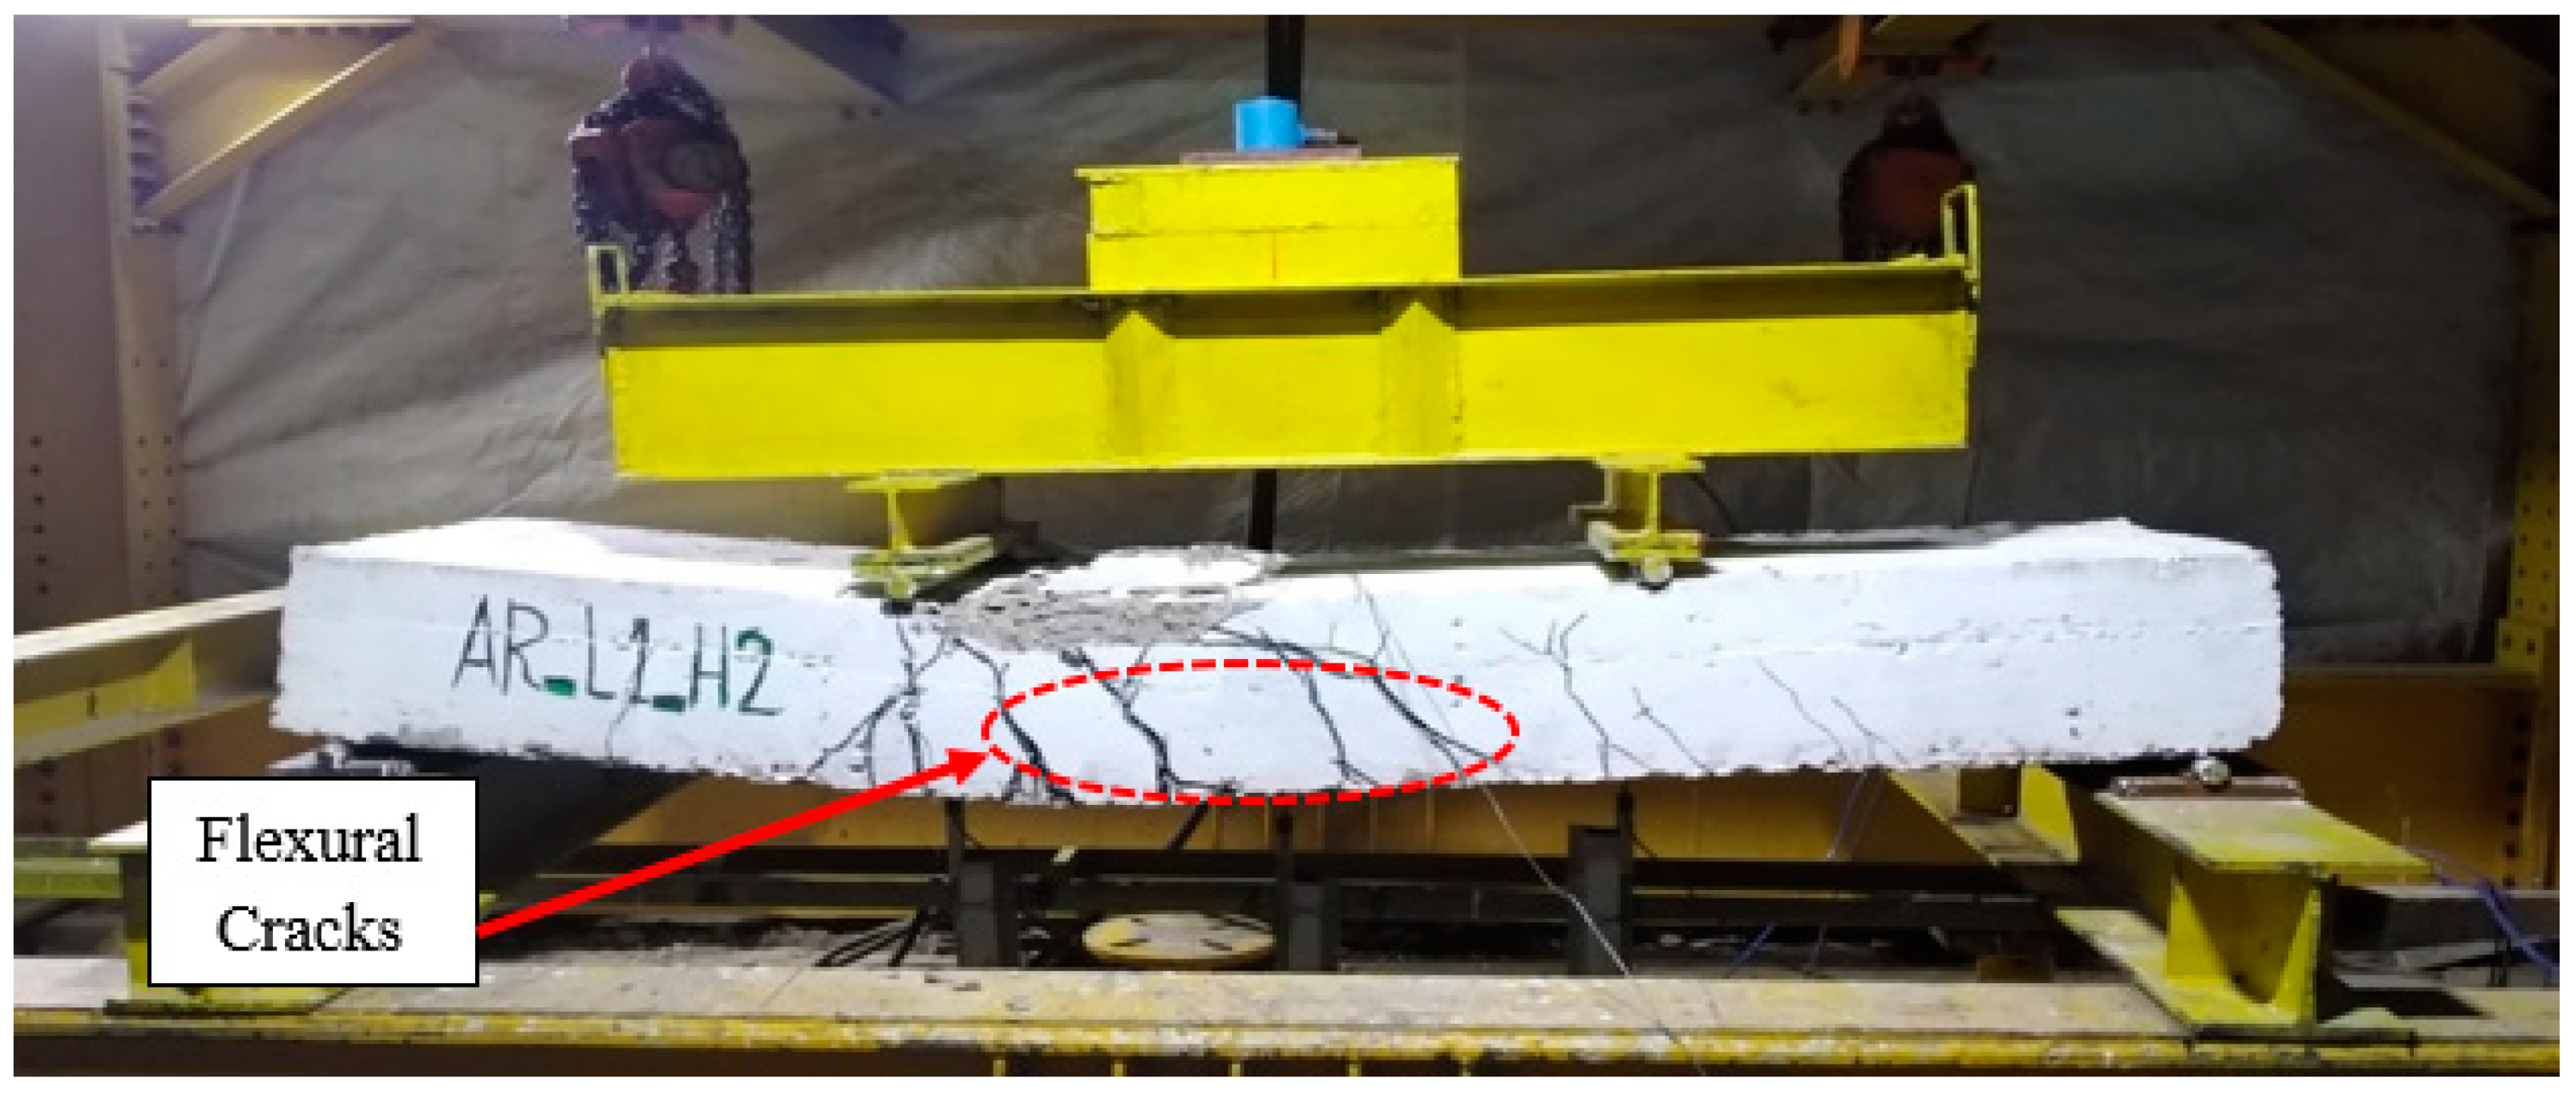
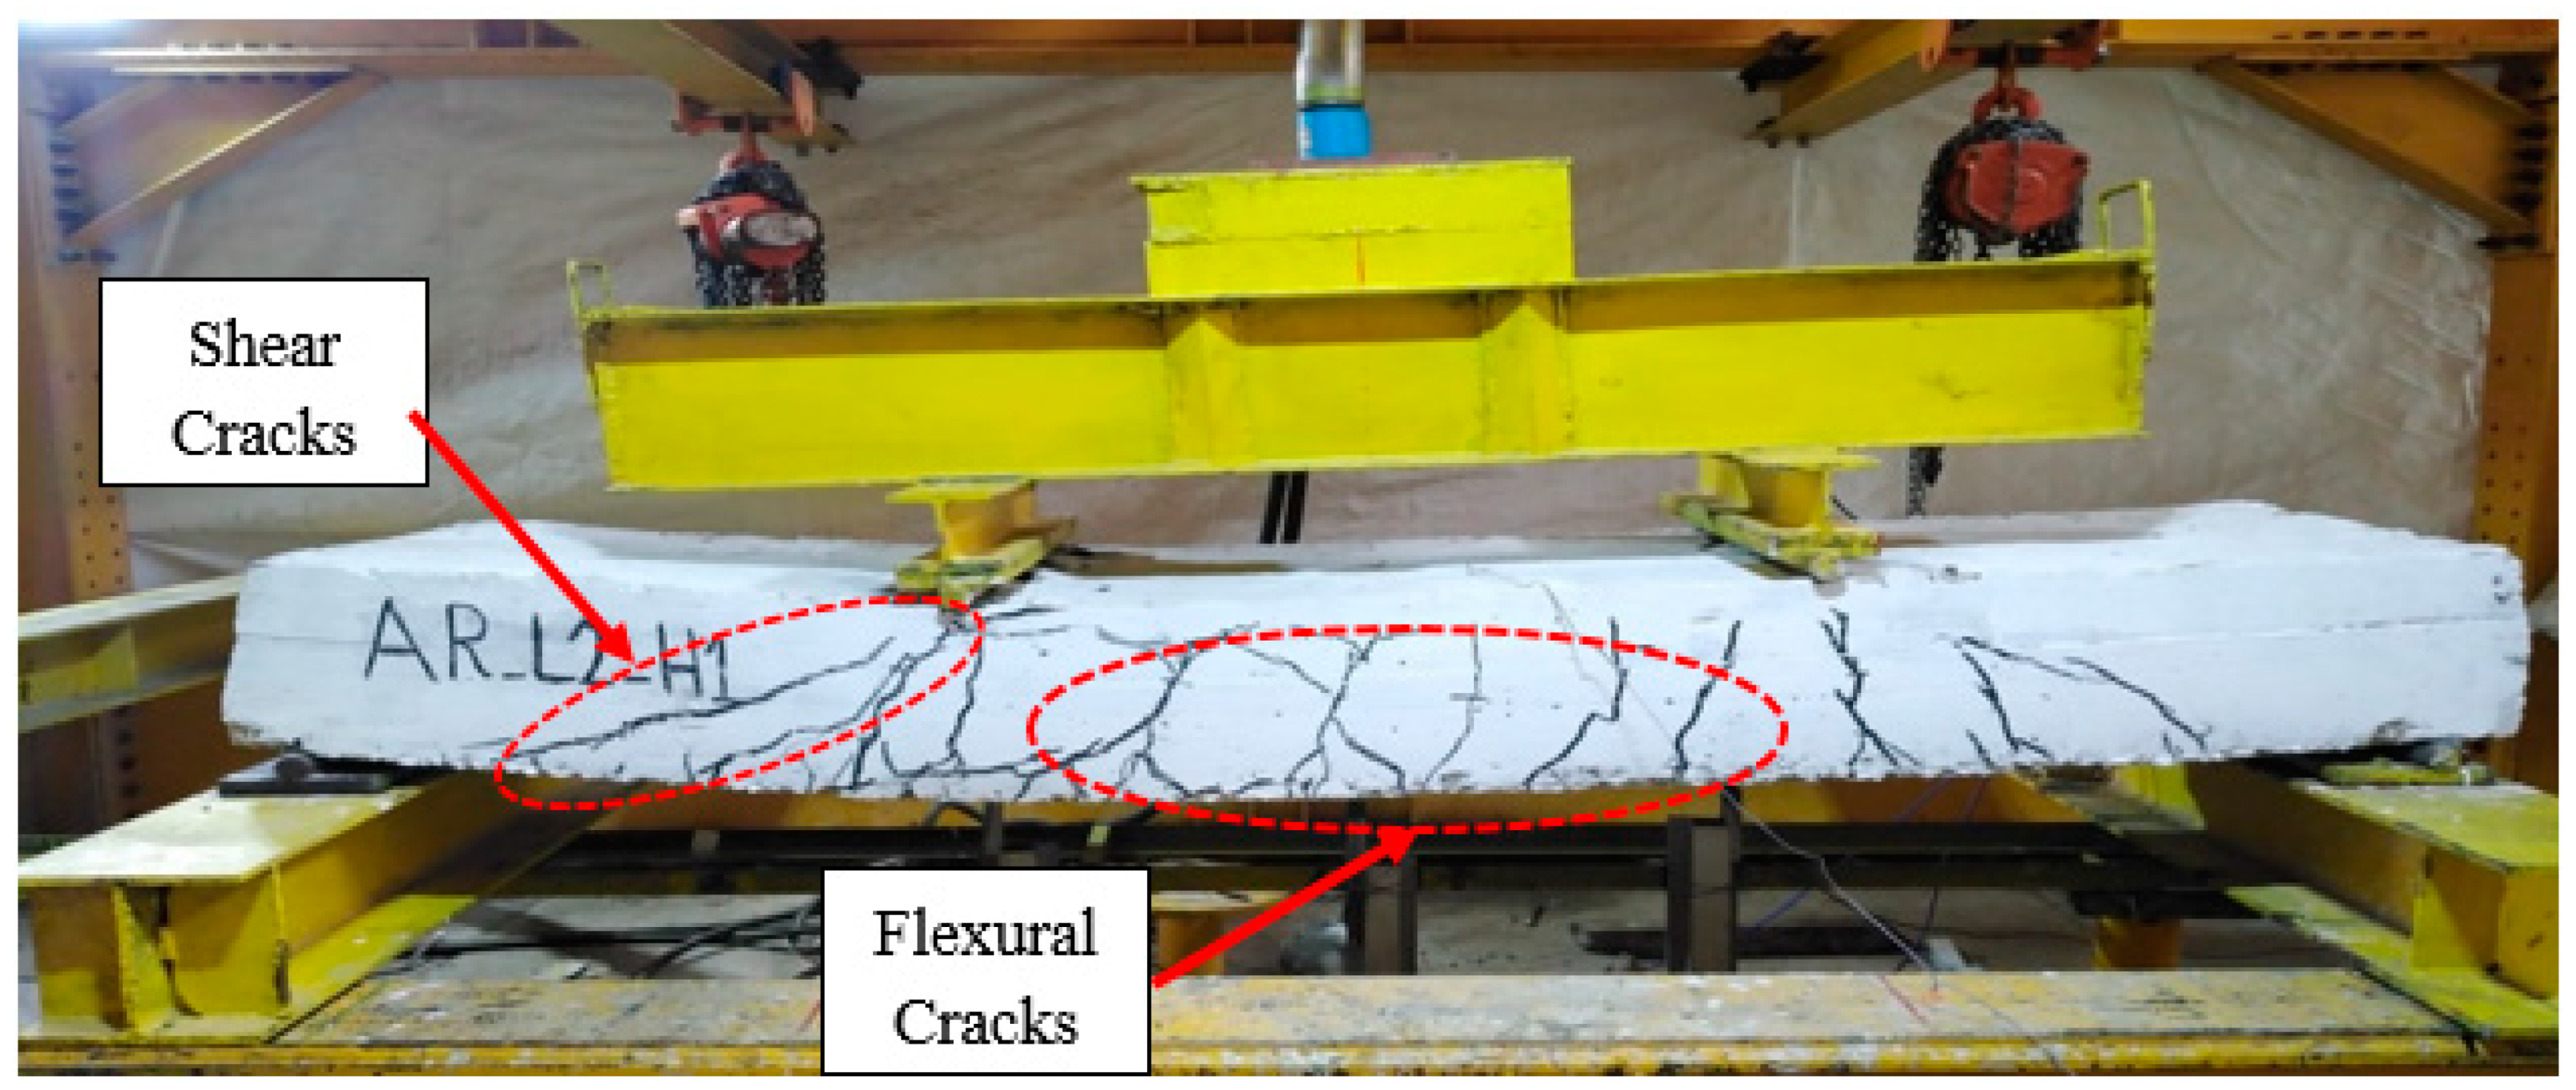
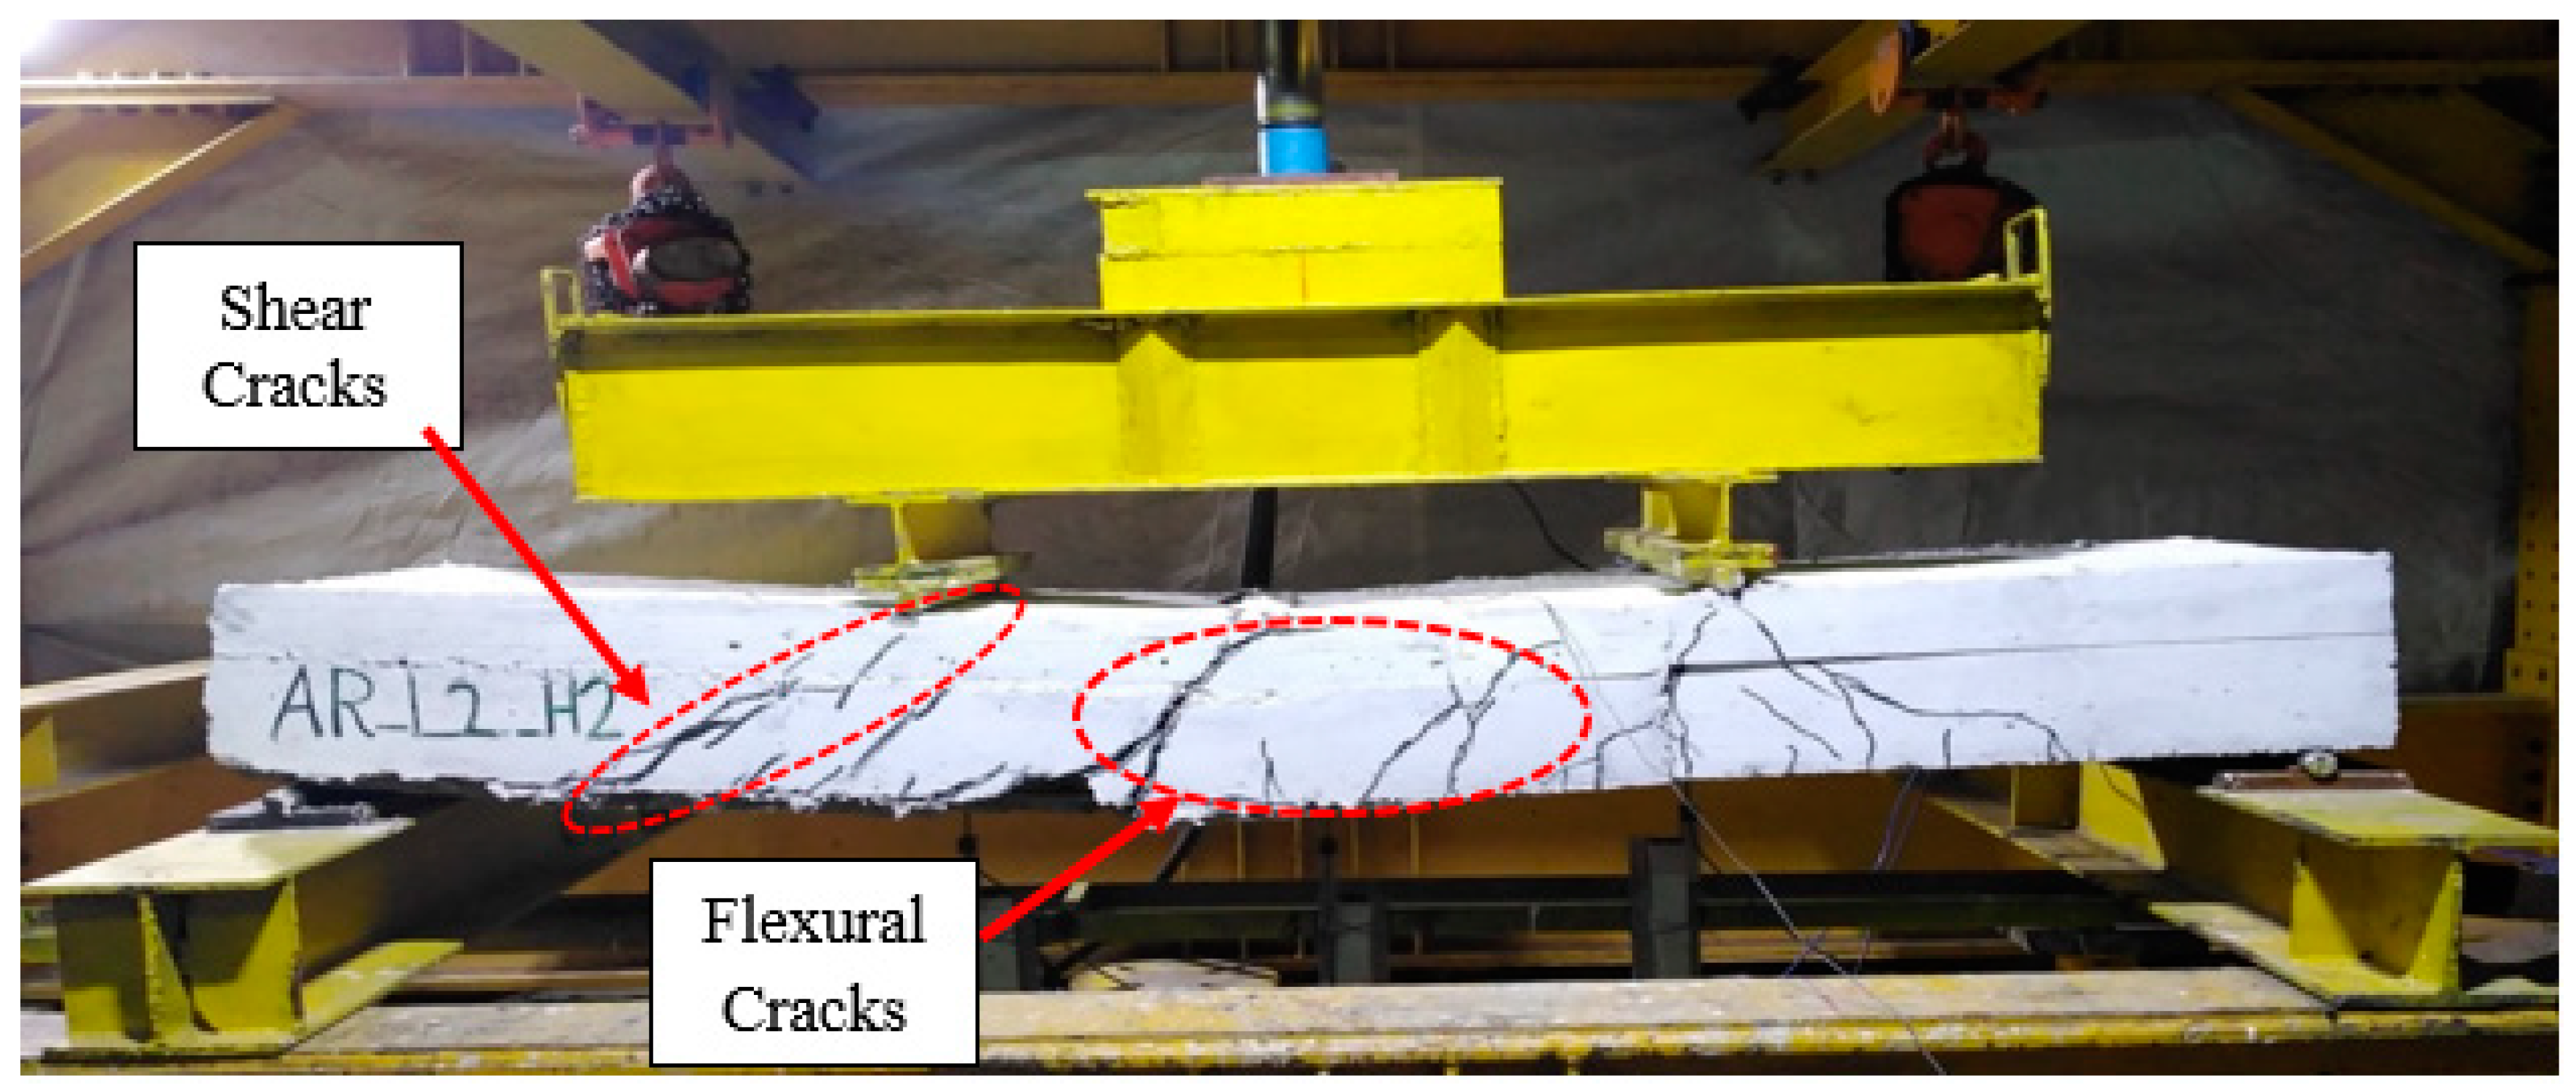
3.1. Ultimate Load Capacities and Modes of Failure

For the control slab SD, flexural cracks were created at the mid-span and propagated in width and height until complete flexural failure occurred at a load capacity of 156 kN, as shown in Figure 3.
For the slab specimens with lP/L = 0.5 (i.e., slab specimens AR-L1-H1 and AR-L1-H2), flexural cracks were created and propagated at different locations in the mid-span regions. The cracks’ length and width increased until the flexural failure occurred at loads of 126 kN and 147 kN, respectively (see Figure 4 and Figure 5).
For the slab specimens with lP/L = 0.75 (i.e., slab specimens AR-L2-H1 and AR-L2-H2), flexural cracks initially were formed at different locations of the middle zone. After successive applications of load, these cracks propagated, and shear cracks appeared near supports. These shear cracks propagated towards the loading lines with an increase in the flexural cracks. The failure occurred at loads of 123 kN and 140 kN, respectively. These slab specimens failed in the shear-flexural mode, as shown in Figure 6 and Figure 7.
For the slab specimens with lP/L = 1.0 (i.e., slab specimens AR-L3-H1 and AR-L3-H2), shear cracks initially appeared near supports. After successive applications of load, the shear cracks propagated towards the loading lines, and a few flexural cracks were formed in the middle zone of the specimens. The failure occurred at loads of 119 kN and 132 kN, respectively. The shear mode of failure dominated, as shown in Figure 8 and Figure 9. The main reason for this state was associated with the smaller mass of concrete in the shear zone, which was not enough to resist the applied shear force.
Based on these results, the mode of failure was changed gradually from flexural failure for slab specimens with lP/L = 0.5 to shear failure for slab specimens with lP/L = 1.0 due to the increase in the lP/L ratio, which resulted in a loss of mass of concrete near supports.
Table 2 summarizes the ultimate strength and failure mode of each tested specimen. For the slab specimens with hP/H = 0.7, the decreases in the ultimate loads were about 19%, 21%, and 24% for slab specimens with lP/L = 0.5, 0.75, and 1.0, respectively, relative to the control slab specimen SD. For the slabs with hP/H = 0.54, these percentages became 6%, 10%, and 15%, respectively. Therefore, it can be observed that, at a certain value of the hP/H ratio, the increase of the lP/L ratio led to reductions in the ultimate load capacity and loss of stiffness. Increasing the lP/L ratio gradually changed the mode of failure from flexural failure to shear failure due to the loss of mass of concrete near supports.
On the other hand, for the slab specimens with lP/L = 0.5, the reductions in the ultimate load capacity were about 19% and 6% for the slab specimens with hP/H = 0.7 and 0.54, respectively, relative to the control slab specimen SD. For the slabs with lP/L = 0.75, these reductions were about 21% and 10%, respectively. In contrast, these percentages became about 24% and 15% for the slabs with lP/L = 1.0. Therefore, it can be observed that, at a certain value of lP/L, the increase in the hP/H ratio from 0.54 to 0.7 led to reductions in the ultimate load and losses of stiffness due to the decrease in the depth of the concrete compression zone. The reduction in the concrete compression zone controlled the mode of failure to be a compressive crushing of concrete instead of yielding steel reinforcement and reduced ductility.

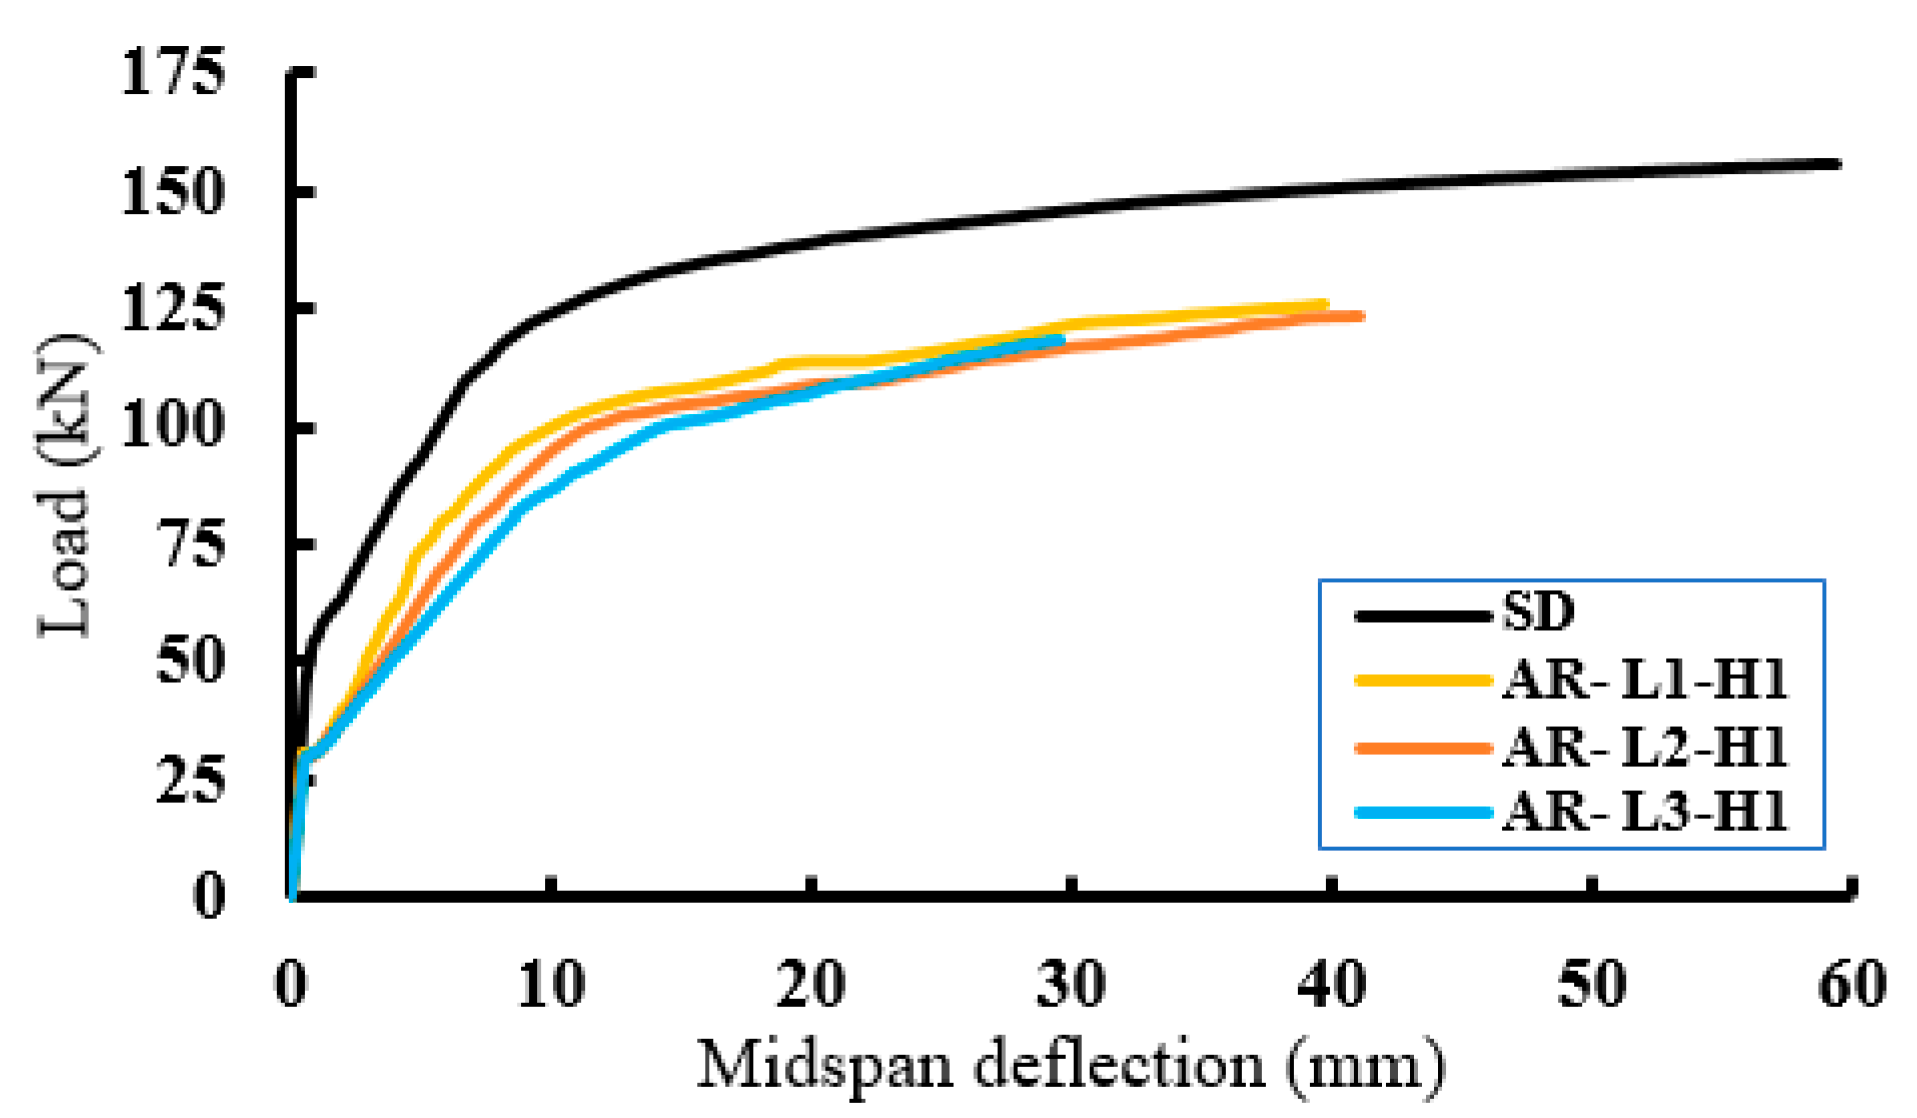
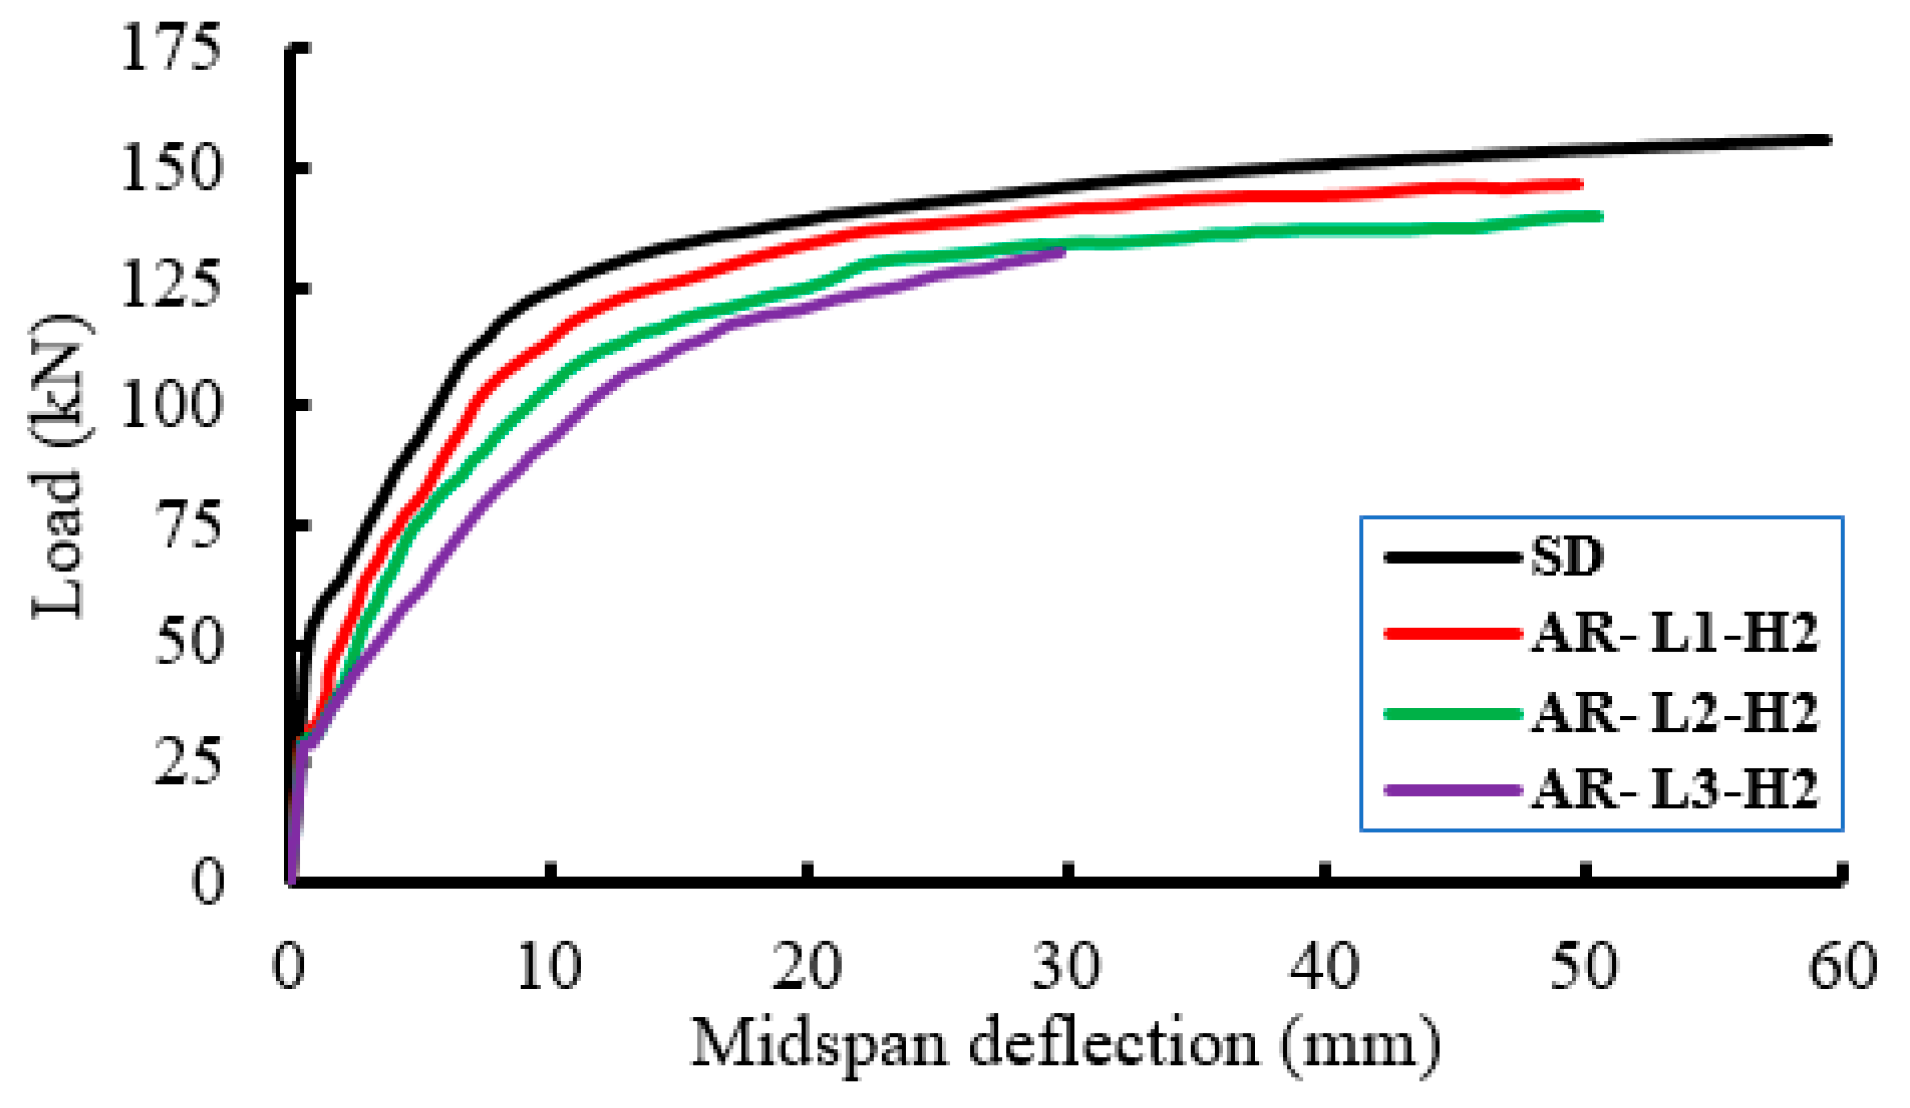
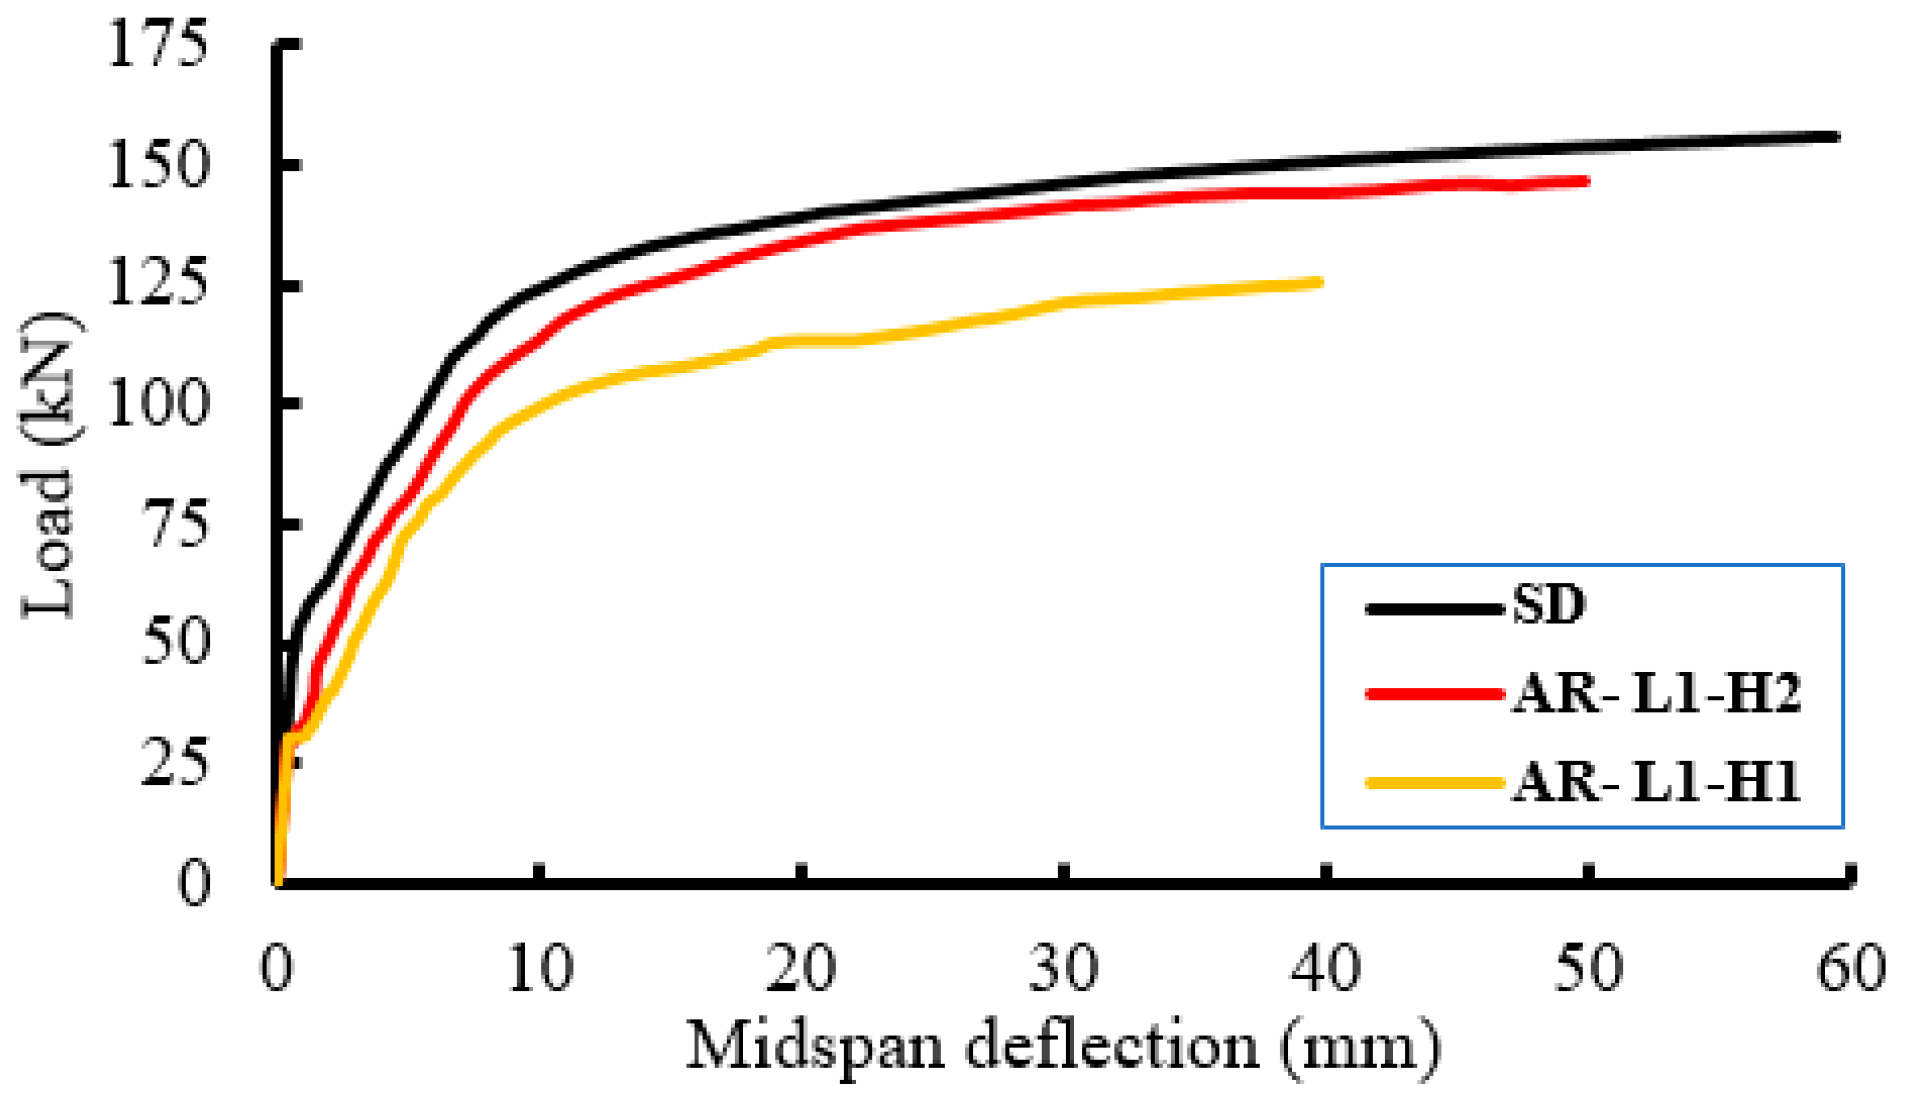
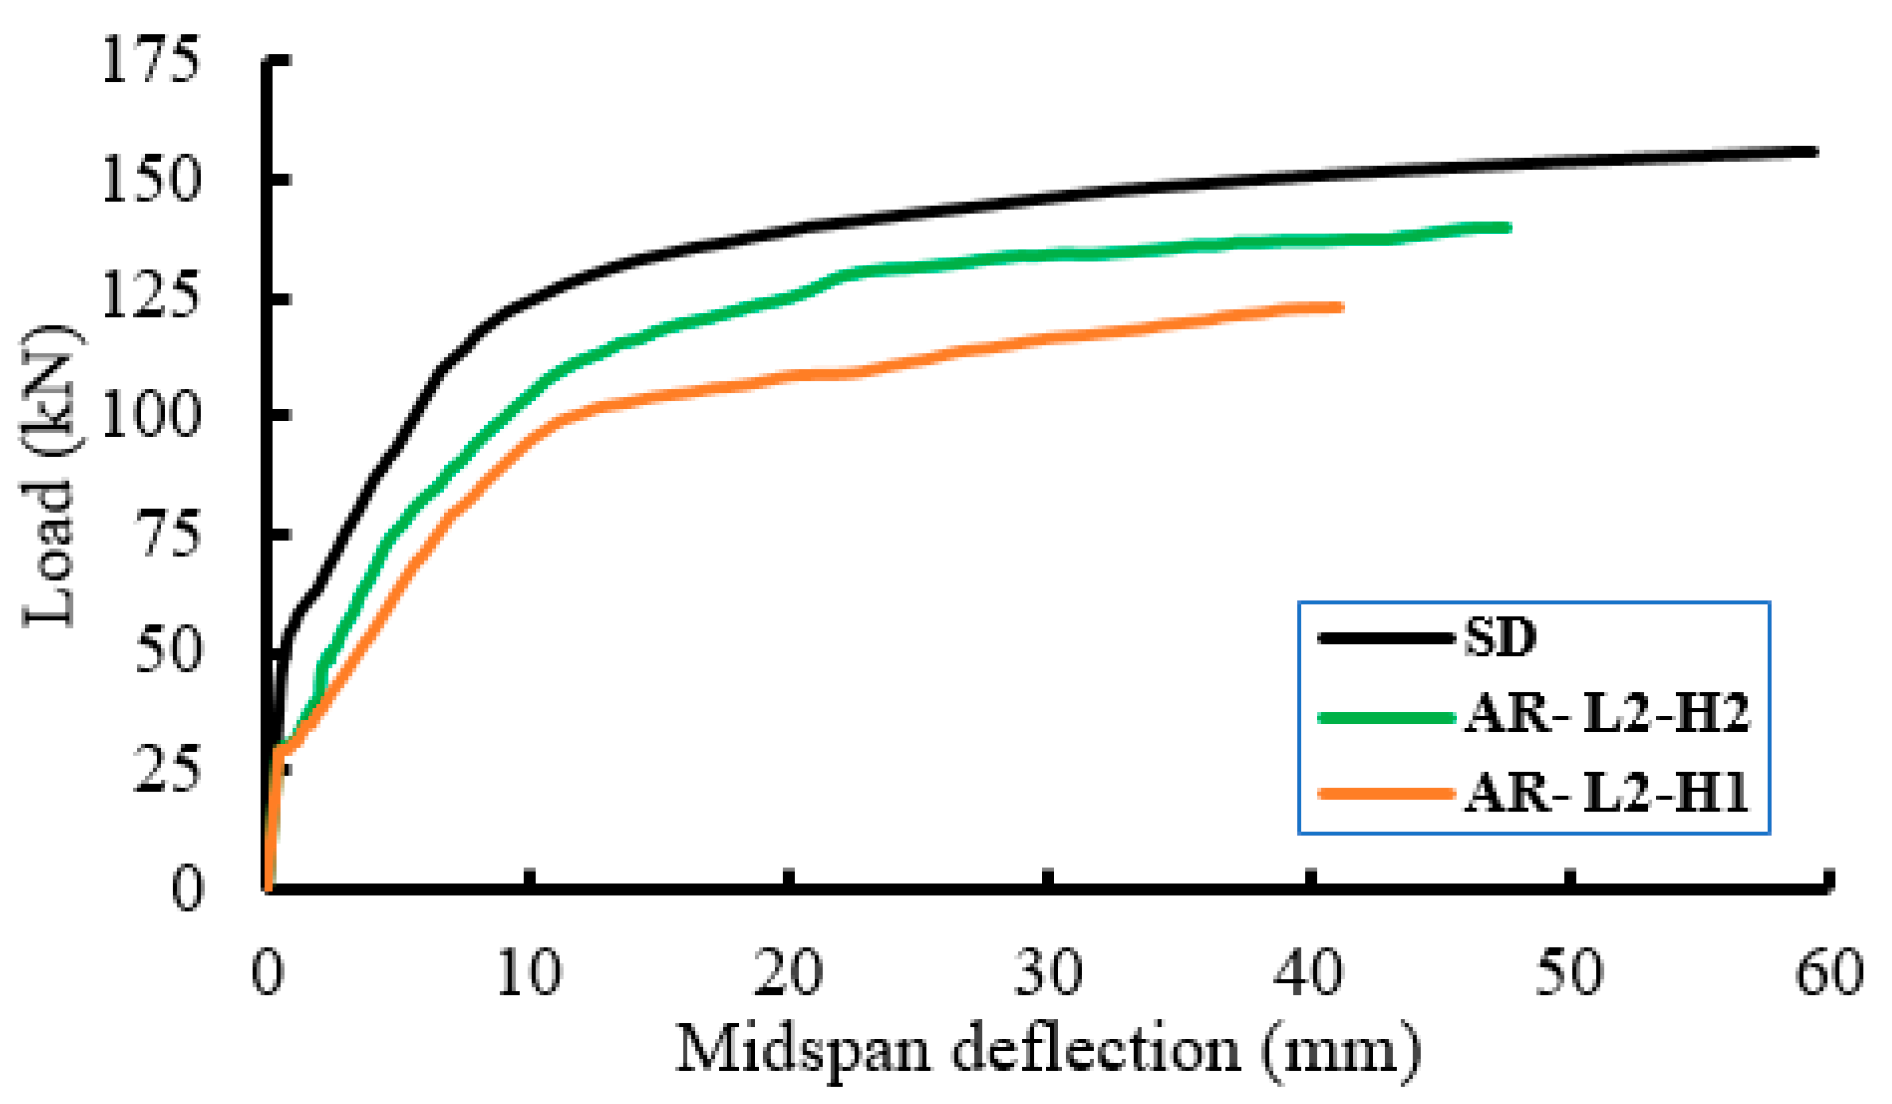
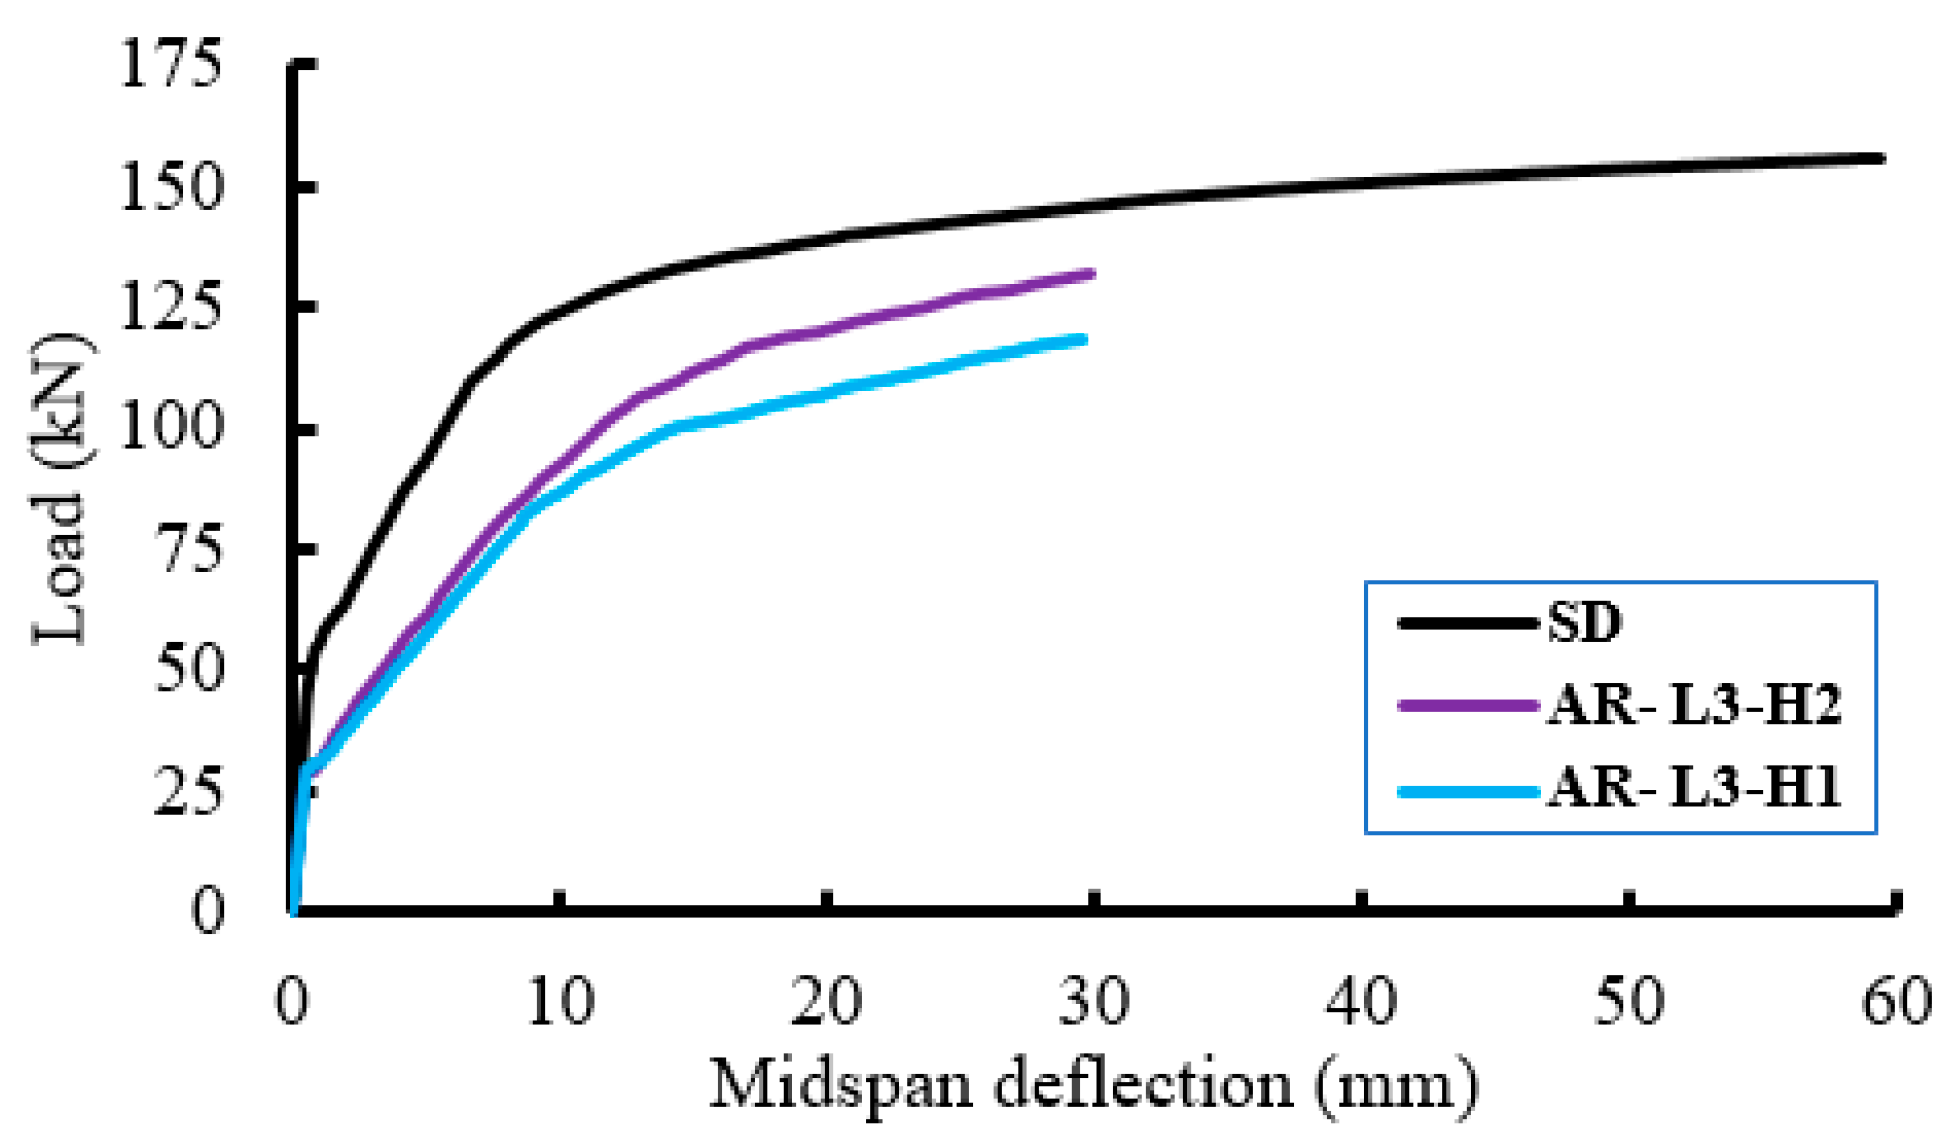
3.2. Load–Deflection Response

Figure 10 and Figure 11 demonstrate the load–deflection responses of the tested slab specimens. The presence of PEABs led to reductions in the stiffness and ultimate load capacity and increases in the mid-span deflections at the same loading level corresponding to the control slab specimen SD.
For the slab specimens with hP/H = 0.7, increasing the lP/L ratio from 0.5 to 1.0 led to growth in the mid-span deflections from 77% to 140%, relative to the control slab SD. Moreover, for the slabs with hP/H = 0.54, the growth was from 34% to 106%. It is worthwhile to mention that all of these percentages were calculated corresponding to a load level of 70% of the ultimate load capacity of the slab specimens with lP/L = 1.0.
The load versus mid-span deflection curves of the slab specimens with hP/H ratios of 0.5, 0.75, and 1.0 are shown in Figure 12, Figure 13 and Figure 14, respectively. It can be observed from these results that increasing the mid-height of the PEABs led to reductions in the ultimate strength and growth in the mid-span deflections due to the reductions in the concrete mass at the top of the mid-spans (compressive zone).

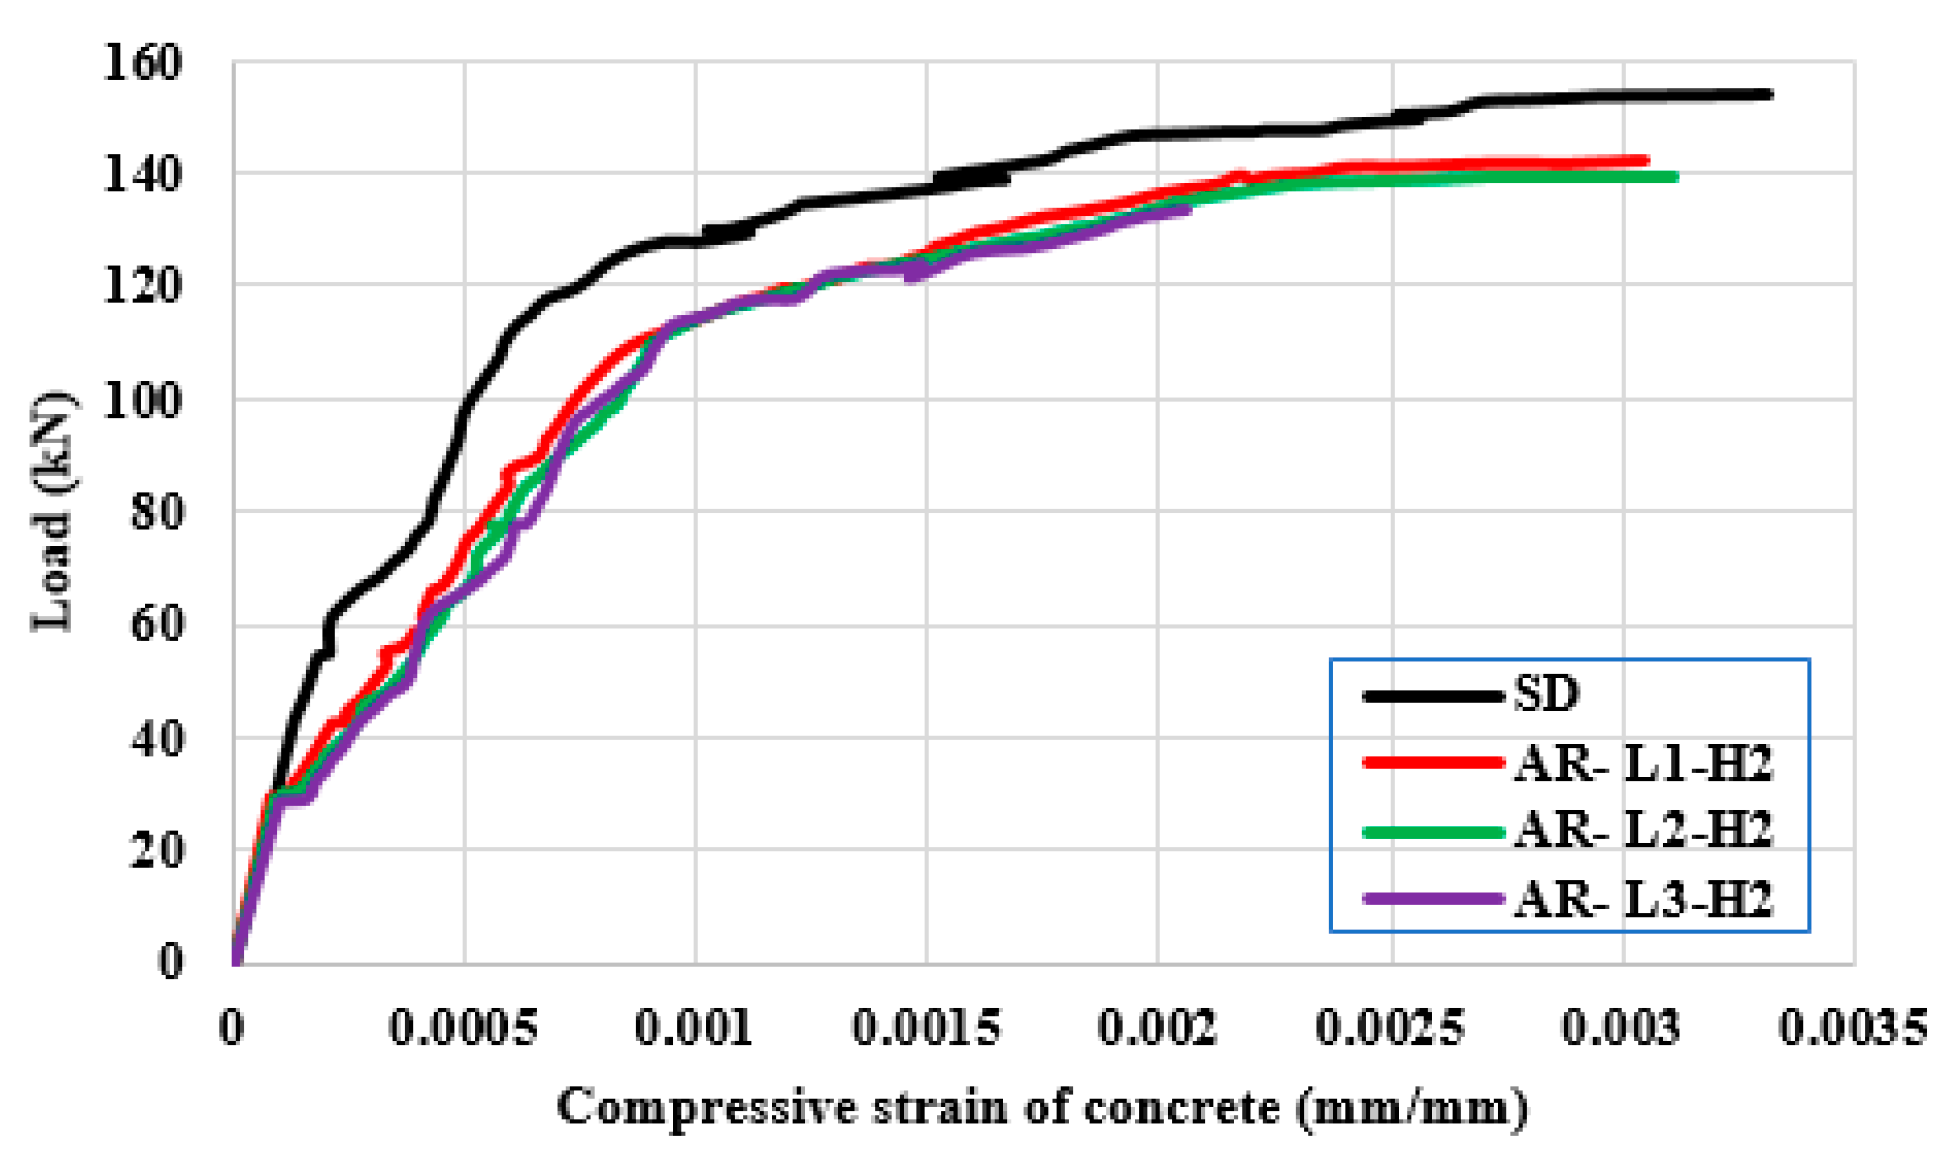
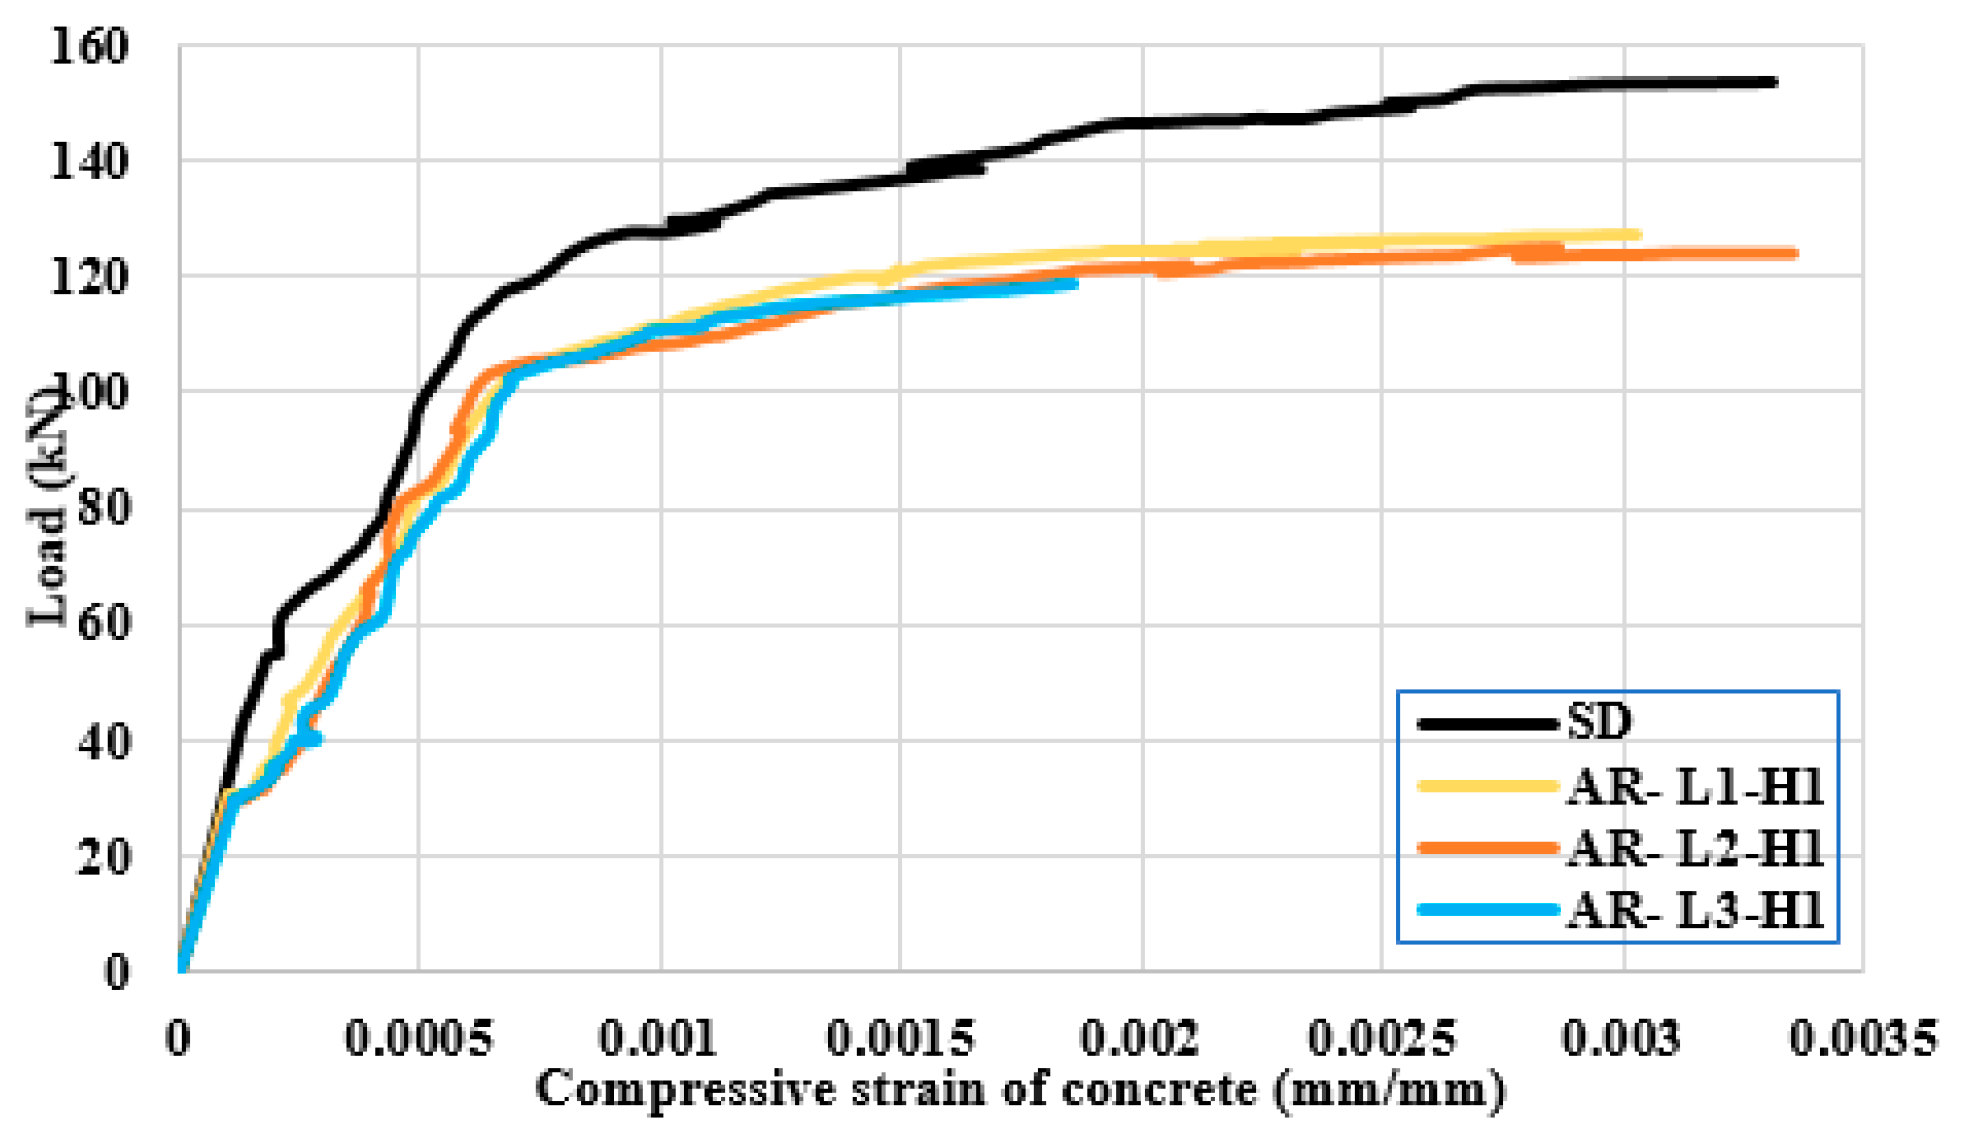
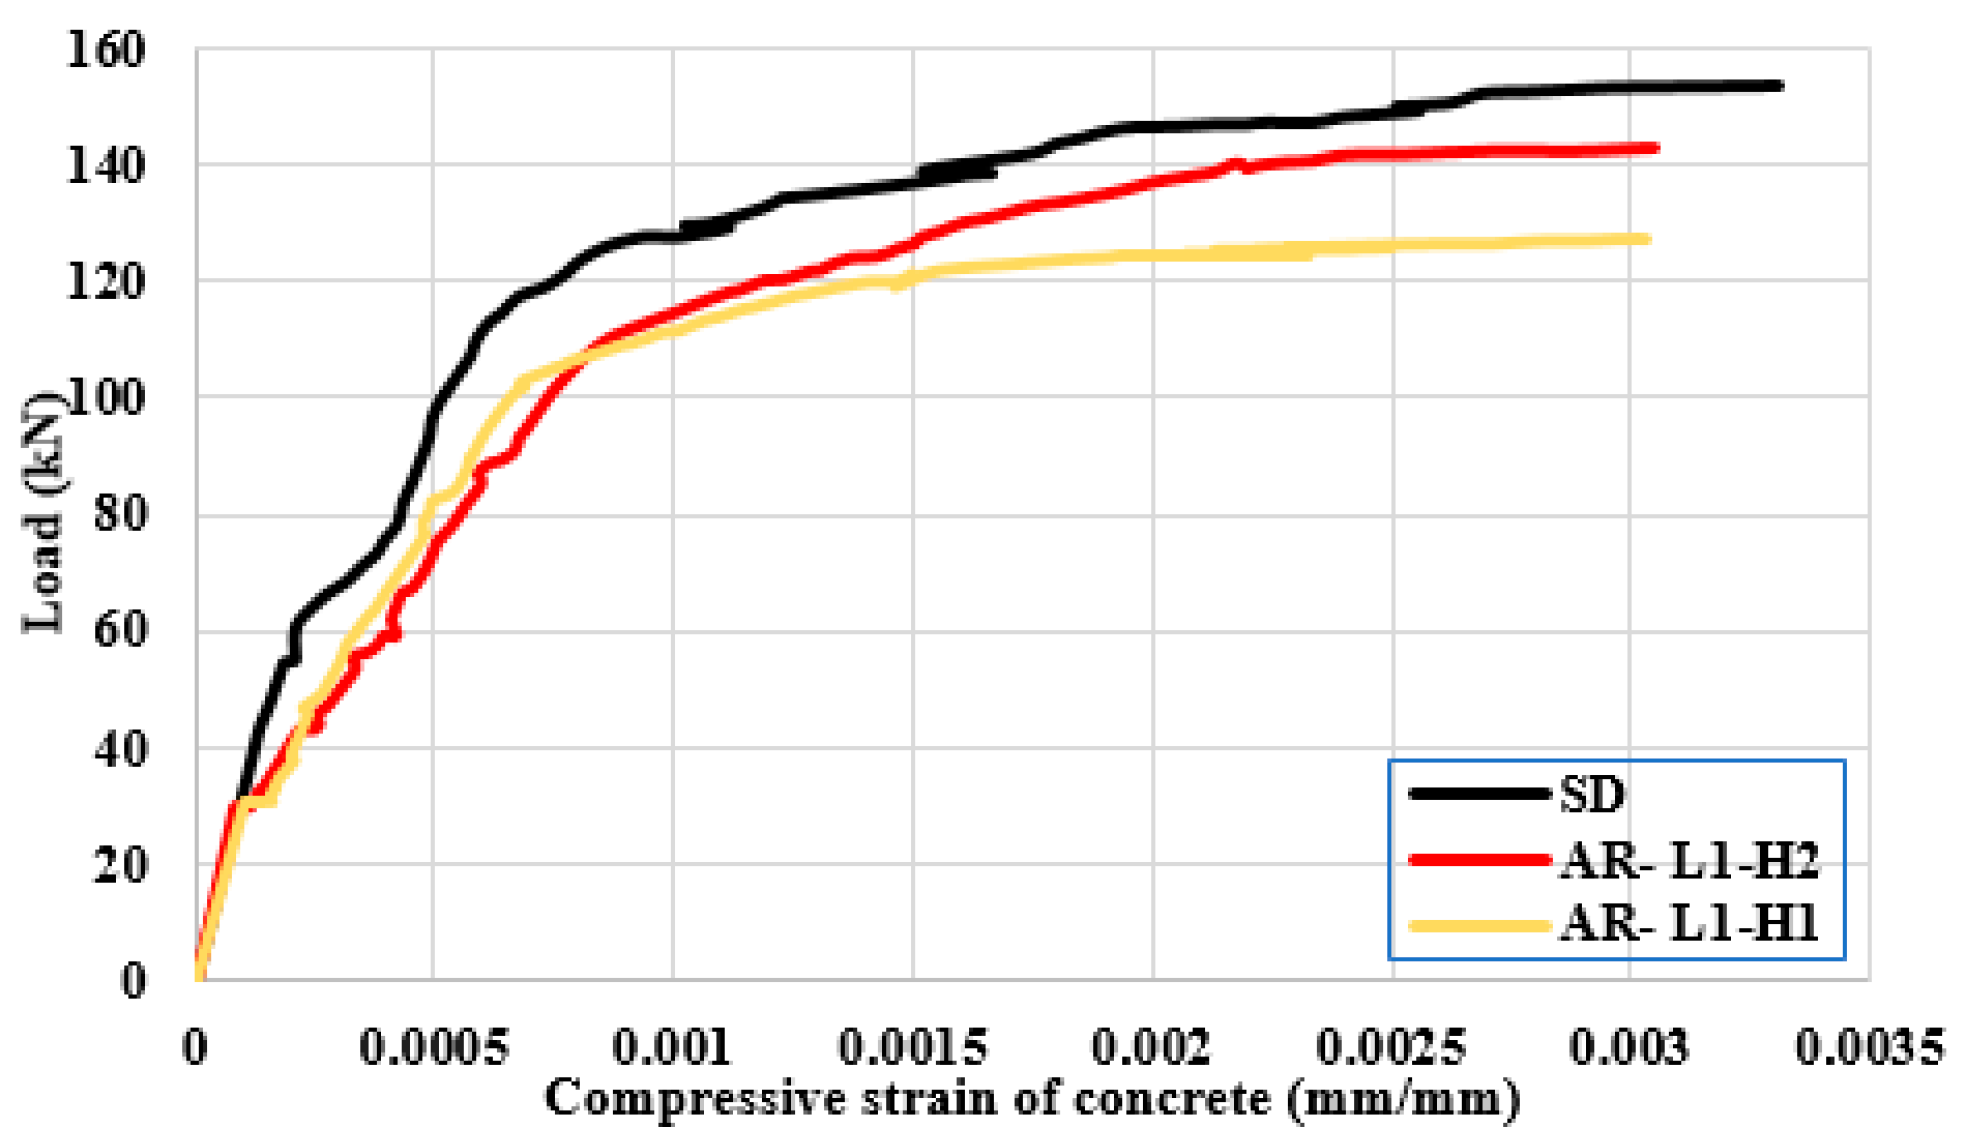
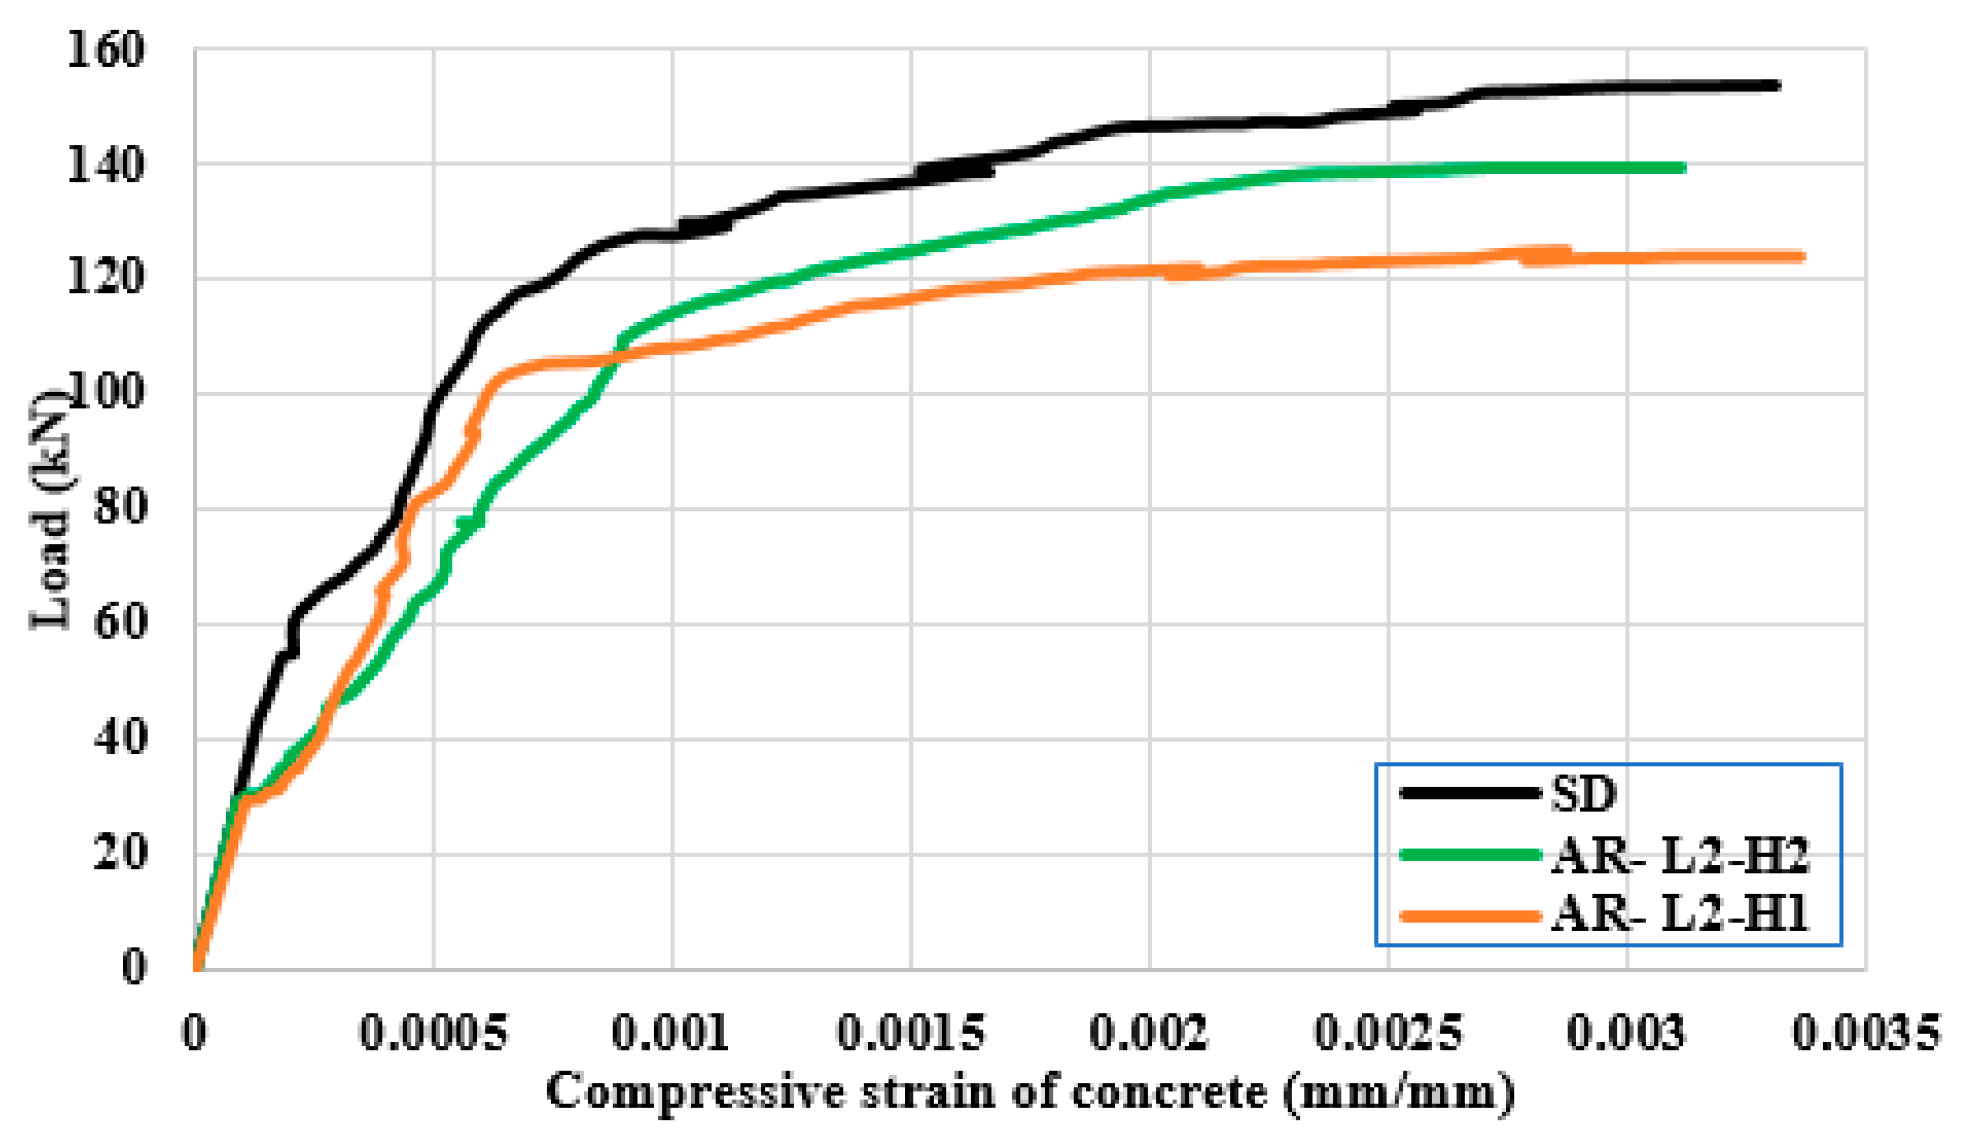
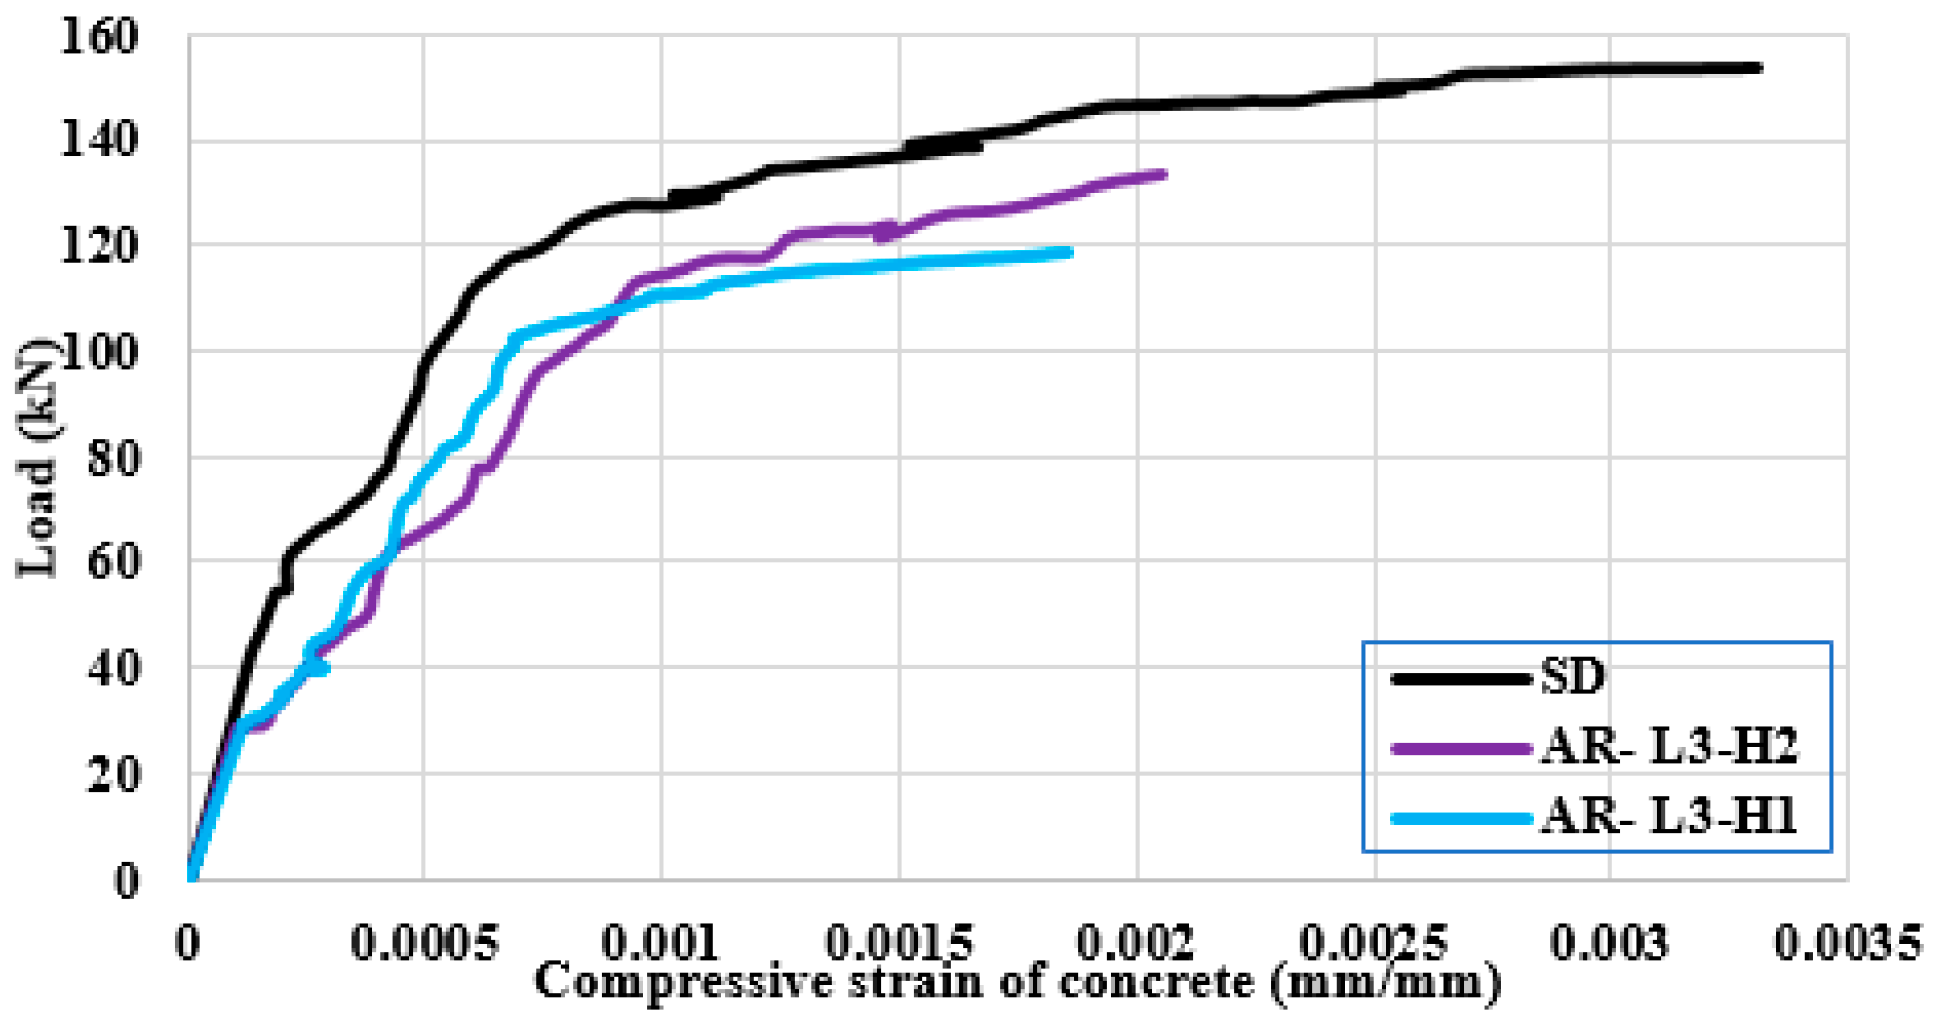
3.3. Strains in the Concrete

Figure 15 and Figure 16 demonstrate the load–compressive strain curves of the tested concrete slabs. For the control specimen SD, the strain increased linearly up to 0.00015 at the loading level of 60 kN. After that, the initial flexural cracks were formed and then propagated, which led to increases in the strain values. The yielding of steel reinforcement started at a loading level of 120 kN, where the load–strain curve behaved non-linearly. The crushing of concrete started when the specimen reached a load level of 156 kN and a strain value of 0.0033. The same behaviors were observed for the specimens with the PEABs, with 50% reduction in the cracking loads of these specimens relative to the control one. Crushing of concrete occurred at nearly the same strain level as the control slab.
Generally, the presence of the PEABs led to increases in the compressive strains of concrete at the same loading level corresponding to the control slab specimen SD. For slab specimens with hP/H = 0.7, increasing the lP/L ratio from 0.5 to 1.0 led to an increase in the compressive strain from 22% to 27% relative to the control slab specimen SD. For the slabs with hP/H = 0.54, the growth increased from 39% to 50%.
At a certain ratio of hP/H, increasing the lP/L ratio caused an insignificant effect on concrete compressive strain except for the case of lP/L = 1, where the mode of failure was changed to be a shear failure. This might be attributed to the constant compression zone of concrete at the mid-span. The load–compressive strain curves of concrete for the slab specimens with hP/H = 0.5, 0.75, and 1.0 are shown in Figure 17, Figure 18 and Figure 19, respectively. At a certain lP/L ratio, increasing the hP/H ratio led to a significant effect on increasing the concrete compressive strain. This might be attributed to the reductions in the compression zone of concrete at the mid-span.
The embedded polystyrene blocks affected the neutral axis (NA) position, which moved down due to the concrete cracking. Therefore, the specimens with the PEABs showed higher levels of compressive strains in the extreme fiber of the cross-section relative to the control solid slab specimen.

4. Finite Element Simulation

The Abaqus 2020 software [17] was used to conduct the FE simulation. The geometric and material non-linearity simulations were presented.

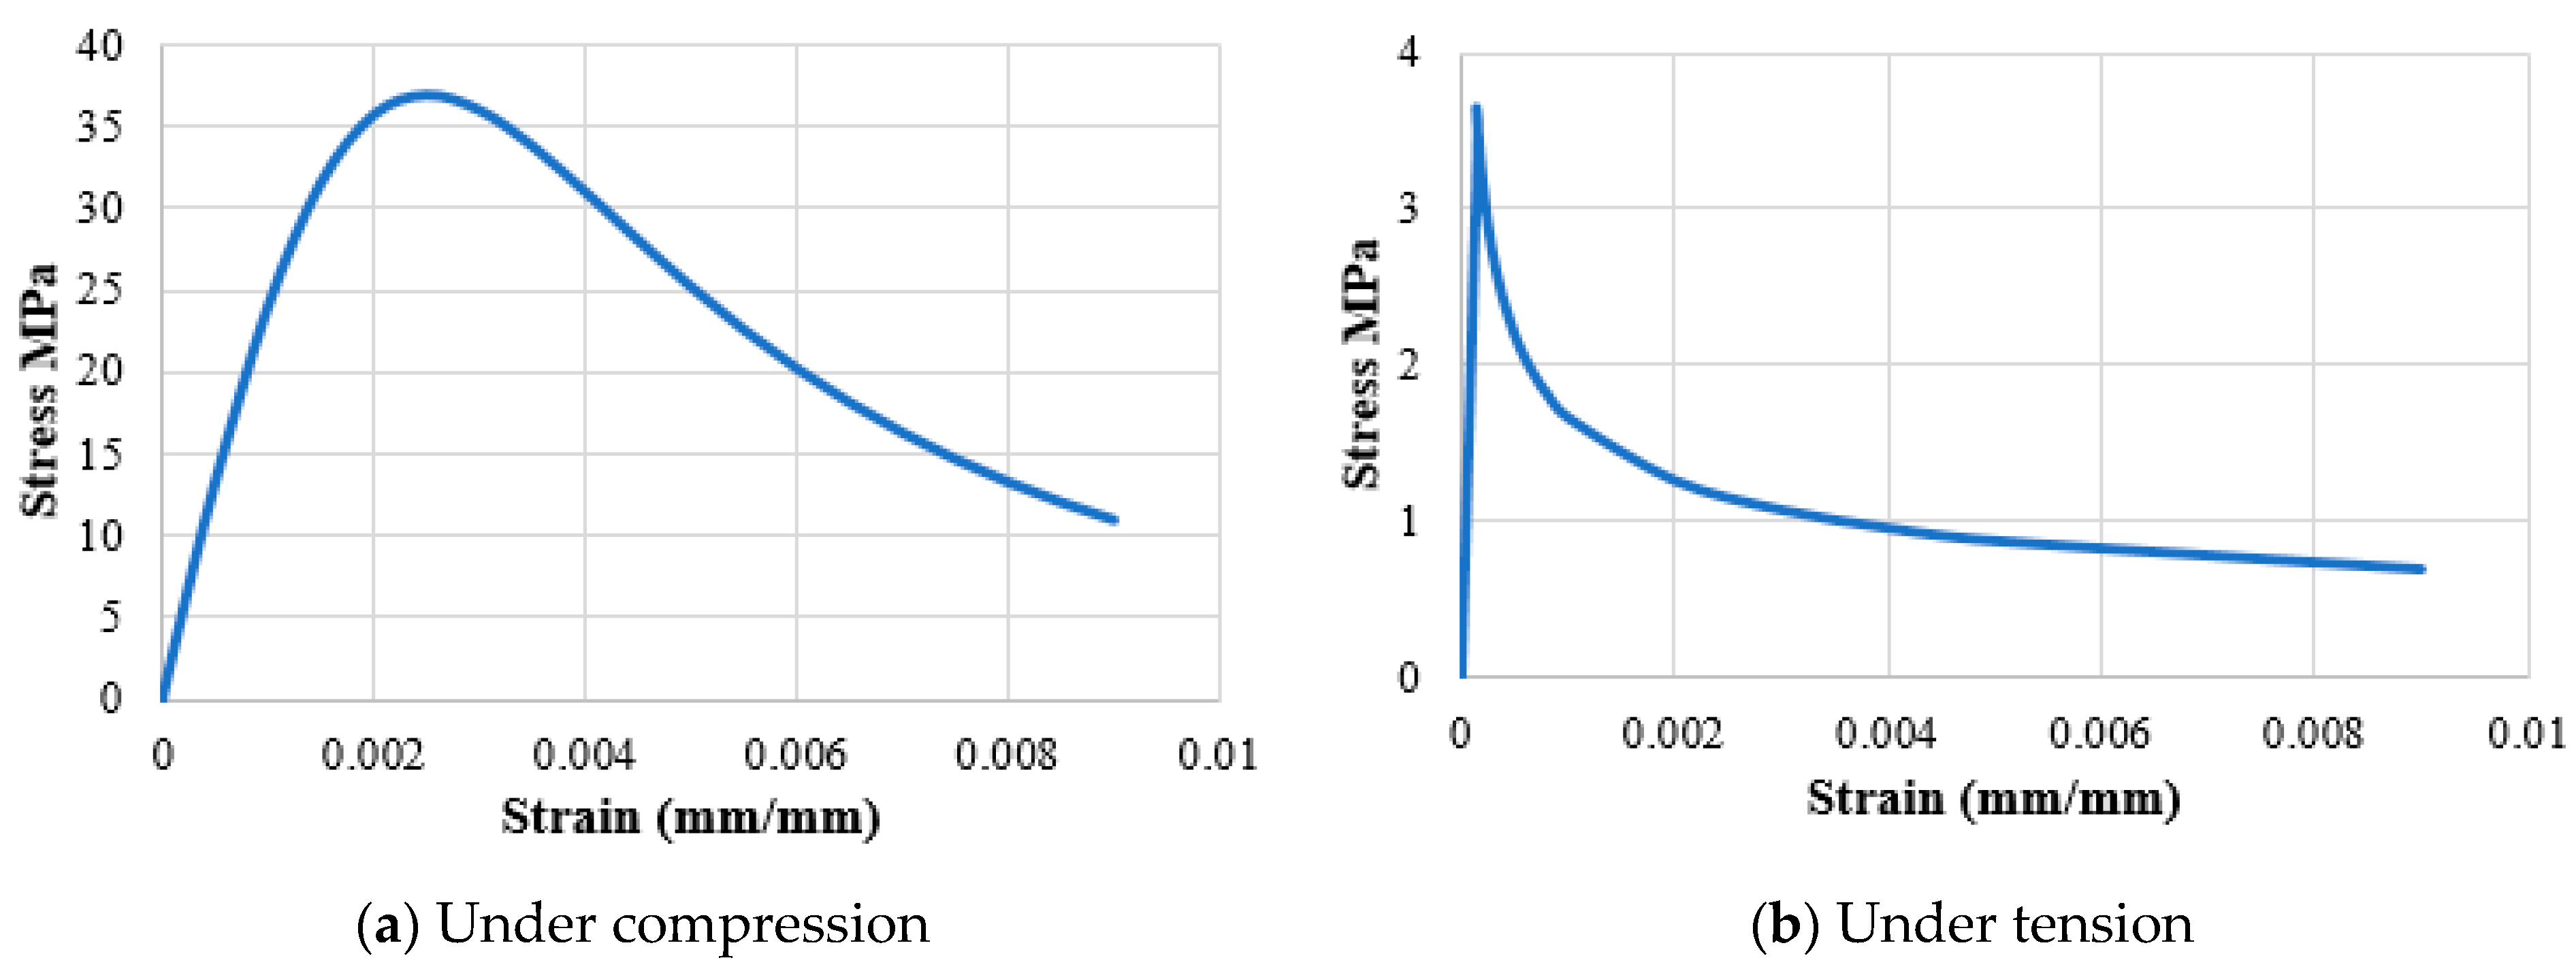
4.1. Constitutive Models of Materials

In the FE model, the damage in concrete was simulated using the concrete damage plasticity (CDP) model, which was implemented in Abaqus 2020 [17]. The concrete compressive and tensile composition relationships, damage parameters for cracking and crushing, and other material parameters, such as dilation (φ), eccentricity (ε), compressive strength to uniaxial pressure ratio biaxial (fbo/fco), coefficient (K), and viscosity parameters (μ), were implemented in the CDP model [18]. Table 3 lists these parameters that were used in this study.
In this study, the compressive stress–strain curve of concrete suggested by Saenz [19] was used and is shown in Figure 20a, whereas the tensile stress–strain curve developed by Belarbi and Hsu [20] was utilized in this study, as shown in Figure 20b.
The steel reinforcement behavior was simulated using a bilinear model, which was implemented in Abaqus [17]. The linear, isotropic part was defined by the modulus of elasticity and the Poisson ratio of steel, which were 200 × 103 MPa and 0.3, respectively. The reinforcement was plasticized completely when reaching the yield stress fy.

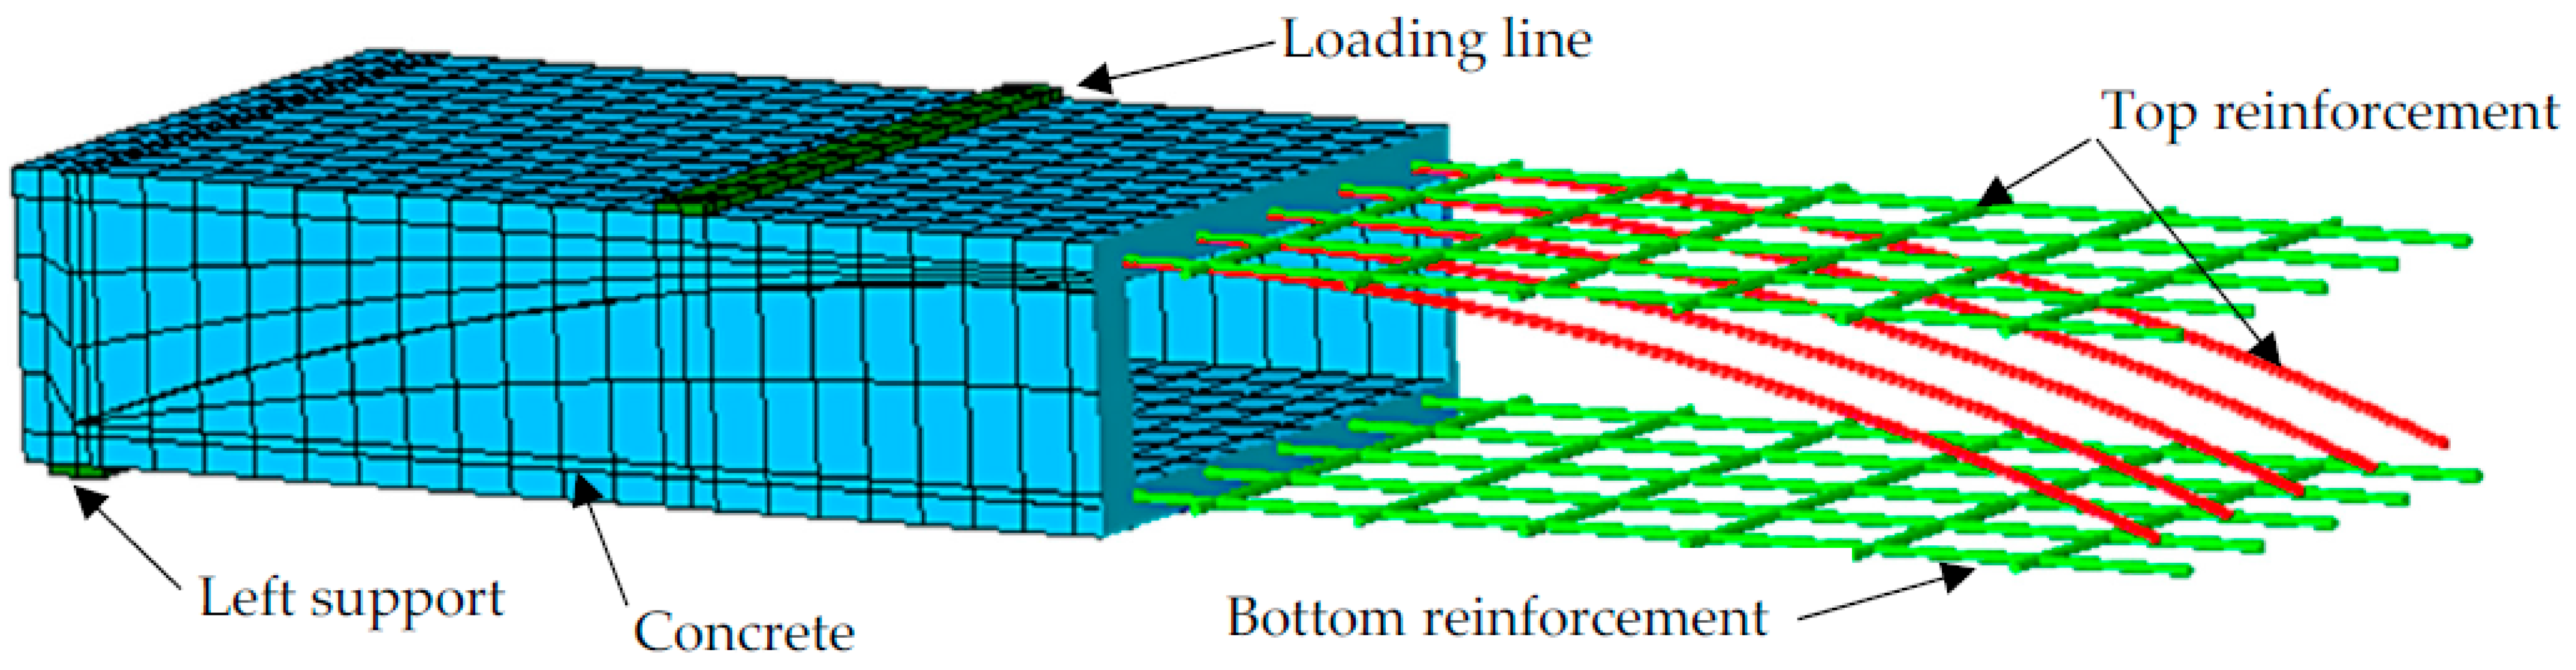
4.2. FE Mesh and Discretization

Concrete was simulated by solid element, C3D8. This element is capable of simulating cracking in tension and crushing in compression after exceeding the stress limits. Three-dimensional truss elements, T3D2, were used to model the steel reinforcement. A full bond was assumed between the nodes of the concrete and reinforcement elements. The PEABs were simulated as a mass block in the FE model with a full bond with concrete, taking into account their density and modulus of elasticity. This technique was adopted in one model only. However, the FE results were approximately the same for the models that did not consider the PEABs. Therefore, to avoid the unconvergence issues and reduce the solution time, the PEABs were not considered in the FE model.
To enhance the FE model and eliminate the unconvergence concerns, several trials with various mesh sizes were conducted. Concrete cubes with maximum dimensions of 50 mm × 50 mm × 50 mm were employed. Figure 21 shows the FE mesh and discretization for a typical, tested slab specimen with PEABs. The boundary conditions were modeled to be similar to those experimental conditions. The translational degrees of freedom (DOFs) in the X- and Y-axis were limited at one of the supports, indicating hinged support. For the other support, which represented roller support, translational DOFs were constrained only in the Y direction.

4.3. Verification of the FE Results

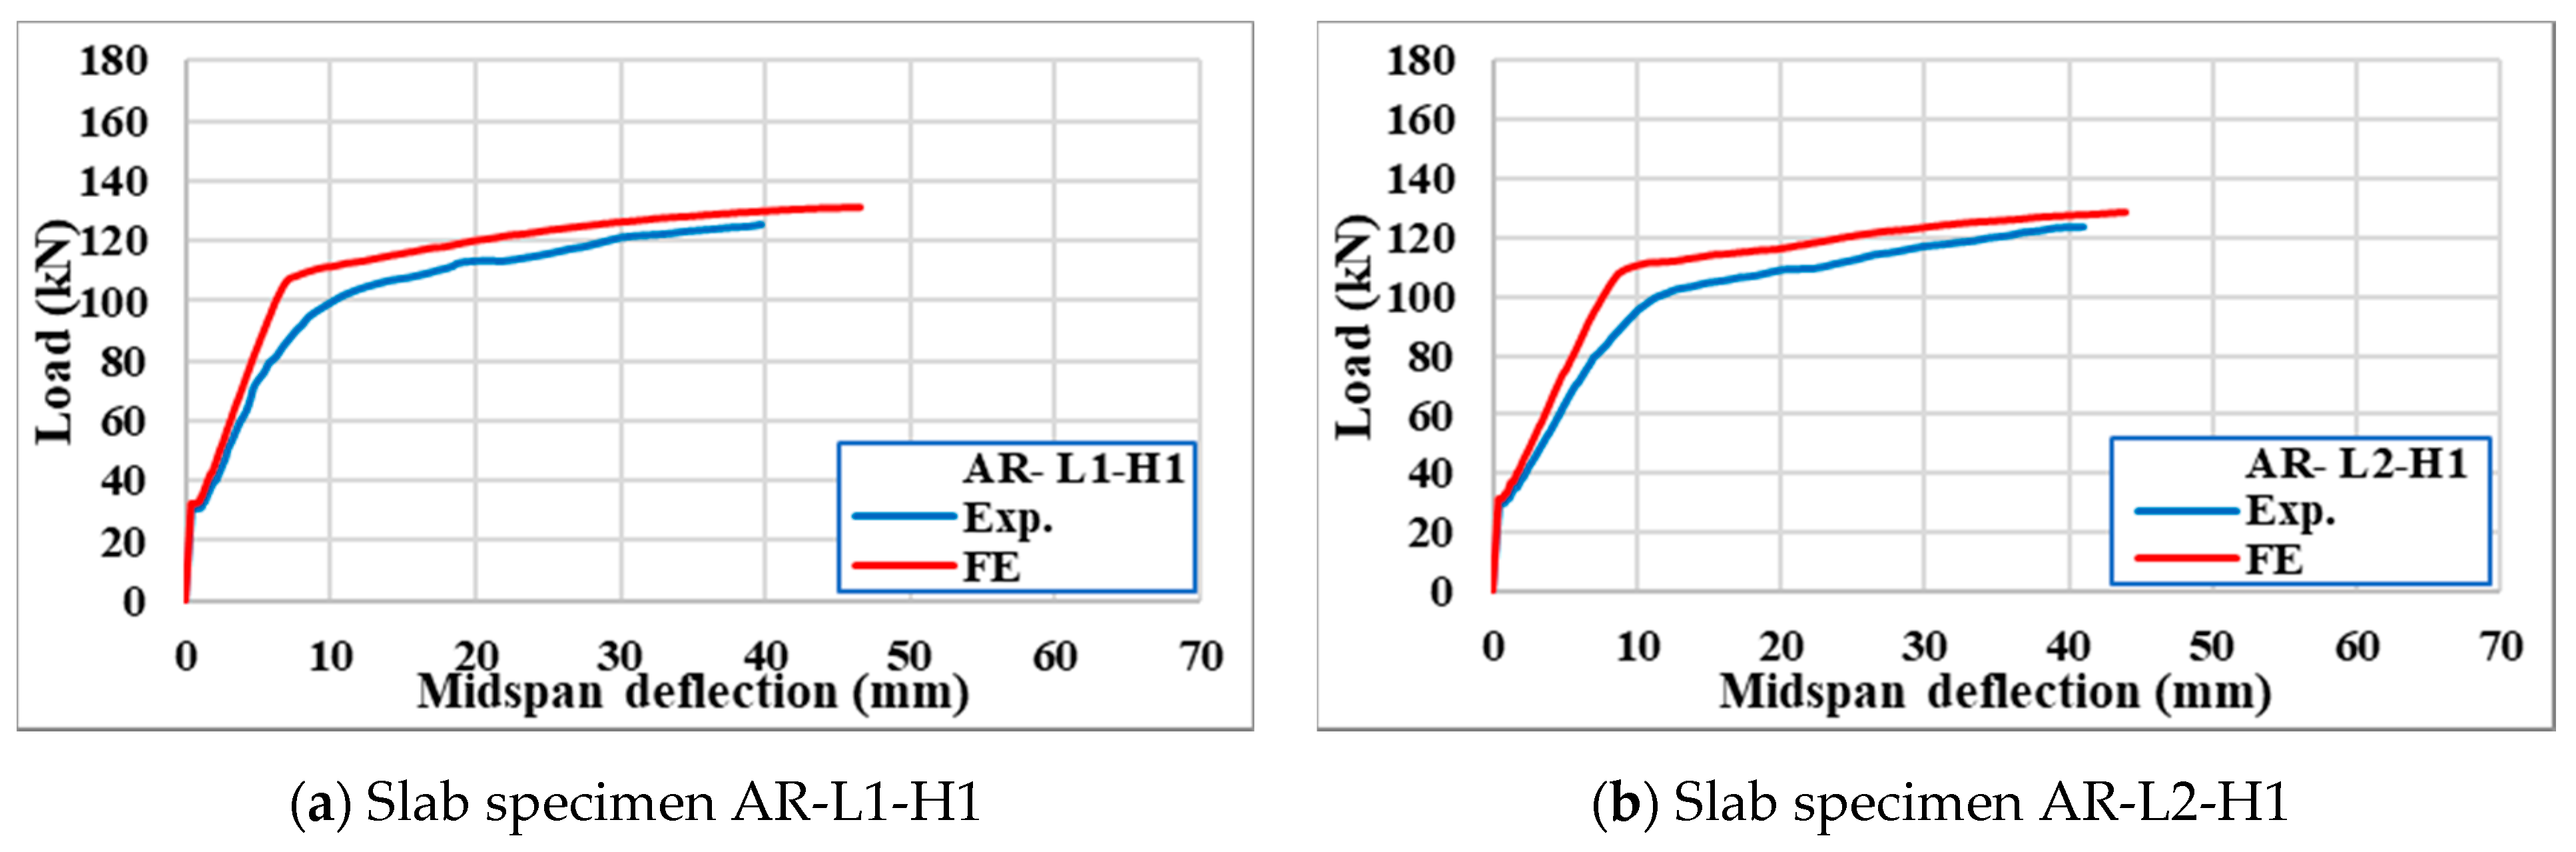
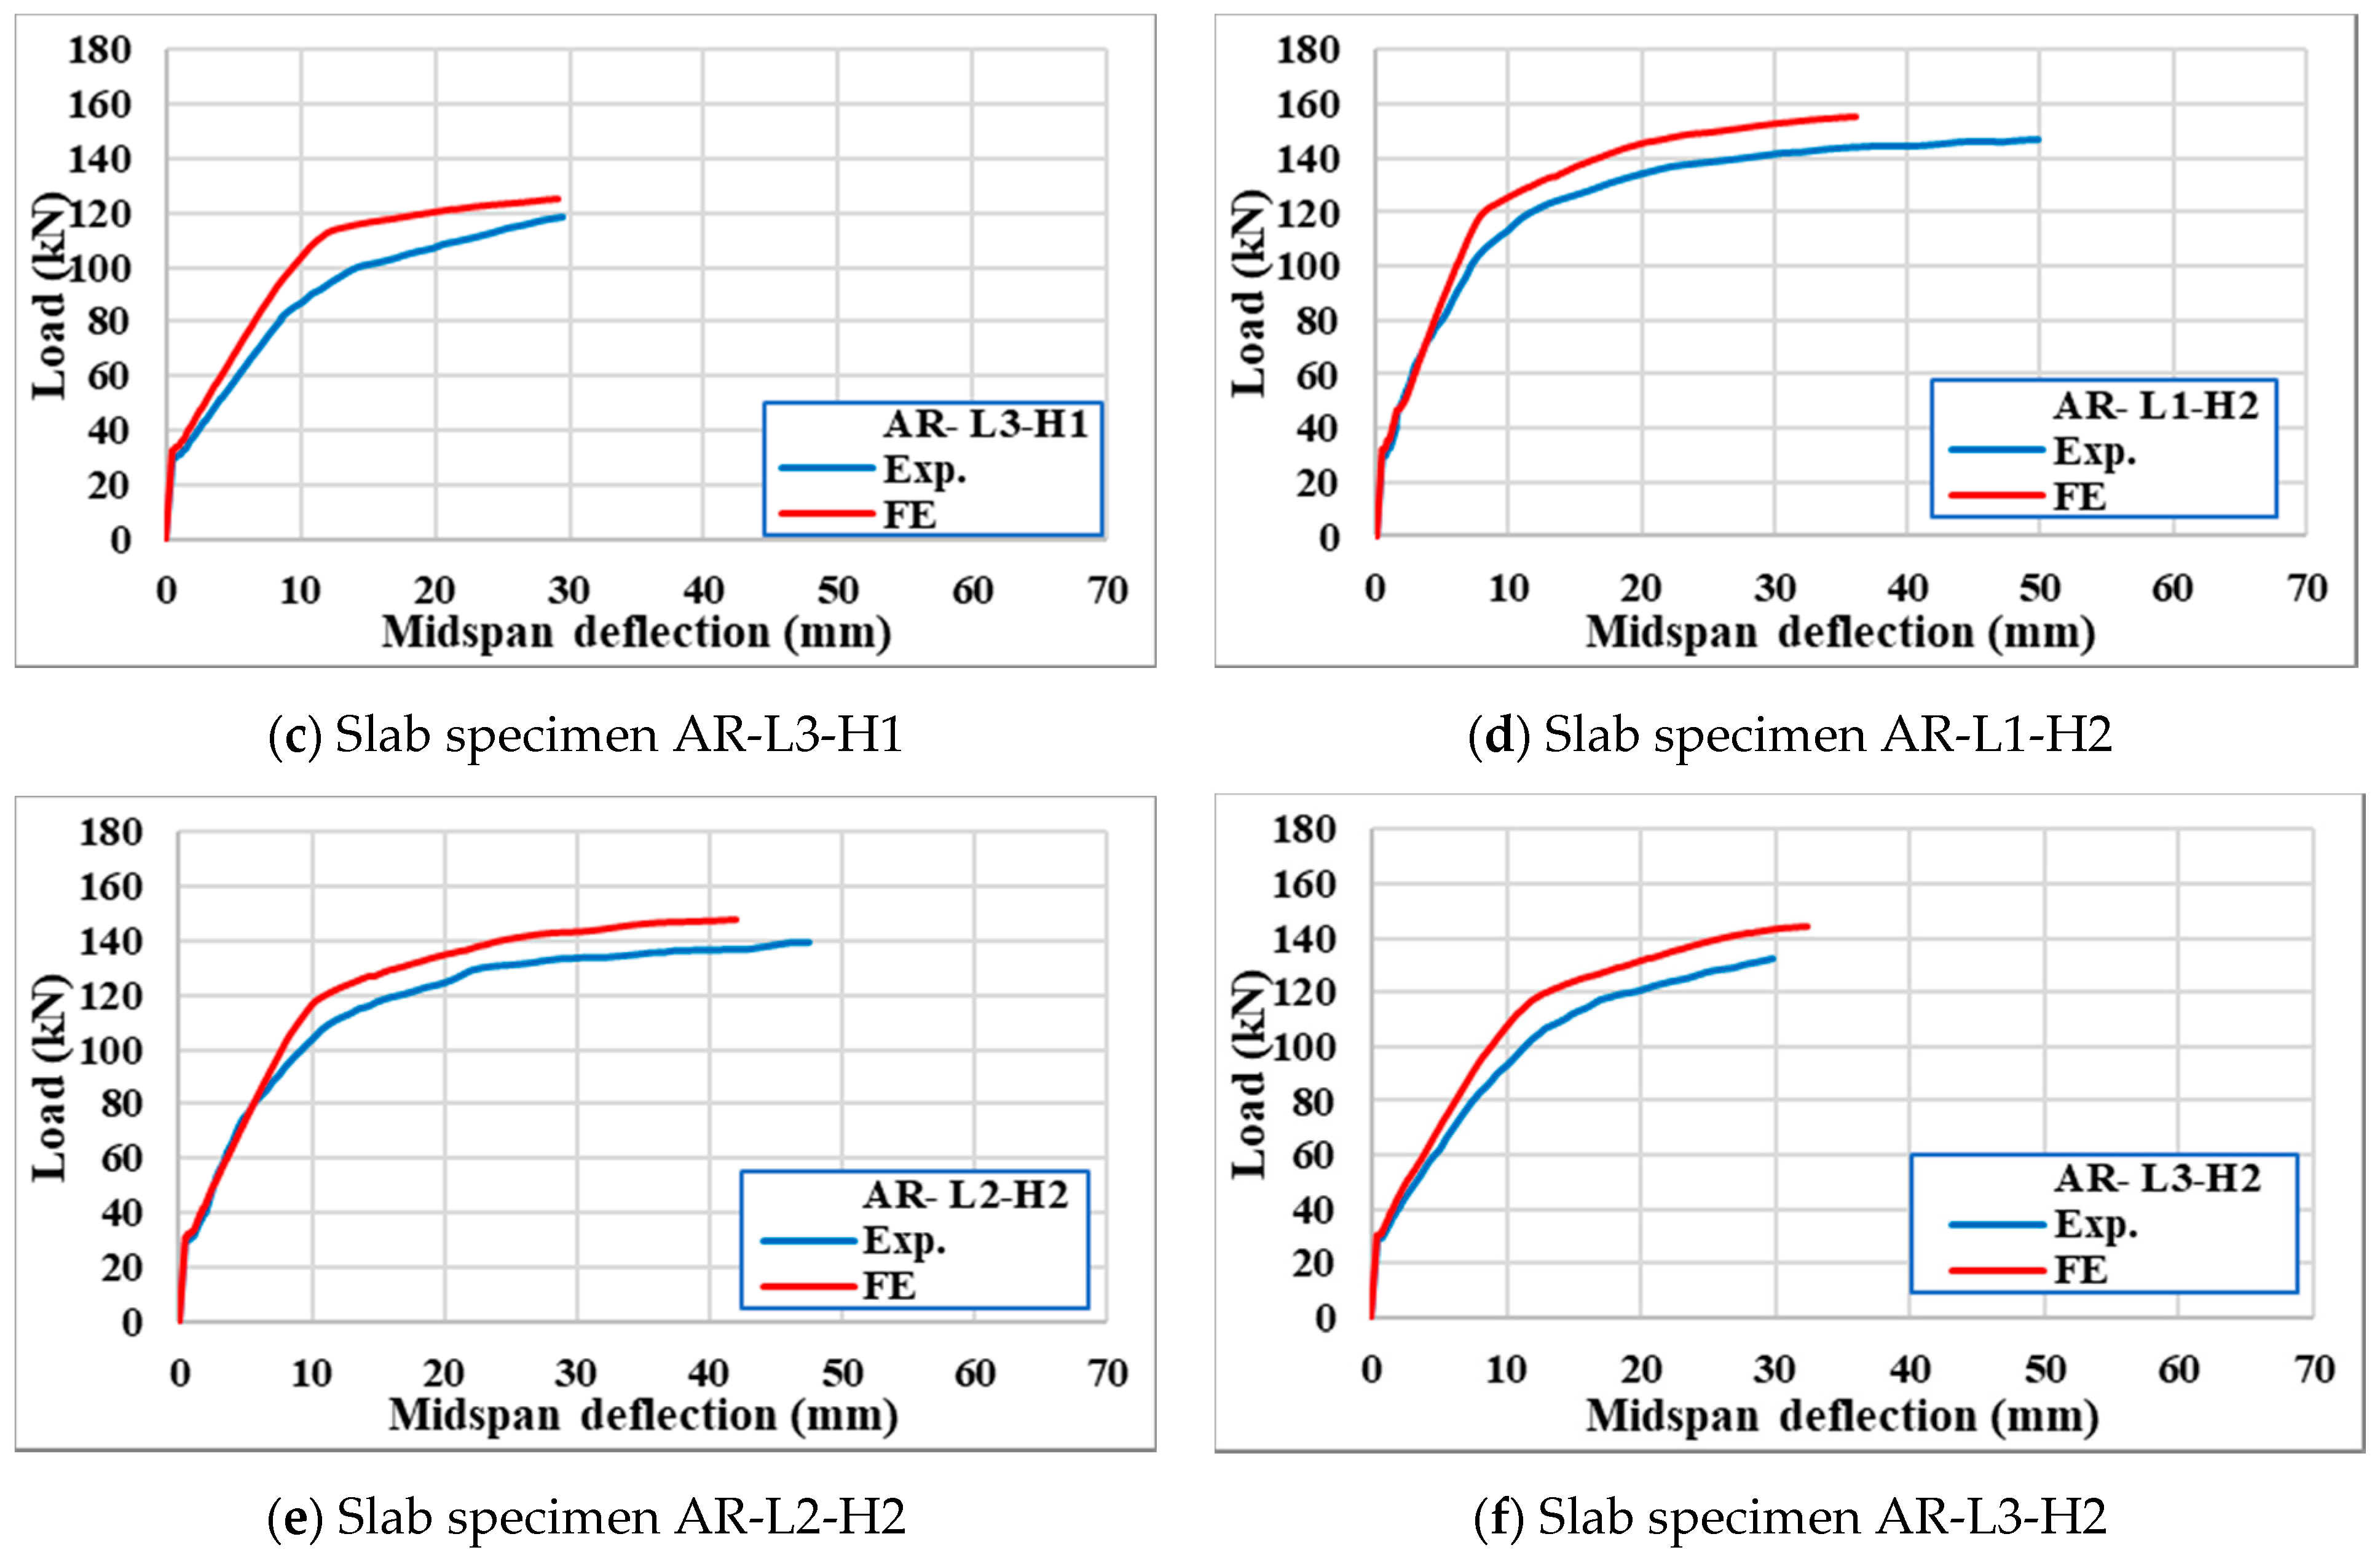
4.3.1. Load–Deflection Relationships

In terms of the load–deflection responses, Figure 22 and Table 4 compare the experimental and FE results. During the elastic stage, the slab responses from the two approaches were fairly similar. The FE findings stiffened slightly as the applied load approached the yielding load. The supposed complete contact between the concrete and reinforcement was attributed to the disparity in response. However, there were good agreements between the experimental and FE results.

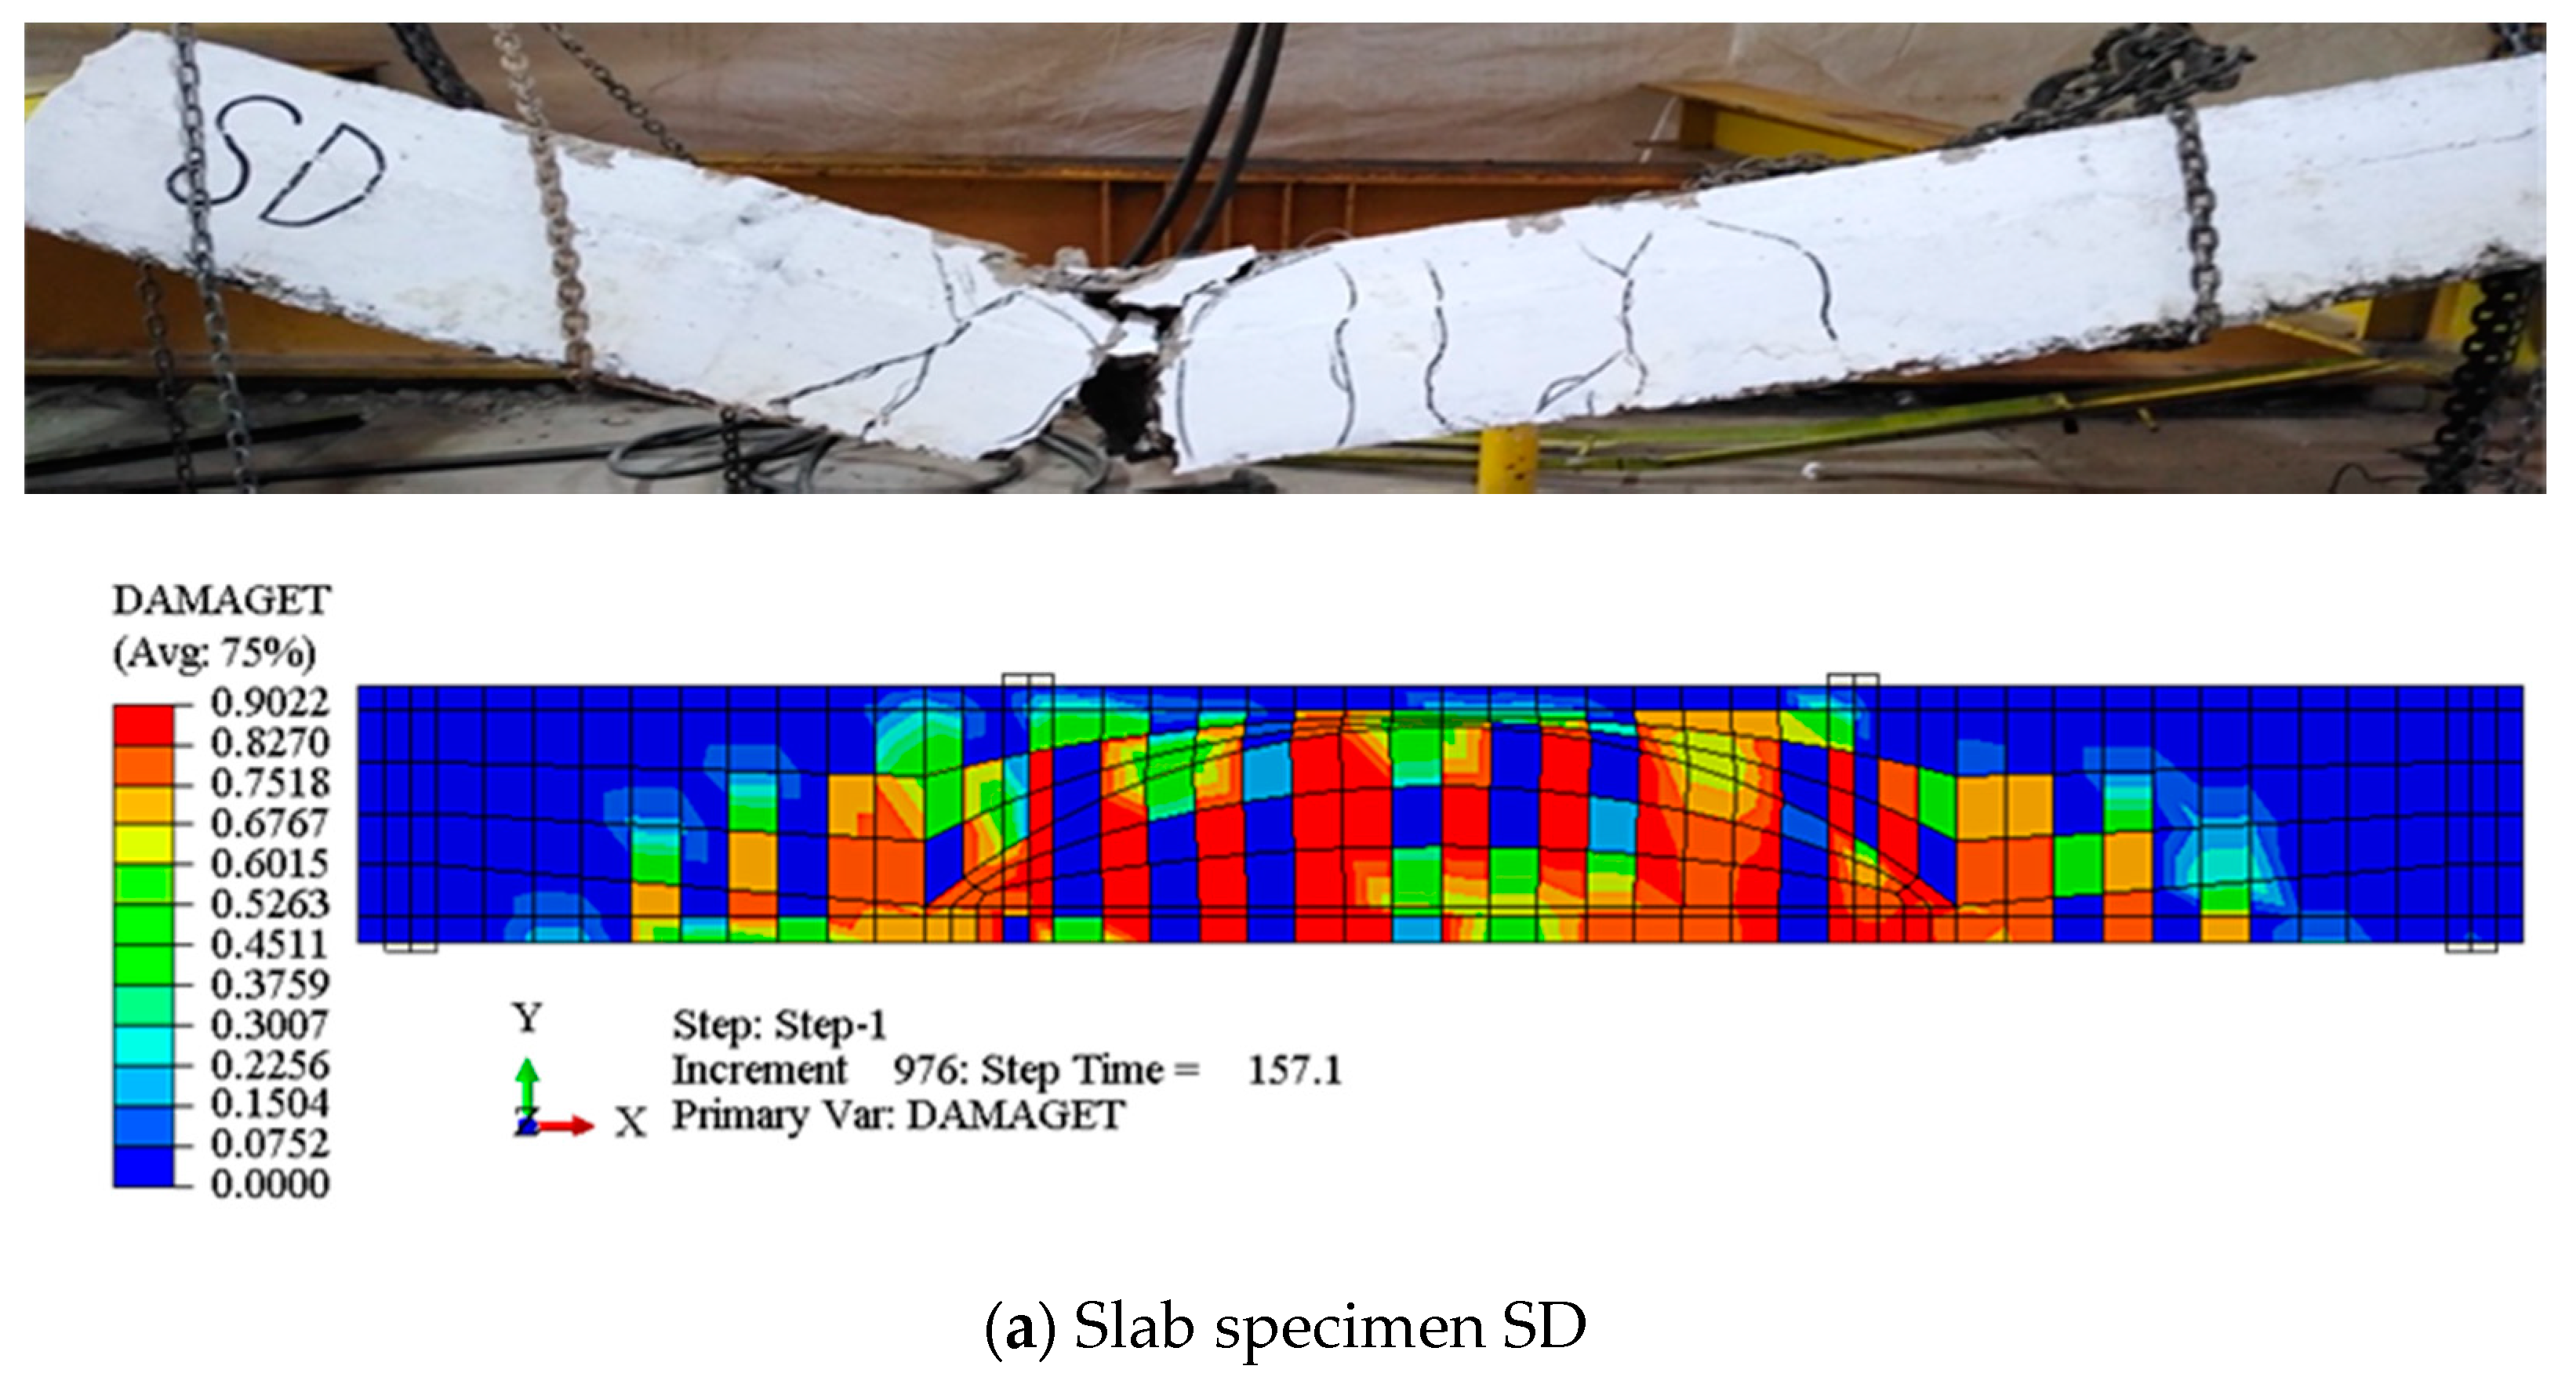
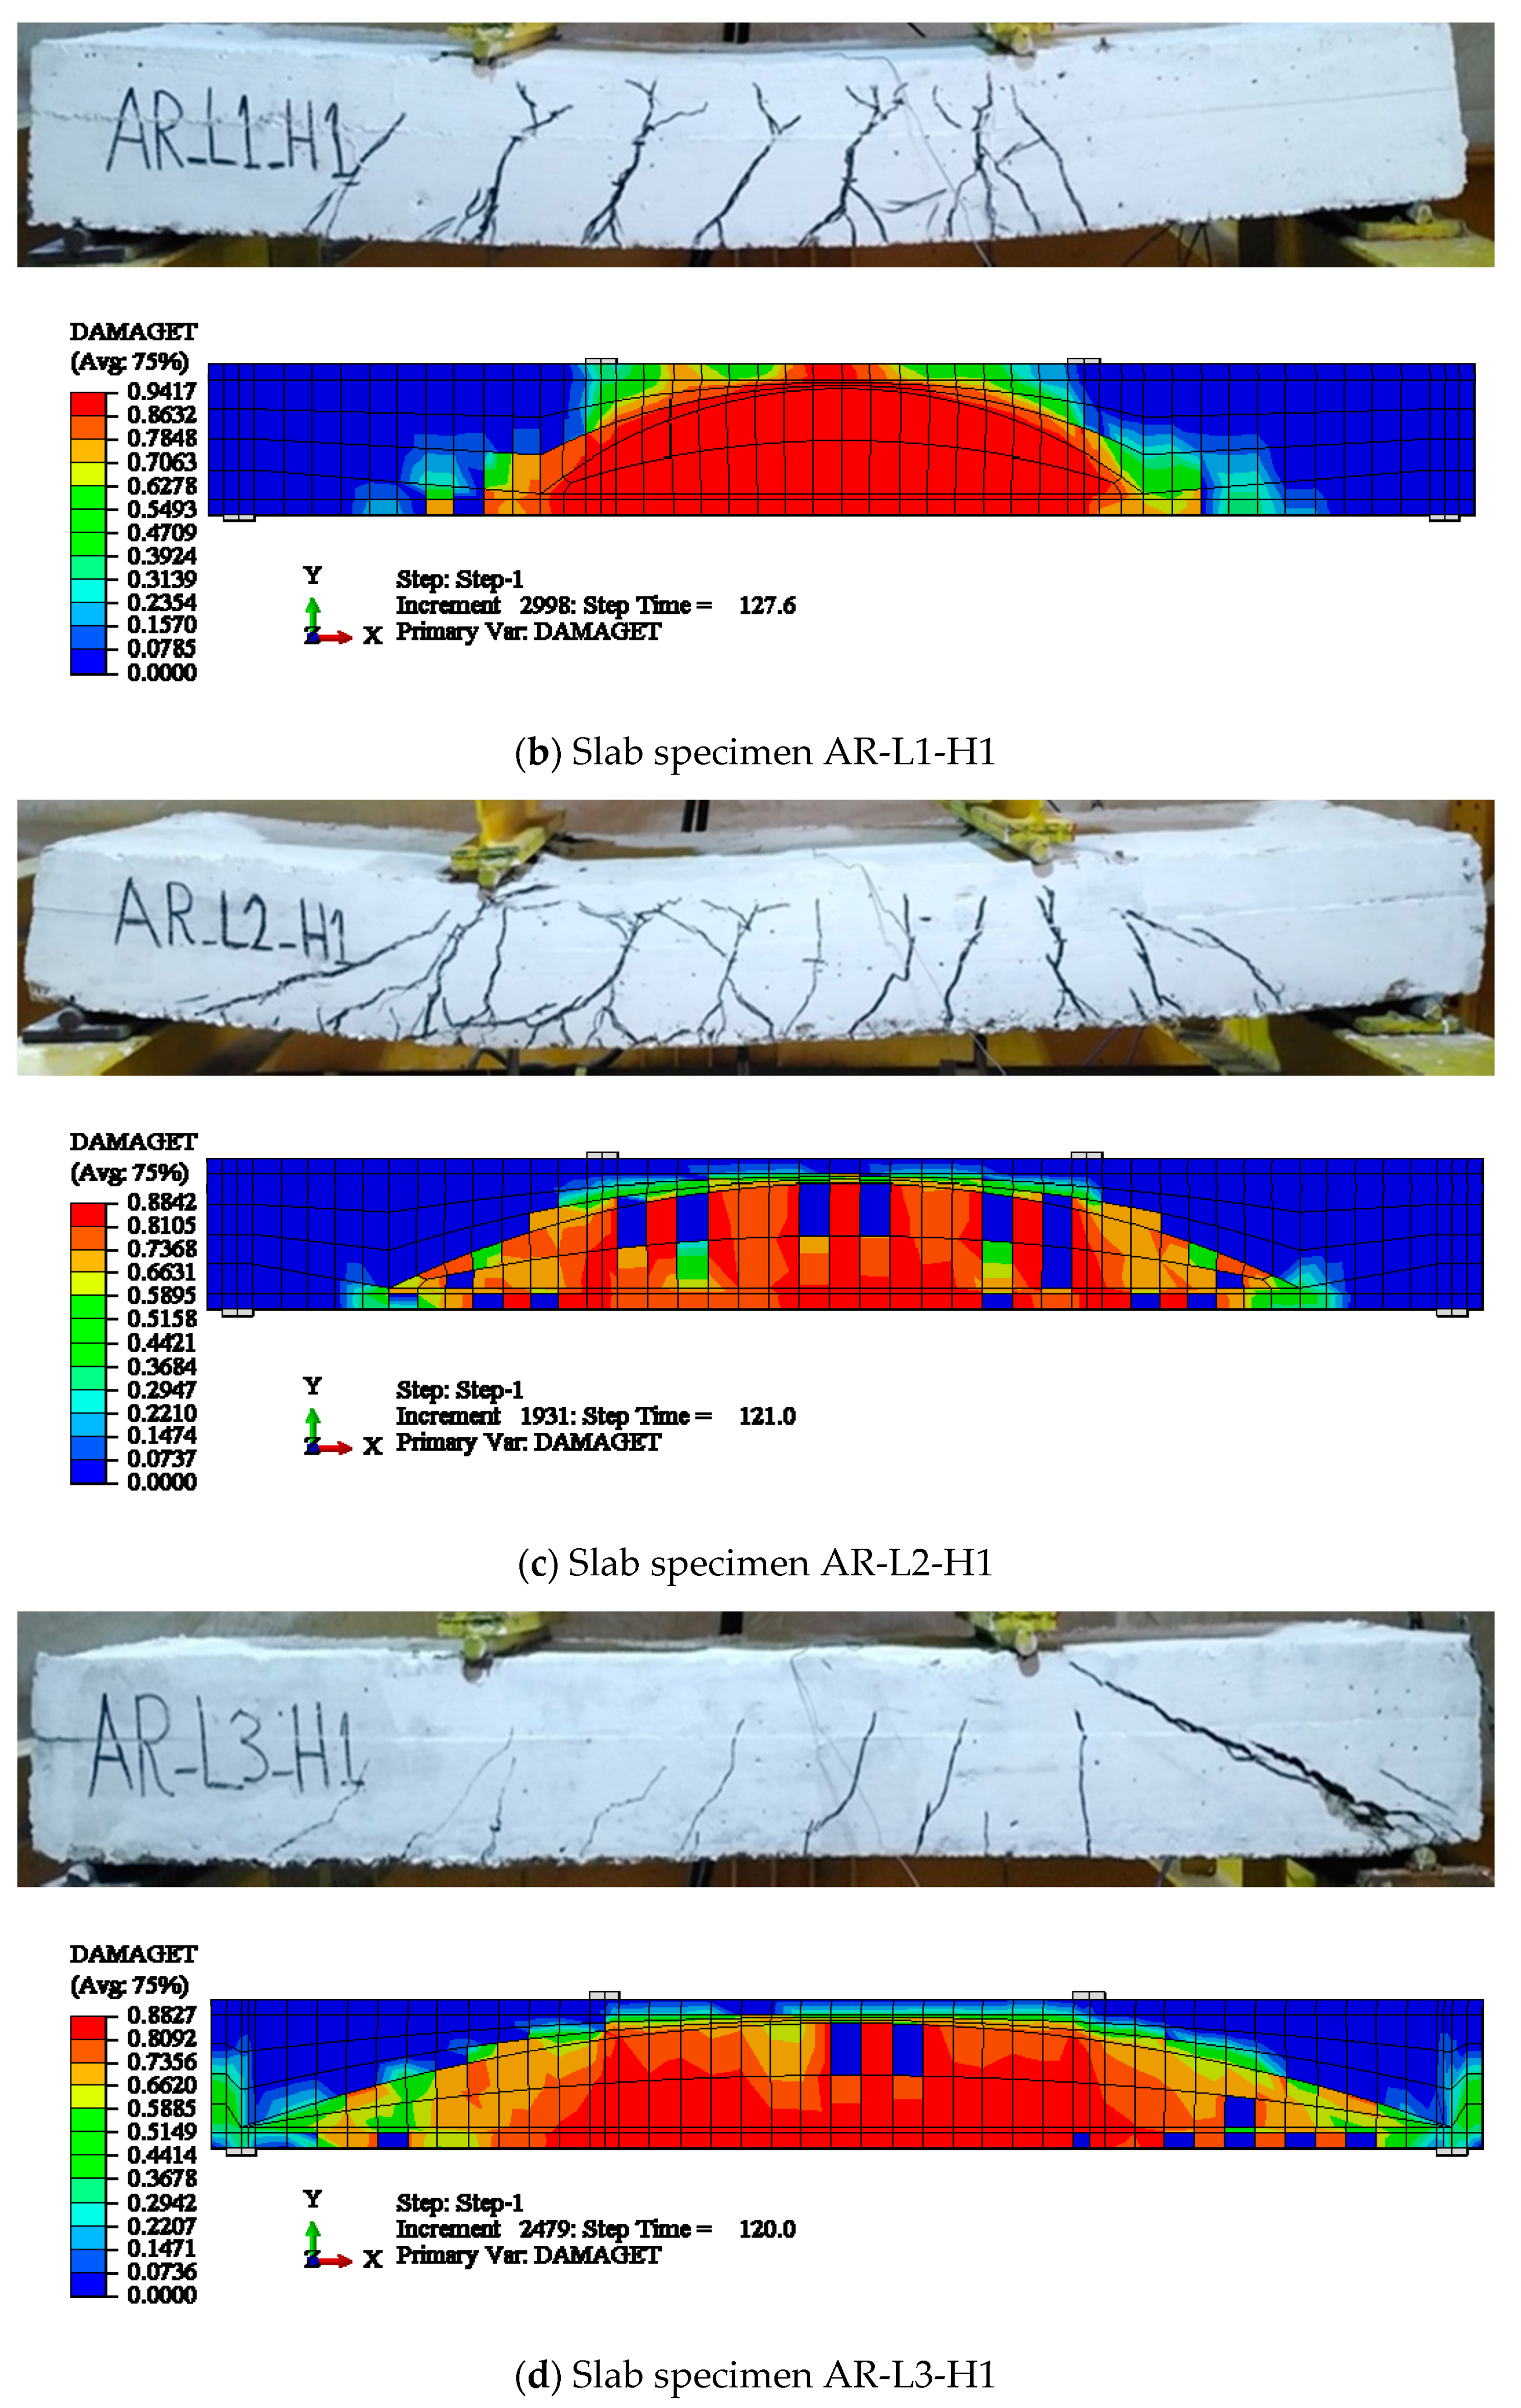
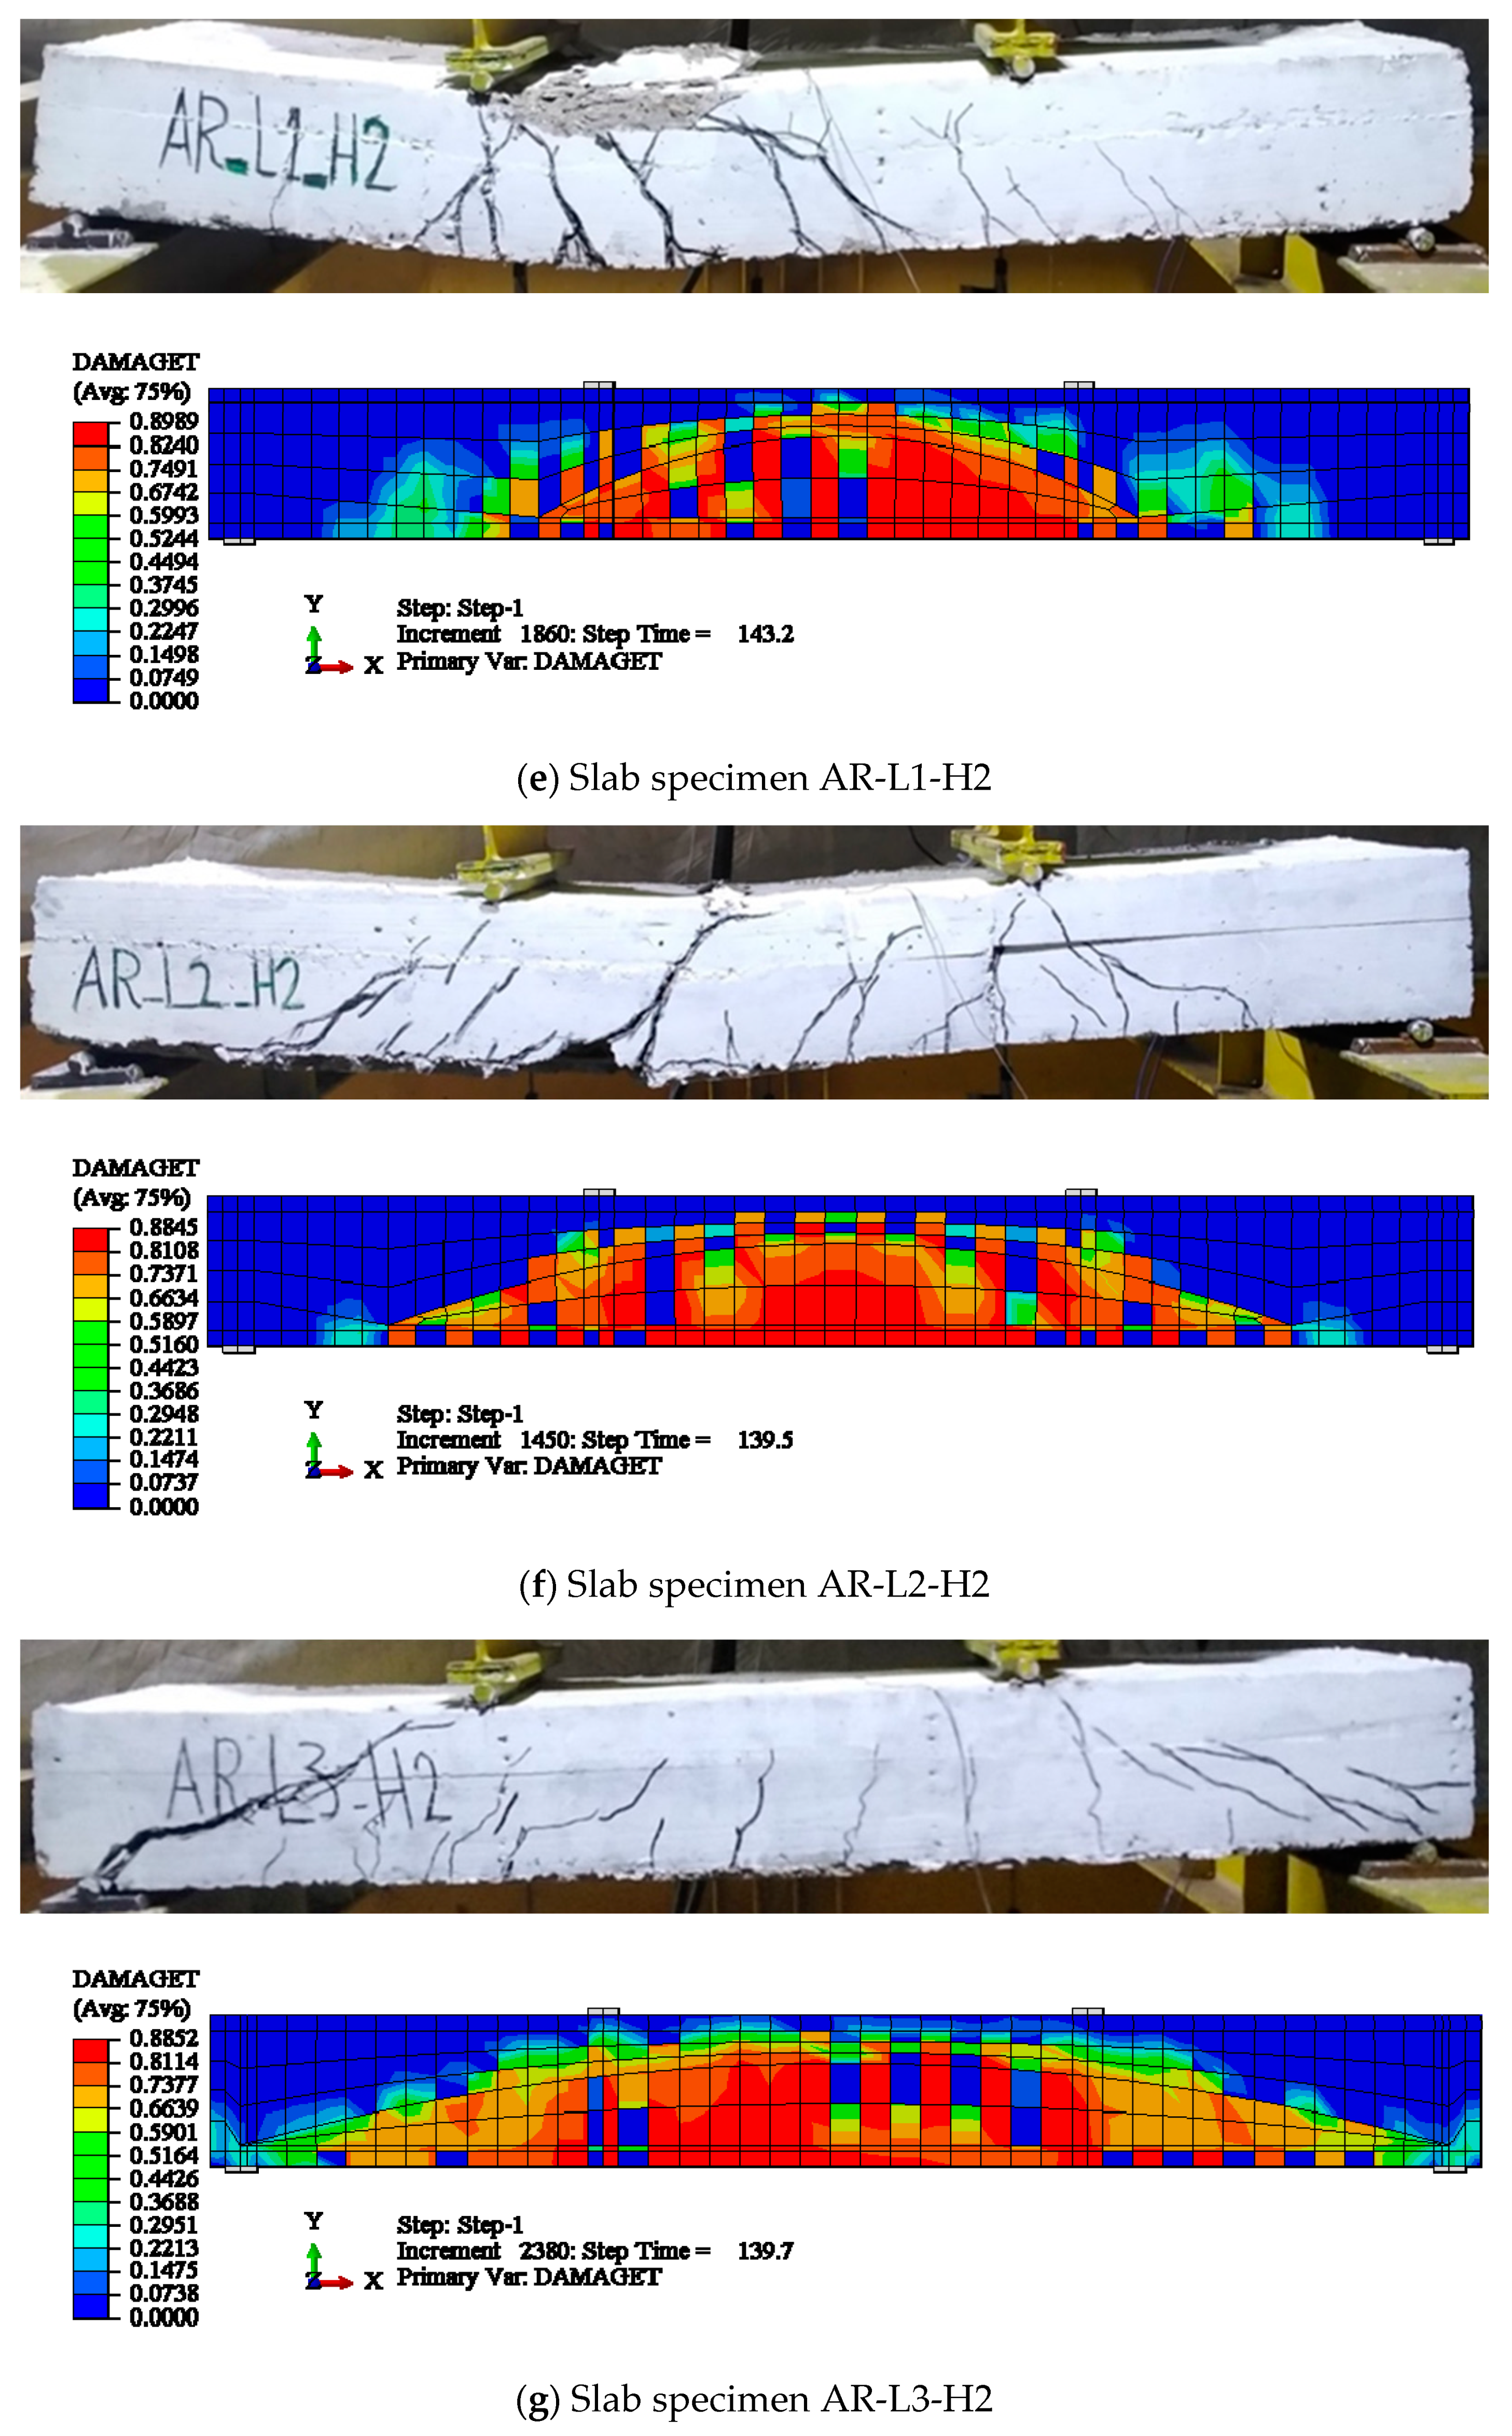
4.3.2. Damage of the Analyzed Beams

Figure 23 shows the damages of the slab specimens generated from the FE model in contrast to the experimental failure pattern. The option used to establish the post-cracking damage (stiffness degradation) attributed to the CDP model was utilized to describe the FE crack patterns. From this figure it can be observed that the FE crack patterns were quite similar to the experimental cracks, demonstrating that the proposed FE model accurately captured the behavior of slab specimens with PEABs.

5. Conclusions

This study presents experimental and numerical investigations on seven one-way RC slabs with a new technique of slab weight reduction using PEABs. One of these slabs was a solid slab, which was taken as a control slab, while the other six slabs were cast with PEABs. The geometric and material non-linearity properties of the solid slab and slabs with the PEABs were considered in the developed FE model. The following conclusions could be drawn:
  • Inserting the polystyrene arched blocks into the slab core significantly reduced the self-weight of the slab. On the other hand, this reduced the slab stiffness and led to strength degradations. The minimum decrease in the ultimate load capacity was about 6% with a minimum reduction in the slab weight of 15%. In contrast, the maximum decrease in ultimate load capacity was about 24% with a maximum reduction in the slab weight of about 40%.
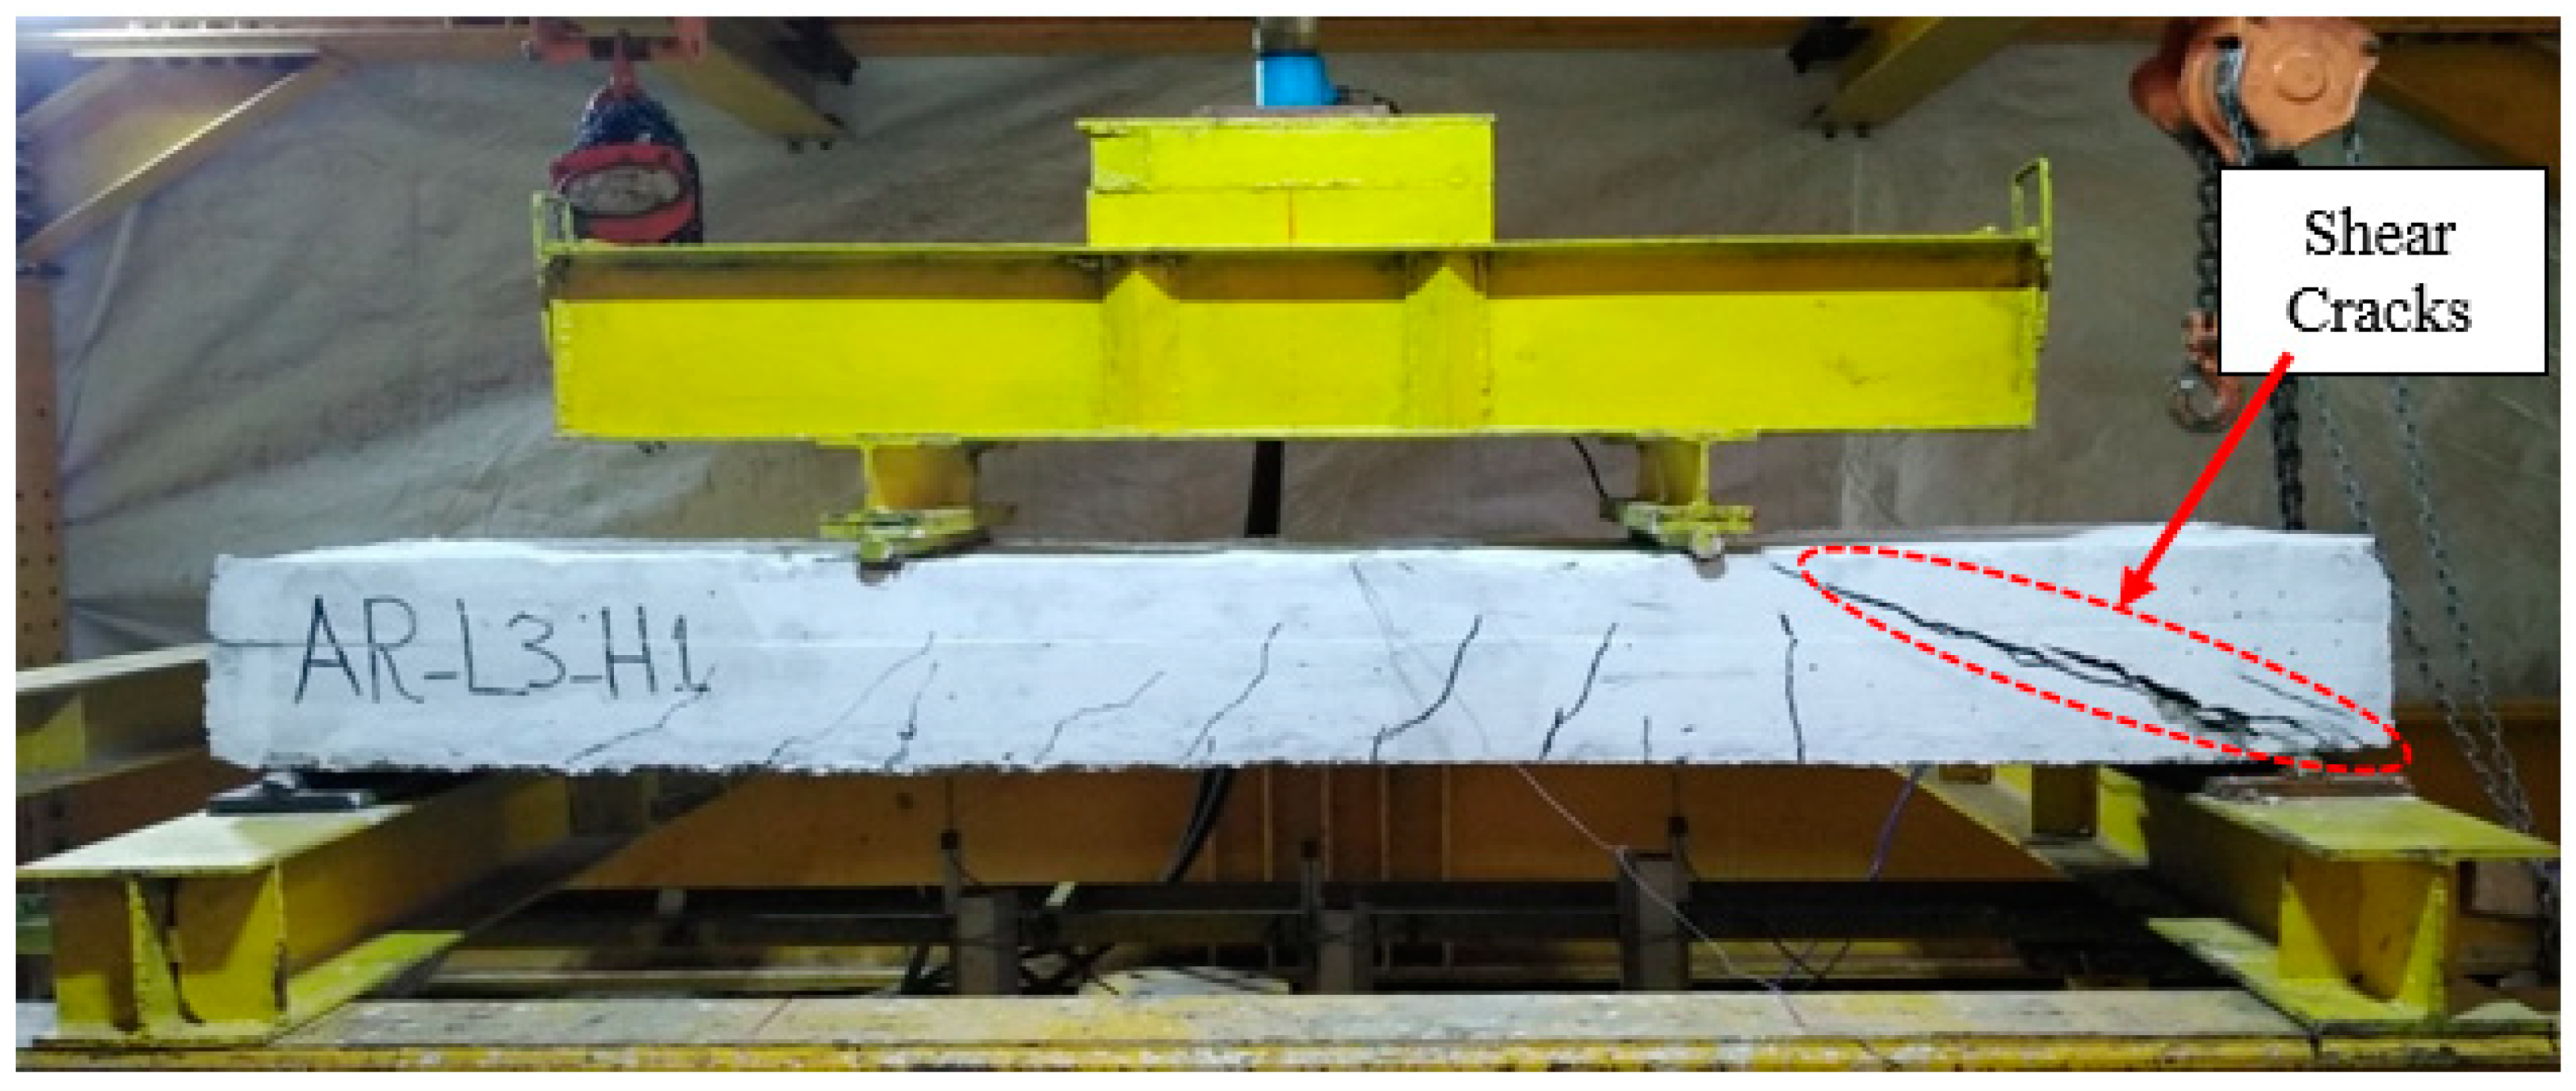
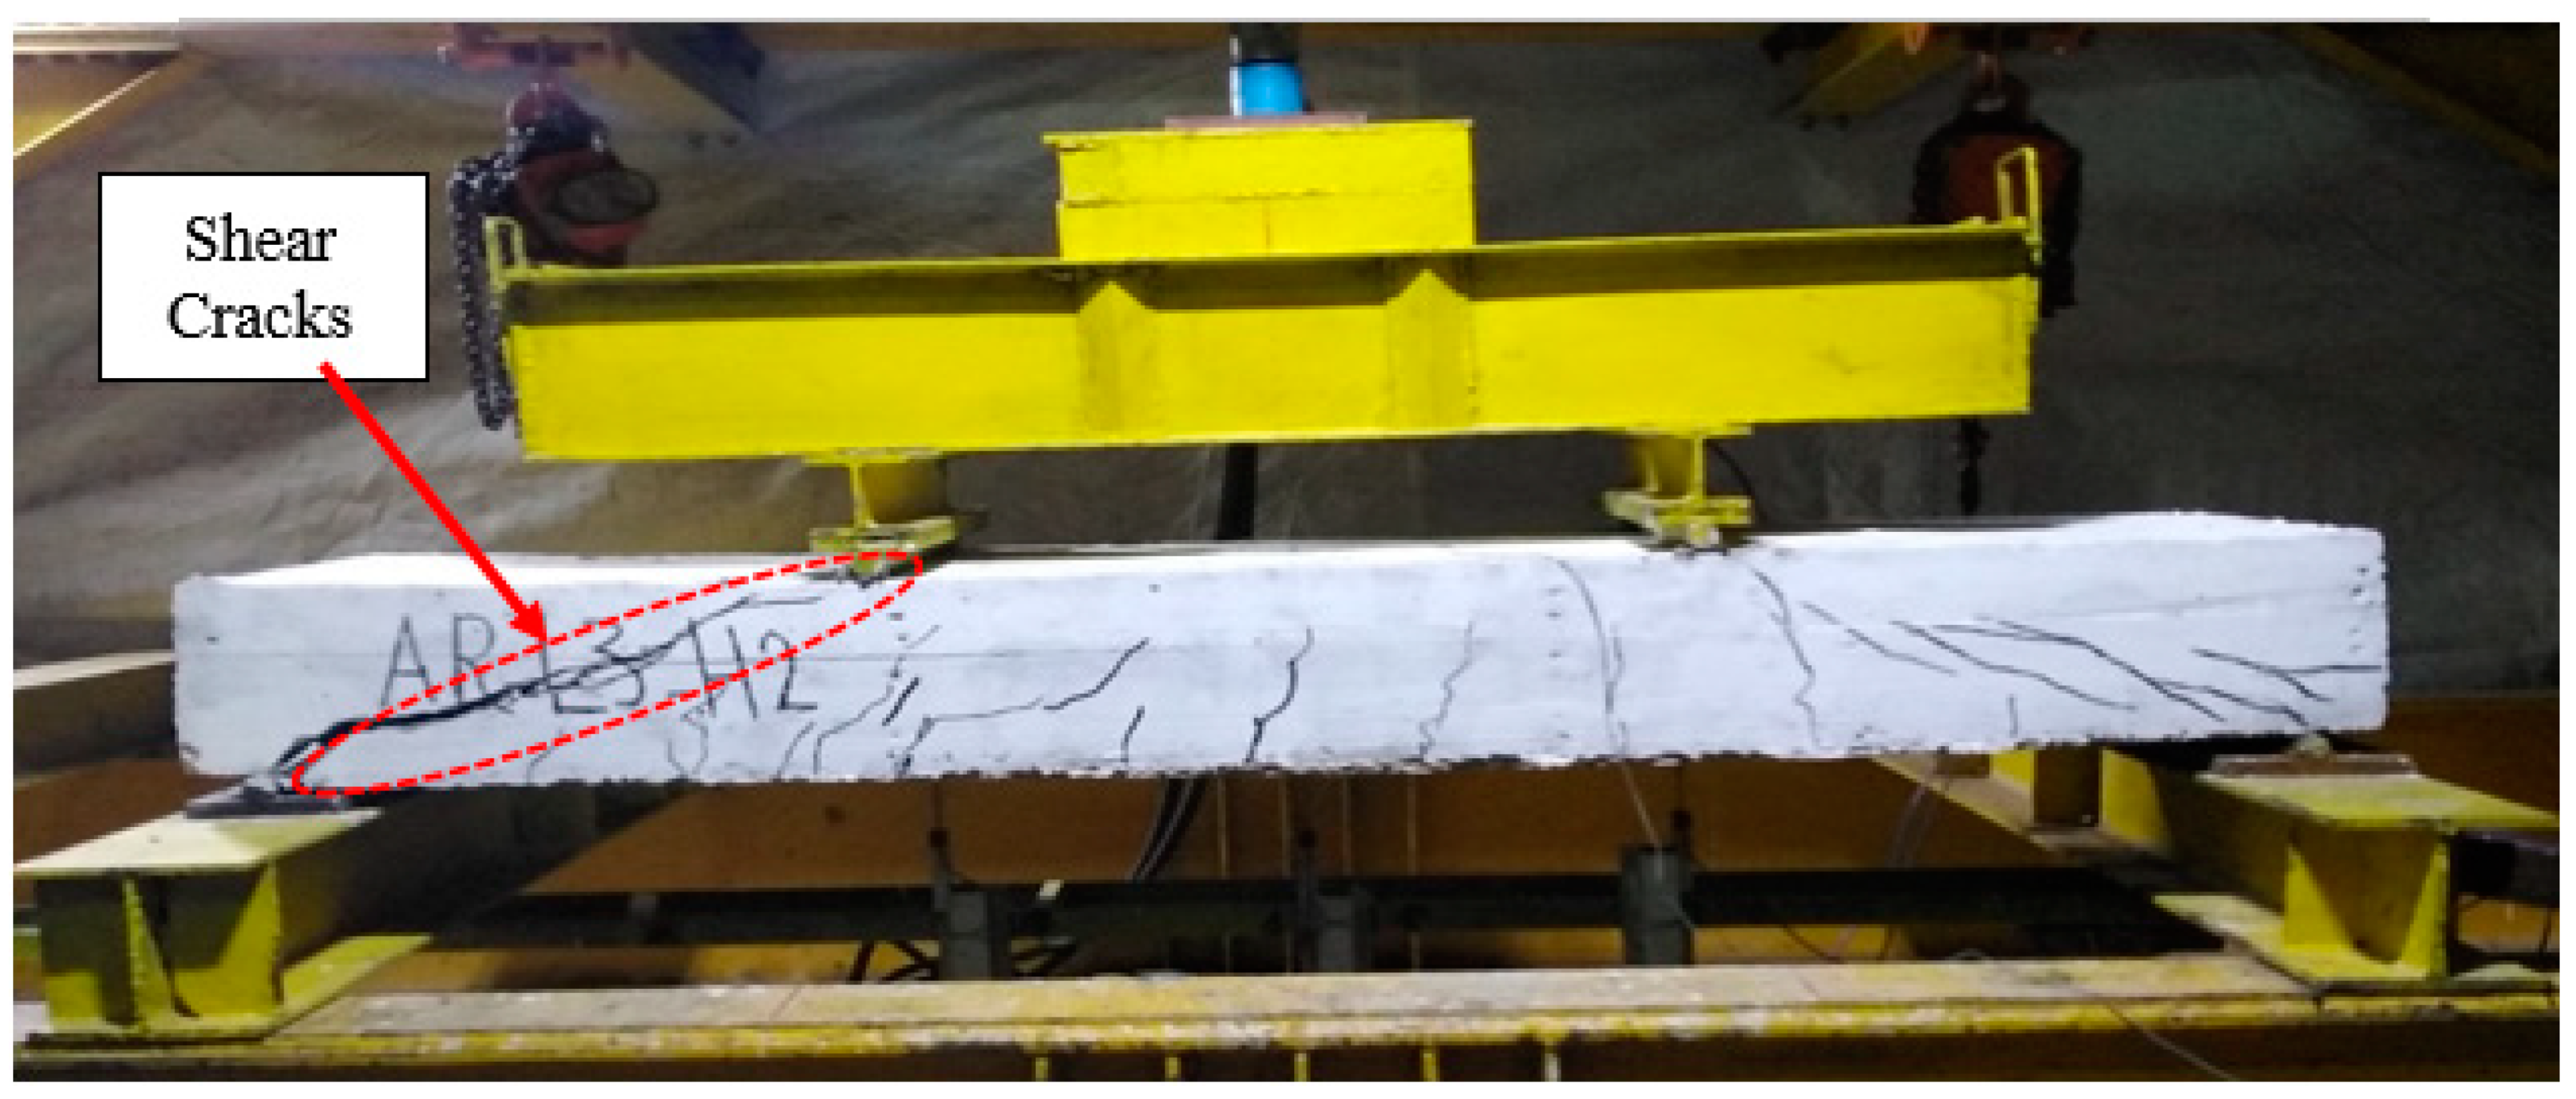
  • The mode of failure of the slabs with the polystyrene arched blocks was affected by the ratio of the length of the PEABs to the length of the slab (lP/L). When the lP/L ratio was more than 0.5, the failure mode gradually changed from flexural failure to shear failure, and complete shear failure occurred when the lP/L ratio was equal to one.
  • At a certain ratio of the height of the PEABs to the total slab depth (hP/H), the ultimate strength was reduced by increasing the length of the PEABs. For the slabs with hP/H = 0.7, the decreases in the ultimate loads were about 19%, 21%, and 24% for slabs with lP/L = 0.5, 0.75, and 1.0, respectively. For the slabs with hP/H = 0.54, these percentages were 6%, 10%, and 15%, respectively.
  • At a certain lP/L ratio, the ultimate load was reduced by increasing the depth of the PEABs. For the slabs with lP/L = 0.5, the decreases in the ultimate loads were about 19% and 6% for slabs with hP/H = 0.7 and 0.54, respectively. For the slabs with lP/L = 0.75, the decreases in the ultimate loads were about 21% and 10% for the slabs with hP/H = 0.7 and 0.54, respectively.
  • Increasing the lP/L ratio had an insignificant effect on the concrete compressive strain except for the case of lP/L = 1, where the mode of failure changed to be shear failure. This might be attributed to the constant compression zone of concrete at the mid-span. In contrast, increasing the hP/H ratio had a significant effect on increasing the concrete compressive strain.
  • To increase the ultimate strength of slabs with PEABs, the shear resistance of the slab must be increased effectively by using higher compressive strength of concrete and/or using shear reinforcement within the shear zone.
  • During the elastic stage, the slab responses from the FE and experimental were fairly similar. The FE findings stiffened slightly as the applied load approached the yielding load. The supposed complete contact between the concrete and reinforcement was attributed to the disparity in response. However, there were good agreements between the experimental and FE results.

Author Contributions

Investigation: F.H.I.; resources: F.H.I.; software: A.H.A.A.-A. and A.A.A.; supervision: A.H.A.A.-A.; validation: A.H.A.A.-A.; visualization: A.H.A.A.-A. and A.E.-Z.; analysis: A.H.A.A.-A. and A.E.-Z.; writing—original draft: A.A.A.; writing—review and editing: A.E.-Z. All authors have read and agreed to the published version of the manuscript.

Funding

This research received no external funding.

Institutional Review Board Statement

Not applicable.

Informed Consent Statement

Not applicable.

Data Availability Statement

Not applicable.

Conflicts of Interest

The authors declare no conflict of interest.

References

  1. Chung, J.-H.; Choi, H.-K.; Lee, S.-C.; Choi, C.-S. One-way shear strength of circular voided reinforced concrete floor slabs. Proc. Inst. Civ. Eng.-Struct. Build. 2015, 168, 336–350. [Google Scholar] [CrossRef]
  2. Valivonis, J.; Jonaitis, B.; Zavalis, R.; Skuturna, T.; Šneideris, A. Flexural capacity and stiffness of monolithic biaxial hollow slabs. J. Civ. Eng. Manag. 2014, 20, 693–701. [Google Scholar] [CrossRef] [Green Version]
  3. Al-Gasham, T.S.S. Structural performance of reinforced concrete bubble slabs after exposing to fire flame. Eng. Sustain. Dev. 2015, 19, 1–14. [Google Scholar]
  4. Al-Gasham, T.S.; Mhalhal, J.M.; Jabir, H.A. Improving punching behavior of interior voided slab-column connections using steel sheets. Eng. Struct. 2019, 199, 109614. [Google Scholar] [CrossRef]
  5. Hashemi, S.S.; Sadeghi, K.; Vaghefi, M.; Siadat, S.A. Evaluation of ductility of RC structures constructed with bubble deck system. Int. J. Civ. Eng. 2018, 16, 513–526. [Google Scholar] [CrossRef]
  6. Schnellenbach-Held, M.; Pfeffer, K. Punching behavior of biaxial hollow slabs. Cem. Concr. Compos. 2002, 24, 551–556. [Google Scholar] [CrossRef]
  7. Fiala, C.; Hájek, P. Environmentally based optimization of RC slab floor structures. In CESB 07 Conference Proceedings; Citeseer: Prague, Czech Republic, 2007. [Google Scholar]
  8. Yang, W.; Yang, Y.; Han, B.; Jiang, P. Experimental study on mechanical property of corner columns supported reinforced concrete honeycombed-core girderless floor. Open Civ. Eng. J. 2013, 7, 179–188. [Google Scholar] [CrossRef] [Green Version]
  9. Chung, J.; Choi, H.K.; Lee, S.C.; Choi, C.S. Shear capacity of biaxial hollow slab with donut type hollow sphere. Procedia Eng. 2011, 14, 2219–2222. [Google Scholar] [CrossRef] [Green Version]
  10. Fanella, D.A.; Mahamid, M.; Mota, M. Flat plate–voided concrete slab systems: Design, serviceability, fire resistance, and construction. Pract. Period. Struct. Des. Constr. 2017, 22, 04017004. [Google Scholar] [CrossRef]
  11. Boyd, T.D. The Arch and the Vault in Greek Architecture. Am. J. Archaeol. 1978, 82, 83–100. [Google Scholar] [CrossRef]
  12. Chebo, K.A.; Temsah, Y.; Abou Saleh, Z.; Darwich, M.; Hamdan, Z. Experimental investigation on the structural performance of single span hollow core slab under successive impact loading. Materials 2022, 15, 599. [Google Scholar] [CrossRef] [PubMed]
  13. Sarvaiya, D.M.; Jivani, D. An experimental study on spherical voided slab. Int. J. Emerg. Technol. Innov. Res. 2022, 9, 226–230. [Google Scholar]
  14. Bhamare, V.P.; Jadhao, P.D.; Pawar, A.J. Design and experimental study of voided slab with proposed new shape of void former. In Smart Technologies for Energy, Environment and Sustainable Development; Springer: Singapore, 2019. [Google Scholar] [CrossRef]
  15. Singh, M.; Saini, B. Analytical and experimental study of voided slab. In International Conference on Sustainable Waste Management through Design; ICSWMD 2018, Lecture Notes in Civil Engineering; Singh, H., Garg, P., Kaur, I., Eds.; Springer: Cham, Switzerland, 2019; Volume 21. [Google Scholar] [CrossRef]
  16. Sagadevan, R.; Rao, B.N. Effect of void former shapes on one-way flexural behaviour of biaxial hollow slabs. Int. J. Adv. Struct. Eng. 2019, 11, 297–307. [Google Scholar] [CrossRef] [Green Version]
  17. Abaqus, A. Computer Software for Finite Element Analysis; Dassault Systems Simulia: Johnston, RI, USA, 2020. [Google Scholar]
  18. Hafezolghorani, M.; Hejazi, F.; Vaghei, R.; Bin Jaafar, M.S.; Karimzade, K. Simplified damage plasticity model for concrete. Struct. Eng. Int. 2017, 27, 68–78. [Google Scholar] [CrossRef]
  19. SANEZ, L. Discussion of “Equation for the stress-strain curve of concrete”, by Desayi, P. and Krishnan, S. ACI J. 1964, 61, 1227–1239. [Google Scholar]
  20. Belarbi, A.; Hsu, T.T. Constitutive laws of concrete in tension and reinforcing bars stiffened by concrete. Struct. J. 1994, 91, 465–474. [Google Scholar]
Figure 1. Dimensions, steel reinforcement, and construction of the polystyrene-embedded arched blocks. (a) Dimensions of a typical, tested specimen (all dimensions are in mm); (b) Construction of the polystyrene-embedded arched blocks and steel reinforcement.
Buildings 12 00331 g001aBuildings 12 00331 g001b
Figure 2. Test setup.
Buildings 12 00331 g002
Figure 3. Crack pattern at the failure of slab specimen SD (flexural failure).
Buildings 12 00331 g003
Figure 4. Crack pattern at the failure of slab specimen AR-L1-H1 (flexural failure).
Buildings 12 00331 g004
Figure 5. Crack pattern at the failure of slab specimen AR-L1-H2 (flexural failure).
Buildings 12 00331 g005
Figure 6. Crack pattern at the failure of slab specimen AR-L2-H1 (shear-flexural failure).
Buildings 12 00331 g006
Figure 7. Crack pattern at the failure of slab specimen AR-L2-H2 (shear-flexural failure).
Buildings 12 00331 g007
Figure 8. Crack pattern at the failure of slab AR-L3-H1 (shear failure).
Buildings 12 00331 g008
Figure 9. Crack pattern at the failure of slab AR-L3-H2 (shear failure).
Buildings 12 00331 g009
Figure 10. Load versus mid-span deflection curves for the slab specimens with hP/H = 0.7.
Buildings 12 00331 g010
Figure 11. Load versus mid-span deflection curves for the slab specimens with hP/H = 0.54.
Buildings 12 00331 g011
Figure 12. Load versus mid-span deflection curves for the slab specimens with lP/L = 0.5.
Buildings 12 00331 g012
Figure 13. Load versus mid-span deflection curves for the slab specimens with lP/L = 0.75.
Buildings 12 00331 g013
Figure 14. Load versus mid-span deflection curves for the slab specimens with lP/L = 1.0.
Buildings 12 00331 g014
Figure 15. Load–compressive strain curves of concrete for the slab specimens with hP/H = 0.54.
Buildings 12 00331 g015
Figure 16. Load–compressive strain curves of concrete for the slab specimens with hP/H = 0.7.
Buildings 12 00331 g016
Figure 17. Load–compressive strain curves of concrete for the slab specimens with lP/L = 0.5.
Buildings 12 00331 g017
Figure 18. Load–compressive strain curves of concrete for the slab specimens with lP/L = 0.75.
Buildings 12 00331 g018
Figure 19. Load–compressive strain curves of concrete for the slab specimens with lP/L = 1.0.
Buildings 12 00331 g019
Figure 20. The compressive and tensile stress–strain curves of concrete.
Buildings 12 00331 g020
Figure 21. FE mesh and discretization for a typical tested slab specimen with the PEABs.
Buildings 12 00331 g021
Figure 22. Comparisons of the experimental and FE results of the slab specimens with the PEABs.
Buildings 12 00331 g022aBuildings 12 00331 g022b
Figure 23. Comparisons of the experimental and FE crack patterns.
Buildings 12 00331 g023aBuildings 12 00331 g023bBuildings 12 00331 g023c
Table 1. Details of test specimen variables.
SpecimensHeight of PEABs hP (mm)hP/HLength of PEABs lP (mm)lP/LReduction of Weight (%)
SD-----
AR-L1-H11750.7010000.5019.97
AR-L2-H115000.7529.56
AR-L3-H120001.0039.63
AR-L1-H21350.5410000.5015.27
AR-L2-H215000.7522.73
AR-L3-H220001.0030.64
Table 2. Ultimate loads and failure modes of the test slabs.
SpecimenshP/HlP/LUltimate Load
(kN)
Decrease in the Ultimate Load (%)Mode of Failure
SD--156-Flexure
AR-L1-H10.700.5012619.23Flexure
AR-L2-H10.7512321.15Shear-Flexure
AR-L3-H11.0011923.72Shear
AR-L1-H20.540.501475.77Flexure
AR-L1-H20.7514010.26Shear-Flexure
AR-L1-H21.0013215.38Shear
Table 3. Parameters of the concrete damage plasticity model.
Parameter Value
φ39°
ε0.1
fbo/fco1.16
K0.667
μ0.001
Table 4. The ultimate load capacities from the experimental and FE results.
Slab DesignationUltimate Load
Exp. (kN)
Ultimate Load
FE (kN)
Exp./FE
SD1561650.95
AR-L1-H11261310.96
AR-L2-H11231290.95
AR-L3-H11191250.95
AR-L1-H21471570.94
AR-L2-H21401480.95
AR-L3-H21321440.92
Publisher’s Note: MDPI stays neutral with regard to jurisdictional claims in published maps and institutional affiliations.

