Article

Structural Identification of a 90 m High Minaret of a Landmark Structure under Ambient Vibrations

1
College of Engineering and Technology, University of Sargodha, Sargodha 40100, Pakistan
2
Department of Civil Engineering, University of Engineering and Technology Taxila, Taxila 47050, Pakistan
3
Department of Civil Engineering, College of Engineering, Taif University, P.O. Box 11099, Taif 21944, Saudi Arabia
4
Department of Civil Engineering, Faculty of Engineering and Technology, International Islamic University, Islamabad 44100, Pakistan
5
Department of Civil Engineering, College of Engineering, Prince Sattam Bin Abdulaziz University, Alkharj 16273, Saudi Arabia
6
National Water Research Center, P.O. Box 74, Shubra El-Kheima 13411, Egypt
*
Authors to whom correspondence should be addressed.
Buildings 2022, 12(2), 252; https://doi.org/10.3390/buildings12020252
Submission received: 28 December 2021 / Revised: 21 January 2022 / Accepted: 16 February 2022 / Published: 21 February 2022

Abstract

:
This paper presents the operational modal analysis of a 90-m-high RC minaret of an iconic mosque considered as a landmark of the city. The minaret was monitored for three days with 11 tri-axial MEMS accelerometers. The purpose of the study was to observe the behavior, develop a representative finite element (FE) model, and establish baseline data for health monitoring studies. The modal properties were extracted using three operational modal analysis techniques (OMA): Enhanced Frequency Domain Decomposition (EFDD), Stochastic Subspace Identification (SSI), and Natural Excitation Technique with Eigensystem Realization Algorithm (NExT-ERA). The first 10 identified modes were below 7 Hz. Eight modes out of the ten were bending-dominant, while the remaining two were torsion-dominant. A FE model was also developed in ETABS to ascertain and compare the response of the structure with the identified results. From the FE model, the modes corresponding to the first ten identified modes were considered for comparison with the identified frequencies from ambient monitoring. The maximum 7.71% error was observed between the experimental and numerical frequencies. The error was minimized by using the manual updating the material properties and adding the weight of nonstructural elements. The variation of identified modal frequencies with ambient temperature was observed to be linearly dependent to a reasonable degree. A general trend of decreasing identified frequencies was observed with the rise in temperature.

1. Introduction

Minarets are thin and tall tower-like structures built as a part of a mosque. They are also known as “manara” in Arabic, meaning place of fire or light. It is the place from where the Azan (call to prayer) is called for the worshipers. Its shape, height, and features may vary according to the local culture. In the early times, bulky and low-height minarets were constructed. However, thin and slender minarets are designed and constructed nowadays due to the advancements in the field of structural engineering and architecture. The occurrence of damage due to natural disasters like earthquakes, wind gusts, etc. makes minarets vulnerable structures.
The dynamic behavior of a structure is related to its modal properties (natural frequencies, mode shapes, and damping ratios), which can be found by numerical methods, as well as using experimental techniques. The popular numerical way is using a Finite Element Analysis (FEA). The modal properties evaluated from a FEA may not represent the true behavior of the existing structure due to uncertainties in the modeling parameters, like boundary conditions, material properties, etc. [1,2]. Therefore, to determine the in situ dynamic behavior under service conditions, real-time monitoring was carried out, and after that, a modal analysis was performed using Operational modal Analysis (OMA) techniques. The field testing involved instrumentation of the subject structure and collection of the data under ambient or forced vibrations. Then, the modal properties were identified based on system identification techniques [3]. The in situ determined dynamic properties can be further used in structural model updating, health monitoring, assessment, and damage detection studies [4].
The field testing for modal analysis can be carried out under two types of excitation conditions, namely forced vibration tests and ambient vibration tests [5]. In forced vibration testing, the structure is vibrated by artificial means like drop weight, impact hammer, or eccentric mass shaker under a known input force. These tests are useful due to the well-defined input force and high signal-to-noise ratio, producing high-quality data for the analysis [6,7]. In ambient vibration testing, the structure is vibrated by a random unknown input force, like traffic, wind, or an earthquake, and the signal-to-noise ratio sometimes may be very low [8]. Forced vibration testing is generally time-consuming and difficult to conduct compared to the ambient vibration test. It also requires careful handling and special permission. On the other hand, ambient vibration testing is the most common, nondestructive, easy-to-implement approach that generally does not affect the occupancy of a structure [8,9]. Many structures have been tested under ambient vibrations, and it was found that it is a convenient way to find their dynamic properties [10,11,12]. The output-only system identification techniques like peak picking (PP), Frequency Domain Decomposition (FDD), Enhanced Frequency Domain Decomposition (EFDD), Stochastic Subspace Identification (SSI), etc. are generally used for ambient vibration testing, and this procedure is generally referred to as an Operational Modal Analysis (OMA). On the other hand, the field testing in which input and output data is used for system identification to determine the modal properties is commonly known as an Experimental Modal Analysis (EMA), for which Deterministic State-space Subspace Identification (DSSI), Eigensystem Realization Algorithm (ERA), and Observer/Kalman filter Identification (OKID), etc. are generally employed [13,14].
Many studies have been conducted to evaluate the dynamic properties of masonry minaret and towers considering their archeological value and cultural heritage. Azzara et al. (2021) evaluated the dynamic properties of the masonry tower of the center of Lucca under ambient vibrations. The structure was instrumented with accelerometers and other devices for a results comparison. The first four identified frequencies were below 4.8 Hz, with a maximum standard deviation of 16% [15]. García-Macías & Ubertini (2020) evaluated the dynamic properties of the historic Sciri Tower in Italy. The automated OMA and Ambient Noise Deconvolution Interferometry (ANDI) techniques were used for this purpose. The first seven identified modes were below 12 Hz [16]. Erkal (2017) studied the effect of traffic-induced vibrations on the minaret of little Hagia Sophia. The modal properties were extracted both numerically and experimentally. A very good agreement was found between the modal frequencies and mode shapes. Hence, it was concluded that ambient vibration testing is a confident way of finding the modal properties of structures [17]. Carpinteri et al. (2016) used the Acoustic Emission monitoring technique using piezoelectric accelerometers to examine the structural stability of the 12th century Asinelli Tower. Damage was found in the walls of the tower, but the tower was still in stable condition [18]. Saisi & Gentile (2015) evaluated the structural condition of a 54-m-high 14th century masonry tower using ambient vibration testing. Two OMA techniques, SSI and FDD, were implemented for the evaluation of modal properties and found that the upper portion of the tower is structurally critical [19].
To evaluate the structural conditions of towers or tower-like structures, many studies have been carried out in the past two decades. Zhao et al. (2019) performed long-term structural health monitoring of a 250-m-high structure at different construction stages and service stages using accelerometers and tilt sensors. The fast Bayesian FFT was implemented to extract the dynamic properties under ambient vibrations. The first ten identified modes were below 2.4 Hz [20]. He et al. (2018) worked on the structural identification of the 600-m-high Ping-An Finance Center in Shenzhen under natural excitation (typhoon). Two OMA techniques, the Peak-Picking method in the frequency domain and the random decrement technique in the time domain, were implemented for the extraction of modal properties. It was found that the natural frequency decreased with the increase of the initial amplitudes, and the damping ratio exhibited slight fluctuations [21]. Sun and Büyüköztürk (2018) identified the effect of soil–structure interactions on the dynamic properties of an 84-m-high building under ambient vibrations. He studied the effect of rocking and displacement on modal properties and developed the baseline data for seismic performance studies with soil–structure interactions [22]. Zhang et al. (2016) worked on the structural health monitoring of 632-m-high Shanghai Tower at different construction stages using the Bayesian approach. The results of the FE model at different construction stage relates with the experimental results, showing the good quality of construction. Twelve-hour monitoring was conducted to observe the effect of the environment on the modal properties. It was found that modal properties depend on the air temperature. The first eight modes were below 1 Hz [23].
The structural assessment of cultural heritage, historical, and landmark structures is a challenging task for structural engineers. To examine the dynamic responses and structural conditions of such structures, the modal properties are one of the important parameters. Generally, the structural condition is quantified by comparing the modal properties of undamaged and damaged structures. Therefore, the determination of the modal properties of an undamaged structure, i.e., development of the baseline data, is of prime importance in structural health monitoring. In the present study, the OMA of a minaret of Faisal Mosque Islamabad (Pakistan), constructed in 1988, was carried out. The structure is considered a landmark of Islamabad and lies close to the Margalla fault line. The real-time monitoring of the minaret was conducted using 11 triaxial accelerometers. To determine the modal properties of the structure, three frequency domain OMA techniques (EFDD, SSI, and NExT-ERA) were used. The comparison of the identified modal properties was carried out with a FE model developed in ETABS. The error between the experimental and numerically identified frequencies was minimized using the manual updating technique. The objective of the present study is to extract the dynamic properties of this iconic structure, examine the variations of the modal frequencies with an ambient temperature, develop the representative FE model, and establish baseline data for future health monitoring and seismic performance studies.

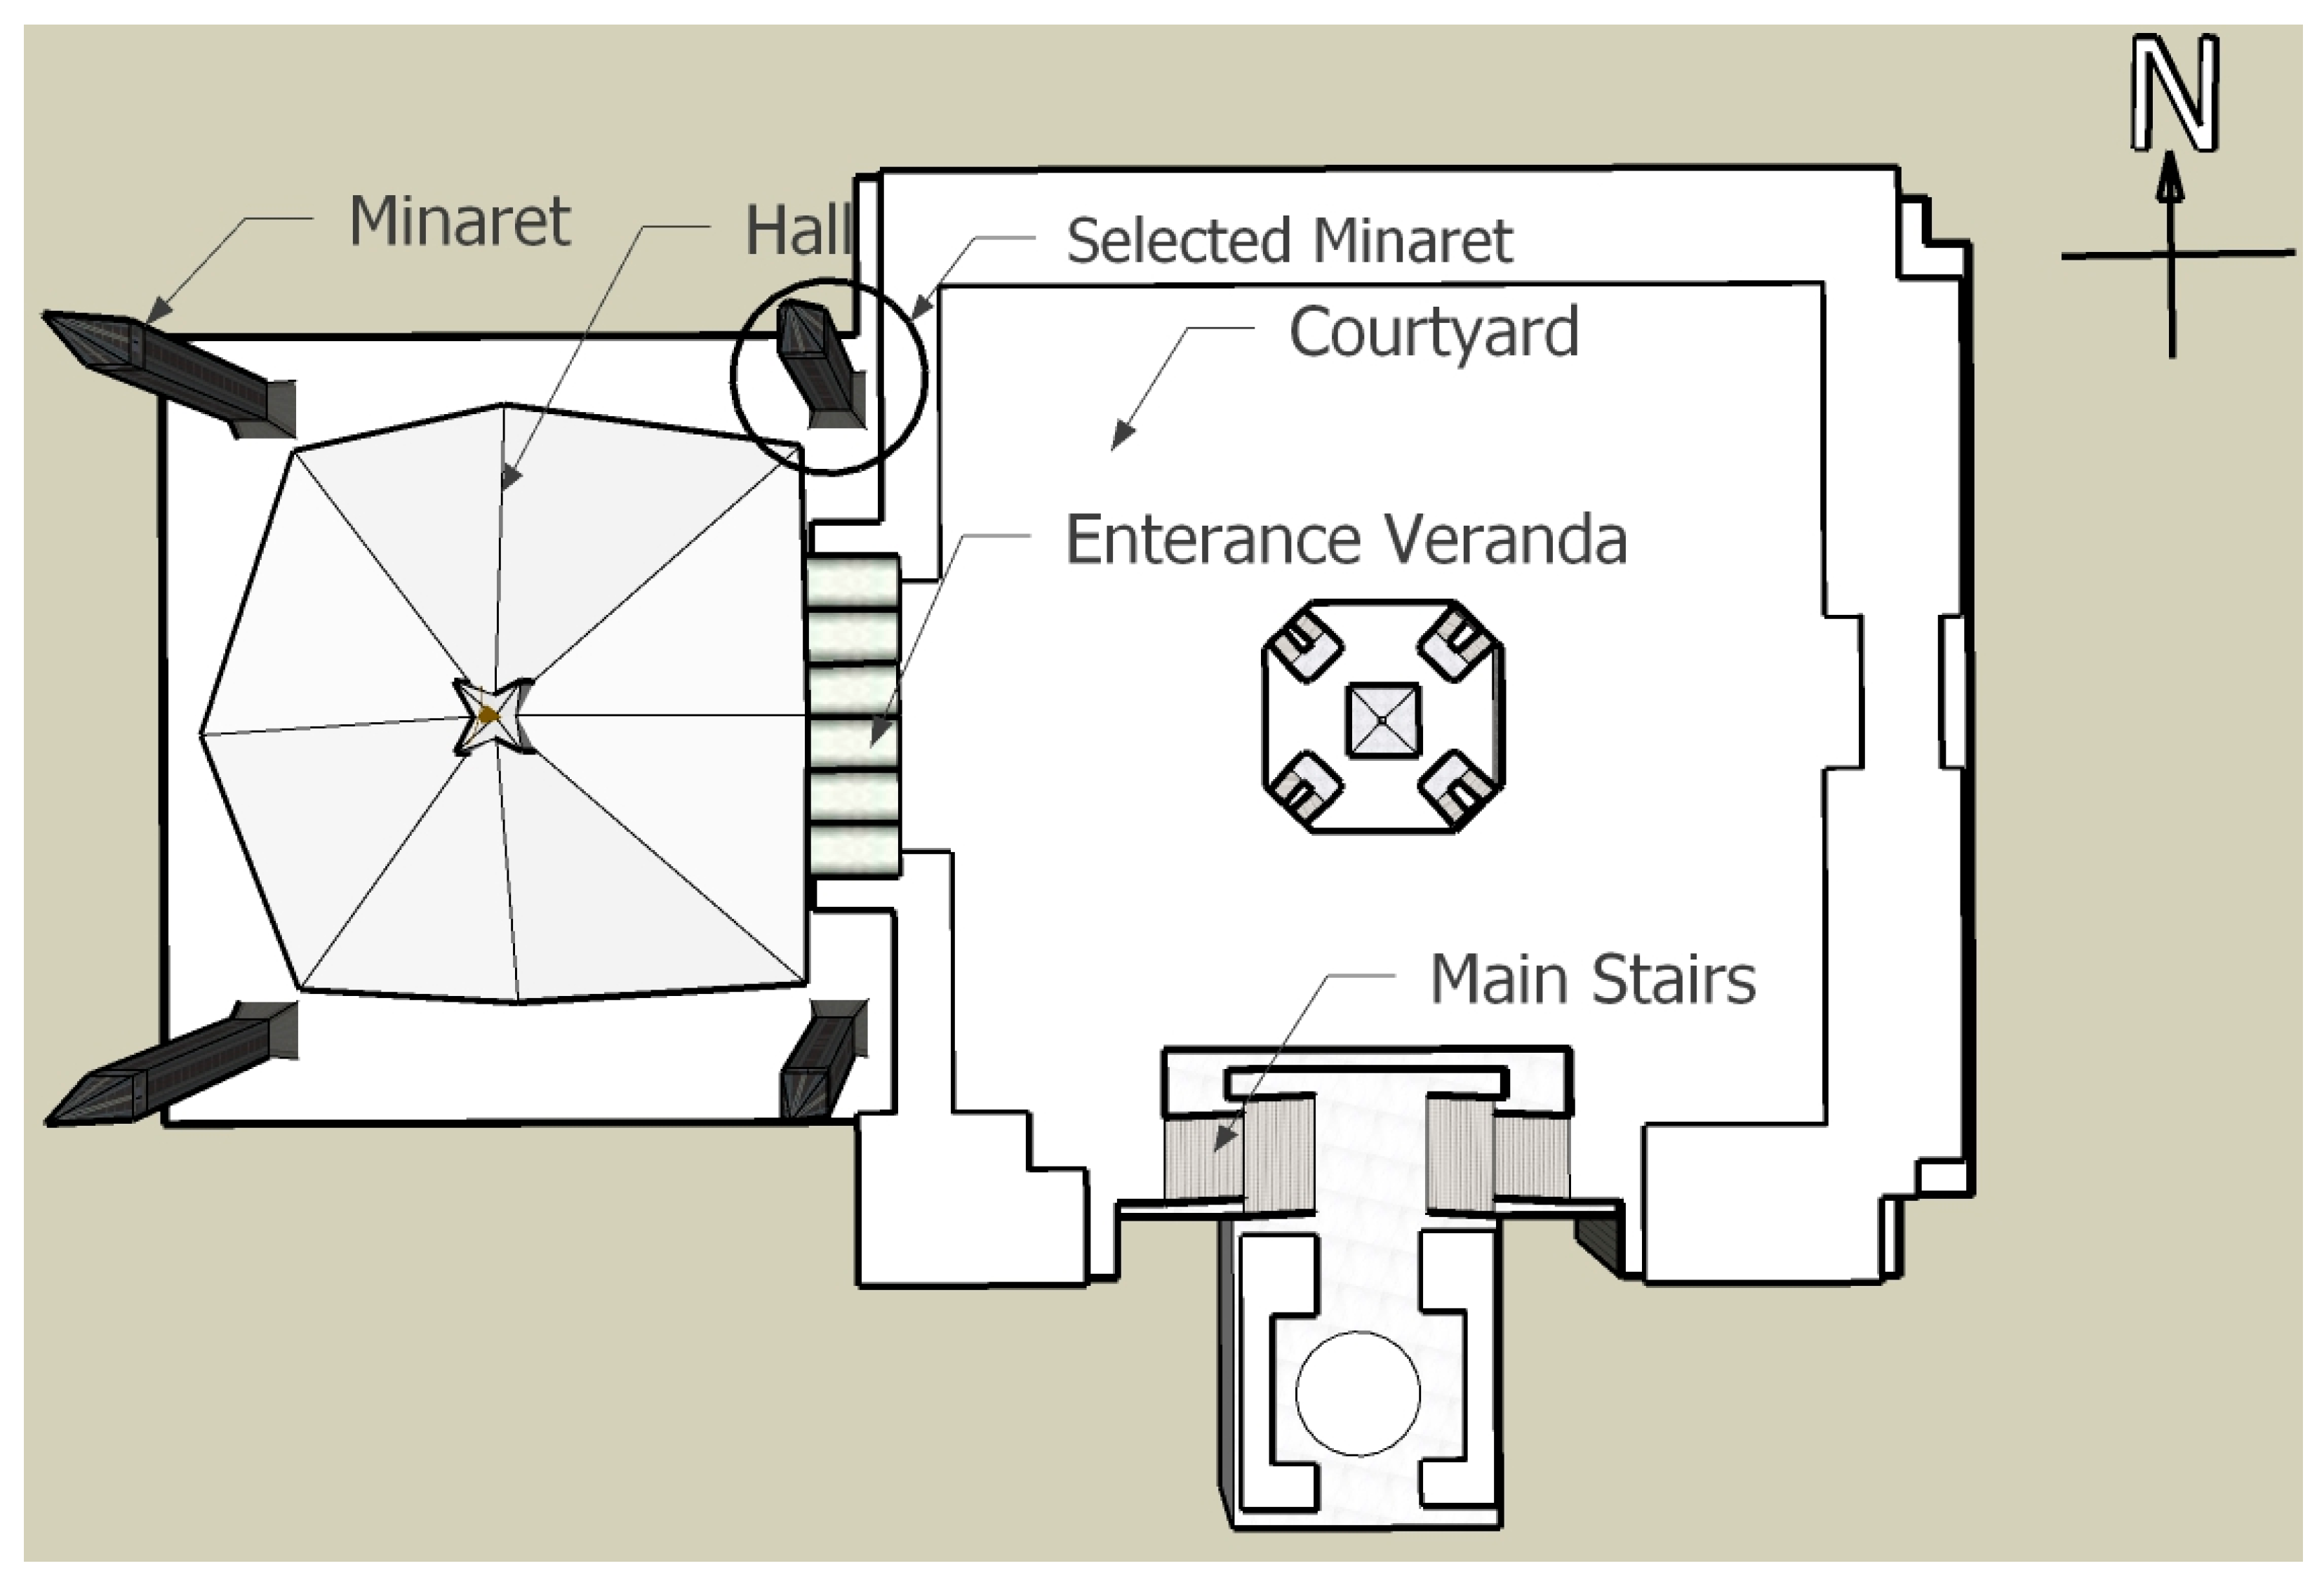
2. Description of the Minaret

Faisal Mosque, designated as the National Mosque of Pakistan [24], was the recipient of the prestigious Aga Khan Architecture Award in 1998. It is located in Islamabad, the capital of Pakistan, which was developed at the foothills of the Margallah Range in 1960. The mosque was designed by Turkish architect Vedat Dalokay (1927–1991), being selected after an international competition [25]. The mosque, with a capacity of 100,000 people, remained the largest in the world from 1986 to 1996 and is now the sixth-largest. The construction of the mosque started in 1976 and was completed in 1988. It covers an area of 5000 m2, which includes a prayer hall, four 90-m-high sharpe pencil-shaped minarets, porticoes, and a courtyard. It also houses the campus of International Islamic University.
All the four minarets are identical and have displayed no sign of damage. The two eastern minarets have elevators and a maximum height access. The Northeastern minaret encircled in Figure 1 was selected for this study due to the ease of access. The minaret resting on a 2.14-m-thick pad foundation with a depth of 6 m from NSL. It houses an elevator that goes up to a level of 62.90 m, enclosed in a 203-mm-thick shear core (Figure 2c). It has four 685-mm × 1828.8-mm columns. The stairs are wrapped around the inner shear core (lift shaft), and a landing is provided after every sixth step. The cross-sectional dimensions of the minaret are shown in Figure 2. The side that has an entrance to the minaret is considered the front elevation of the minaret, as shown in Figure 2. The RC stairs monolithically connect the columns and the outer RC wall to the inner shear core (lift shaft). It has an observation deck at a height of 57 m, and the RC stairs do not go beyond the observation deck. The shear core stops at an elevation of 62.23 m. After that elevation, only columns go up to the total height.

3. Ambient Vibration Monitoring and Modal Identification

3.1. Testing Arrangement and Data Collection

The ambient vibration response of the minaret was captured by eleven triaxial MEMS accelerometers for a continuous three days attached to the shear core. Each accelerometer was a standalone device, operating with a real-time clock (RTC), an internal 5 V battery, a data logger, and a range of ±2 g. The additional power setup (Figure 3) was developed to prolong the data acquisition time. The RTC of all the accelerometers was adjusted to a common laptop PC.
A total of 11 points were selected to capture the dynamic response of the minaret. A schematic diagram representing the position of the sensors is shown in Figure 4. All the accelerometers were placed staggered at regular intervals on the opposite side of the shear core, except accelerometer number 5 and 6 at 40.62 m and 9 and 10 at 59.44 m; those were placed at the same level to capture the torsional effect. The topmost portion of the minaret was not instrumented due to the access restrictions. The sampling rate of the accelerometers was kept at 256 Hz. The OMA was performed on two-minute data chunks selected from each half an hour of the 24-h recordings. A total of 40 datasets were taken for each day, comprising the recordings of two lateral axis measurements. The data of each lateral axis was separated for structural identification. Hence, a total of 80 identification routines were carried out for each recorded day, and a total of 240 identifications were performed over three days of recorded data.

3.2. Modal Identification of the Minaret

The raw data was detrended and processed by applying the basic signal processing as required. The modal properties were extracted using three identification techniques: Enhanced Frequency Domain Decomposition (EFDD) [26], Data-Driven Stochastic Subspace Identification (SSI) [27,28], and Natural Excitation Technique with Eigensystem Realization Algorithm (NExT-ERA) [29]. The modal analysis was carried out on the selected 120 two-minute data chunks, where each chunk comprised two lateral axis acceleration recordings. A separate identification routine was carried out for each axis; hence, a total of 240 identification routines were performed over three days data for each identification technique. From the modal analyses, ten frequencies identified were below 7 Hz by each of the identification technique. The average modal frequencies of the first ten identified modes with standard deviation and nature of the mode are shown in Table 1. The notation E with the mode number represents a modal frequency from experimental results.
In the identified ten modes, eight modes were bending-dominant, two were torsion-dominant. All the bending modes have appeared in the X- and Y-axis pairs, with a very small difference in the frequencies. This is due to the geometrical symmetry of the minaret structure at both the lateral X- and Y-axis. Similar results were observed in the research on tower-like structures [4,30,31]. The first mode with an average frequency of 0.519 Hz was the X-axis bending mode, while the second mode with an average frequency of 0.524 Hz was the Y-axis bending mode.
The third and fourth modes were bending-dominant modes with average frequencies of 2.644 Hz and 2.669 Hz, respectively. The two-dimensional mode shapes of the bending modes are shown in Figure 5. The fifth mode was the torsion-dominant mode about its geometric center with an average frequency of 2.841 Hz (Figure 6). The torsional mode is difficult to display in a two-dimensional representation. The accelerometers were installed at the same levels to capture the torsional nature of a mode. The location points of the same level accelerometers were collinear along the X-axis. Therefore, the torsional mode shape cannot be developed using X-axis data. The Y-axis of the accelerometers were parallel and a constant distance apart; hence, the torsional nature of the modes can be examined by using Y-axis data. Figure 5 and Figure 6 show an elevation view and a planar view of the mode shapes, respectively. Figure 6 presents, in a better way, the bending and torsion natures of the mode shapes by showing the movement along both lateral axes in a planar view. The sixth and seventh modes were bending modes with average frequencies of 4.592 Hz and 4.619 Hz, respectively. The eighth mode was a torsional mode with an average frequency of 5.564 Hz. The ninth and 10th modes were also bending dominant, with average frequencies of 6.446 Hz and 6.567 Hz, respectively. From Table 1, it is evident that the standard deviation increased with the increase of the natural frequency, a similar trend has been observed in past research [15,19,32]. It is clear from Figure 7 that the frequencies identified from the different techniques are very close and present the accuracy of the results.

3.3. Mode Shape Correlation

The modal assurance criterion (MAC) is a quantitative comparison tool for the mode shapes used by most of the researchers in similar research areas for correlating mode shapes [32,33,34,35,36]. Its value varies from zero to one. The digit one indicates good harmony among the mode shapes, and zero indicates that the mode shapes are not consistent or correlated [37]. MAC can be used to compare experimental and numerical modes, experimental modes of different techniques, modes before and after the change in parameters of numerical and physical models, and modes obtained from different datasets of the same technique [38].
Table 2 presents the MAC values of the first 10 identified modes from the datasets of all three techniques. The maximum and minimum MAC values vary from 0.99 to 0.72, which indicates an excellent to a good match between the same modes of different datasets. A typical MAC matrix between the identified modes is presented in Figure 8. It is evident that the off-diagonal terms in the MAC matrix are very low (below 0.15). Therefore, it can be inferred that the identified modes are not coupled.

4. Frequency Variation and Correlation with Ambient Temperature

The effect of ambient temperature on the modal properties is an important aspect in the regions where the temperature change is significant during a 24-h period. The variations of the modal properties with the temperatures of various masonry and concrete structures were examined before [39,40]. For the present study, air temperature data was collected from the Pakistan Metrological Department (PMD). The closest weather station was located 6 km from the testing site. The variation in the temperature for the 24-h data acquisition for three days is shown in Figure 9. It can be observed that a difference of 17 °C exists between the maximum and minimum temperatures. The maximum and minimum temperatures during the three days of monitoring were observed at around 14.00 PST and 08.00 PST, respectively.
Long-term monitoring is necessary to identify the correlation between the modal properties and environmental factors [41,42]. It is also required to make a comprehensive baseline dataset for health monitoring, damage detection studies, and to avoid false alarms for changes in the modal frequency. Table 3 summarizes the maximum, minimum, and average frequencies of all three techniques.
Another simple way to investigate the effect of environmental temperature on modal frequency is the plot of the temperature vs. identified modal frequency. Figure 10 shows the variations in the frequencies (identified using EFDD technique) with the ambient temperature. The least-square regression analysis is used to find the relationship between the temperature and modal frequencies. The strength of the correlations is generally illustrated by the coefficient of determination R2 of the linear regression model.
The R2 values of all three techniques are enlisted in Table 3, as well. The coefficient of determination varied from 0.51 to 0.661, indicating that a linear relationship fits the data to a reasonable degree. It can be clearly seen that the identified frequencies decreased with the rise in temperature for all the modes. The results of the temperature effect on the modal properties were different from the previous research, which presented the hypothesis that the increase in temperature induced a reduction in the fracture strain and overall increase in the global stiffness of the structure [15,43]. This hypothesis may be valid for the damaged or masonry structure. The decreasing trend in natural frequency presented the expansion of the material and little reduction in the global stiffness.

5. Finite Element Modeling

A numerical model is helpful for the validation of the operational modal analysis and interpretation of the results [44]. A 3D FE model was developed with commercial software ETABS [45] to simulate the behavior of a structure and to correlate it with the identified dynamic properties. The geometry of the minaret was modeled with the help of architectural and structural drawings and at-site measurements. The geometric properties of the minaret were discussed in Section 2. The main components of the minaret, i.e., columns, outer RC walls, inner shear core housing elevator, stair landings, waist slab, and observation deck at an elevation of 57 m, were modeled using four-node shell elements, while the beams and cross bracings were modeled using two-node line elements, as shown in Figure 11. The waist slab of the stair was modeled as a ramp with a four-node shell area element. The stairs connected the outer RC walls and columns to the inner shear core. RC cross-bracings were used to connect the columns with the outer RC walls. The plan, stairs, and 3D view of the FE model of minaret are shown in Figure 11. The density and compressive strength of concrete for all the structural members were taken as 2400 kg/m3 and 30 MPa, respectively, from the structural drawings. The mass of the nonstructural components like floor finishes and the dead weight of the stair steps, etc. were applied at the appropriate locations. The base of the minaret was considered as fixed.
After the construction of the detailed 3D model, as shown in Figure 11, a modal analysis was carried out. The number of modes for the analysis was considered based on a minimum 90% modal mass participation. It is an important parameter to understand the nature of a mode and the contribution of each mode. A total of 90 modes yielded the required modal mass participation. Among those, the first ten were within the range of the identified frequencies (i.e., below 7 Hz) and are shown in Table 4 and Figure 12, whereas the rest are higher modes. Ux and Uy denote translational mass participation in X and Y directions, respectively, and Rz denotes the torsional mass participation. It is clear from Table 4 that the modal mass participation of the first four numerical modes are far higher in the translation direction than that in the torsional direction, showing the pure bending nature of the modes. All the bending modes appeared in pairs, with a very small difference in the frequency values. That is due to the symmetry of the structure at both the lateral axes. The sixth, seventh, ninth, and tenth modes are also pure bending modes, whereas the fifth and eighth are torsional modes. For convenience in the discussion, the notations B and T represent the bending-dominant and torsion-dominant natures, respectively, as mentioned in Table 4.

6. Comparison between Experimental and FE Results

The dynamic properties of the structure identified from the ambient excitation tests comprised the actual boundary conditions, materials, and geometric properties, whereas the dynamic properties from the numerical model may not represent the actual dynamic properties due to assumptions in the boundary conditions and material properties. The % error is a numeric value that presents the difference between actual and approximated values. The experimentally identified and numerically determined dynamic properties are considered as the actual and approximated values, respectively. The comparisons between the experimental and FE modal frequencies are listed in Table 4, along with the % error and MAC values. Figure 12 represents the ten FE mode shapes. The observed % error between first ten numerical and experimental modal frequencies are 2.98, 3.16, 4.78, 4.56, 5.76, 6.48, 6.40, 6.28, 6.54, and 7.71% respectively. The maximum and minimum errors were 7.71% and 2.98% for the tenth and first modes, respectively. The observed errors can be due to the assumptions considered for modeling the minaret in FE software. The MAC values between the experimental and numerical pure bending modes, i.e., first, second, and seventh, were higher than 0.8, showing a good agreement between them. The MAC values of the other bending modes, i.e., third, fourth, sixth, and tenth, were within 0.65–0.8, which showed a correlation from a satisfactory to good level. However, the MAC values of the torsional modes, i.e., fifth and eighth, were below 0.6, which indicated that the limited number of sensors may not be enough to capture its torsional behavior more accurately.

7. Finite Element Model Updating

The dissimilarity in the modal properties obtained from the experimental and initial FE model showed that the dynamic behavior of the FE model did not coincide appreciably with that observed through the experimental work. The experimental and numerical modal frequencies with percentage errors are given in Table 4. The reason for the discrepancies in the FE model results was the differences in the actual and assumed material properties, boundary conditions, and structural geometry used for modeling. To minimize the differences between the experimental and numerical results, FE model updating techniques were used that involved manual changes in the mechanical properties of the model, i.e., Young’s modulus, boundary conditions, mass source, and by changing the mesh size [4,46,47].
In this study, the FE model was updated by adjusting the material properties and weight of the nonstructural components based on nondestructive testing techniques and engineering judgment. The modal frequencies identified from all three methods were very close, so the results of EFDD were used as a reference for updating the FE model. The initial value of the Young’s modulus was taken 23,250 MPa from the compressive strength of 27.8 MPa of concrete, provided in the structural drawings. The various updating routines were considered as given in Table 5. The frequencies obtained from the FE model were lower than the experimental frequencies. This shows that the actual structure was stiffer than the initially modeled structure. Therefore, the higher values of Young’s modulus were considered for updating. However, the nondestructive strength evaluation was done using a rebound hammer test (ASTM-C805/C805M-18 [48]) at columns and shear walls (Figure 13). The estimated strength was 36.5 MPa. The objective function representing the mean weighted absolute relative frequency error was developed to minimize the error [49,50]. The objective function is listed below as Equation (1):
e f = 1 n i = 0 n | Δ f i | f i
n = no of target frequencies, fi = target frequency, and Δfi = frequency error.
The updated modal frequencies, along with the % error and the objective function, are given in Table 6. Total six trials were conducted: three with uniform Ec and two with different Ec (for columns and other structural members) and one with additional weights of nonstructural members like a lift machine and its counterweight’s weight. In the first three trials, the frequencies increased and error rate was minimized, but the frequencies were still lower than the experimental frequencies. In trial 4, as the Ec value increased, the numerical frequencies became higher than the experimental frequencies, and the objective function reduced from 1.81 to 1.61. Trial 5 was done with little a reduction in Ec of a member other than the column. The objective function reduced, but few frequencies were lower, and the rest were higher than the experimental frequencies. However, the objective function reduced from 1.67 to 1.32. In trial 6, the weights of the nonstructural elements (elevator with accessories) were added at the upper portion of the lift well. The objective function obtained in trial 6 was the lowest, i.e., 0.85, within the acceptable limit of 10% [51]. The overall maximum error in the frequency was reduced from 7.71% to 0.3%. It was observed that, while improving the frequencies, the MAC has also improved. This has also been reported by other relevant studies that have used the same objective function (Equation (1)) [49,50]. The MAC values of all the modes significantly improved in the updating process, as shown in Table 6. The MAC values of all the bending modes were more than or close to 0.9, except modes 9 and 10, which significantly improved from the initial values of 0.69 and 0.70, respectively, but were still less than 0.9. The MAC values of the torsion-dominant modes also improved significantly from their initial values of 0.51 and 0.58; however, their values were still close to 0.8. The reason for the lower values of the MAC for the torsion-dominant modes can be lesser measurement points for capturing the complex nature of torsion and, hence, may require further denser instrumentation to capture the torsion-dominant modes precisely.

8. Conclusions

Ambient vibration tests were conducted on a 90-m-high RC minaret to evaluate its dynamic properties. The data acquisition was carried out for three days. The OMA was carried out using three techniques, i.e., EFDD, data-driven SSI, and NExT-ERA. The effect of the environmental conditions on the modal properties was also observed. The numerical model was developed in ETABS and updated using the manual modal updating technique. The following conclusions are drawn from this study:
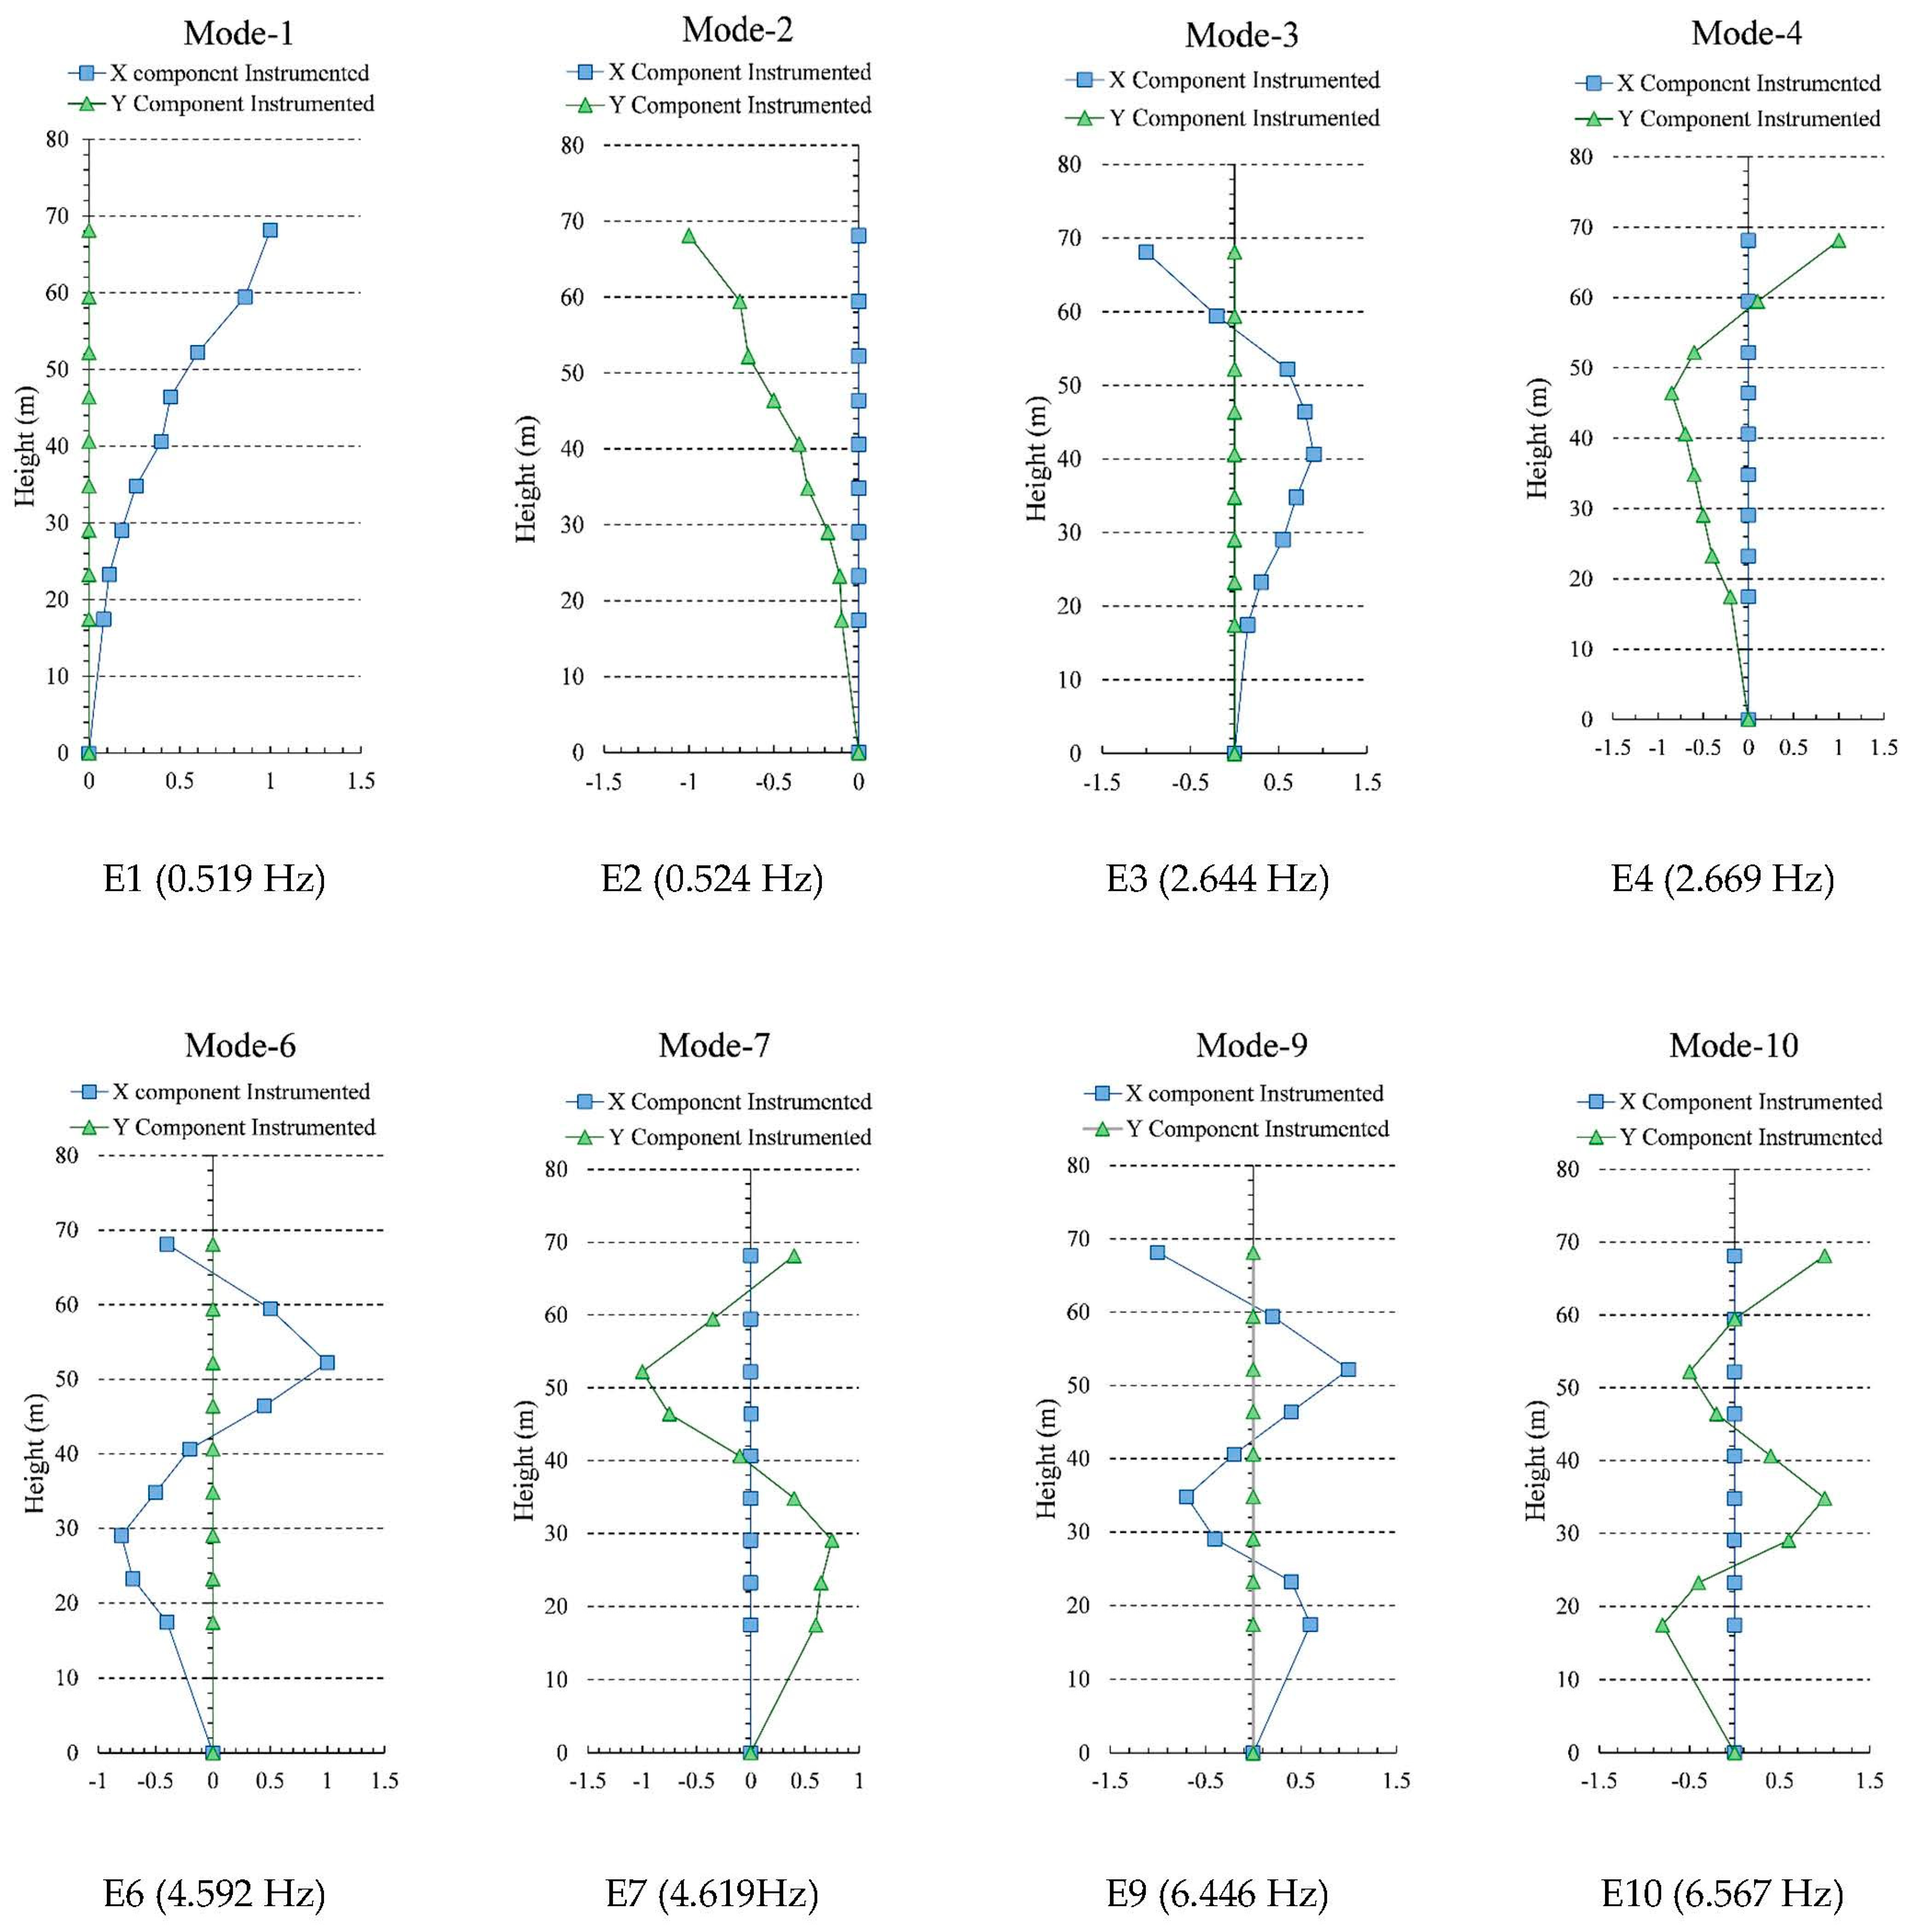
  • The modal frequencies identified from the three techniques: EFDD, data-driven SSI, and NExT-ERA provided close values, showing the relatability of the identification techniques. A total of ten modes were identified below 7 Hz with three-day average identified frequencies of 0.519 Hz, 0.524 Hz, 2.644 Hz, 2.669 Hz, 2.841 Hz, 4.592 Hz, 4.619 Hz, 5.564 Hz, 6.446 Hz, and 6.567 Hz, respectively. The first, second, third, fourth, sixth, seventh, ninth, and tenth experimental modes were bending-dominant, whereas the fifth and eighth were torsion-dominant.
  • Since the structure was axis-symmetrical, the first few modes therefore appeared in pairs for both the lateral axes. The combined axis identification routines did not provide the separation of such modes. Hence, separate identification routines were performed for both the lateral axes for the axis-symmetric structure to capture identical very closely spaced modes.
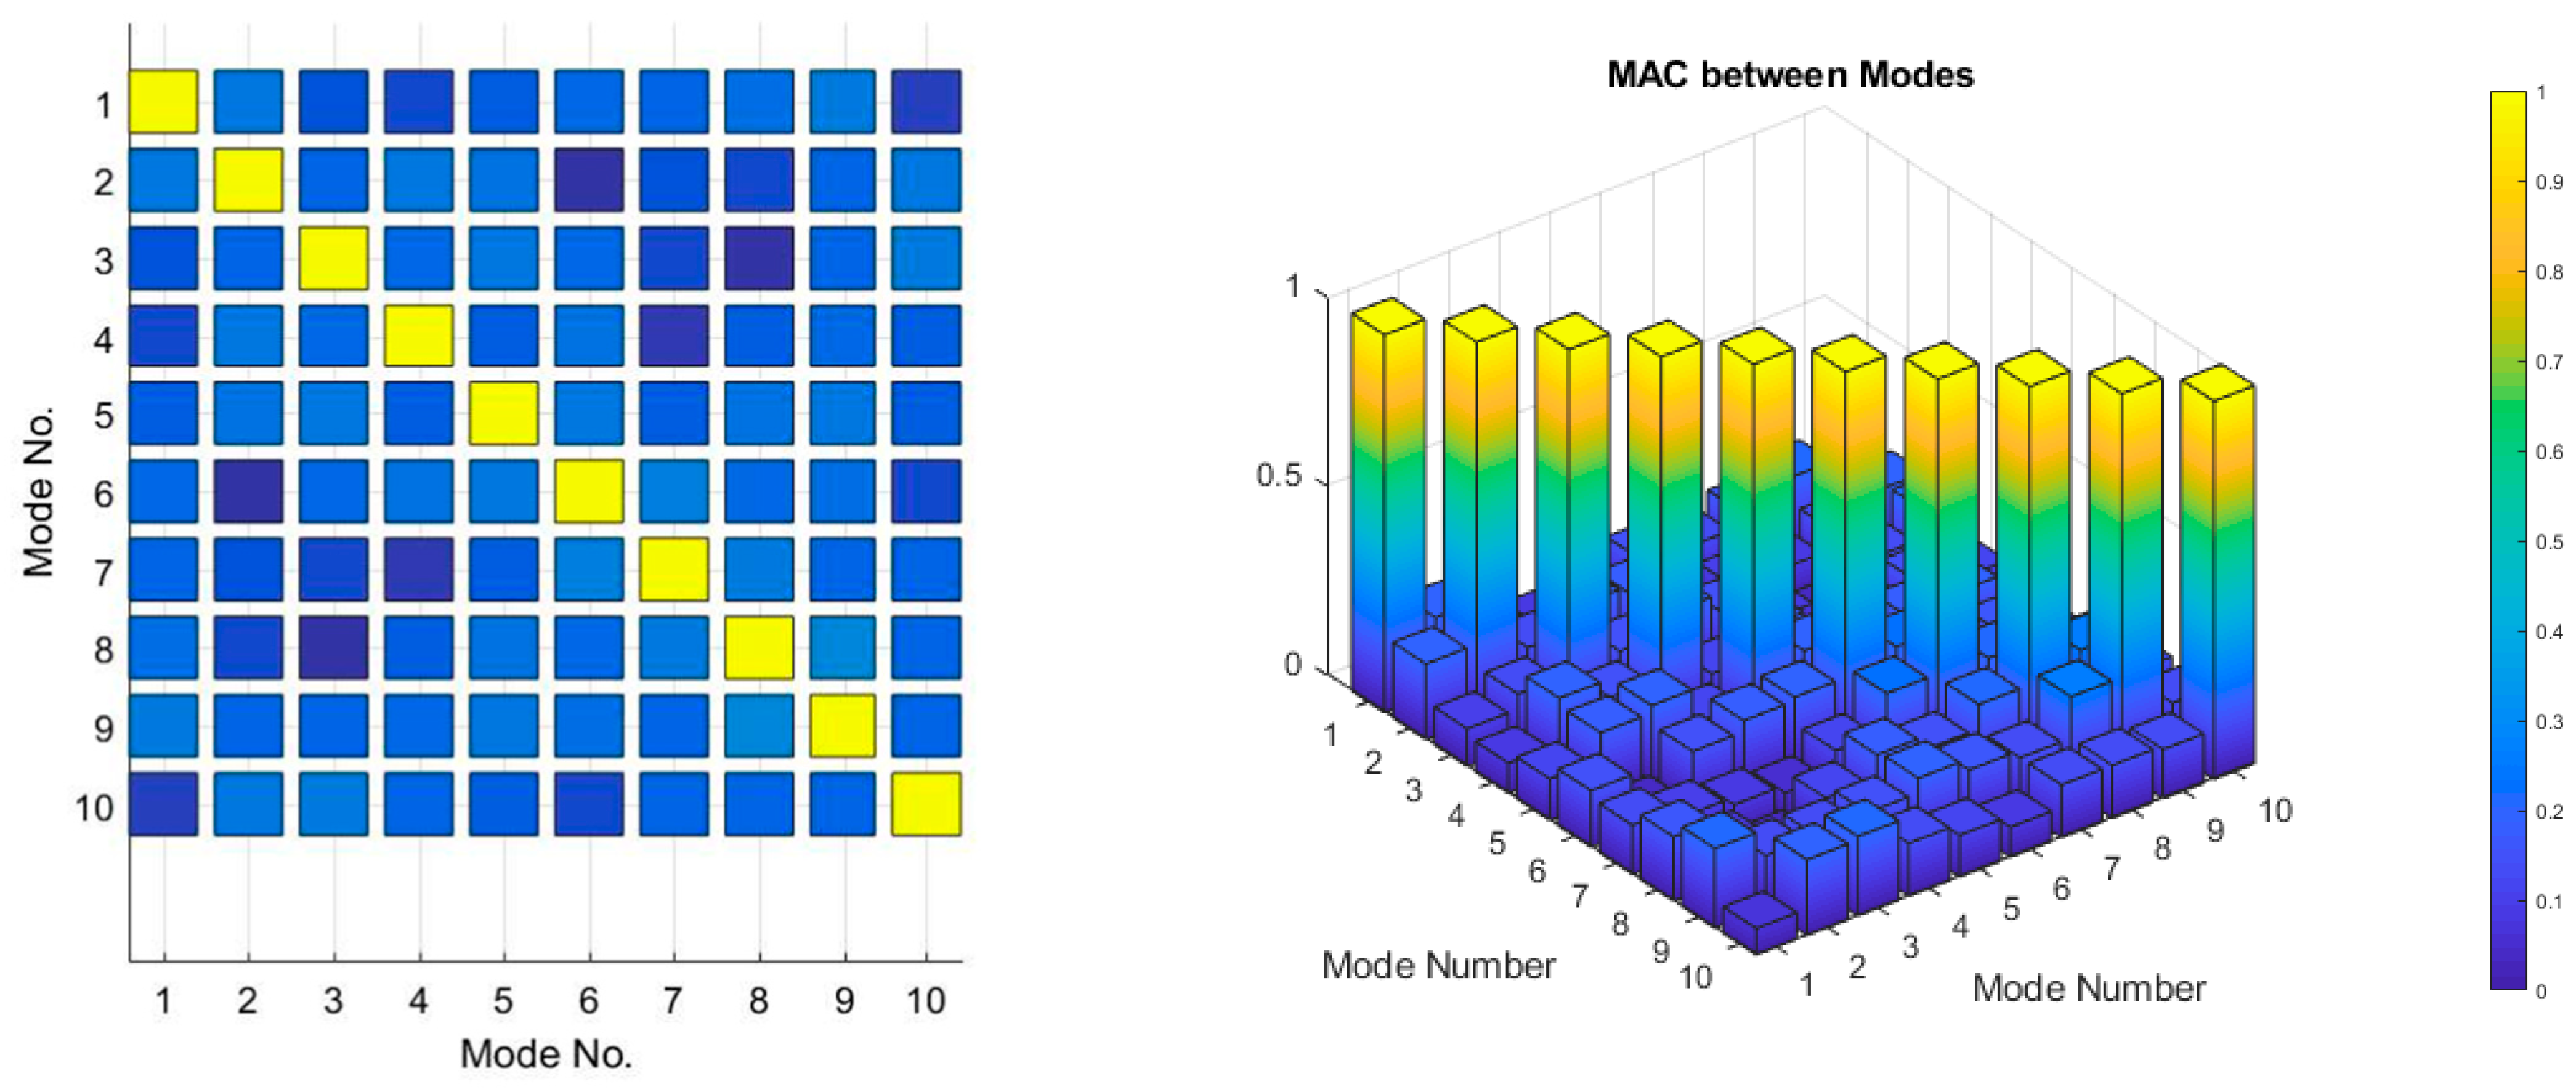
  • The initial MAC values between the same modes of each of test dataset varied from 0.72 to 0.99, which showed a reasonable to excellent match. The MAC matrix between different mode shapes showed values close to 0.1, depicting the modes not coupled. The MAC values between the numerical and experimental modes were higher for the bending modes and comparatively lower for the torsional modes, which indicated that more sensors are required to capture torsional behavior precisely.
  • The variations of the modal frequencies with the ambient temperature were observed to be linearly dependent to a reasonable degree, with the R2 values varying from 0.51 to 0.661. The changes in the frequencies can be due to the changes in stiffness of the structure due to environmental effects, including temperature, humidity, etc. The value of R2 may have been better if a weather station has been installed on or very close to the minaret site. However, due to certain restrictions, this was not allowed.
  • The first ten modes determined from the FE model, below 7 Hz, were taken for comparison with the experimentally identified modes. All the longitudinal bending modes appeared in pairs due to the symmetry about the two lateral axes of the minaret.
  • The error between the numerical and experimental modal frequencies was minimized by manual updating of the Young’s modulus and weight of the nonstructural elements. The objective function error reduced to 0.85% in six trials, providing a sufficiently close match between the frequencies, along with significant improvement in the MAC values of the modes, particularly the bending-dominant modes.
The structural condition of any structure can be examined by comparing the modal properties of the undamaged and damaged structures. The preparation of baseline data or the identification of modal properties of an undamaged structure is the first step for this purpose. Three-day-long monitoring was carried out to capture the variations in the identified modal properties that can serve as baseline data for any future damage detection and health monitoring studies. However, further prolonged monitoring for several weeks and during all seasons of the year is recommended to further improve the baseline data that is currently not allowed due to certain restrictions.

Author Contributions

Conceptualization, F.B. and H.A.; methodology, F.B. and H.A.; formal analysis, H.A., F.B. and M.R.; funding acquisition, M.A., E.E.H. and F.B.; investigation, H.A., F.B., M.A., M.R., O.B. and E.E.H.; supervision, F.B.; validation, H.A., F.B. and M.R.; writing—original draft, H.A. and F.B.; writing—review and editing, H.A., F.B., M.A., M.R., O.B. and E.E.H. All authors have read and agreed to the published version of the manuscript.

Funding

This research was funded by Taif University Researchers Supporting Project, grant number TURSP-2020/196, Taif University, Taif, Saudi Arabia.

Institutional Review Board Statement

Not applicable.

Informed Consent Statement

Not applicable.

Data Availability Statement

Some of the data presented in this study are available on request from the corresponding author.

Acknowledgments

Authors would like to acknowledge the finical support provided from Taif University Researchers Supporting Project Number (TURSP-2020/196). The authors would also like to gratefully acknowledge the support of the engineering staff office at the Faisal Mosque Islamabad, Pakistan in providing access to the minaret, its drawings, and granting permission for its instrumentation.

Conflicts of Interest

All authors declare no conflict of interest.

References

  1. Jang, J.; Smyth, A. Bayesian model updating of a full-scale finite element model with sensitivity-based clustering. Struct. Control Health Monit. 2017, 24, 1–15. [Google Scholar] [CrossRef]
  2. Chen, C.-C.; Wu, W.-H.; Shih, F.; Wang, S.-W. Scour evaluation for foundation of a cable-stayed bridge based on ambient vibration measurements of superstructure. NDT E Int. 2014, 66, 16–27. [Google Scholar] [CrossRef]
  3. Ramos, L.F.; Marques, L.; Lourenço, P.B.; De Roeck, G.; Campos-Costa, A.; Roque, J. Monitoring historical masonry structures with operational modal analysis: Two case studies. Mech. Syst. Signal. Process. 2010, 24, 1291–1305. [Google Scholar] [CrossRef] [Green Version]
  4. Bayraktar, A.; Sevim, B.; Altunişik, A.C.; Türker, T. Analytical and operational modal analyses of Turkish style reinforced concrete minarets for structural identification. Exp. Tech. 2009, 33, 65–75. [Google Scholar] [CrossRef]
  5. Diaferio, M.; Foti, D.; Giannoccaro, N.I. Non-destructive characterization and identification of the modal parameters of an old masonry tower. In Proceedings of the 2014 IEEE Workshop on Environmental Energy and Structural Monitoring Systems (EESMS), Naples, Italy, 17–18 September 2014; IEEE: New York, NY, USA, 2014; pp. 1–6. [Google Scholar]
  6. Yousefianmoghadam, S.; Behmanesh, I.; Stavridis, A.; Moaveni, B.; Nozari, A.; Sacco, A. System identification and modeling of a dynamically tested and gradually damaged 10-story reinforced concrete building. Earthq. Eng. Struct. Dyn. 2018, 47, 25–47. [Google Scholar] [CrossRef]
  7. He, X.; Moaveni, B.; Conte, J.P.; Elgamal, A.; Masri, S.F. System identification of alfred zampa memorial bridge using dynamic field test data. J. Struct. Eng. 2009, 135, 54–66. [Google Scholar] [CrossRef]
  8. Ntotsios, E.; Karakostas, C.; Lekidis, V.; Panetsos, P.; Nikolaou, I.; Papadimitriou, C.; Salonikos, T. Structural identification of Egnatia Odos bridges based on ambient and earthquake induced vibrations. Bull. Earthq. Eng. 2009, 7, 485. [Google Scholar] [CrossRef] [Green Version]
  9. Cunha, A.; Caetano, E. Experimental modal analysis of civil engineering structures. Sound Vib. 2006, 12–20. [Google Scholar] [CrossRef]
  10. Sohn, H.; Farrar, C.R.; Hemez, F.M.; Czarnecki, J.J. A Review of Structural Health Review of Structural Health Monitoring Literature 1996–2001; Los Alamos National Laboratory: New Mexico, NM, USA, 2002.
  11. Gade, S.; Møller, N.B.; Herlufsen, H.; Konstantin-Hansen, H. Frequency domain techniques for operational modal analysis. In Proceedings of the 1st IOMAC Conference, Copenhagen, Denmark, 26–27 April 2005. [Google Scholar]
  12. Gentile, C.; Bernardini, G. Output-only modal identification of a reinforced concrete bridge from radar-based measurements. Ndt E Int. 2008, 41, 544–553. [Google Scholar] [CrossRef]
  13. Pau, A.; Vestroni, F. Vibration assessment and structural monitoring of the Basilica of Maxentius in Rome. Mech. Syst. Signal. Process. 2013, 41, 454–466. [Google Scholar] [CrossRef]
  14. Morassi, A.; Tonon, S. Dynamic testing for structural identification of a bridge. J. Bridge Eng. 2008, 13, 573–585. [Google Scholar] [CrossRef]
  15. Azzara, R.M.; Girardi, M.; Iafolla, V.; Lucchesi, D.M.; Padovani, C.; Pellegrini, D. Ambient vibrations of age-old masonry towers: Results of long-term dynamic monitoring in the historic centre of Lucca. Int. J. Archit. Herit. 2021, 15, 5–21. [Google Scholar] [CrossRef] [Green Version]
  16. García-Macías, E.; Ubertini, F. Automated operational modal analysis and ambient noise deconvolution interferometry for the full structural identification of historic towers: A case study of the Sciri Tower in Perugia, Italy. Eng. Struct. 2020, 215, 110615. [Google Scholar] [CrossRef]
  17. Erkal, A. Transmission of Traffic-induced Vibrations on and around the Minaret of Little Hagia Sophia. Int. J. Archit. Herit. 2017, 11, 349–362. [Google Scholar] [CrossRef]
  18. Carpinteri, A.; Lacidogna, G.; Manuello, A.; Niccolini, G. A study on the structural stability of the Asinelli Tower in Bologna. Struct. Control Health Monit. 2016, 23, 659–667. [Google Scholar] [CrossRef]
  19. Saisi, A.; Gentile, C. Post-earthquake diagnostic investigation of a historic masonry tower. J. Cult. Herit. 2015, 16, 602–609. [Google Scholar] [CrossRef]
  20. Zhang, F.; Yang, Y.; Xiong, H.; Yang, J.; Yu, Z. Structural health monitoring of a 250-m super-tall building and operational modal analysis using the fast Bayesian FFT method. Struct. Control Health Monit. 2019, 26, e2383. [Google Scholar] [CrossRef]
  21. He, Y.; Li, Q.; Zhu, H.; Han, X.; He, Y.; Li, X. Monitoring of structural modal parameters and dynamic responses of a 600 m-high skyscraper during a typhoon. Struct. Des. Tall Spec. Build. 2018, 27, e1456. [Google Scholar] [CrossRef]
  22. Sun, H.; Büyüköztürk, O. The MIT Green Building benchmark problem for structural health monitoring of tall buildings. Struct. Control Health Monit. 2018, 25, e2115. [Google Scholar] [CrossRef]
  23. Zhang, F.L.; Xiong, H.B.; Shi, W.X.; Ou, X. Structural health monitoring of Shanghai Tower during different stages using a Bayesian approach. Struct. Control Health Monit. 2016, 23, 1366–1384. [Google Scholar] [CrossRef]
  24. Jamil, R. Role of a Dome-Less Mosque in Conserving the Religious and Traditional Values of Muslims: An Innovative Architecture of Shah Faisal Mosque, Islamabad. Int. J. Archit. Eng. Constr. 2017, 6, 40–45. [Google Scholar] [CrossRef]
  25. Pekol, B. Architectural Impressions between Turkey and Pakistan: A hermeneutic tightrope from objects to the historian. In Historiography of Architecture of Pakistan and the Region; Vandal, P., Ed.; Thaap Publications: Lahore, Pakistan, 2011. [Google Scholar]
  26. Brincker, R.; Zhang, L.; Andersen, P. Modal identification of output-only systems using frequency domain decomposition. Smart Mater. Struct. 2001, 10, 441. [Google Scholar] [CrossRef] [Green Version]
  27. Van Overschee, P.; De Moor, B.L. Subspace Identification for Linear Systems: Theory—Implementation—Applications; Springer Science & Business Media: Berlin/Heidelberg, Germany, 2012; ISBN 1461304652. [Google Scholar]
  28. Peeters, B.; De Roeck, G. Reference-based stochastic subspace identification for output-only modal analysis. Mech. Syst. Signal. Process. 1999, 13, 855–878. [Google Scholar] [CrossRef] [Green Version]
  29. Juang, J.-N. Applied System Identification; Prentice-Hall, Inc.: Hoboken, NJ, USA, 1994; ISBN 013079211X. [Google Scholar]
  30. Bayraktar, A.; Sevim, B.; Altunişik, A.C.; Türker, T. Earthquake analysis of reinorced concrete minarets using ambient vibration test results. Struct. Des. Tall Spec. Build. 2010, 19, 257–273. [Google Scholar] [CrossRef]
  31. Şahin, A.; Bayraktar, A.; Özcan, D.M.; Sevim, B.; Altunışık, A.C.; Türker, T. Dynamic field test, system identification, and modal validation of an RC Minaret: Preprocessing and postprocessing the wind-induced ambient vibration data. J. Perform. Constr. Facil. 2010, 25, 336–356. [Google Scholar] [CrossRef]
  32. Gentile, C.; Saisi, A. Ambient vibration testing of historic masonry towers for structural identification and damage assessment. Constr. Build. Mater. 2007, 21, 1311–1321. [Google Scholar] [CrossRef]
  33. Magalhães, F.; Cunha, A. Explaining operational modal analysis with data from an arch bridge. Mech. Syst. Signal. Process. 2011, 25, 1431–1450. [Google Scholar] [CrossRef] [Green Version]
  34. Wu, J.R.; Li, Q.S. Finite element model updating for a high-rise structure based on ambient vibration measurements. Eng. Struct. 2004, 26, 979–990. [Google Scholar] [CrossRef]
  35. Brownjohn, J.M.W.; Pan, T.-C.; Deng, X.Y. Correlating dynamic characteristics from field measurements and numerical analysis of a high-rise building. Earthq. Eng. Struct. Dyn. 2000, 29, 523–543. [Google Scholar] [CrossRef]
  36. Friswell, M.; Mottershead, J.E. Finite Element Model Updating in Structural Dynamics; Springer Science & Business Media: Berlin/Heidelberg, Germany, 2013; Volume 38, ISBN 9401585083. [Google Scholar]
  37. Allemang, R.J. The modal assurance criterion–twenty years of use and abuse. Sound Vib. 2003, 37, 14–23. [Google Scholar]
  38. Pastor, M.; Binda, M.; Harčarik, T. Modal assurance criterion. Procedia Eng. 2012, 48, 543–548. [Google Scholar] [CrossRef]
  39. Xia, Y.; Hao, H.; Zanardo, G.; Deeks, A. Long term vibration monitoring of an RC slab: Temperature and humidity effect. Eng. Struct. 2006, 28, 441–452. [Google Scholar] [CrossRef]
  40. Liu, C.; DeWolf, J.T. Effect of temperature on modal variability of a curved concrete bridge under ambient loads. J. Struct. Eng. 2007, 133, 1742–1751. [Google Scholar] [CrossRef]
  41. Chen, W.H.; Lu, Z.R.; Lin, W.; Chen, S.H.; Ni, Y.Q.; Xia, Y.; Liao, W.Y. Theoretical and experimental modal analysis of the Guangzhou New TV Tower. Eng. Struct. 2011, 33, 3628–3646. [Google Scholar] [CrossRef]
  42. Yuen, K.-V.; Kuok, S.-C. Ambient interference in long-term monitoring of buildings. Eng. Struct. 2010, 32, 2379–2386. [Google Scholar] [CrossRef]
  43. Azzara, R.M.; De Roeck, G.; Girardi, M.; Padovani, C.; Pellegrini, D.; Reynders, E. The influence of environmental parameters on the dynamic behaviour of the San Frediano bell tower in Lucca. Eng. Struct. 2018, 156, 175–187. [Google Scholar] [CrossRef]
  44. Brownjohn, J.M.W.; Xia, P.-Q. Dynamic assessment of curved cable-stayed bridge by model updating. J. Struct. Eng. 2000, 126, 252–260. [Google Scholar] [CrossRef] [Green Version]
  45. ETABS V 16.0.2 Computer and Structures.
  46. Khan, B.L.; Azeem, M.; Usman, M.; Farooq, S.H.; Hanif, A.; Fawad, M. Effect of near and far Field Earthquakes on performance of various base isolation systems. Procedia Struct. Integr. 2019, 18, 108–118. [Google Scholar] [CrossRef]
  47. Khan, B.L.; Farooq, H.; Usman, M.; Butt, F.; Khan, A.Q.; Hanif, A. Effect of soil–structure interaction on a masonry structure under train-induced vibrations. Proc. Inst. Civ. Eng. Build. 2019, 172, 922–934. [Google Scholar] [CrossRef]
  48. ASTM C805/C805M. Standar Test Method for Rebound Number of Hardened Concrete; American Society for Testing and Materials: West Conshohocken, WC, USA, 2013. [Google Scholar] [CrossRef]
  49. Beskhyroun, S.; Wegner, L.D.; Sparling, B.F. Integral resonant control scheme for cancelling human-induced vibrations in light-weight pedestrian structures. Struct. Control Health Monit. 2011, 19, 55–69. [Google Scholar] [CrossRef]
  50. Butt, F.; Omenzetter, P. Seismic response trends evaluation and finite element model calibration of an instrumented RC building considering soil–structure interaction and non-structural components. Eng. Struct. 2014, 65, 111–123. [Google Scholar] [CrossRef] [Green Version]
  51. Butt, F.; Omenzetter, P. Finite element model updating of a RC building considering seismic response trends. In Proceedings of the Nondestructive Characterization for Composite Materials, Aerospace Engineering, Civil Infrastructure, and Homeland Security 2013, Chicago, IL, USA, 12–15 March 2012; International Society for Optics and Photonics: Bellingham, WA, USA, 2013; Volume 8694, p. 86941E. [Google Scholar]
Figure 1. The top view of Faisal Mosque with the encircled minaret considered for this study.
Buildings 12 00252 g001
Figure 2. (a) A picture of a minaret. (b) Elevation view of the minaret. (c) Cross-sectional view of the minaret.
Buildings 12 00252 g002
Figure 3. Accelerometer with an additional power arrangement.
Buildings 12 00252 g003
Figure 4. The schematic diagram for the sensor arrangements.
Buildings 12 00252 g004
Figure 5. Experimental mode shapes in an elevation view.
Buildings 12 00252 g005
Figure 6. Experimental mode shapes in planar view at 40.64 m to show the bending and torsional natures of the modes (EFDD).
Buildings 12 00252 g006
Figure 7. Frequency comparison identified from EFDD, SSI, and NExT-ERA.
Buildings 12 00252 g007
Figure 8. A typical MAC matrix between the identified modes (EFDD).
Buildings 12 00252 g008
Figure 9. The variation of temperature during 24-h data acquisition over three days.
Buildings 12 00252 g009
Figure 10. The correlation between the identified frequencies and the ambient temperature (EFDD).
Buildings 12 00252 g010
Figure 11. The FE model of the minaret (a) plan, (b) stairs, and (c) 3D view.
Buildings 12 00252 g011
Figure 12. Numerical mode shapes, along with the natural frequencies. (a) First mode. (b) Second mode. (c) Third mode. (d) Fourth mode. (e) Fifth mode. (f) Sixth mode. (g) Seventh mode. (h) Eighth mode. (i) Ninth mode. (j) Tenth mode.
Buildings 12 00252 g012
Figure 13. Rebound hammer test.
Buildings 12 00252 g013
Table 1. First ten average identified frequencies from the three identification methods.
Frequency NoEFDDSSINExT-ERAAverage
Frequency of Three Methods (Hz)
Mode Nature
Average
Frequency
(Hz)
*St DevAverage
Frequency
(Hz)
*St DevAverage
Frequency
(Hz)
*St Dev
E10.5040.0510.5390.0410.5140.0610.519B
E20.5070.0440.5420.0490.5230.0620.524B
E32.7220.0662.5770.0512.6330.0322.644B
E42.7390.0612.5990.0572.6710.0422.669B
E52.8810.0892.7840.0702.8590.0912.841T
E64.5030.1074.6380.1314.6010.1494.592B
E74.610.1274.6460.1164.6360.1674.619B
E85.5740.1575.760.1695.360.1785.564T
E96.4420.2116.5470.2736.3510.2766.446B
E106.5930.2196.6130.2846.4950.2486.567B
*St Dev—Standard deviation, E—Experimental Frequencies, B—Bending dominant Mode, and T—Torsion dominant Mode.
Table 2. The MAC values of the first 10 identified modes from the datasets.
Frequency NoEFDDSSINExT-ERA
Average Frequency
(Hz)
MaxMinAverage Frequency
(Hz)
MaxMinAverage Frequency
(Hz)
MaxMin
E10.5040.950.830.5390.940.810.5140.920.78
E20.5070.950.810.5420.950.770.5230.970.79
E32.7220.970.722.5770.960.792.6330.960.83
E42.7390.980.792.5990.970.822.6710.970.81
E52.8810.970.852.7840.920.872.8590.910.88
E64.5030.960.824.6380.960.764.6010.930.78
E74.610.980.814.6460.940.814.6360.990.75
E85.5740.950.795.760.970.825.360.920.81
E96.4420.920.86.5470.940.796.3510.930.78
E106.5930.950.816.6130.960.86.4950.950.77
Table 3. The maximum, minimum, and average identified frequencies and their correlations with the ambient temperature.
Frequency NoEFDDSSINExT-ERA
Avg
Freq
favg
(Hz)
Max Freq
fmax
(Hz)
Min Freq fmin
(Hz)
R2Avg
Freq
favg
(Hz)
Max Freq
fmax
(Hz)
Min Freq fmin
(Hz)
R2Avg
Freq
favg
(Hz)
Max Freq
fmax
(Hz)
Min Freq fmin
(Hz)
R2
E10.5040.5860.4050.6200.5390.5780.4250.6130.5140.5830.4750.661
E20.5070.590.4120.6040.5420.6020.4620.6010.5230.5790.4670.611
E32.7222.7982.6950.6062.5772.7342.4180.6142.6332.8042.5030.583
E42.7392.7872.650.6092.5992.7532.4030.5492.6712.7982.5870.562
E52.8812.9912.8010.5452.7842.8812.6920.5862.8592.9892.790.589
E64.5034.9684.0540.5984.6384.8744.2420.5614.6014.9884.5450.623
E74.614.954.0090.5784.6464.8924.4730.5844.6364.9274.5490.593
E85.5745.9665.1410.5105.765.9095.3690.6055.365.7675.2320.622
E96.4426.8896.0030.5176.5476.8766.2120.6116.3516.6396.1370.609
E106.5936.9756.0040.5556.6136.9256.2190.5926.4956.7616.1120.582
Table 4. Comparison of the experimental and numerical natural frequencies.
Mode NoNumerical Frequency
(Hz)
Modal Mass ParticipationAverage
Experimental Frequency
(Hz)
Error %MACNumerical Mode Type
UxUyRz
10.4890.37830.00865.165 × 10−70.5042.980.86B
20.4910.00860.37782.034 × 10−50.5073.160.81B
32.5920.14030.000102.7224.780.72B
42.6140.00010.14030.00012.7394.560.78B
52.71502.088 × 10−50.38142.8815.760.51T
64.2110.0498004.5036.480.79B
74.31500.05042.411 × 10−64.616.400.81B
85.2241.002E-060.00020.04825.5746.280.58T
96.0210.02910.000206.4426.540.69B
106.0850.00020.03010.00016.5937.710.70B
B—Bending-dominant and T—Torsion-dominant.
Table 5. Manual model updating scheme.
Trial NoUpdating Parameters
1Ec = 23,250 MPa
2Ec = 24,855 MPa
3Columns Ec = 24,855 MPa and all other members Ec = 23,250 MPa
4Ec = 26,363.32 MPa
5Columns Ec = 26,363 MPa and all other members Ec = 24,855 MPa
6Ec = 26,363 MPa and additional masses of non-structural components
Table 6. Model updating results.
Experimental/Target Frequencies Numerical Frequencies
Trial-1% ErrorTrial-2% ErrorTrial-3% ErrorTrial-4% ErrorTrial-5% ErrorTrial-6% ErrorMAC
0.5040.4892.980.4912.580.492.780.511−1.390.509−0.990.5081.570.97
0.5070.4913.160.4991.580.4952.370.517−1.970.515−1.580.5111.560.95
2.7222.5924.782.6014.452.5984.562.872−5.512.872−5.512.8121.210.93
2.7392.6144.562.6224.272.6194.382.911−6.282.843−3.802.8241.130.94
2.8812.7155.762.7773.612.7355.073.021−4.862.981−3.472.9140.400.78
4.5034.2116.484.3523.354.2944.644.768−5.884.3653.064.6210.580.90
4.614.3156.404.4473.544.3814.974.957−7.534.4513.454.8731.240.89
5.5745.2246.285.4552.135.3154.655.861−5.155.861−5.155.6670.300.70
6.4426.0216.546.3151.976.2812.506.842−6.216.842−6.216.7510.740.87
6.5936.0857.716.4811.706.3413.826.945−5.346.945−5.346.8620.620.84
Objective Function2.241.441.811.671.320.85
Publisher’s Note: MDPI stays neutral with regard to jurisdictional claims in published maps and institutional affiliations.

