
Flexural Behavior of RC Beams Using Fe-Based Shape Memory Alloy Rebars as Tensile Reinforcement


Abstract
:1. Introduction
2. Experiment Program
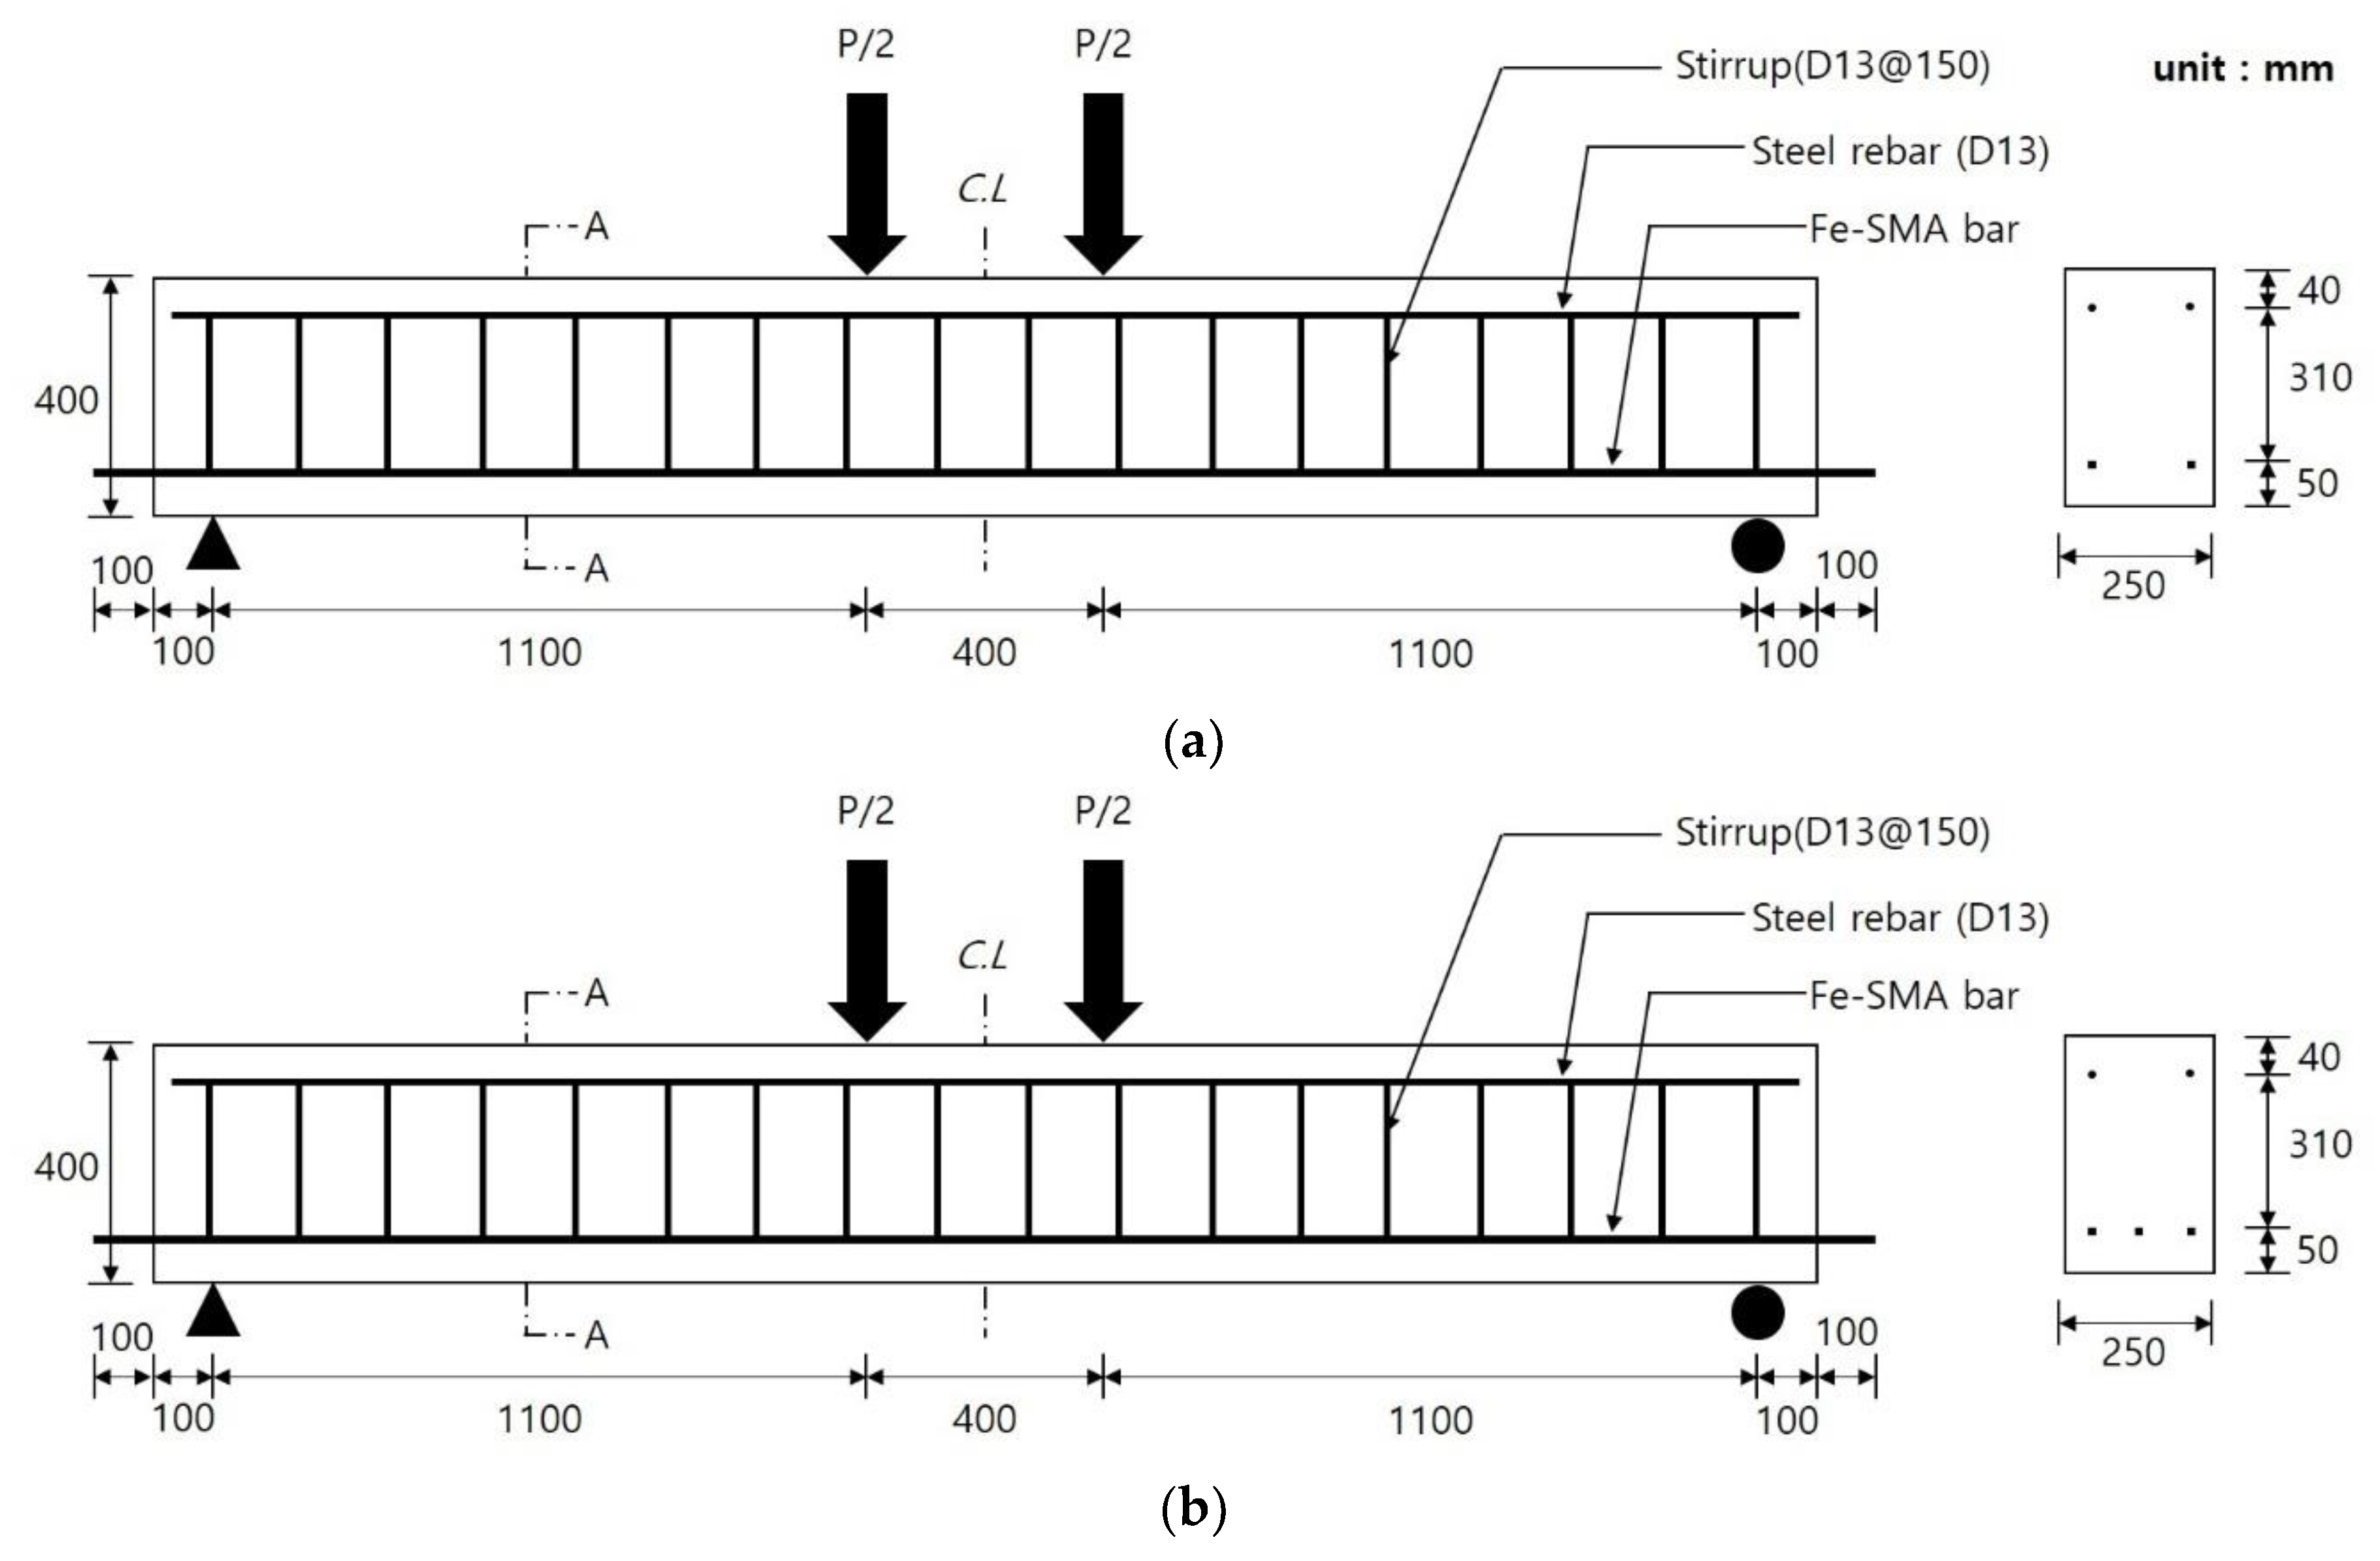
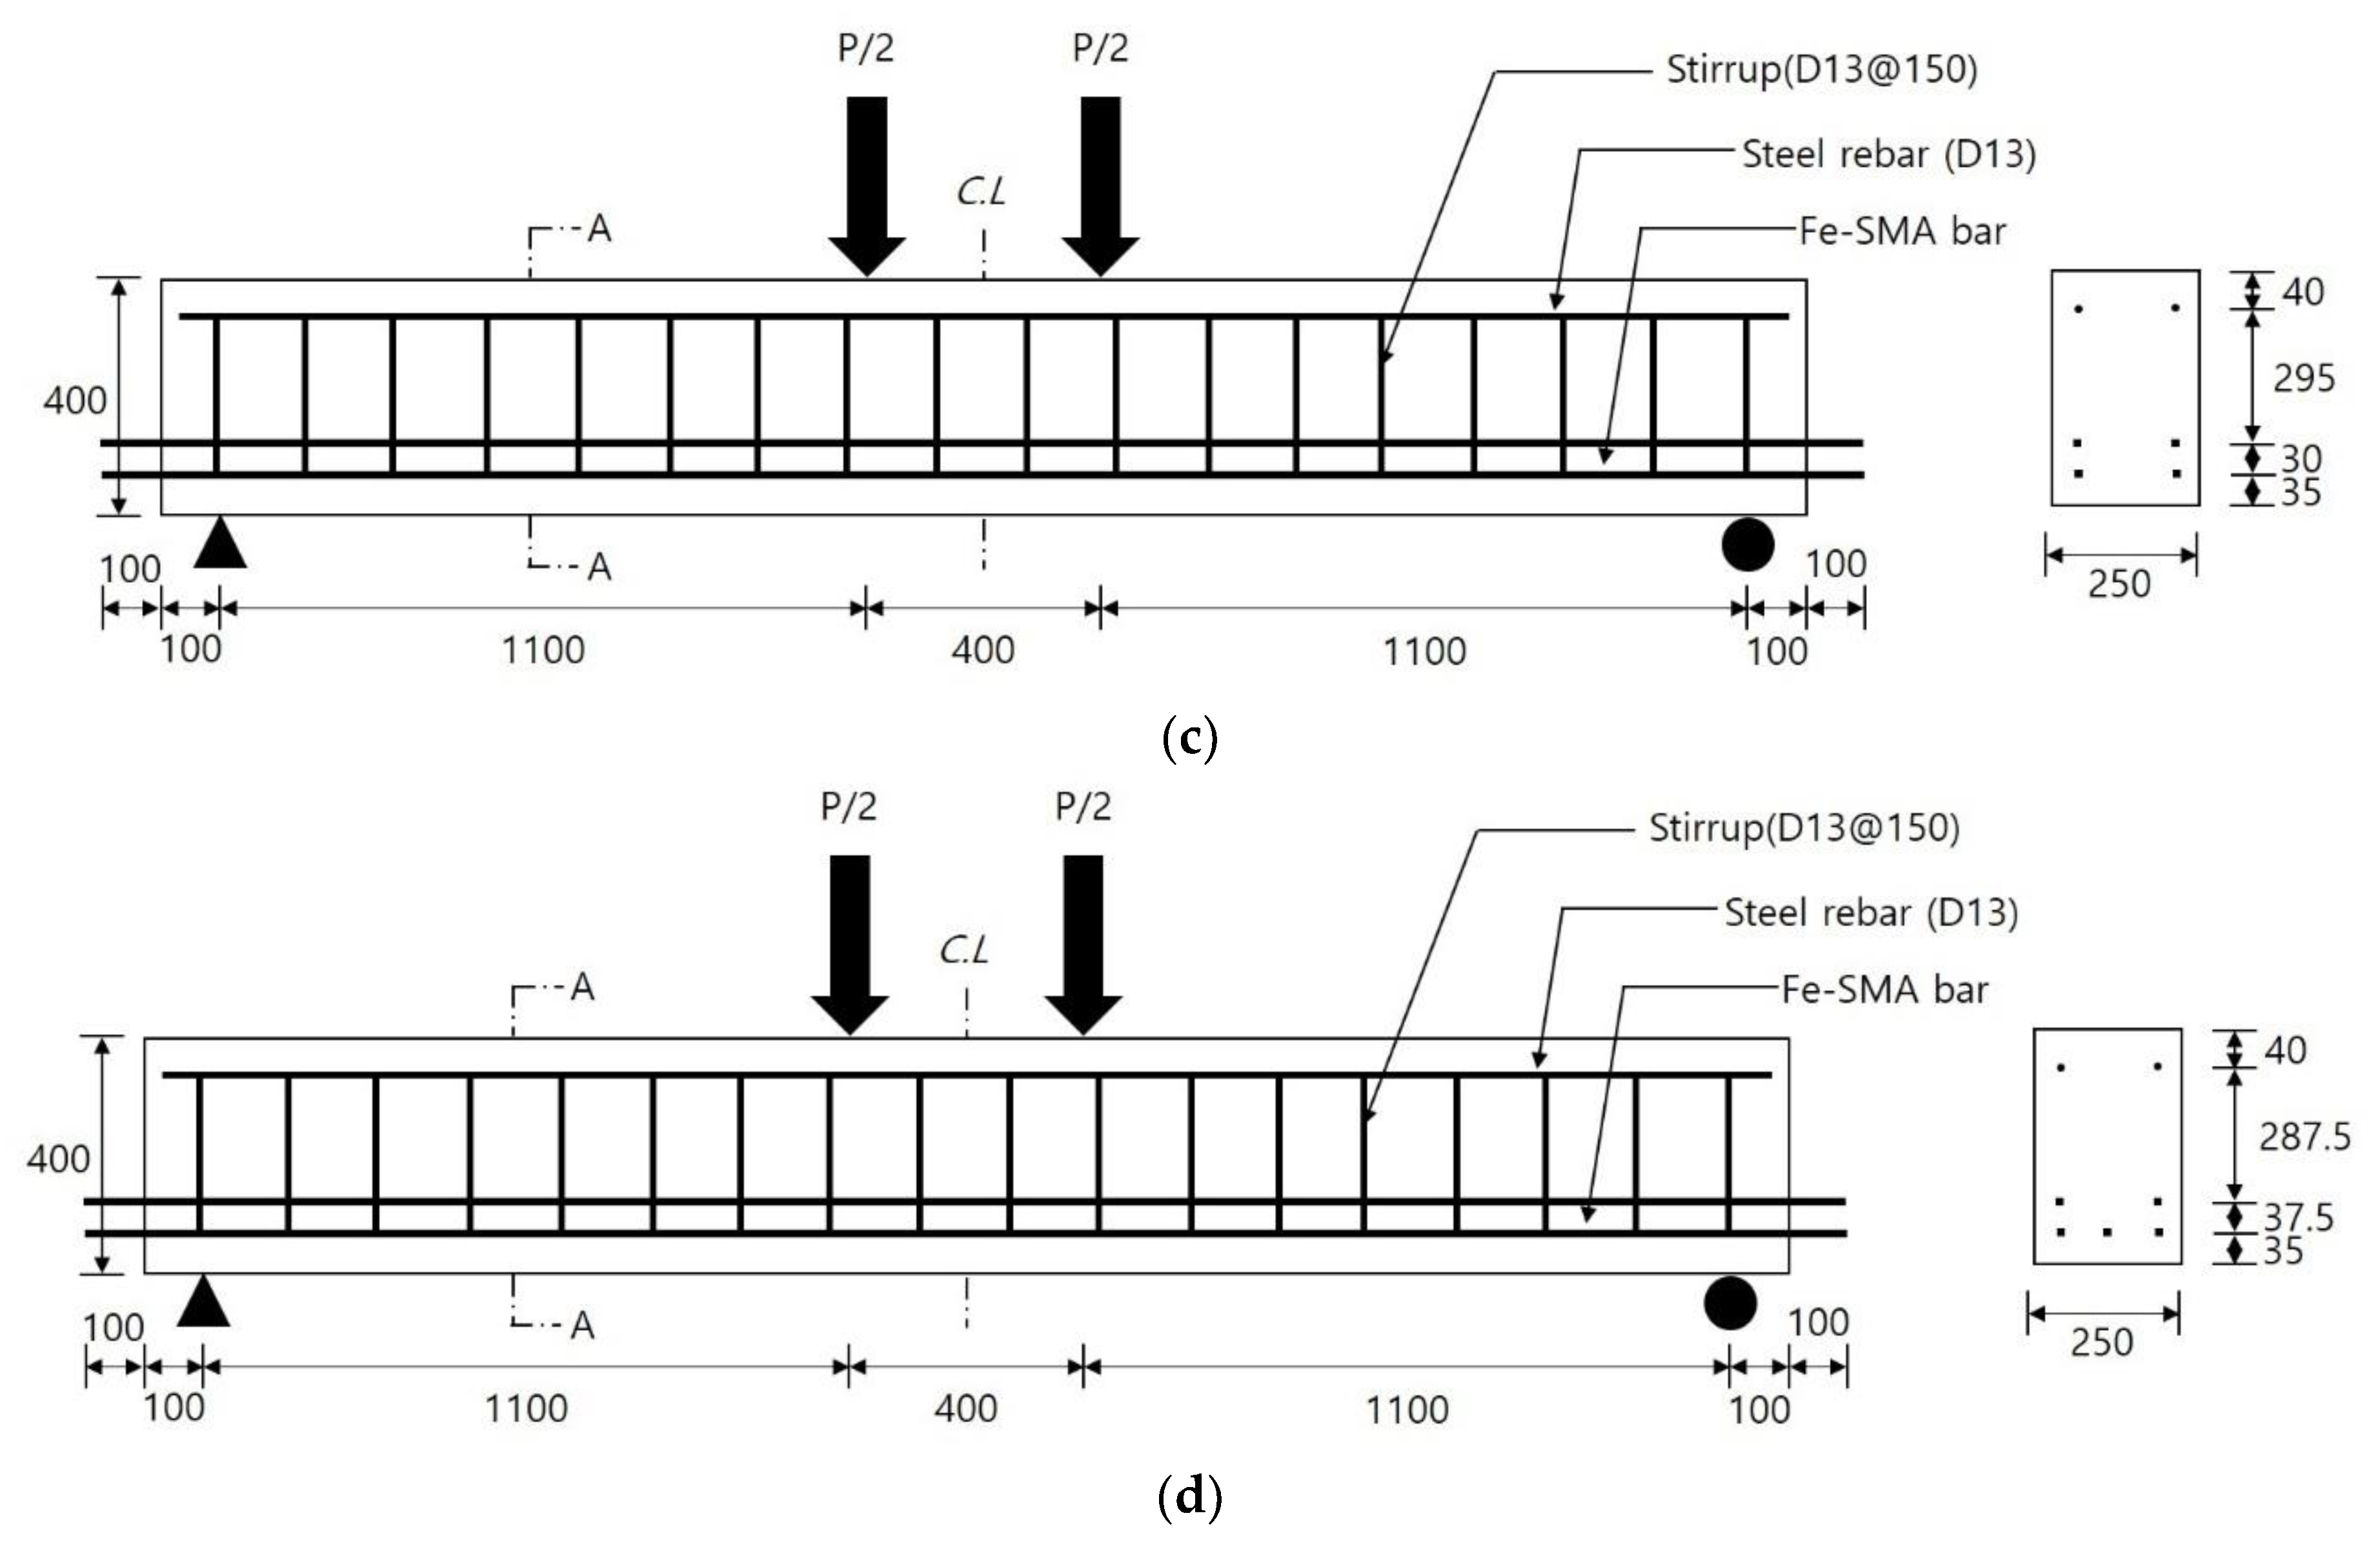
2.1. Test Specimens
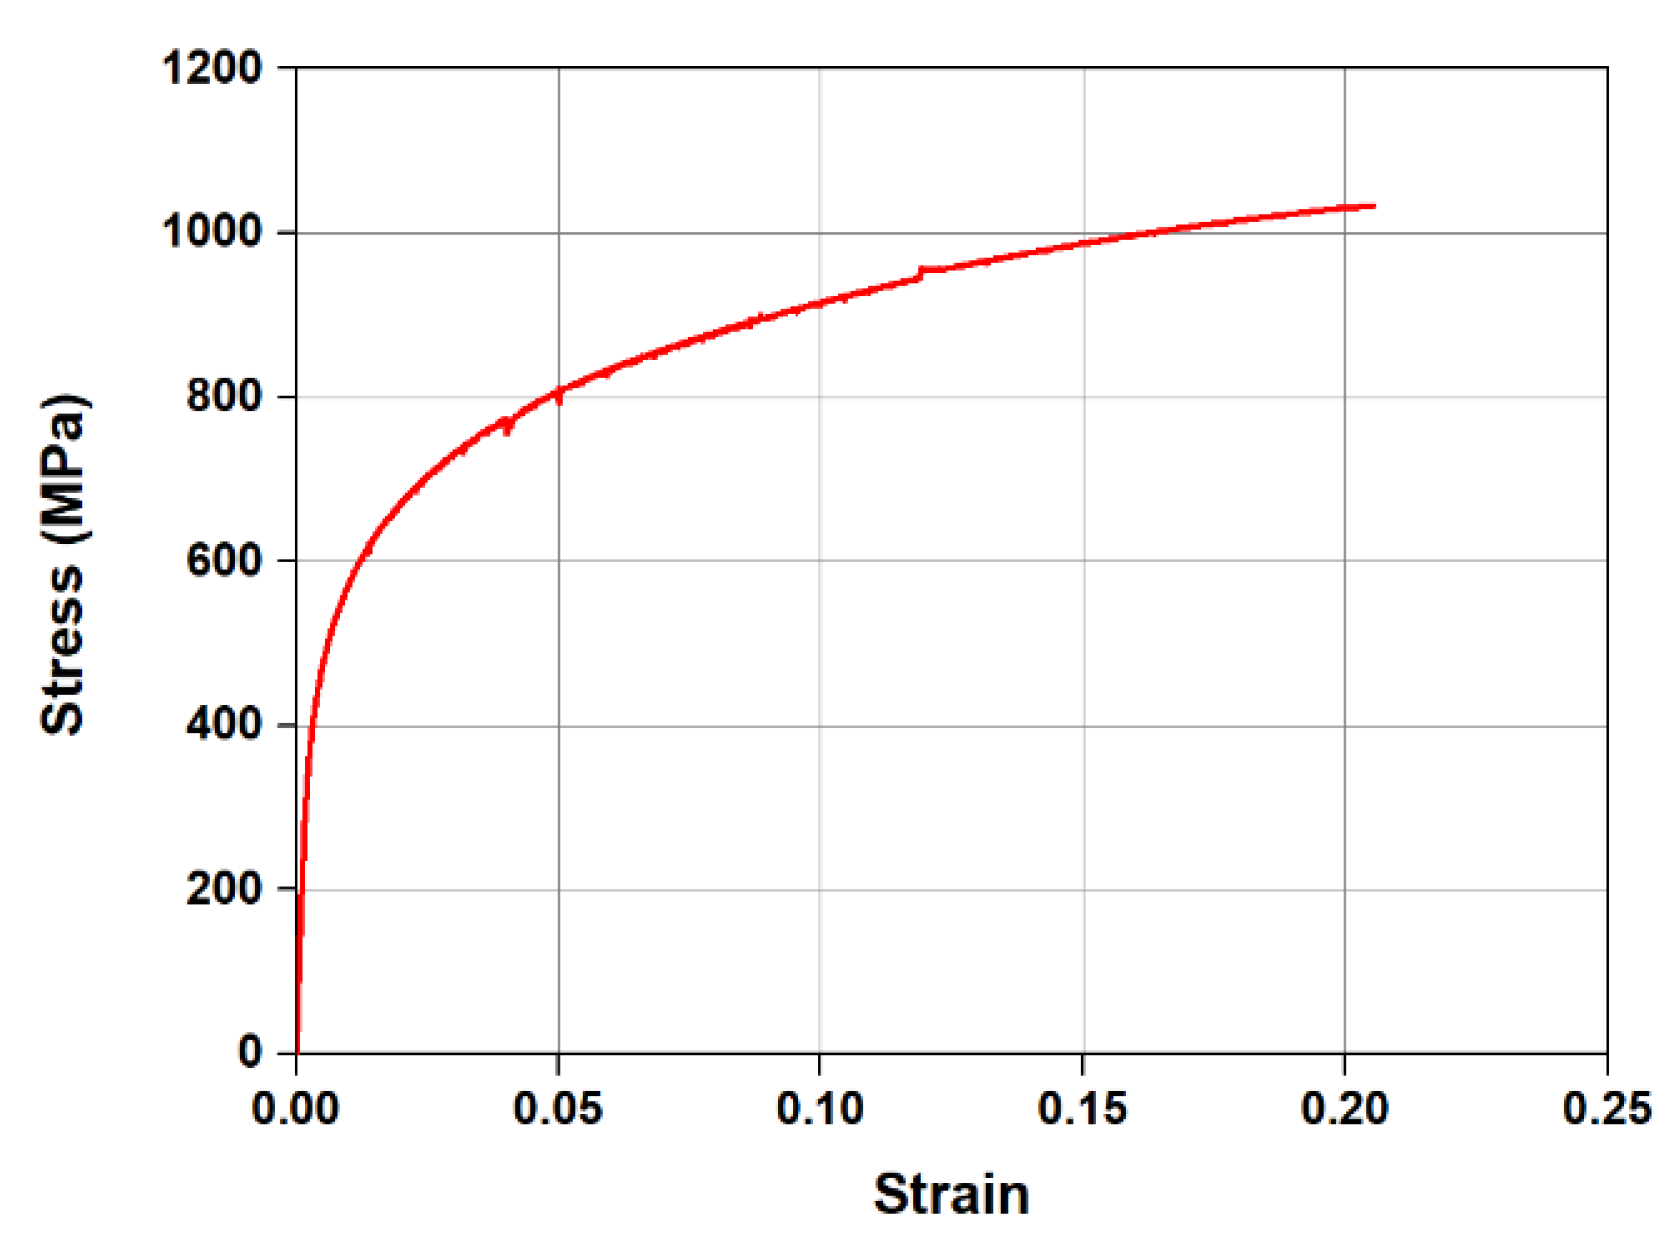
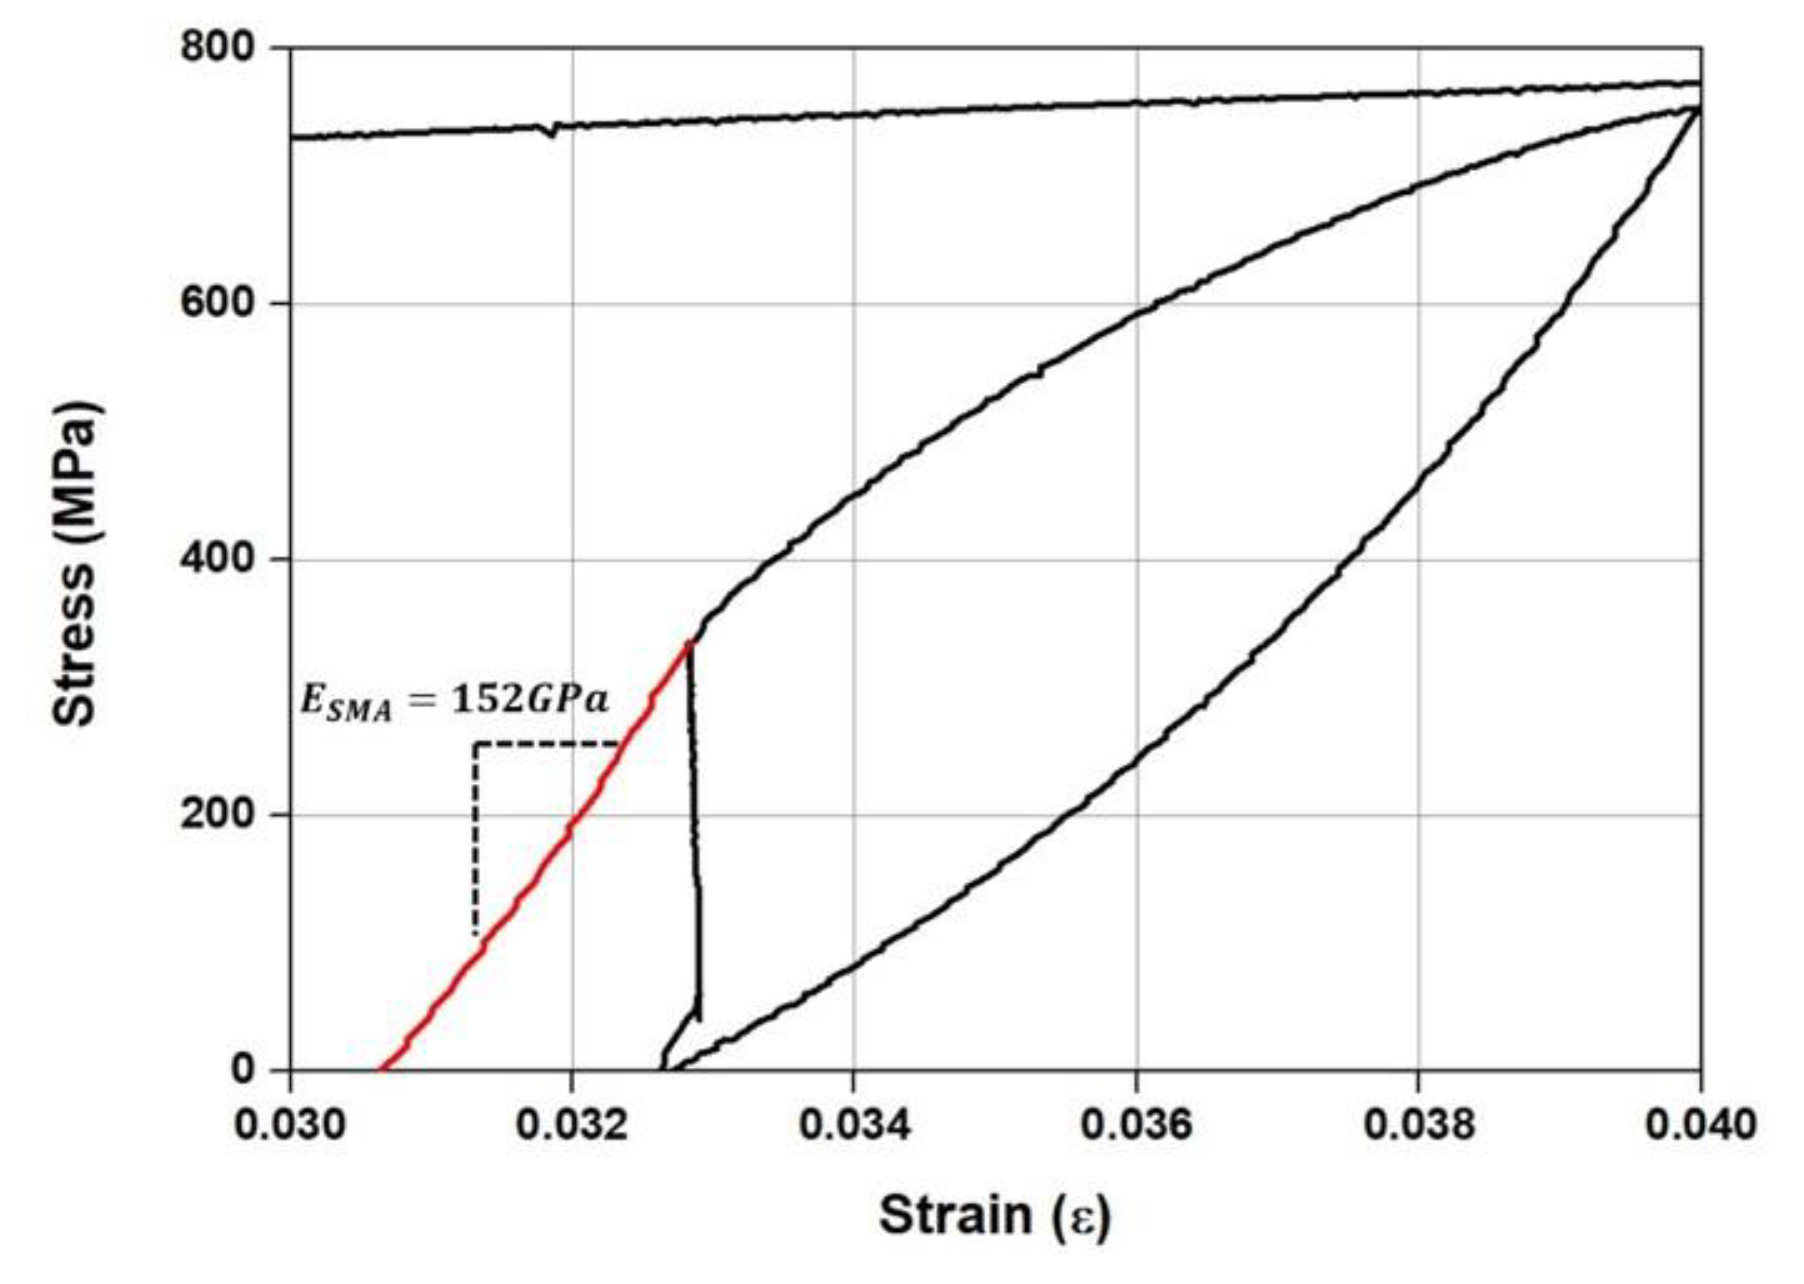
2.2. Materials
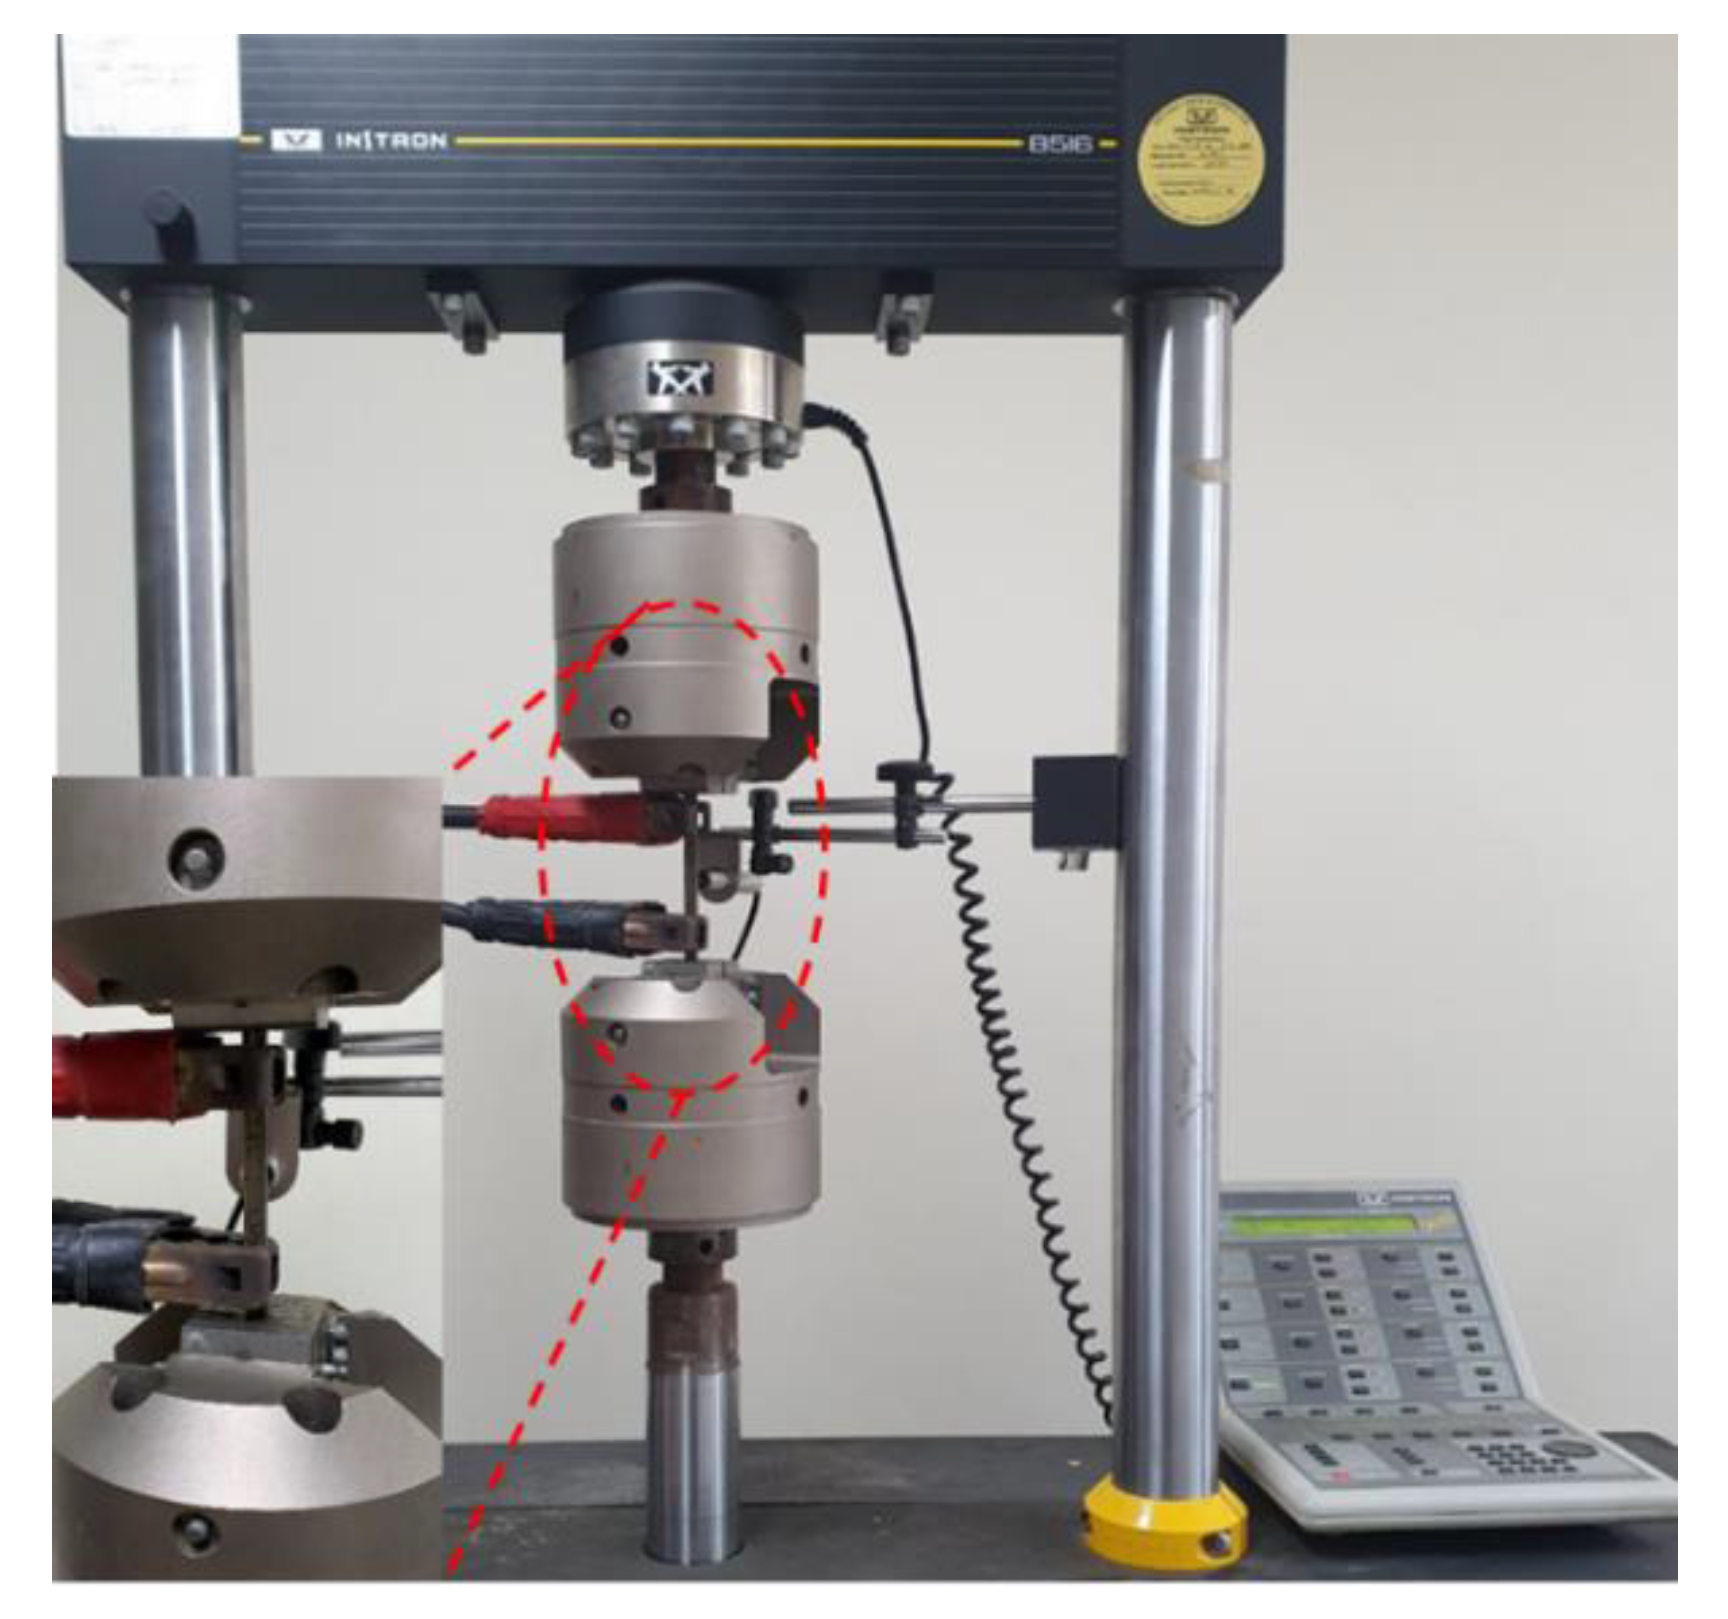
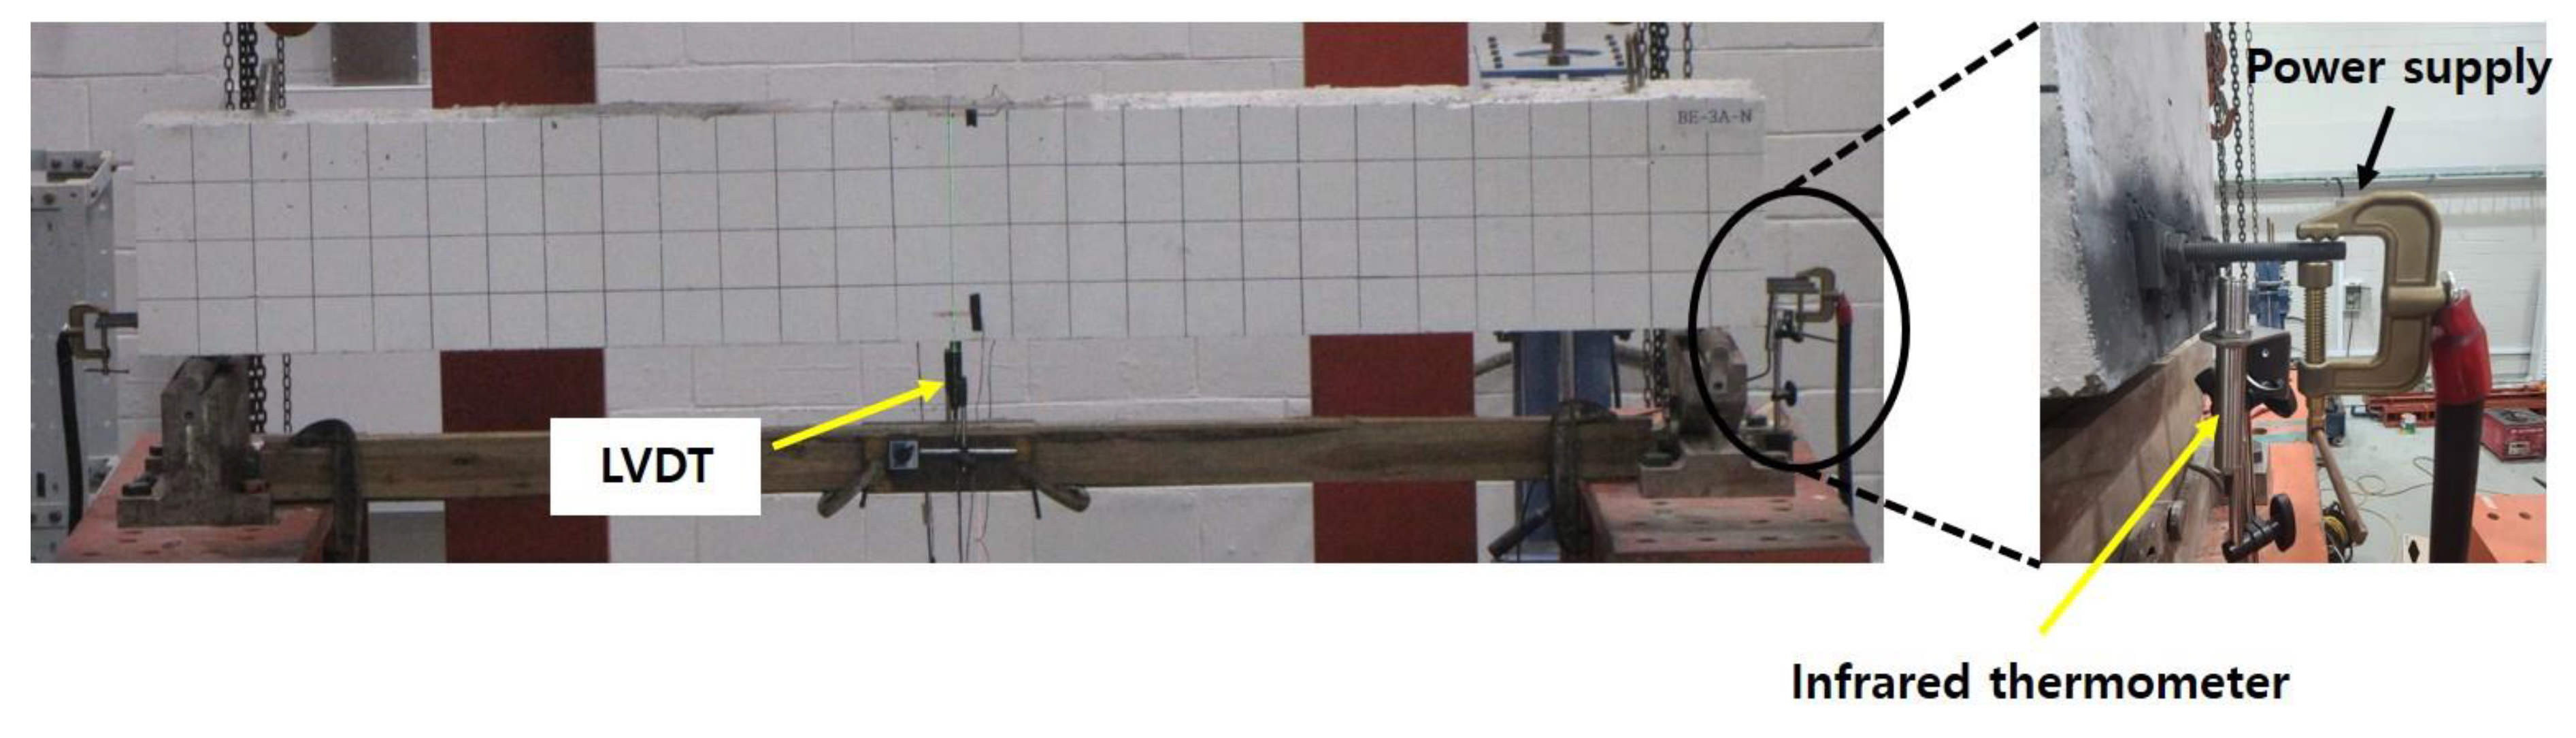
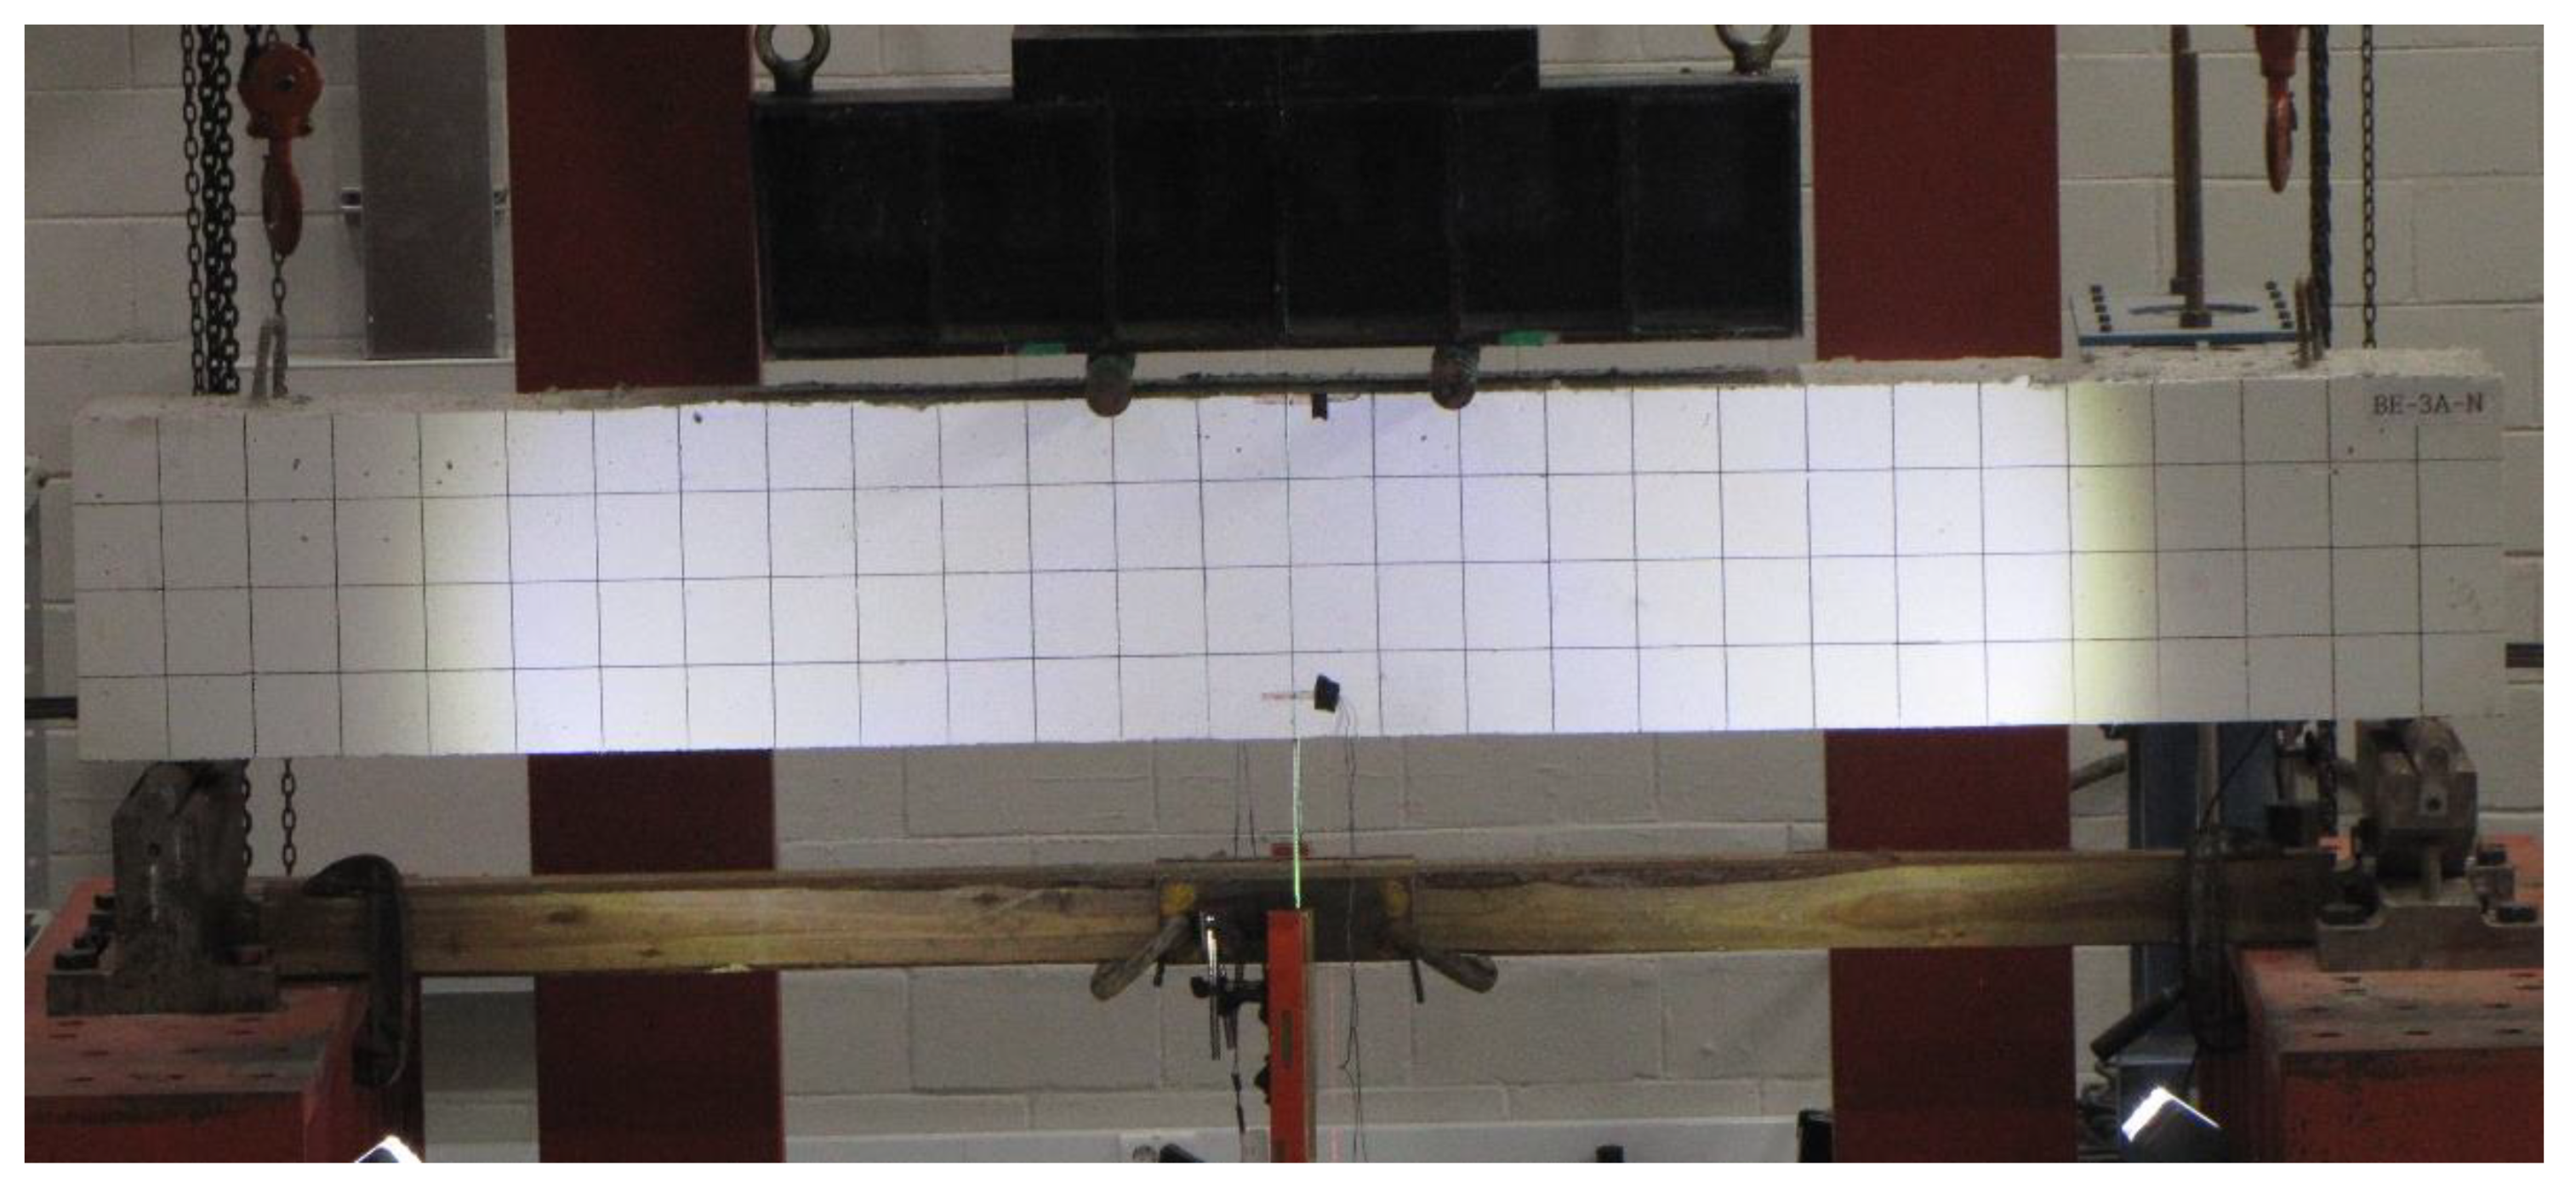
2.3. Test Setup
3. Experiment Results and Discussion
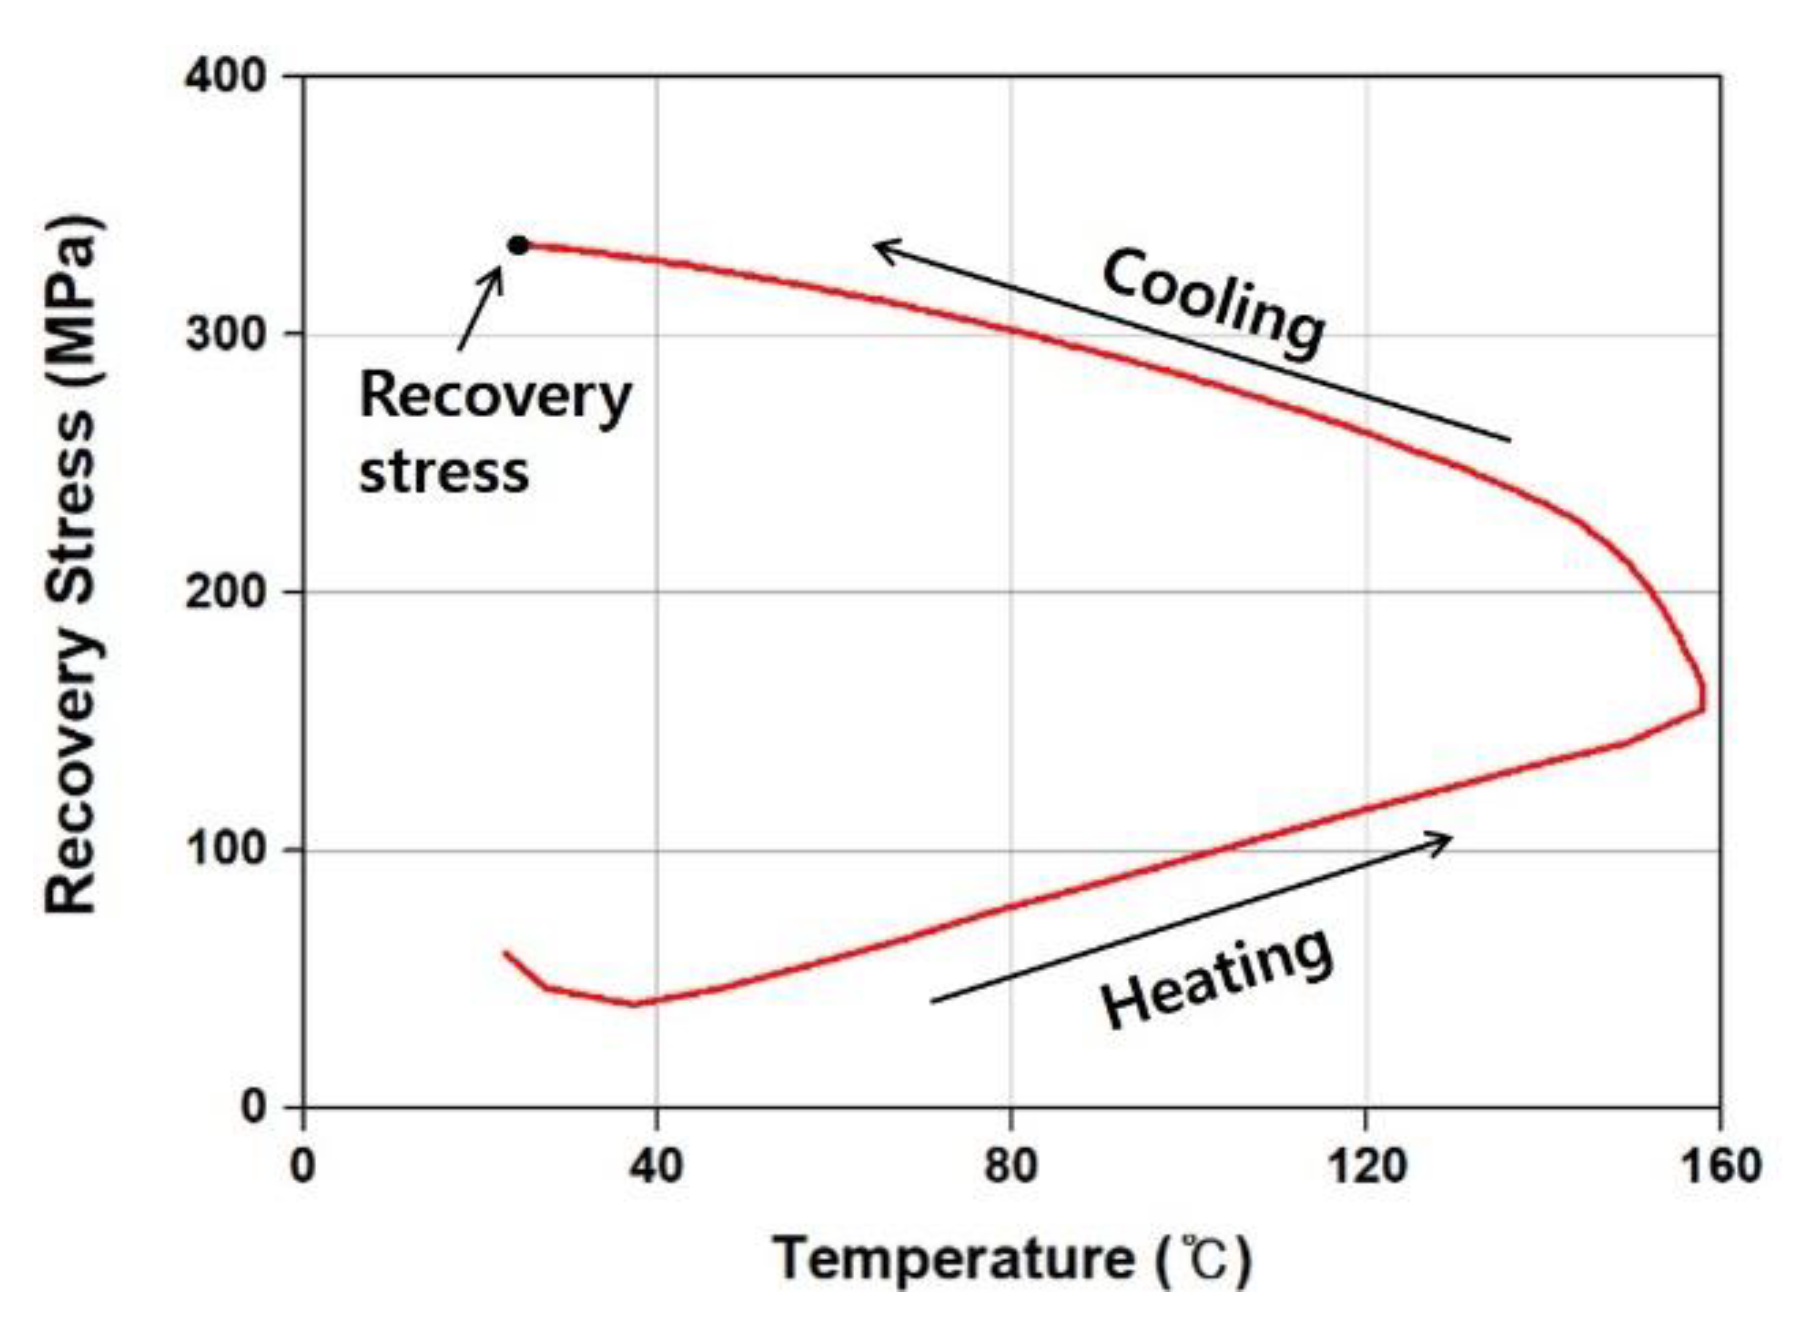
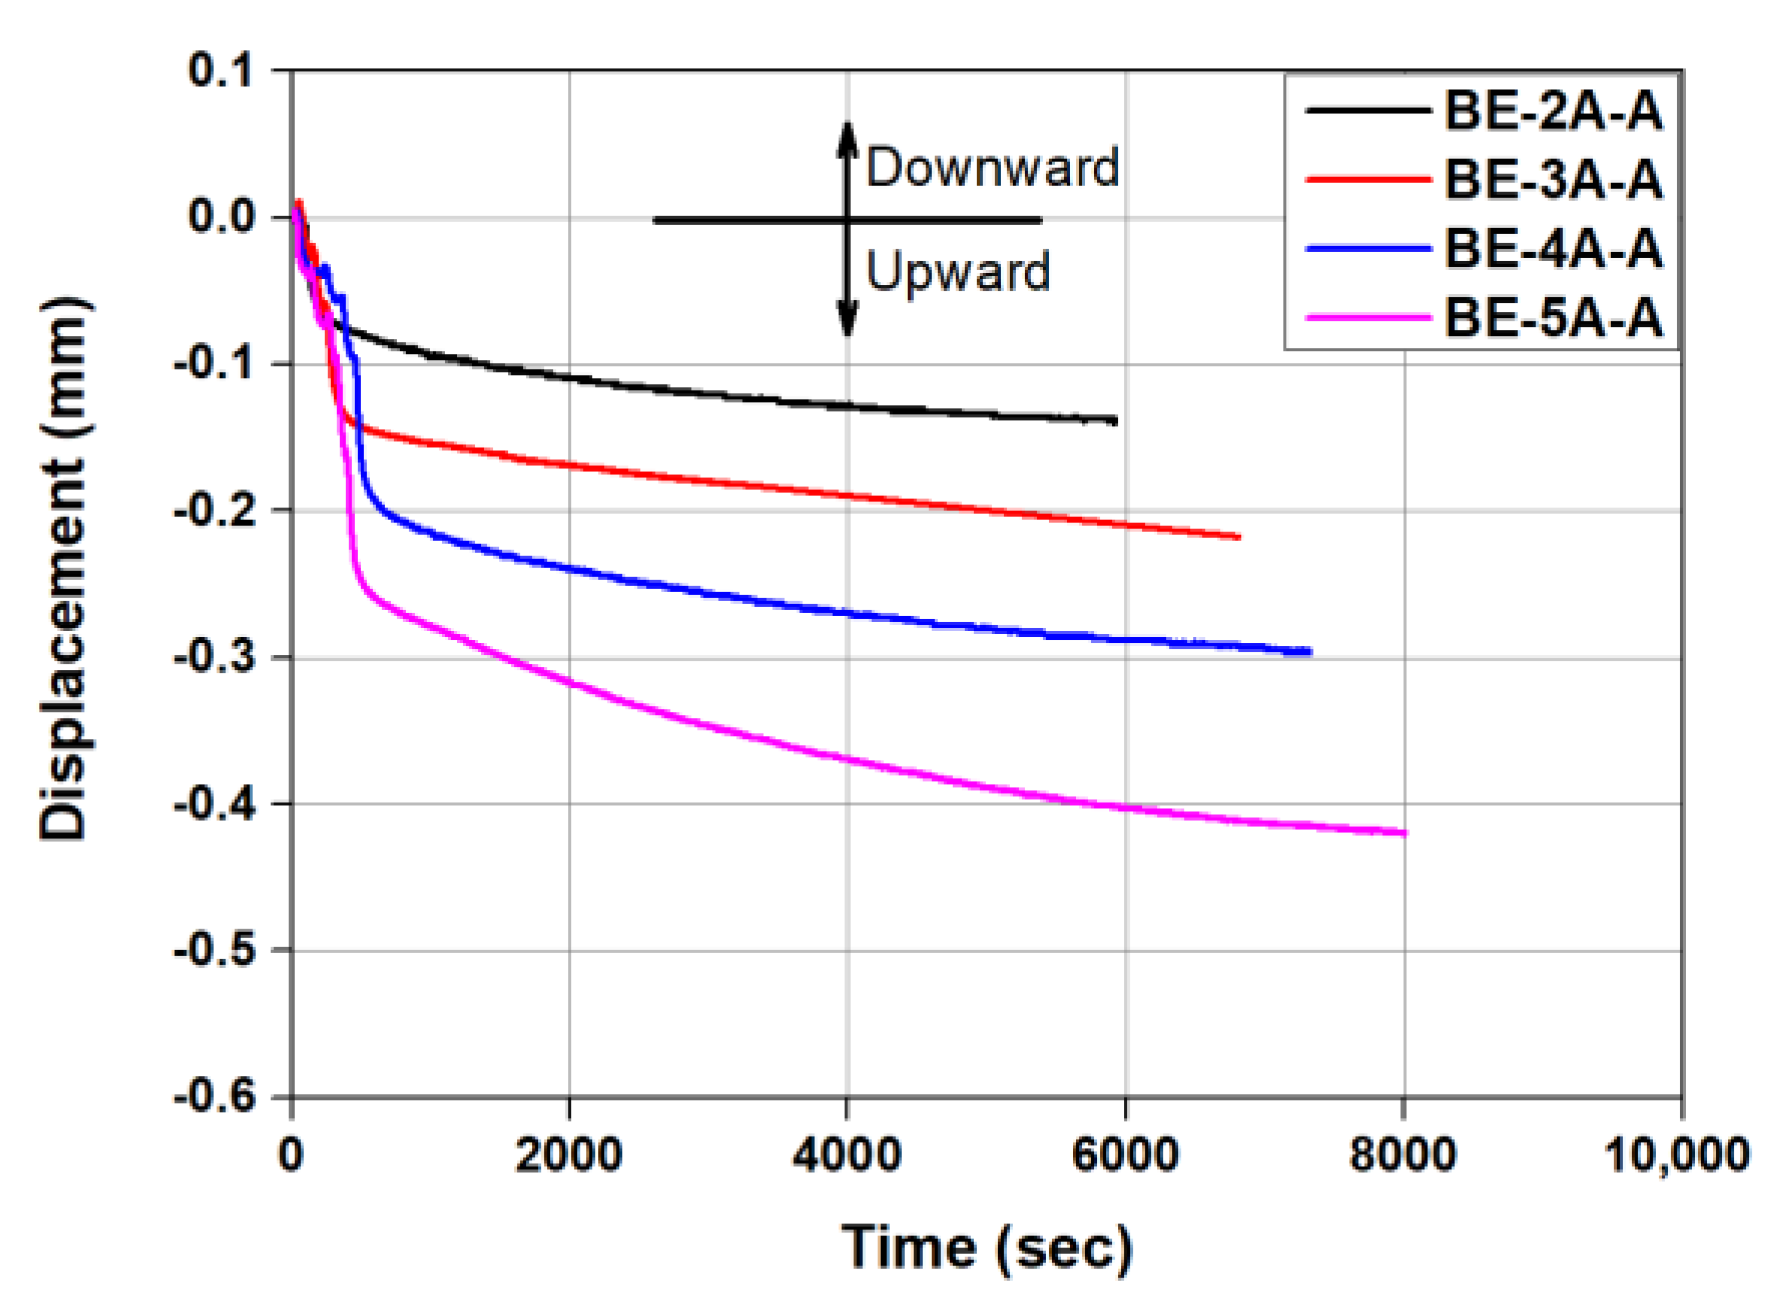
3.1. Activation of the Fe-SMA Rebars
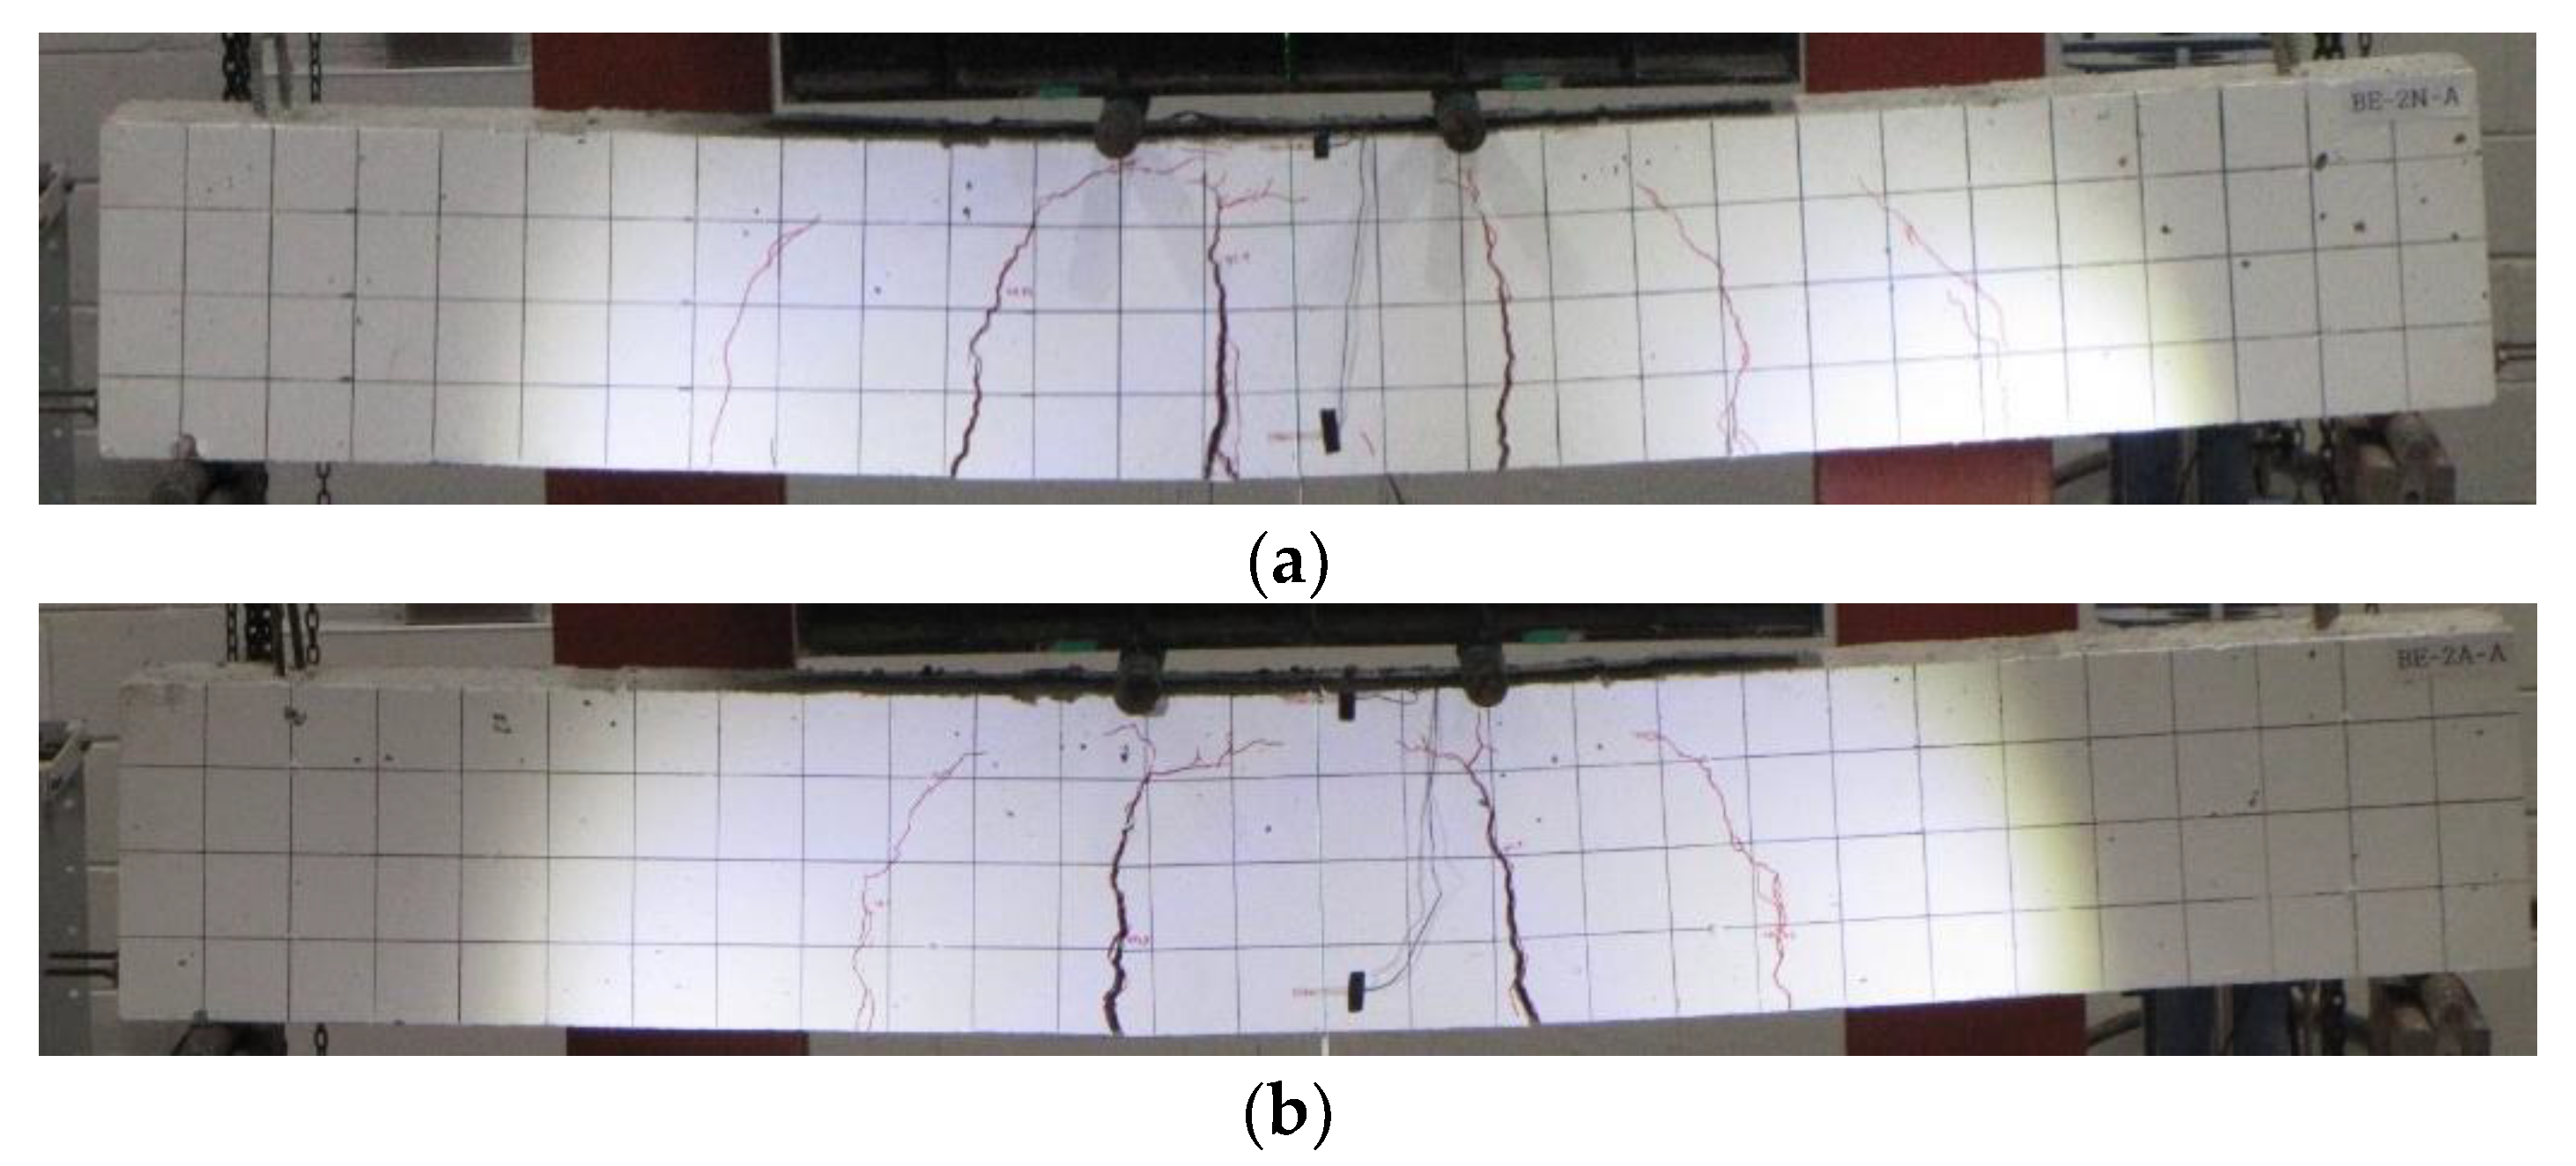
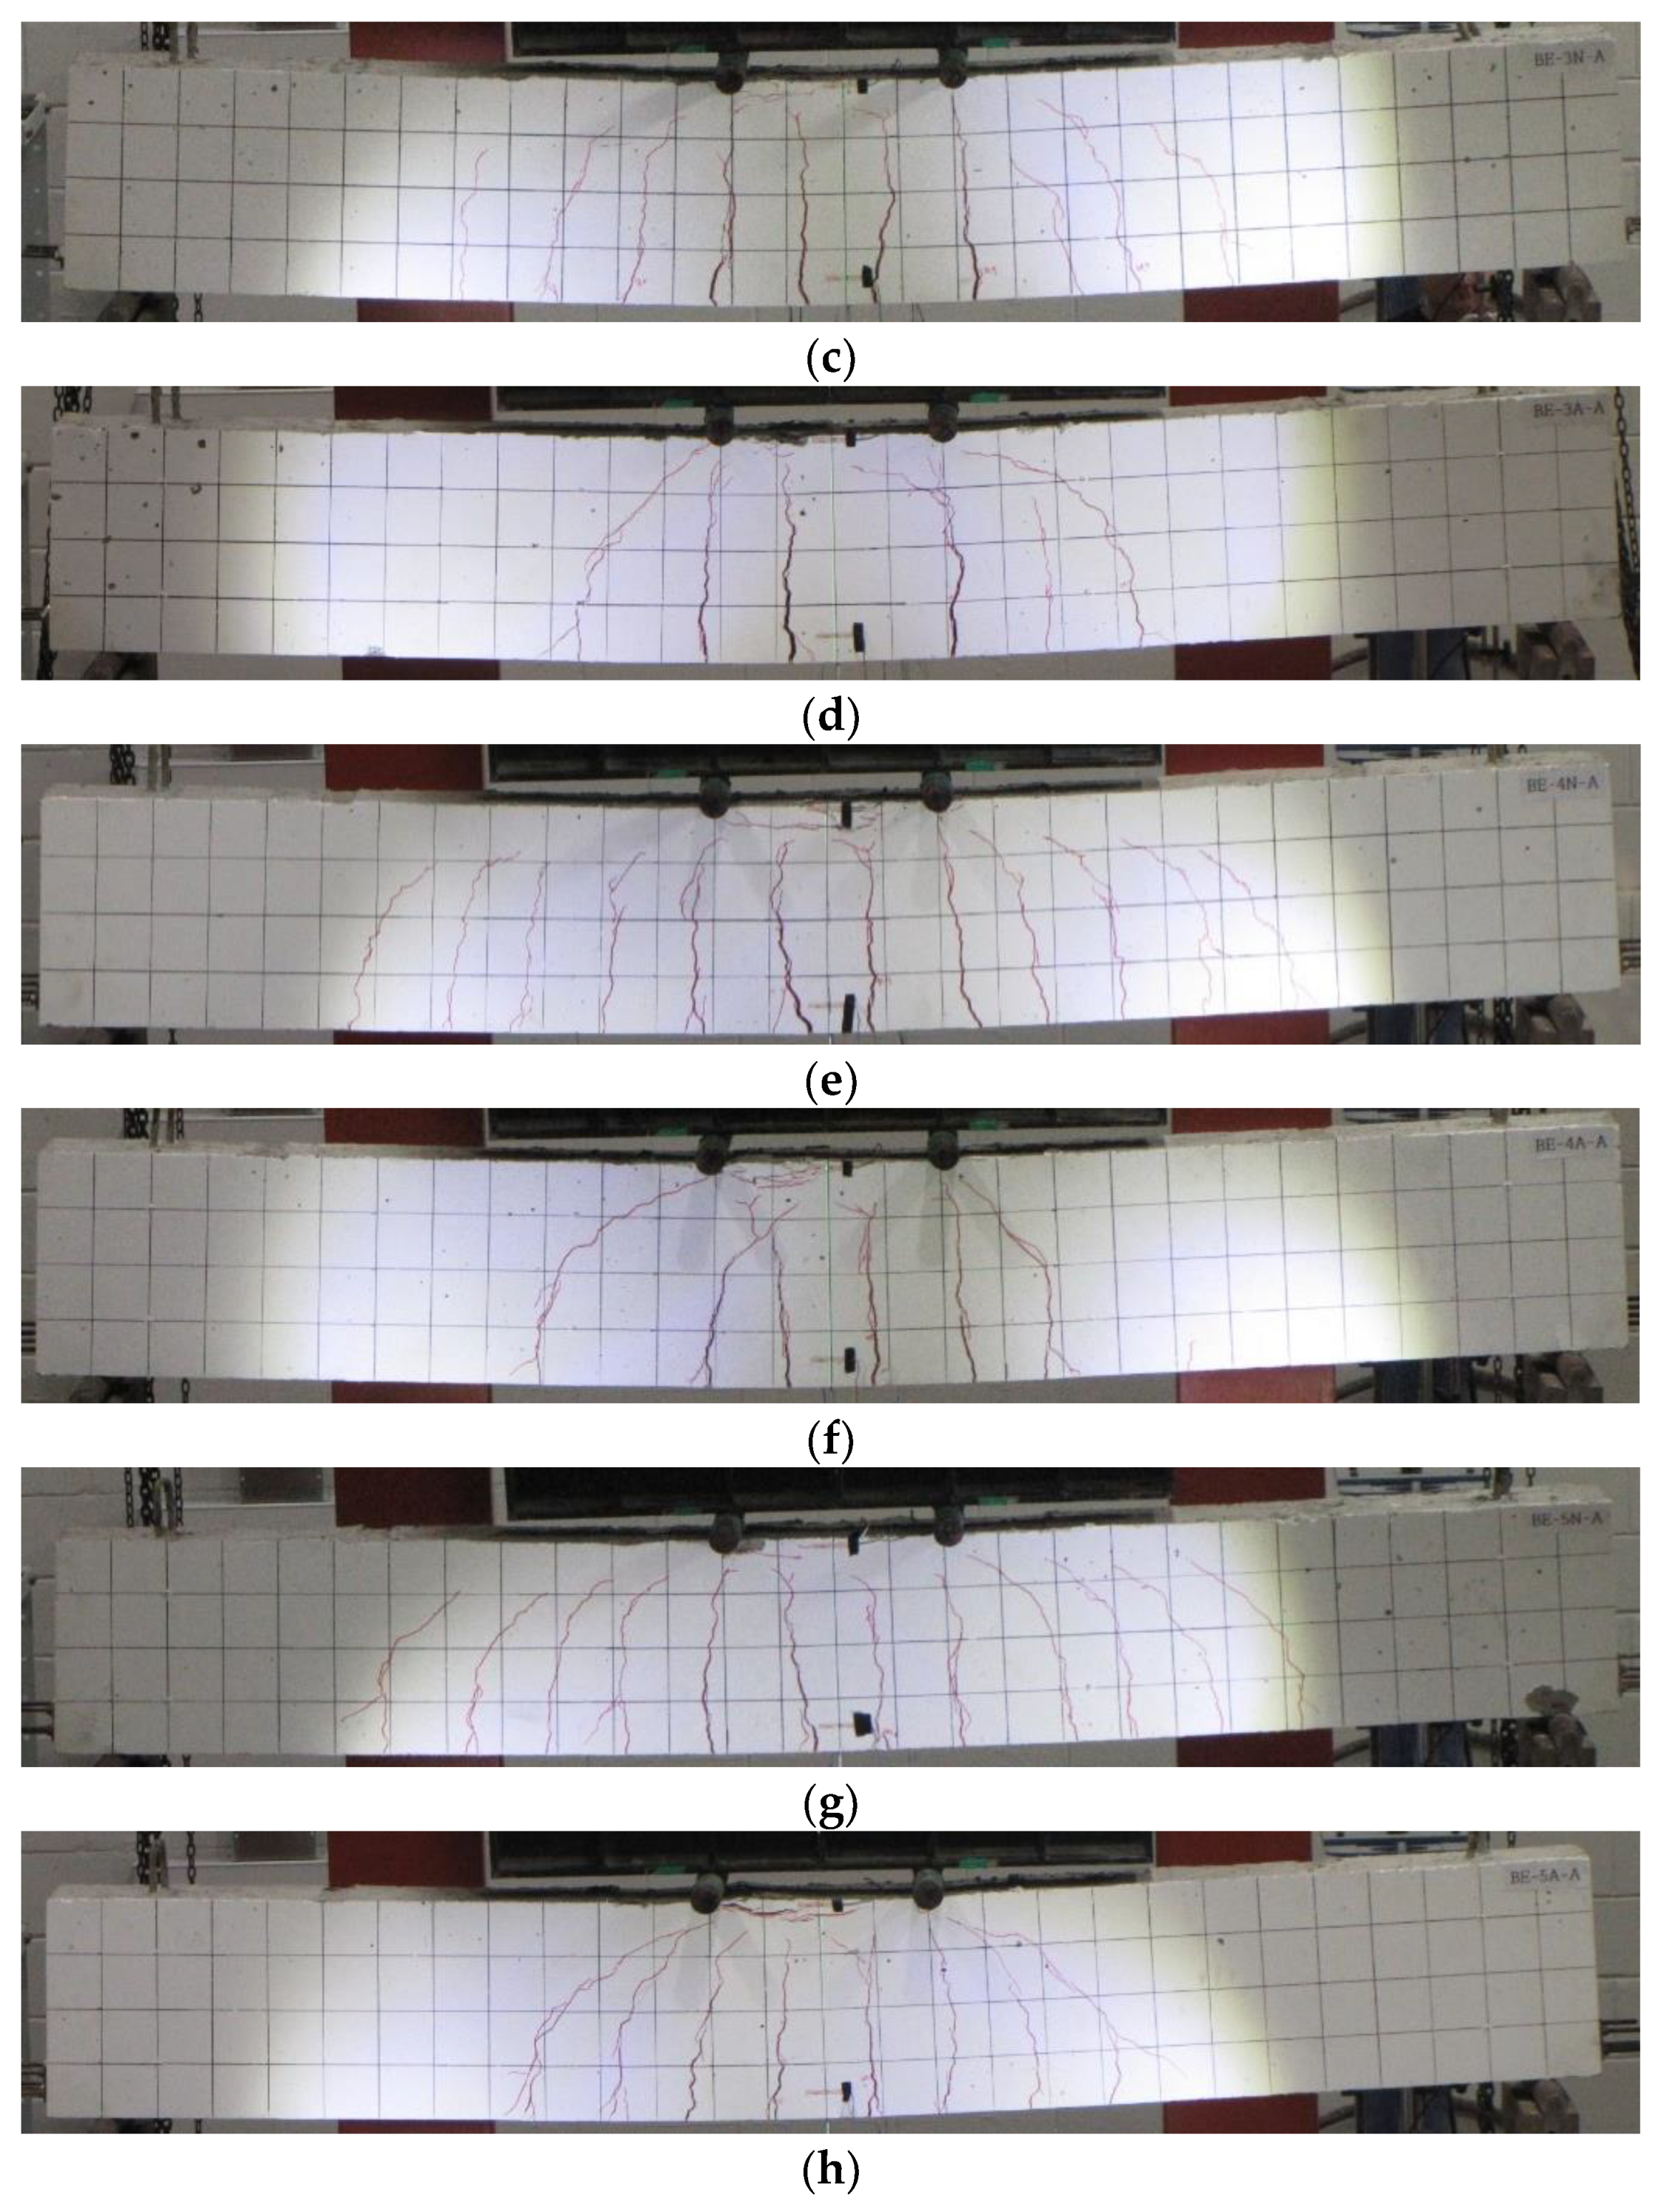
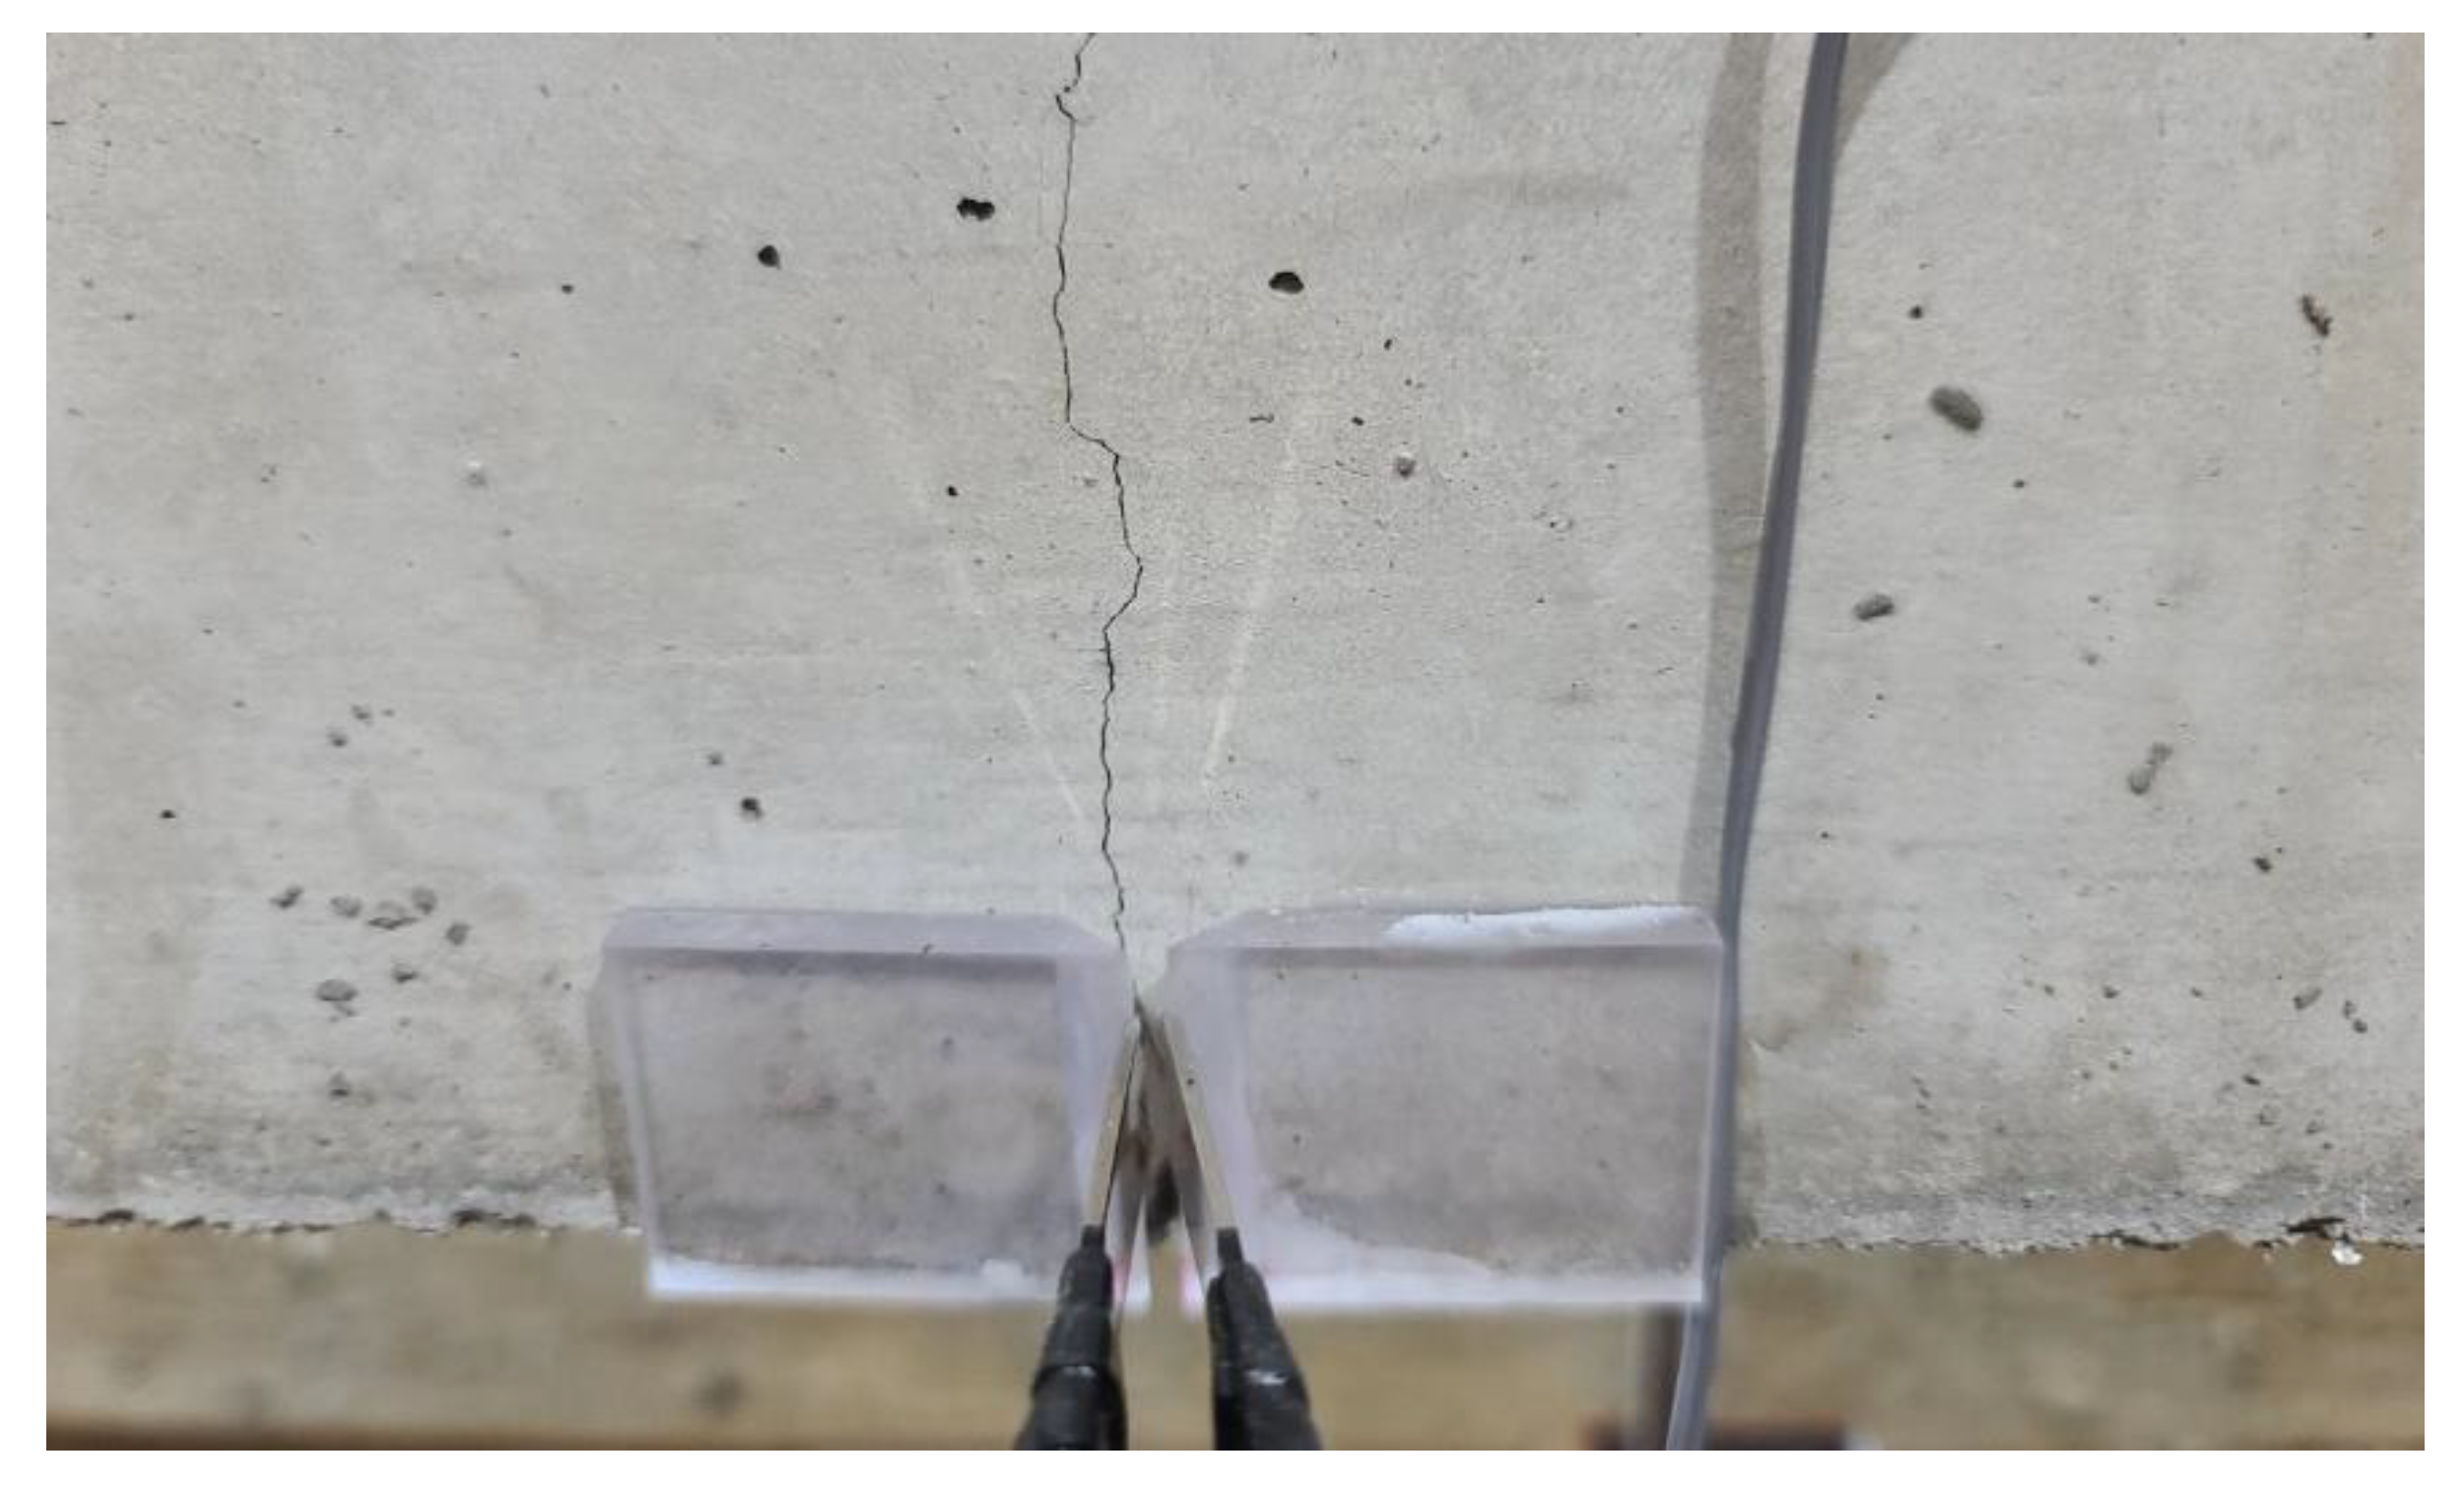
3.2. Failure Mode
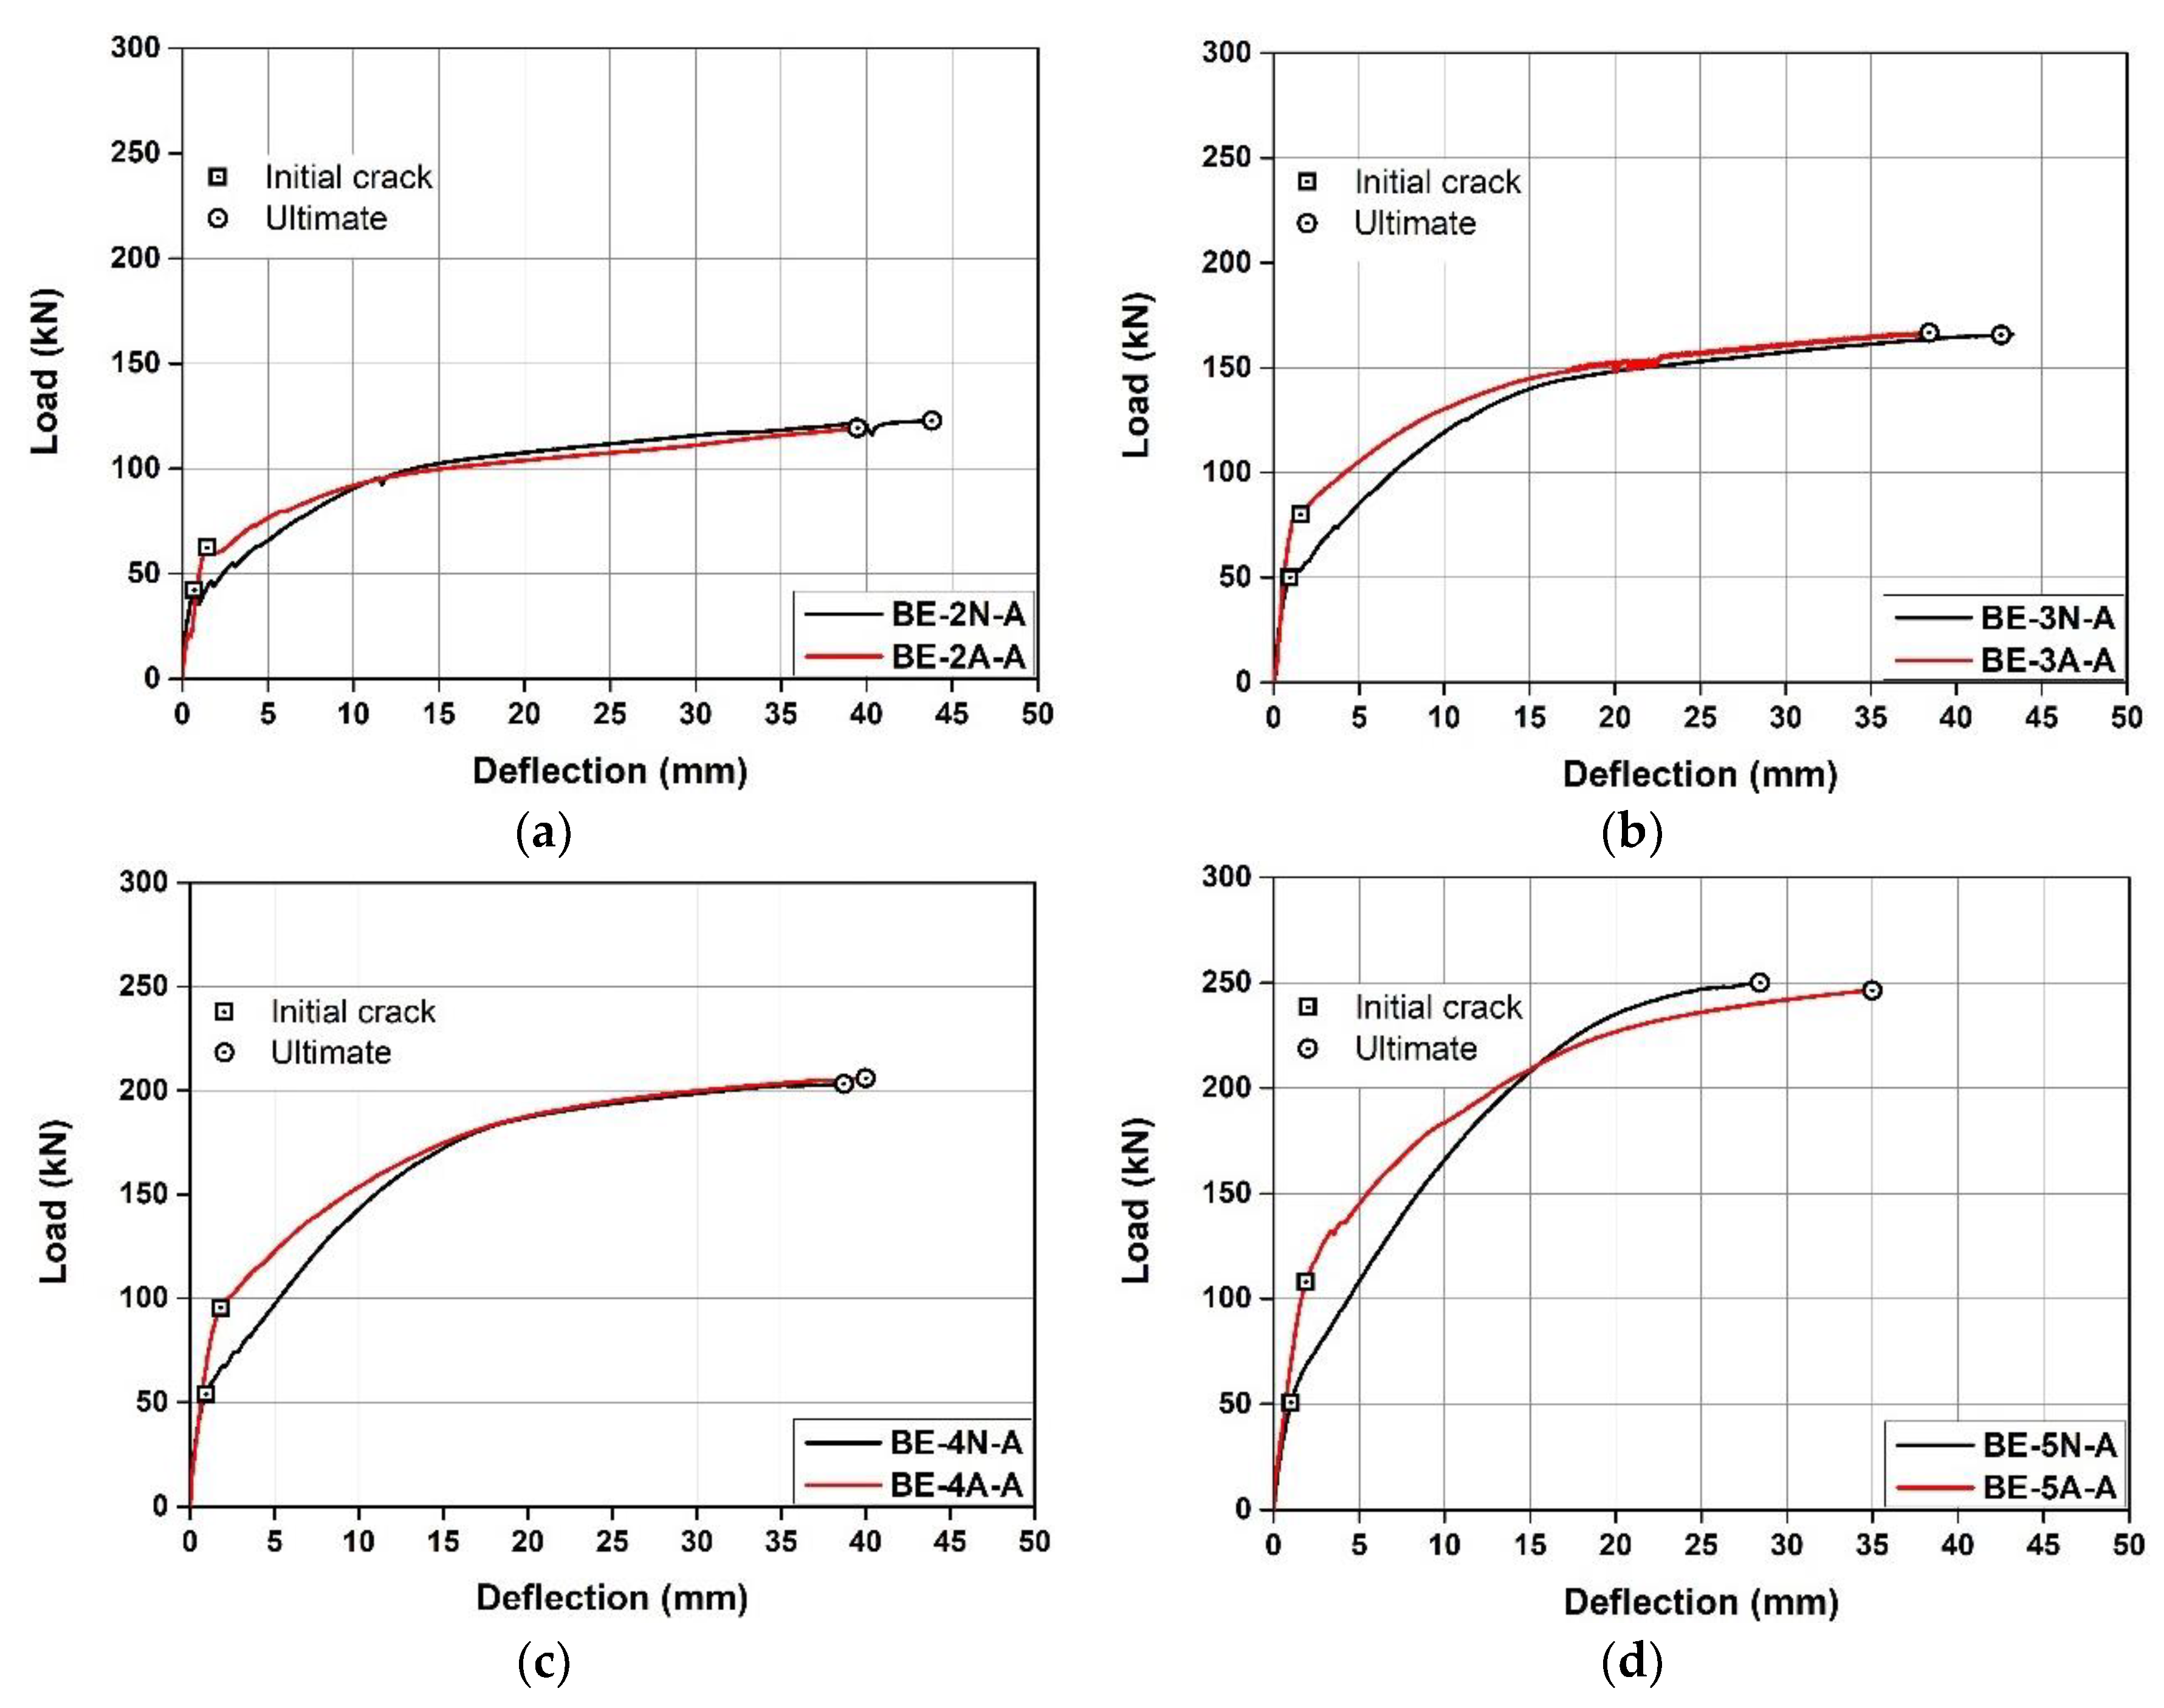
3.3. Load–Deflection Relationships
3.3.1. Effect of Fe-SMA Activation
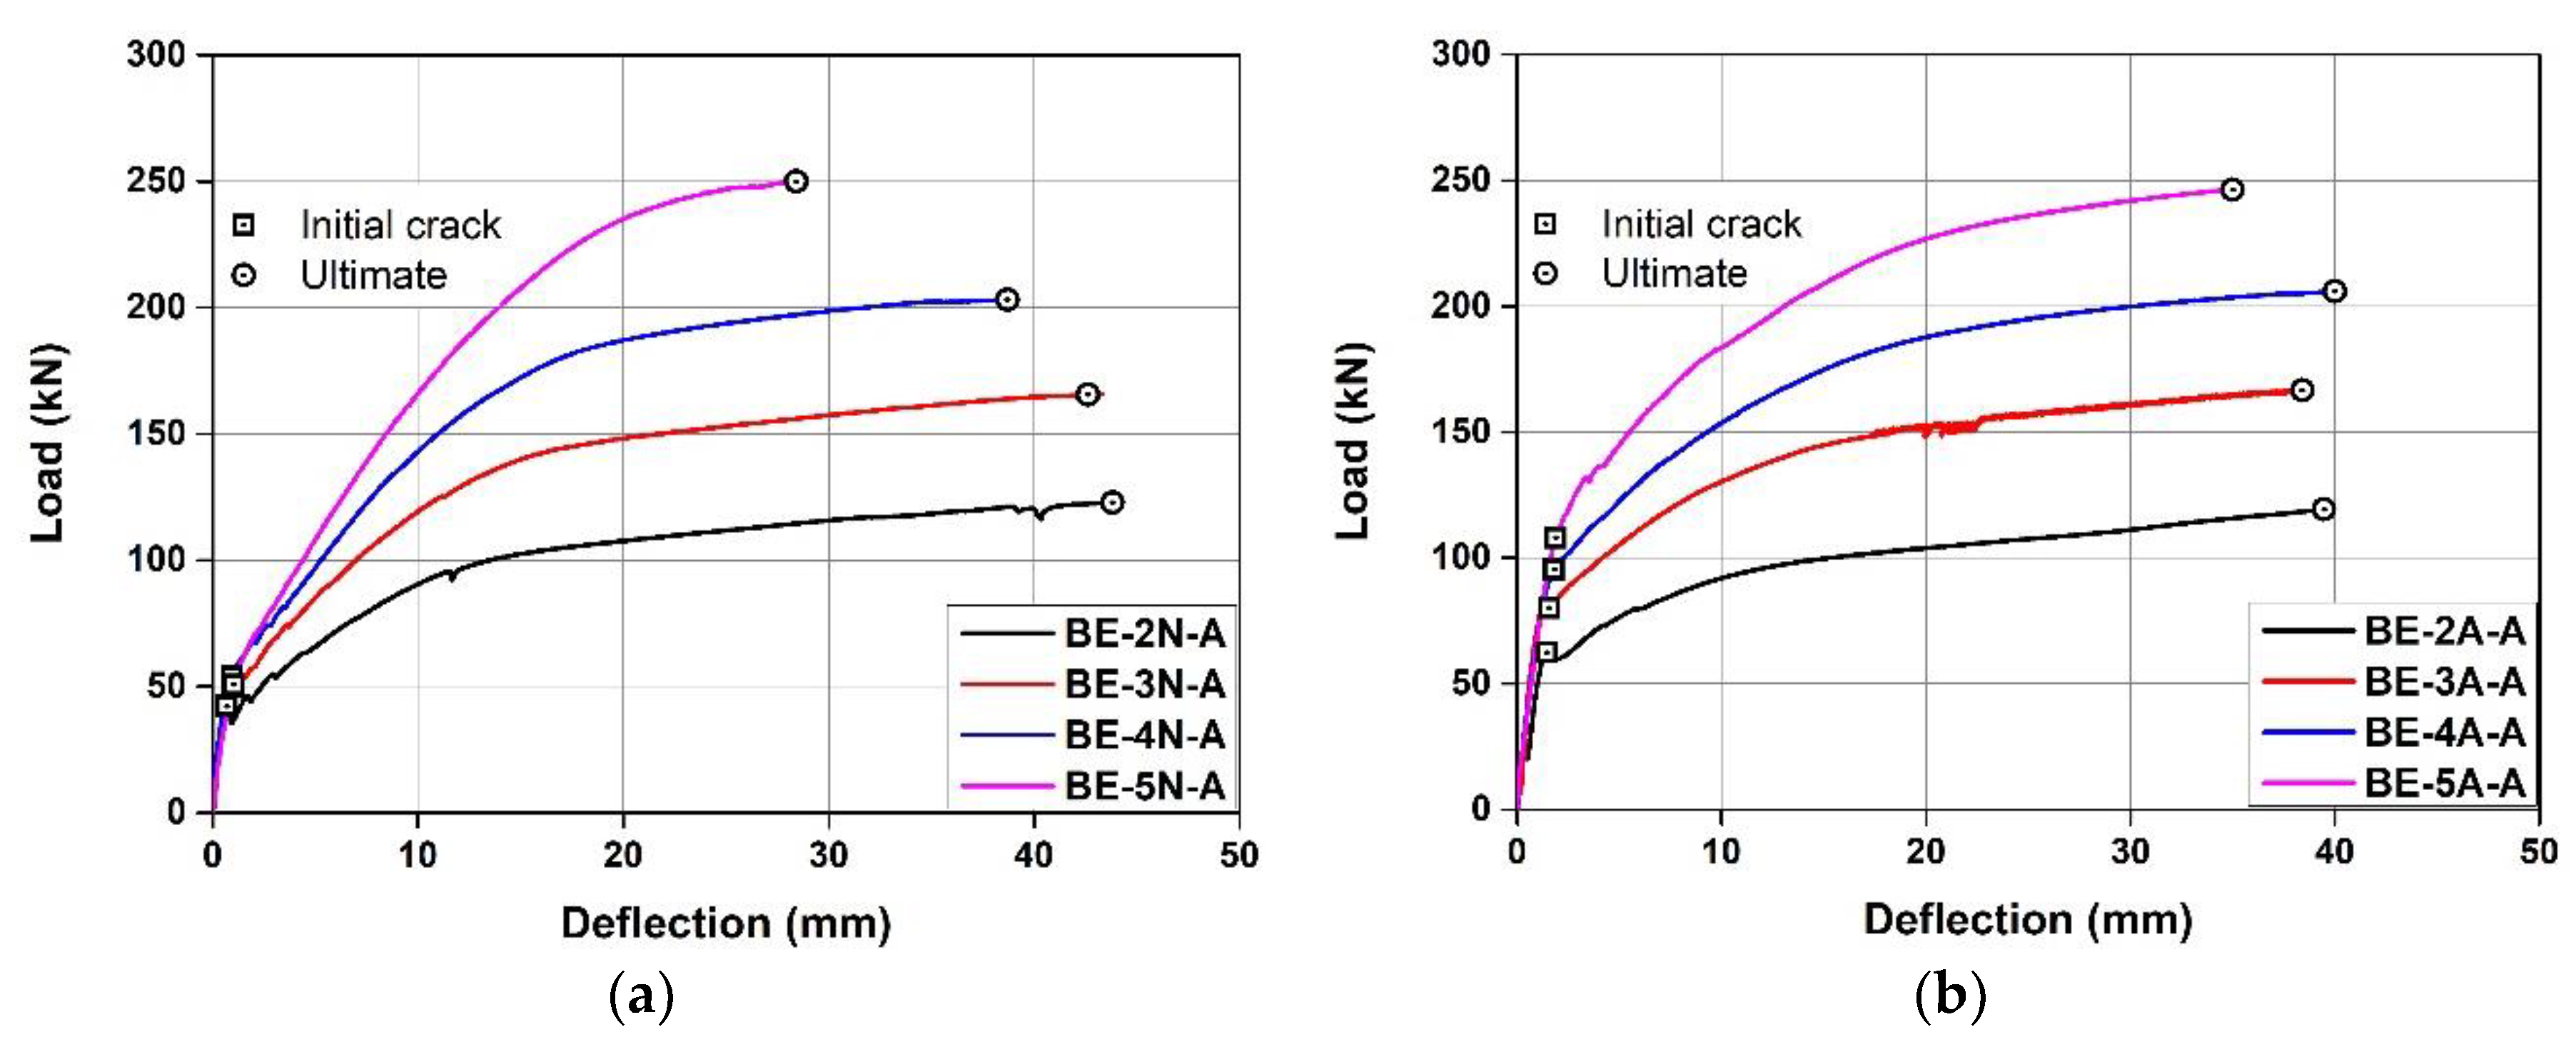
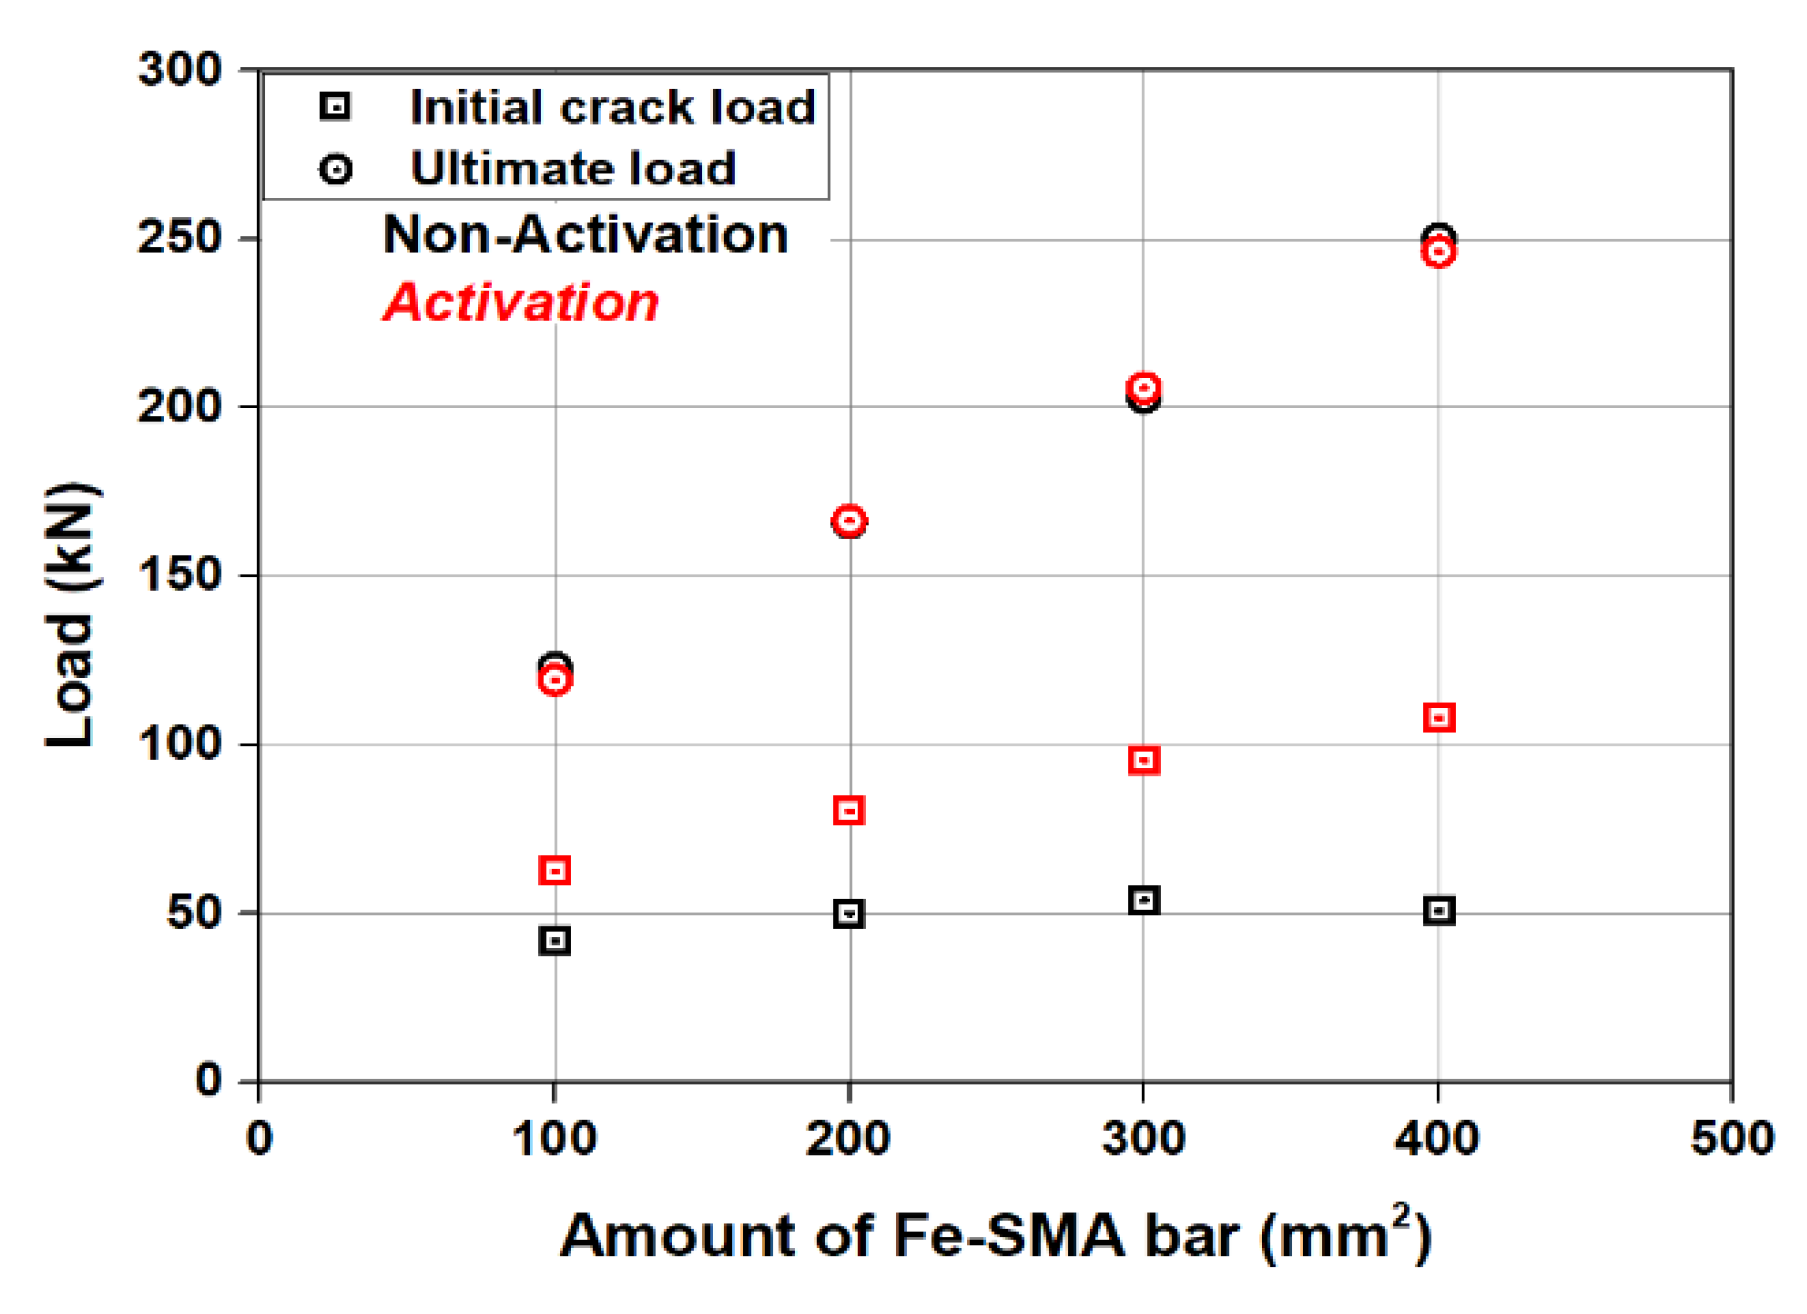
3.3.2. Effect of Fe-SMA Areas
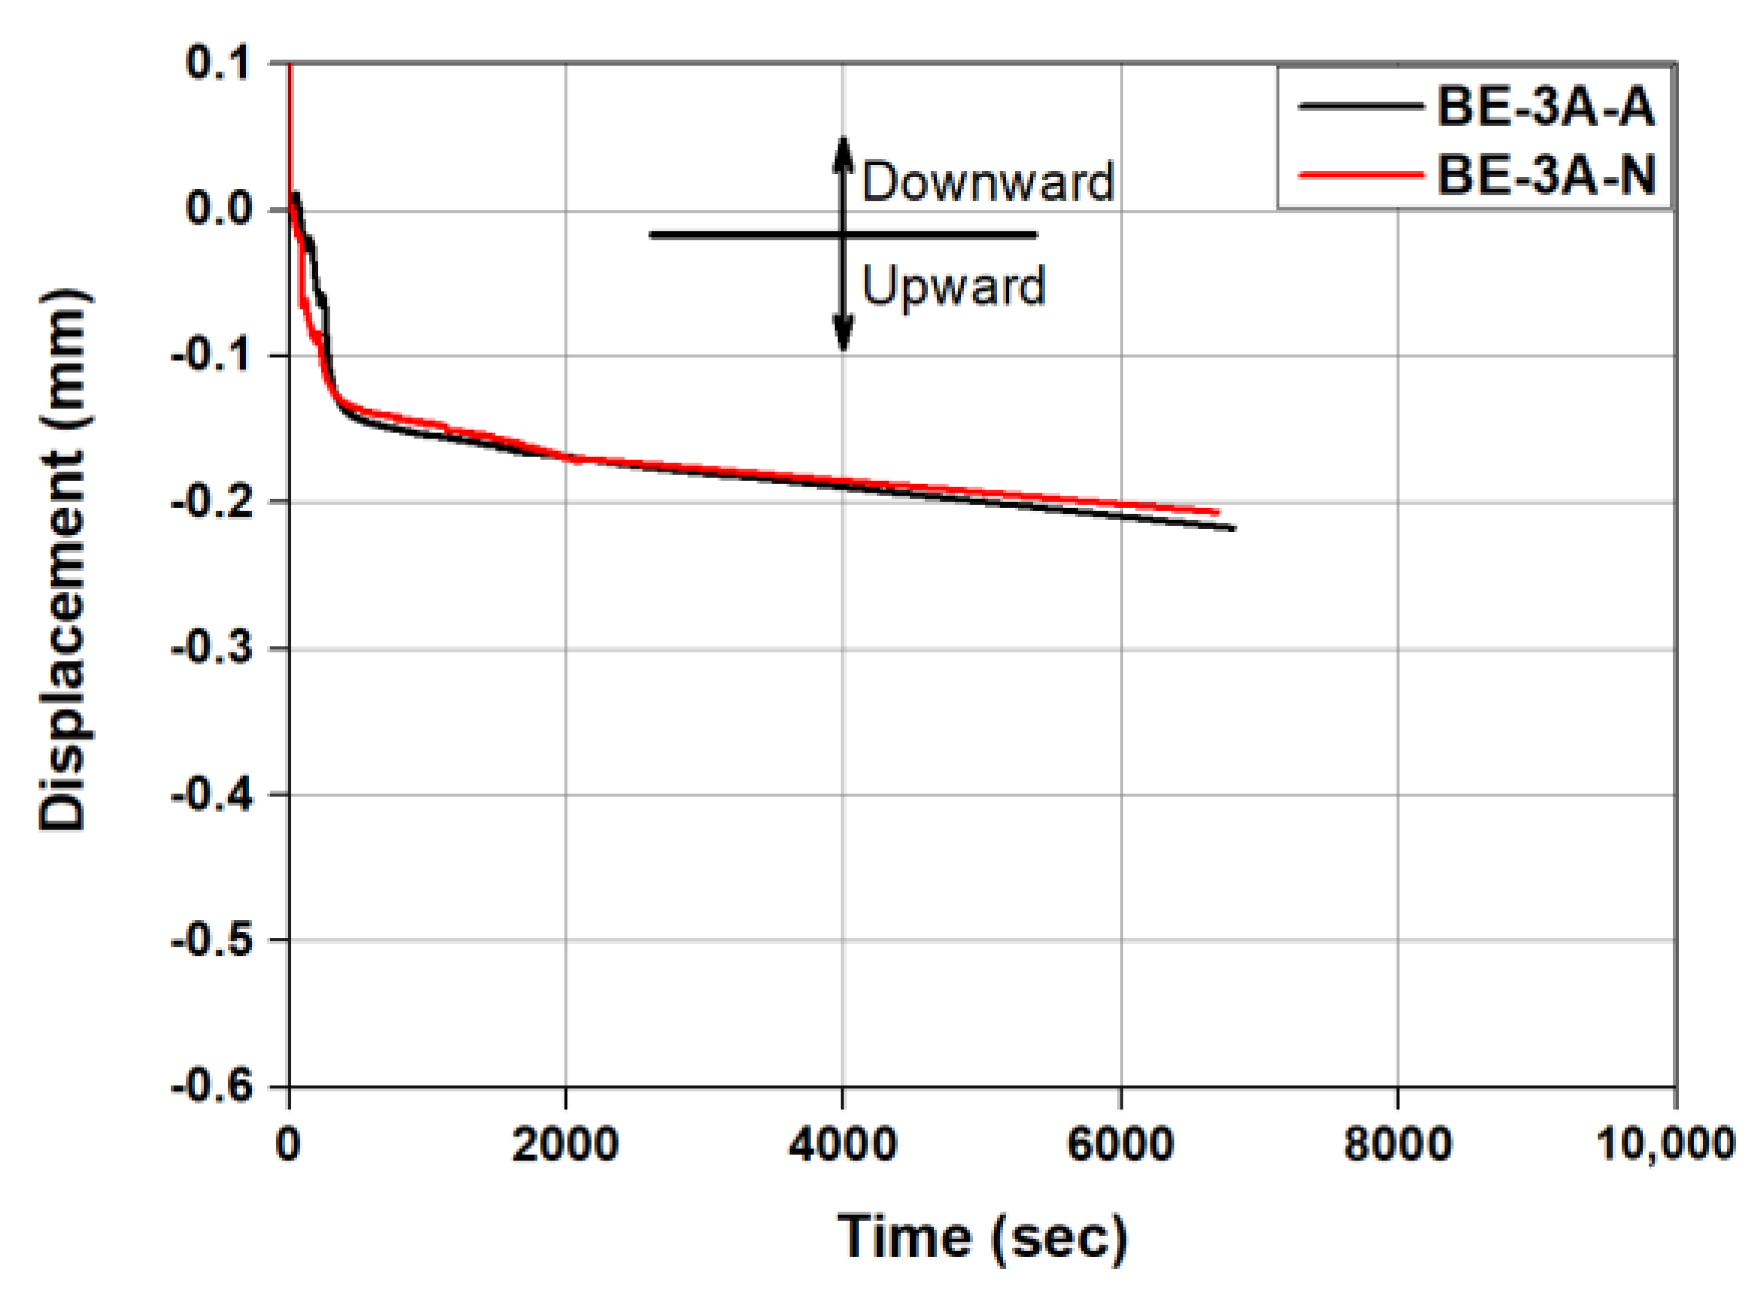
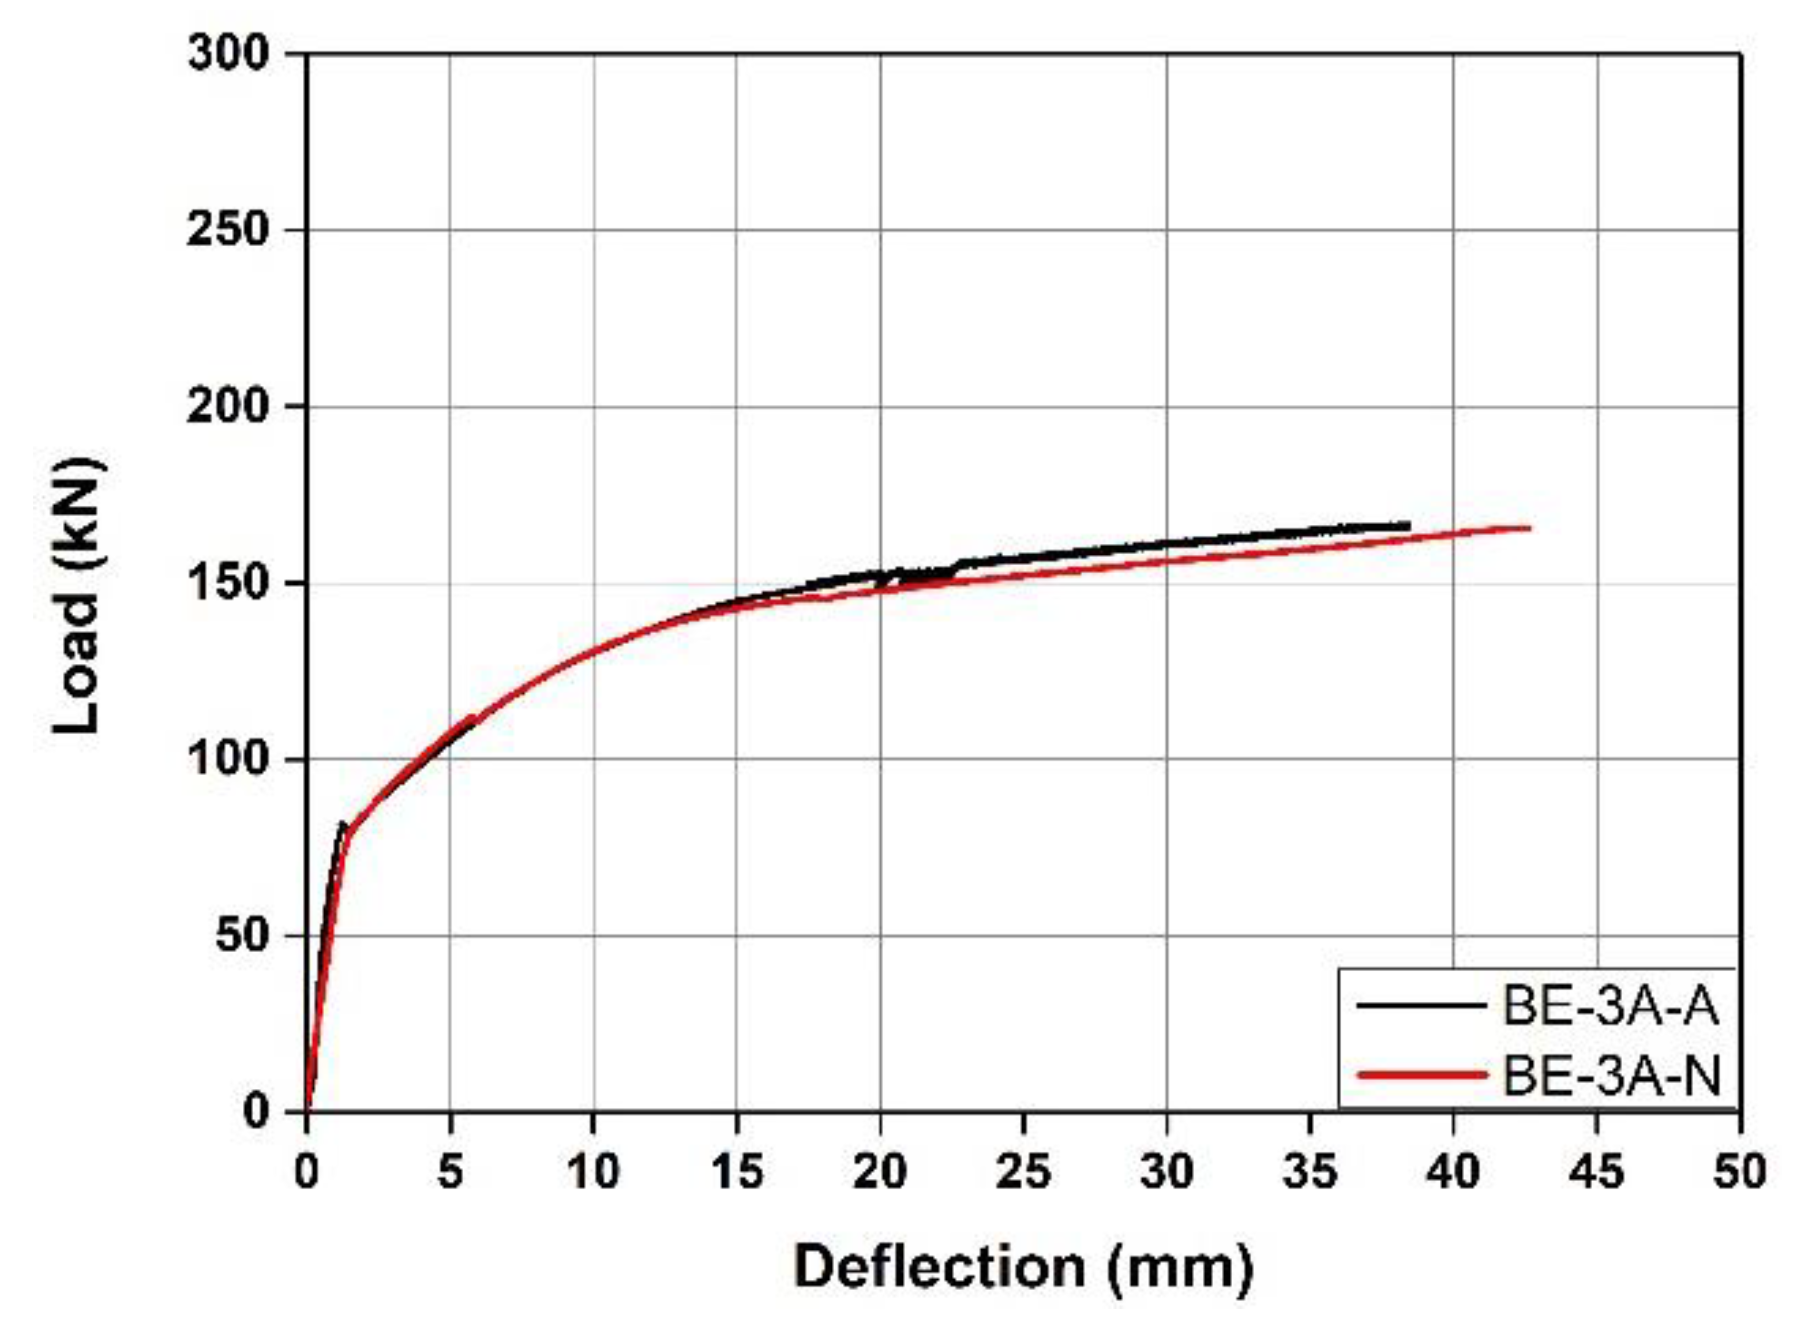
3.3.3. Effect of Anchoring Fe-SMA Rebars
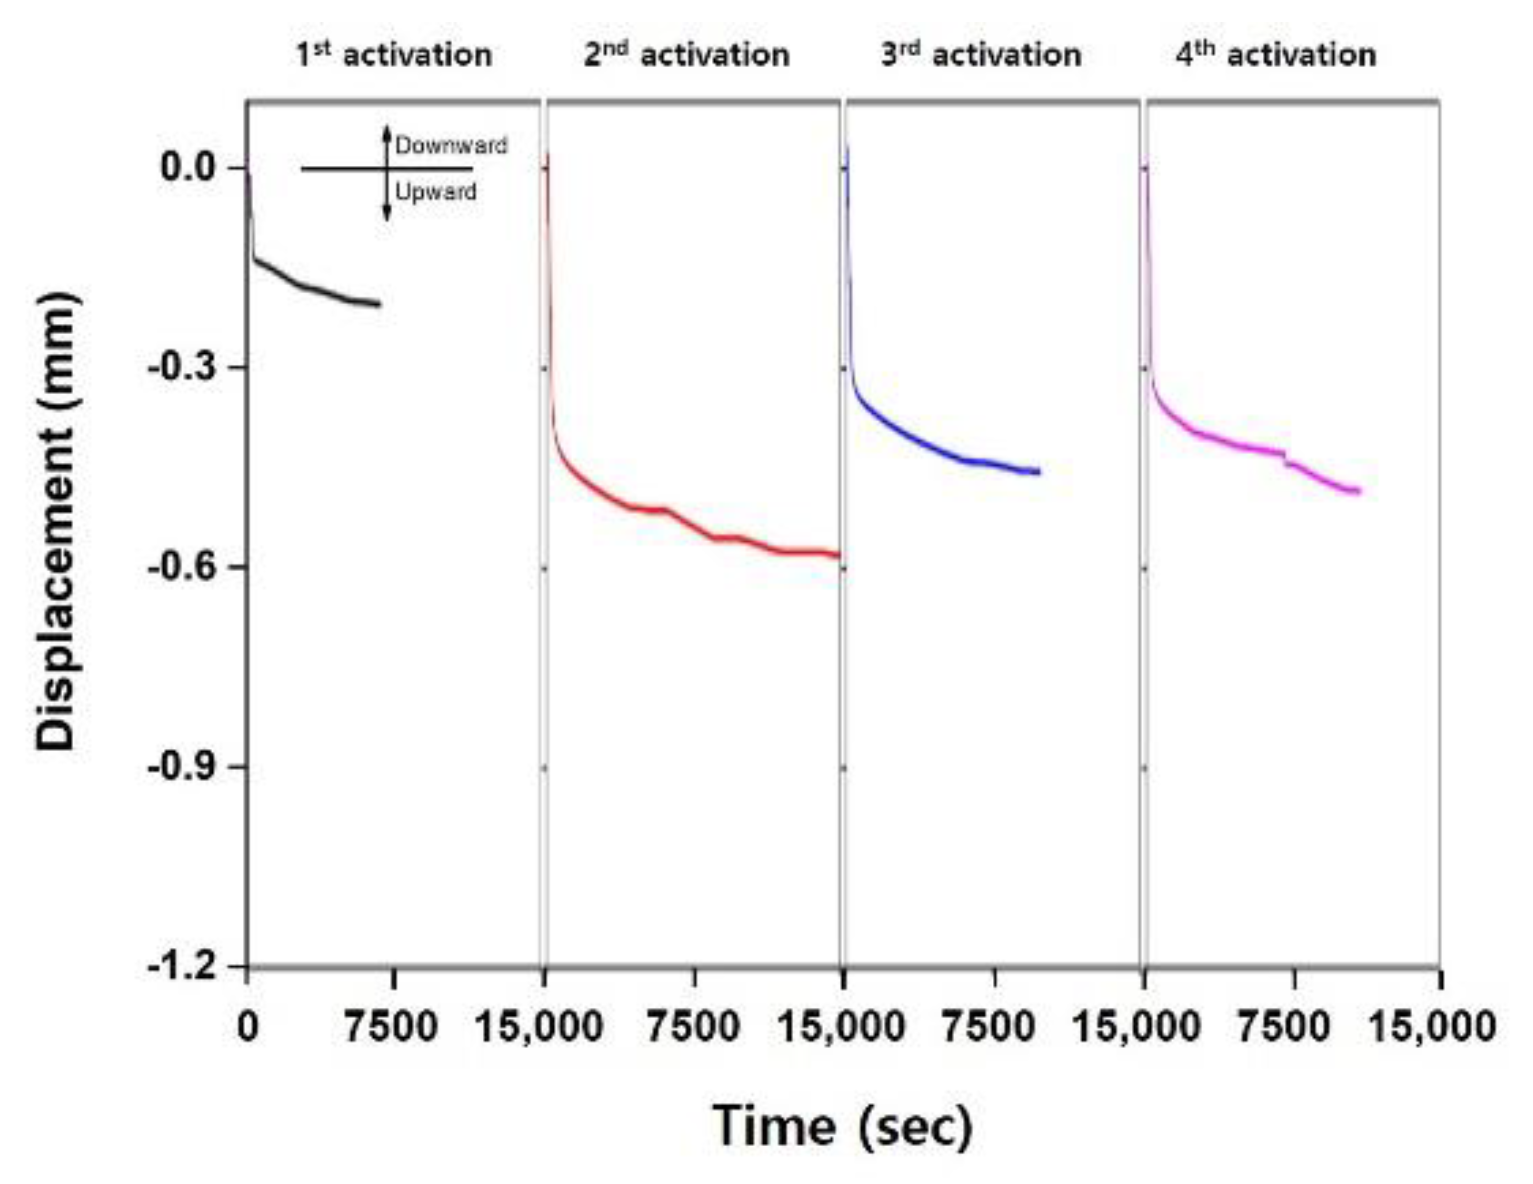
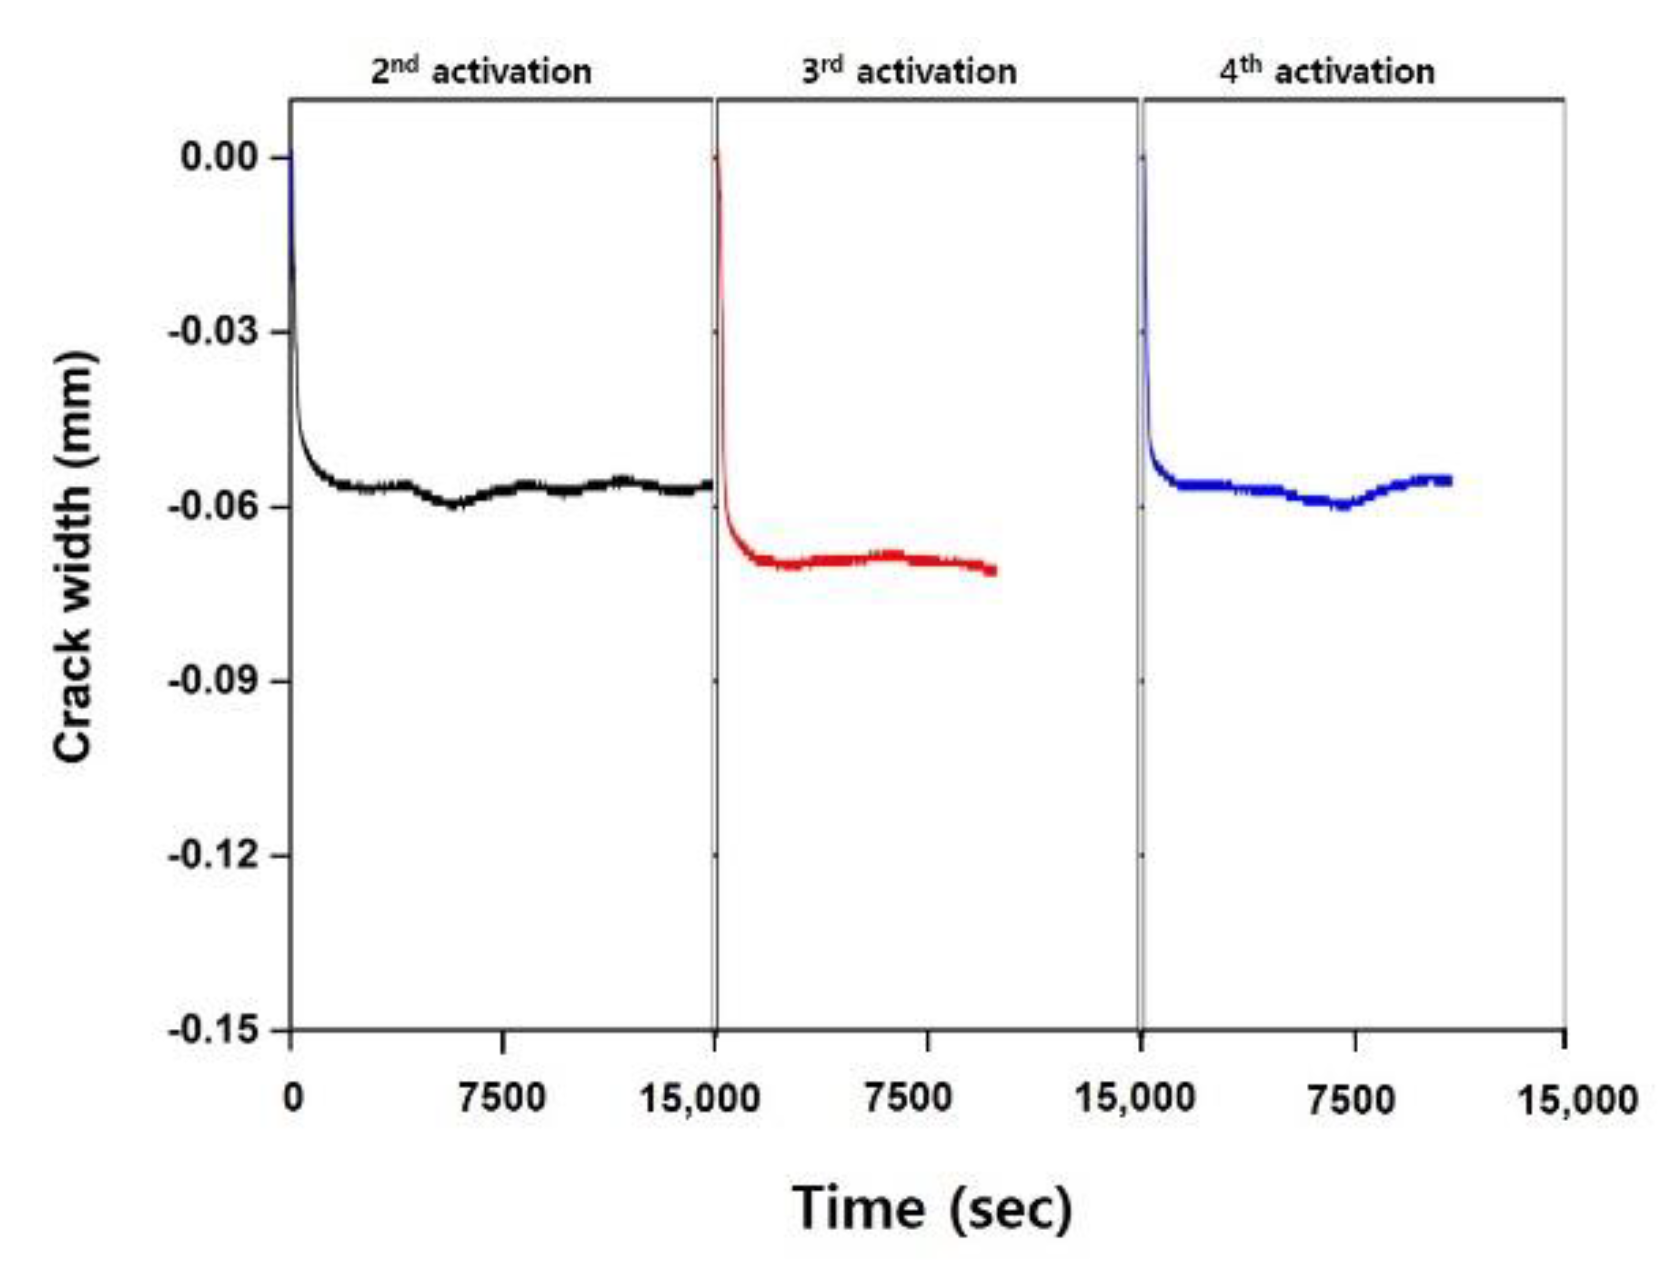
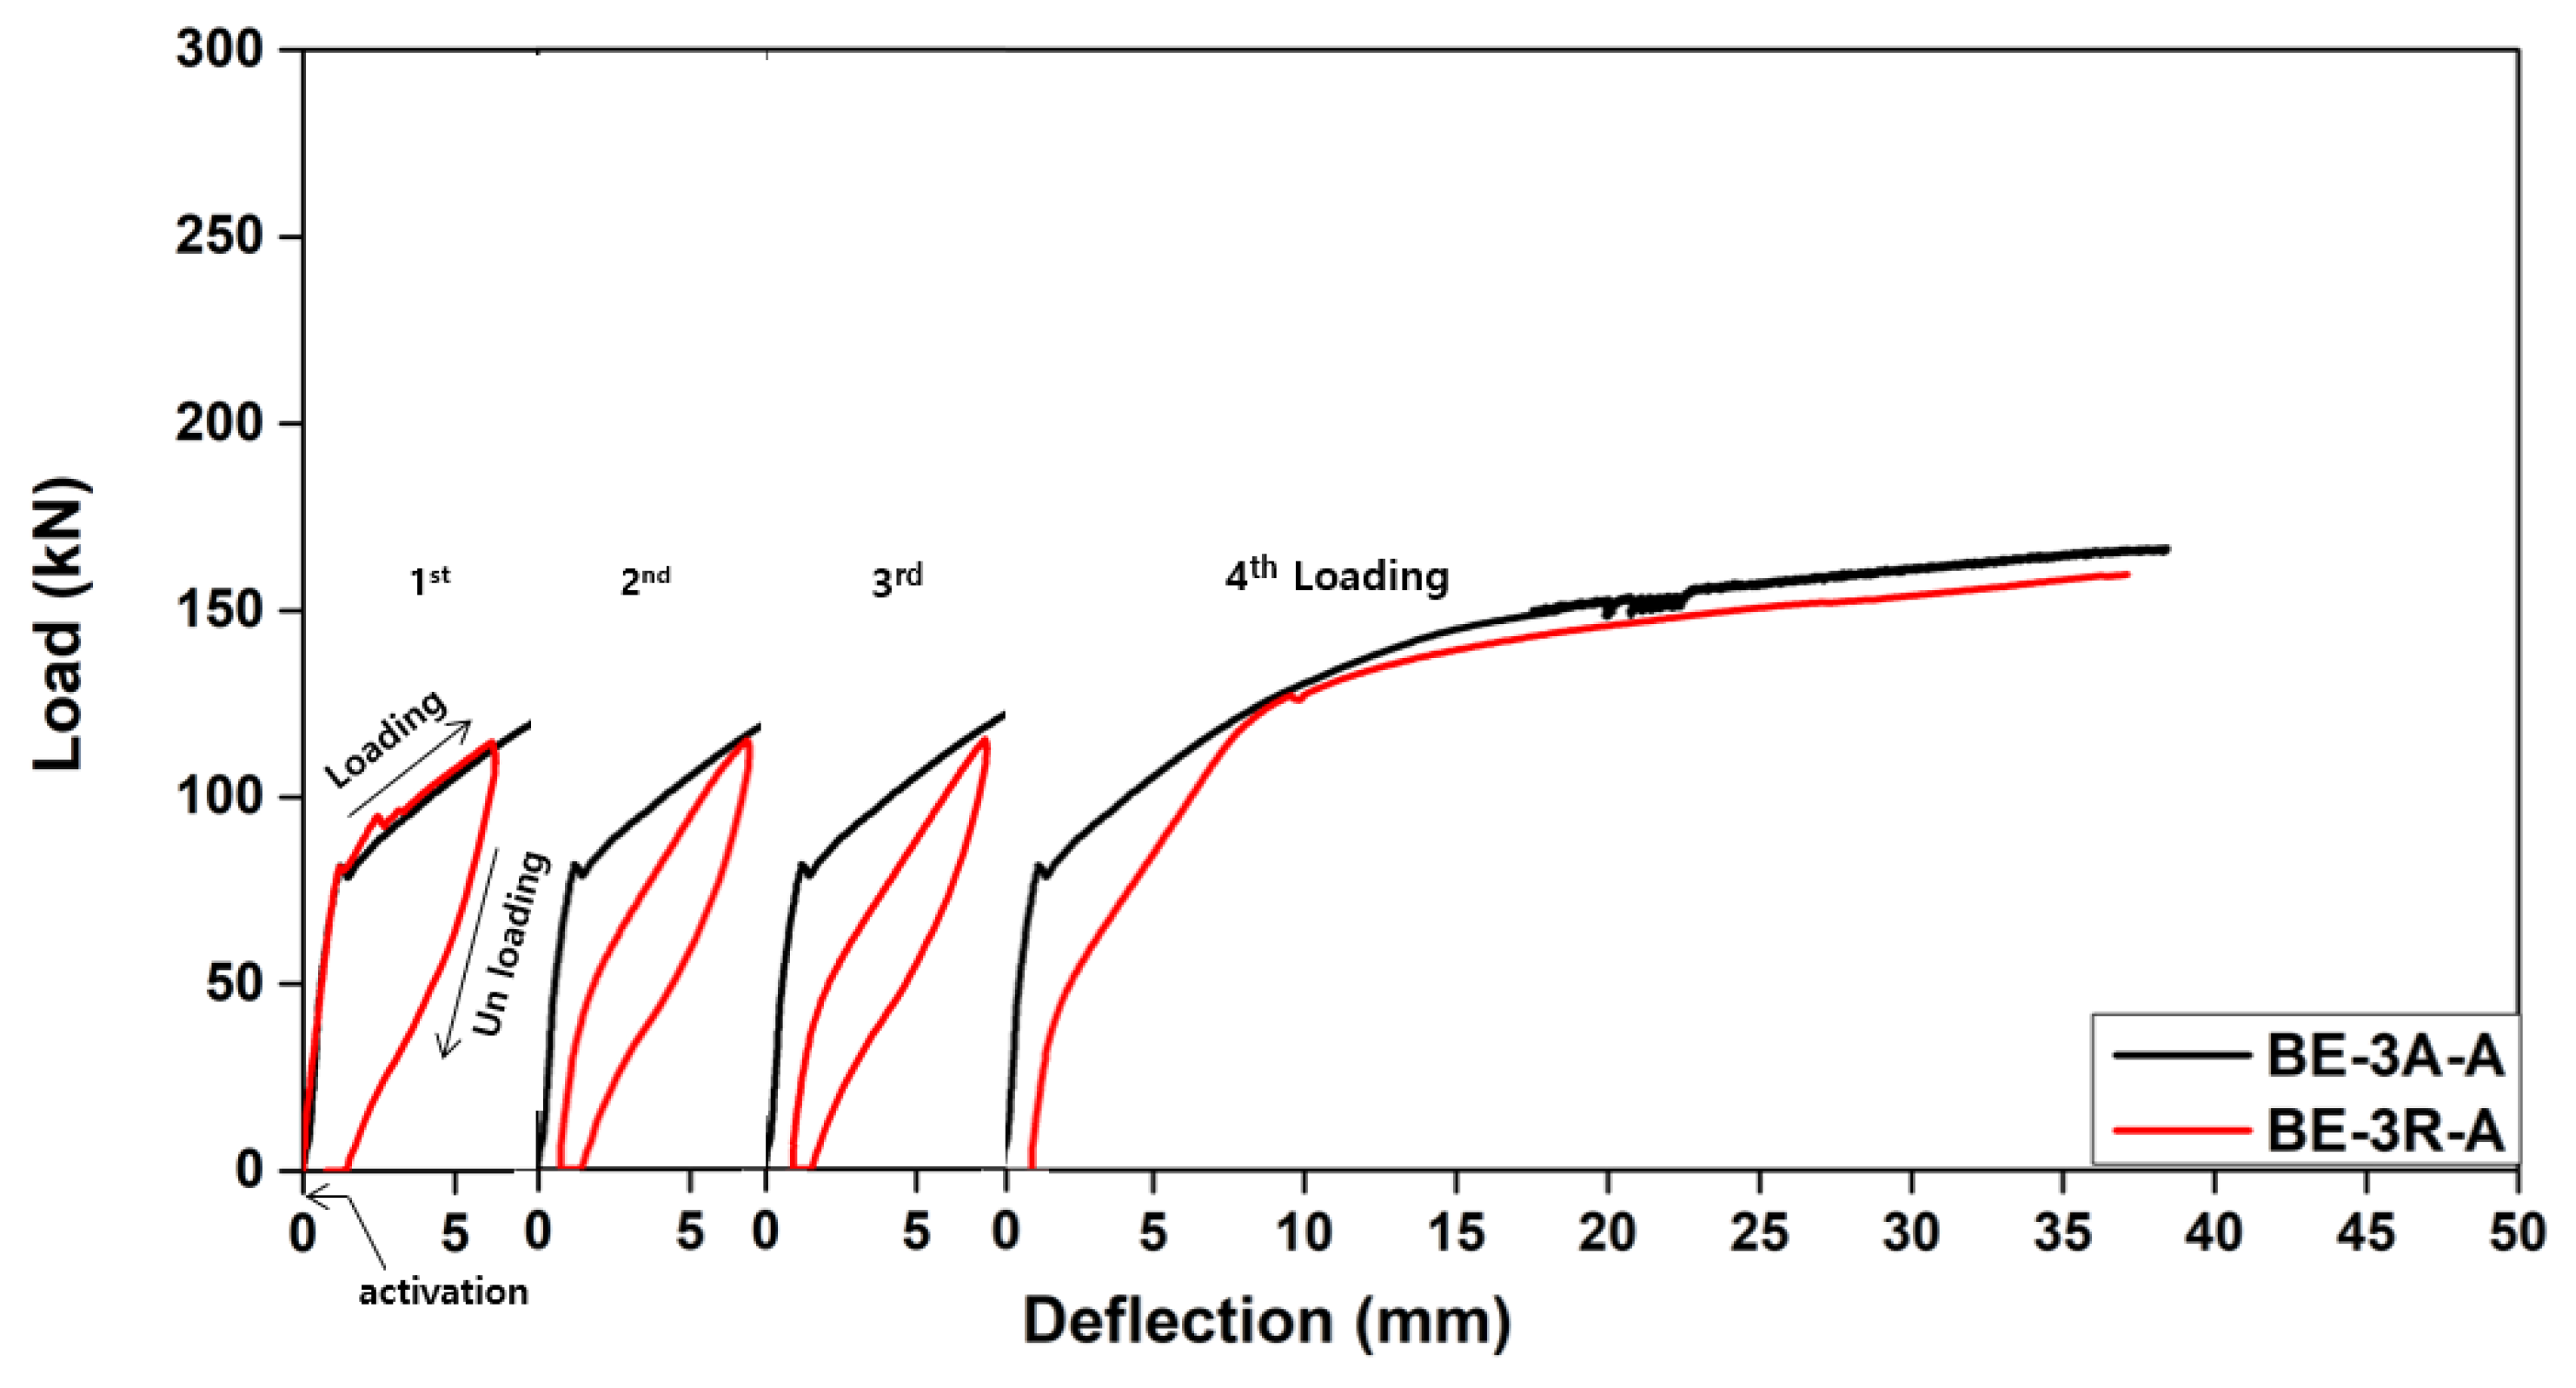
3.3.4. Effect of Reactivating Fe-SMA Rebars
4. Conclusions
- When the Fe-SMA rebars were activated, downward deflections due to initial thermal expansion occurred, but cambers occurred due to the recovery stress of the Fe-SMA rebars. When the area of the Fe-SMA rebars was increased by 100 mm2, the camber increased by 0.093 mm on average.
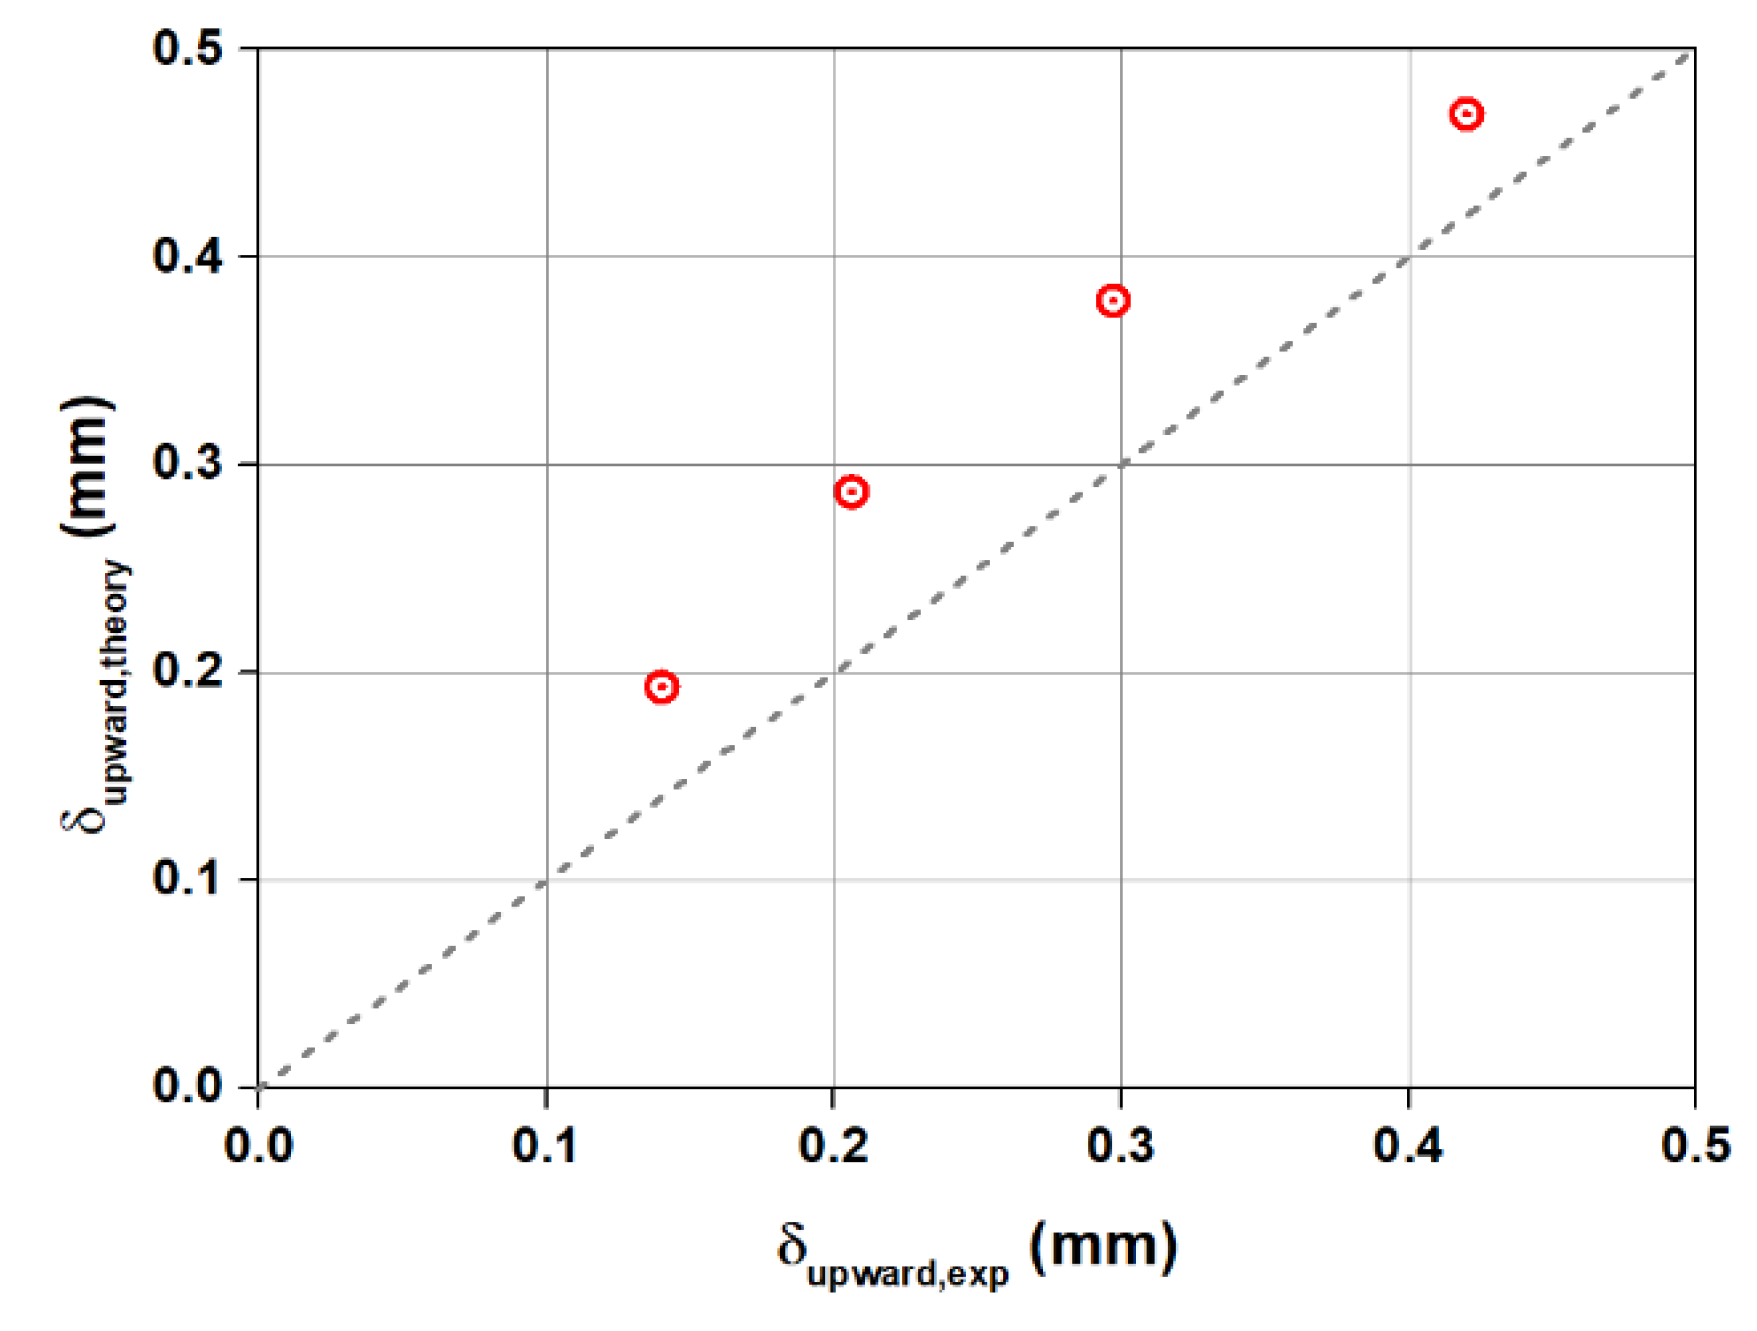
- The theoretically calculated camber of the concrete beam specimen by the activation of the Fe-SMA rebars was 22% lower than that from experimental test. This is because the heat of hydration activated the embedded Fe-SMA bars inside the concrete member. Thus, controlling the heat of hydration should be considered for casting a concrete member using Fe-SMA rebar as tensile reinforcement.
- The initial cracking loads of the beam specimens with the activated Fe-SMA rebars were 47.6% to 112.8% higher than those of the nonactivated case. The increased initial crack loads were due to the introduction of the compressive force generated by the recovery stress of the Fe-SMA rebars. At the ultimate loads, the load differences were below 3%, depending on whether the Fe-SMA rebars were activated.
- Using an anchoring device to prevent slippage of the Fe-SMA rebars slightly improved the camber and increased the flexural strength of the beam specimens by less than 2%. Thus, the bonding strength at the interface between the concrete and Fe-SMA rebars is sufficient to resist the slippage of the Fe-SMA rebars in the concrete beam members.
- When the Fe-SMA bars were reactivated after applying 70% of the ultimate load, the deflection generated in the beam specimens was recovered by 0.456 mm ~ 0.581 mm, and the crack widths were recovered by 0.060 mm ~ 0.071 mm. Thus, the prestressed concrete using Fe-SMA rebars is expected to improve usability by recovering the lost prestressing force through reactivations even if the prestressing force is reduced due to various causes.
- After four times of activation, it was confirmed that the load–displacement curves from the beam specimen with the rebars only activated once and the beam specimen with four-times-activated rebars were similar. In addition, the ultimate loads of the beam specimens with the reactivated rebars showed slight differences of only 4.3% compared to those of the beam specimen with the rebars activated four times. Therefore, it is noted that repeated activations on the Fe-SMA rebars may not substantially affect the flexural strength of the beam specimens.
- As a result of the study, the prestressed concrete using Fe-SMA rebars is expected to be an alternative option that can solve various problems of the conventional prestressed concrete.
Author Contributions
Funding
Acknowledgments
Conflicts of Interest
References
- Afroughsabet, V.; Ozbakkaloglu, T. Mechanical and durability properties of high-strength concrete containing steel and polypropylene fibers. Constr. Build. Mater. 2015, 94, 73–82. [Google Scholar] [CrossRef]
- Park, S.-G. Shear Strengthening Effect of Damaged Reinforced Concrete Beams Using Externally Post-Tensioning Steel Rods. Master’s Thesis, Kyungpook National University, Kyungpook, Korea, 2018. [Google Scholar]
- Ahmed, I.; Manzur, T.; Efaz, I.H.; Mahmood, T. Experimental Study on Bond Performance of Epoxy Coated Bars and Uncoated Deformed Bars in Concrete; Bangladesh University of Engineering & Technology: Dhaka, Bangladesh, 2017. [Google Scholar]
- Yoon, I.-S.; Kang, T.H.K.; Shin, H.-Y. Evaluation of corrosion prevention systems of strands for PSC structures. J. Korea Concr. Inst. 2019, 31, 557–565. [Google Scholar] [CrossRef]
- Collins, M.P.; Mitchell, D. Prestressed Concrete Structures; Prentice-Hall: Hoboken, NJ, USA, 1991. [Google Scholar]
- Kang, W.-H.; Han, M.-Y.; Lee, T.-S.; Rhu, Y.-M. A study on development of methods to rehabilitate the damaged prestressed concrete beam using glass fiber. J. Korea Concr. Inst. 1999, 11, 167–175. [Google Scholar]
- Fawaz, G.; Murcia-Delso, J. Bond Behavior of Iron-Based Shape Memory Alloy Reinforcing Bars Embedded in Concrete. Mater. Struct. 2020, 53, 1–19. [Google Scholar] [CrossRef]
- Hong, K.-N.; Lee, S.-G.; Yeon, Y.-M.; Jung, K.-S. Flexural response of reinforced concrete beams strengthened with near-surface-mounted Fe-based shape-memory alloy strips. Int. J. Concr. Struct. Mater. 2018, 12, 651–663. [Google Scholar] [CrossRef]
- Lee, W.-J.; Webe, B.; Czaderski, C.; Motacalli, M.; Leinebach, C. Phase transformation behavior under uniaxial deformation of an Fe-Mn-Si-Cr-Ni-VC shape memory alloy. Mater. Sci. Eng. A. 2013, 581, 1–7. [Google Scholar] [CrossRef]
- Rojob, H.; El-Hacha, R. Self-prestressing using iron-based shape memory alloy for flexural strengthening of reinforced concrete beams. ACI Struct. J. 2017, 114, 523–532. [Google Scholar] [CrossRef]
- Lee, W.-J.; Weber, B.; Leinenbach, C. Recovery stress formation in a restrained Fe–Mn–Si-based shape memory alloy used for prestressing or mechanical joining. Constr. Build. Mater. 2015, 95, 600–610. [Google Scholar] [CrossRef]
- Sawaguchi, T.; Kikuchi, K.; Ogawa, K.; Kajiwara, S.; Ikeo, Y.; Kojima, M.; Ogawa, T. Development of prestressed concrete using Fe-Mn-Si-based shape memory alloys containing NbC. Mater. Trans. 2006, 47, 580–583. [Google Scholar] [CrossRef] [Green Version]
- Czaderski, C.; Shahverdi, M.; Bronnimann, R.; Lenenbach, C.; Motavalli, M. Feasibility of iron-based shape memory alloy strip for prestressed strengthening of concrete structures. Constr. Build. Mater. 2014, 56, 94–105. [Google Scholar] [CrossRef]
- Michels, J.; Shahverdi, M.; Czaderski, C. Flexural strengthening of structural concrete with iron-based shape memory alloy strips. Struct. Concr. 2018, 19, 876–891. [Google Scholar] [CrossRef]
- Enami, K.; Nagasawa, A.; Nenno, S. Reversible Shape Memory Effect in Fe-Base Alloys. Scr. Metall. 1975, 9, 941–948. [Google Scholar] [CrossRef]
- Shahverdi, M.; Czaderski, C.; Motavalli, M. Iron-based shape memory alloys for prestressed near-surface mounted strengthening of reinforced concrete beams. Constr. Build. Mater. 2016, 112, 28–38. [Google Scholar] [CrossRef]
- Michels, J.; Shahverdi, M.; Czaderski, C.; El-Hacha, R. Mechanical performance of iron-based shape-memory alloy ribbed bars for concrete prestressing. ACI Struct. J. 2015, 114, 523–532. [Google Scholar]
- Hosseini, E.; Ghafoori, E.; Leinenbach, C.; Motavalli, M.; Holdsworth, S.-R. Stress Recovery and Cyclic Behaviour of an Fe–Mn–Si Shape Memory Alloy After Multiple Thermal Activation. Smart Mater. Struct. 2018, 27, 1–27. [Google Scholar] [CrossRef] [Green Version]
- Hong, K.-N.; Lee, S.-G.; Han, S.H.; Yeon, Y.-M. Evaluation of Fe-based shape memory alloy (Fe-SMA) as strengthening material for reinforced concrete structures. Appl. Sci. 2018, 8, 730. [Google Scholar] [CrossRef] [Green Version]
- Yeon, Y.-M.; Hong, K.-N.; Lee, S.H.; Ji, S.-W. Numerical study of RC beams strengthened with Fe-based shape memory alloy strips using the NSM method. Appl. Sci. 2021, 11, 6809. [Google Scholar] [CrossRef]
- Shahverdi, M.; Michels, J.; Czaderski, C.; Motavalli, M. Iron-based shape memory alloy strips for strengthening RC members: Material behavior and characterization. Constr. Build. Mater. 2018, 173, 586–599. [Google Scholar] [CrossRef]
- Kim, D.-H.; Park, C.-H.; Lee, J.-H.; Hong, K.-N.; Park, Y.-H.; Lee, W.-J. Microstructure shape memory behavior and mechanical properties of hot rolled Fe-17Mn-5Si-5Cr-4Ni-0.3C-1Ti shape memory alloy. Eng. Struct. 2021, 236, 112300. [Google Scholar] [CrossRef]
- Montoya-Coronado, L.A.; Ruiz-Pinilla, J.G.; Ribas, C.; Cladera, A. Experimental study on shear strengthening of shear critical RC beams using iron-based shape memory alloy strips. Eng. Struct. 2019, 200, 109680. [Google Scholar] [CrossRef]
- ASTM C39/C39M-17b. Standard Test Method for Compressive Strength of Cylindrical Concrete Specimens; ASTM International: West Conshohocken, PA, USA, 2017. [Google Scholar]
- Lee, W.-J.; Partovi-Nia, R.; Suter, T.; Leinenbach, C. Electrochemical characterization and corrosion behavior of an Fe-Mn-Si shape memory alloy in simulated concrete pore solutions. Mater. Corros. 2015, 67, 839–846. [Google Scholar] [CrossRef]
- Park, S.-J.; Yim, H.-J.; Kwak, H.-G. Evaluation of microcracks in thermal damaged concrete using nonlinear ultrasonic modulation technique. J. Korea Concr. Inst. 2012, 24, 651–658. [Google Scholar] [CrossRef] [Green Version]
- Yeon, Y.-M. Evaluation of Prestressing Effect for Fe-based Shape Memory Alloy. Master’s Thesis, Chungbuk National University, Cheongju-si, Korea, 2018. [Google Scholar]
- ACI. Building Code Requirements for Structural Concrete; ACI 318-08; ACI: Farmington Hills, MI, USA, 2008. [Google Scholar]


| Specimen | Area of Fe-SMA Rebars (mm2) | Activation | Anchorage |
|---|---|---|---|
| BE-2N-A | 200 | Nonactivation | Anchorage |
| BE-2A-A | Activation | ||
| BE-3N-A | 300 | Nonactivation | |
| BE-3A-A | Activation | ||
| BE-3R-A | |||
| BE-3A-N | Non-anchorage | ||
| BE-4A-A | 400 | Nonactivation | Anchorage |
| BE-4A-A | Activation | ||
| BE-5A-A | 500 | Nonactivation | |
| BE-5A-A | Activation |
| Slump (cm) | Air Content (%) | W/B (%) | S/a (%) | Weight per Unit Volume (kg/m3) | ||||
|---|---|---|---|---|---|---|---|---|
| W | C | S | G | AD | ||||
| 12 | 4.5 | 30.7 | 47 | 192 | 625 | 684 | 780 | 4.38 |
| Standard No. | Nominal Diameter (mm) | Nominal Area (mm2) | Young’s Modulus (GPa) | Yield Strength (MPa) | Ultimate Strength (MPa) | Elongation (%) |
|---|---|---|---|---|---|---|
| D13 | 12.6 | 126.7 | 200 | 462 | 540 | 17.1 |
| Specimen | (mm) | (mm) | |
|---|---|---|---|
| BE-2A-A | 0.140 | 0.193 | 0.725 |
| BE-3A-A | 0.206 | 0.287 | 0.718 |
| BE-4A-A | 0.297 | 0.379 | 0.784 |
| BE-5A-A | 0.420 | 0.469 | 0.896 |
| Average | 0.781 |
| Specimen | Initial Crack | Ultimate State | Failure Mode | ||
|---|---|---|---|---|---|
| Deflection (mm) | Load (kN) | Deflection (mm) | Load (kN) | ||
| BE-2N-A | 0.71 | 42.31 | 43.82 | 122.77 | Flexural |
| BE-2A-A | 1.45 | 62.46 | 39.47 | 119.26 | |
| BE-3N-A | 0.96 | 50.01 | 43.33 | 165.9 | |
| BE-3A-A | 1.25 | 81.51 | 38.41 | 166.53 | |
| BE-3R-A | 1.2 | 81.38 | 37.11 | 159.44 | |
| BE-3A-N | 0.95 | 80.14 | 42.62 | 165.64 | |
| BE-4A-A | 0.95 | 53.92 | 38.71 | 203.14 | |
| BE-4A-A | 1.81 | 95.42 | 40.00 | 205.86 | |
| BE-5A-A | 1.03 | 50.74 | 28.43 | 249.94 | |
| BE-5A-A | 1.89 | 107.98 | 35.00 | 246.28 | |
Publisher’s Note: MDPI stays neutral with regard to jurisdictional claims in published maps and institutional affiliations. |
© 2022 by the authors. Licensee MDPI, Basel, Switzerland. This article is an open access article distributed under the terms and conditions of the Creative Commons Attribution (CC BY) license (https://creativecommons.org/licenses/by/4.0/).
Share and Cite
Hong, K.-N.; Yeon, Y.-M.; Ji, S.-W.; Lee, S. Flexural Behavior of RC Beams Using Fe-Based Shape Memory Alloy Rebars as Tensile Reinforcement. Buildings 2022, 12, 190. https://doi.org/10.3390/buildings12020190
Hong K-N, Yeon Y-M, Ji S-W, Lee S. Flexural Behavior of RC Beams Using Fe-Based Shape Memory Alloy Rebars as Tensile Reinforcement. Buildings. 2022; 12(2):190. https://doi.org/10.3390/buildings12020190
Chicago/Turabian StyleHong, Ki-Nam, Yeong-Mo Yeon, Sang-Won Ji, and Sugyu Lee. 2022. "Flexural Behavior of RC Beams Using Fe-Based Shape Memory Alloy Rebars as Tensile Reinforcement" Buildings 12, no. 2: 190. https://doi.org/10.3390/buildings12020190