
Early-Age Performance of Graphene-Nanoplatelet-Modified High-Strength Concrete Cured by Electric Thermal Curing in Severe Cold Regions

Abstract
:1. Introduction
2. Materials and Methods
2.1. Materials
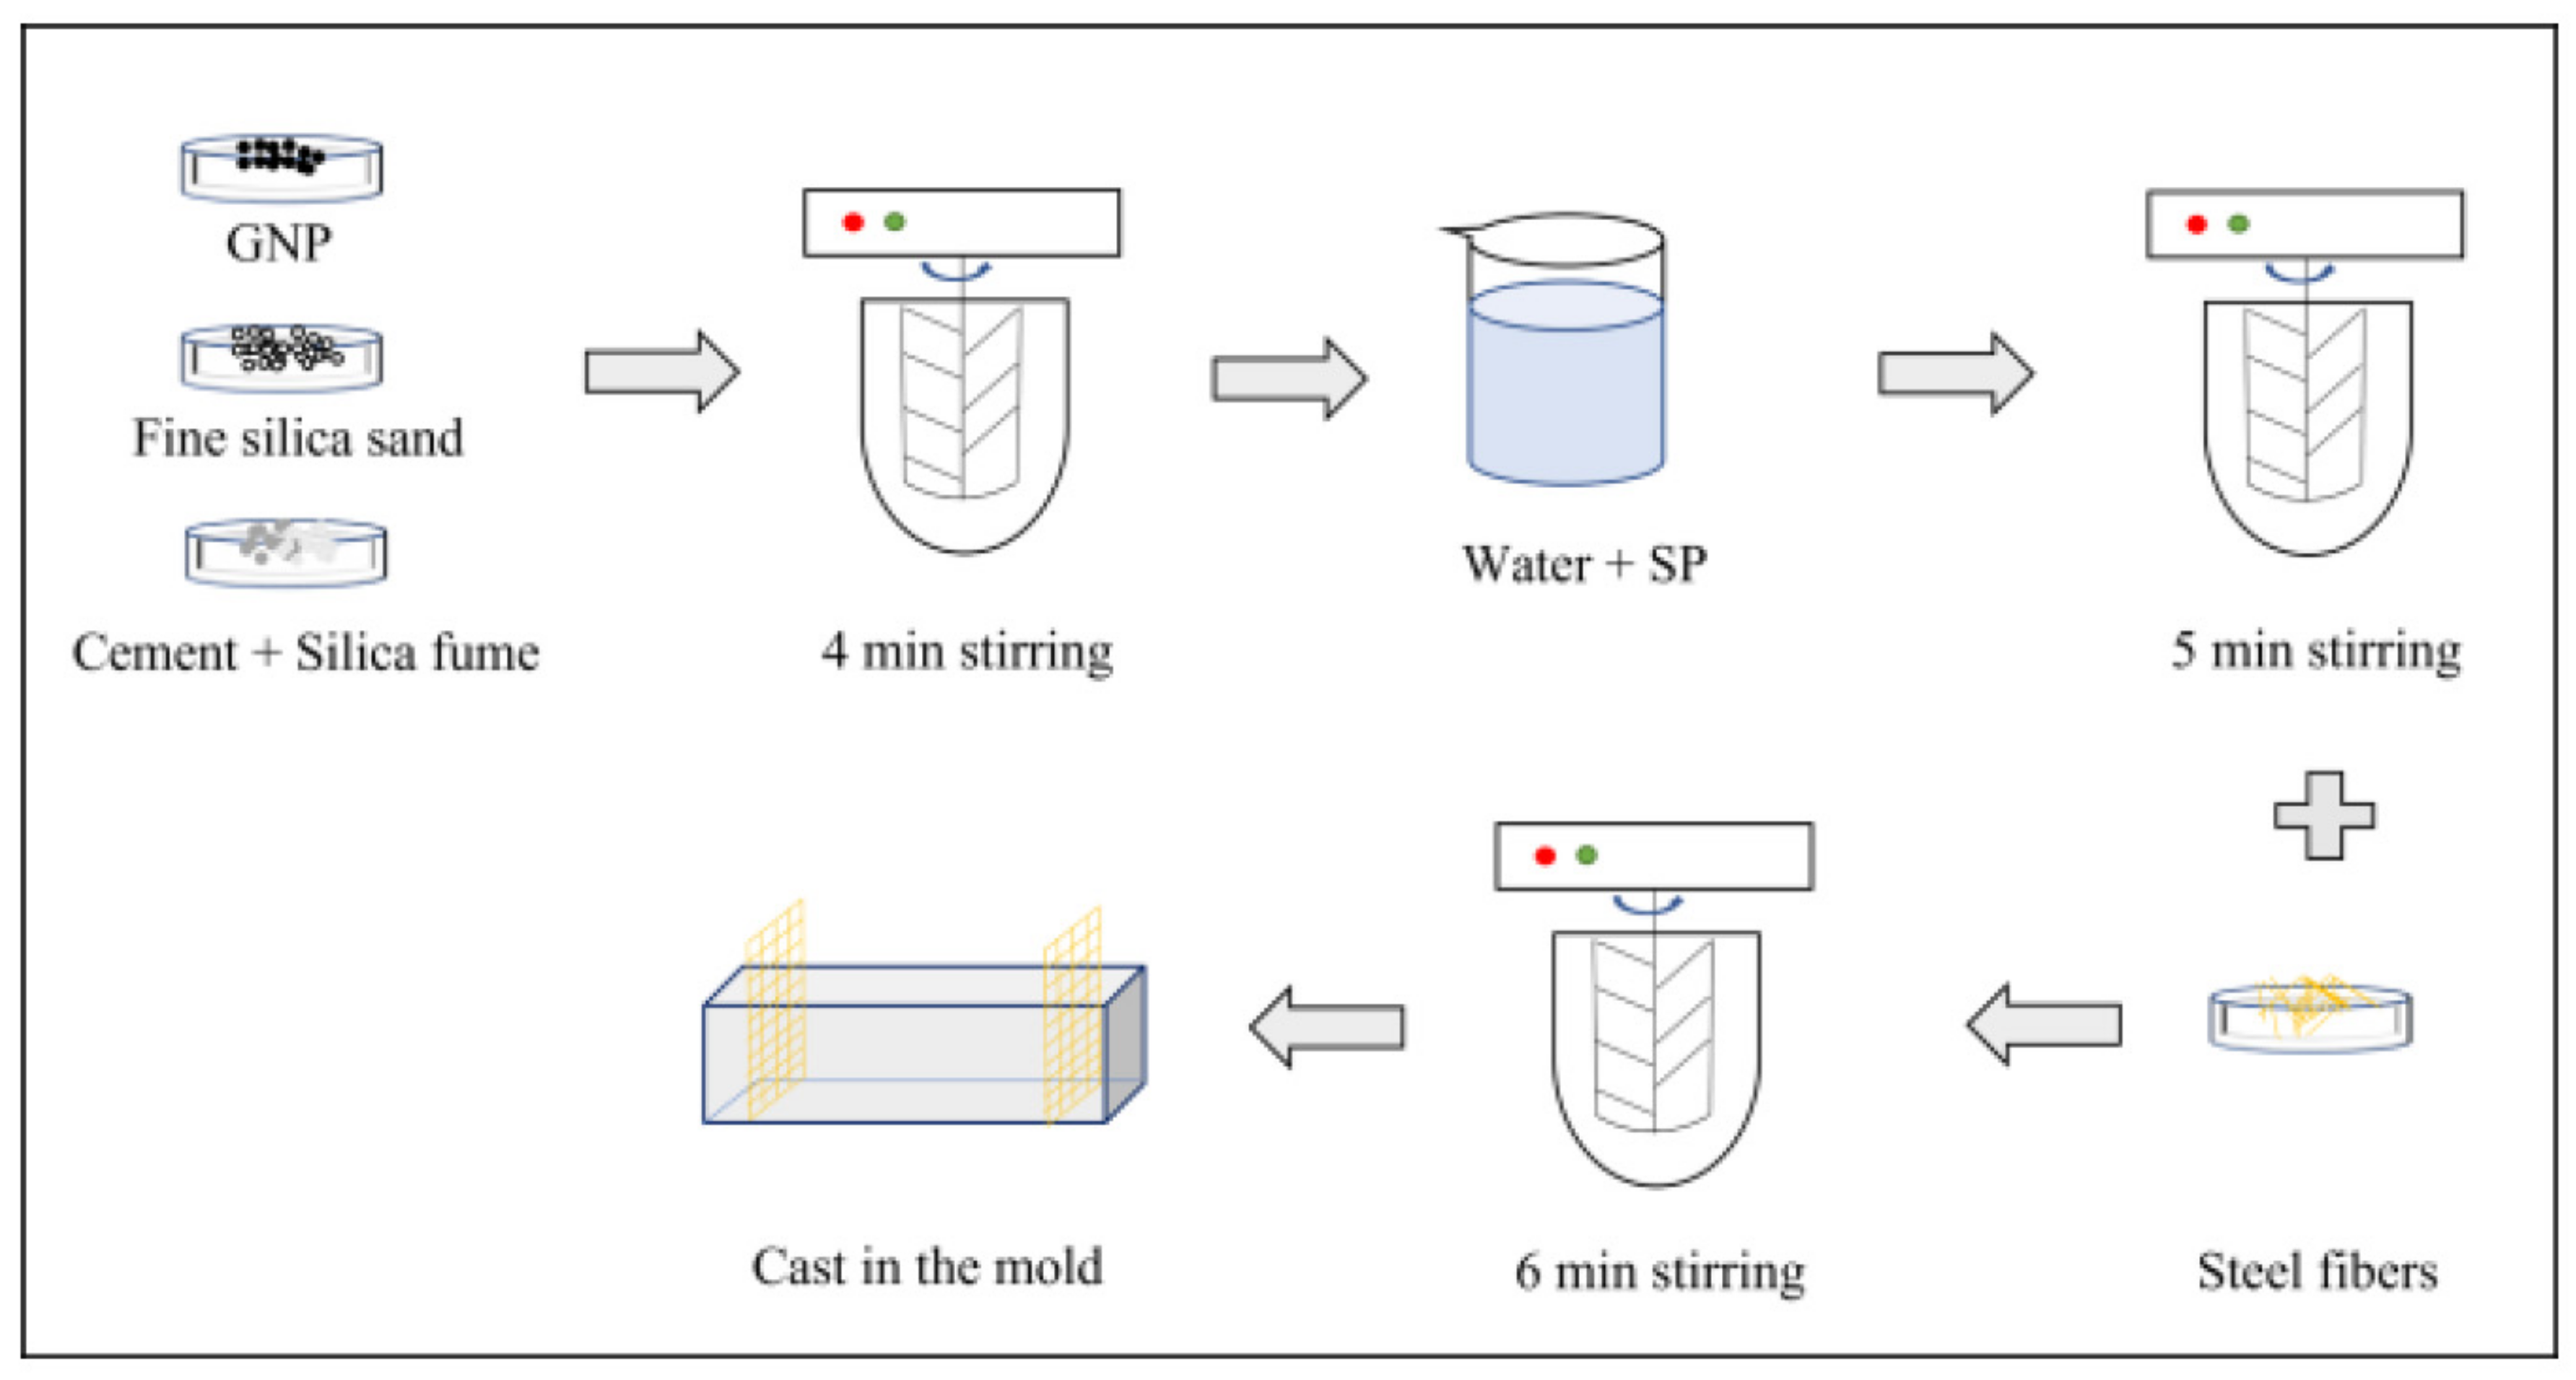
2.2. Preparation of GNP-Modified Steel-Fiber-Reinforced High-Strength Concrete (GNP-HSC)
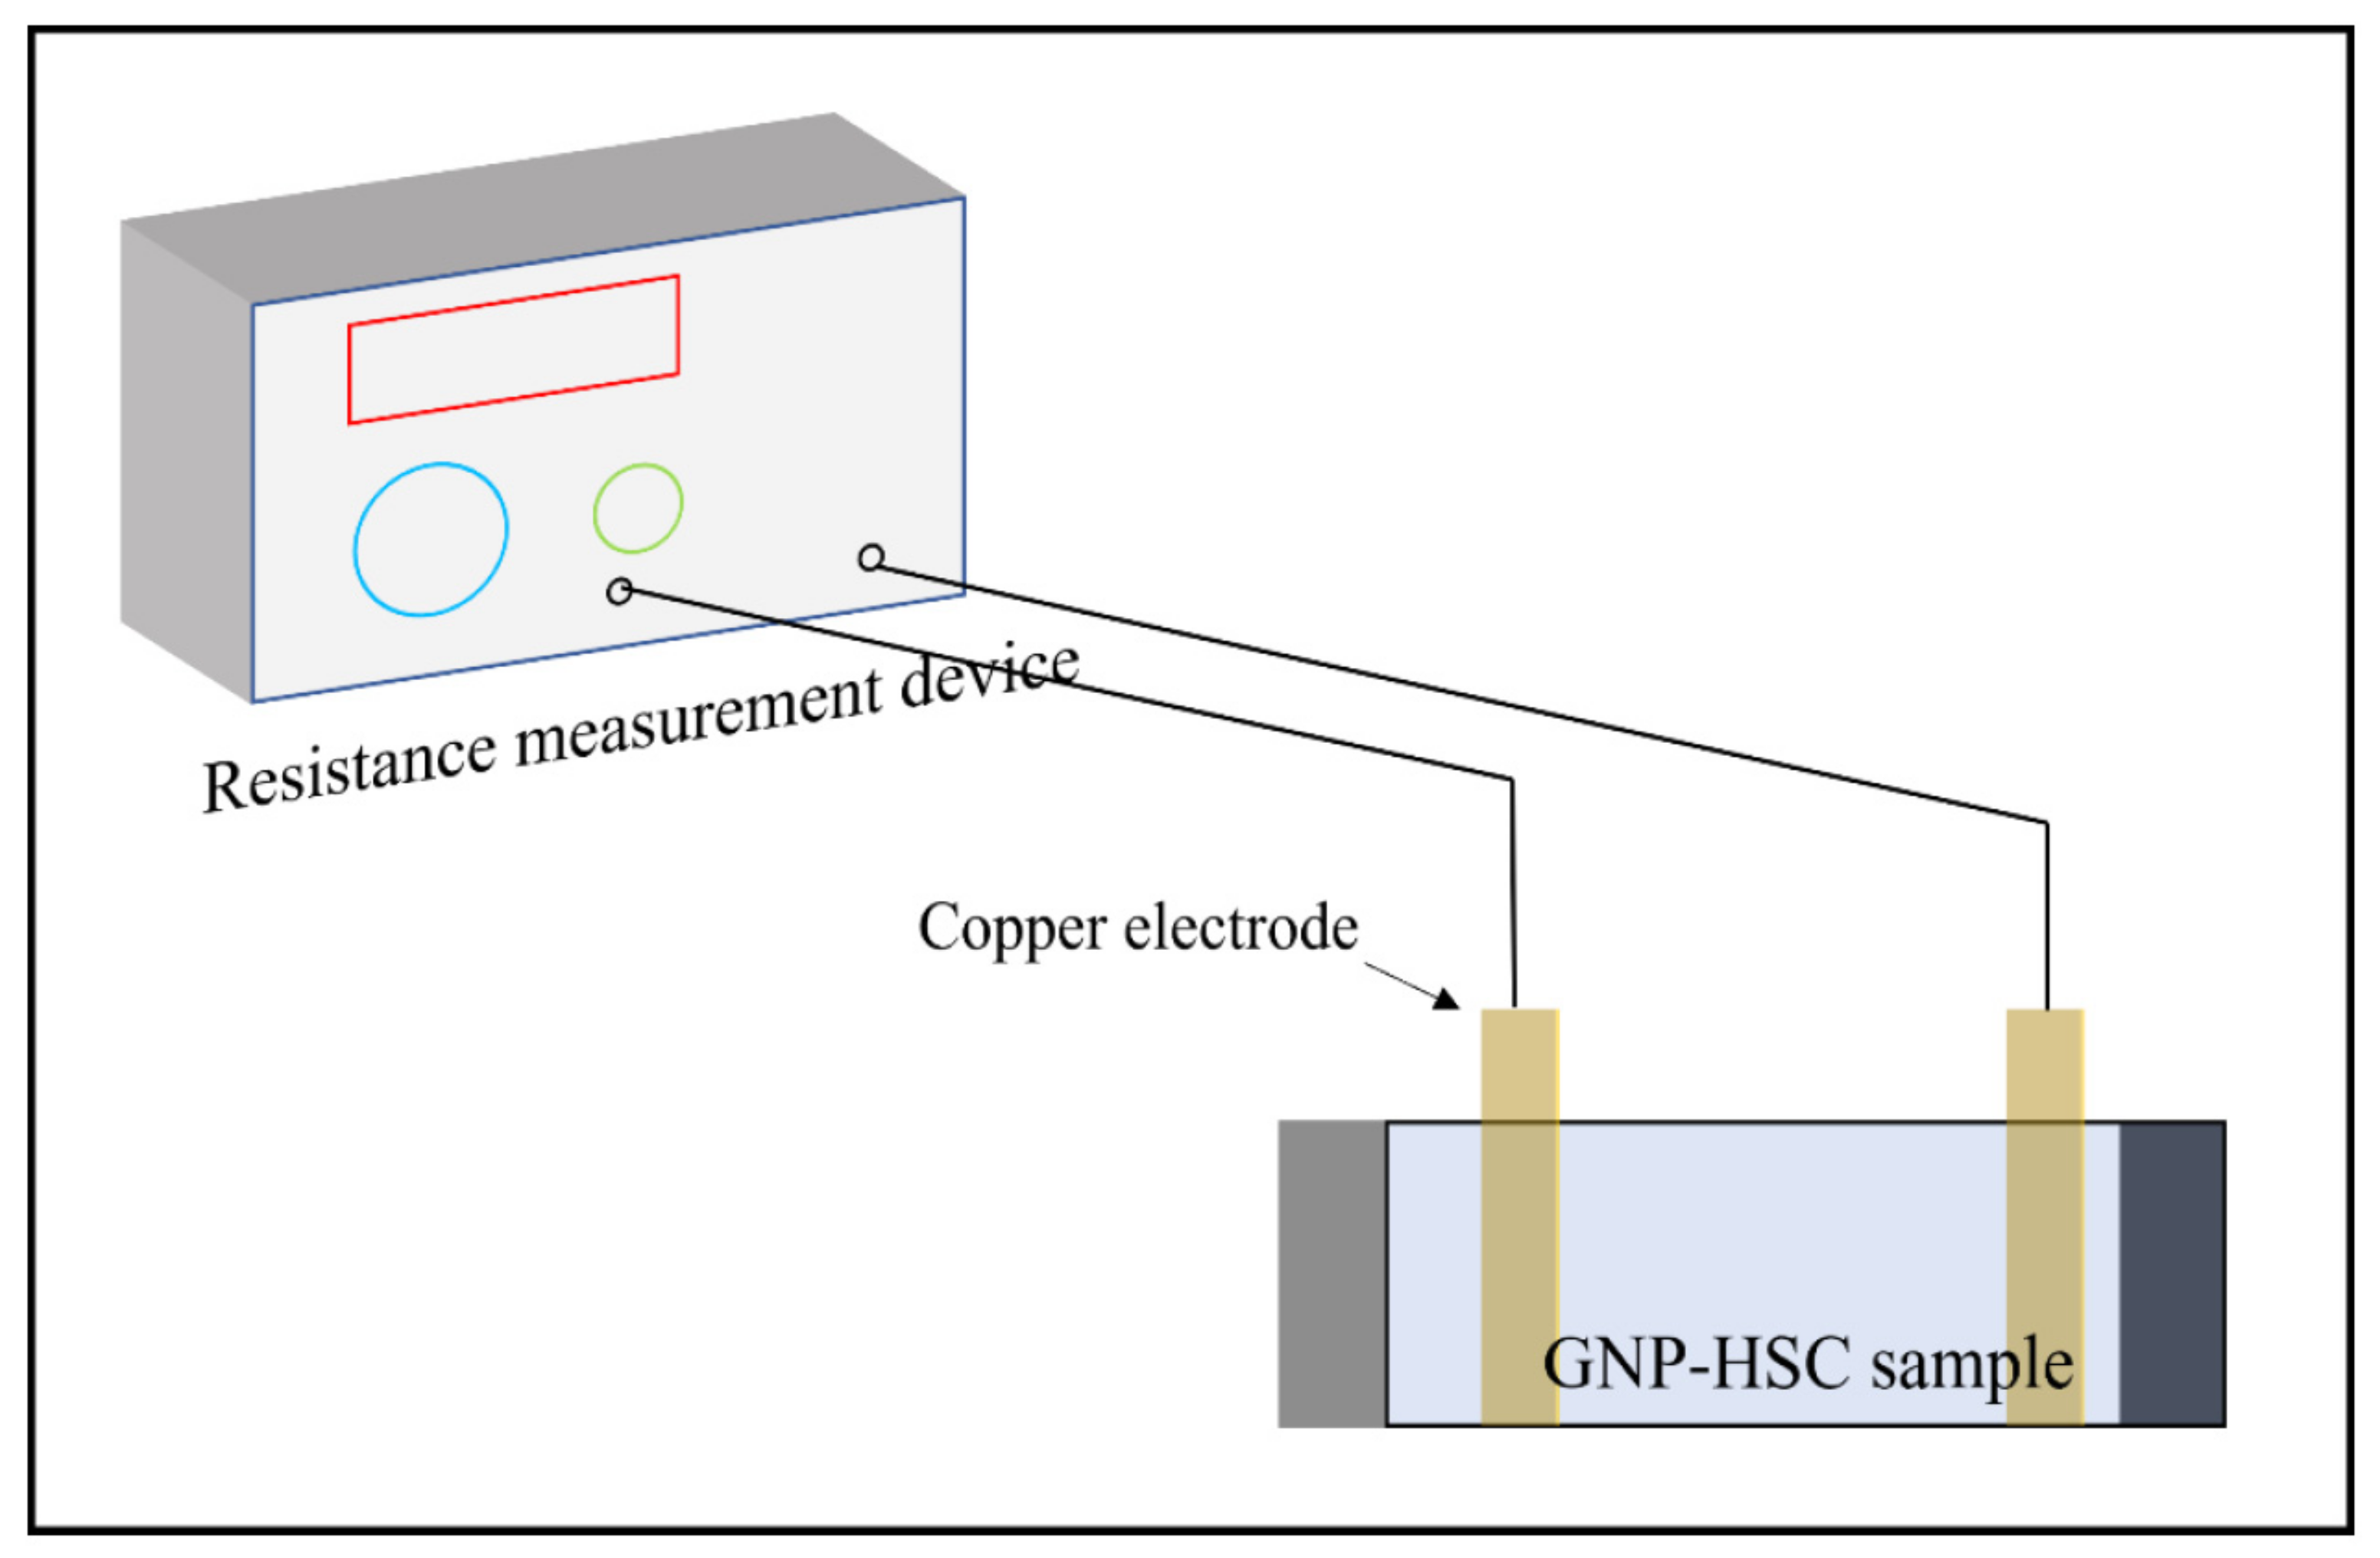
2.3. Resistivity Measurement
2.4. Curing Regimes
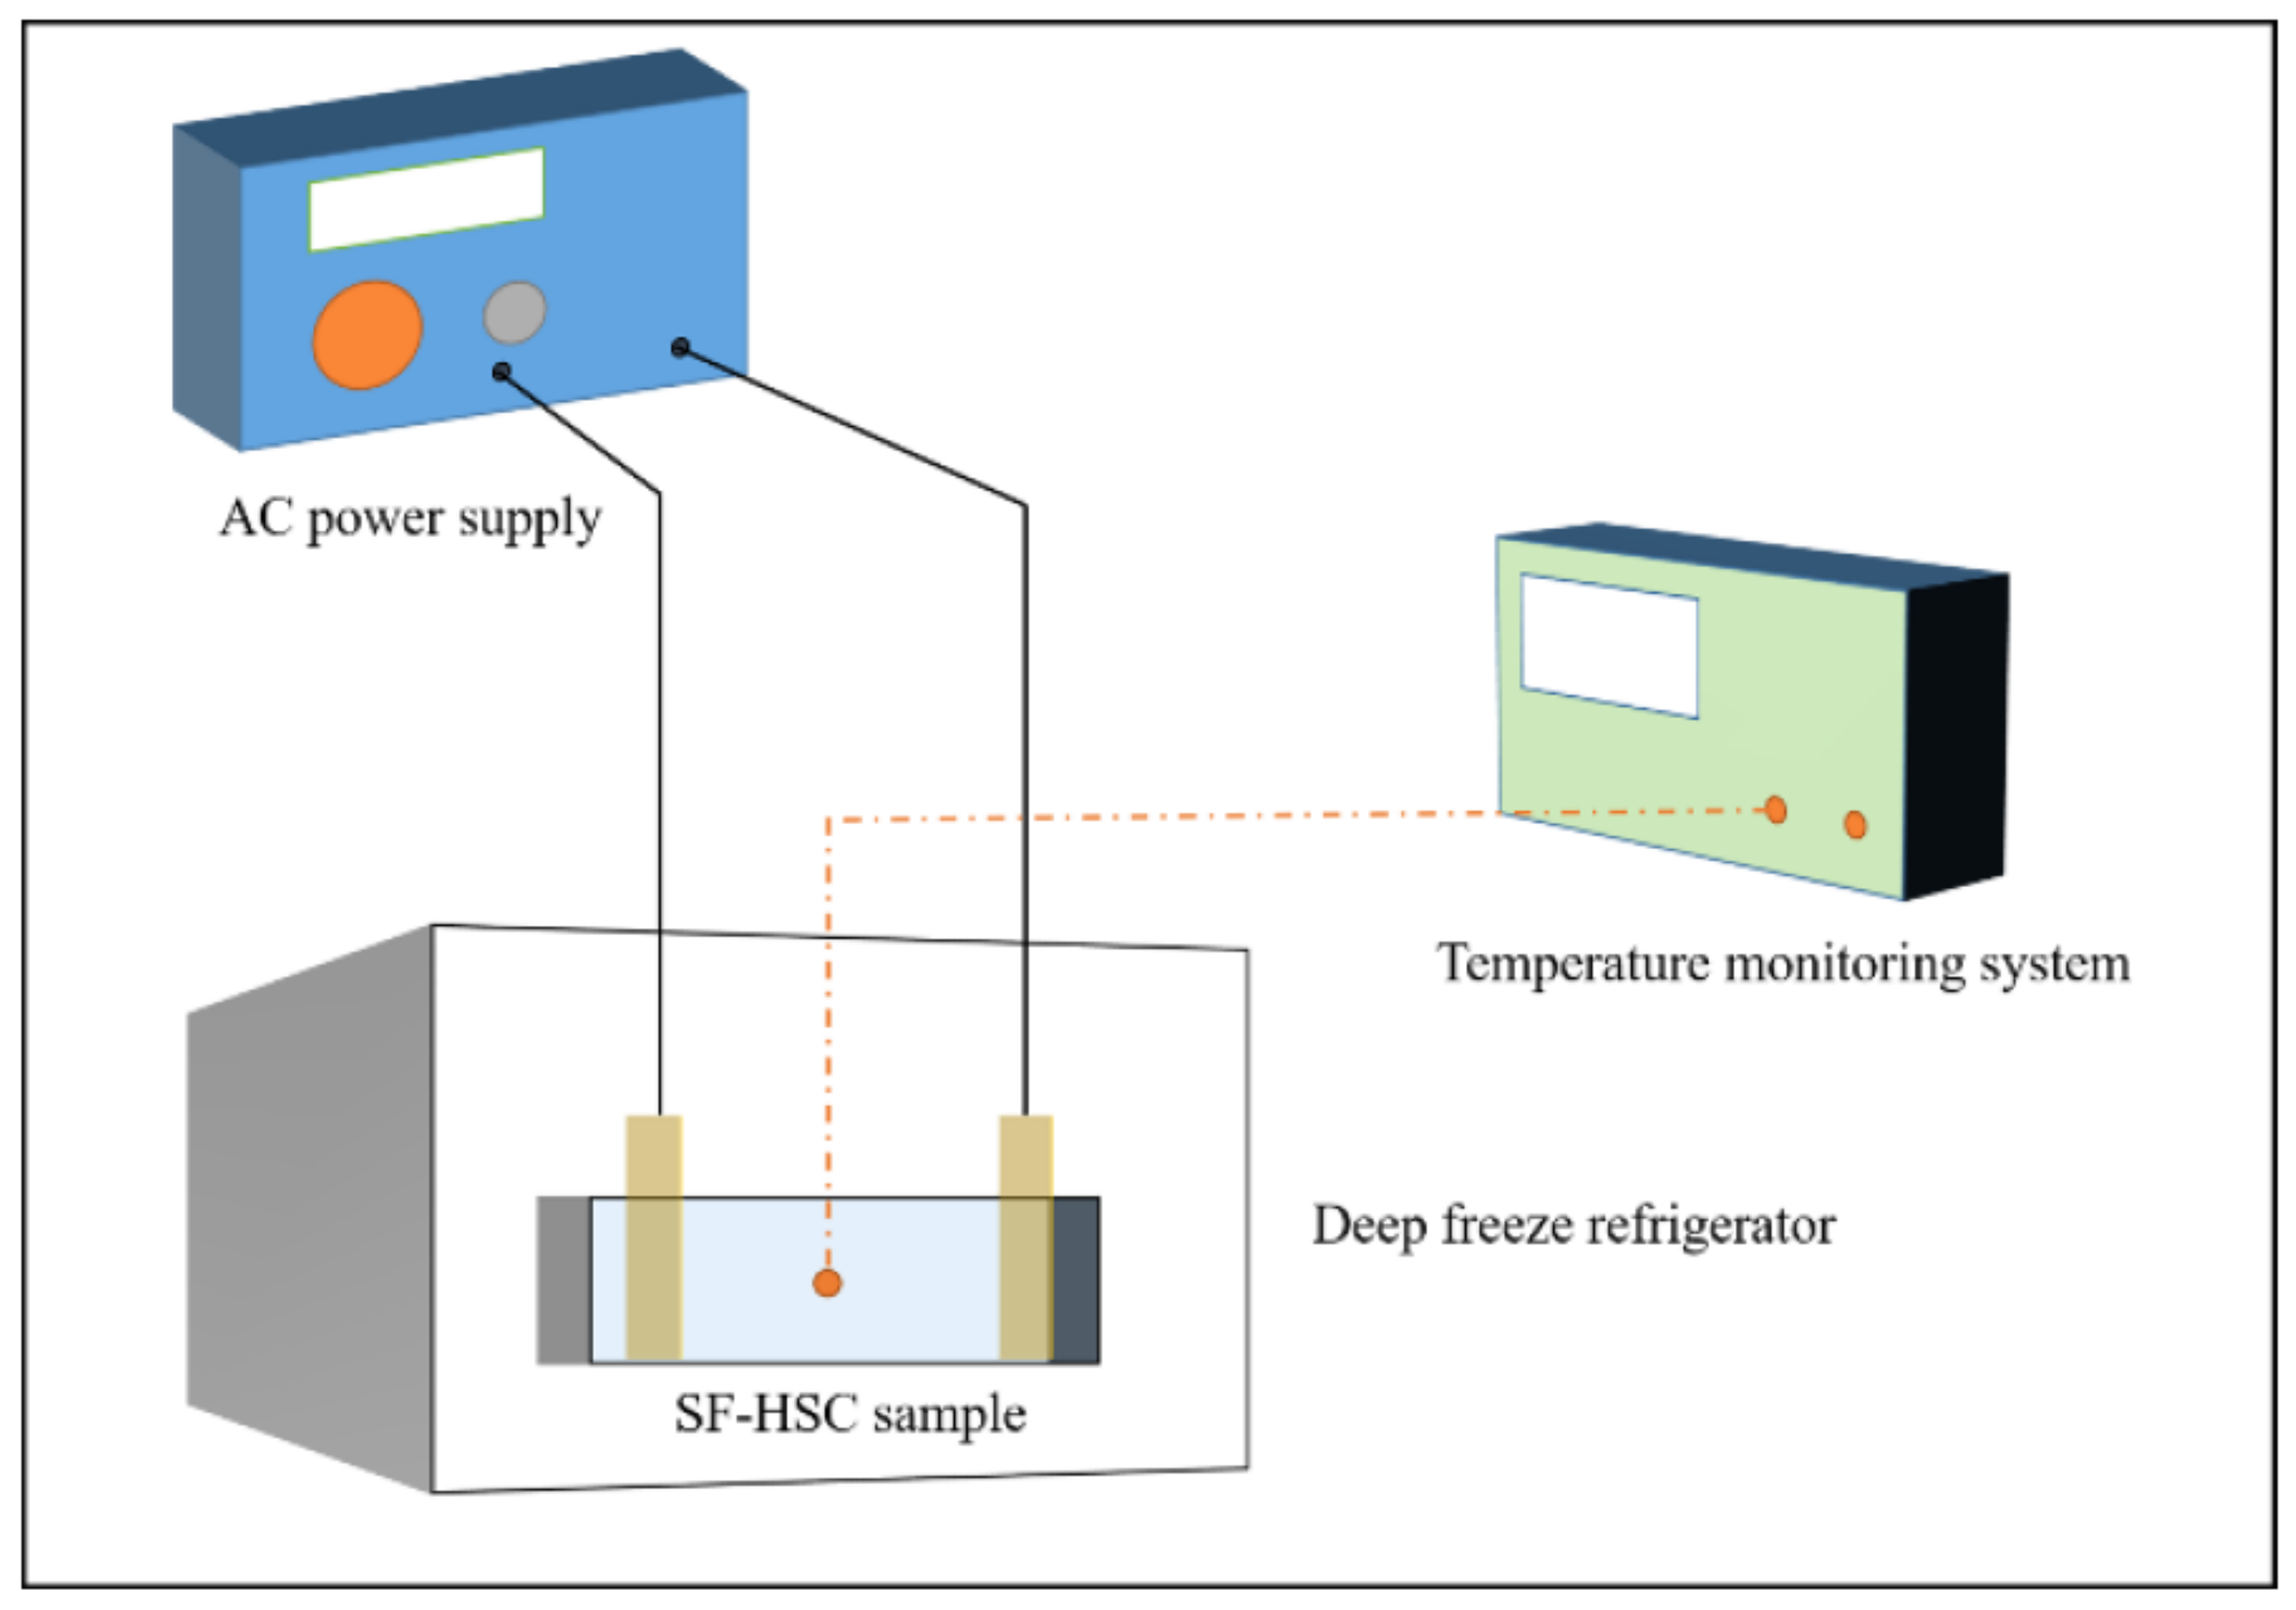
2.5. Electric Thermal (ET) Curing of GNP-HSC
2.6. Characterization
2.7. Percolation Analysis
3. Results
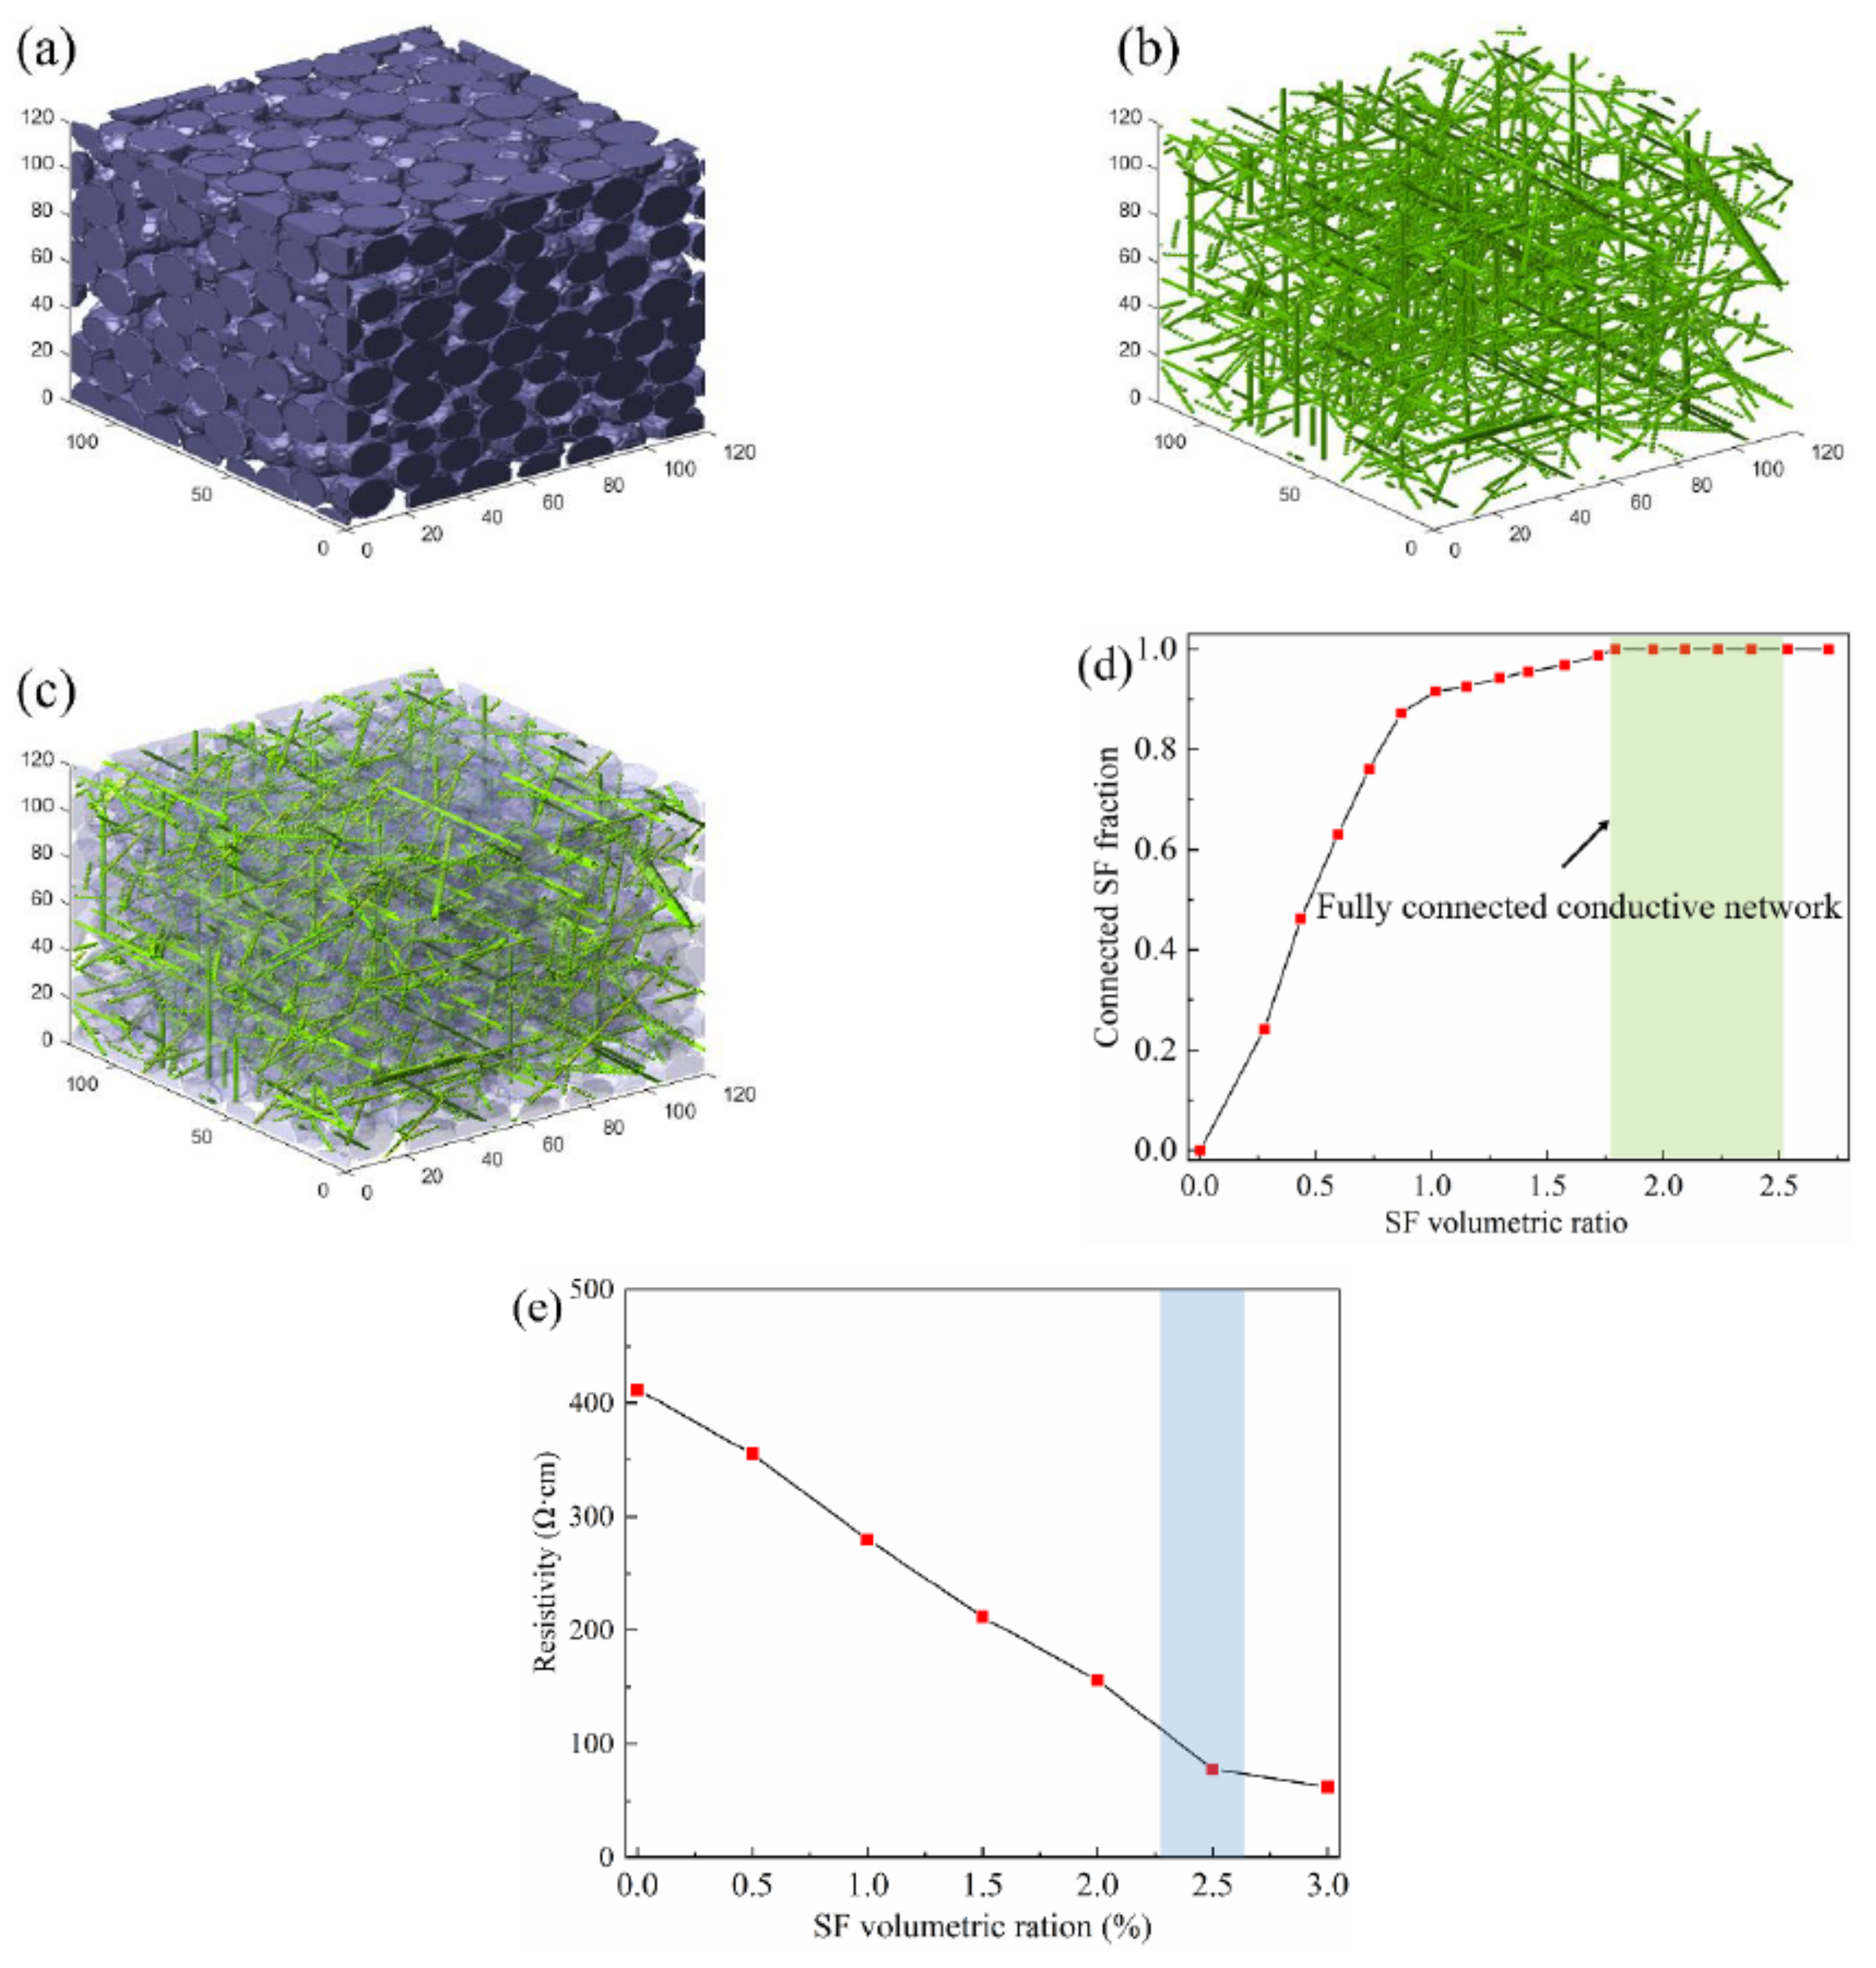
3.1. Numerical and Experimental Investigation of Optimal Amount of Steel Fiber Addition
3.2. Temperature Evolution of GNP-HSC Cured by ET Curing
3.3. Mechanical Properties
3.4. Hydration Products of GNP-HSC Samples
3.4.1. XRD Analysis
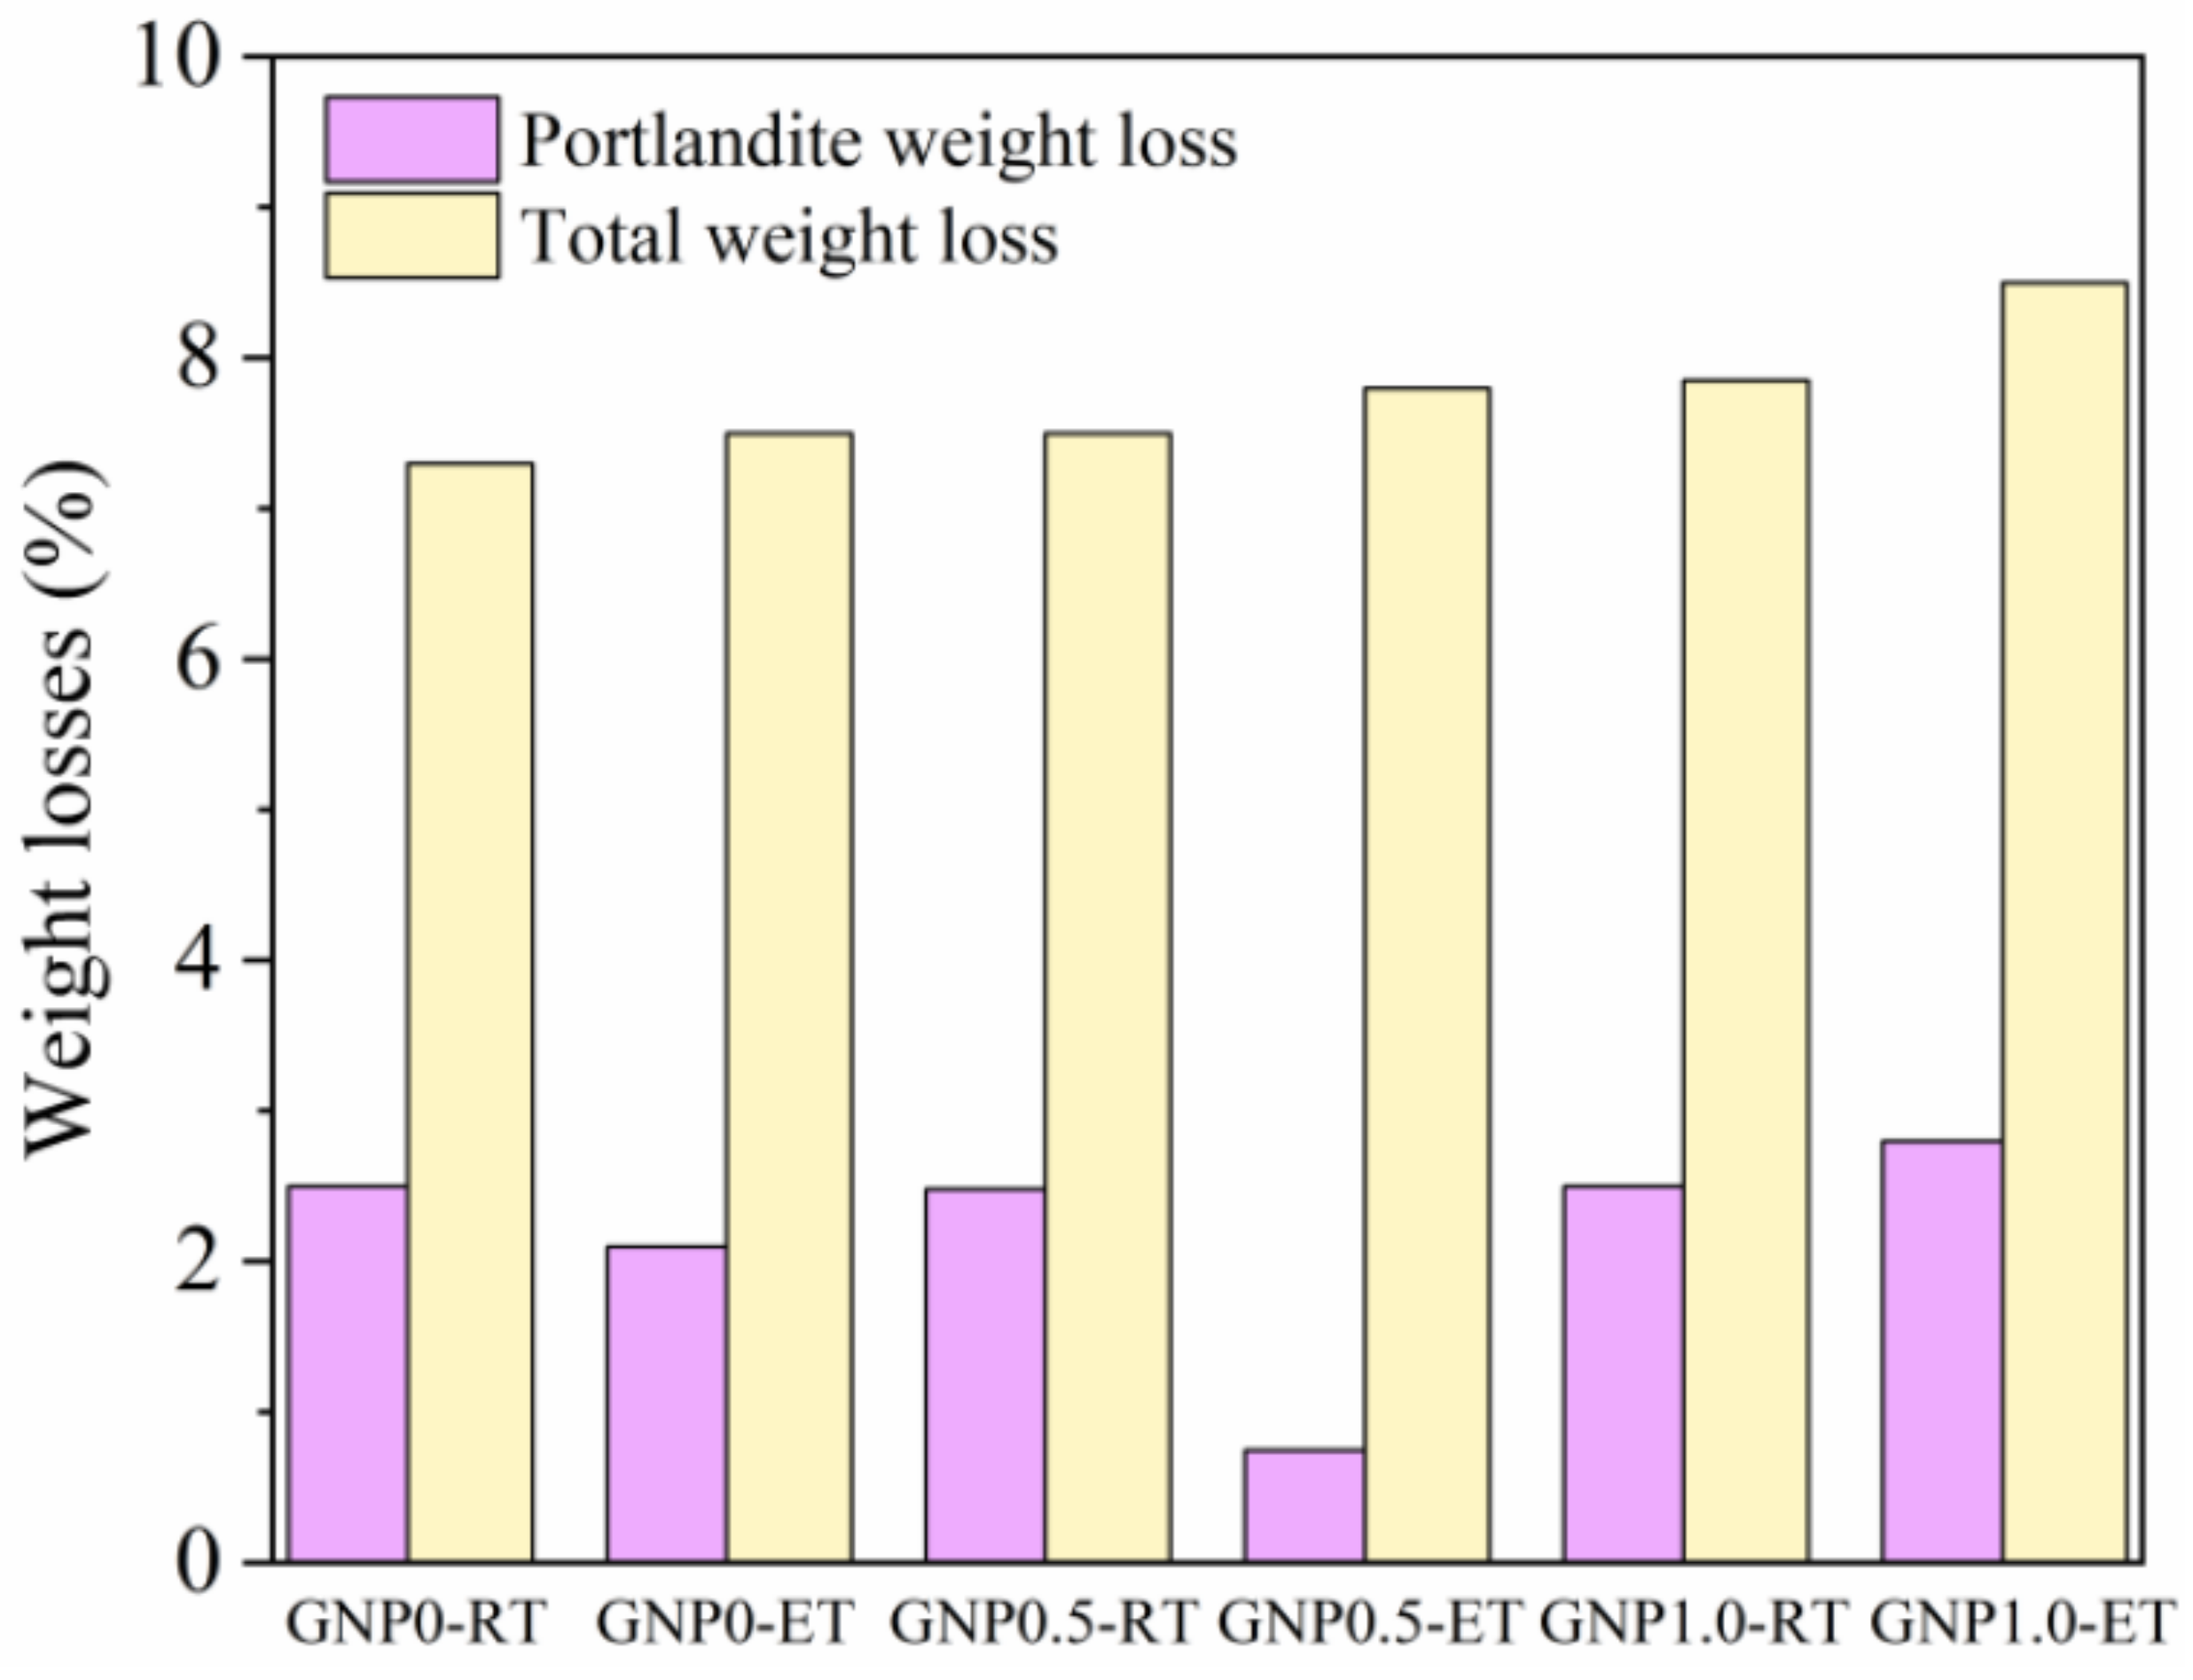
3.4.2. TG Analysis
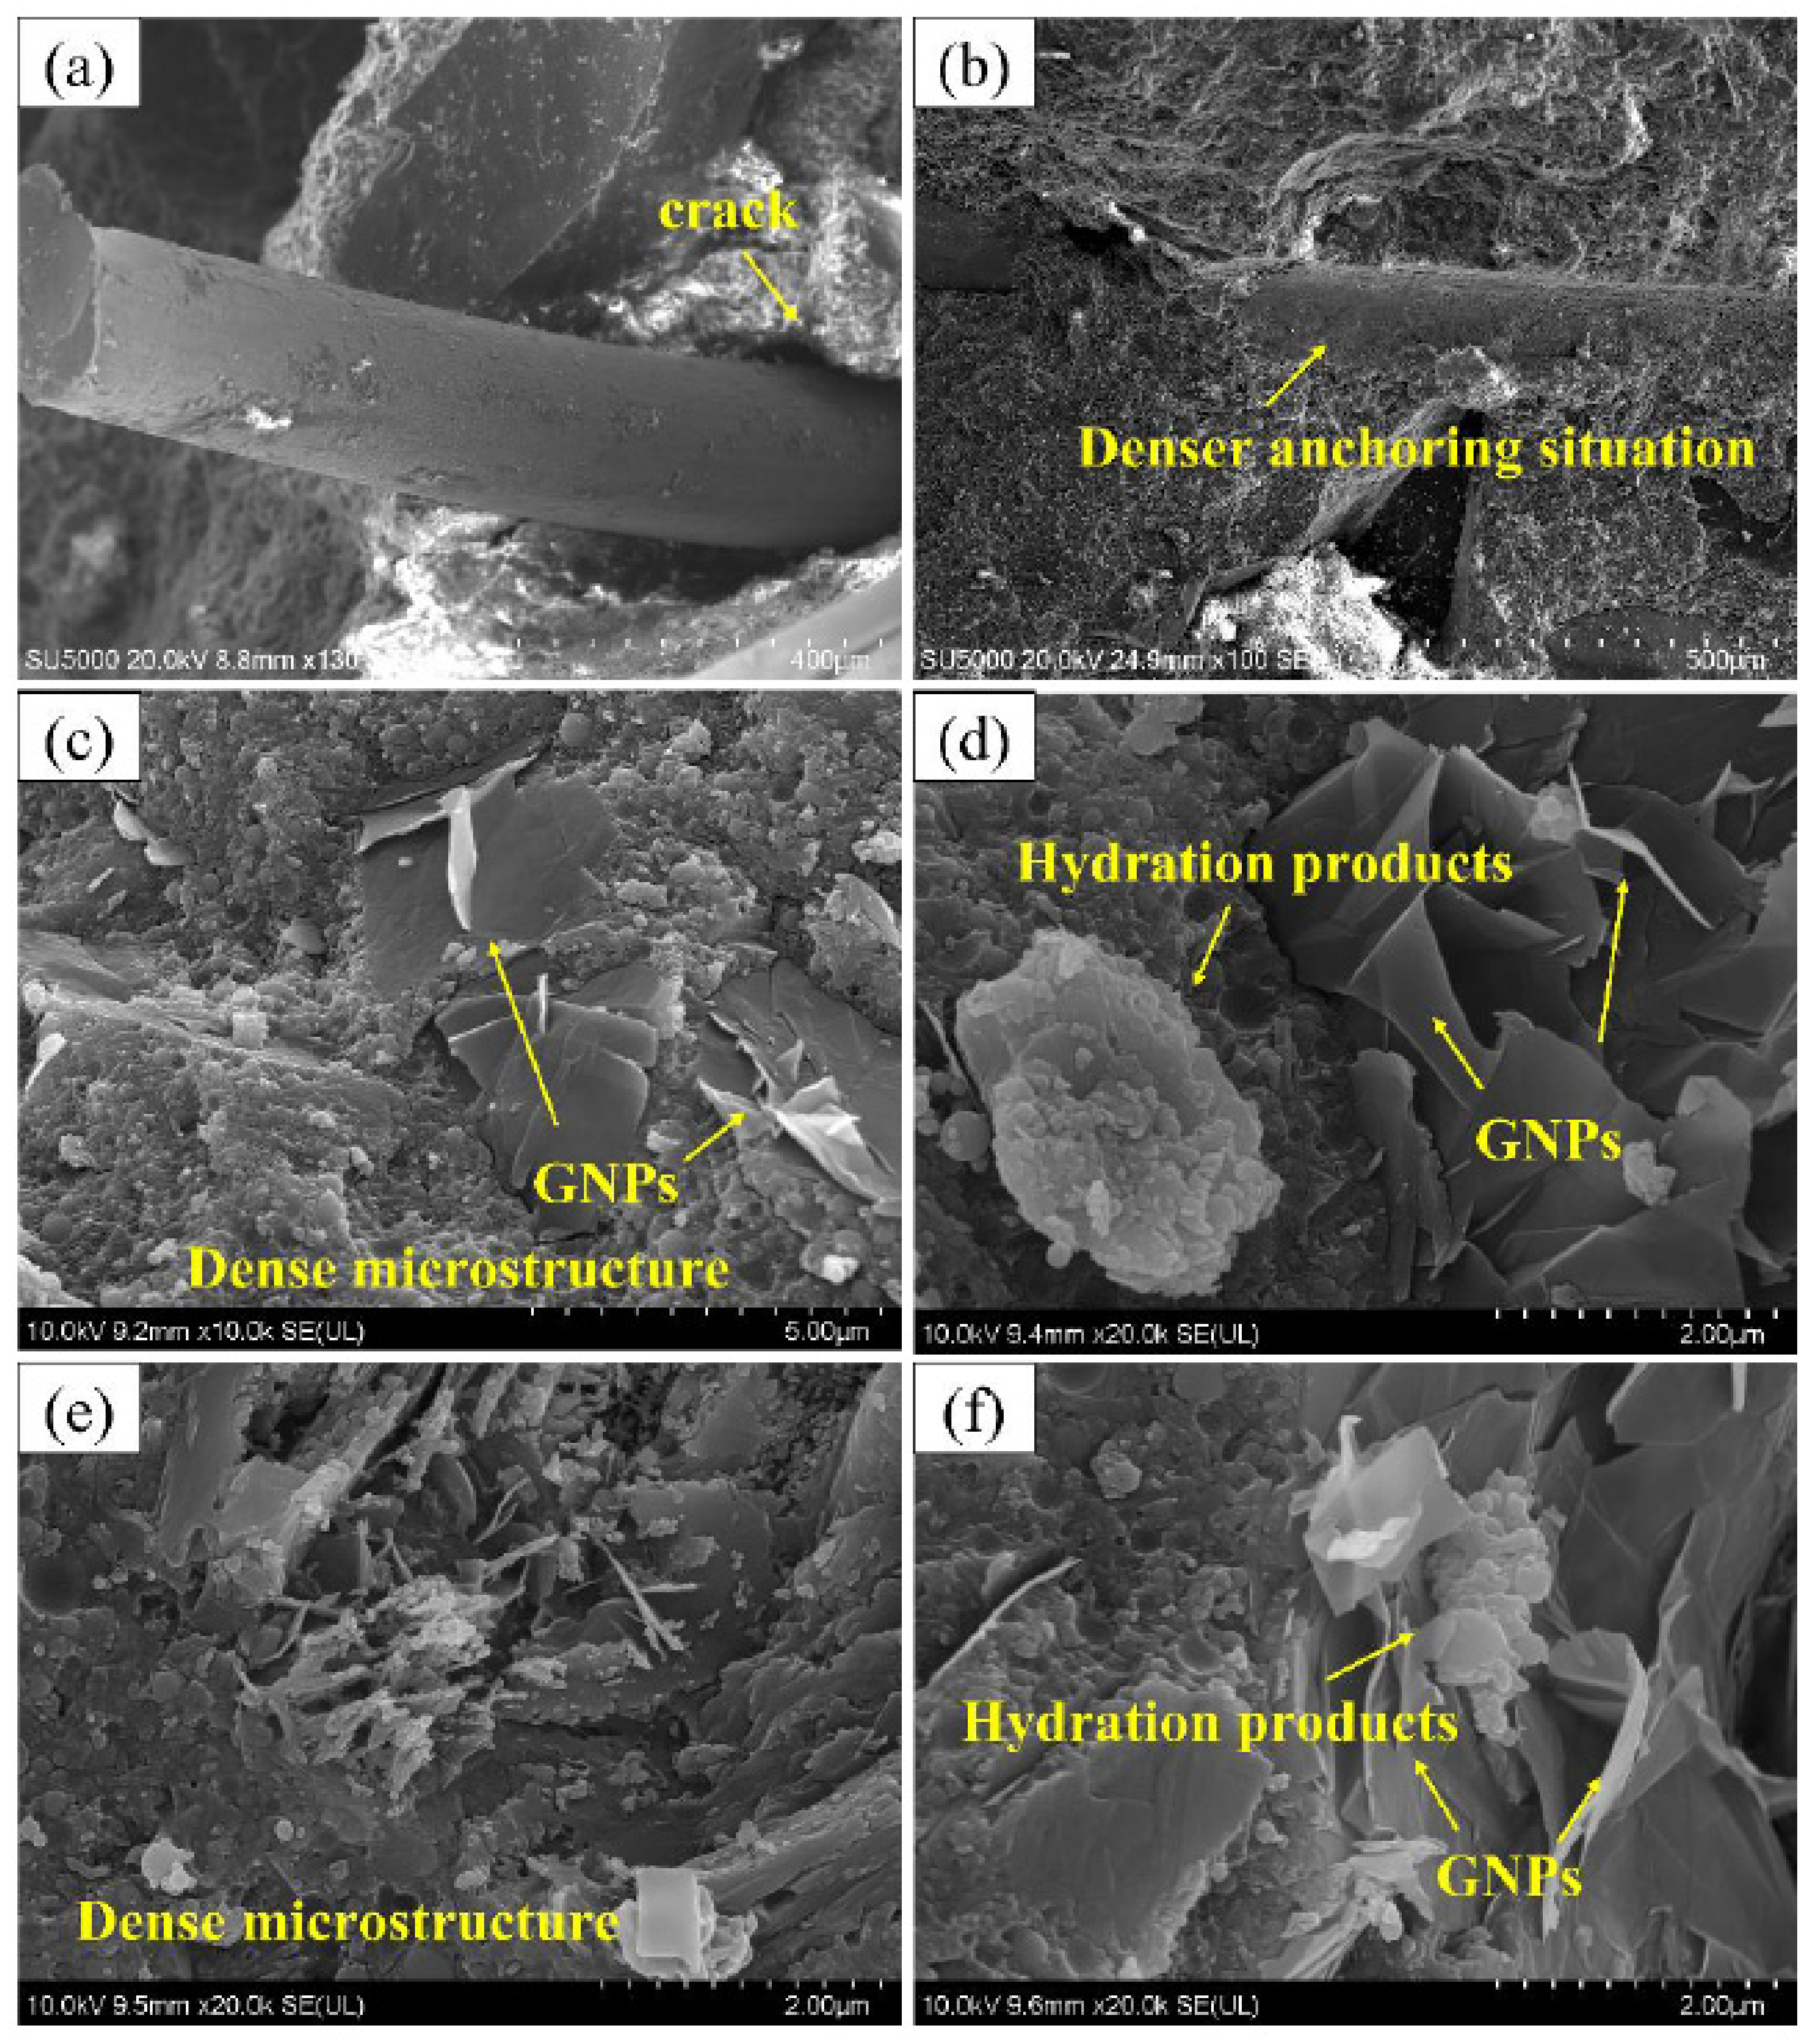
3.5. SEM Analysis
4. Conclusions and Future Work
- (1)
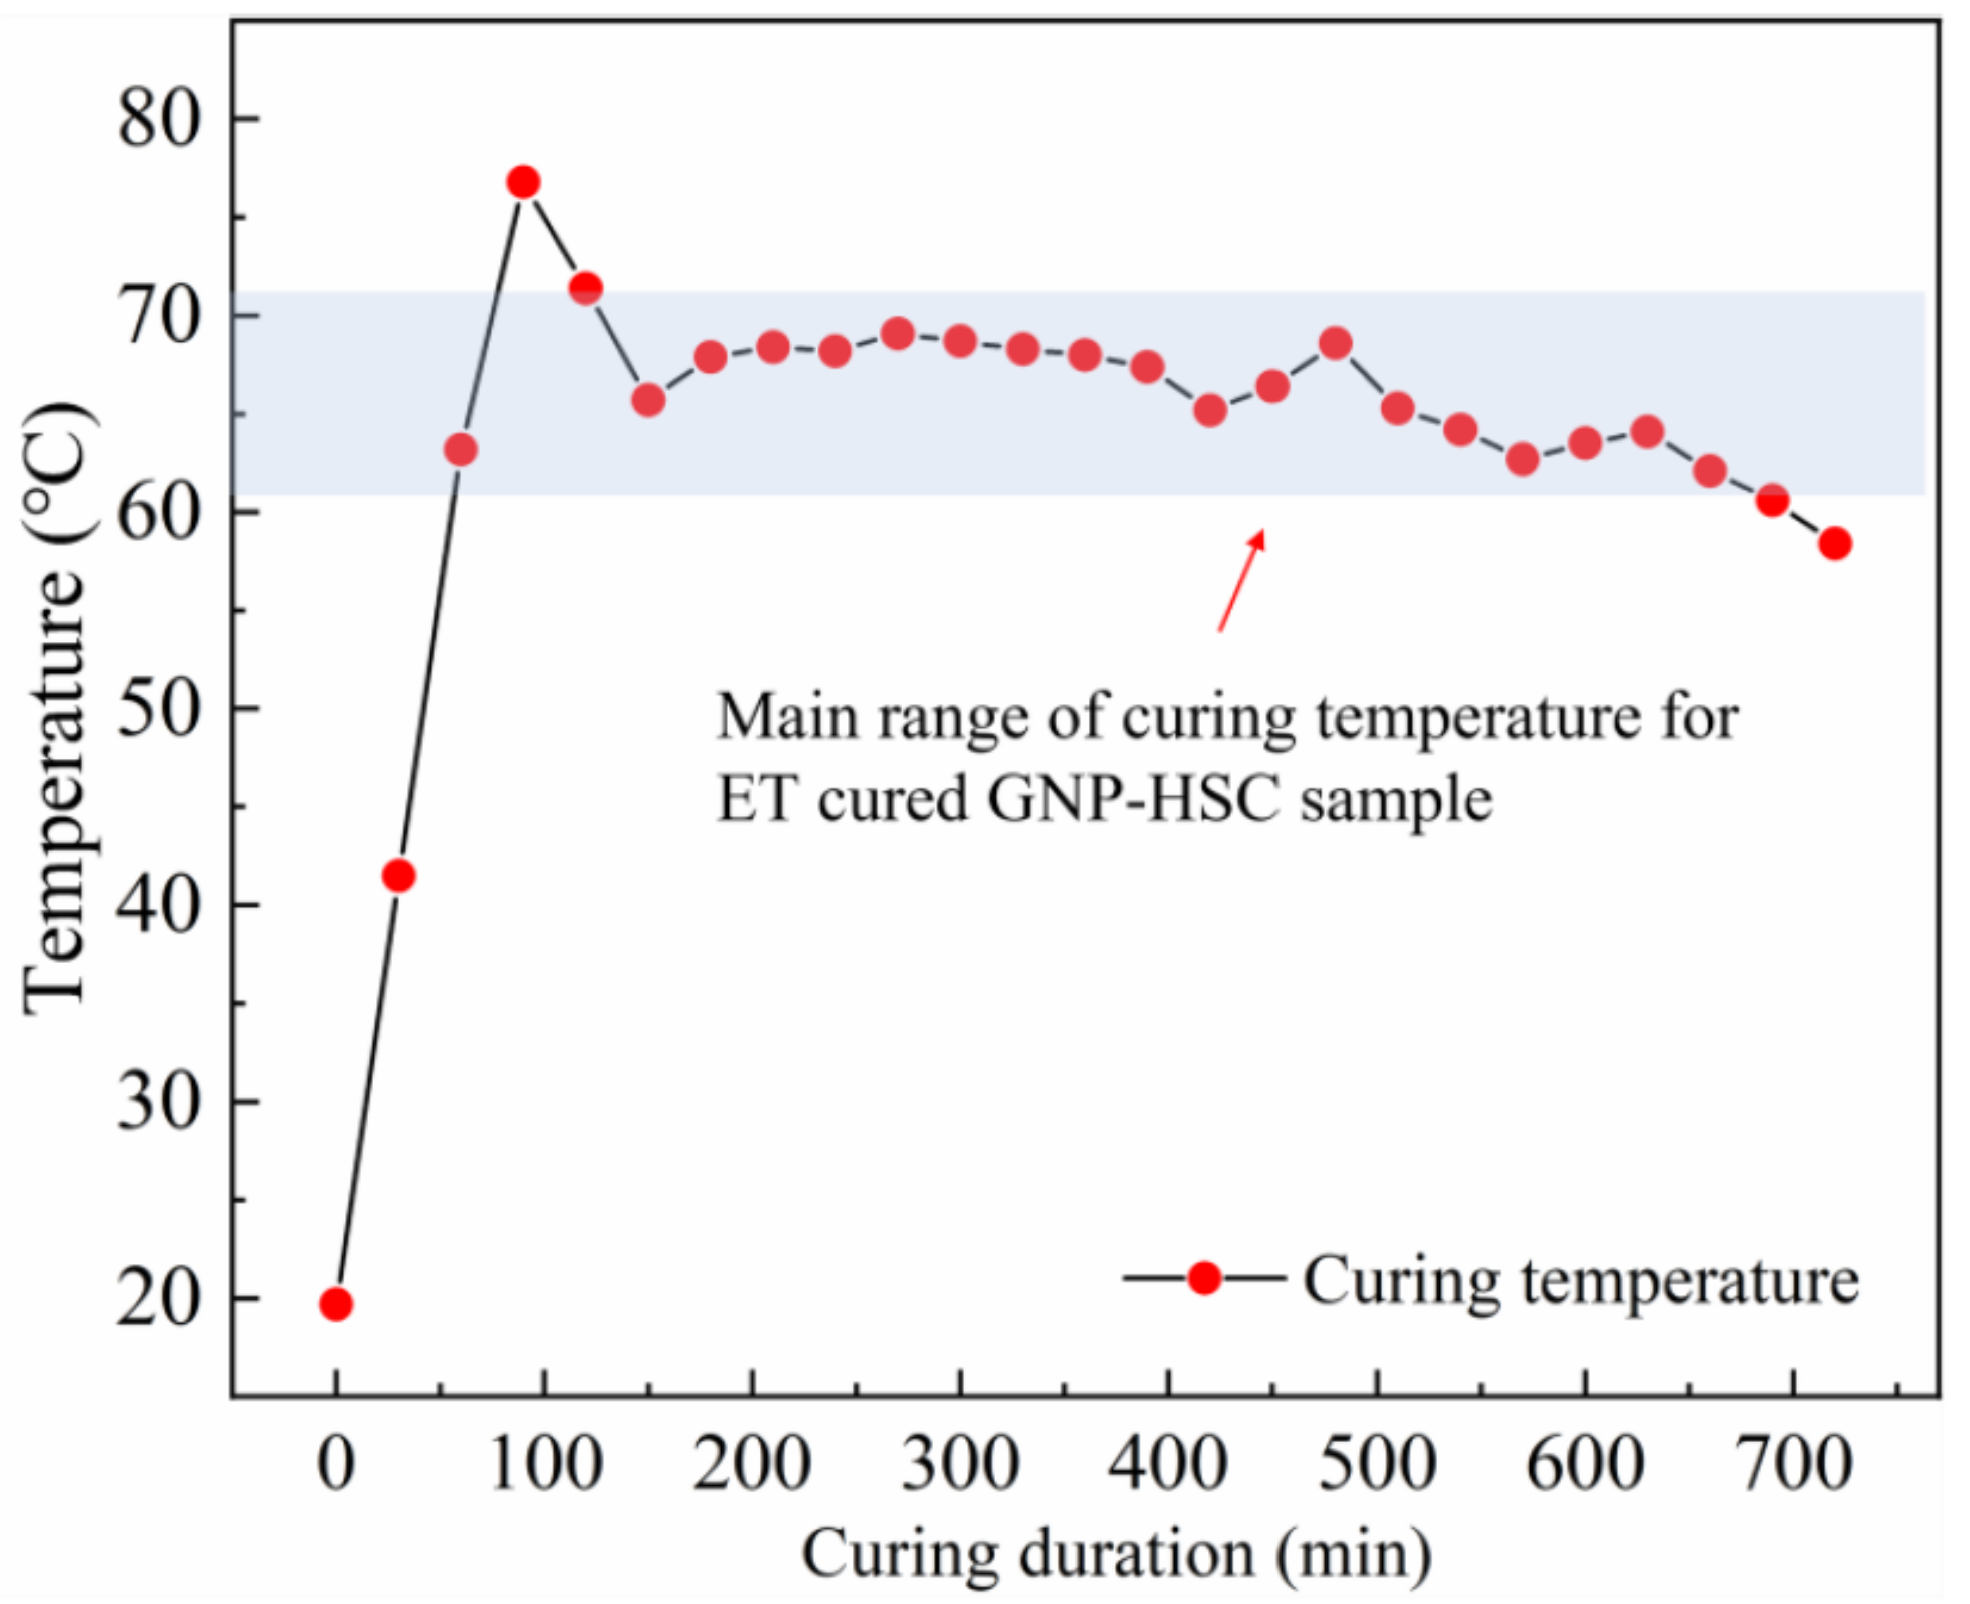
- The optimal addition content of conductive steel fibers was numerically and experimentally determined to be 2.5 vol%. The temperature development of HSC samples cured by ET curing under −20 °C was recorded. The ET-cured samples exhibited great temperature development regularity and the curing temperature of the sample was maintained in the range of 60~70 °C.
- (2)
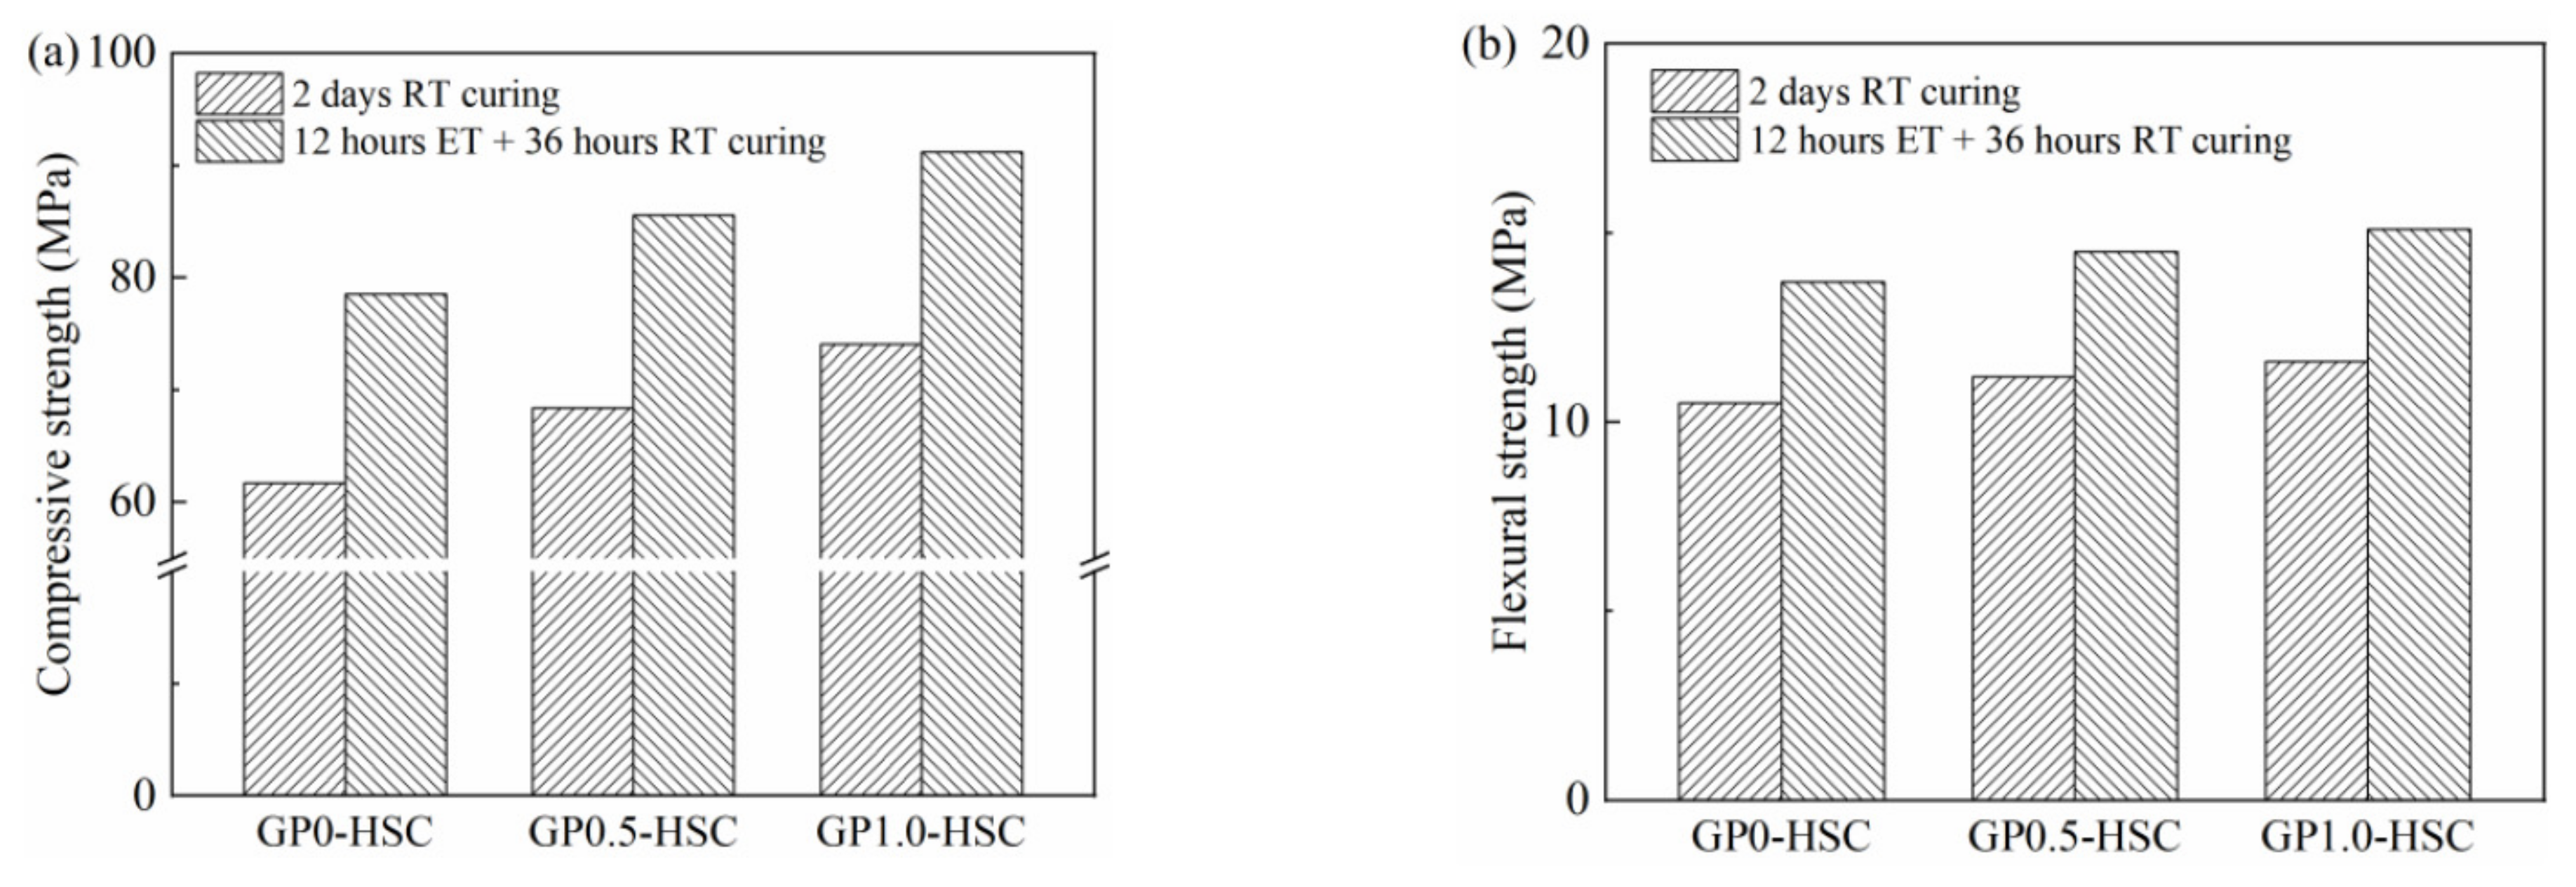
- The incorporation of GNP could effectively enhance the mechanical properties of HSC samples. In particular, the compressive strengths of the 12 h ET-cured GNP0.5-HSC and GNP1.0-HSC samples, respectively, reached up to 85.6 and 91.2 MPa with further 36 h RT curing, which are 9.0% and 16.2% higher than that of the ET-cured sample with no GNP addition. Moreover, the implementation of ET curing is also advantageous for the performance of GNP-HSC samples: with the same GNP content added, ET-cured samples possessed higher mechanical properties than RT-cured samples.
- (3)
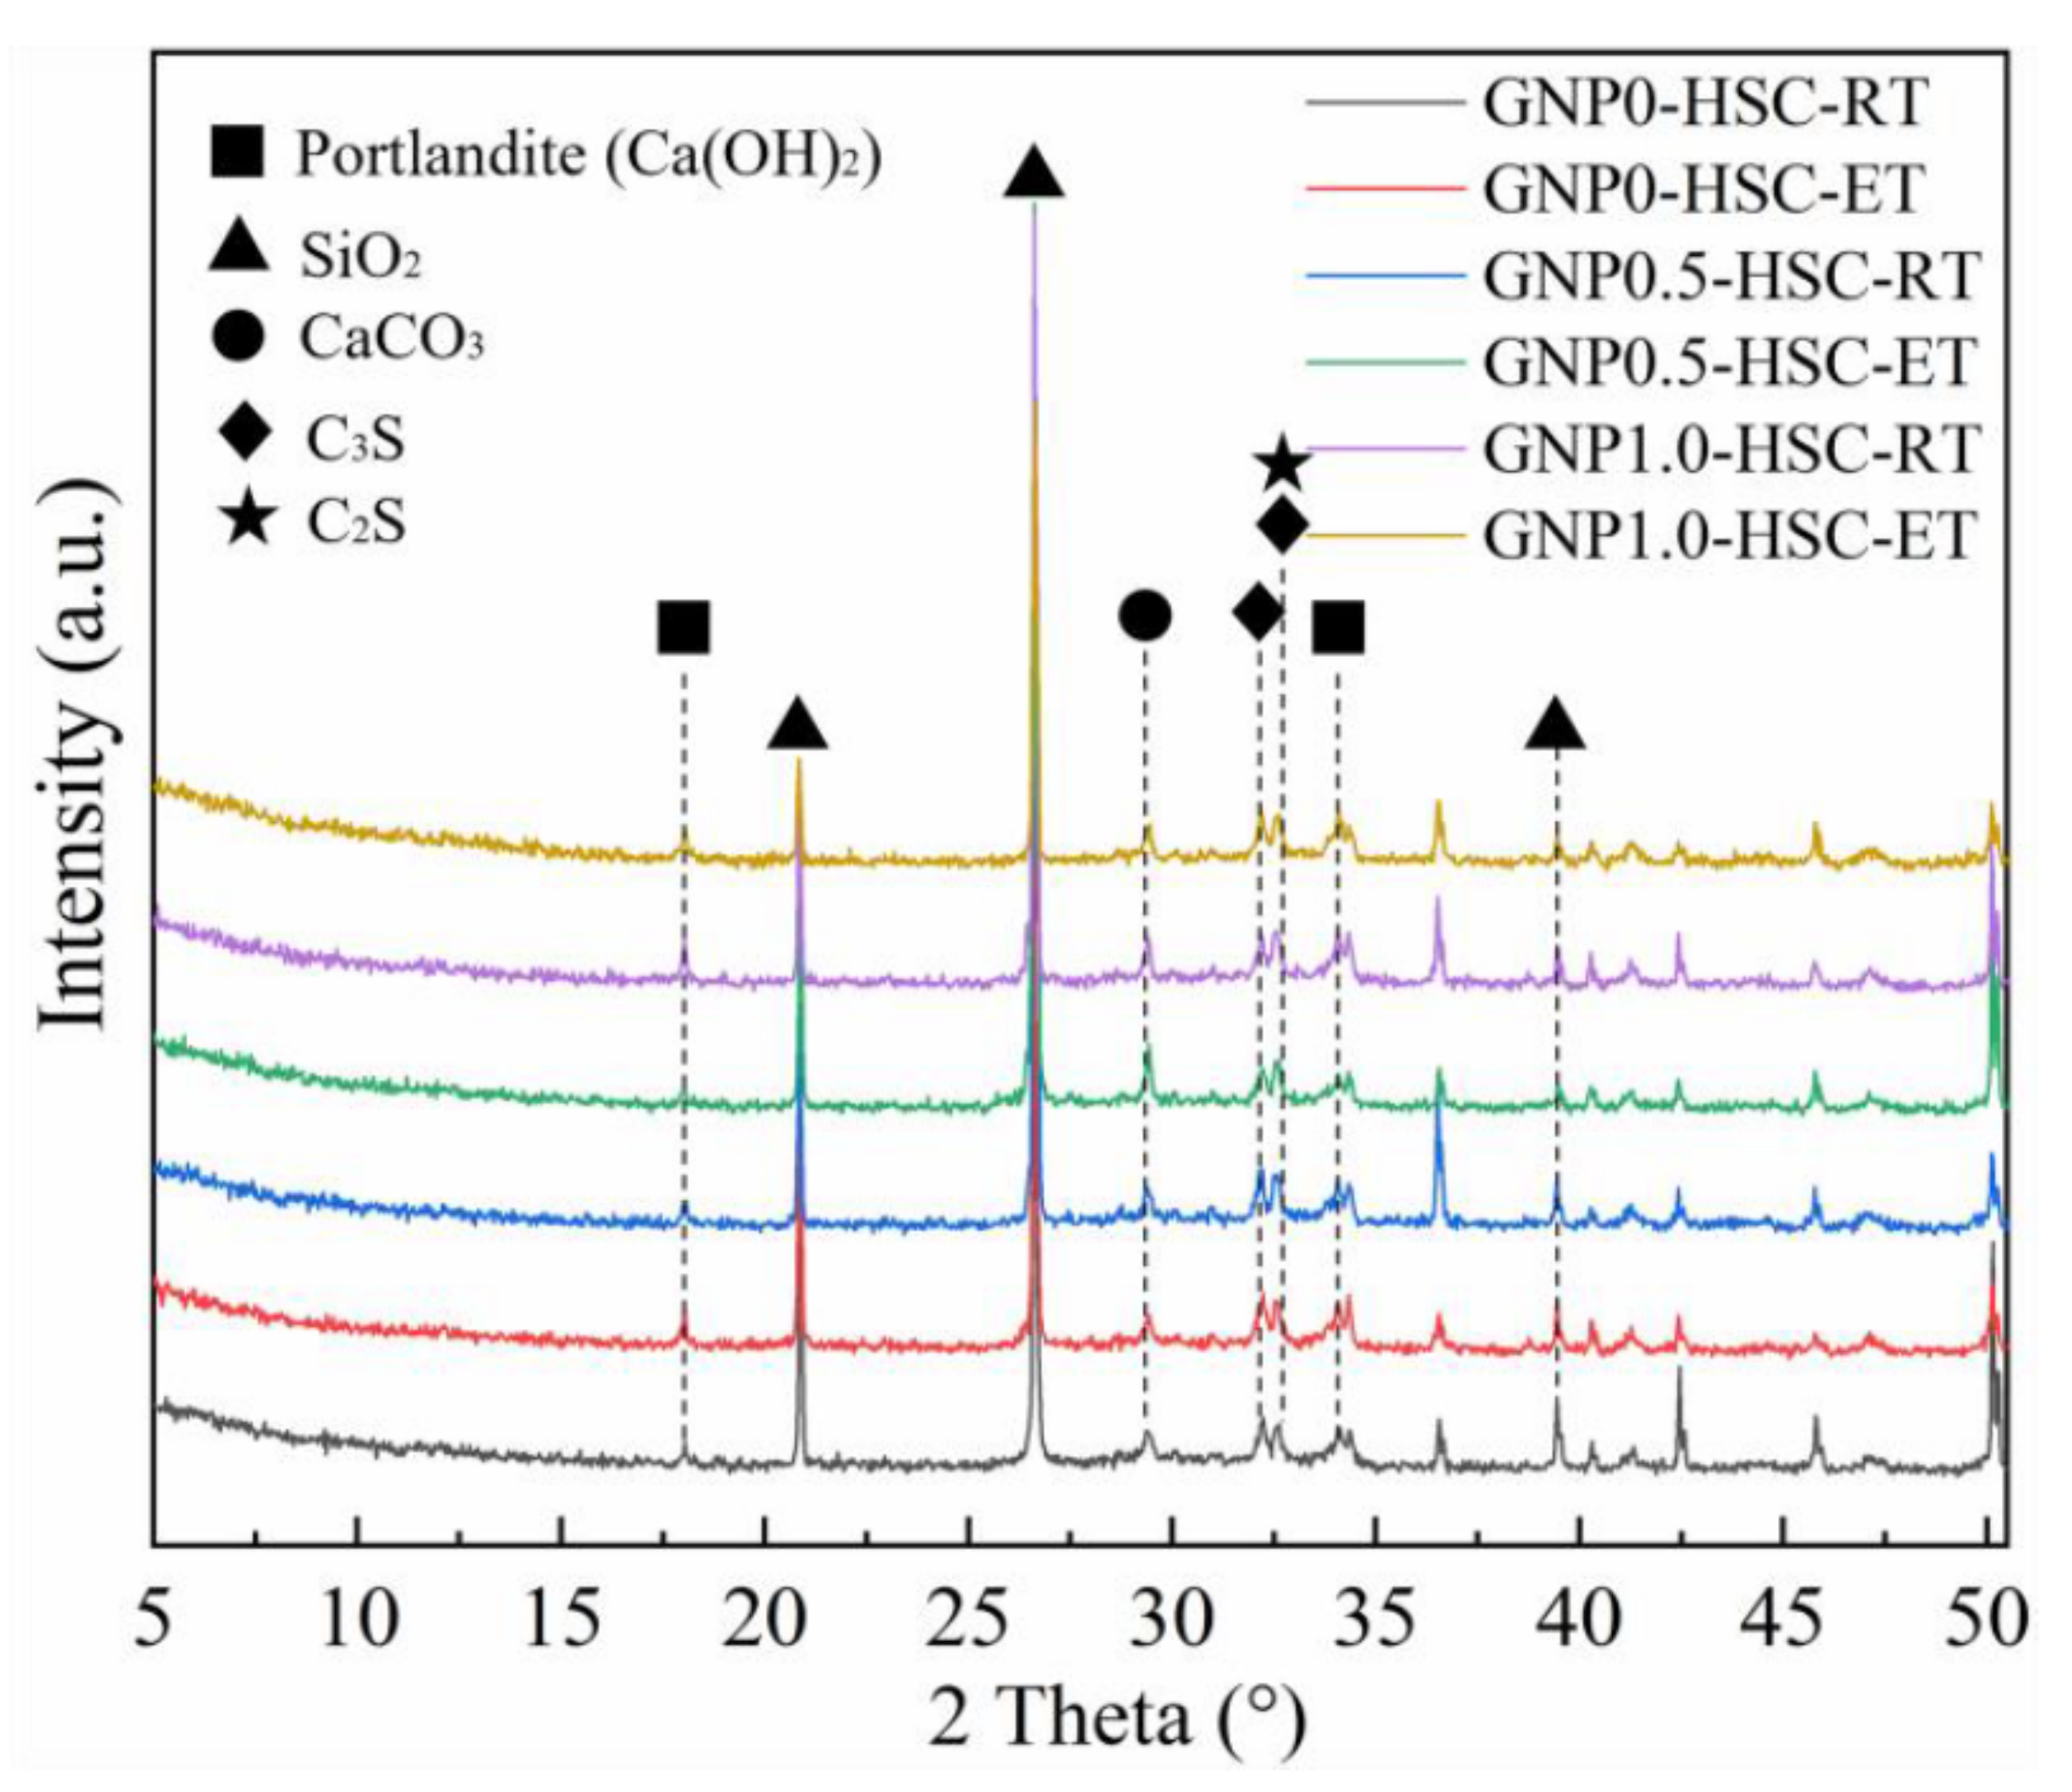
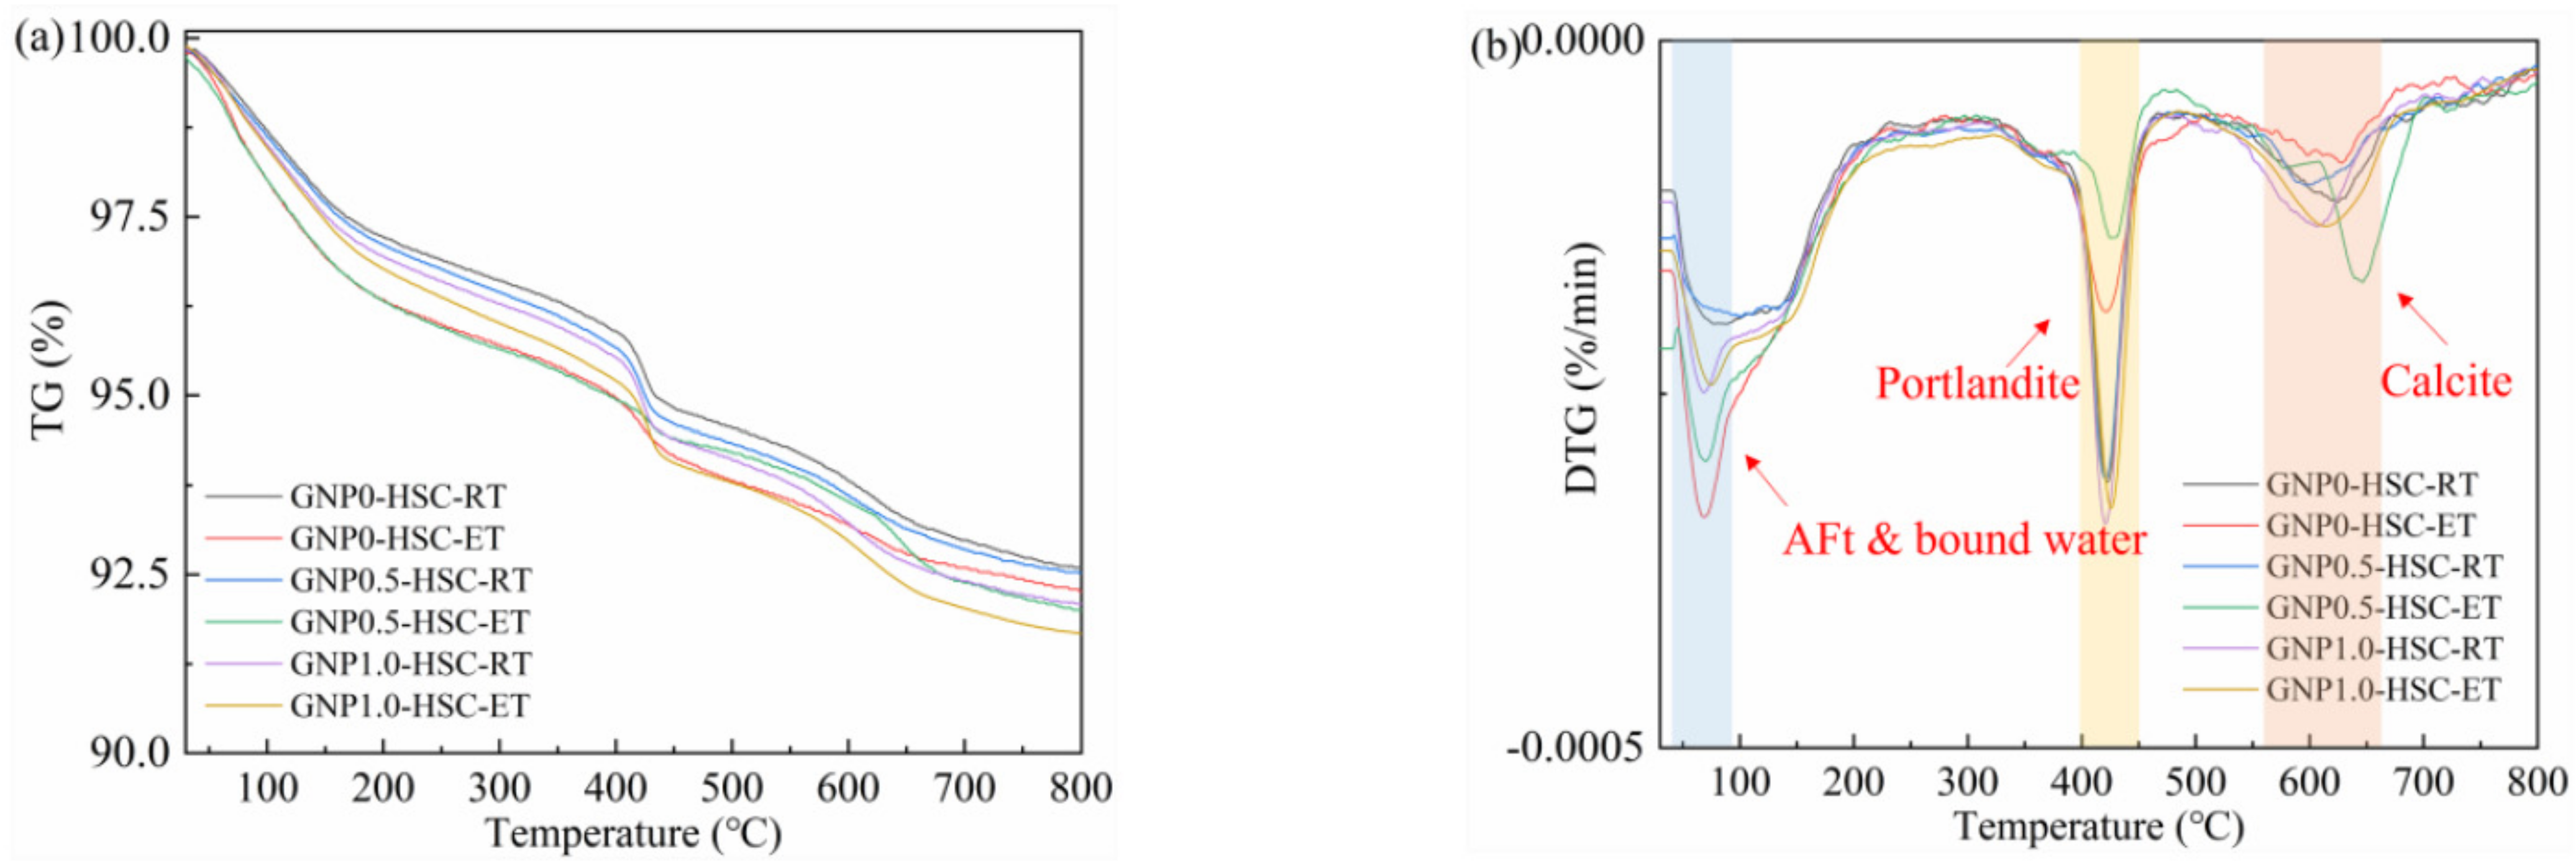
- The results of the XRD, TG and SEM analyses suggest that the incorporation of GNP can stimulate the hydration reaction in ET-cured GNP-HSC samples with a higher hydration degree and denser microstructure, emphasizing the superiority of GNP incorporation for the performance of ET-cured samples for winter concrete construction in cold regions.
Author Contributions
Funding
Data Availability Statement
Conflicts of Interest
References
- Nmai, C.K. Recent Advances in Ultra-high Performance Concrete. J. Korean Recycl. Constr. Resour. Inst. 2013, 1, 163–172. [Google Scholar] [CrossRef] [Green Version]
- He, S.; Qiu, J.; Li, J.; Yang, E.H. Strain hardening ultra-high performance concrete (SHUHPC) incorporating CNF-coated polyethylene fibers. Cem. Concr. Res. 2017, 98, 50–60. [Google Scholar] [CrossRef]
- Fan, D.Q.; Yu, R.; Shui, Z.H.; Wu, C.F.; Song, Q.L.; Liu, Z.J.; Sun, Y.; Gao, X.; He, Y.J. A new design approach of steel fibre reinforced ultra-high performance concrete composites: Experiments and modeling. Cem. Concr. Compos. 2020, 110, 103597. [Google Scholar] [CrossRef]
- Shi, C.; Wu, Z.; Xiao, J.; Wang, D.; Huang, Z.; Fang, Z. A review on ultra high performance concrete: Part I. Raw materials and mixture design. Constr. Build. Mater. 2015, 101, 741–751. [Google Scholar] [CrossRef]
- Ma, B.; Mei, J.; Tan, H.; Li, H.; Liu, X.; Jiang, W.; Zhang, T. Effect of Nano Silica on Hydration and Microstructure Characteristics of Cement High Volume Fly Ash System under Steam Curing. J. Wuhan Univ. Technol. Mater. Sci. Ed. 2019, 34, 604–613. [Google Scholar] [CrossRef]
- Yazici, H.; Yardimci, M.Y.; Aydin, S.; Karabulut, A.Ş. Mechanical properties of reactive powder concrete containing mineral admixtures under different curing regimes. Constr. Build. Mater. 2009, 23, 1223–1231. [Google Scholar] [CrossRef]
- Yazici, H.; Deniz, E.; Baradan, B. The effect of autoclave pressure, temperature and duration time on mechanical properties of reactive powder concrete. Constr. Build. Mater. 2013, 42, 53–63. [Google Scholar] [CrossRef]
- Kahanji, C.; Ali, F.; Nadjai, A.; Alam, N. Effect of curing temperature on the behaviour of UHPFRC at elevated temperatures. Constr. Build. Mater. 2018, 182, 670–681. [Google Scholar] [CrossRef]
- Liu, J.; Li, Y.; Yang, Y.; Cui, Y. Effect of low temperature on hydration performance of the complex binder of silica fume-portland cement. J. Wuhan Univ. Technol. Mater. Sci. Ed. 2014, 29, 75–81. [Google Scholar] [CrossRef]
- Polat, R.; Demirboǧa, R.; Karakoç, M.B.; Türkmen, I. The influence of lightweight aggregate on the physico-mechanical properties of concrete exposed to freeze-thaw cycles. Cold Reg. Sci. Technol. 2010, 60, 51–56. [Google Scholar] [CrossRef]
- Wang, L.; Fan, G.; Yang, H.; Wang, Y. Comparison of fly ash, PVA fiber, MgO and shrinkage-reducing admixture on the frost resistance of face slab concrete via pore structural and fractal analysis. Fractals 2021, 29, 2140002. [Google Scholar] [CrossRef]
- ACI 306.1-90; Standard Specification for Cold Weather Concreting. American Concrete Institution: Farmington Hills, MI, USA, 2002; pp. 1–5.
- ACI Committee 306 Cold Weather Concreting. In Proceedings of the American Concrete Institute; Elsevier Ltd.: Amsterdam, The Netherlands, 2010.
- Kim, J.K.; Chu, I.Y.; Yi, S.T. Minimum curing time for preventing frost damage of early-age concrete. IES J. Part A Civ. Struct. Eng. 2008, 1, 209–217. [Google Scholar] [CrossRef]
- Koh, K.T.; Ryu, G.S.; Lee, J.H. Effect of curing method on the strength development and freezing-thawing durability of the concrete incorporating high volume blast-furnace slag subjected to initial frost damage. Adv. Mater. Res. 2013, 602–604, 962–967. [Google Scholar] [CrossRef]
- Barna, L.A.; Seman, P.M.; Korhonen, C.J. Energy-efficient approach to cold-weather concreting. J. Mater. Civ. Eng. 2011, 23, 1544–1551. [Google Scholar] [CrossRef]
- Liu, Y.; Wang, M.; Wang, W. Ohmic heating curing of electrically conductive carbon nanofiber/cement-based composites to avoid frost damage under severely low temperature. Compos. Part A Appl. Sci. Manuf. 2018, 115, 236–246. [Google Scholar] [CrossRef]
- Ziolkowski, M.; Kovtun, M. Confined-Direct Electric Curing of NaOH-activated fly ash based brick mixtures under free drainage conditions: Part 1. Factorial experimental design. Constr. Build. Mater. 2017, 155, 1050–1062. [Google Scholar] [CrossRef] [Green Version]
- Tian, W.; Liu, Y.; Wang, W. Multi-structural evolution of conductive reactive powder concrete manufactured by enhanced ohmic heating curing. Cem. Concr. Compos. 2021, 123, 104199. [Google Scholar] [CrossRef]
- Liu, Y.; Wang, M.; Wang, W. Electric induced curing of graphene/cement-based composites for structural strength formation in deep-freeze low temperature. Mater. Des. 2018, 160, 783–793. [Google Scholar] [CrossRef]
- Garas, V.Y.; Kurtis, K.E.; Kahn, L.F. Creep of UHPC in tension and compression: Effect of thermal treatment. Cem. Concr. Compos. 2012, 34, 493–502. [Google Scholar] [CrossRef]
- Rao, R.; Fu, J.; Chan, Y.; Tuan, C.Y.; Liu, C. Steel fiber confined graphite concrete for pavement deicing. Compos. Part B Eng. 2018, 155, 187–196. [Google Scholar] [CrossRef]
- Jiang, L.; Liu, Z.; Yu, Y.; Ben, X. The effect of graphene on the conductivity of magnesium sulfate cement. Constr. Build. Mater. 2021, 312, 125342. [Google Scholar] [CrossRef]
- BS EN 12390-3; Testing Hardened Concrete Part 3: Compressive Strength of Test Specimens. British Standards Institution: London, UK, 2009.
- Wang, M.; Al-Tabbaa, A.; Wang, W. Improving discrete particle packing models for the microstructural formation simulation of Portland cement. Constr. Build. Mater. 2019, 229, 116841. [Google Scholar] [CrossRef]
- Al-Raoush, R.; Papadopoulos, A. Representative elementary volume analysis of porous media using X-ray computed tomography. Powder Technol. 2010, 200, 69–77. [Google Scholar] [CrossRef]
- Wang, M.; Liu, Y.; Qi, B.; Al-Tabbaa, A.; Wang, W. Percolation and conductivity development of the rod networks within randomly packed porous media. Compos. Part B Eng. 2020, 187, 107837. [Google Scholar] [CrossRef]
- Shen, P.; Lu, L.; He, Y.; Wang, F.; Hu, S. The effect of curing regimes on the mechanical properties, nano-mechanical properties and microstructure of ultra-high performance concrete. Cem. Concr. Res. 2019, 118, 1–13. [Google Scholar] [CrossRef]
- Qin, L.; Gao, X. Recycling of waste autoclaved aerated concrete powder in Portland cement by accelerated carbonation. Waste Manag. 2019, 89, 254–264. [Google Scholar] [CrossRef] [PubMed]
- Von Werder, J.; Simon, S.; Lehmann, C.; Selleng, C.; Fontana, P.; Meng, B. Autoclaving of ultra-high performance concrete (UHPC). Ce/Papers 2018, 2, 131–136. [Google Scholar] [CrossRef]
- Huang, J.; Li, W.; Huang, D. Fractal analysis on pore structure and hydration of magnesium oxysulfate cements by first principle, thermodynamic and microstructure-based methods. Fractal Fract. 2021, 5, 164. [Google Scholar] [CrossRef]
- Ma, S.; Li, W.; Zhang, S.; Hu, Y.; Shen, X. Study on the hydration and microstructure of Portland cement containing diethanol-isopropanolamine. Cem. Concr. Res. 2015, 67, 122–130. [Google Scholar] [CrossRef]
- Shao, Y.; Rostami, V.; He, Z.; Boyd, A.A. Accelerated carbonation of portland limestone cement. J. Mater. Civ. Eng. 2014, 26, 117–124. [Google Scholar] [CrossRef]
- Fang, Y.; Chang, J. Microstructure changes of waste hydrated cement paste induced by accelerated carbonation. Constr. Build. Mater. 2015, 76, 360–365. [Google Scholar] [CrossRef]
- Lei, W.; Luo, R.; Zhang, W.; Jin, M. Effects of fineness and content of phosphorus slag on cement hydration, permceability, pore structure and fractal dimension of concrete. Fractals 2021, 29, 2140004. [Google Scholar] [CrossRef]
- Xiao, J.; Xu, Z.; Murong, Y.; Jiang, H.; Qu, W. Effect of chemical composition of fine aggregate on the frictional behavior of concrete–soil interface under sulfuric acid environment. Fractal Fract. 2022, 6, 22. [Google Scholar] [CrossRef]
- Lei, W.; Zeng, X.; Yang, H.; Lv, X. Investigation and application of fractal theory in cement-based materials: A review. Fractal Fract. 2021, 5, 247. [Google Scholar] [CrossRef]


| Oxide Species | SiO2 | Al2O3 | Fe2O3 | MgO | CaO | SO3 |
|---|---|---|---|---|---|---|
| Oxide content (wt%) | 20.86 | 5.47 | 3.94 | 1.73 | 62.23 | 2.66 |
| Oxide Species | CaO | SiO2 | Al2O3 | MgO | K2O | Na2O | Fe2O3 |
|---|---|---|---|---|---|---|---|
| Content (wt%) | 0.63 | 87.67 | 0.28 | 3.41 | 1.2 | 4.12 | 0.60 |
| Cement (kg/m3) | Sand (kg/m3) | w/b | Silica Fume (kg/m3) | Steel Fiber (vol%) | SP (wt%) |
|---|---|---|---|---|---|
| 1171 | 1404 | 0.2 | 234 | 0 | 1 |
| 1171 | 1404 | 0.2 | 234 | 0.5 | 1.5 |
| 1171 | 1404 | 0.2 | 234 | 1 | 2 |
| 1171 | 1404 | 0.2 | 234 | 1.5 | 2 |
| 1171 | 1404 | 0.2 | 234 | 2 | 2.5 |
| 1171 | 1404 | 0.2 | 234 | 2.5 | 2.5 |
| 1171 | 1404 | 0.2 | 234 | 3 | 3 |
Publisher’s Note: MDPI stays neutral with regard to jurisdictional claims in published maps and institutional affiliations. |
© 2022 by the authors. Licensee MDPI, Basel, Switzerland. This article is an open access article distributed under the terms and conditions of the Creative Commons Attribution (CC BY) license (https://creativecommons.org/licenses/by/4.0/).
Share and Cite
Zhou, Z.; Zhang, B.; Wang, M.; Wang, W. Early-Age Performance of Graphene-Nanoplatelet-Modified High-Strength Concrete Cured by Electric Thermal Curing in Severe Cold Regions. Buildings 2022, 12, 86. https://doi.org/10.3390/buildings12020086
Zhou Z, Zhang B, Wang M, Wang W. Early-Age Performance of Graphene-Nanoplatelet-Modified High-Strength Concrete Cured by Electric Thermal Curing in Severe Cold Regions. Buildings. 2022; 12(2):86. https://doi.org/10.3390/buildings12020086
Chicago/Turabian StyleZhou, Zheng, Boyi Zhang, Mingzhi Wang, and Wei Wang. 2022. "Early-Age Performance of Graphene-Nanoplatelet-Modified High-Strength Concrete Cured by Electric Thermal Curing in Severe Cold Regions" Buildings 12, no. 2: 86. https://doi.org/10.3390/buildings12020086