Article

Performance-Based Bi-Objective Retrofit Optimization of Building Portfolios Considering Uncertainties and Environmental Impacts

1
Shenzhen Urban Transport Planning Center Co., Ltd., Shenzhen 518057, China
2
Department of Civil and Environmental Engineering, The Hong Kong Polytechnic University, Hung Hom, Kowloon, Hong Kong 999077, China
*
Author to whom correspondence should be addressed.
Buildings 2022, 12(1), 85; https://doi.org/10.3390/buildings12010085
Submission received: 12 December 2021 / Revised: 12 January 2022 / Accepted: 14 January 2022 / Published: 17 January 2022
(This article belongs to the Section Building Structures)

Abstract

:
It is essential to assess the performance of a community under probable hazard scenarios and to provide possible performance enhancements. This requires establishing performance indicators, an assessment method, and an optimization technique to provide mitigation alternatives. In this paper, multiple performance indicators are utilized to assess the performance of a community building portfolio including loss, downtime, and environmental impact (e.g., CO2 emissions). The performance of a community is assessed by utilizing a performance-based assessment methodology. Then, the performance indicators are utilized as performance objectives to be optimized considering non-dominated sorting and crowding distance evolutionary optimization techniques. The framework utilizes retrofit alternatives for each building in a community and provides Pareto-optimal solutions for considered performance objectives given retrofit cost. This process of performance assessment and optimization is repeated by utilizing the Monte Carlo approach to consider uncertainties. Finally, the Pareto-optimal solutions are utilized to evaluate the retrofit programs for community building portfolios in terms of considered performance indicators.

1. Introduction

Most of the building stock is privately owned and the decision-making related to the choices including the type of construction, upgradation, among others is partially decentralized (i.e., buildings construction and upgradation related activities are not entirely centrally planned by a government body or community stakeholders). Hence, the stakeholders and decision-makers must work in collaboration and form an organizational structure to reduce the hazard impacts [1]. There exist various levels of organizational structures ranging from individuals to families, neighborhoods to communities, and communities to states and nations [2]. Different levels of organizational structure perform different functions. For instance, the construction of main roads and bridges is decided on a state level, the mitigation support may be provided at a state or country level. The planning to assess the hazards, characterize the built environment, assess the performance, and identify possible mitigation alternatives can be performed on a community level [3]. Hence, it is important to consider the performance of buildings on a portfolio level for possible collective enhancements.
The performance of buildings is usually assessed in terms of engineering demand parameters [4,5,6,7]. These parameters provide engineering information that is difficult to comprehend for community stakeholders and decision-makers. For instance, given a possible hazard scenario, engineering demand parameters for a particular building may include story drifts, spectral accelerations, deflections, curvatures, among others [8,9,10,11]. These parameters are checked against the allowable limits to verify the acceptable performance of a building under hazards [12,13,14,15]. More recently, demand parameters that may be more meaningful to the community stakeholders are being utilized to better assess the performance of a community [16,17,18]. The utilized demand parameters may include total casualties, total repair costs, total repair time under a given hazard scenario that gives a meaningful performance assessment parameter which community stakeholders can understand [19,20,21]. The demand parameters are usually correlated with the discrete damage states of buildings via fragility functions which are lognormal cumulative distribution functions, providing the probability of exceeding damage states given intensity measures. Different damage states provide contributions of varying percent to the assessment of demand parameters which are discussed in various methods available in literature including FEMA, HAZUS, among others [22,23,24]. These demand parameters can provide an intuitive understanding of the performance of buildings under a hazard and are utilized in this research to assess and enhance community performance.
The collective demand parameters on a community level are assessed by utilizing performance indicators. The performance indicators considered in the literature include risk, resilience, and sustainability [25,26,27]. The risk performance indicator is related to the immediate impact of extreme events and has been extensively utilized to assess the performance of community building portfolios under hazard scenarios [28,29,30]. These immediate impacts may include total number of casualties, total waste generated, total repair costs on a community level, among others. The resilience performance indicator is related to the consequences arising due to the non-functionality of a community building portfolio such as population outmigration, business interruptions, among others [31,32,33]. Resilience on a community building portfolio level has been recently utilized and is often measured in relation to the downtime assessments of building portfolios [34,35,36,37,38,39]. The sustainability performance indicator considers consequences on a community level which may compromise the ability of future generations to meet their needs [40,41]. For instance, the release of potential global warming gases during the repair activities from a hazard event would impact the environment negatively and may impact future generations. These performance indicators can cover a wide range of consequences, provide more meaningful and intuitive information, and can be utilized to make decisions and enhance performance. Although risk and downtime performance indicators have been utilized on a community building portfolio under hazard scenarios, however, the environmental performance indicator has not been considered. This research considers the sustainability performance indicator (e.g., CO2 emissions) in the performance assessment and enhancement of community building portfolios.
The performance assessment and enhancements considering multiple performance indicators against community-level retrofit costs require a bi-objective optimization approach. The community building portfolios consist of numerous buildings with different structural systems, functionalities, and different retrofit strategies which cannot be selected manually for the optimized performance. In the last two decades, the evolutionary multi-objective optimization approach has become increasingly popular because this technique does not require derivative information and is relatively easier to implement in variety of settings such as optimizing dynamic response of structural systems, design optimization, life-cycle optimization, among others in the context of structural engineering [42,43]. The method was first proposed by Holland [44], inspired by Darwin’s evolutionary theory of origin of species. Later, many multi-objective evolutionary algorithms were developed [45,46,47], the two most widely adopted being the strength Pareto evolutionary algorithm [48] and non-dominated sorting genetic algorithm [49]. In a community building portfolio under a hazard scenario, few researchers have employed one of these methods on a community level to solve optimization problem in a pre-hazard scenario. For instance, Zhang and Nicholson [50] proposed bi-objective optimization considering risk in terms of population dislocation and structural costs. Sutley et al. [51] considered risk and recovery-related objectives by coupling socio-economic aspects with the engineering systems. However, sustainability-related indicators and uncertainties have not been explored. According to the best of the authors’ knowledge, there have been no studies providing a performance-based bi-objective optimization framework for community building portfolios considering multiple performance indicators including sustainability and under uncertainties.
In this paper, a performance-based bi-objective optimization framework is proposed to evaluate Pareto-optimal solutions for risk, downtime, and environmental performance indicators against the retrofit costs on a community level. The proposed methodology consists of a performance-based assessment part to evaluate the performance objectives for all the individuals given each simulation, and the optimization part in which the population with a given number of individuals is utilized to optimize the performance objectives. The simulations are repeated N times to incorporate uncertainties in the damage, consequence assessments, and optimization steps. Finally, Pareto-optimal solutions are determined and utilized to develop retrofit programs to satisfy the required performance of community building portfolios. The framework is illustrated in a community with residential and commercial buildings of different structural systems, code configurations, fragility, and consequence functions, among others. This paper is organized into six sections: (1) Section 1 outlines the introduction of the paper, (2) Section 2 proposed a bi-objective optimization framework for community building portfolios, (3) Section 3 presents the performance-based assessment method to assess performance objectives, (4) Section 4 highlights the bi-objective evolutionary optimization method, (5) Section 5 presents an illustrative example, and (6) the final section presents the conclusions of the paper.

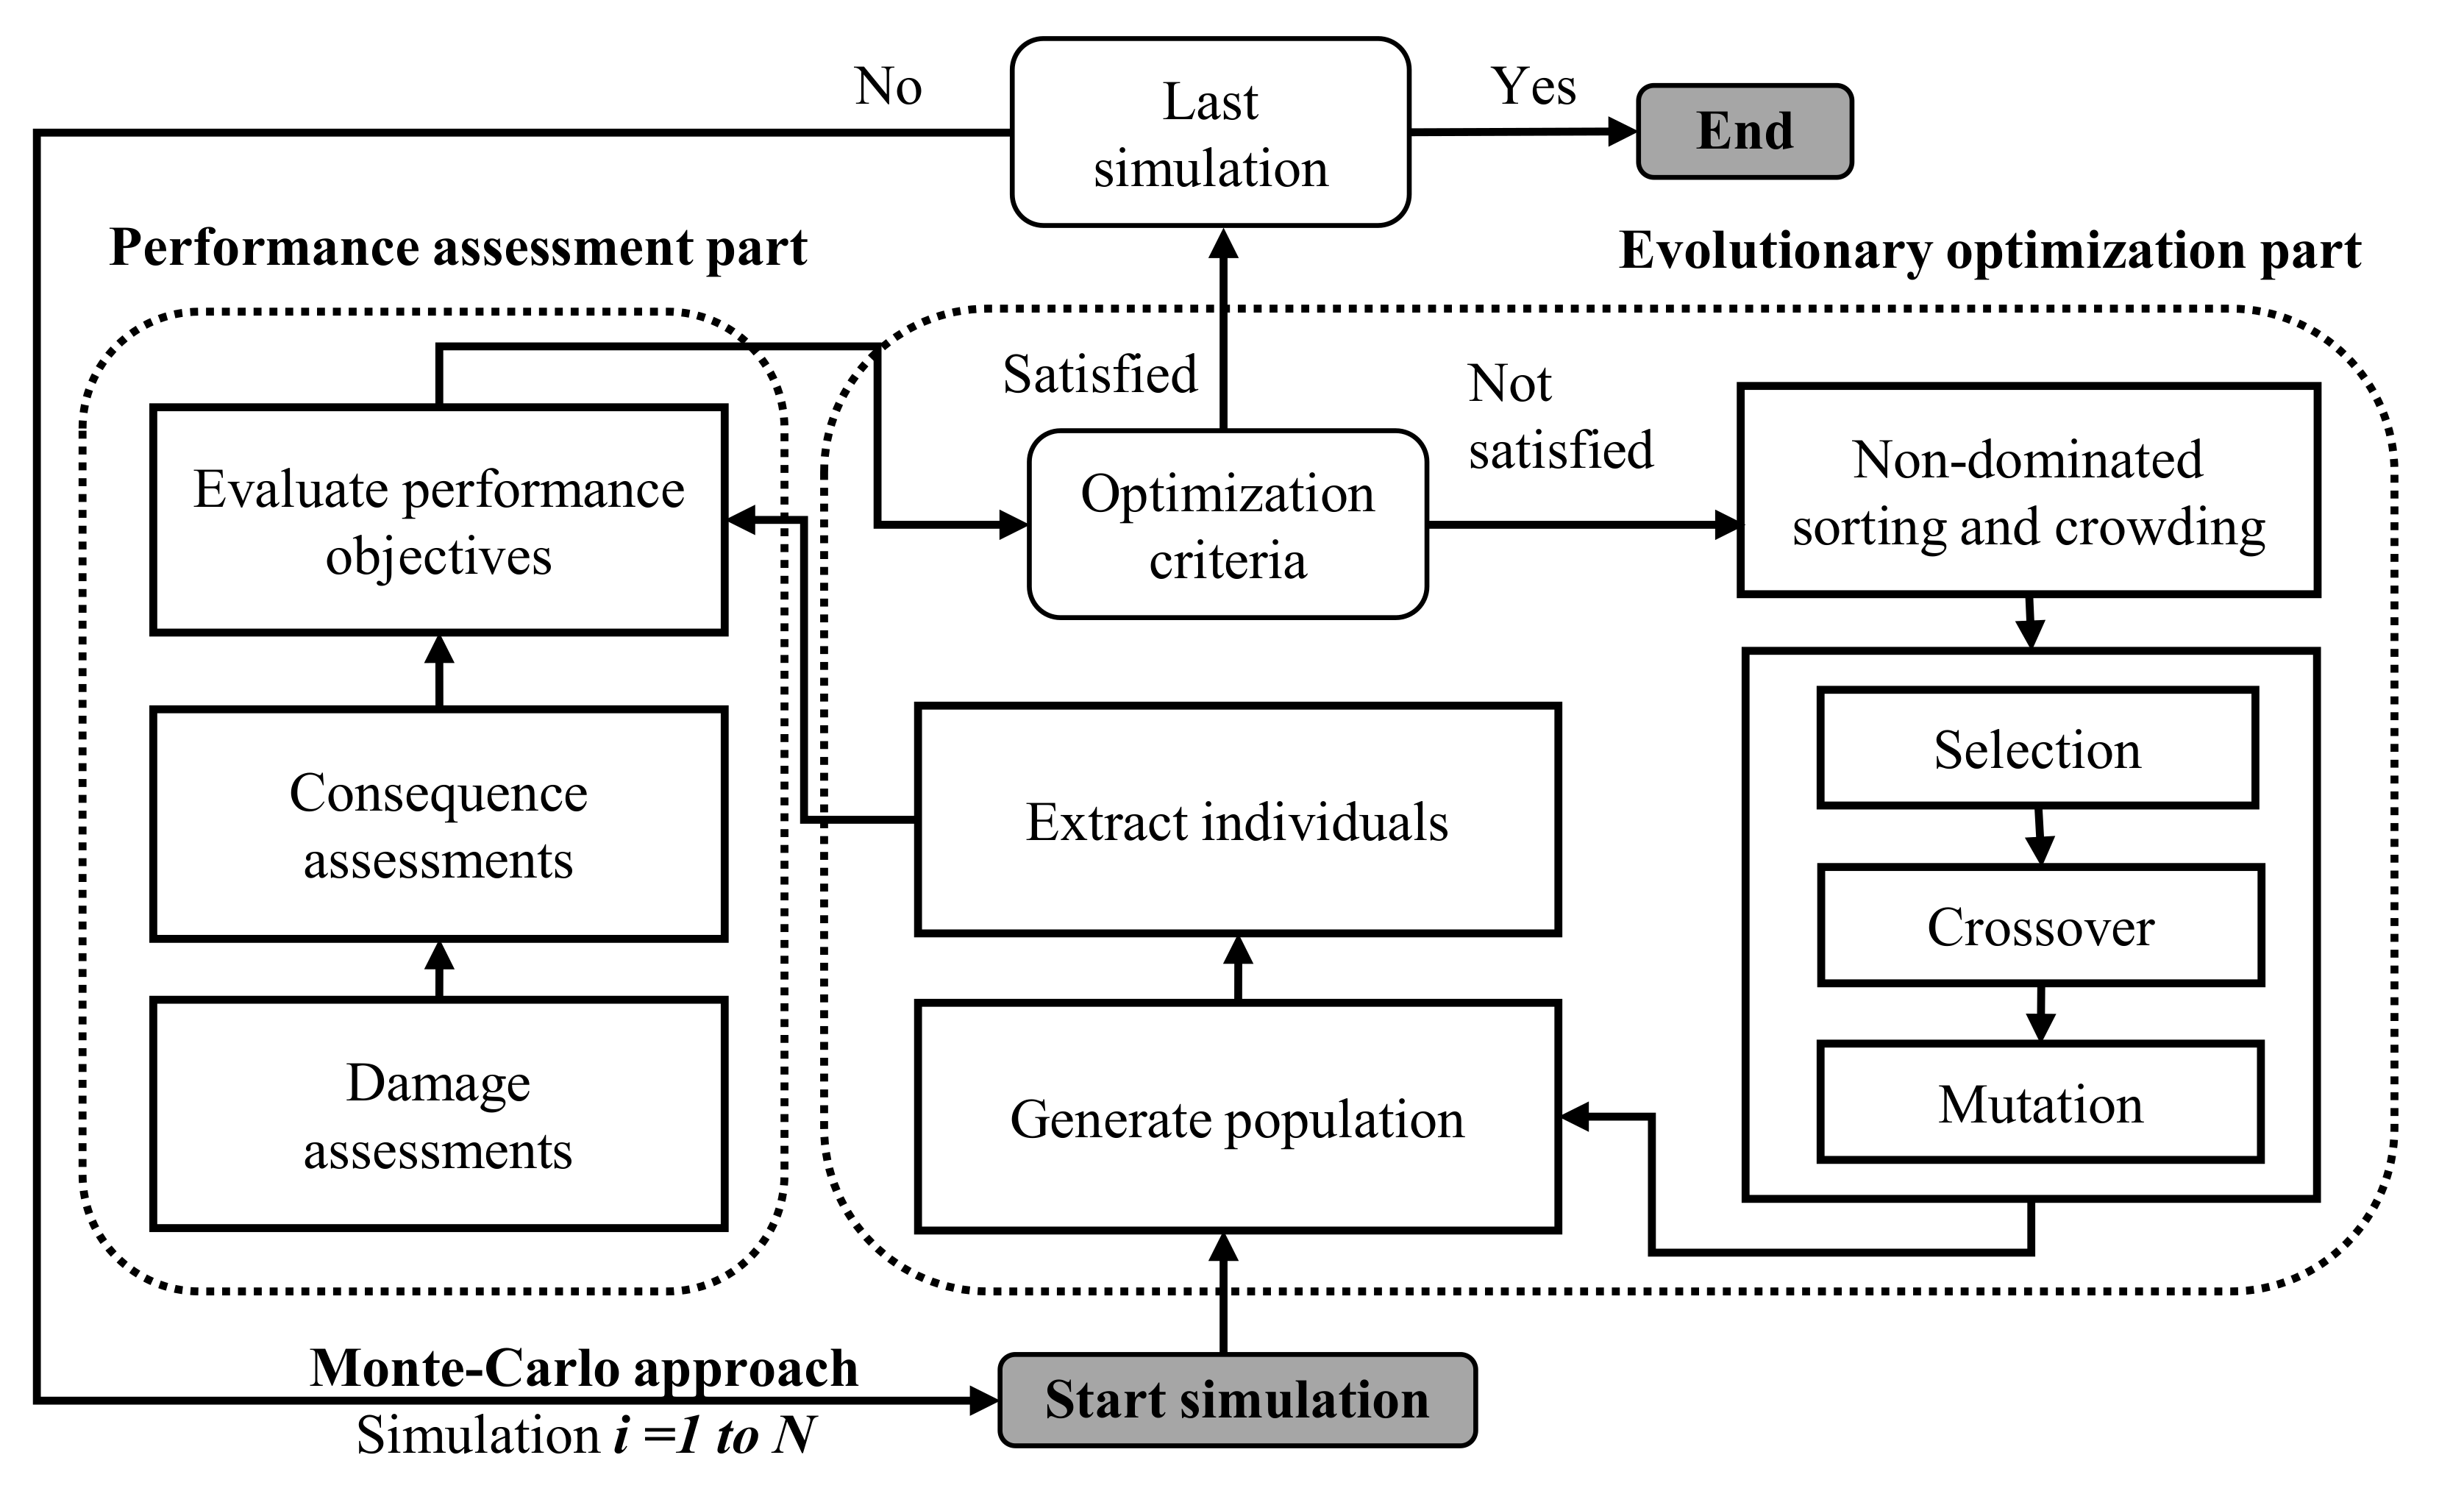
2. Proposed Optimization Framework for Community Building Portfolios

The proposed bi-objective retrofit optimization framework can be divided into two main parts: (1) performance assessment part, and (2) evolutionary optimization part. The performance assessment part is utilized to evaluate performance objectives and the evolutionary optimization part is utilized to evaluate the Pareto-optimal solutions by optimizing the performance objectives given retrofit alternatives. The proposed framework is shown in Figure 1, representing a single simulation from start to end. These simulations are repeated N times to incorporate uncertainties by utilizing the Monte Carlo approach [52]. In each simulation, a random value is extracted from distribution functions utilized in the framework including fragility functions and functions in the consequence assessment part. At the end of all the simulations, the results can be extracted in terms of distributions for damage assessments, consequence assessments, and Pareto-optimal solutions, among others.
The process starts by generating an initial population consisting of a certain number of individuals. Each individual consists of two parts: (1) chromosome, and (2) fitness functions. The fitness functions are utilized as the performance objectives of community building portfolios defined in terms of risk, downtime, and sustainability indicators. The performance objectives provide information related to the performance of a community under hazard events and can be optimized given retrofit costs on a community level. For instance, the fitness function for a risk performance indicator can be the total number of casualties given hazard scenario, or total repair costs of a given hazard event, among others, and will change based on the retrofit costs implemented on a community level. The chromosome can be considered as a scenario of community building portfolio having different types of genes. Each gene can be considered as a building in a community building portfolio and consists of two main parts: (1) allele, and (2) locus. The allele defines the retrofit alternative implemented for a particular building or no-retrofit implemented in the case of a reference building, and the locus defines the geospatial location of a particular building in a community building portfolio. The geospatial location will help identify the building and all the relevant assigned characteristics such as building type, structural system, code-level, floor area, story heights, among others. These evolutionary optimization terminologies in the context of community building portfolios are graphically presented in Figure 2.
The genes of all the individuals in the initial population are randomly assigned retrofit alternatives or no-retrofit, and fitness functions for all the individuals are determined utilizing a performance-based assessment approach. These individuals are then optimized by utilizing non-dominated sorting and crowding distance genetic algorithm and Pareto-optimal solutions are determined for all the simulations to incorporate uncertainties. The Pareto-optimal solutions are then utilized to assess the performance enhancement of a community building portfolio by providing retrofit programs. The subsequent sections discuss the two main parts of the framework in detail.

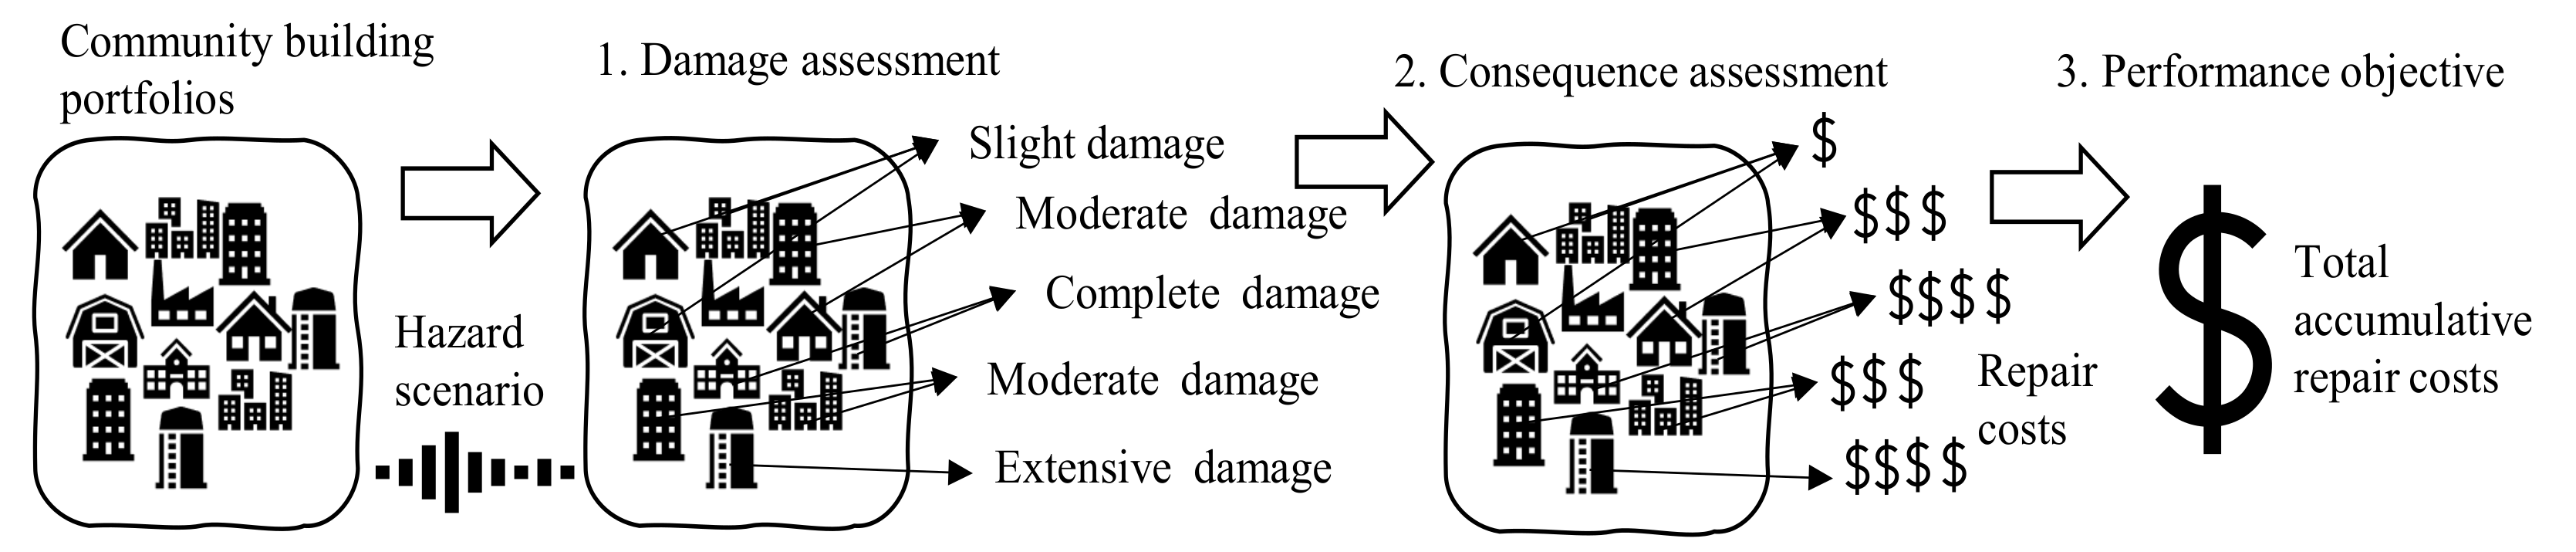
3. Performance-Based Community Objectives Assessment

The optimization framework requires evaluating the performance objectives at a community portfolio level in each iteration to assess the criteria. If the performance objectives satisfy the required criteria, the Pareto-optimal solutions can be extracted, otherwise the process of optimization continues and the iteration is repeated. The performance-based assessment methodology is implemented herein to provide community performance objectives for optimization. The community performance objectives are evaluated in three steps: (1) performing building-level damage assessment for all the buildings in a community given a hazard scenario, (2) performing building-level consequence assessment for all the buildings given the damage state of a building, and (3) accumulating the consequences of all the buildings to determine risk, downtime, and sustainability. For illustration, the performance objective assessment for risk performance indicator (i.e., total repair cost of a community’s given hazard scenario) is graphically presented in Figure 3. The subsequent sections provide further discussion related to these steps.

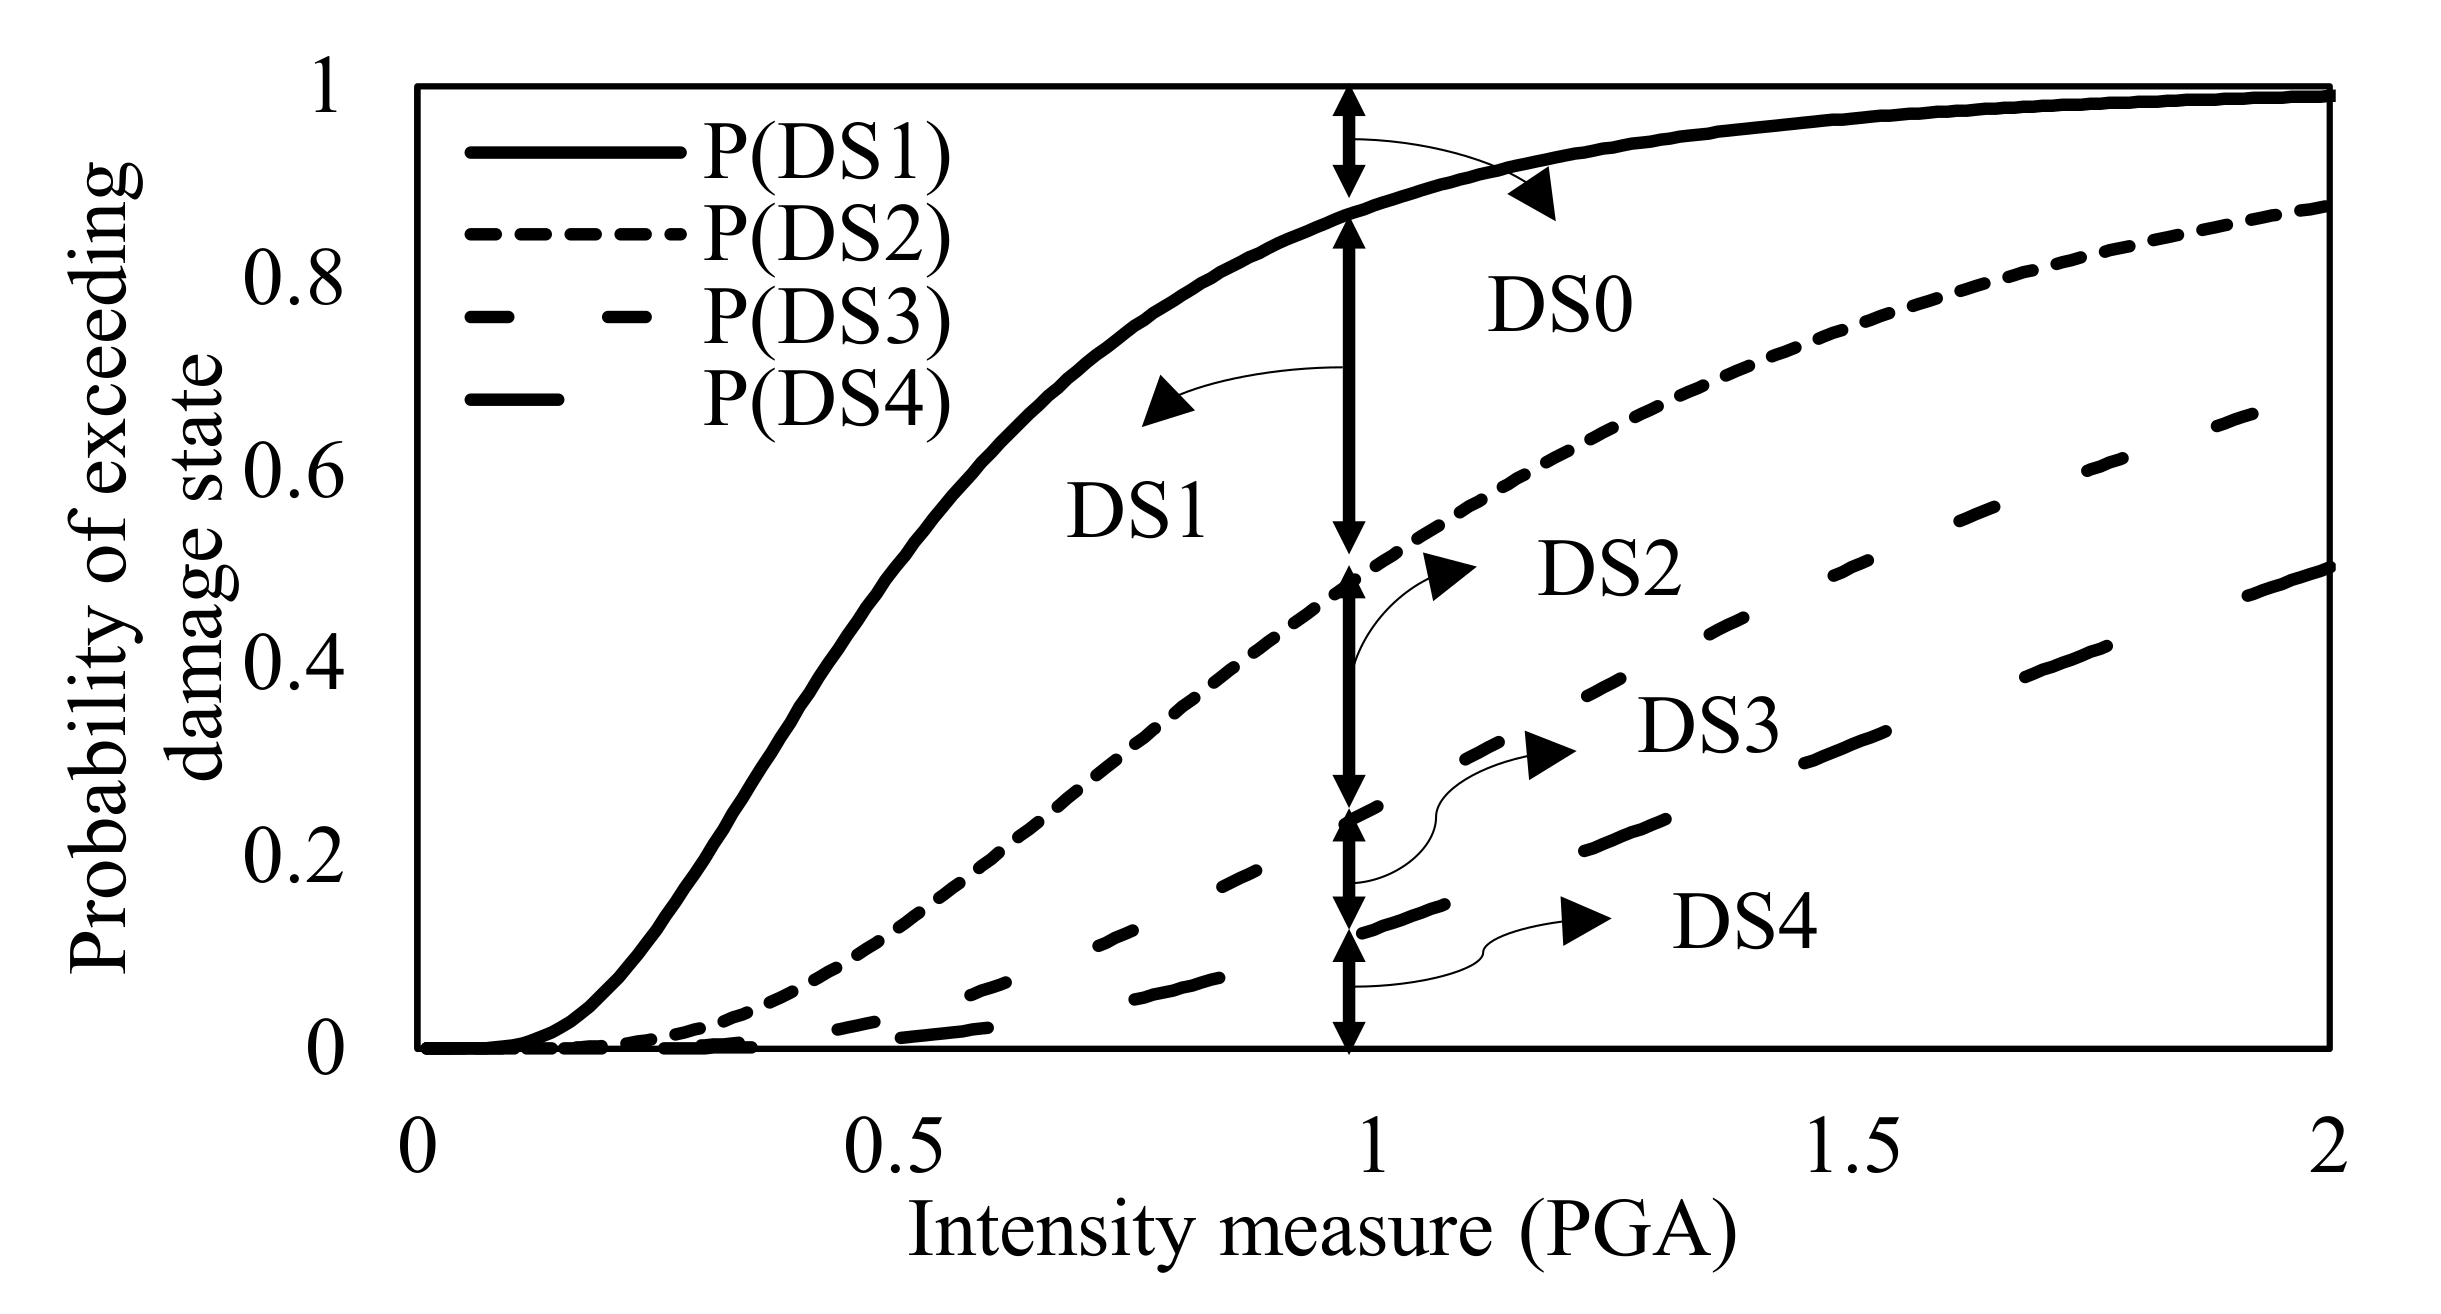
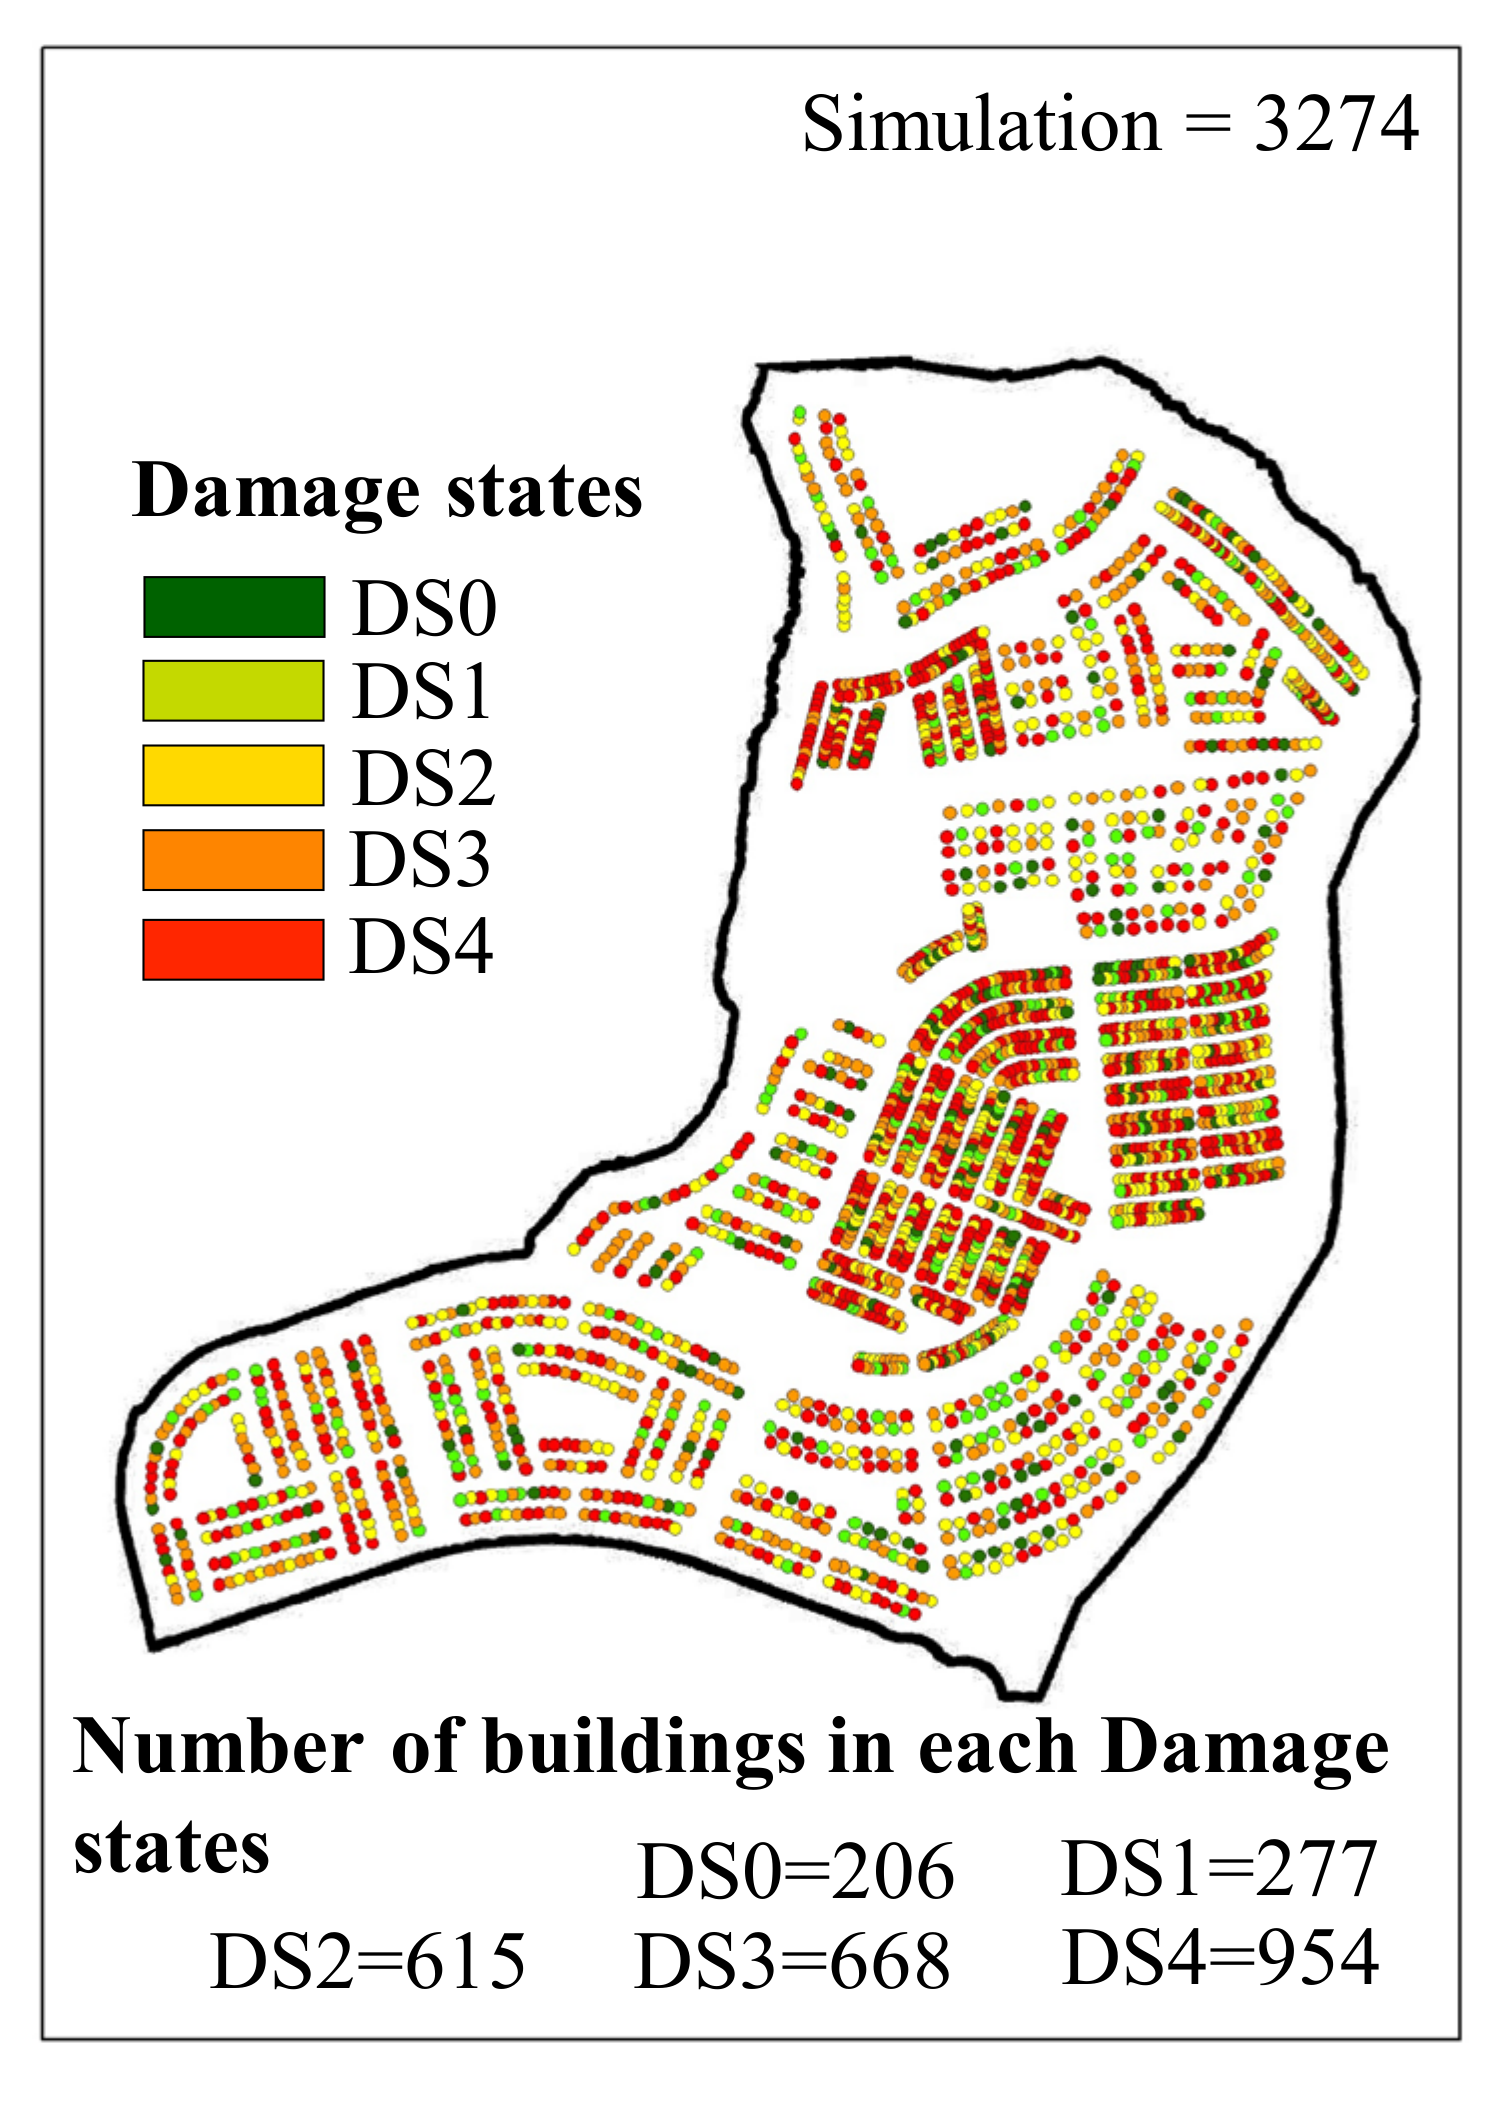
3.1. Building-Level Damage Assessments

In the literature, there exist different methods of damage assessments including empirical, analytical, numerical, and hybrid methods [53]. Different risk assessment frameworks have been developed as a result to provide methodologies for predicting damage given seismic hazards [54,55,56]. The most prominent ones are FEMA and HAZUS, among others, and require defining damage states for building-level damage assessment [23,24]. In HAZUS, for instance, five discrete damage states are defined including no damage state (DS0), slight damage state (DS1), moderate damage state (DS2), extensive damage state (DS3), and complete damage state (DS4). These damage states provide specific damage conditions of a particular structural system. For instance, in the case of an unreinforced masonry bearing walls (URM) structural system, the no damage state would indicate negligible damage to a building after a hazard event; slight damage would indicate diagonal hairline cracks on masonry walls, and few large cracks around the windows and doors; moderate damage state may include diagonal cracks in almost all the masonry walls with few walls having larger cracks; extensive damage state would indicate widespread cracking of masonry walls along with displacement of beams and trusses; and complete damage state would indicate structural collapse or imminent danger of collapse due to in-plane or out-of-plane failure of masonry buildings [23,57,58,59].
These damage states are determined by establishing a fragility function which provides probability of exceeding each damage state’s given intensity measure [60,61]. The intensity measure may include peak ground accelerations, peak ground velocities, among others, and are correlated with the intensity of hazard scenarios [62,63]. The damage states of all the buildings in a community are determined by utilizing a probabilistic approach in which a random number is generated from 0 to 1 and depending upon the range of damage state it falls; a relevant damage state is assigned to a particular building as shown in Figure 4 illustratively. The process is repeated for all the buildings in a community building portfolio for a single simulation run. The number of simulations is repeated and damage state distribution for each damage state given hazard scenario can be determined.

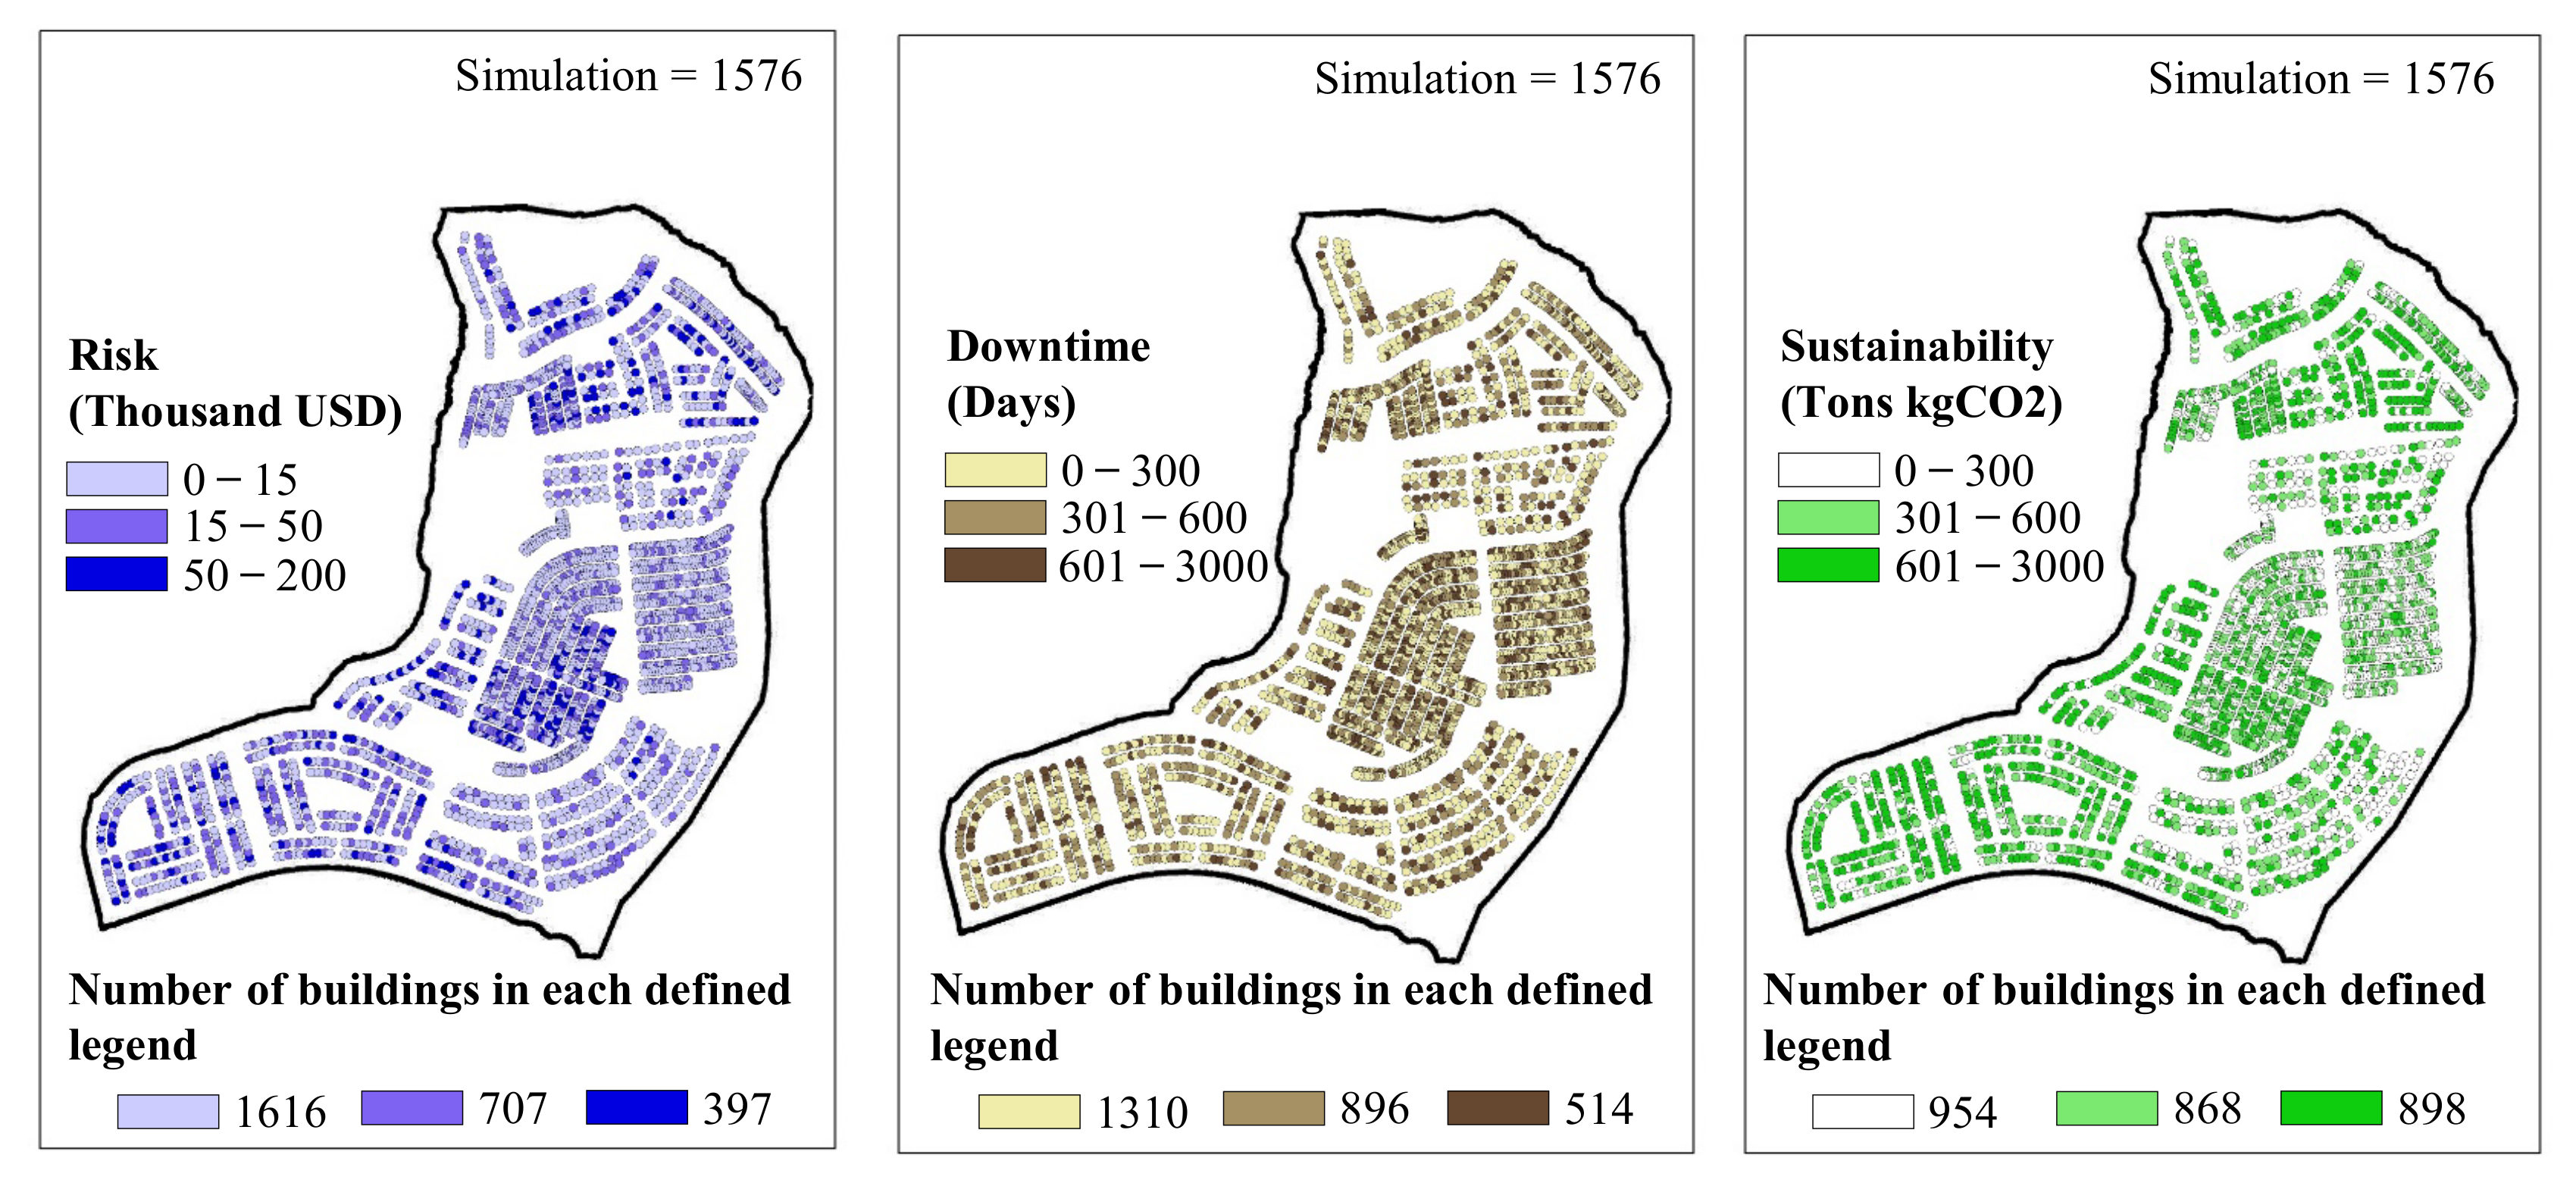
3.2. Building-Level Consequence Assessments

The damage states are utilized to evaluate consequences which may include the cost incurred to repair a building, the downtime of a building, equivalent carbon emissions due to the damage, and recovery efforts, among others [64]. Different methods can be employed to assess the consequences of extreme events on a given damage state of a building [28,65,66]. This requires building information for various building types including the fragility and consequence functions. However, even the same building types can have different fragilities and consequence models based on age, construction materials, geometric properties, material costs, among others, and may require calibration for use in other communities [67].
The HAZUS consequence assessment methodology is utilized in this paper which starts by evaluating the total material required to be replaced due to the damage of a building. The damaged building material is a function of each damage state and is determined by utilizing percentage damage of different construction materials given the damage state [68]. The damaged materials are then correlated with the consequences by utilizing consequence functions [69].
The consequence functions can be uniform, normal, or lognormal cumulative distribution functions defined for each damage state [70]. The consequence functions considered in this framework include repair costs, downtime, and equivalent carbon emissions [71]. These consequence functions are evaluated for each building in a single simulation run. The simulations are repeated and the distribution of consequences for each building in a community building portfolio can be evaluated.
The downtime consequence of a building consists of two parts: (1) the repair time, and (2) the delay time. The repair time is determined by lognormal consequence function, which is defined for each damage state, and the delay time is determined by evaluating the additional delays due to financing, engineering mobilization, contractor mobilization, obtaining permits, among others [72]. These additional delays are also defined in terms of cumulative distribution functions and added with the repair time to evaluate downtime for each building.

3.3. Portfolio-Level Performance Objectives Assessment

The consequences assessed for all the buildings in a community are accumulated into the performance indicators. The risk performance indicator of a community will provide the total cost required to repair a community given a hazard scenario, the downtime indicator will provide total downtime of a community building portfolio, and the sustainability indicator will provide total equivalent carbon dioxide emissions given the hazard scenario. Additional socioeconomic and environmental consequences can also be considered under these performance indicators including total casualties given the hazard, total embodied energy, among others [73].

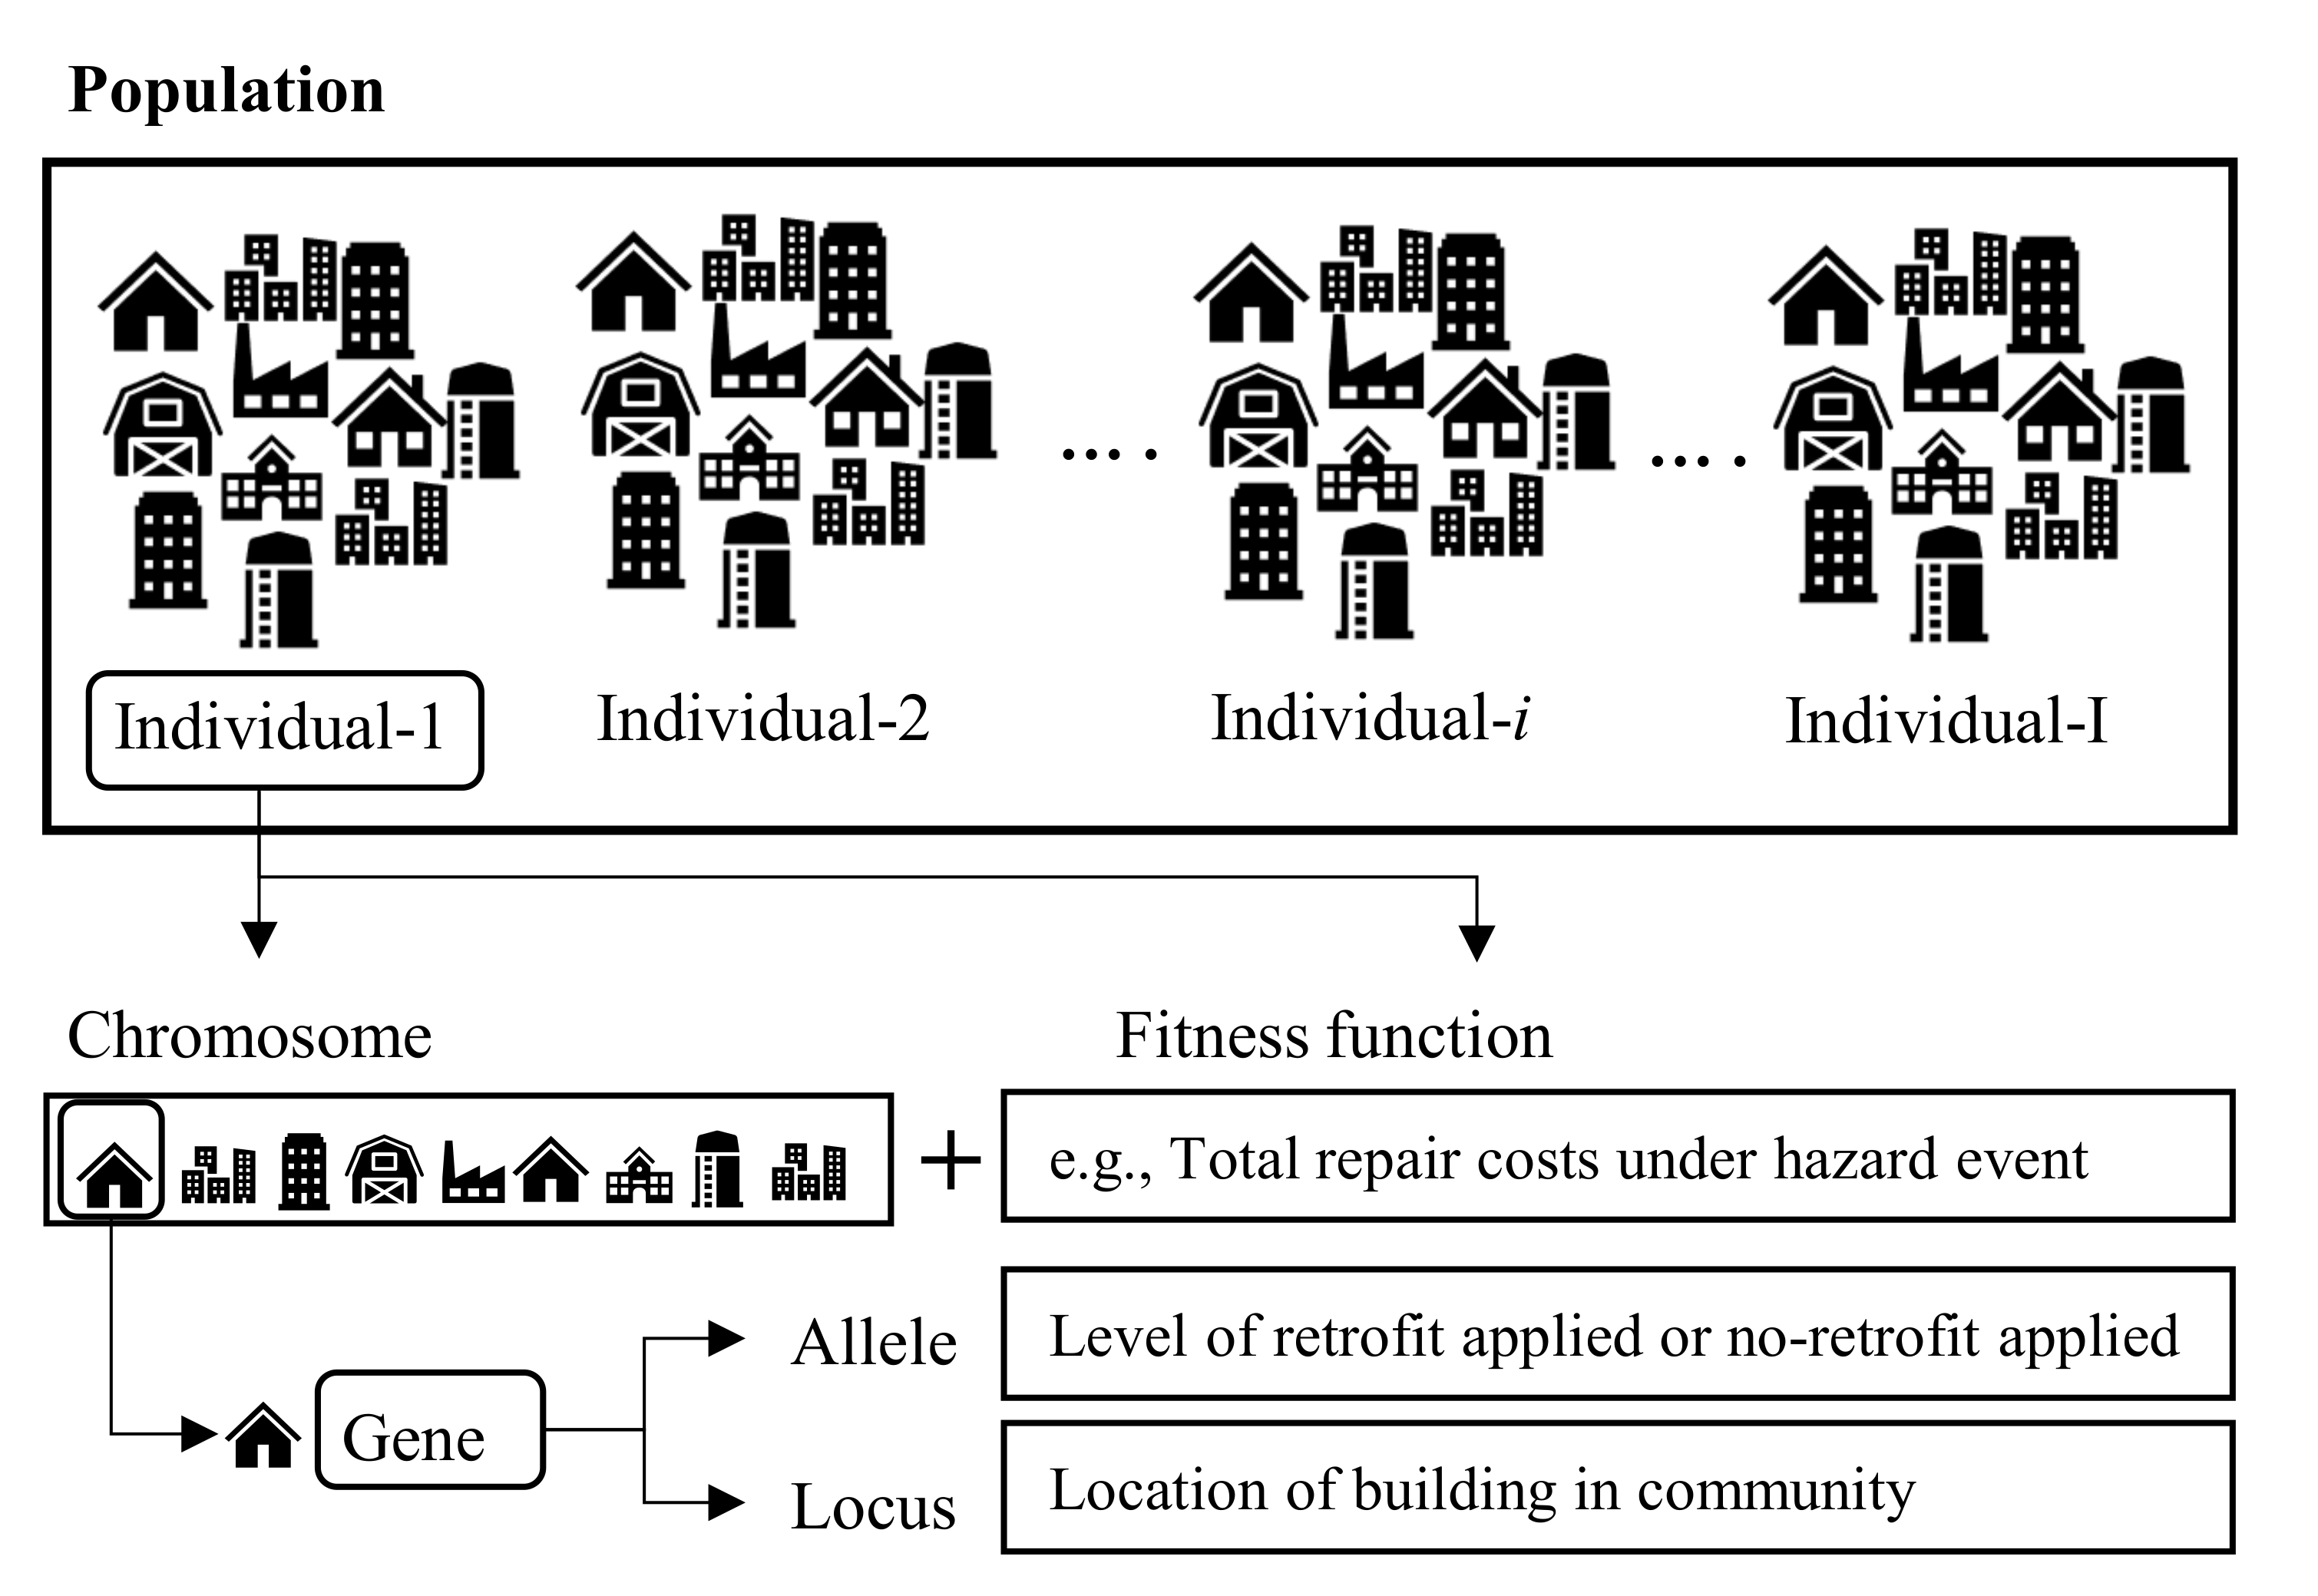
4. Bi-Objective Evolutionary Optimization

The performance indicators will provide meaningful information related to the performance of a community under considered hazard scenarios. The community stakeholders or decision-makers may want to improve the performance of a community. This requires implementing pre-hazard mitigation alternatives which may include retrofitting buildings of a community. The decision-makers may identify various retrofit alternatives to implement but need to assess the number of buildings to be retrofitted, which type of retrofit alternative to be implemented, and how to achieve maximum performance given retrofit alternatives, among others. Briefly, the decision-makers are interested in knowing the performance enhancement of community building portfolios and the cost of supporting the performance enhancements.
There exist many combinations of retrofit alternatives to be implemented on a community building portfolio. Hence, a bi-objective evolutionary approach is utilized to obtain Pareto-optimal solutions that will provide maximized performance of community against the minimized retrofit costs for all the individuals. The performance indicators developed in the performance-based assessment part are utilized here as performance objectives and are optimized utilizing non-dominated sorting and a crowding distance genetic algorithm. It is important to highlight that the proposed performance-based bi-objective evolutionary optimization approach utilized here is heuristic and the optimal solutions are not guaranteed. Nonetheless, the method is sufficient for approximating the Pareto-optimal solutions in a bi-objective space.
The bi-objective optimization problem can be formulated as:
Given:
  • The community building portfolio with different structural systems, code-conformance, building heights, fragility, and consequence functions, among others;
  • Intensity measure at building locations under a given hazard scenario;
  • Probabilistic damage assessment of community building portfolio;
  • Consequences of all the buildings in a community building portfolio;
  • The damage and consequences of buildings for different retrofit-levels.
Find:
  • The retrofit actions for all the buildings in a community building portfolio.
So that:
  • The retrofit costs associated with the retrofit levels is minimized;
  • The performance of a community associated with the retrofit-level is maximized.
The first step is to generate an initial population consisting of certain number of individuals. Each individual is a scenario of a community building portfolio where all the buildings are randomly given one of the retrofit alternatives or no-retrofit. In the next step, the individuals are extracted, and the performance objectives are evaluated by utilizing the performance-based assessment method presented in the previous section. The performance objectives are then checked against the optimization criteria and Pareto-optimal solutions are extracted if the optimization criteria are satisfied, or else the individuals are optimized by utilizing three main steps: performing (1) a fast non-dominated sorting and crowding distances; implementing (2) selection, crossover, and mutation strategies; and finally (3) generating a new population. The process is repeated until the optimization criteria are satisfied and the Pareto-optimal solutions providing performance indicators given retrofit programs can be extracted. The optimization criteria can be the number of allowed generations which may be based on computational costs and accuracy requirements. Subsequent subsections provide more information on the highlighted optimization steps.

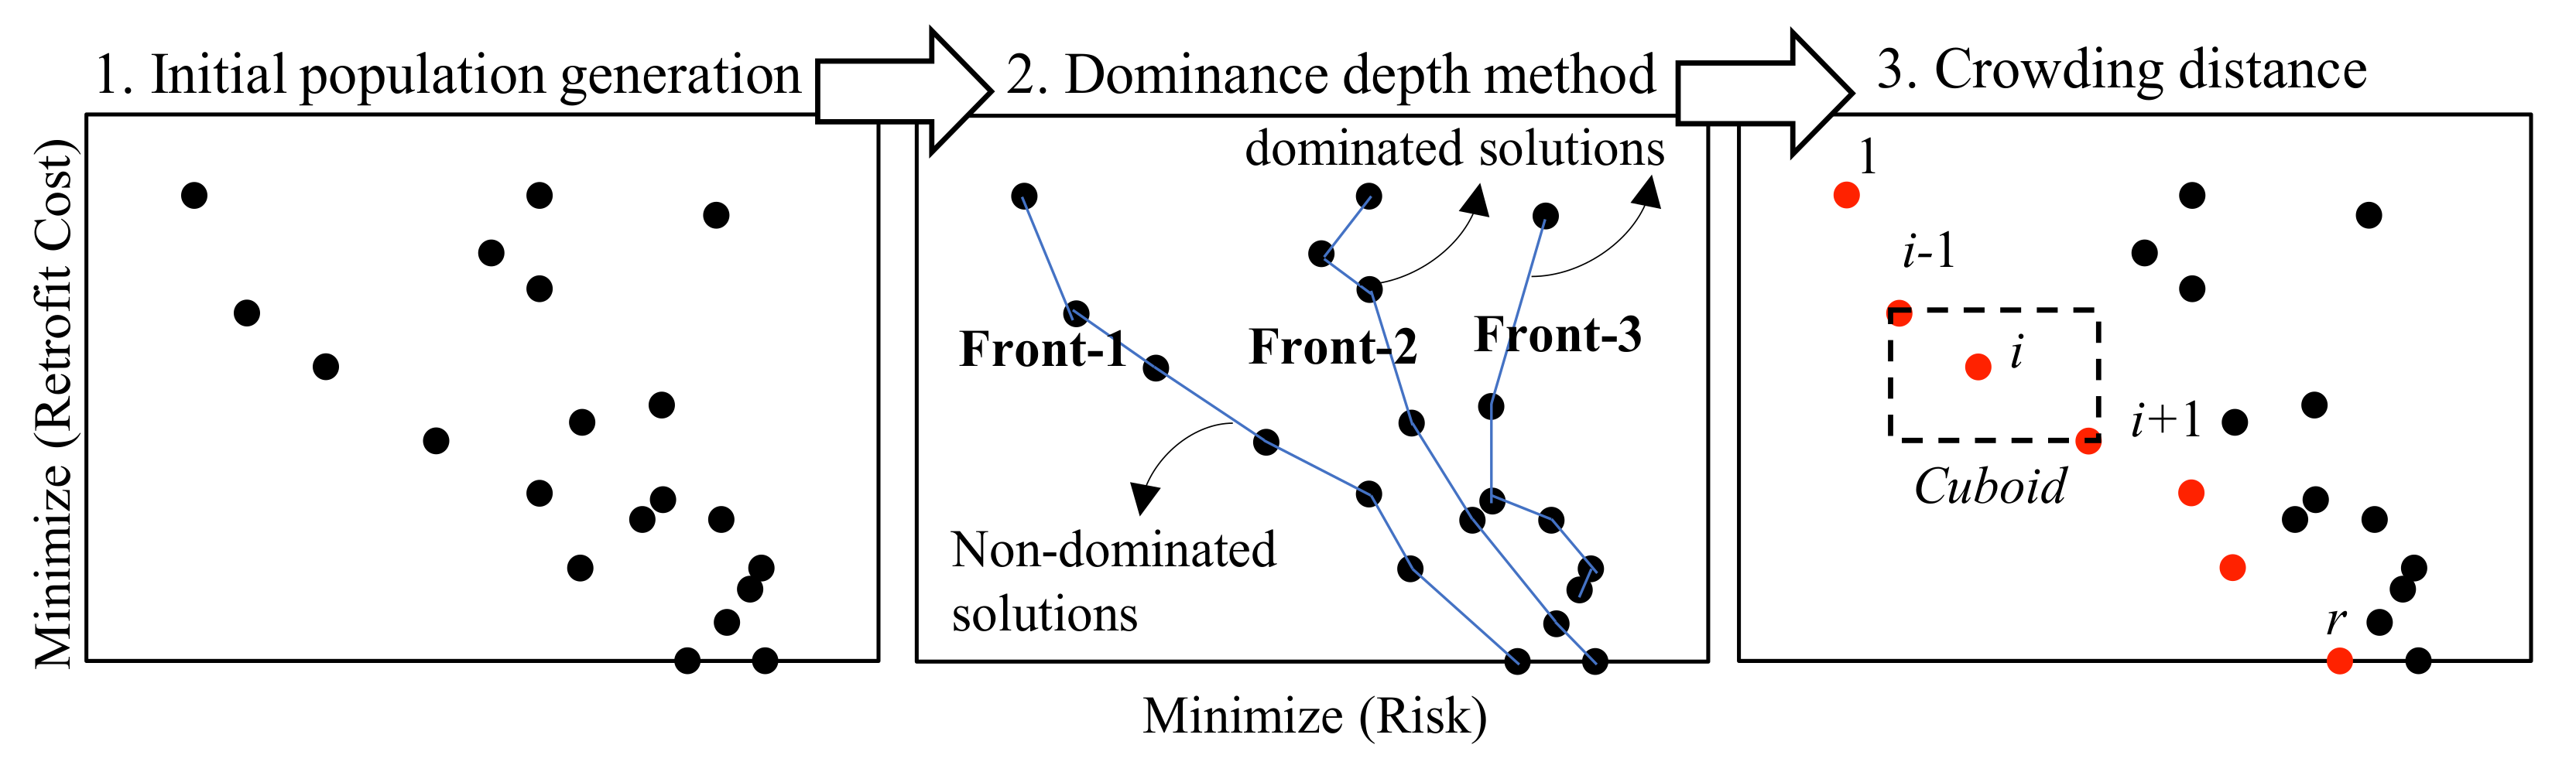
4.1. Fast Non-Dominated Sorting and Crowding Distances

The individuals in the population have varying performance values against retrofit costs. The fast non-dominated sorting and crowding distances approach is utilized to select the best solutions in the given population. The best solutions are extracted by utilizing two methods: (1) the dominance depth method to determine the non-dominated and dominated solutions, and (2) crowding distance algorithm to ensure diversity among the selected solutions. The dominance depth method ranks the individuals based on which front a particular individual lies. For instance, the individuals on a Front-1 would be given highest rank since they are non-dominated solutions that are not dominated by other individuals. Additionally, the crowding distance algorithm is utilized to measure the relative distances with other individuals lying on the same front. The individuals lying further apart are preferred to ensure the individuals are distributed over the considered Front and are not congested over a localized area. The non-dominated solutions with high diversity are the optimal solutions for a particular generation since these individuals provide the best performance against the least retrofit cost. The dominance depth method and crowding distance assessment given an initial population are shown illustratively in Figure 5.

4.2. Selection, Crossover, and Mutation

Once the ranking of all individuals is determined based on dominance depth method and crowding distance algorithm, the next step is to perform selection, crossover, and mutation to generate new individuals. The purpose of selection is to identify above-average individuals from the population-based on the rank and crowding distances. The crowded binary tournament selection method is utilized to select the parents from the population. This method starts by randomly selecting two individuals from the population and choosing an individual with the better rank to become parent. In the case of two selected individuals having same rank, then the selection is based on the crowding distances, and in the case that both rank and crowding distances are same, then the selection is performed randomly. This method of selection increases the chance of better individuals being selected from the population.
After selecting parents, the crossover operator is utilized to create new solutions referred as offspring. These offspring are generated by performing crossover of the two randomly selected parents which helps explore the search in space. In this paper, a simulated binary crossover operator is utilized to explore the discrete search space. The probability density function of the simulated crossover binary operator is presented as:
p β i = 0.5 η c + 1 β i η c , i f   β i     1 0.5 η c + 1 β i η c + 2 ,   e l s e
where βi is the spread factor and ηc is the control parameter that defines the spread of the distribution function. A vector of βi is determined by integrating the area under the probability distribution curve equal to a random number ui ϵ [0, 1], evaluated as:
β i = 2 u i 1 η c + 1 i f   u i   0.5 1 2 1 u i 1 η c + 1     e l s e
The vector βi is utilized to change the allele of the genes. If the βi is greater than 1, the first child gene is altered to a higher retrofit level as compared to the first parent the and second child gene is altered to a lower retrofit level to that of the parent. Contrarily, if the βi is lower than 1, the first child gene is altered to a lower retrofit level as compared to the first parent and the second child gene is altered to a higher retrofit level to that of the parent. This process helps to produce fitter offspring from above-average parent population exploring the search space further for optimal solutions.
The mutation operator is adopted with low probability pm to avoid non-convergence issues. In this paper, a polynomial distribution operator is utilized for obtaining a solution. The polynomial probability distribution function is presented as:
p δ = 0.5 η m + 1 1 δ η m
where δ is the median value and ηm is the factor controlling the spread of the distribution function. A vector of δ is determined by integrating the area under the probability distribution curve equal to a random number ri ϵ [0, 1], evaluated as:
δ = 2 r i 1 η m + 1 1 i f   r i < 0.5 1 2 1 u i 1 η m + 1     e l s e
The polynomial mutation operator works in such a way that if the mutation probability randomly selects a locus where mutation is required, then the gene is altered to a lower retrofit level if δ is less than zero, or else the gene is altered to a higher retrofit level.

4.3. New Population Generation

The resulting solutions include the parent population and the offspring population. The offspring population comprises new individuals extracted by utilizing selection, crossover, and mutation strategies and the parent population comprises previous individuals. The best solutions with the original population size are then selected from the parent and offspring populations such that the total population size is retained at its original size. The best-selected solutions of original population size are referred to as new population or survival population. The next step is to evaluate the performance objectives for all the individuals in a new population, and the process of selection, crossover, mutation, and survival and elimination is repeated until the optimization criteria are satisfied. The resulting Pareto-optimal solutions after the optimization criteria are met are the optimal solutions of the bi-objective optimization problem for a single simulation run. The number of simulations are performed using the Monte Carlo approach and the probability distributions of performance indicators can be extracted. The subsequent section implements the proposed framework on a community building portfolio for illustration of the proposed framework.

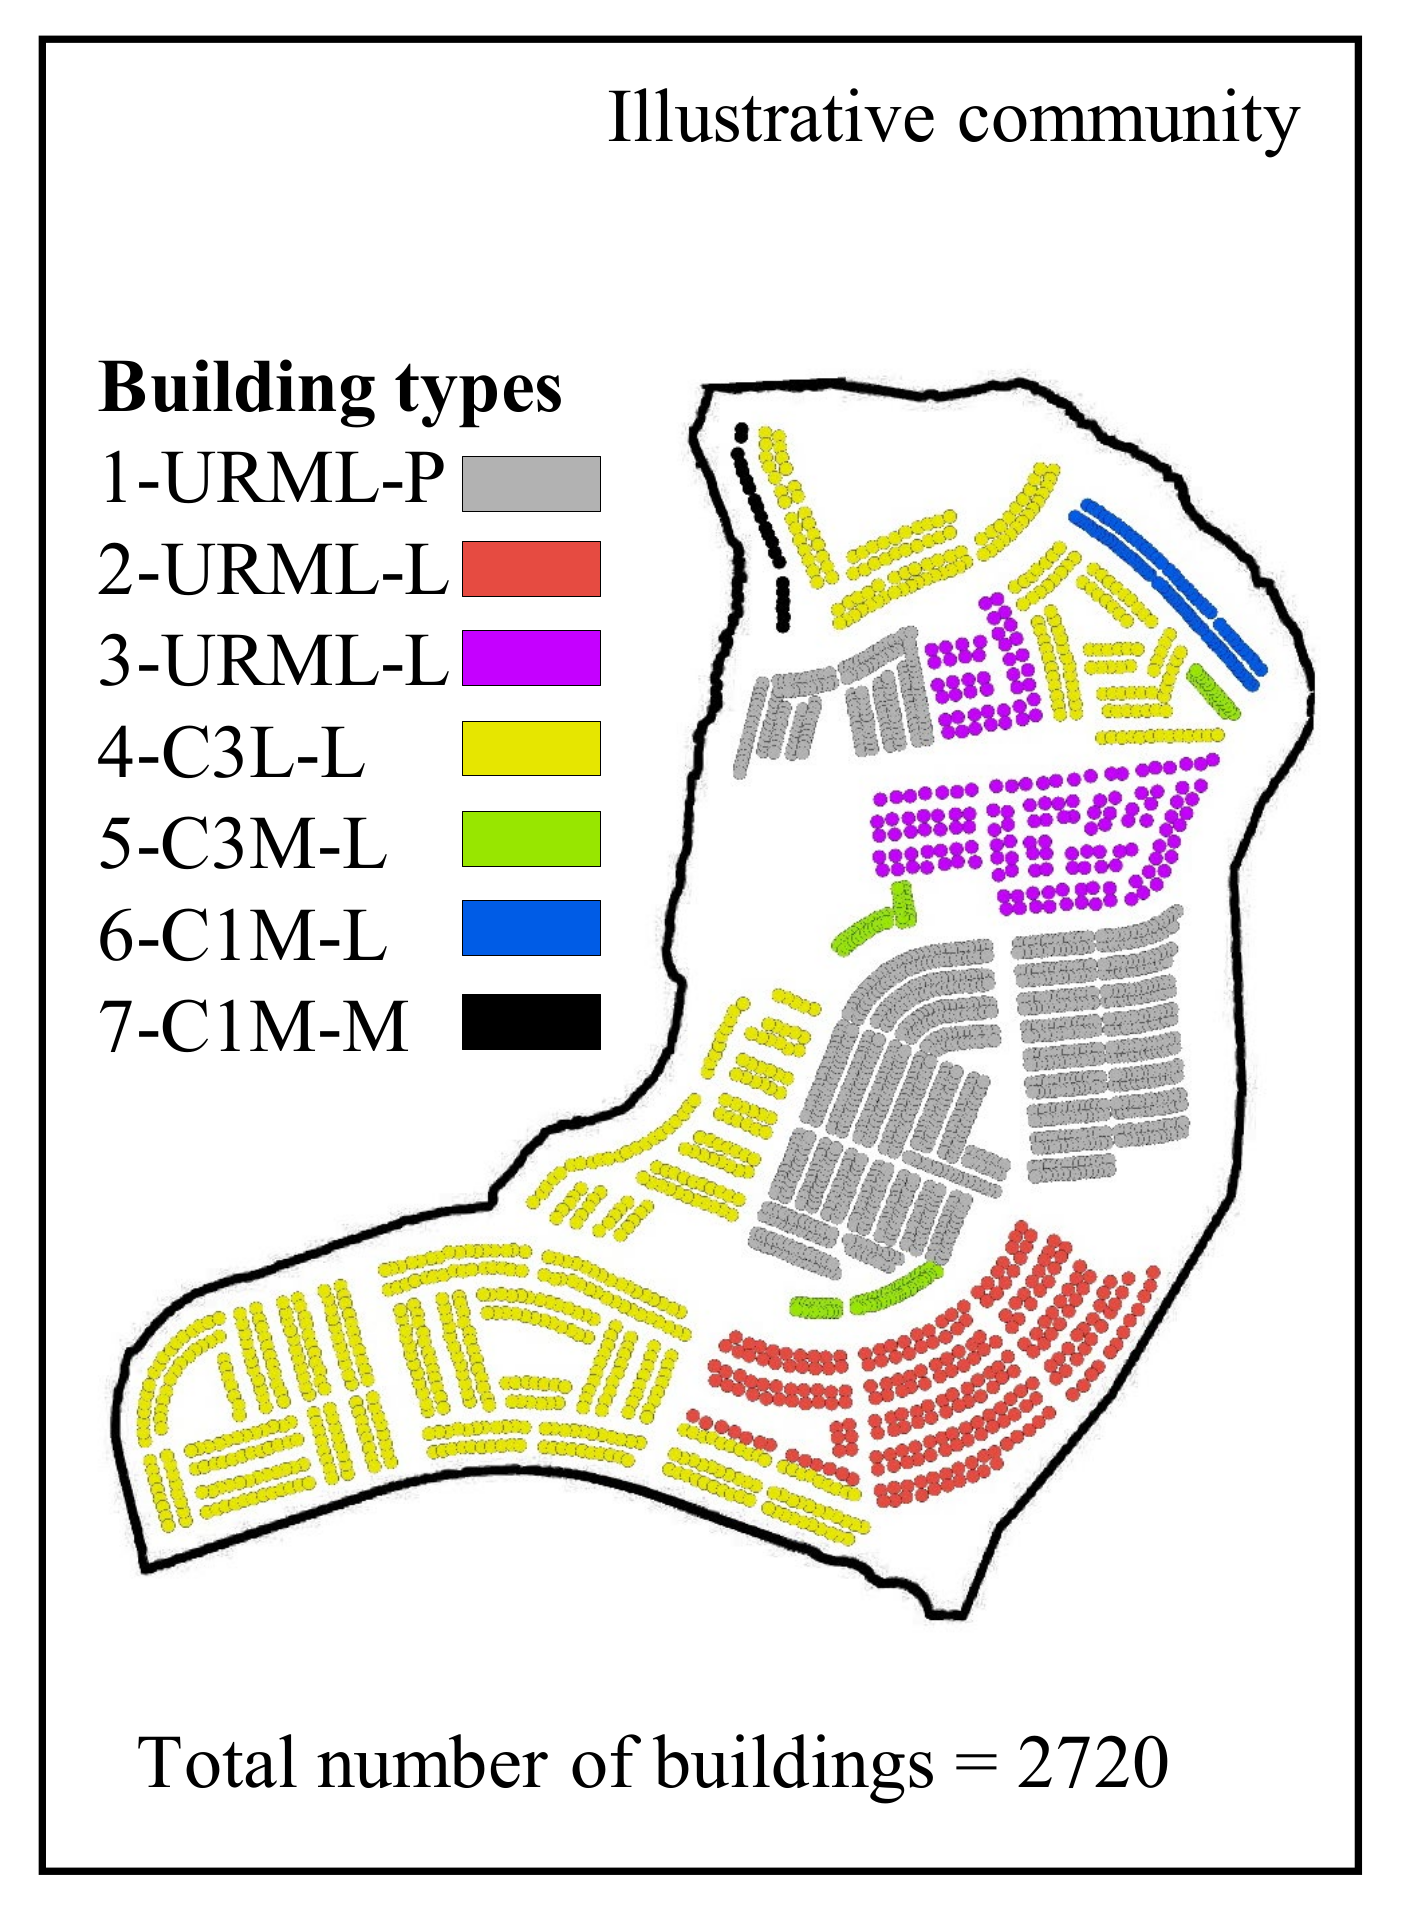
5. Illustrative Example

The framework is illustrated on a community consisting of residential and commercial buildings. The structural systems consist of unreinforced masonry bearing walls (URM), concrete frames with unreinforced masonry infill walls (C3), and concrete frames (C1). The residential building portfolio is dominated by low-rise (L) construction with story heights ranging from 1–3 stories, and commercial buildings are mid-rise (M) with story heights ranging from 4–7 stories. The building portfolio is a mix of pre-code, low-code, and moderate-code construction with most of the building comprising low-code construction. The building portfolio is divided into seven different types of buildings depending upon structural system, height, and code configurations as shown in Figure 6. The classification of building types follows HAZUS [68] classification system i.e., (1) structural system is highlighted first, (2) followed by story type, and (3) the last symbol denotes the code level. For instance, a URM building with a low-rise story and pre-code configuration is denoted as URML-P. Further details can be found in Appendix A.
To measure the performance of a community building portfolio under an earthquake hazard, three performance indicators are selected: (1) total repair cost incurred on a community because of an earthquake referred herein as risk performance indicator, (2) total downtime of a community as a measure of how long it will take to recover from a hazard, referred herein as downtime performance indicator, and (3) total equivalent carbon emissions emitted as a result of damage to the community and recovery efforts, referred herein as sustainability performance indicator.
In this illustrative example, a design hazard scenario is selected with a return period of 475 years, having 10% probability of occurrence in 50 years’ service life. The selected hazard scenario will generate a peak ground acceleration of 0.33 g and is considered herein to assess the performance of a community. It is important to note that considering a complete hazard curve along with relevant mean annual frequency of exceedances for hazard scenarios would provide better evaluation of retrofit interventions on a community-level. However, only a design hazard scenario is considered in this case study to illustrate the proposed framework which can be extended to consider a complete hazard curve. The next section highlights the performance of a community building portfolio under given hazard without considering any mitigation measures.

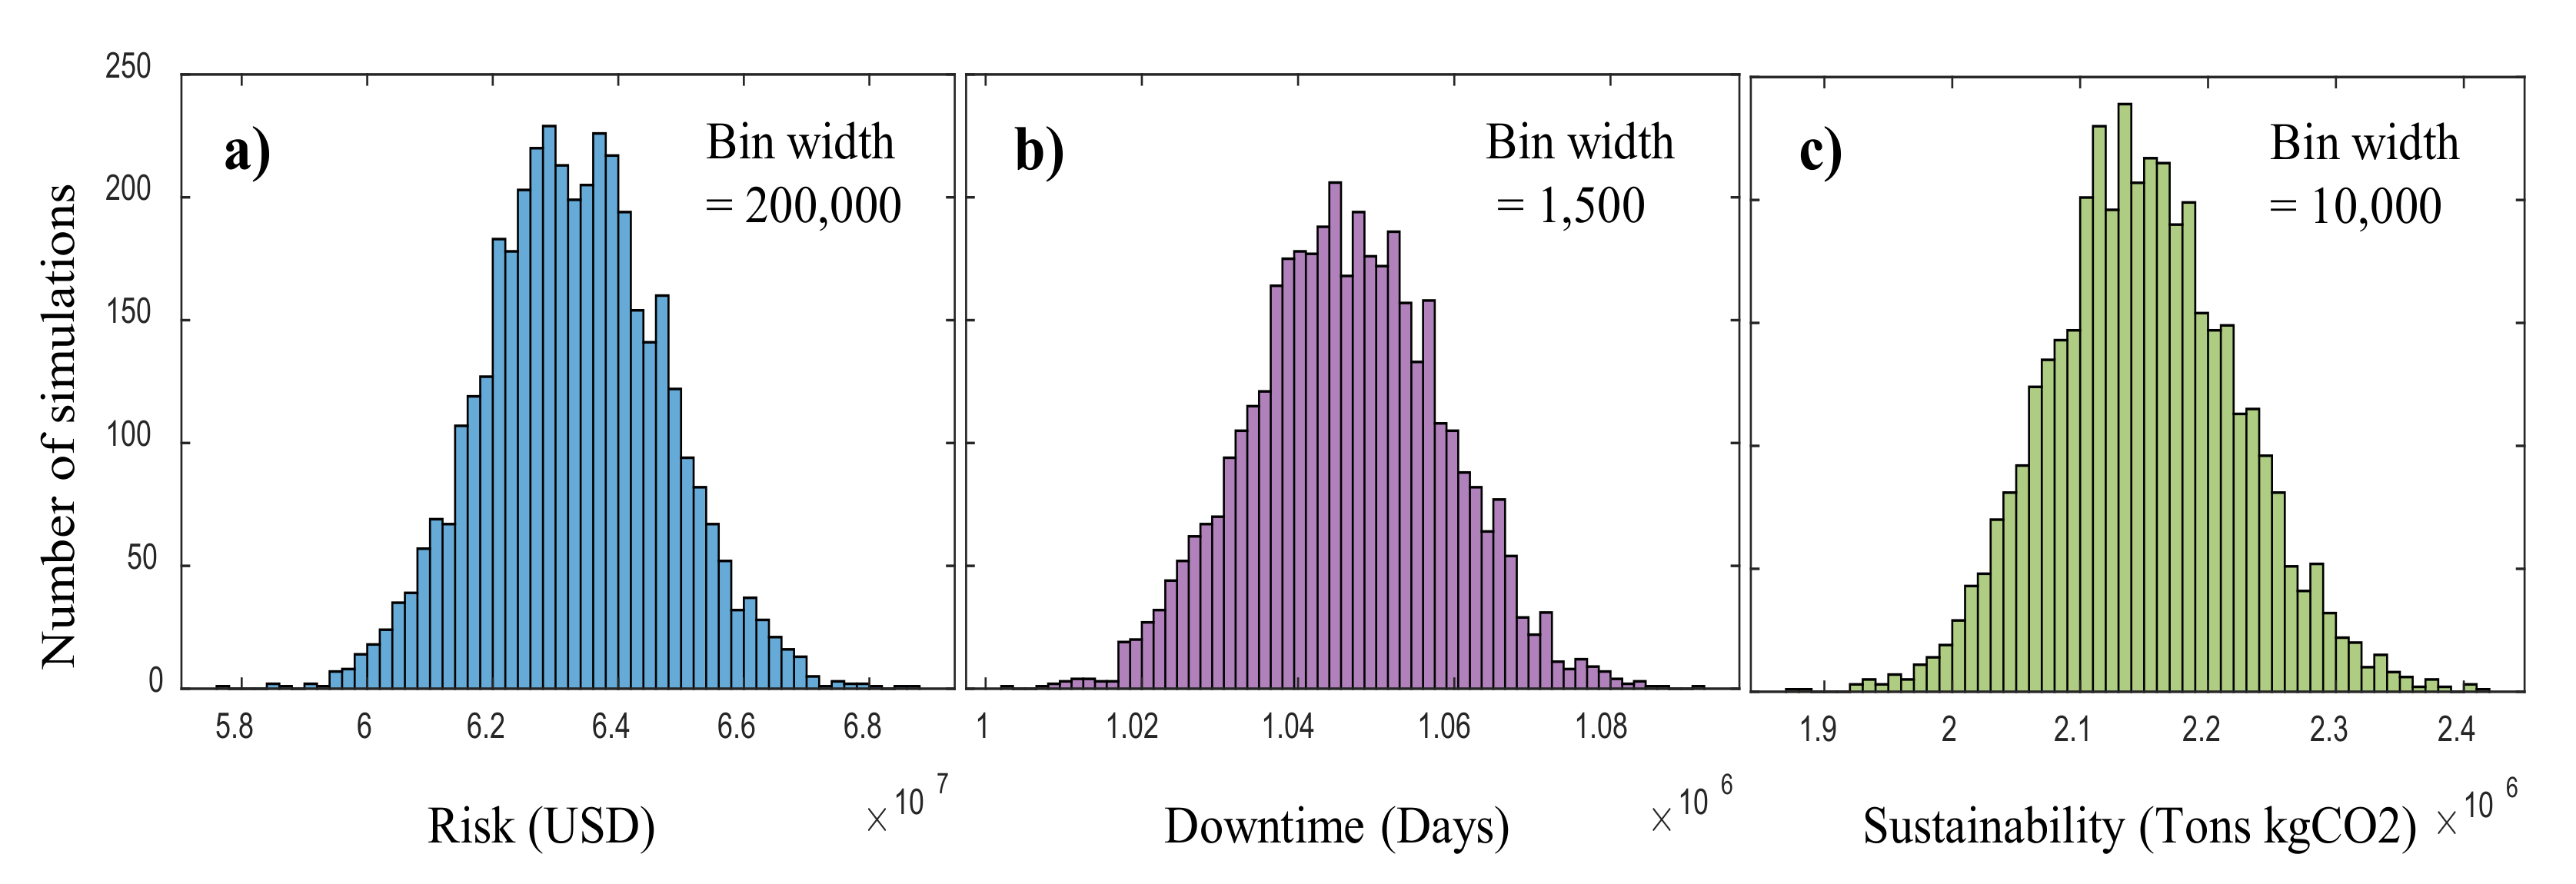
5.1. Performance-Based Assessment

The first step is to assess the damage states of all the buildings in a community. A total of 4000 simulations are performed to determine the discrete damage states of a community building portfolio considering a probabilistic approach formulated in the methodology section. The resulting damage state distributions under a design hazard scenario are shown in Figure 7. Four statistical moments are also extracted from the distributions, presented in Table 1. As shown, the mean value for buildings having negligible damage is 187.13, and complete damage is 981.57. It is noted that the damage states have low skewness values and kurtosis values of around 3. The positive kurtosis values around 3 indicate that the damage state distributions are close to the normal distributions.
The geospatial distribution of damage states of a community building portfolio for a random simulation is shown in Figure 8 for illustrative purposes. In the given simulation, the number of buildings having no damage are 206, and buildings with complete damage are 954 in number. These simulations are repeated and distributions of considered damage states are extracted accordingly as shown in Figure 7.
The damage states are then correlated with the consequences to evaluate risk, downtime, and sustainability performance indicators. The consequences in terms of repair cost, downtime, and equivalent tons of kgCO2 emissions are determined for each building in each simulation. For illustration, the geospatial distribution of consequences in terms of three performance indicators is shown in Figure 9 for a random simulation. In this simulation, the number of buildings having repair costs up to US$15,000 is 1616, from US$15,000–50,000 is 707, and from US$50,000–200,000 is 397. The repair cost for the majority of the buildings is under US$50,000 per building. Similar observations can be extracted for downtime and equivalent tons of carbon dioxide emissions.
The number of simulations is repeated and distributions for three performance indicators on a community level are determined as shown in Figure 10. The mean value for risk under a design hazard scenario is US$63.3 million with a standard deviation of US$1.42 million, the mean value for downtime is 1.05 million days with a standard deviation of 12,400 days, and the mean value for sustainability is 2.15 million tons of kgCO2 emissions with a standard deviation of 73,700 tons of kgCO2. The sustainability performance indicator has a positive skewness of 0.12 and the rest of the performance indicators have negligible skewness. However, all the performance indicators show positive kurtosis values ranging from 2.89–3.10 which shows the performance indicator values are almost normally distributed.

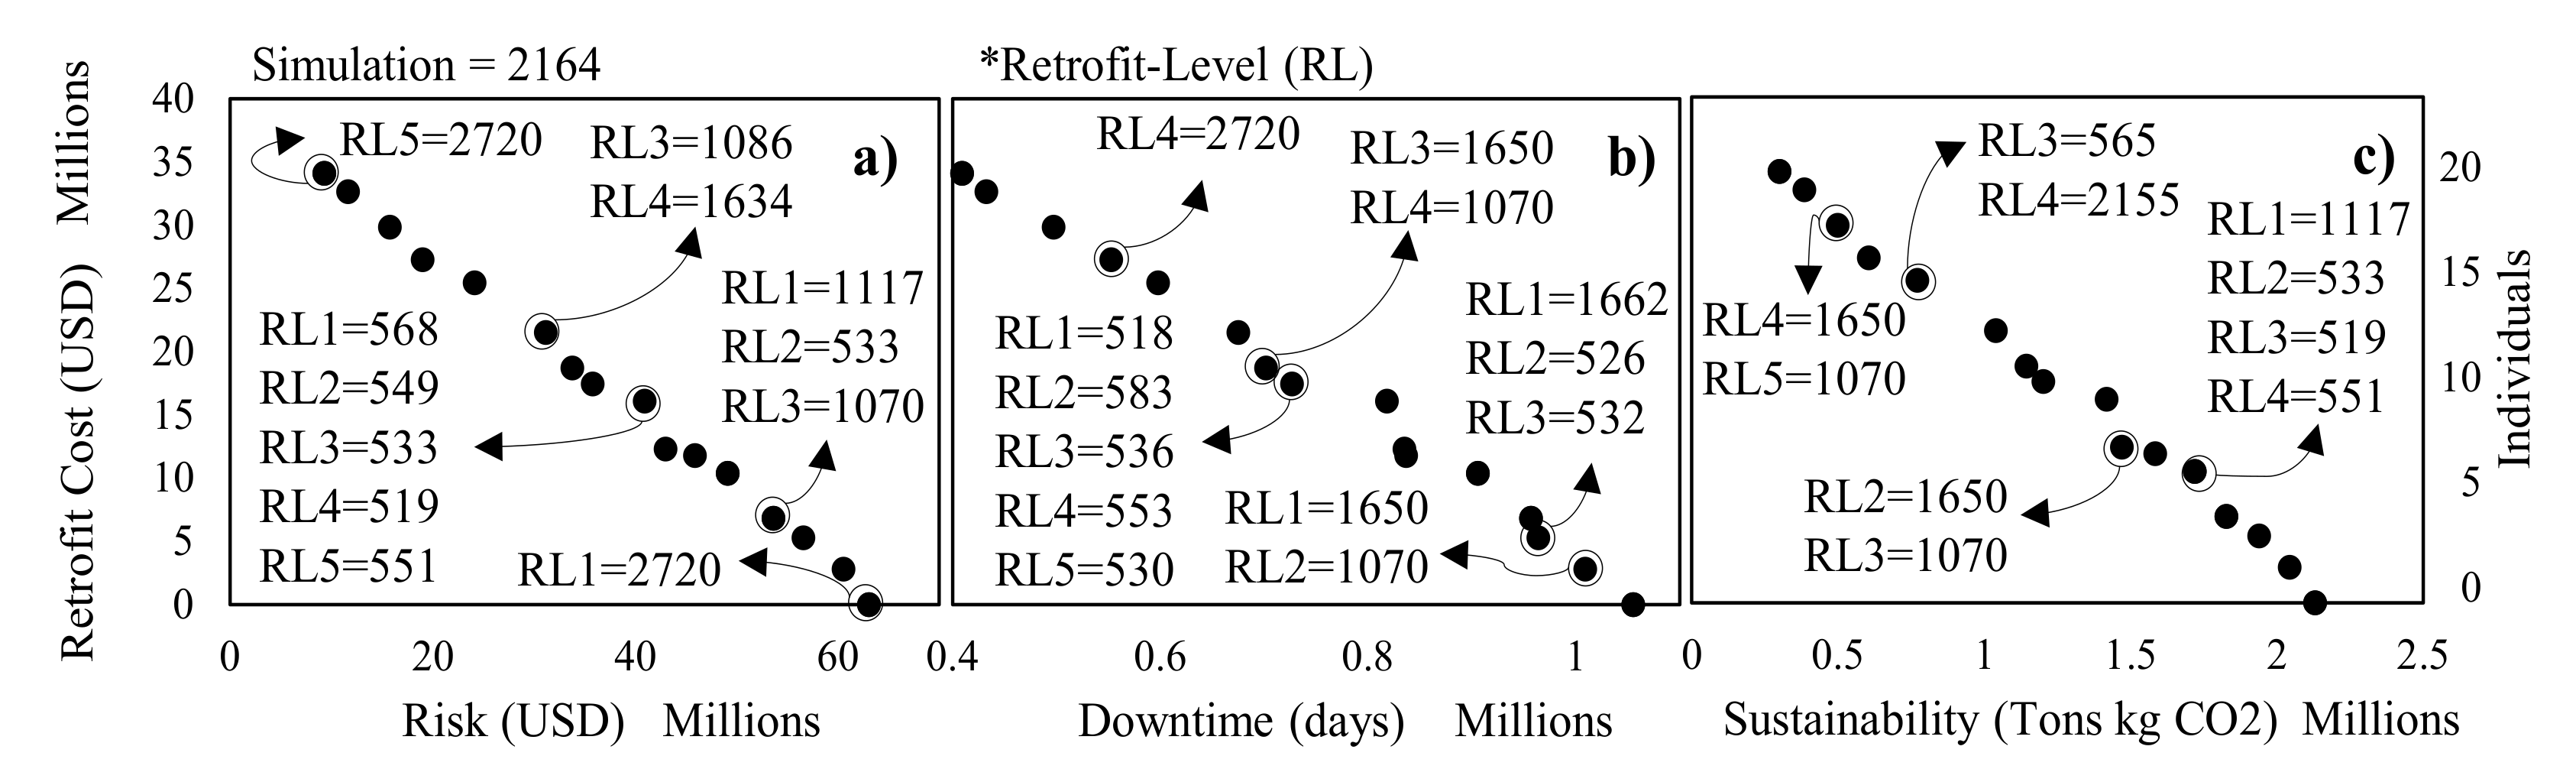
5.2. Bi-Objective Evolutionary Optimization

The performance indicators provide total repair costs, an estimation of community recovery time, and total equivalent carbon dioxide emissions under an earthquake hazard scenario. Mitigation alternatives can be implemented to improve the performance of a community building portfolio under given hazard. The decision-makers are mostly interested in the question related to how much cost is required to improve the required performance of a community. The bi-objective evolutionary optimization technique is utilized to determine retrofit programs which will provide information related to the investment costs needed for retrofitting a community to improve performance to a certain level. Note that the retrofitting buildings can give different performance levels depending upon the type of retrofit implemented and on how many buildings are retrofitted. This optimization technique can provide optimal performance improvements that can be achieved for given retrofit programs in terms of Pareto-optimal solutions.
The performance indicators are utilized as objectives to be optimized for given retrofit alternatives. The initial population with population size of 20 individuals is selected with an optimization criterion of 20 maximum generations. The higher the number of individuals selected, the more data points will be generated in the Pareto-optimal solutions but as a result, the computational costs would increase. The selection criteria of individuals is based on generating enough data points to appropriately assess the Pareto-optimal solutions at reasonable computational costs. The search space consists of five options for each building which are randomly assigned to all the buildings in the initial population. Option one includes assigning a building with no-retrofit alternative (i.e., building is not retrofitted), and options two to five consist of an increasing level of retrofit. The increasing level of retrofit would provide increasing performance and would also incur an increasing level of retrofit cost. The fragility functions for all the buildings are extracted from HAZUS [23], and the damage state and retrofit cost factors are selected based on the literature review [23,74,75,76]. The damage state factors are multiplied by the mean values of fragility functions to update the fragility functions for different retrofit levels and retrofit cost factors are multiplied with the construction costs to evaluate retrofit costs. The considered damage state factors for five retrofit levels are 1, 1.27, 1.55, 2.11, and 2.79. Similarly, the considered retrofit cost factors for five retrofit levels are 1, 1.1, 1.15, 1.2, and 1.25. The selection criteria for the damage state factors and retrofit cost factors are based on previous studies conducted on seismic retrofit of buildings [19,76]. Nonetheless, the damage state factors and retrofit cost factors are utilized here for illustrative purposes only.
The next step is to evaluate the performance objectives of all the individuals and generate a new population by non-dominated sorting and crowding distances, and through selection, crossover, and mutation strategies discussed in the methodology section. The process is repeated for a new population until the optimization criterion is satisfied. At each generation, the performance of individuals keeps on improving given total retrofit costs and Pareto-optimal solutions can be extracted after the optimization criterion is satisfied.
The Pareto-optimal solutions for a random simulation number are shown in Figure 11 for considered performance indicators. As shown, the performance indicators show high risk, downtime, and sustainability values for a reference community with no mitigation alternative implemented. For instance, in this simulation, if all the buildings are given retrofit level one (i.e., if no mitigation alternative is applied), the risk, downtime, and sustainability values are US$63.1 million, 1.06 million days, and 2.13 million tons of kgCO2. Similarly, if all the buildings are retrofitted with the retrofit level five, the maximum performance of US$9.33 million, 0.41 million days, and 0.3 million tons of kgCO2 can be achieved. The retrofit costs to achieve this maximum performance level is US$34.1 million.
Various combinations of retrofit levels on a community building portfolio would result in different levels of performance, and the bi-objective optimization approach is utilized to determine the retrofit-level combinations to achieve optimal performance given the least retrofit costs. For instance, an individual 12 in a population provides risk, downtime, and sustainability values of US$35.8 million, 0.727 million days, and 1.2 million tons of kgCO2 with a given retrofit cost of US$17.5 million, as shown in Figure 11. This level of performance is achieved by retrofitting buildings with different retrofit levels including retrofit level 1 (RL1) having 518 buildings, retrofit level 2 (RL2) having 583 buildings, retrofit level 3 (RL3) having 536 buildings, retrofit level 4 (RL4) having 553 buildings, and retrofit level 5 (RL5) having 530 buildings, accordingly. The determined Pareto-optimal solutions provide an increasing level of performance given increasing retrofit costs for different individuals.
The uncertainties in the performance enhancement are considered by performing 4000 evolutionary optimization simulations and extracting information including buildings in different retrofit levels, performance indicators, and the required retrofit costs for an optimized population. The mean values of buildings in different retrofit levels for an optimized population are shown in Figure 12. Individual 1 refers to a case scenario of a community building portfolio where all the buildings are at retrofit level one, and individual 20 refers to a case scenario where all the buildings are at retrofit level five. The individuals in between refer to the buildings with different retrofit levels optimized to provide maximized performance objectives at a minimized retrofit cost. Finally, the community stakeholders and decision-makers can utilize the Pareto-optimal solutions and develop retrofit programs to satisfy the required performance of a community under given hazard.
For illustration purposes, four retrofit programs (RPs) are extracted ranging from retrofit costs of US$5–20 million. For instance, retrofit package 1 (i.e., US$5 million cost for retrofitting community building portfolio) requires mean values of 1786 buildings in RL1 (i.e., no-retrofit required), 773 buildings in RL2, and 161 buildings in RL3. Similar observations for other retrofit programs can be made from Figure 12. The RLs represent mean value of buildings in different retrofit-levels averaged over N simulations.
The distribution of performance indicators under four selected retrofit programs is shown in Figure 13, Figure 14 and Figure 15. For illustration, the statistical moments for the risk performance indicator under four retrofit programs are shown in Table 2. As shown, the total repair cost under a design hazard scenario without considering any mitigation alternative is US$63.3 million which can be reduced to US$56.78 million by applying a retrofit cost of US$5 million. Similarly, the retrofit programs costing US$10, 15, and 20 million would reduce the risk to US$49.10, 41.74, and 32.34 million. The standard deviation for the risk performance indicator ranges between US$1.04–1.42 million. In addition, negligible skewness is observed, and the kurtosis values are close to 3 which indicates the distribution is almost normally distributed.
Similar observations can be extracted for downtime and sustainability performance indicators given retrofit programs. For instance, implementing the considered four retrofit programs would result in improving mean downtime values from 1.05 million days to 0.977, 0.893, 0.816, and 0.705 million days, and mean sustainability values would improve from 2.15 million tons kgCO2 to 1.92, 1.65, 1.40, and 1.07 million tons of kgCO2. The standard deviation for downtime ranges from 11,420–16,930 days and for sustainability ranges from 47,850–73,690 tons of kgCO2. The kurtosis values for downtime and sustainability range from 2.89–3.26, indicating nearly normal distributions.

6. Conclusions

This paper proposed a performance-based bi-objective optimization framework for community building portfolios considering multiple performance indicators. In addition, the uncertainties in the process were incorporated by utilizing the Monte Carlo approach. Performance-based assessment methodology was utilized to assess performance objectives in terms of risk, downtime, and sustainability. Then, the performance objectives were optimized by utilizing an evolutionary optimization approach for given retrofit levels for each building in a community. The proposed methodology was implemented on an illustrative community and Pareto-optimal solutions were developed. Finally, the Pareto-optimal solutions were utilized to assess four different retrofit programs to enhance the community performance.
The following conclusions can be drawn based on the proposed framework and illustrative example.
  • The proposed bi-objective retrofit optimization framework considered risk, downtime, and sustainability performance indicators for assessment and enhancement of community performance under a designed seismic hazard scenario. The proposed framework optimized the performance objectives for given pre-hazard mitigation alternatives considering uncertainties and provided the decision-makers with retrofit programs to enhance community performance for given retrofit costs.
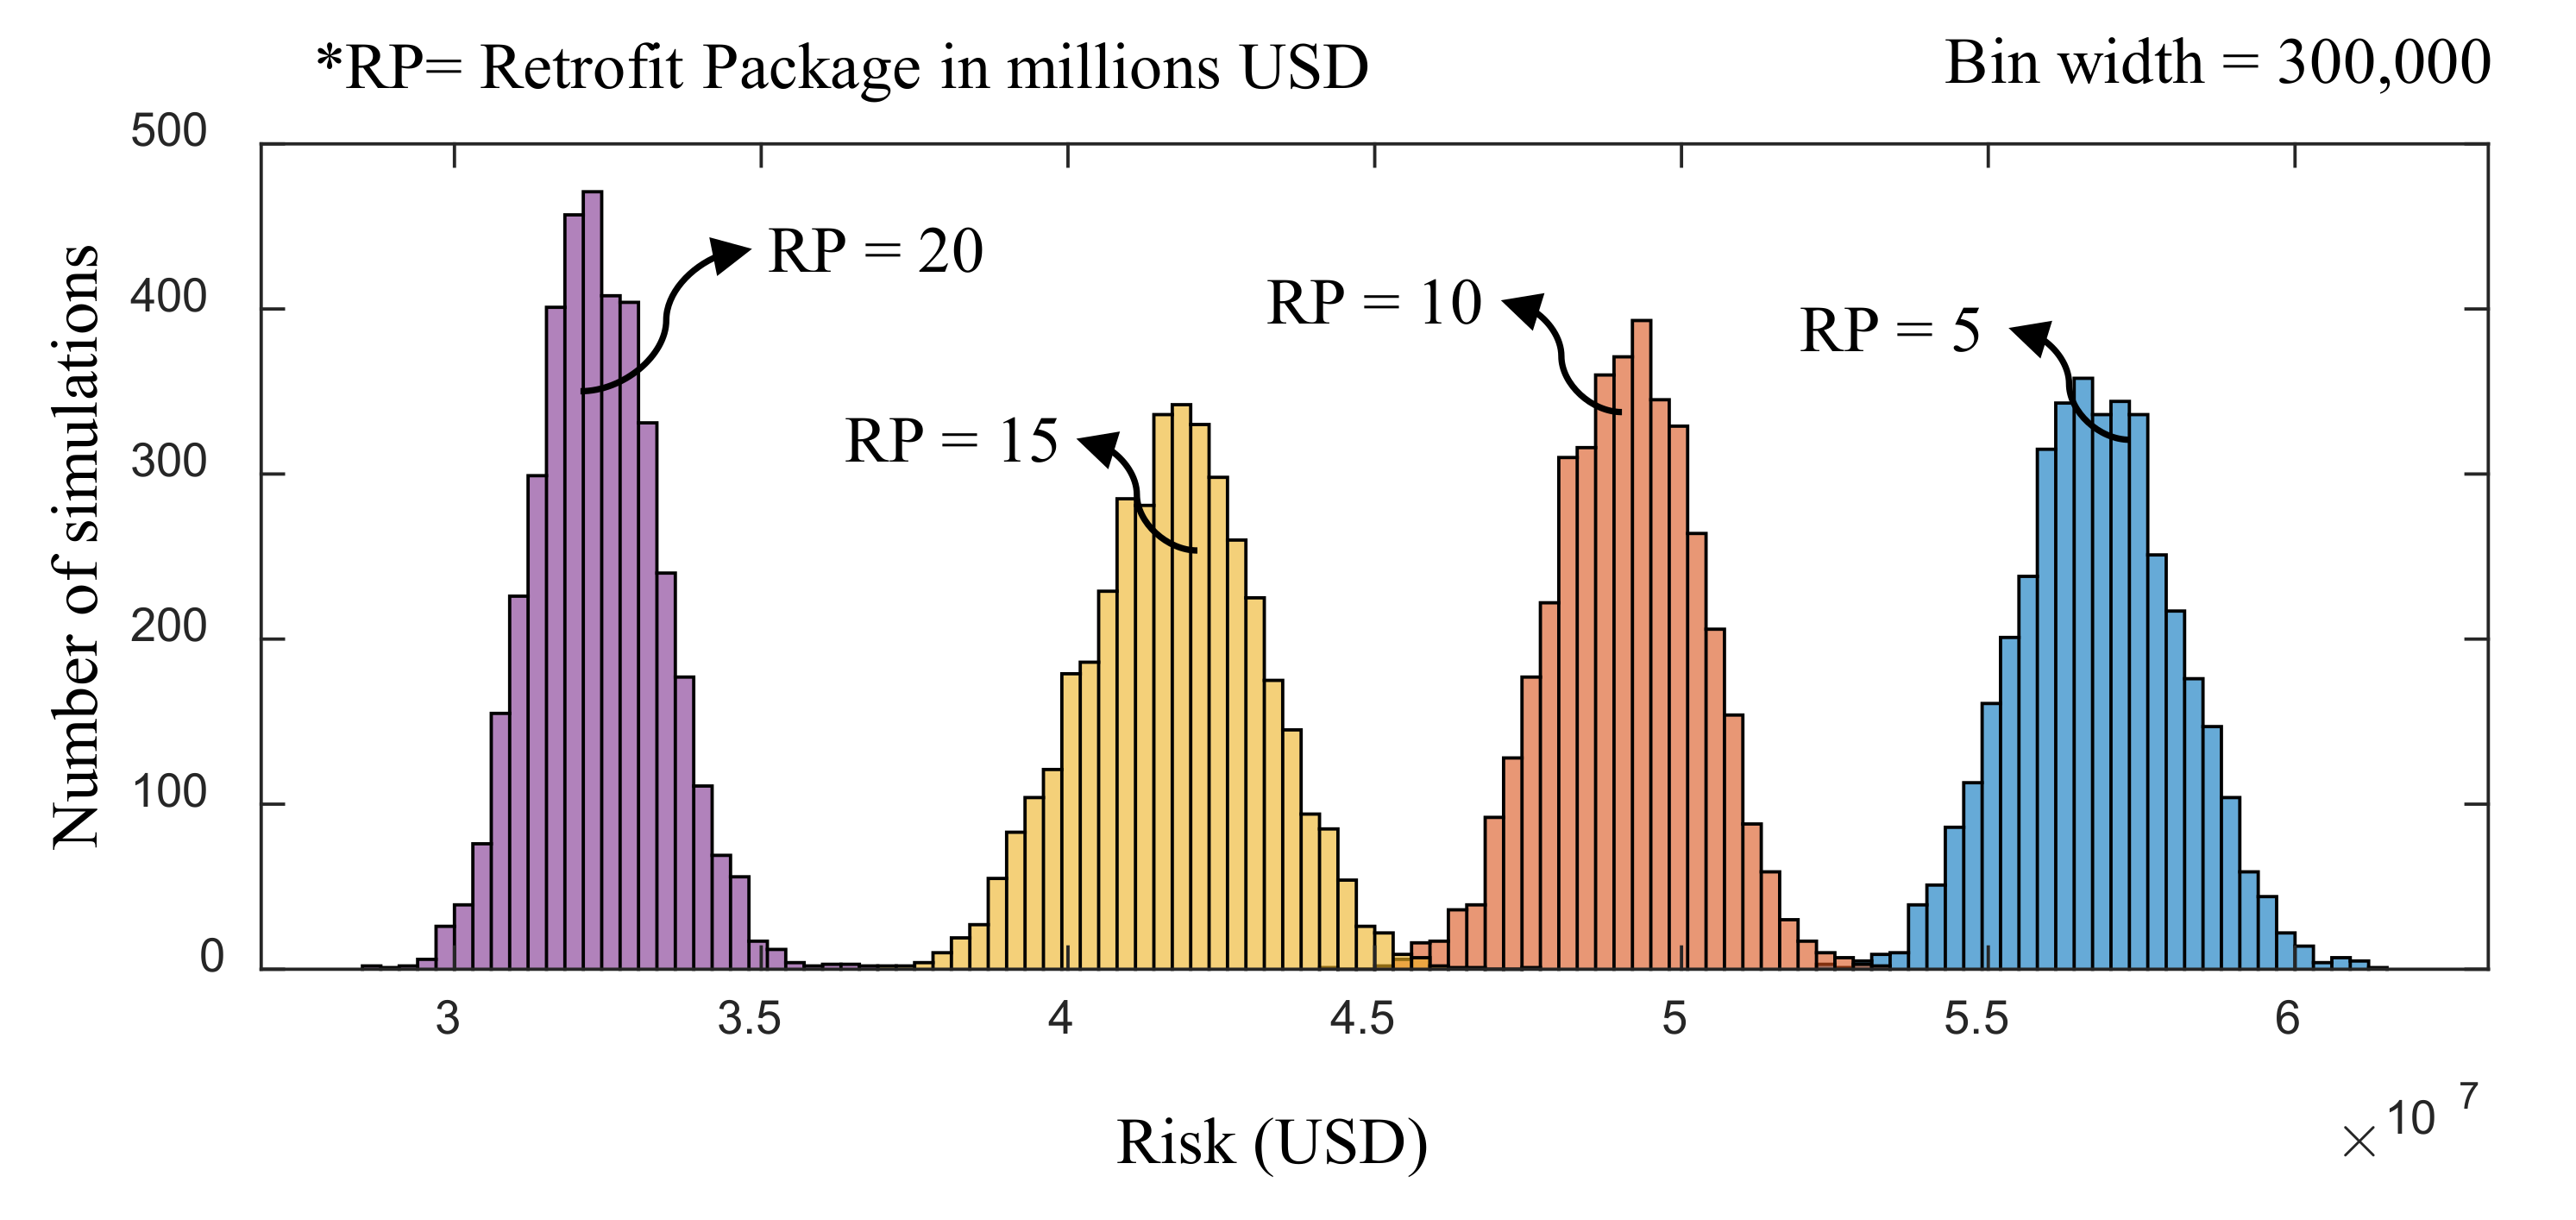
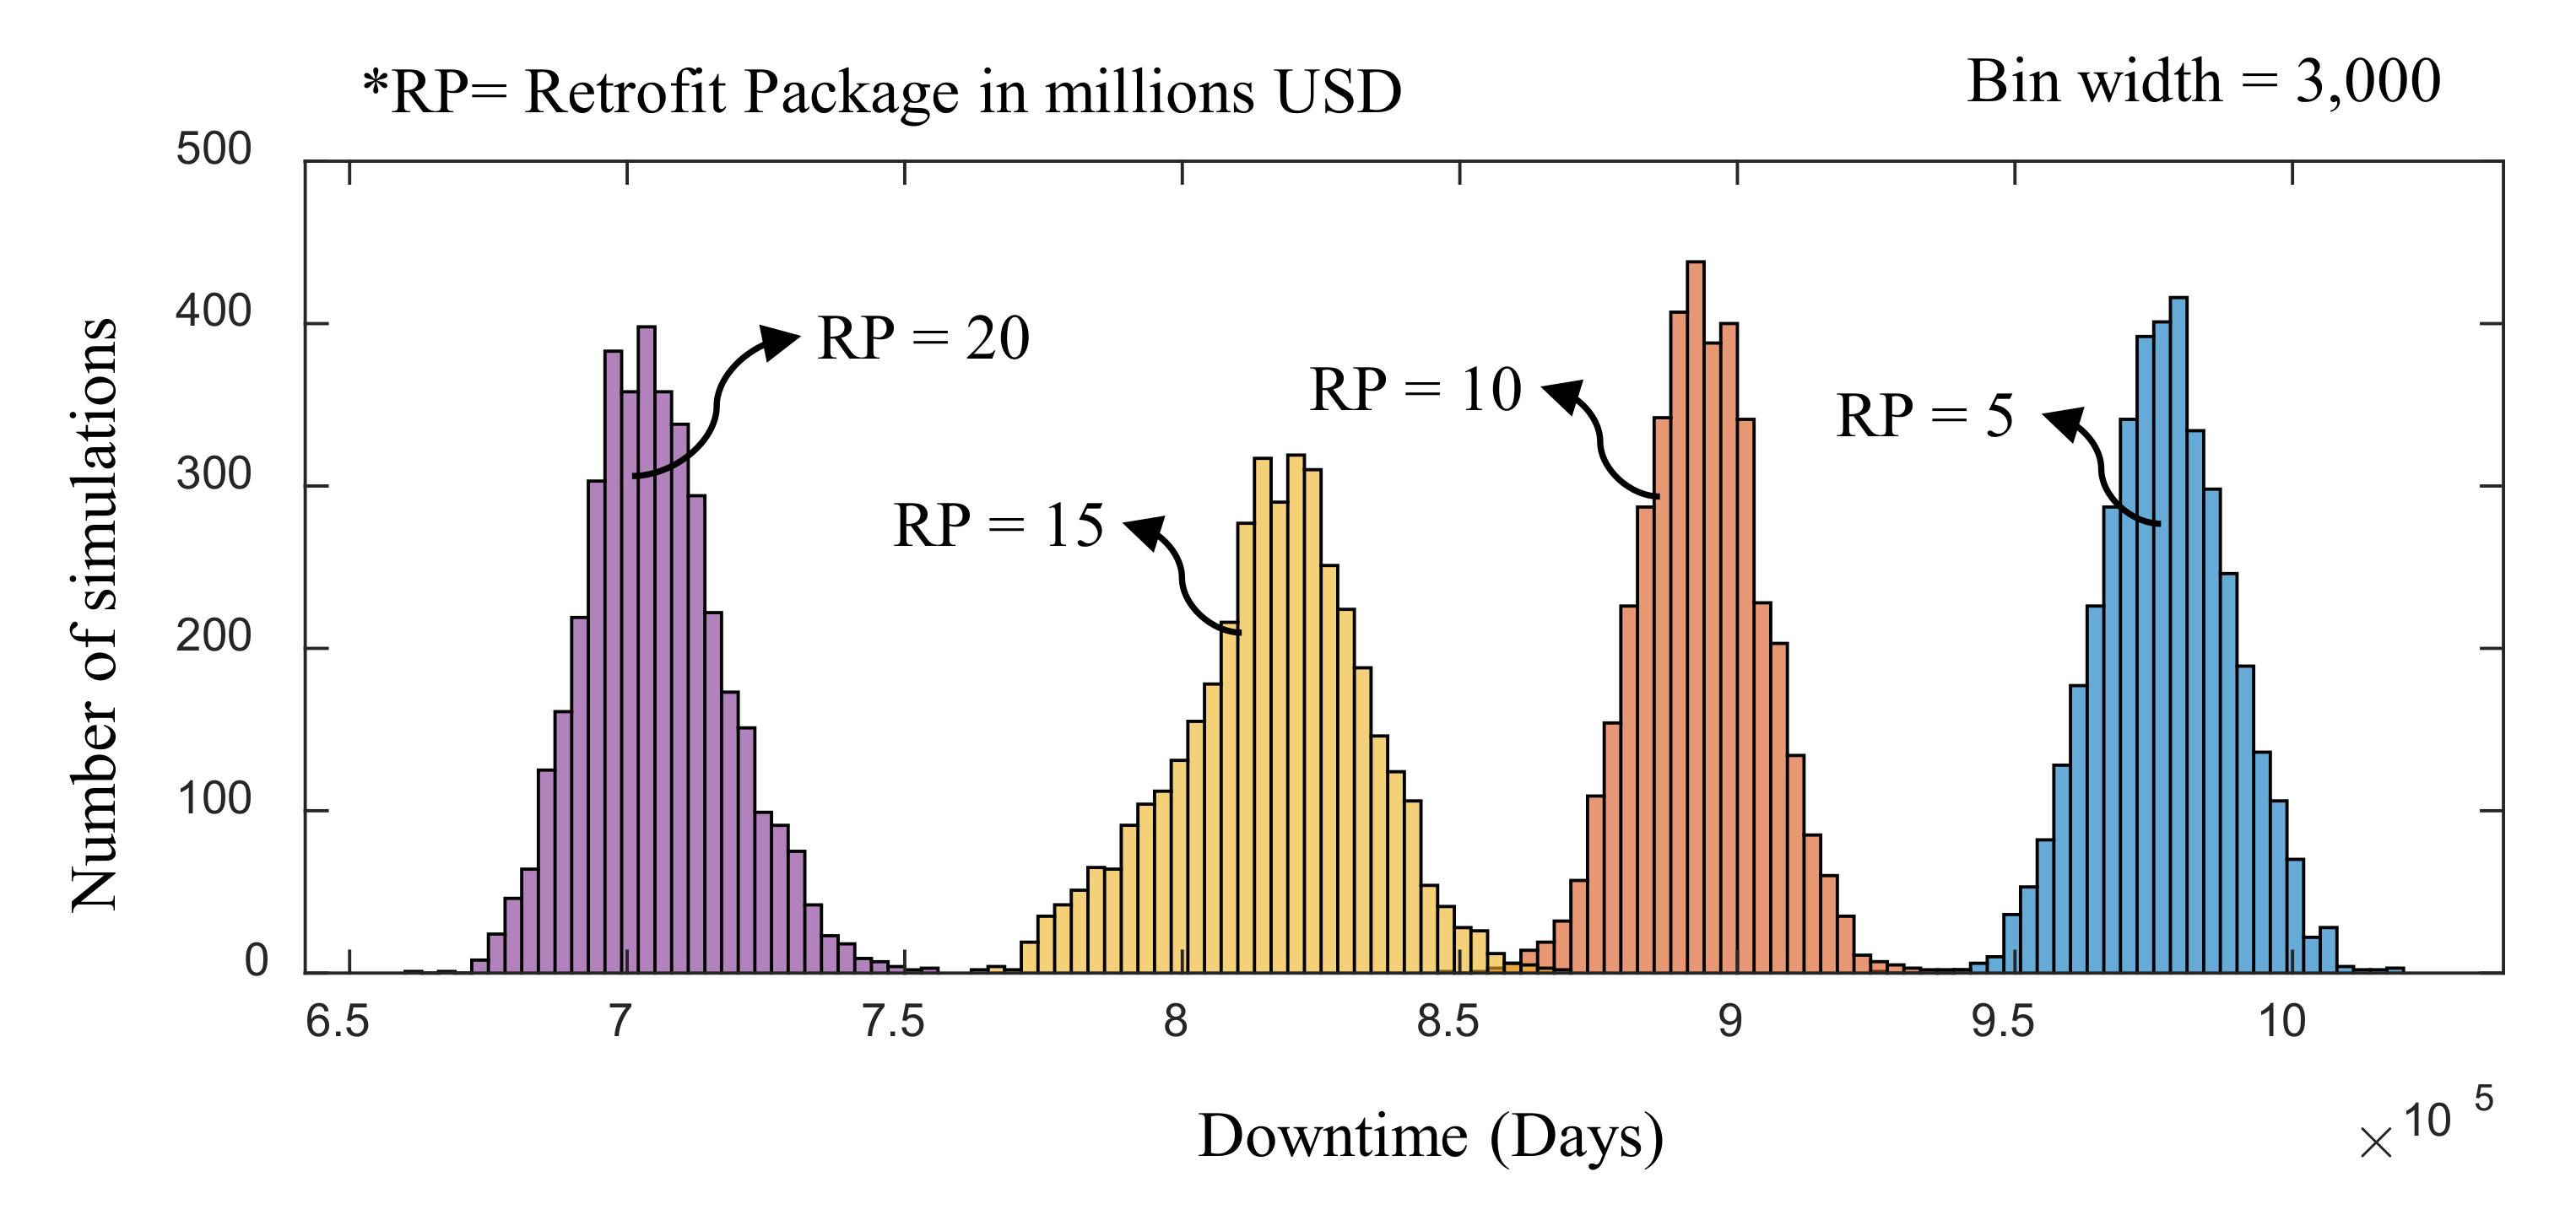
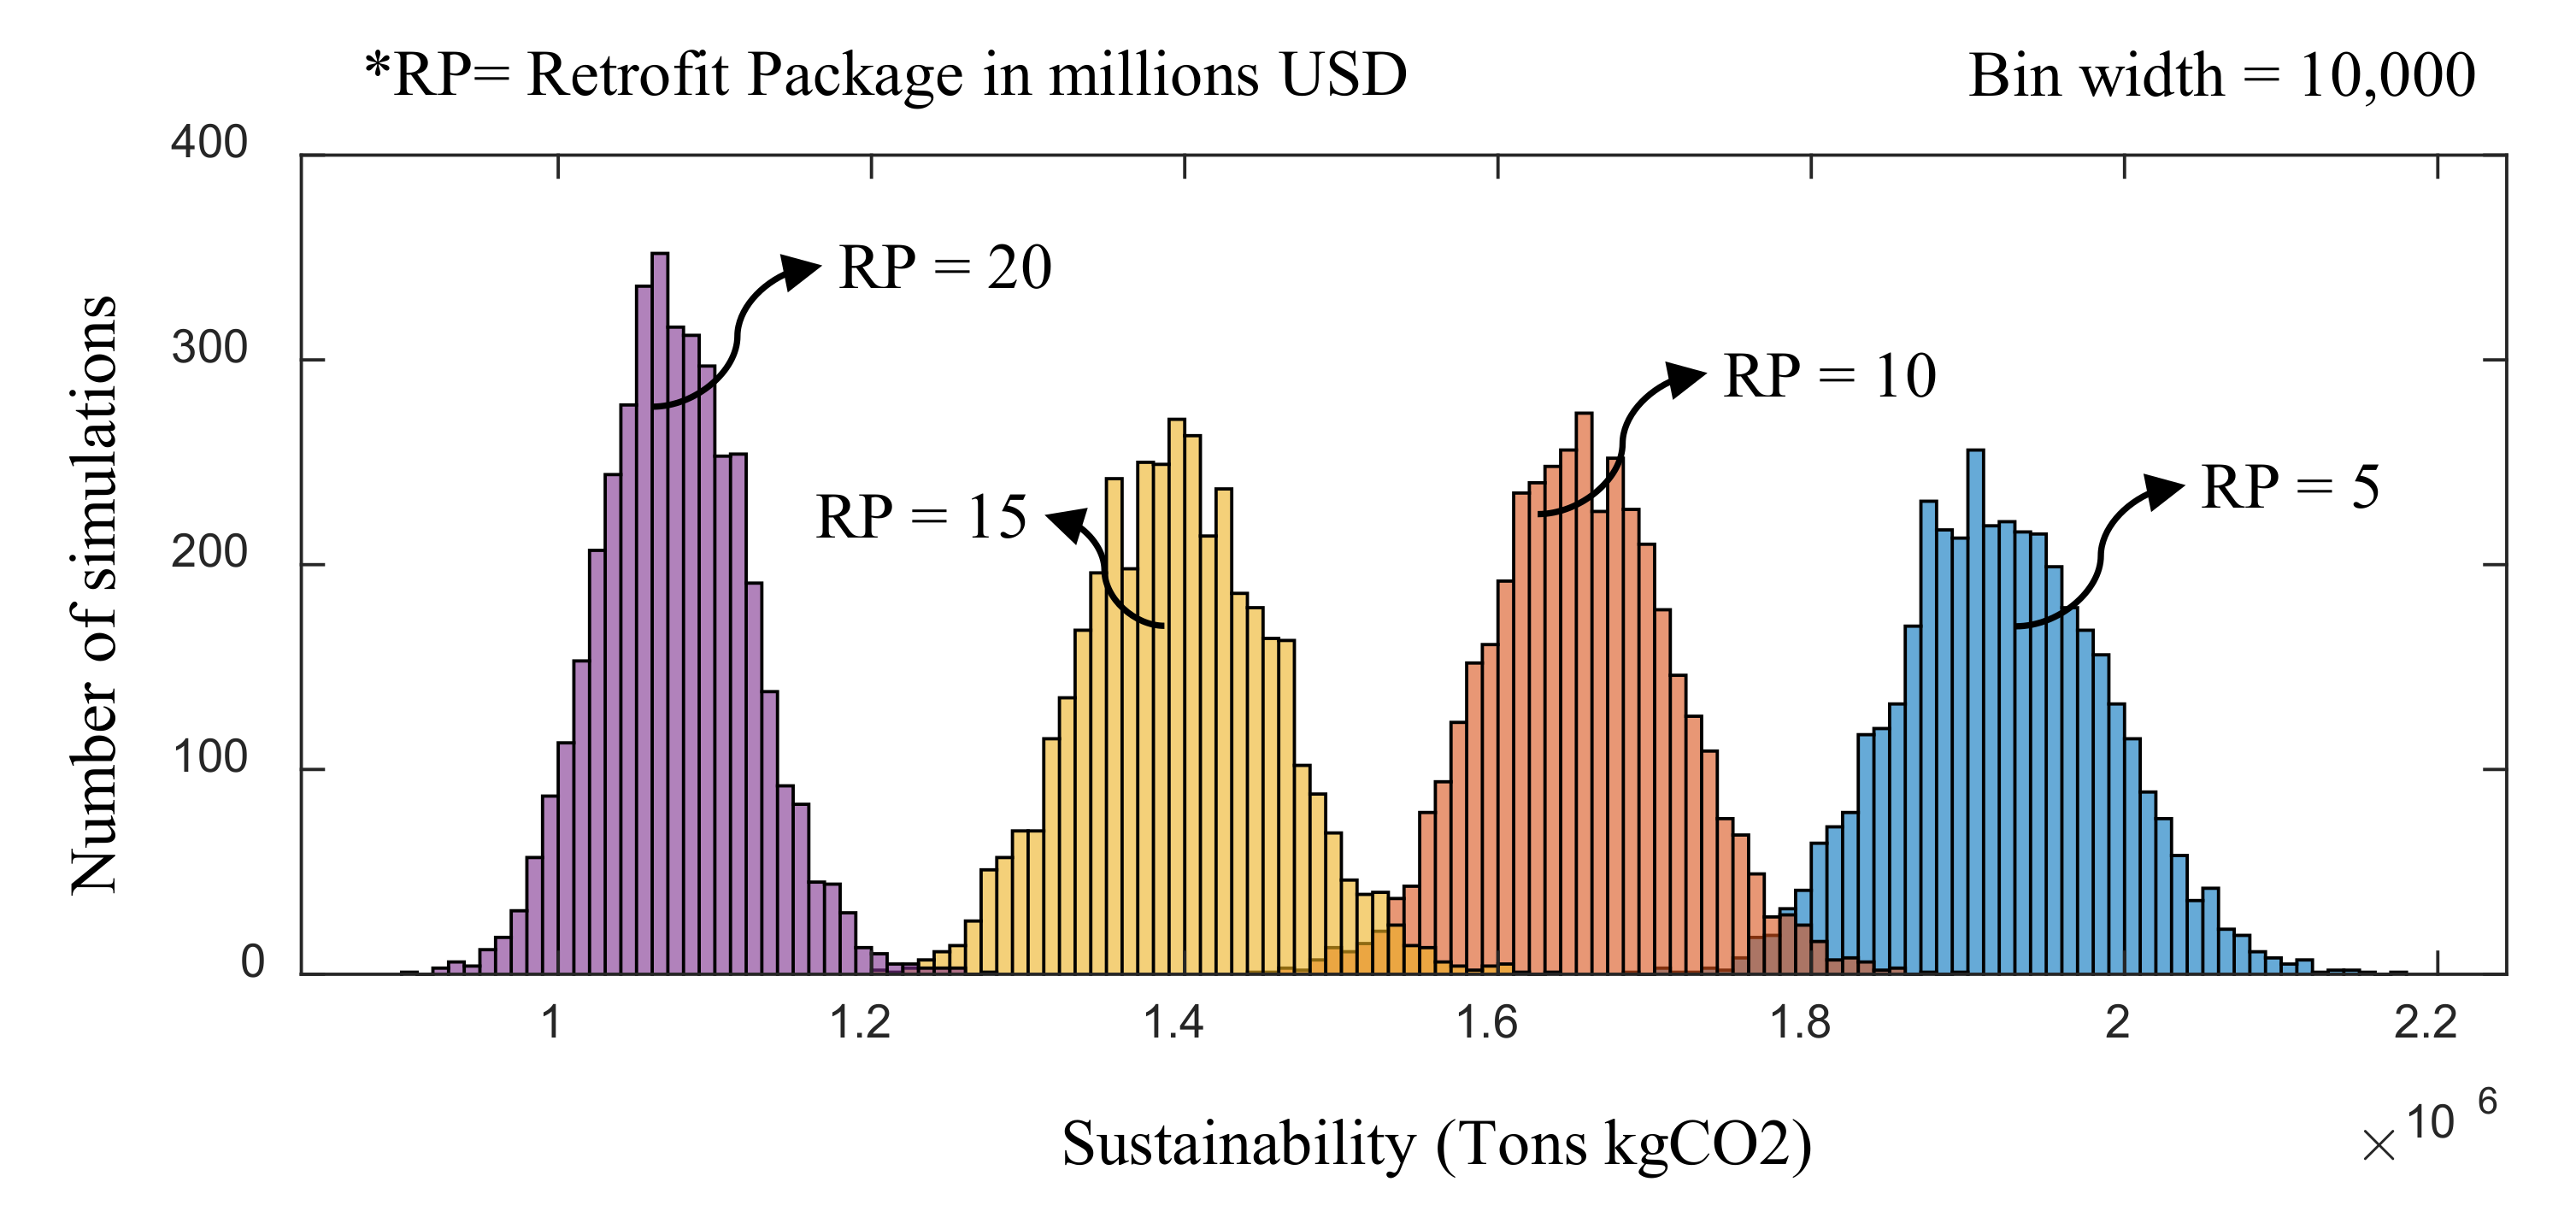
  • The distributions of discrete damage states and the performance indicators showed negligible skewness with kurtosis values close to three. This showed the distributions were almost normally distributed. The normal distributions were also observed for the retrofit programs extracted after performing performance-based evolutionary optimization.
  • Pareto-optimal solutions were determined by utilizing bi-objective optimization which provided optimal solutions for the considered performance indicators against the retrofit cost. The number of buildings required to be retrofitted at different retrofit levels to achieve performance enhancements for given retrofit costs were also determined. For instance, in a random simulation, to achieve risk, downtime, and sustainability performance of US$35.8 million, 0.727 million days, and 1.2 million tons of kgCO2 emissions, a retrofit cost of US$17.5 million is required. To achieve this level of performance, the number of buildings needed to be retrofitted in the five retrofit levels ranging from 1–5 were 518, 583, 536, 553, and 530.
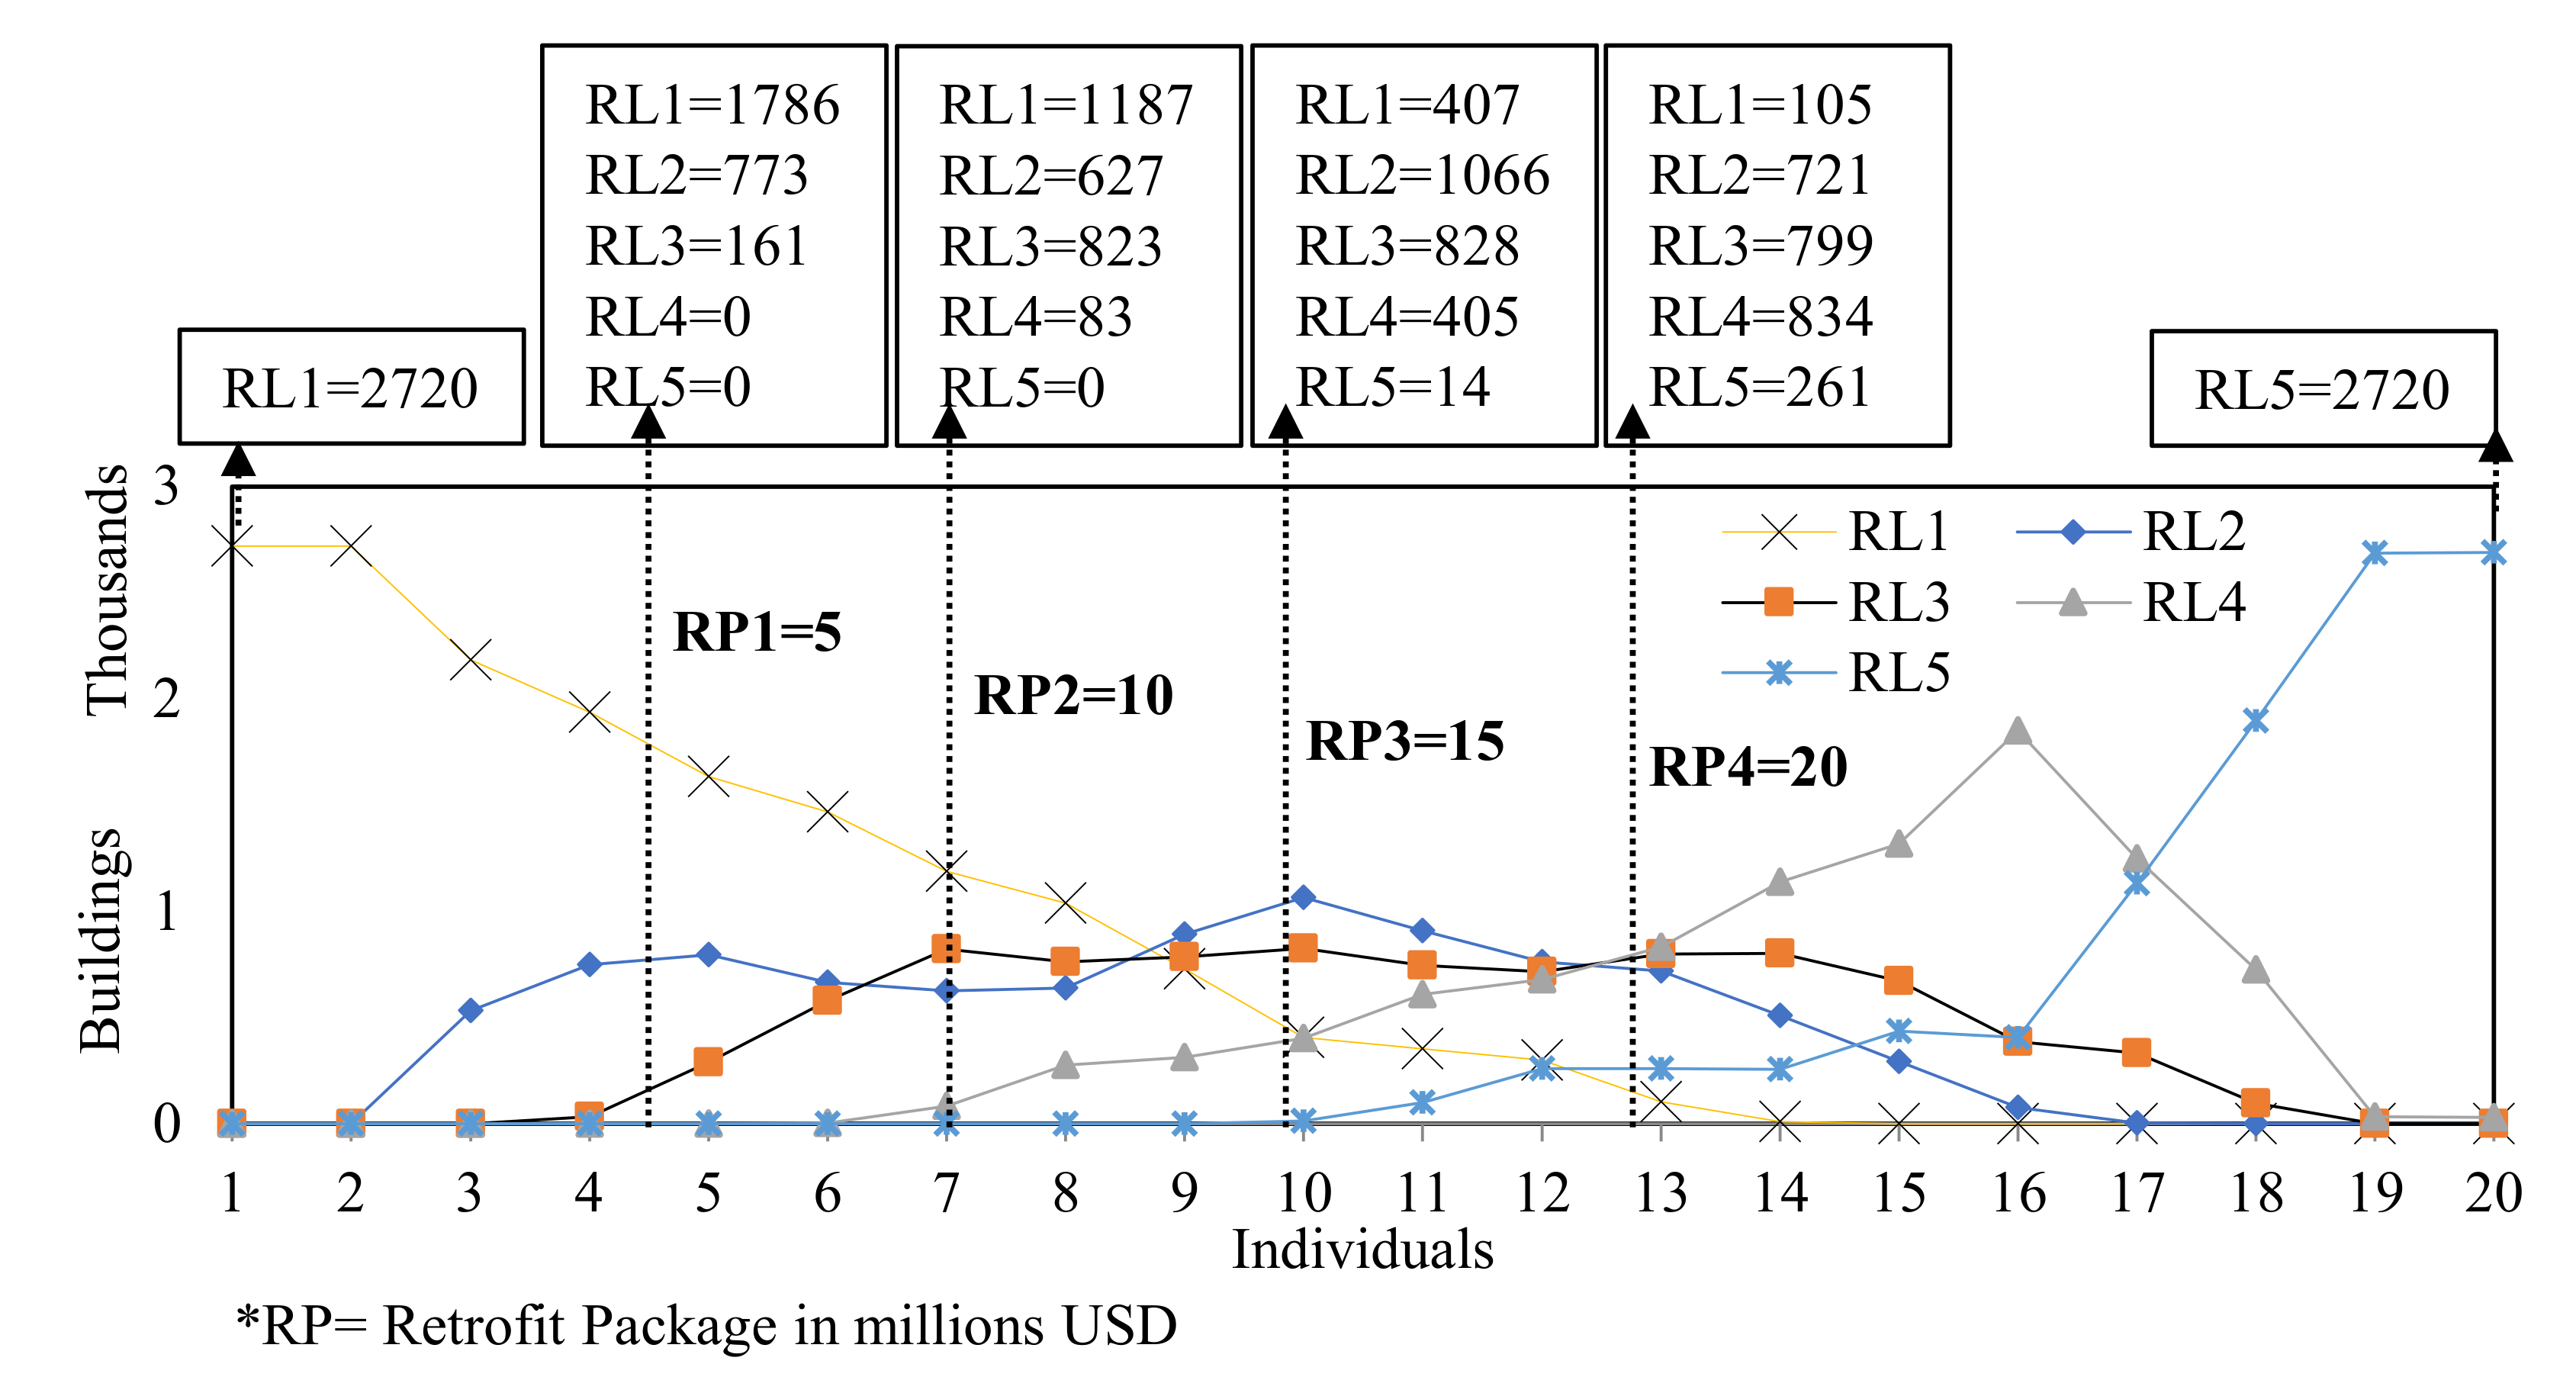
  • For an illustration of the proposed framework, four retrofit programs were extracted ranging from US$5–20 million and the resulting performance enhancements along with the number of buildings required to be retrofitted at different retrofit levels were determined. For instance, by applying a retrofit program of US$20 million, the mean risk, downtime, and sustainability performance values were reduced to 48.91%, 32.59%, and 50%. Furthermore, to achieve this level of performance enhancement, the mean number of buildings required to be retrofitted ranging from retrofit levels 1–5 were 105, 721, 799, 834, and 261.
In summary, the proposed framework considered pre-hazard retrofit alternatives to enhance the performance of community building portfolios under an earthquake scenario and can be extended to other extreme events. The methodology can be extended to optimize the post-hazard scenarios and during the recovery phase after an earthquake event. The study can also be extended to other physical infrastructure systems and new performance indicators can be added including total casualties, and embodied energy consumption, among others.

Author Contributions

Visualization, Z.Z., Investigation, Z.Z., Conceptualization, G.A.A., Methodology, G.A.A., Software, G.A.A., Writing-original draft, G.A.A., Writing-review & editing, Y.D., Validation, Y.D., Supervision, Y.D. All authors have read and agreed to the published version of the manuscript.

Funding

This research was funded by the National Key R&D Program of China (No. 2019YFB2102703). The support is gratefully acknowledged. The opinions and conclusions presented in this paper are those of the authors and do not necessarily reflect the views of the sponsoring organizations.

Conflicts of Interest

The authors declare no conflict of interest.

Appendix A. Inputs Related to the Fragility and Consequence Functions Utilized in the Illustrative Example

The mean values of considered fragility functions for the archetype buildings is shown in Table A1.
Table A1. Fragility functions utilized for different building types.
IDBuilding TypeCode LevelDamage StateFragility Function (g)
URML-PLow-Rise Unreinforced Masonry Bearing WallsPre-codeSlight
Moderate
Extensive
Complete
0.13
0.17
0.26
0.37
URML-LLow-Rise Unreinforced Masonry Bearing WallsLow codeSlight
Moderate
Extensive
Complete
0.14
0.20
0.32
0.46
URMM-LMid-Rise Unreinforced Masonry Bearing WallsLow codeSlight
Moderate
Extensive
Complete
0.10
0.16
0.27
0.46
C3L-LLow-Rise Concrete Frame with Unreinforced Masonry Infill WallsLow codeSlight
Moderate
Extensive
Complete
0.12
0.17
0.26
0.44
C3M-LMid-Rise Concrete Frame with Unreinforced Masonry Infill WallsLow codeSlight
Moderate
Extensive
Complete
0.11
0.17
0.32
0.51
C1M-LMid-Rise Concrete Moment FrameLow codeSlight
Moderate
Extensive
Complete
0.12
0.17
0.32
0.54
C1M-MMid-Rise Concrete Moment FrameModerate codeSlight
Moderate
Extensive
Complete
0.13
0.21
0.49
0.89
The mean values are expressed in terms of PGA (g) with coefficient of variation of 0.64.
The total construction material is evaluated by utilizing data provided in Table A2 extracted from HAZUS [22].
Table A2. Construction material composition for different building types.
IDConstruction MaterialsTons kg/Thousand Sft
URML-P,
URML-L,
URMM-L
Brick
Wood
Concrete
Steel
35
10.5
41
4
C3L-L,
C3M-L,
C1M-L,
C1M-M
Brick
Wood
Concrete
Steel
20
5.3
90
4
The considered distribution is lognormal with coefficient of variation 0.2.
The total cost and emissions in terms of kgCO2 per building is extracted by utilizing the information provided in Table A3.
Table A3. Costs and emissions data for considered construction materials.
Construction MaterialsCost in USD per kg TonsTons kgCO2 Emissions per kg Tons
Brick
Wood
Concrete
Steel
28
140
20
650
0.2–0.6
0.75–1.35
0.05–5.15
1.72–2.82
The considered distribution is uniform.
The cost and emissions data for damaged buildings is determined by utilizing percentage of total material damaged given damage state provided in Table A4.
Table A4. Percentage of total material damaged given damage state for different building types.
IDDamage StatePercentage of Total Material Damaged
BrickWoodConcreteSteel
URML-P,
URML-L,
URMM-L
Slight
Moderate
Extensive
Complete
3.5
18.5
50
100
3.5
18.5
50
100
0
6
27
100
0
6
27
100
C3L-L,
C3M-L
Slight
Moderate
Extensive
Complete
3
16
47.5
100
3
16
47.5
100
0.05
7
31
100
0.05
7
31
100
C1M-L,
C1M-M
Slight
Moderate
Extensive
Complete
0.5
3.5
17.5
100
0.5
3.5
17.5
100
0.05
6.5
30.5
100
0.05
6.5
30.5
100
The repair time for different building types given damage state is determined from the data provided in Table A5.
Table A5. Repair time estimation for different building types given damage state.
IDDamage StateRepair Time in Days
URML-P,
URML-L,
URMM-L
C3L-L
Slight
Moderate
Extensive
Complete
2
30
90
180
C3M-L,
C1M-L
C1M-M
Slight
Moderate
Extensive
Complete
5
30
120
240
The considered distribution is lognormal with coefficient of variation 0.4.
The downtime assessment of a building is determined by utilizing delay time statistics shown in Table A6.
Table A6. Delay time statistics.
ComponentBuilding ConditionDelay Time in DaysCoefficient of Variation
InspectionSlight
other
0
5
0
0.54
Engineering mobilizationSlight
Moderate
Extensive
Complete
6
12
12
50
0.4
0.4
0.4
0.32
FinancingInsurance
Private loans
SBA-backed loans
Not covered
6
15
48
48
1.11
0.68
0.57
0.65
Contractor mobilizationSlight
other
7
19
0.6
0.38
PermittingSlight
other
1
8
0.86
0.32

References

  1. Godschalk, D.R. Urban hazard mitigation: Creating resilient cities. Nat. Hazards Rev. 2003, 4, 136–143. [Google Scholar] [CrossRef]
  2. McAllister, T.P. Community Resilience Planning Guide for Buildings and Infrastructure Systems; NIST: Gaithersburg, MD, USA, 2015; Volume I. [Google Scholar]
  3. Koliou, M.; van de Lindt, J.W.; McAllister, T.P.; Ellingwood, B.R.; Dillard, M.; Cutler, H. State of the research in community resilience: Progress and challenges. Sustain. Resilient Infrastruct. 2017, 5, 131–151. [Google Scholar] [CrossRef]
  4. Huang, Y.-N.; Whittaker, A.S.; Hamburger, R.O. A simplified analysis procedure for performance-based earthquake engineering of buildings. Eng. Struct. 2017, 150, 719–735. [Google Scholar] [CrossRef]
  5. Fajfar, P. A nonlinear analysis method for performance-based seismic design. Earthq. Spectra 2000, 16, 573–592. [Google Scholar] [CrossRef]
  6. Ghobarah, A. Performance-based design in earthquake engineering: State of development. Eng. Struct. 2001, 23, 878–884. [Google Scholar] [CrossRef]
  7. Guo, H.; Dong, Y.; Bastidas-Arteaga, E.; Gu, X.-L. Probabilistic failure analysis, performance assessment, and sensitivity analysis of corroded reinforced concrete structures. Eng. Fail. Anal. 2021, 124, 105328. [Google Scholar] [CrossRef]
  8. Moehle, J.P. Seismic analysis, design, and review for tall buildings. Struct. Des. Tall Spec. Build. 2006, 15, 495–513. [Google Scholar] [CrossRef]
  9. Jeong, S.-H.; Mwafy, A.M.; Elnashai, A.S. Probabilistic seismic performance assessment of code-compliant multi-story RC buildings. Eng. Struct. 2012, 34, 527–537. [Google Scholar] [CrossRef]
  10. Qian, J.; Dong, Y. Uncertainty and multi-criteria global sensitivity analysis of structural systems using acceleration algorithm and sparse polynomial chaos expansion. Mech. Syst. Signal Processing 2022, 163, 108120. [Google Scholar] [CrossRef]
  11. Lemma, M.; Rebelo, C.; Silva, L. Seismic Design and Performance Assessment of Steel Frames Considering Joints’Behaviour. ce/papers 2021, 4, 1965–1973. [Google Scholar] [CrossRef]
  12. FEMA 440. Improvement of Nonlinear Static Seismic Analysis Procedures; FEMA 440: Redwood City, CA, USA, 2005. [Google Scholar]
  13. Jalayer, F.; Ebrahimian, H.; Miano, A. Record-to-record variability and code-compatible seismic safety-checking with limited number of records. Bull. Earthq. Eng. 2021, 19, 6361–6396. [Google Scholar] [CrossRef]
  14. Guan, M.; EERI, X.; Burton, M.; EERI, H.; Shokrabadi, M. A database of seismic designs, nonlinear models, and seismic responses for steel moment-resisting frame buildings. Earthq. Spectra 2021, 37, 1199–1222. [Google Scholar] [CrossRef]
  15. Zheng, Y.; Dong, Y.; Chen, B.; Anwar, G.A. Seismic damage mitigation of bridges with self-adaptive SMA-cable-based bearings. Smart Struct. Syst. 2019, 24, 127–139. [Google Scholar]
  16. Chen, L.; Qian, J.; Tu, B.; Frangopol, D.M.; Dong, Y. Performance-based risk assessment of reinforced concrete bridge piers subjected to vehicle collision. Eng. Struct. 2021, 229, 111640. [Google Scholar] [CrossRef]
  17. Giouvanidis, A.I.; Dong, Y. Seismic loss and resilience assessment of single-column rocking bridges. Bull. Earthq. Eng. 2020, 4481–4513. [Google Scholar] [CrossRef]
  18. Anwar, G.A.; Dong, Y.; Zhai, C. Performance-based probabilistic framework for seismic risk, resilience, and sustainability assessment of reinforced concrete structures. Adv. Struct. Eng. 2020, 23, 1454–1472. [Google Scholar] [CrossRef]
  19. Anwar, G.A.; Dong, Y.; Li, Y. Performance-based decision-making of buildings under seismic hazard considering long-term loss, sustainability, and resilience. Struct. Infrastruct. Eng. 2020, 17, 454–470. [Google Scholar] [CrossRef]
  20. Hashemi, M.J.; Al-Attraqchi, A.Y.; Kalfat, R.; Al-Mahaidi, R. Linking seismic resilience into sustainability assessment of limited-ductility RC buildings. Eng. Struct. 2019, 188, 121–136. [Google Scholar] [CrossRef]
  21. Dong, Y.; Frangopol, D.M. Performance-based seismic assessment of conventional and base-isolated steel buildings including environmental impact and resilience. Earthq. Eng. Struct. Dyn. 2016, 45, 739–756. [Google Scholar] [CrossRef]
  22. Vettore, M.; Donà, M.; Carpanese, P.; Follador, V.; da Porto, F.; Valluzzi, M.R. A multilevel procedure at urban scale to assess the vulnerability and the exposure of residential masonry buildings: The case study of Pordenone, Northeast Italy. Heritage 2020, 3, 80. [Google Scholar] [CrossRef]
  23. HAZUS. Multi-Hazard Loss Estimation Methodology, Earthquake Model; FEMA: Washington, DC, USA, 2003. [Google Scholar]
  24. FEMA-P-58. Seismic Performance Assessment of Buildings: Volume 1–Methodology; ATC: Camarillo, CA, USA, 2012. [Google Scholar]
  25. Yang, D.Y.; Frangopol, D.M. Chapter 23 in Routledge Handbook of Sustainable and Resilient Infrastructure. In Bridging the Gap between Sustainability and Resilience of Civil Infrastructure Using Lifetime Resilience; Routledge: Abingdon-on-Thames, UK, 2018; pp. 419–442. [Google Scholar]
  26. McAllister, T.P.; Moddemeyer, S. Aligning community resilience and sustainability. In Routledge Handbook of Sustainable and Resilient Infrastructure; Routledge: Abingdon-on-Thames, UK, 2018; pp. 15–27. [Google Scholar]
  27. Rodriguez-Nikl, T. Linking disaster resilience and sustainability. Civ. Eng. Environ. Syst. 2015, 32, 157–169. [Google Scholar] [CrossRef]
  28. Erdik, M. Earthquake risk assessment. Bull. Earthq. Eng. 2017, 15, 5055–5092. [Google Scholar] [CrossRef]
  29. Battarra, M.; Balcik, B.; Xu, H. Disaster preparedness using risk-assessment methods from earthquake engineering. Eur. J. Oper. Res. 2018, 269, 423–435. [Google Scholar] [CrossRef] [Green Version]
  30. Barbat, A.H.; Carreño, M.L.; Pujades, L.G.; Lantada, N.; Cardona, O.D.; Marulanda, M.C. Seismic vulnerability and risk evaluation methods for urban areas. A review with application to a pilot area. Struct. Infrastruct. Eng. 2010, 6, 17–38. [Google Scholar] [CrossRef]
  31. Miles, S.B.; Burton, H.V.; Kang, H. Community of Practice for Modeling Disaster Recovery. Nat. Hazards Rev. 2018, 20, 04018023. [Google Scholar] [CrossRef]
  32. Miles, S.B.; Chang, S.E. Modeling community recovery from earthquakes. Earthq. Spectra 2006, 22, 439–458. [Google Scholar] [CrossRef]
  33. Donà, M.; Bizzaro, L.; Carturan, F.; da Porto, F. Effects of business recovery strategies on seismic risk and cost-effectiveness of structural retrofitting for business enterprises. Earthq. Spectra 2019, 35, 1795–1819. [Google Scholar] [CrossRef]
  34. Sen, M.K.; Dutta, S.; Kabir, G.; Pujari, N.N.; Laskar, S.A. An integrated approach for modelling and quantifying housing infrastructure resilience against flood hazard. J. Clean. Prod. 2021, 288, 125526. [Google Scholar] [CrossRef]
  35. Masoomi, H.; van de Lindt, J.W. Community-Resilience-Based Design of the Built Environment. ASCE-ASME J. Risk Uncertain. Eng. Syst. Part A Civ. Eng. 2018, 5, 04018044. [Google Scholar] [CrossRef]
  36. Feng, K.; Wang, N.; Li, Q.; Lin, P. Measuring and enhancing resilience of building portfolios considering the functional interdependence among community sectors. Struct. Saf. 2017, 66, 118–126. [Google Scholar] [CrossRef]
  37. Burton, H.V.; Deierlein, G.; Lallemant, D.; Singh, Y. Measuring the Impact of Enhanced Building Performance on the Seismic Resilience of a Residential Community. Earthq. Spectra 2017, 33, 1347–1367. [Google Scholar] [CrossRef]
  38. Lin, P.; Wang, N. Stochastic post-disaster functionality recovery of community building portfolios I: Modeling. Struct. Saf. 2017, 69, 96–105. [Google Scholar] [CrossRef]
  39. Hassan, E.M.; Mahmoud, H. An integrated socio-technical approach for post-earthquake recovery of interdependent healthcare system. Reliab. Eng. Syst. Saf. 2020, 201, 106953. [Google Scholar] [CrossRef]
  40. Zinke, T.; Bocchini, P.; Frangopol, D.; Ummenhofer, T. Combining resilience and sustainability in infrastructure projects. In Life-Cycle and Sustainability of Civil Infrastructure Systems; Taylor & Francis Group: London, UK, 2013; p. 473. [Google Scholar]
  41. Asprone, D.; Manfredi, G. Linking disaster resilience and urban sustainability: A glocal approach for future cities. Disasters 2015, 39, s96–s111. [Google Scholar] [CrossRef] [Green Version]
  42. Dong, Y.; Frangopol, D.M.; Saydam, D. Pre-earthquake multi-objective probabilistic retrofit optimization of bridge networks based on sustainability. J. Bridge Eng. 2014, 19, 04014018. [Google Scholar] [CrossRef]
  43. Dong, Y.; Frangopol, D.M. Adaptation optimization of residential buildings under hurricane threat considering climate change in a lifecycle context. J. Perform. Constr. Facil. 2017, 31, 04017099. [Google Scholar] [CrossRef]
  44. Holland, J. Adaptation in Natural and Artificial Systems; University of Michigan Press: Ann Arbor, MI, USA, 1975. [Google Scholar]
  45. Schaffer, J.D. Multiple objective optimization with vector evaluated genetic algorithms. In Proceedings of the first International Conference on Genetic Algorithms and Their Applications, Pittsburg, PA, USA, 24–26 July 1985. [Google Scholar]
  46. Horn, J.; Nafpliotis, N.; Goldberg, D.E. A niched Pareto genetic algorithm for multiobjective optimization. In Proceedings of the first IEEE conference on evolutionary computation, IEEE world congress on computational intelligence, Orlando, FL, USA, 27–29 June 1994; pp. 82–87. [Google Scholar]
  47. Konak, A.; Coit, D.W.; Smith, A.E. Multi-objective optimization using genetic algorithms: A tutorial. Reliab. Eng. Syst. Saf. 2006, 91, 992–1007. [Google Scholar] [CrossRef]
  48. Zitzler, E.; Laumanns, M.; Thiele, L. SPEA2: Improving the strength Pareto evolutionary algorithm. TIK-Report 2001, 1–13. [Google Scholar]
  49. Deb, K.; Pratap, A.; Agarwal, S.; Meyarivan, T. A fast and elitist multiobjective genetic algorithm: NSGA-II. IEEE Trans. Evol. Comput. 2002, 6, 182–197. [Google Scholar] [CrossRef] [Green Version]
  50. Zhang, W.; Nicholson, C. A multi-objective optimization model for retrofit strategies to mitigate direct economic loss and population dislocation. Sustain. Resilient Infrastruct. 2016, 1, 123–136. [Google Scholar] [CrossRef]
  51. Sutley, E.J.; van de Lindt, J.W.; Peek, L. Multihazard analysis: Integrated engineering and social science approach. J. Struct. Eng. 2017, 143, 04017107. [Google Scholar] [CrossRef]
  52. Hammersley, J. Monte Carlo Methods; Springer Science & Business Media: Berlin/Heidelberg, Germany, 2013. [Google Scholar]
  53. Donà, M.; Carpanese, P.; Follador, V.; Sbrogiò, L.; da Porto, F. Mechanics-based fragility curves for Italian residential URM buildings. Bull. Earthq. Eng. 2021, 19, 3099–3127. [Google Scholar] [CrossRef]
  54. Šipoš, T.K.; Hadzima-Nyarko, M. Rapid seismic risk assessment. Int. J. Disaster Risk Reduct. 2017, 24, 348–360. [Google Scholar] [CrossRef]
  55. Carreño, M.L.; Cardona, O.D.; Barbat, A.H. New methodology for urban seismic risk assessment from a holistic perspective. Bull. Earthq. Eng. 2012, 10, 547–565. [Google Scholar] [CrossRef]
  56. Zentner, I.; Gündel, M.; Bonfils, N. Fragility analysis methods: Review of existing approaches and application. Nucl. Eng. Des. 2017, 323, 245–258. [Google Scholar] [CrossRef] [Green Version]
  57. Crowley, H.; Pinho, R.; van Elk, J.; Uilenreef, J. Probabilistic damage assessment of buildings due to induced seismicity. Bull. Earthq. Eng. 2019, 17, 4495–4516. [Google Scholar] [CrossRef]
  58. Da Porto, F.; Donà, M.; Rosti, A.; Rota, M.; Lagomarsino, S.; Cattari, S.; Borzi, B.; Onida, M.; De Gregorio, D.; Perelli, F.L. Comparative analysis of the fragility curves for Italian residential masonry and RC buildings. Bull. Earthq. Eng. 2021, 19, 3209–3252. [Google Scholar] [CrossRef]
  59. Park, J.; Towashiraporn, P.; Craig, J.I.; Goodno, B.J. Seismic fragility analysis of low-rise unreinforced masonry structures. Eng. Struct. 2009, 31, 125–137. [Google Scholar] [CrossRef]
  60. Farhan, M.; Bousias, S. Seismic fragility analysis of LNG sub-plant accounting for component dynamic interaction. Bull. Earthq. Eng. 2020, 18, 5063–5085. [Google Scholar] [CrossRef]
  61. Qian, J.; Dong, Y. Multi-criteria decision making for seismic intensity measure selection considering uncertainty. Earthq. Eng. Struct. Dyn. 2020, 49, 1095–1114. [Google Scholar] [CrossRef]
  62. Wang, X.; Shahzad, M.M.; Wang, T. Research on dynamic response characteristics and control effect of mega-sub controlled structural system under long-period ground motions. In Structures; Elsevier: Amsterdam, The Netherlands, 2021; Volume 29, pp. 225–234. [Google Scholar]
  63. Zhang, N.; Gu, Q.; Dong, Y.; Qian, J.; Zheng, Y. Seismic performance of bridges with ECC-reinforced piers. Soil Dyn. Earthq. Eng. 2021, 146, 106753. [Google Scholar] [CrossRef]
  64. Li, Y.; Dong, Y.; Frangopol, D.M.; Gautam, D. Long-term resilience and loss assessment of highway bridges under multiple natural hazards. Struct. Infrastruct. Eng. 2020, 16, 626–641. [Google Scholar] [CrossRef]
  65. Silva, V. Critical issues on probabilistic earthquake loss assessment. J. Earthq. Eng. 2018, 22, 1683–1709. [Google Scholar] [CrossRef]
  66. Stojadinović, Z.; Kovačević, M.; Marinković, D.; Stojadinović, B. Rapid earthquake loss assessment based on machine learning and representative sampling. Earthq. Spectra 2021. [Google Scholar] [CrossRef]
  67. Erdik, M.; Şeşetyan, K.; Demircioğlu, M.; Hancılar, U.; Zülfikar, C. Rapid earthquake loss assessment after damaging earthquakes. Soil Dyn. Earthq. Eng. 2011, 31, 247–266. [Google Scholar] [CrossRef]
  68. Kircher, C.A.; Whitman, R.V.; Holmes, W.T. HAZUS earthquake loss estimation methods. Nat. Hazards Rev. 2006, 7, 45–59. [Google Scholar] [CrossRef]
  69. Cardone, D.; Perrone, G. Damage and loss assessment of pre-70 RC frame buildings with FEMA P-58. J. Earthq. Eng. 2017, 21, 23–61. [Google Scholar] [CrossRef]
  70. Molina Hutt, C.; Almufti, I.; Willford, M.; Deierlein, G. Seismic loss and downtime assessment of existing tall steel-framed buildings and strategies for increased resilience. J. Struct. Eng. 2016, 142, C4015005. [Google Scholar] [CrossRef]
  71. Mitrani-Reiser, J. An ounce of prevention: Probabilistic Loss Estimation for Performance-Based Earthquake Engineering. Ph.D. Thesis, California Institute of Technology, Pasadena, CA, USA, 2007. [Google Scholar]
  72. Almufti, I.; Willford, M. REDi™ Rating System: Resilience Based Earthquake Design Initiative for the Next Generation of Buildings. Version 1.0; Arup: London, UK, 2013; pp. 1–68. [Google Scholar]
  73. Asadi, E.; Salman, A.M.; Li, Y. Multi-criteria decision-making for seismic resilience and sustainability assessment of diagrid buildings. Eng. Struct. 2019, 191, 229–246. [Google Scholar] [CrossRef]
  74. FEMA-547. Techniques for the Seismic Rehabilitation of Existing Buildings; Building Seismic Safety Council for the Federal Emergency Management Agency: Washington, DC, USA, 2006. [Google Scholar]
  75. FEMA-P695. Quantification of Building Seismic Performance Factors; US Department of Homeland Security, FEMA: Washington, DC, USA, 2009. [Google Scholar]
  76. Anwar, G.A.; Dong, Y. Seismic resilience of retrofitted RC buildings. Earthq. Eng. Eng. Vib. 2020, 19, 561–571. [Google Scholar] [CrossRef]
Figure 1. Bi-objective retrofit optimization framework for community building portfolio considering uncertainties.
Buildings 12 00085 g001
Figure 2. Evolutionary optimization terminologies in the context of community building portfolio.
Buildings 12 00085 g002
Figure 3. Performance objectives assessment of community building portfolio utilizing performance-based assessment methodology.
Buildings 12 00085 g003
Figure 4. Damage state assessment under seismic hazard.
Buildings 12 00085 g004
Figure 5. Illustration of fast non-dominated sorting and crowding distances.
Buildings 12 00085 g005
Figure 6. Illustrative community consisting of building communities.
Buildings 12 00085 g006
Figure 7. Damage states distributions of community building portfolio under given hazard.
Buildings 12 00085 g007
Figure 8. Damage states of community building portfolio under a given hazard.
Buildings 12 00085 g008
Figure 9. Performance indicators of community building portfolio under a given hazard scenario.
Buildings 12 00085 g009
Figure 10. Performance indicator distributions of community building portfolio given hazard scenario for (a) Risk, (b) Downtime, and (c) Sustainability.
Buildings 12 00085 g010
Figure 11. Pareto-optimal solutions of performance indicators against retrofit costs for (a) Risk, (b) Downtime, and (c) Sustainability.
Buildings 12 00085 g011
Figure 12. Mean values of buildings at different retrofit levels in a population along with considered four retrofit programs.
Buildings 12 00085 g012
Figure 13. Distributions of risk performance indicator under four retrofit programs.
Buildings 12 00085 g013
Figure 14. Distributions of downtime performance indicator under four retrofit programs.
Buildings 12 00085 g014
Figure 15. Distributions of sustainability performance indicator under four retrofit programs.
Buildings 12 00085 g015
Table 1. Statistical moments of damage states of community building portfolio given hazard.
Damage StatesMean
(Buildings)
Standard
Deviation
SkewnessKurtosis
No-damage187.1313.110.0232.996
Slight damage251.0514.790.0512.877
Moderate damage614.4121.84−0.0123.058
Extensive damage685.8422.360.0463.045
Complete damage981.5724.530.0783.126
Table 2. Statistical moments of risk performance indicator under considered retrofit programs.
Risk Performance IndicatorMean
(Million USD)
Standard Deviation
(Million USD)
SkewnessKurtosis
Without a retrofit program63.301.420.0573.03
Retrofit of 5 million USD56.781.330.0432.93
Retrofit of 10 million USD49.101.22−0.0652.98
Retrofit of 15 million USD41.741.44−0.0262.86
Retrofit of 20 million USD32.341.040.2113.23
Publisher’s Note: MDPI stays neutral with regard to jurisdictional claims in published maps and institutional affiliations.

