


Evaluating the Effects of Different Improvement Strategies for the Outdoor Thermal Environment at a University Campus in the Summer: A Case Study in Northern China


Abstract
:
1. Introduction
2. Methods
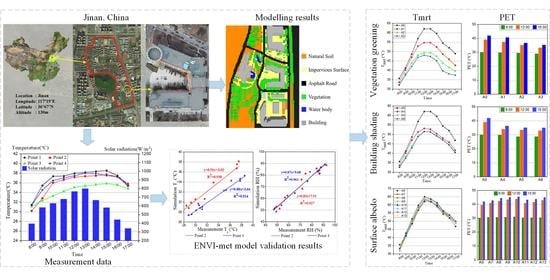
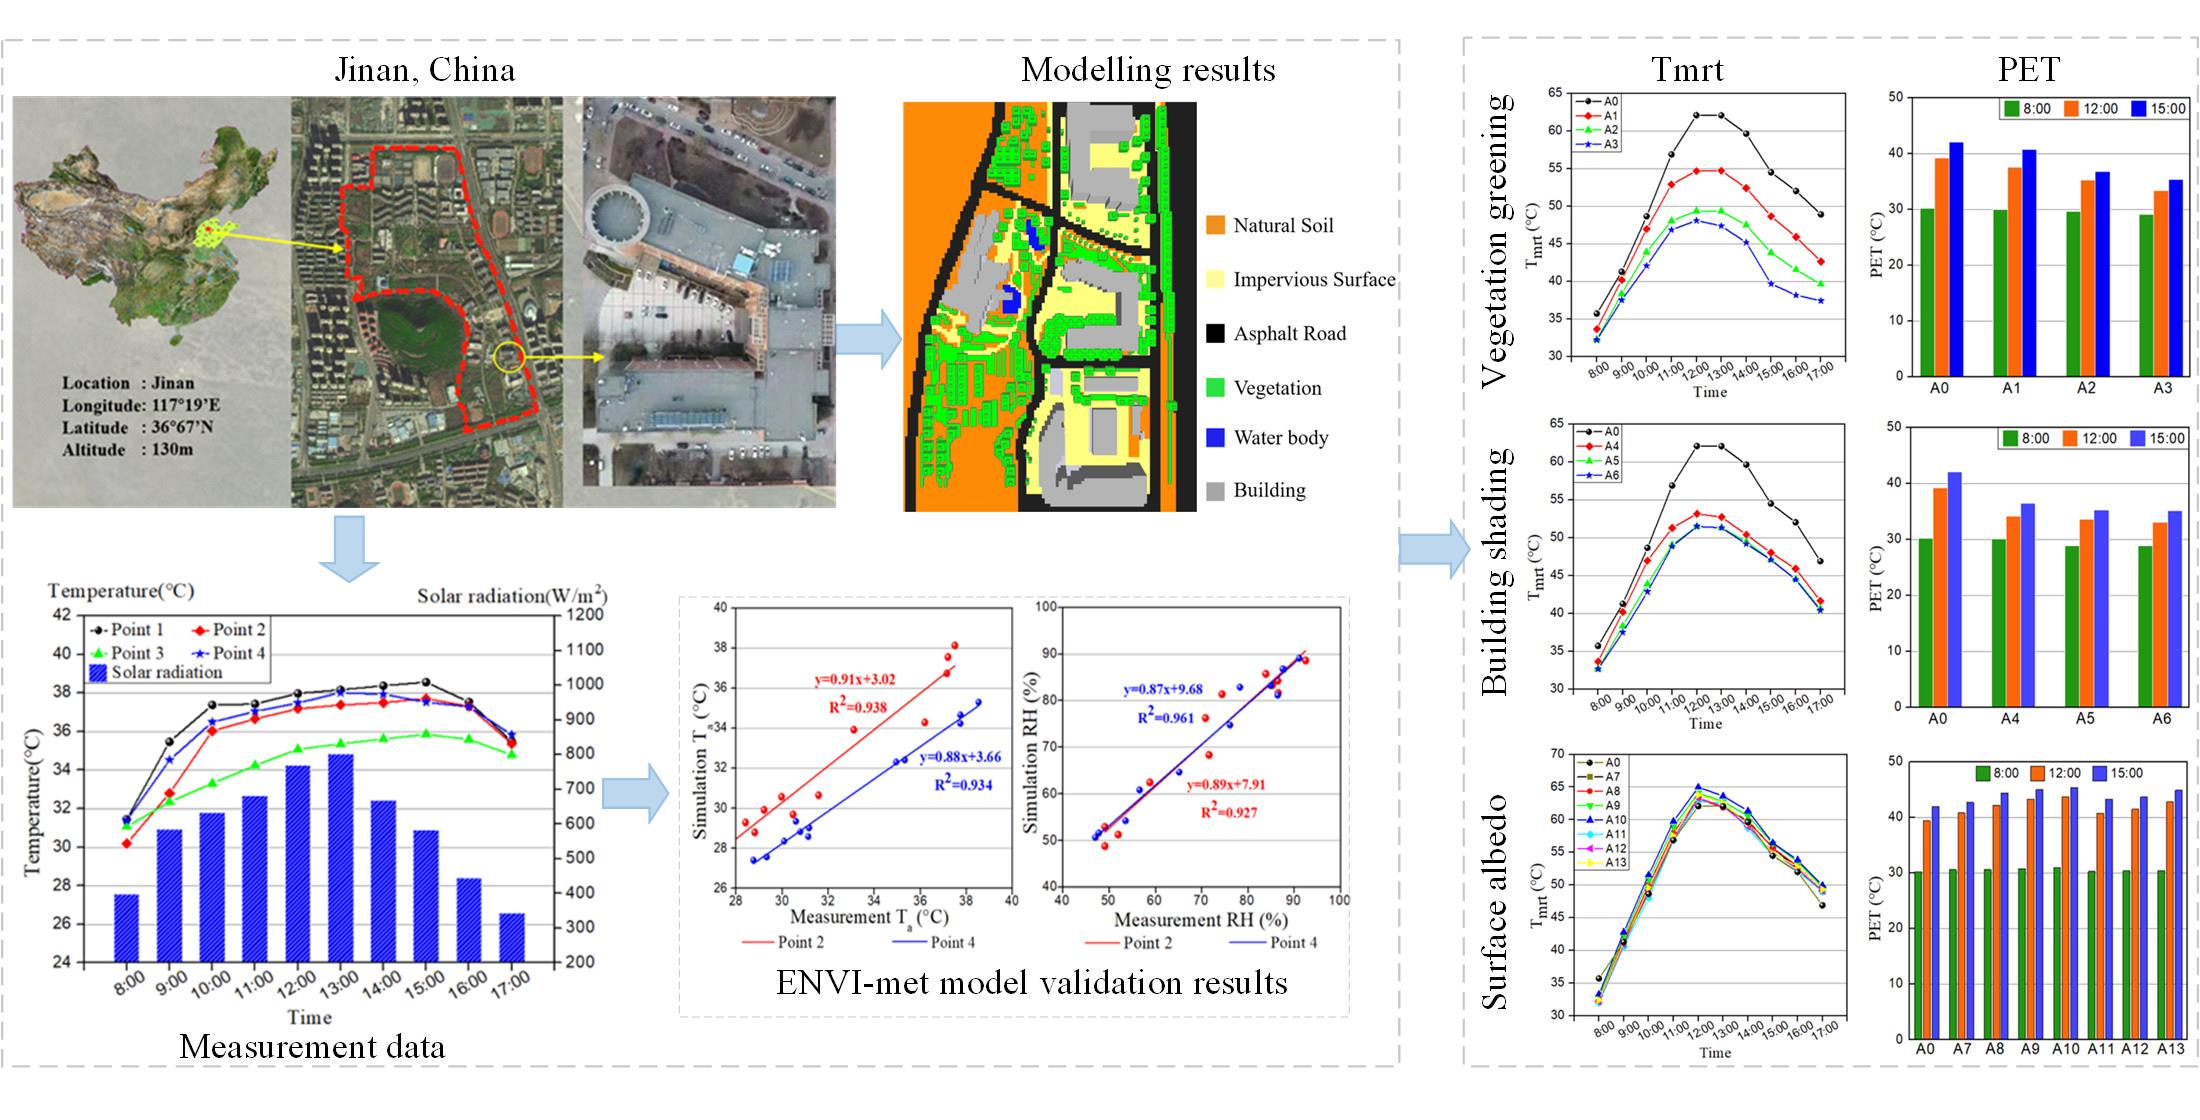
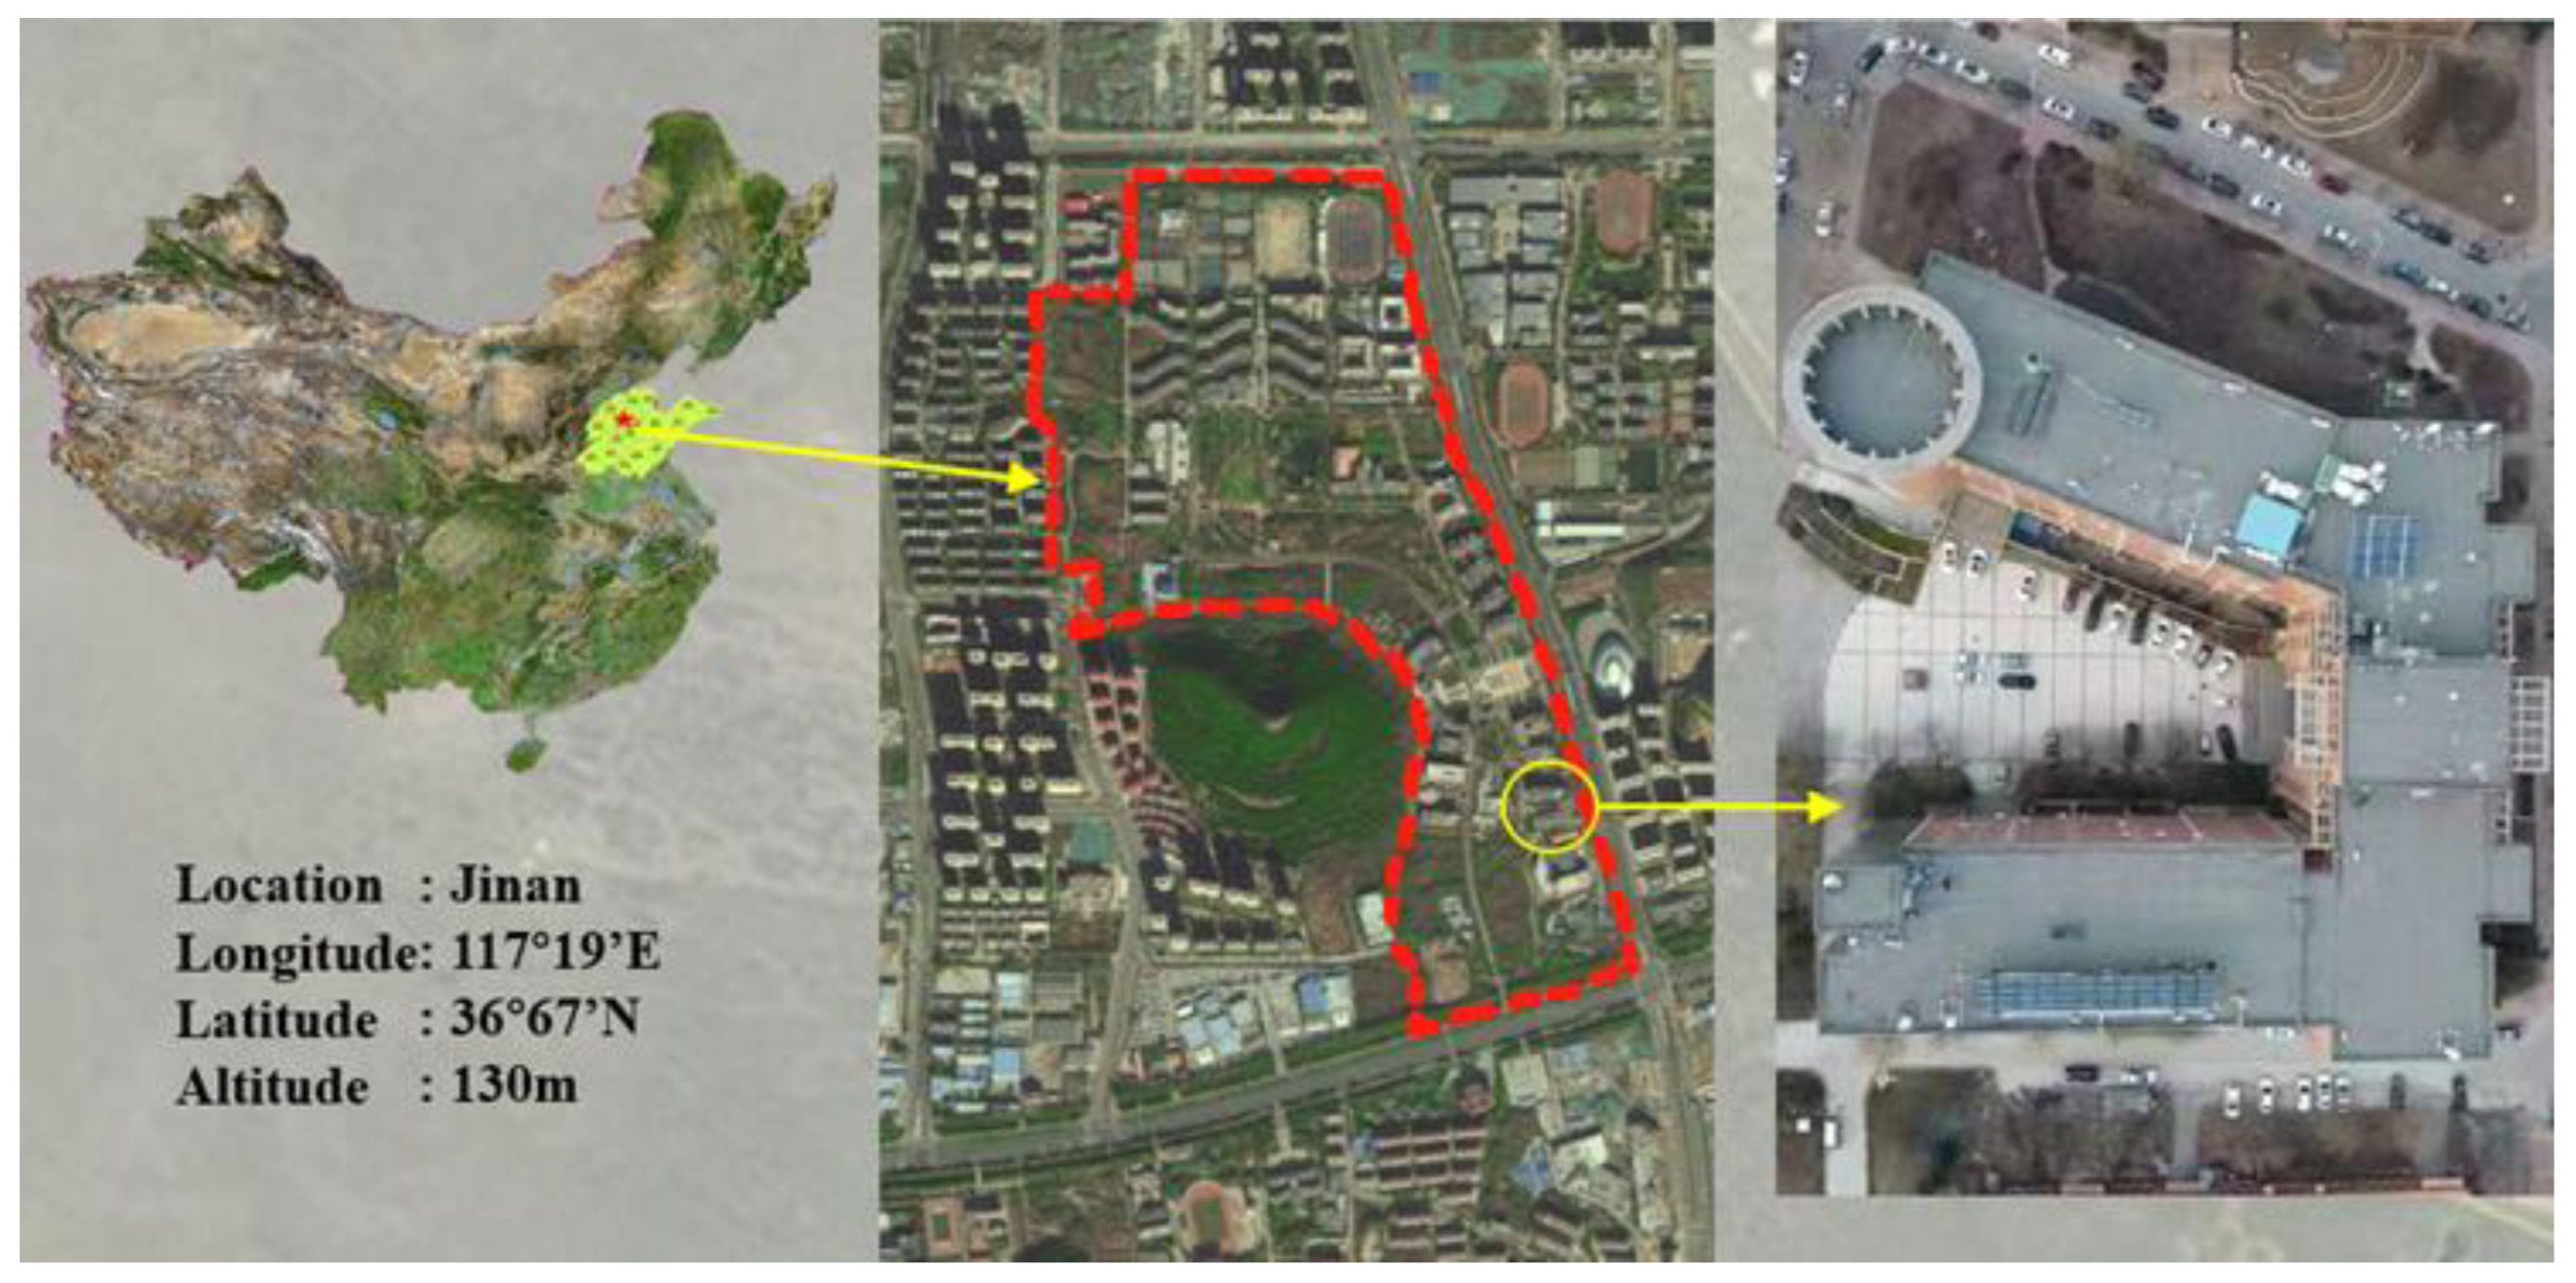
2.1. Study Area and Climatic Conditions
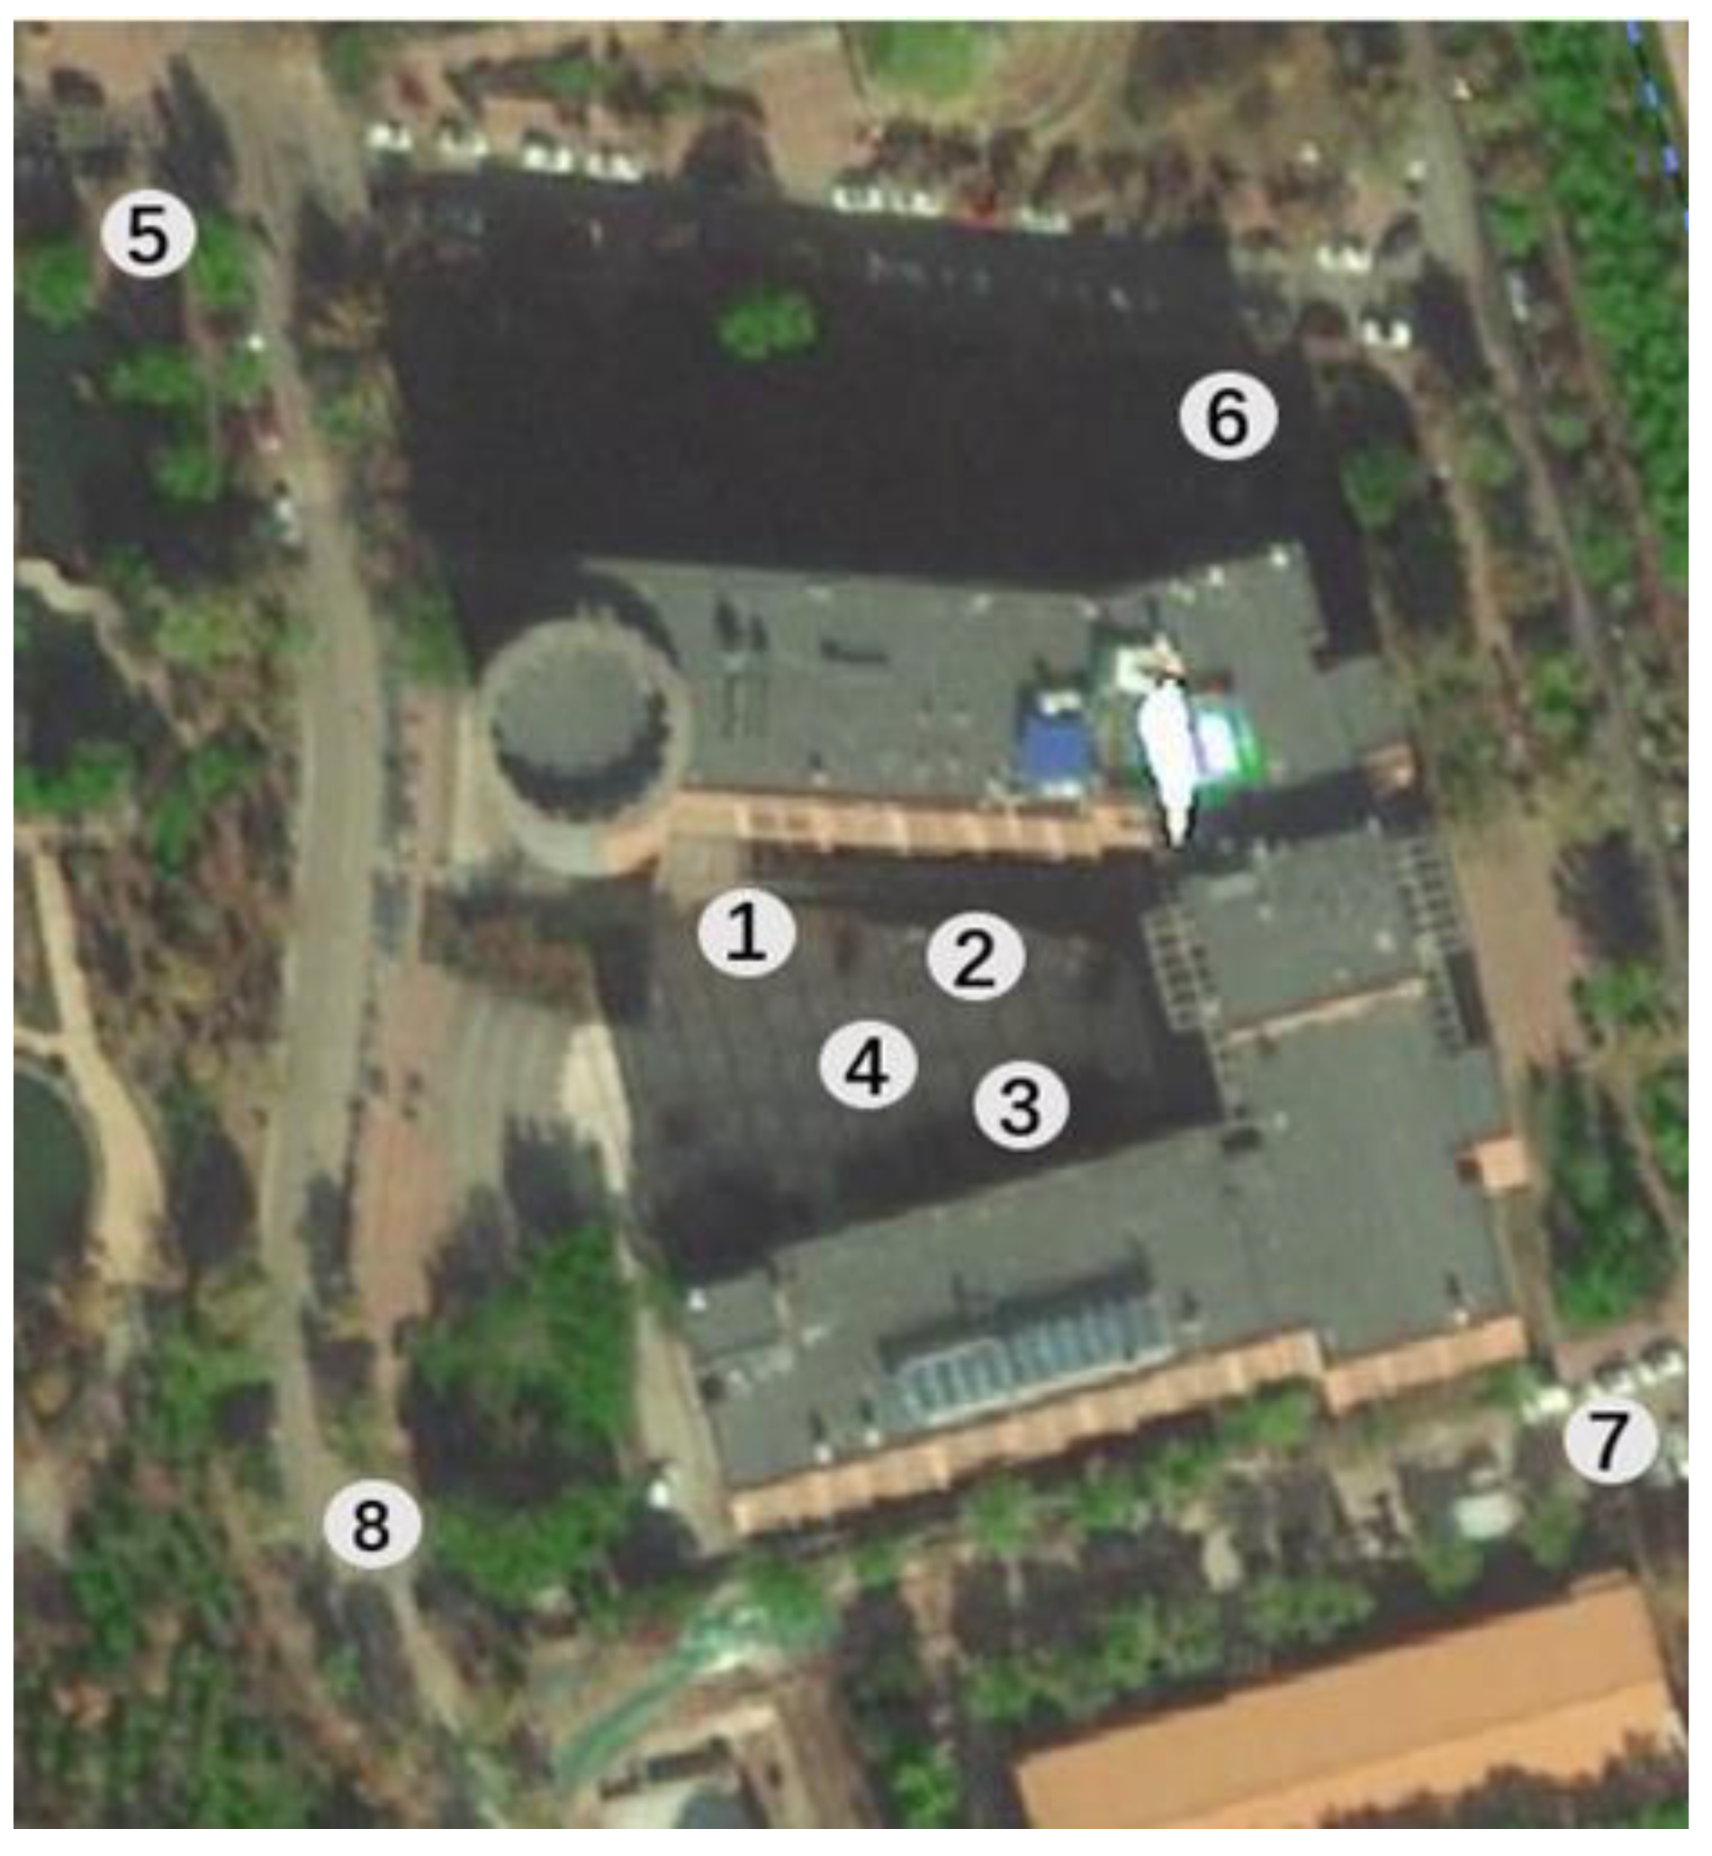
2.2. Field Measurements
2.3. Thermal Comfort Indices
2.4. Simulation Methodology
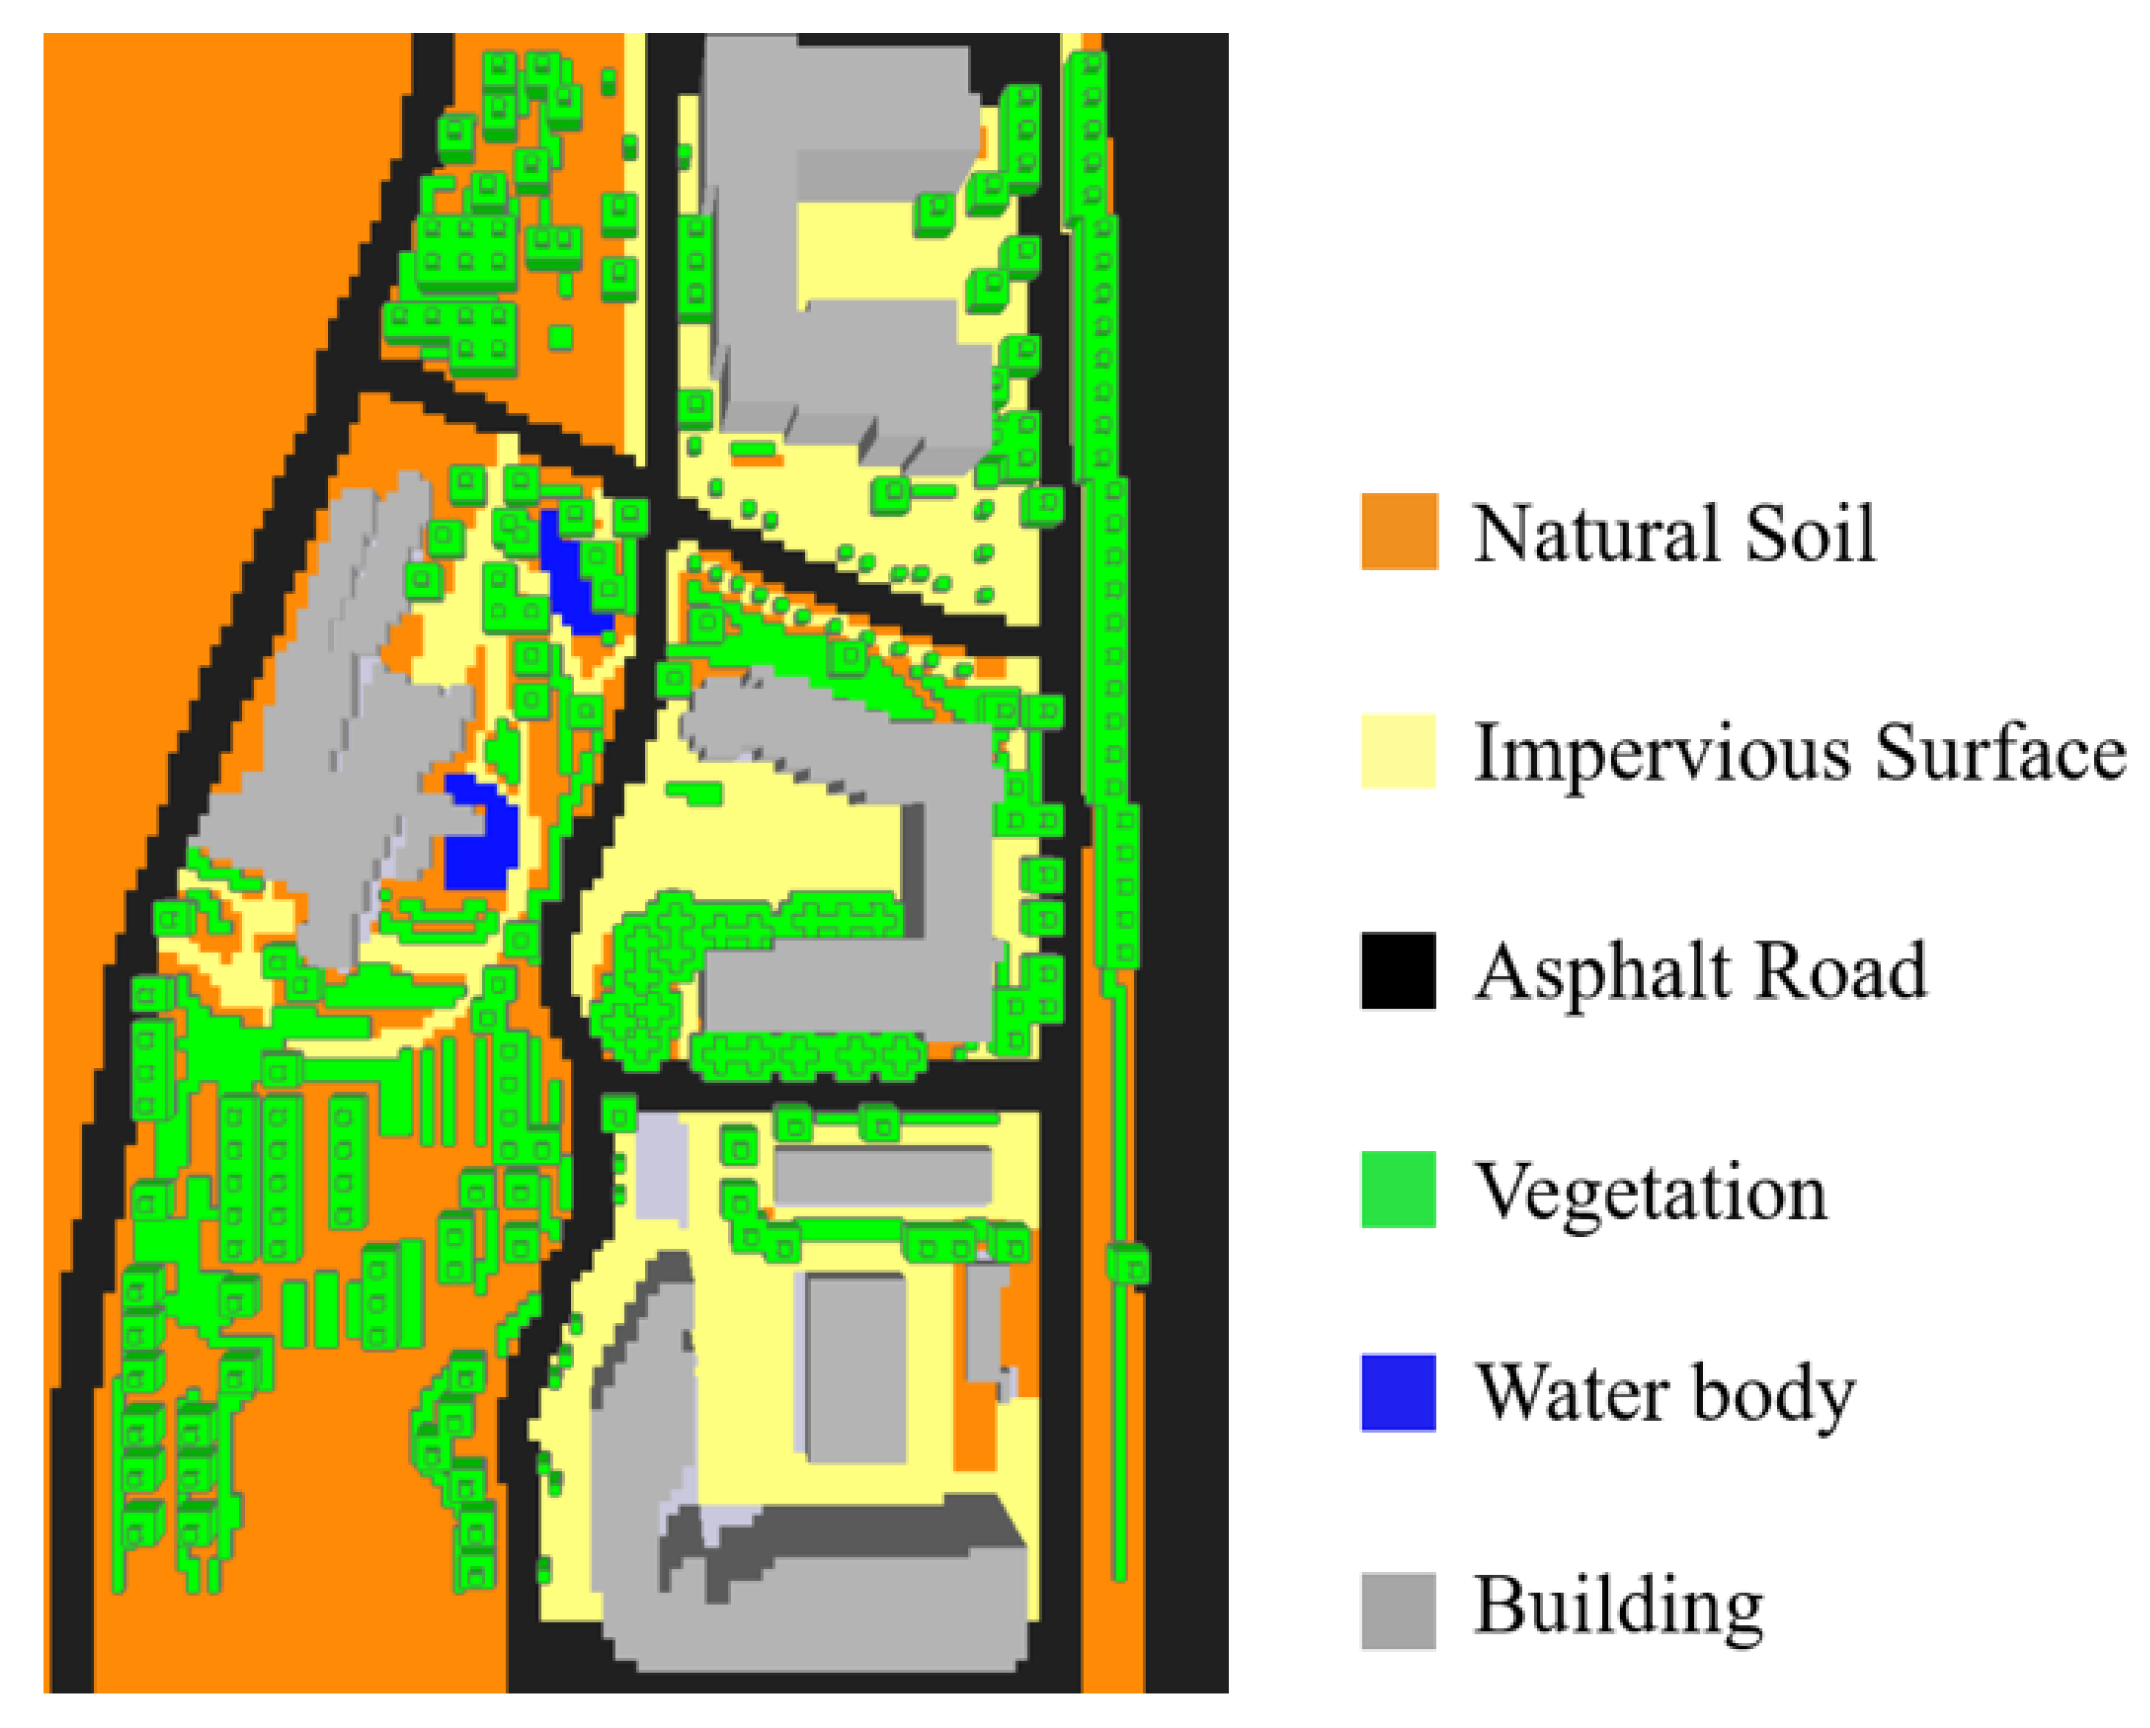
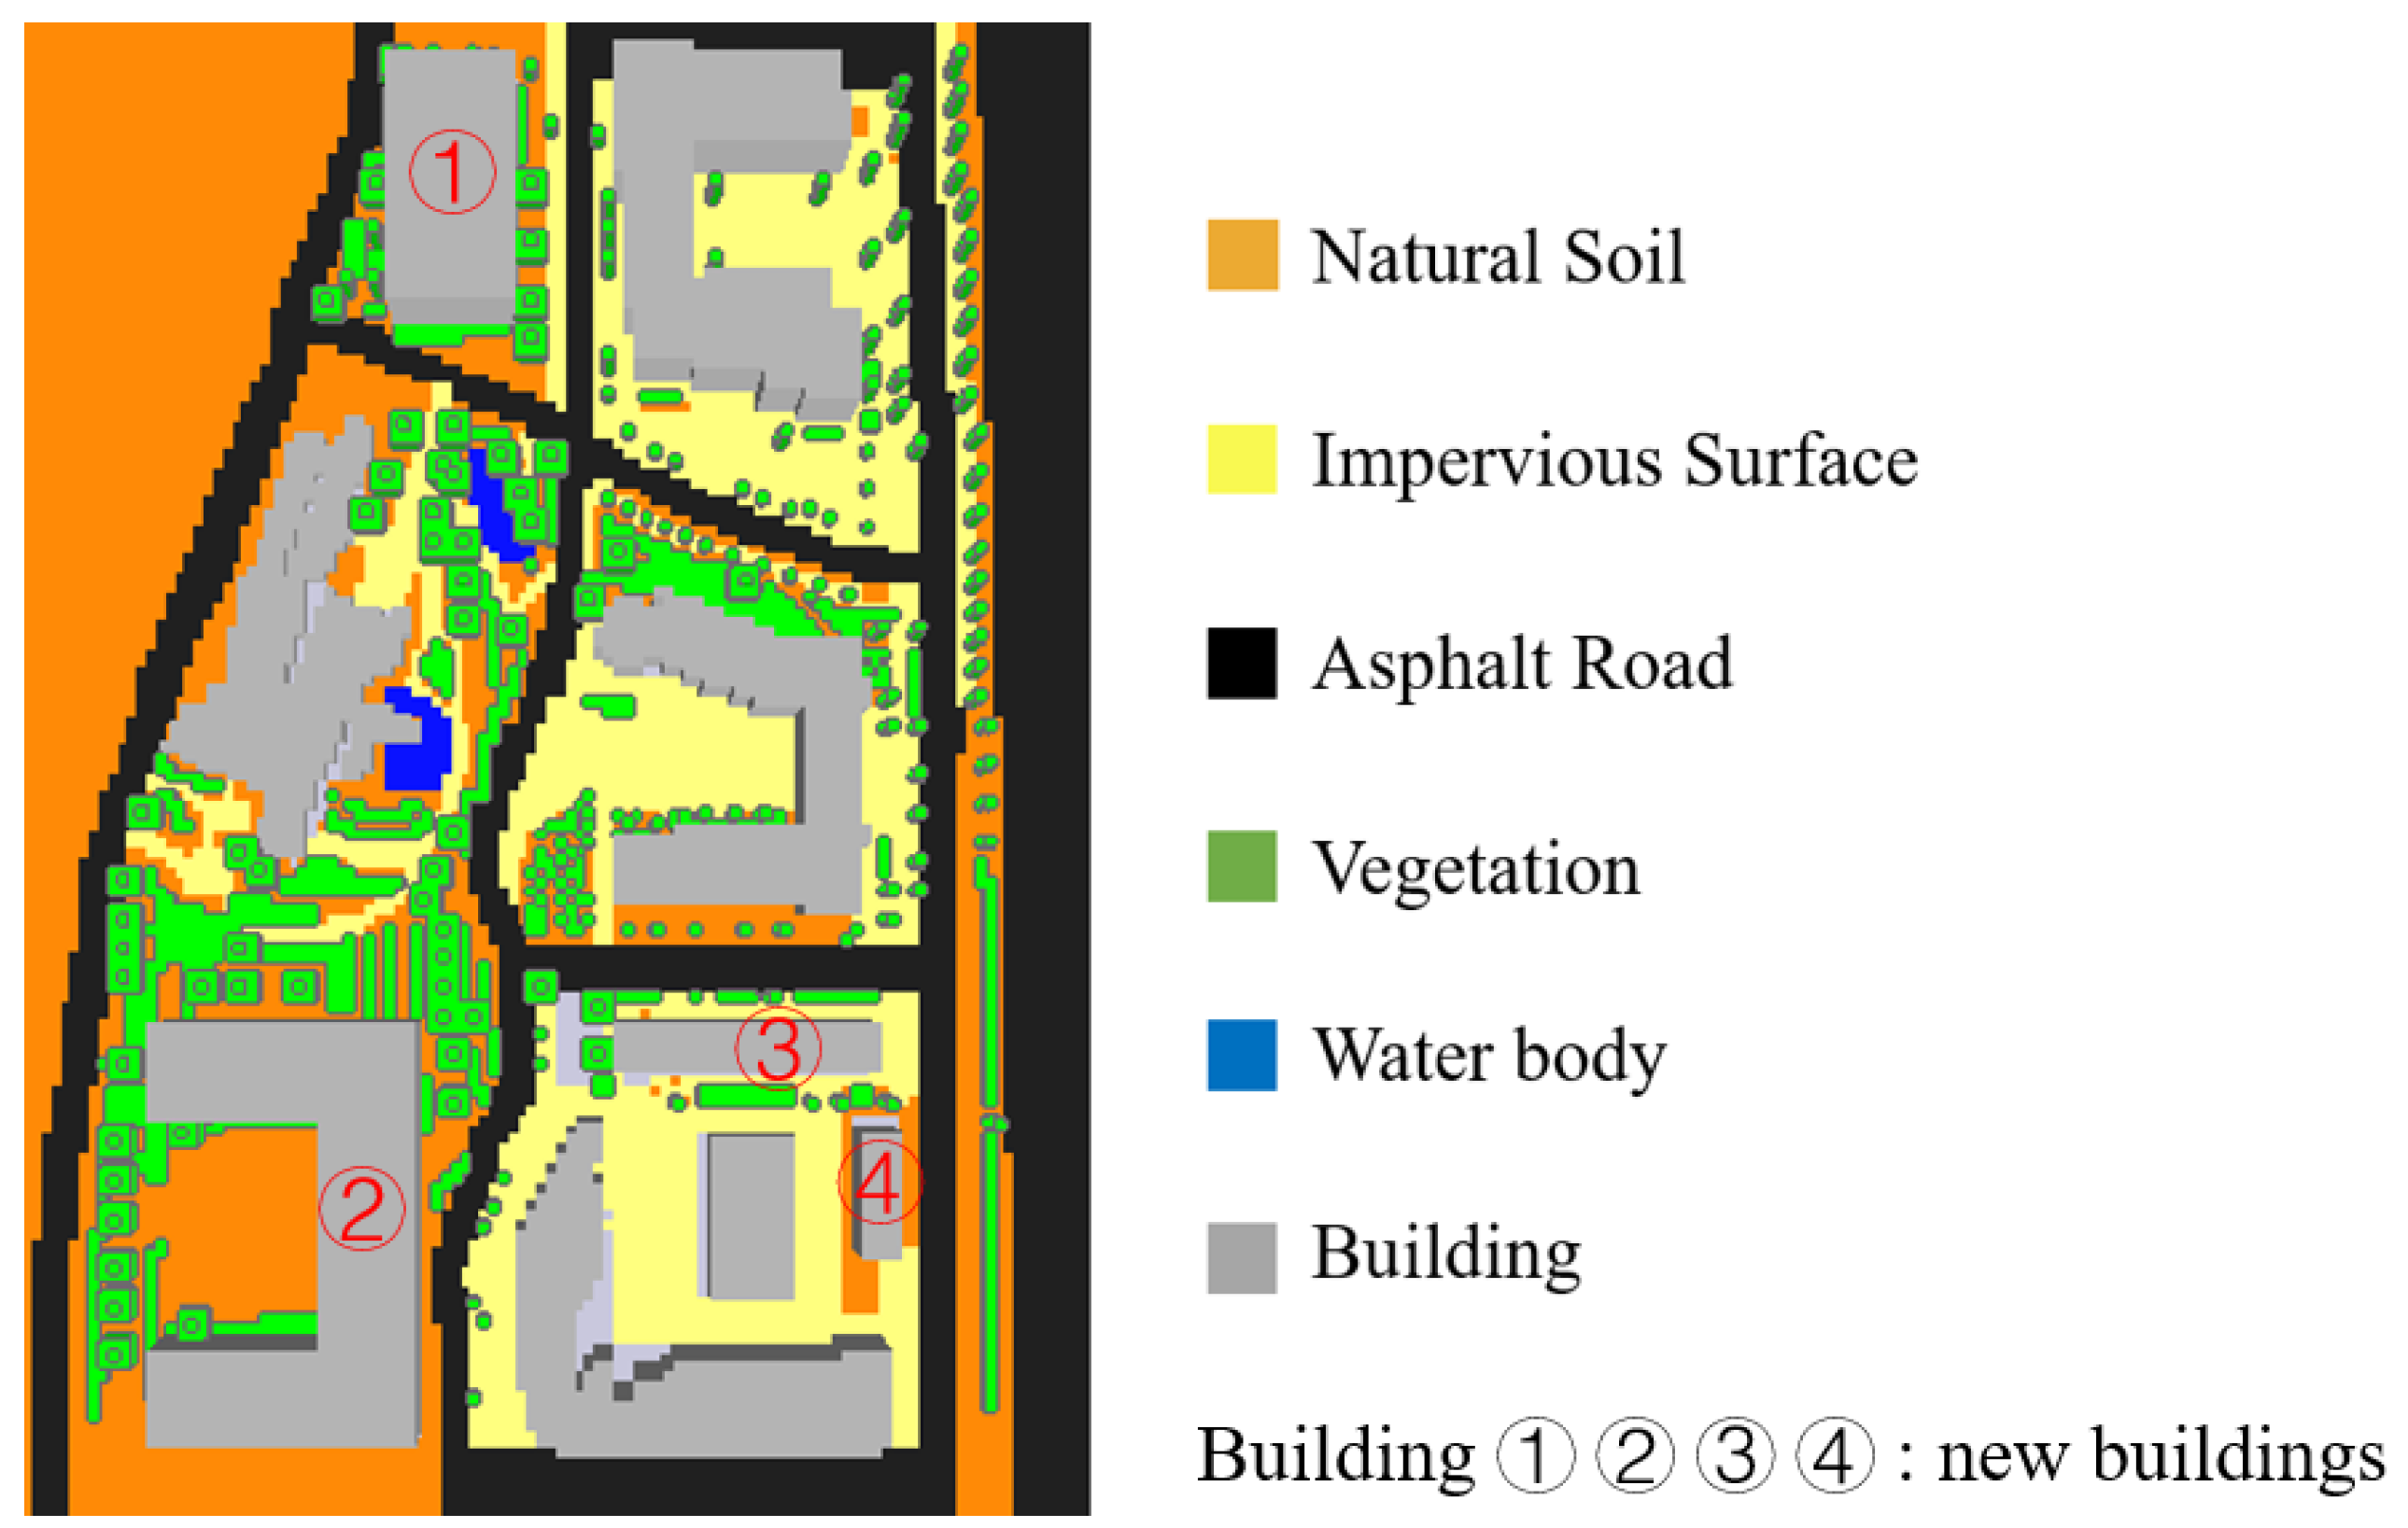
2.4.1. Simulation Model
2.4.2. ENVI-Met Simulation Setting
3. Results
3.1. Measured Results and Simulation Verification
3.1.1. Measurement of Environmental Parameters
3.1.2. ENVI-Met Model Validation
3.2. Effect of Greening Rate
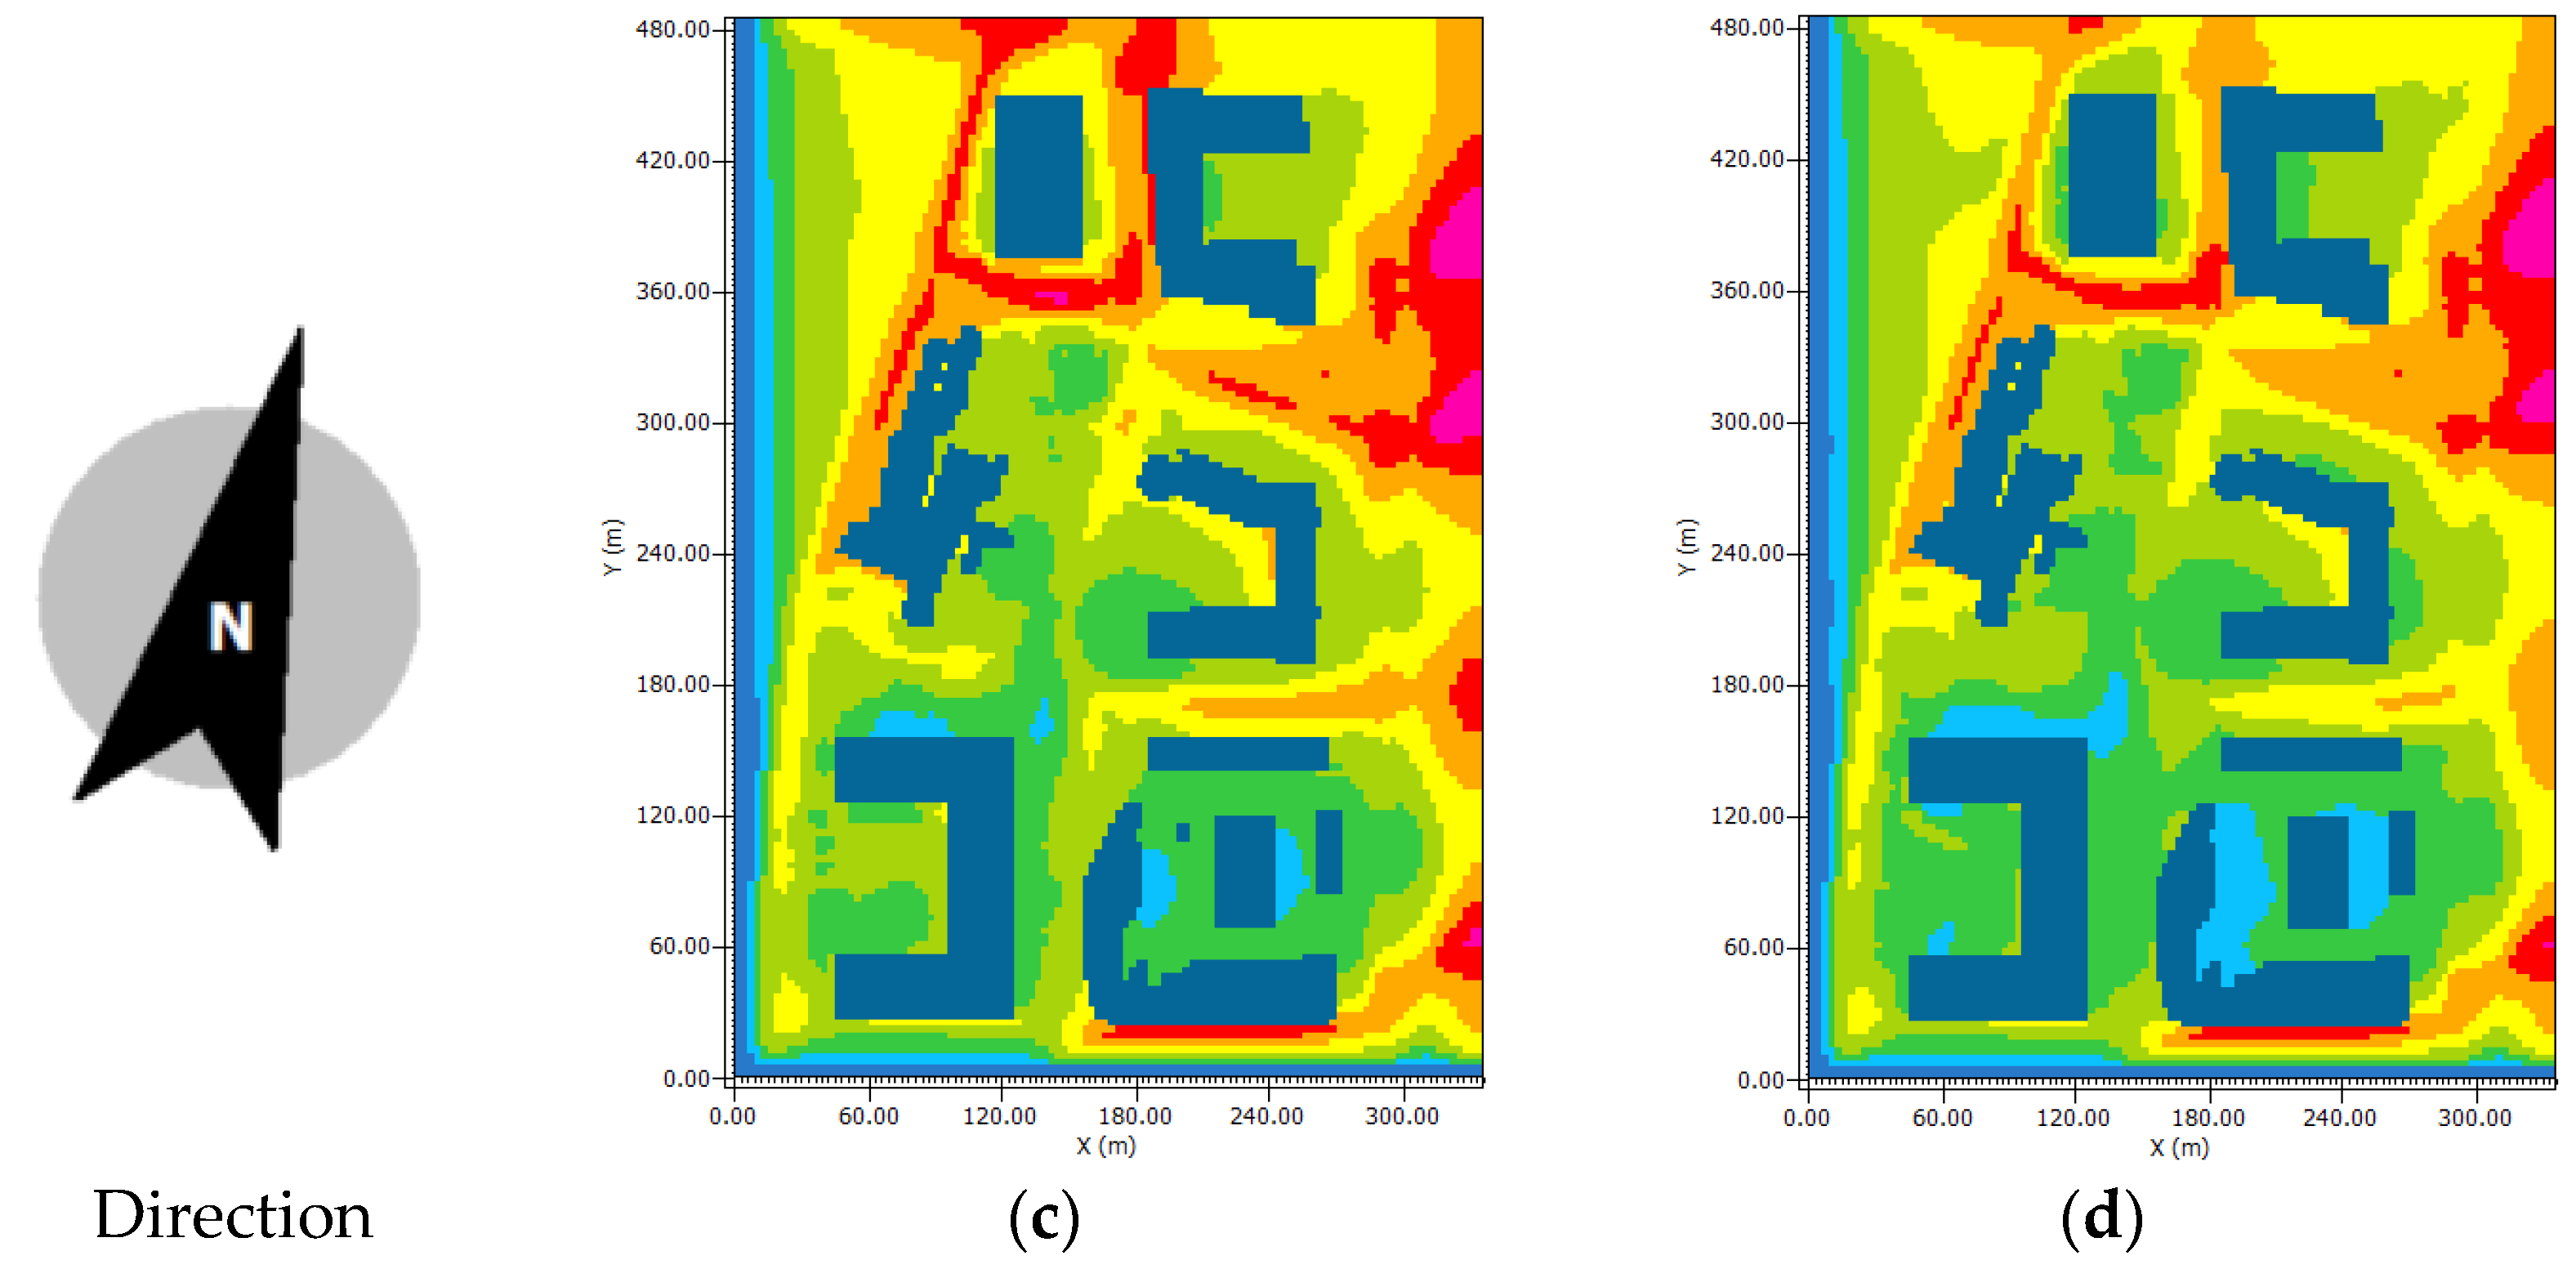
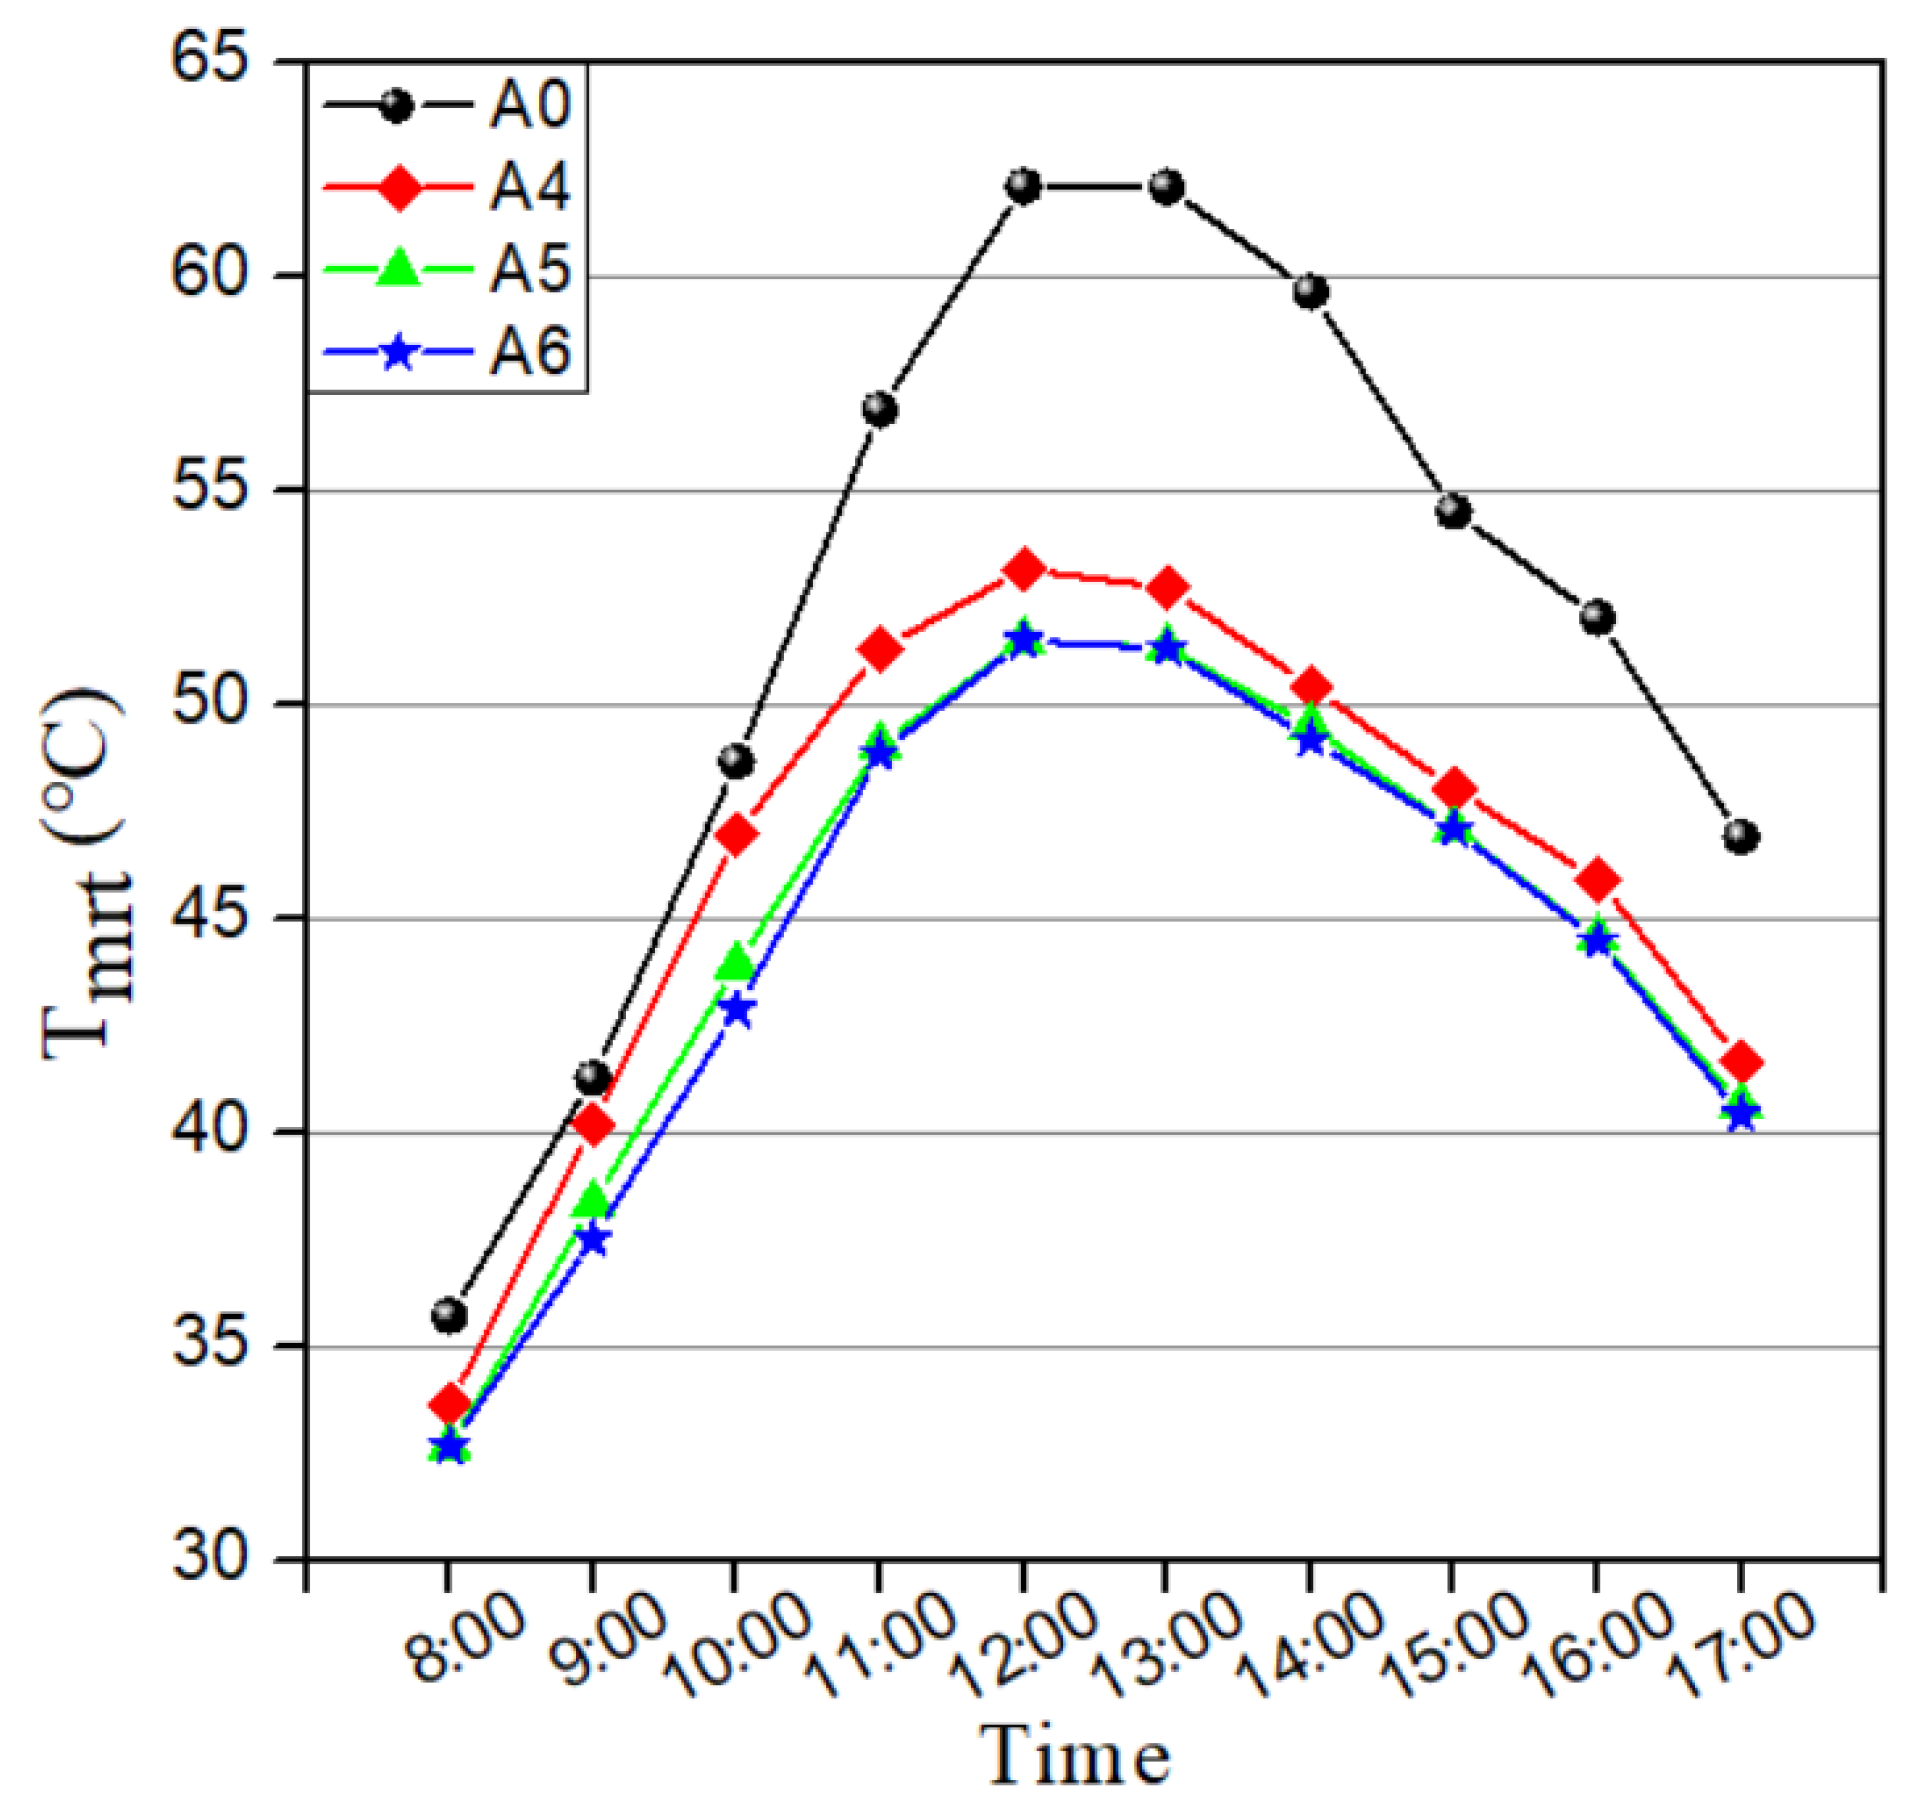
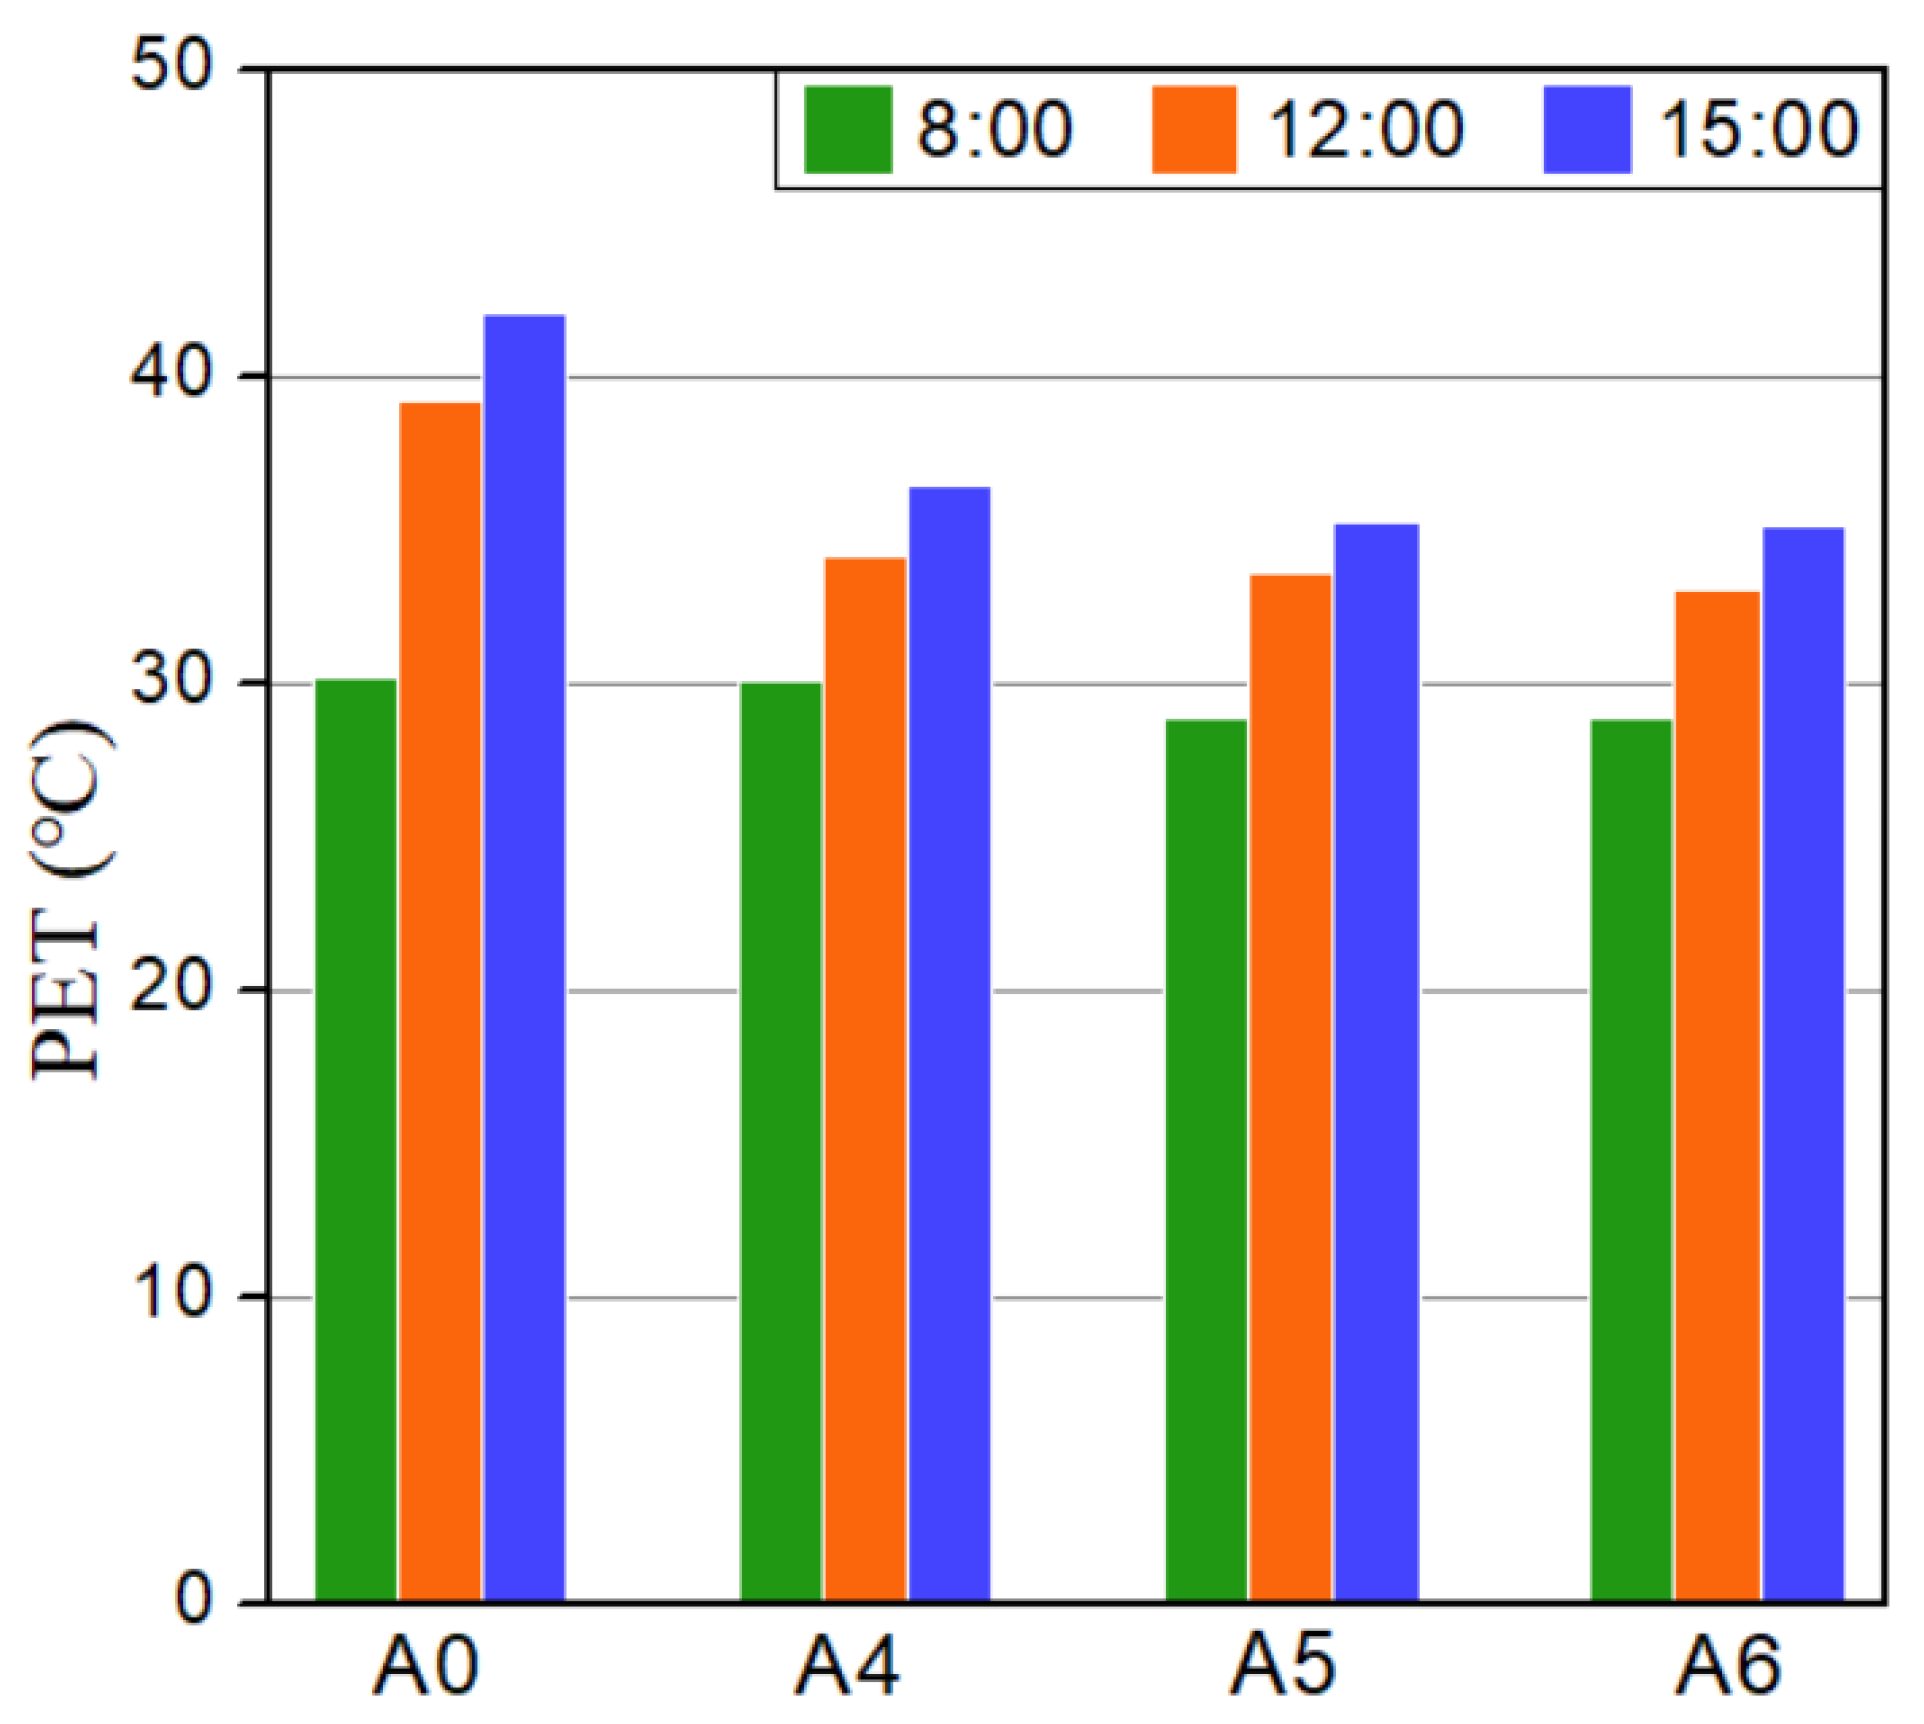
3.3. Effect of Building H/W
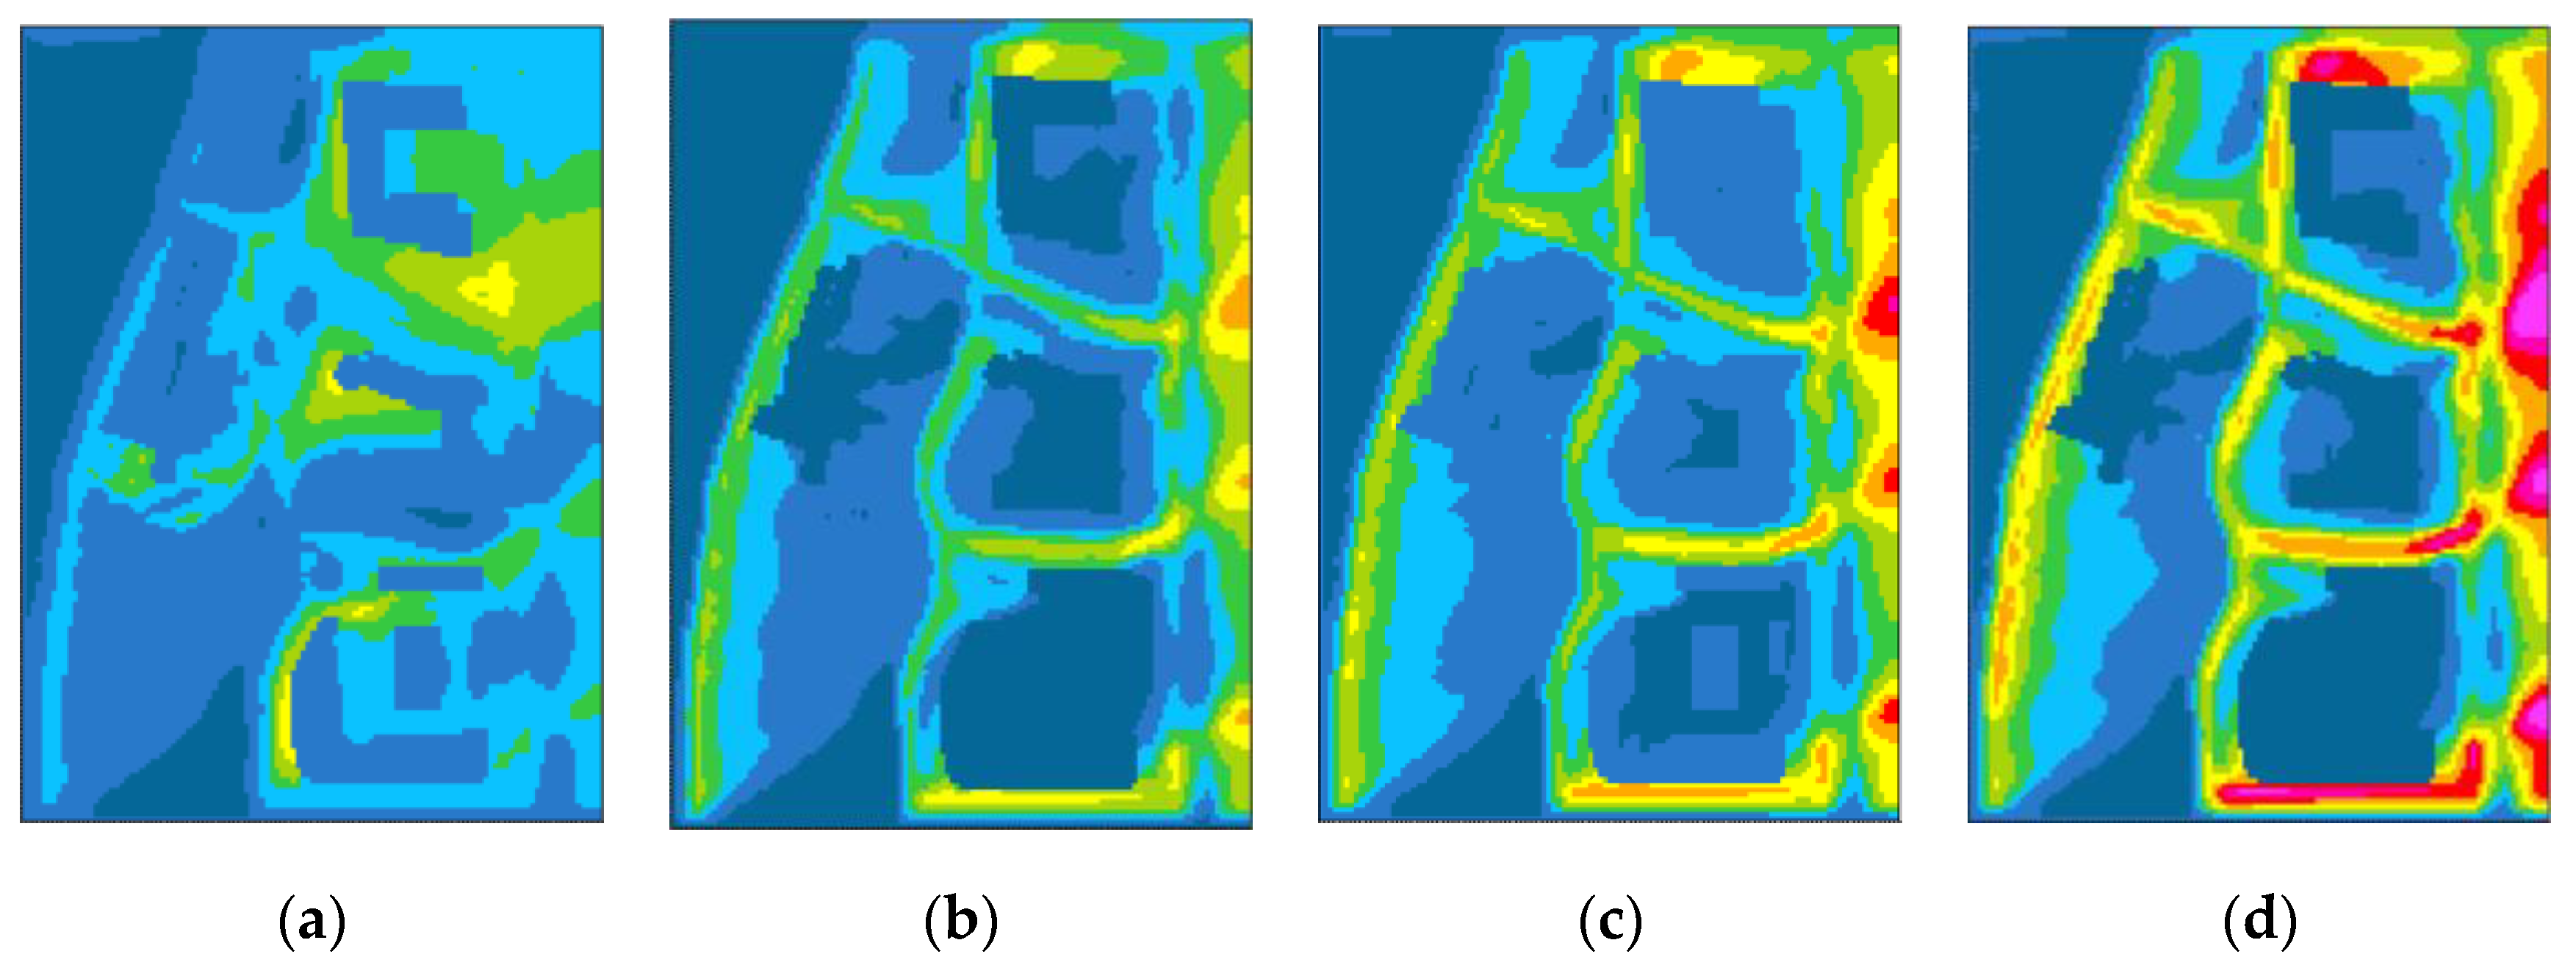
3.4. Effect of Surface Albedo
4. Discussion
5. Conclusions
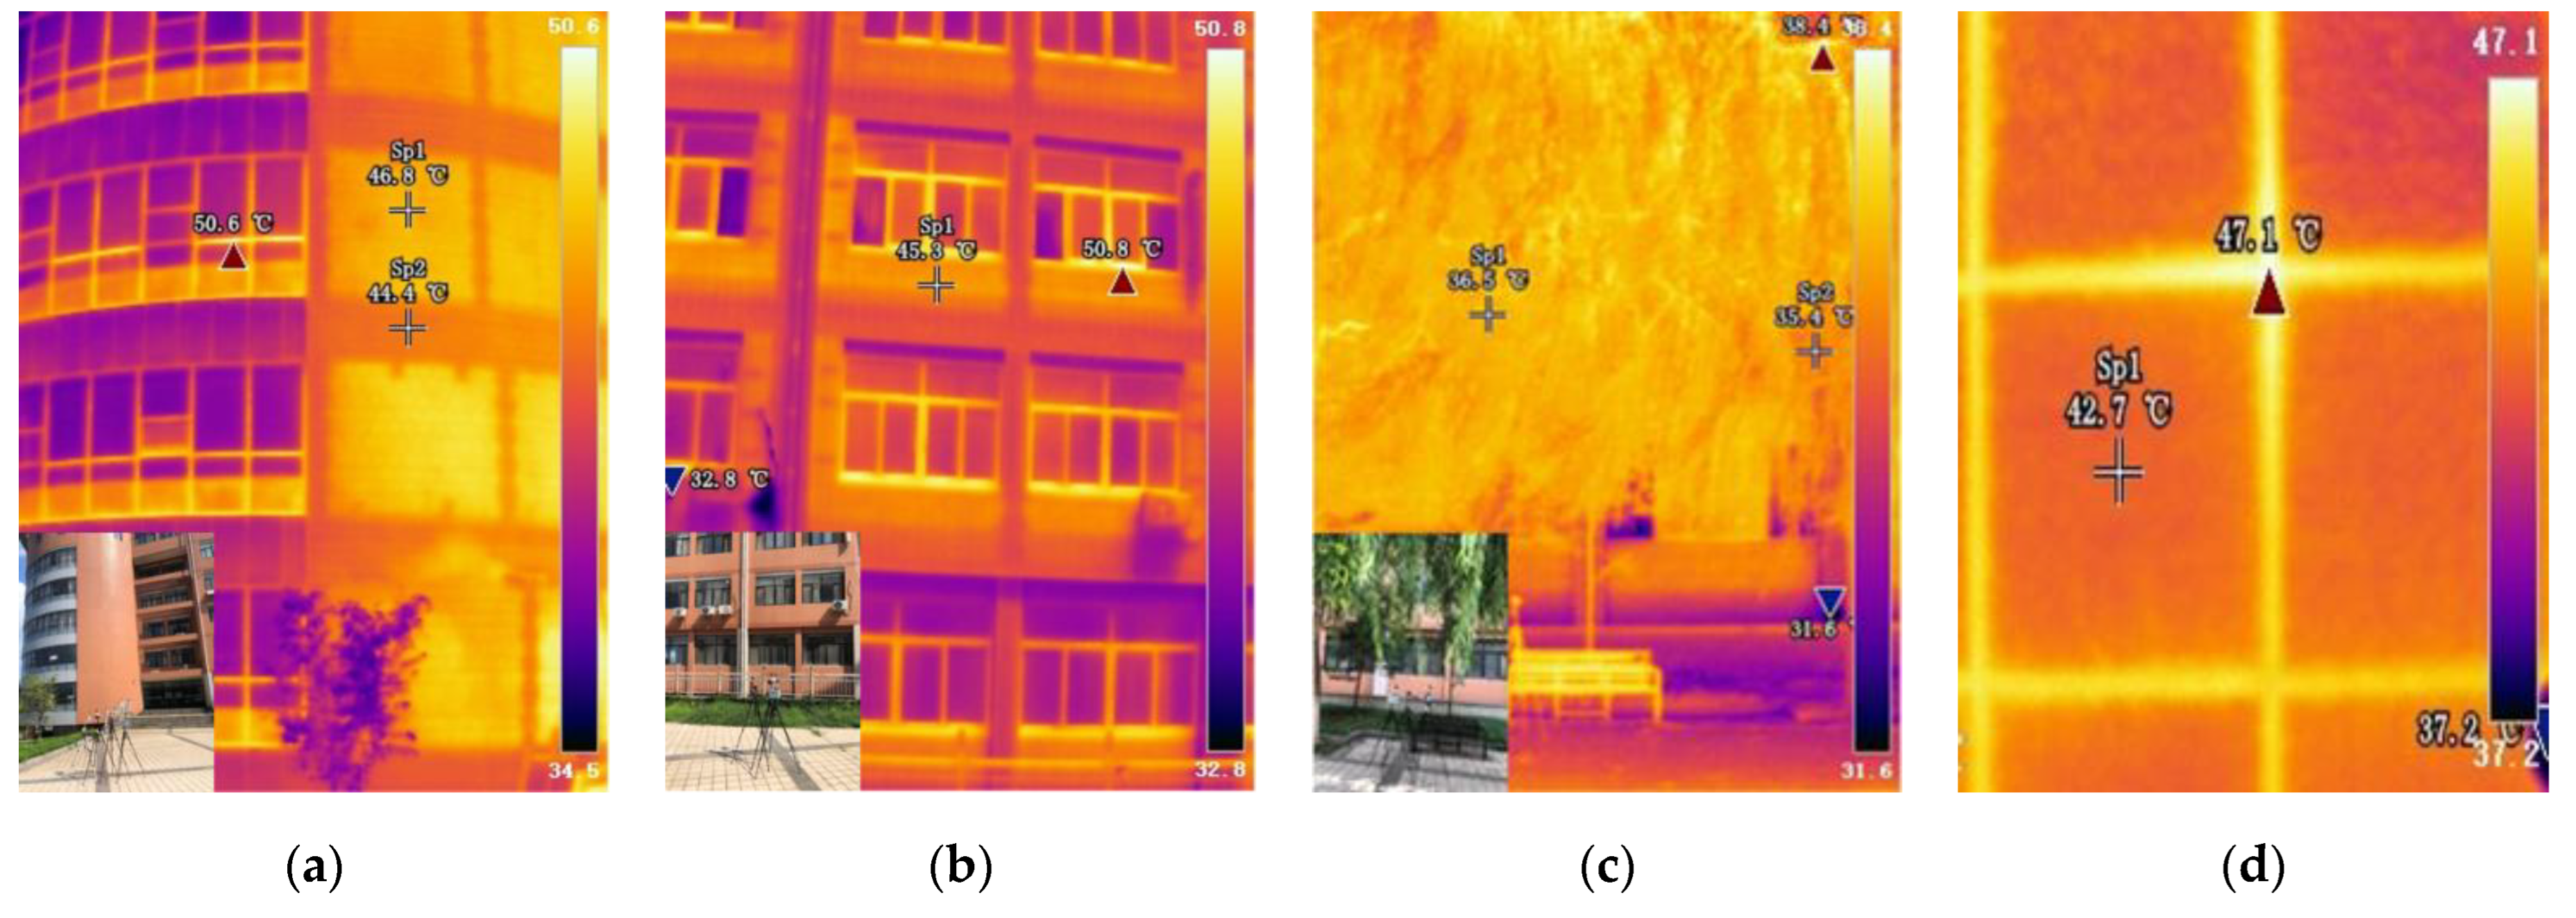
- (1)
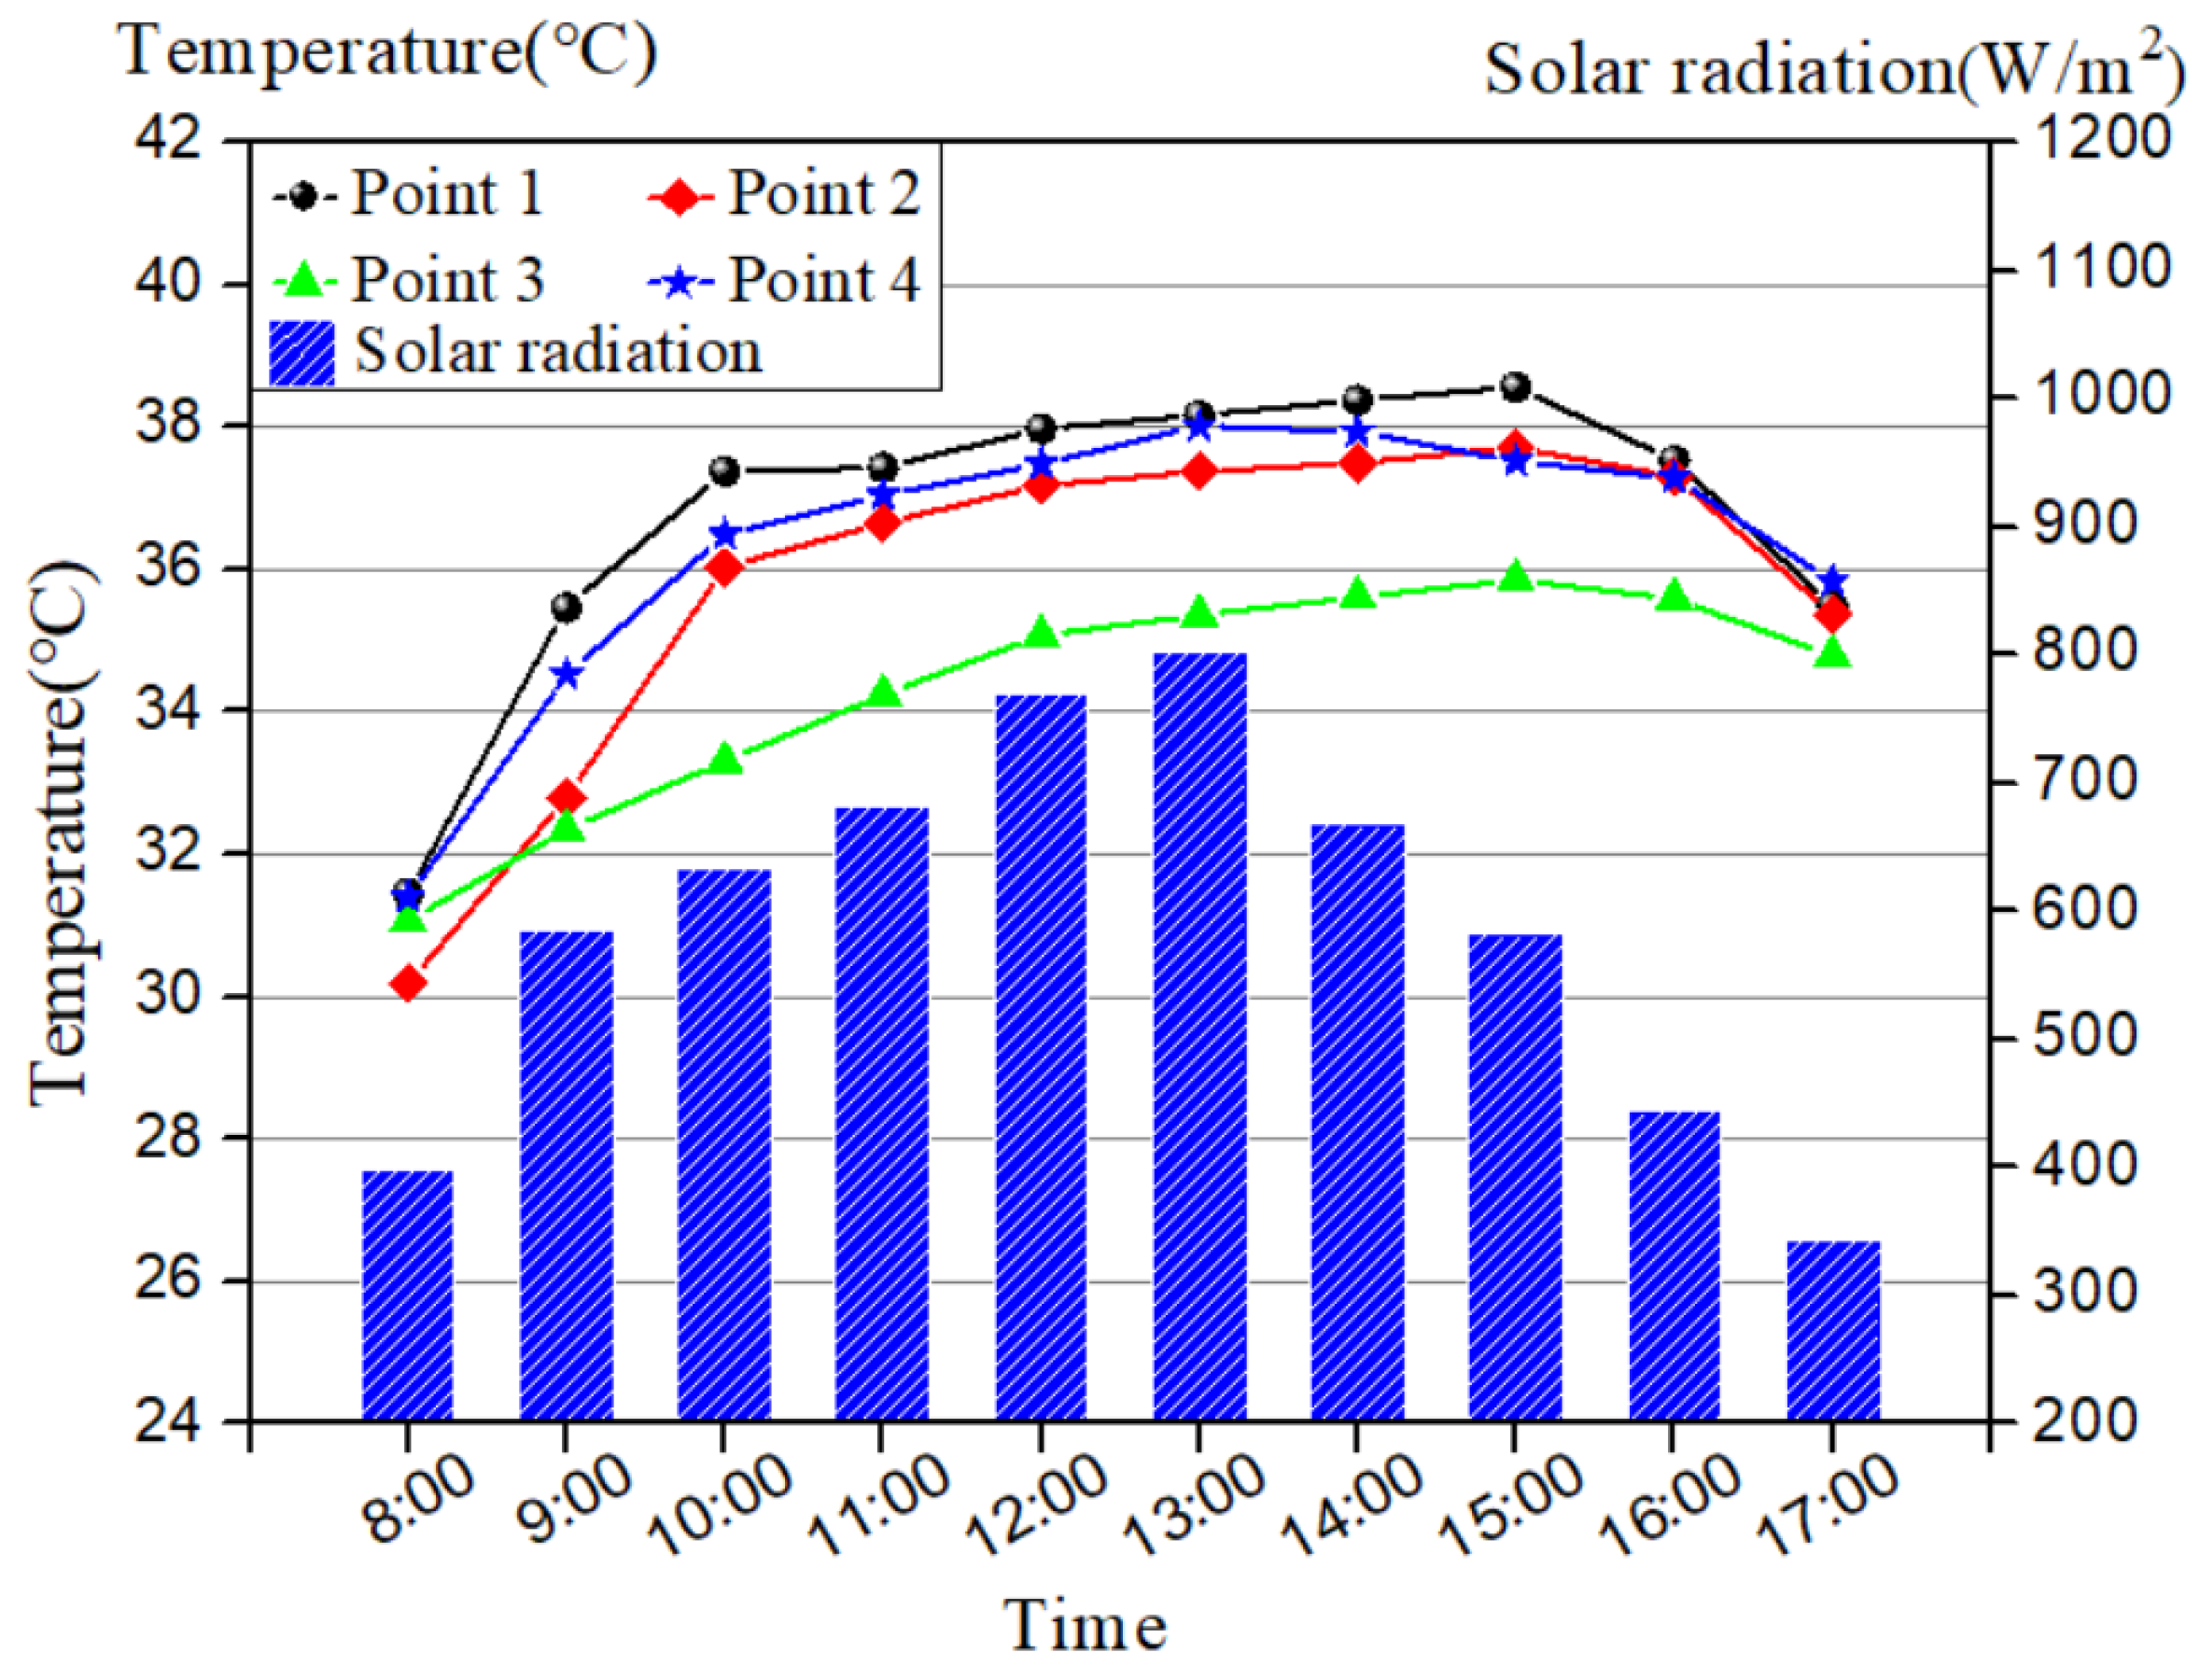
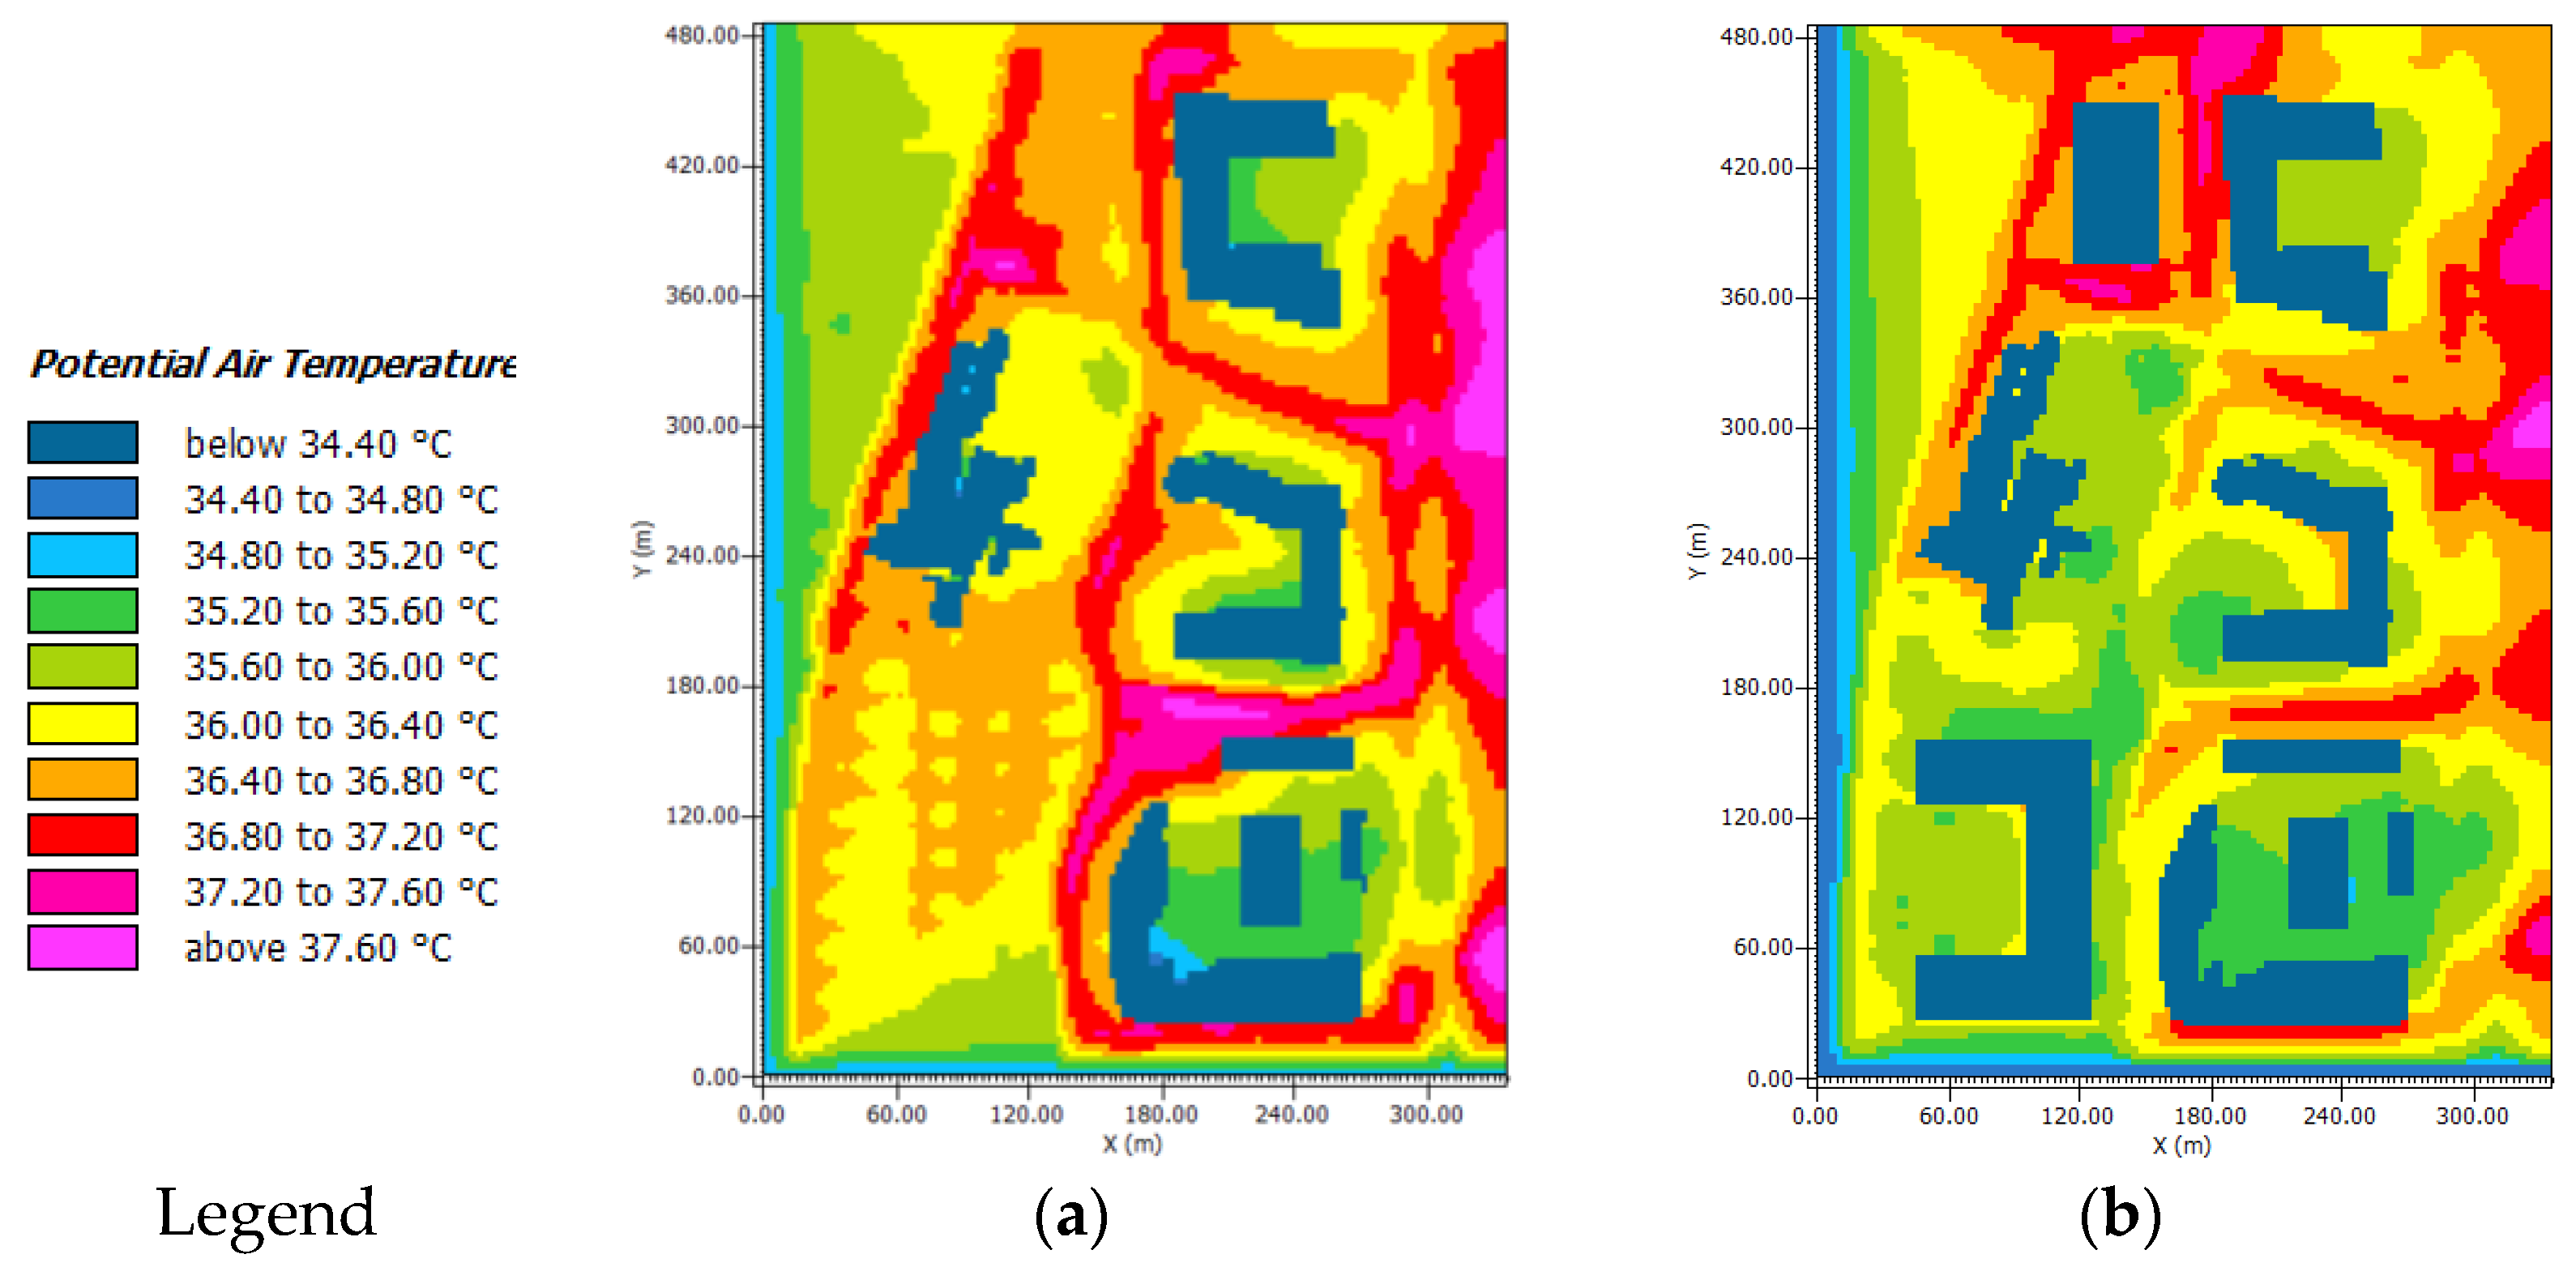
- The field test showed that the temperature of the campus reached 38.4 °C at noon in summer, and the temperature in areas without shade was above 36 °C, adversely affecting the students’ outdoor activities. Thermal imagery showed very high surface temperatures of pavement and walls, ranging from 44 °C to 51 °C. In contrast, the surface temperatures in areas shaded by vegetation and buildings were much lower, ranging from 31 °C to 35 °C.
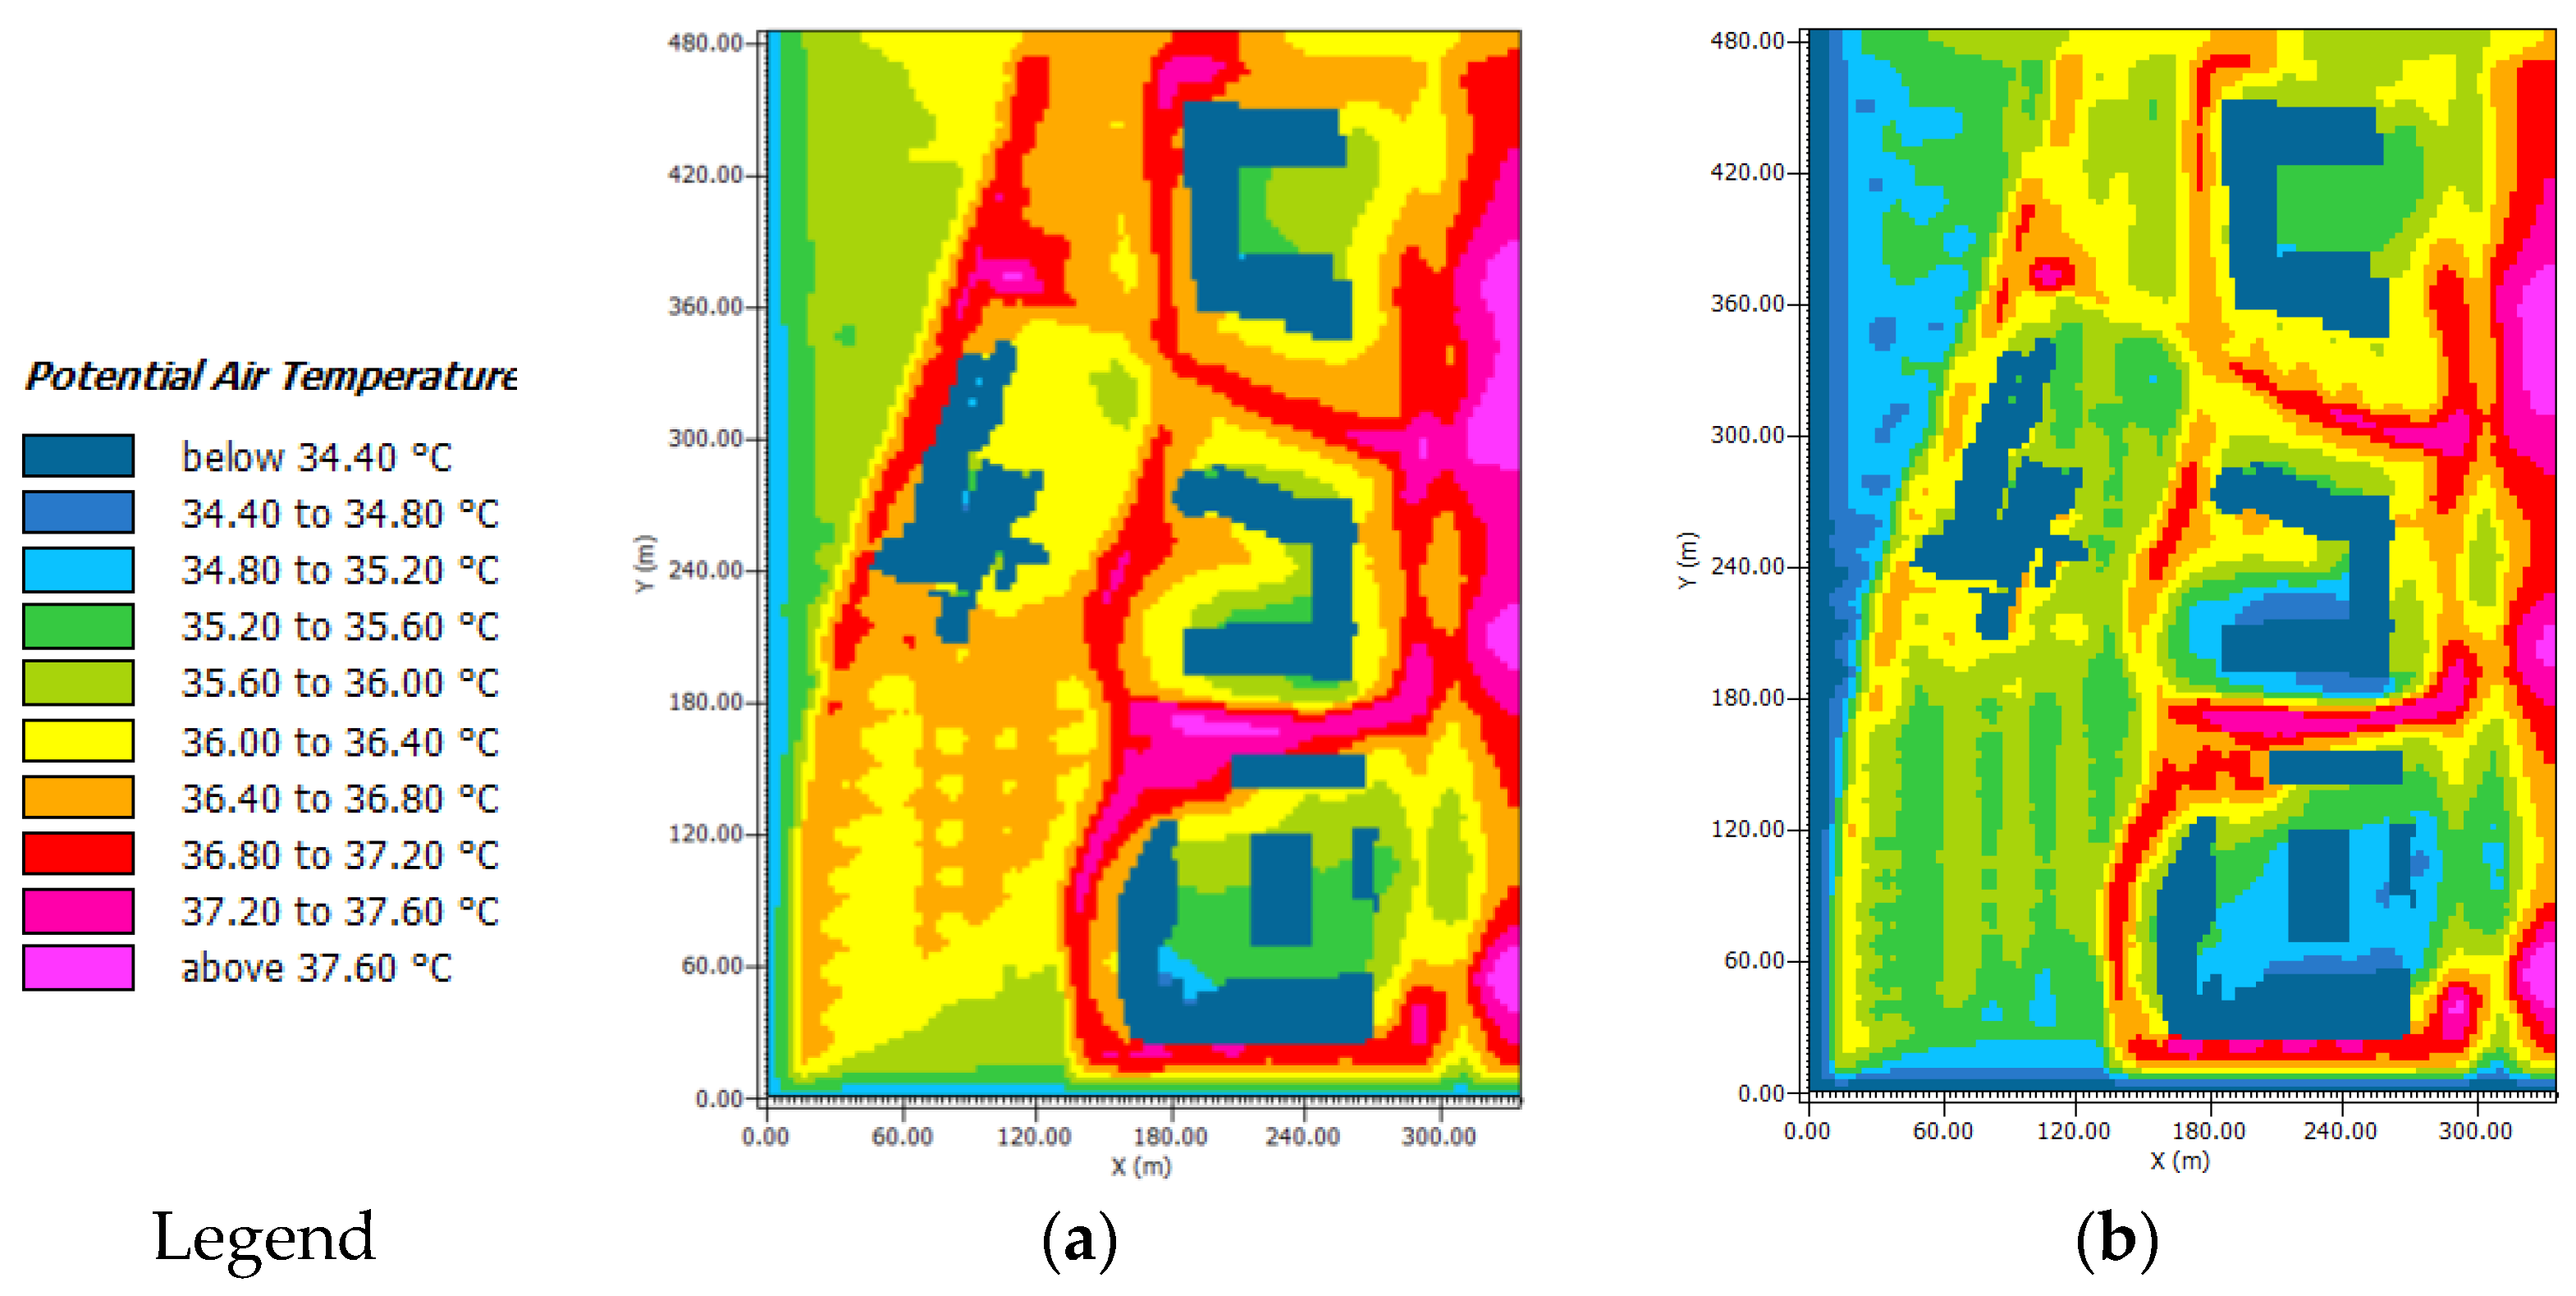
- (2)
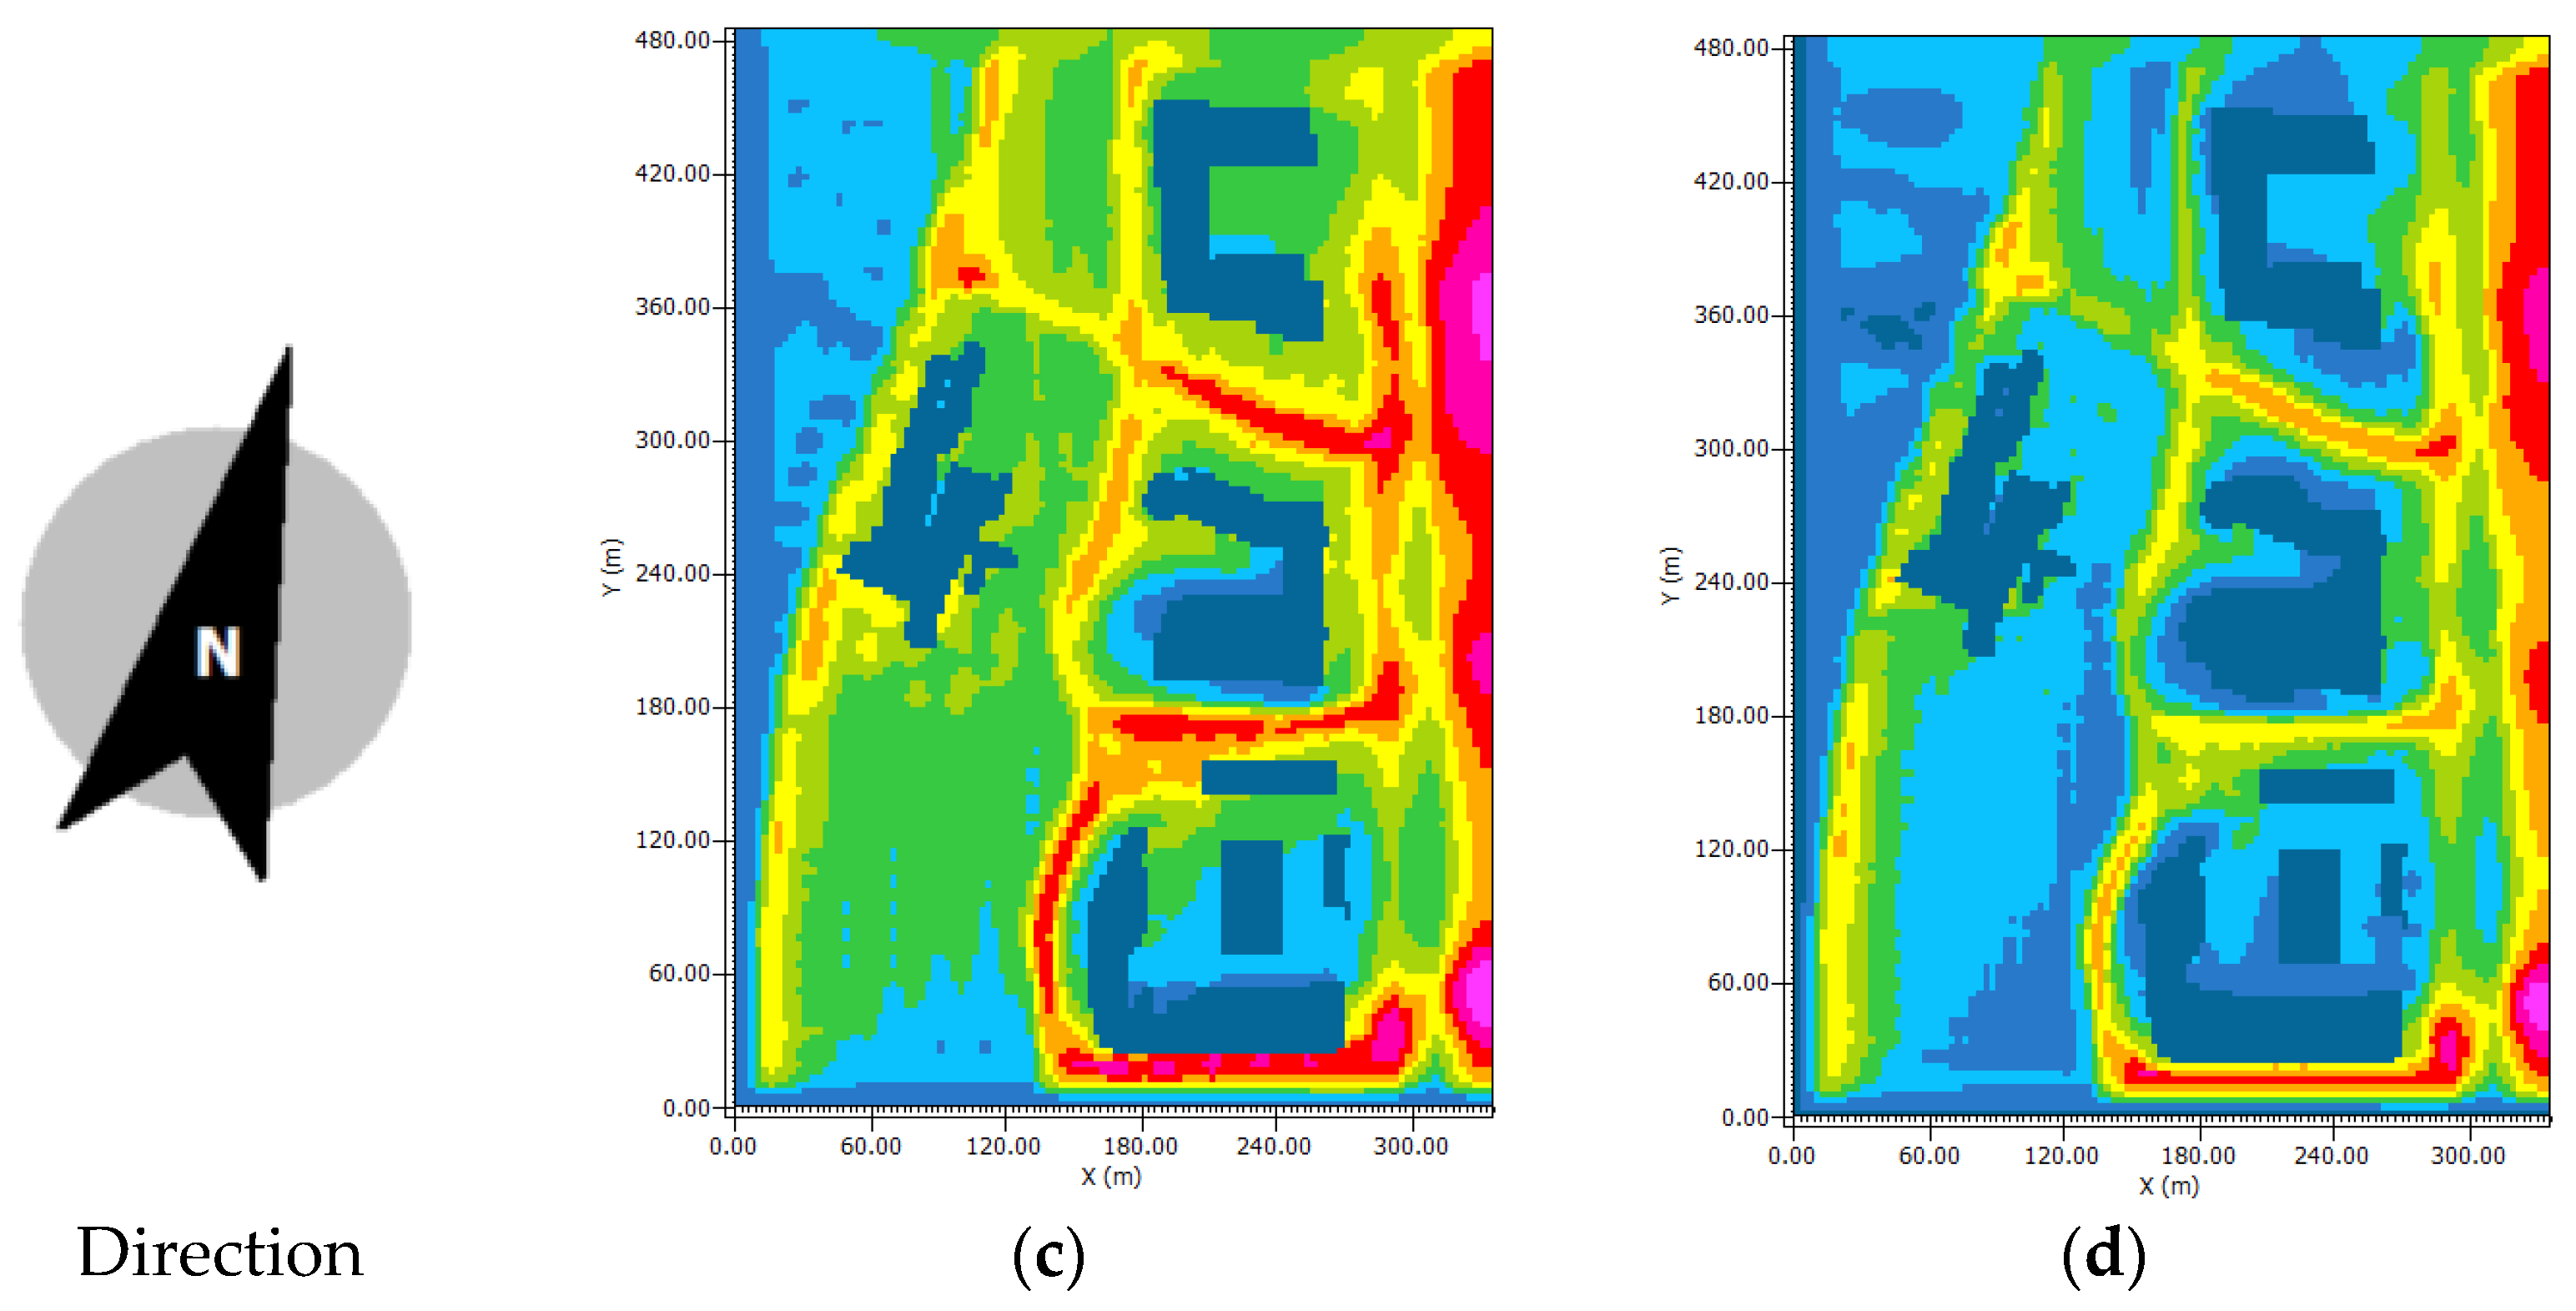
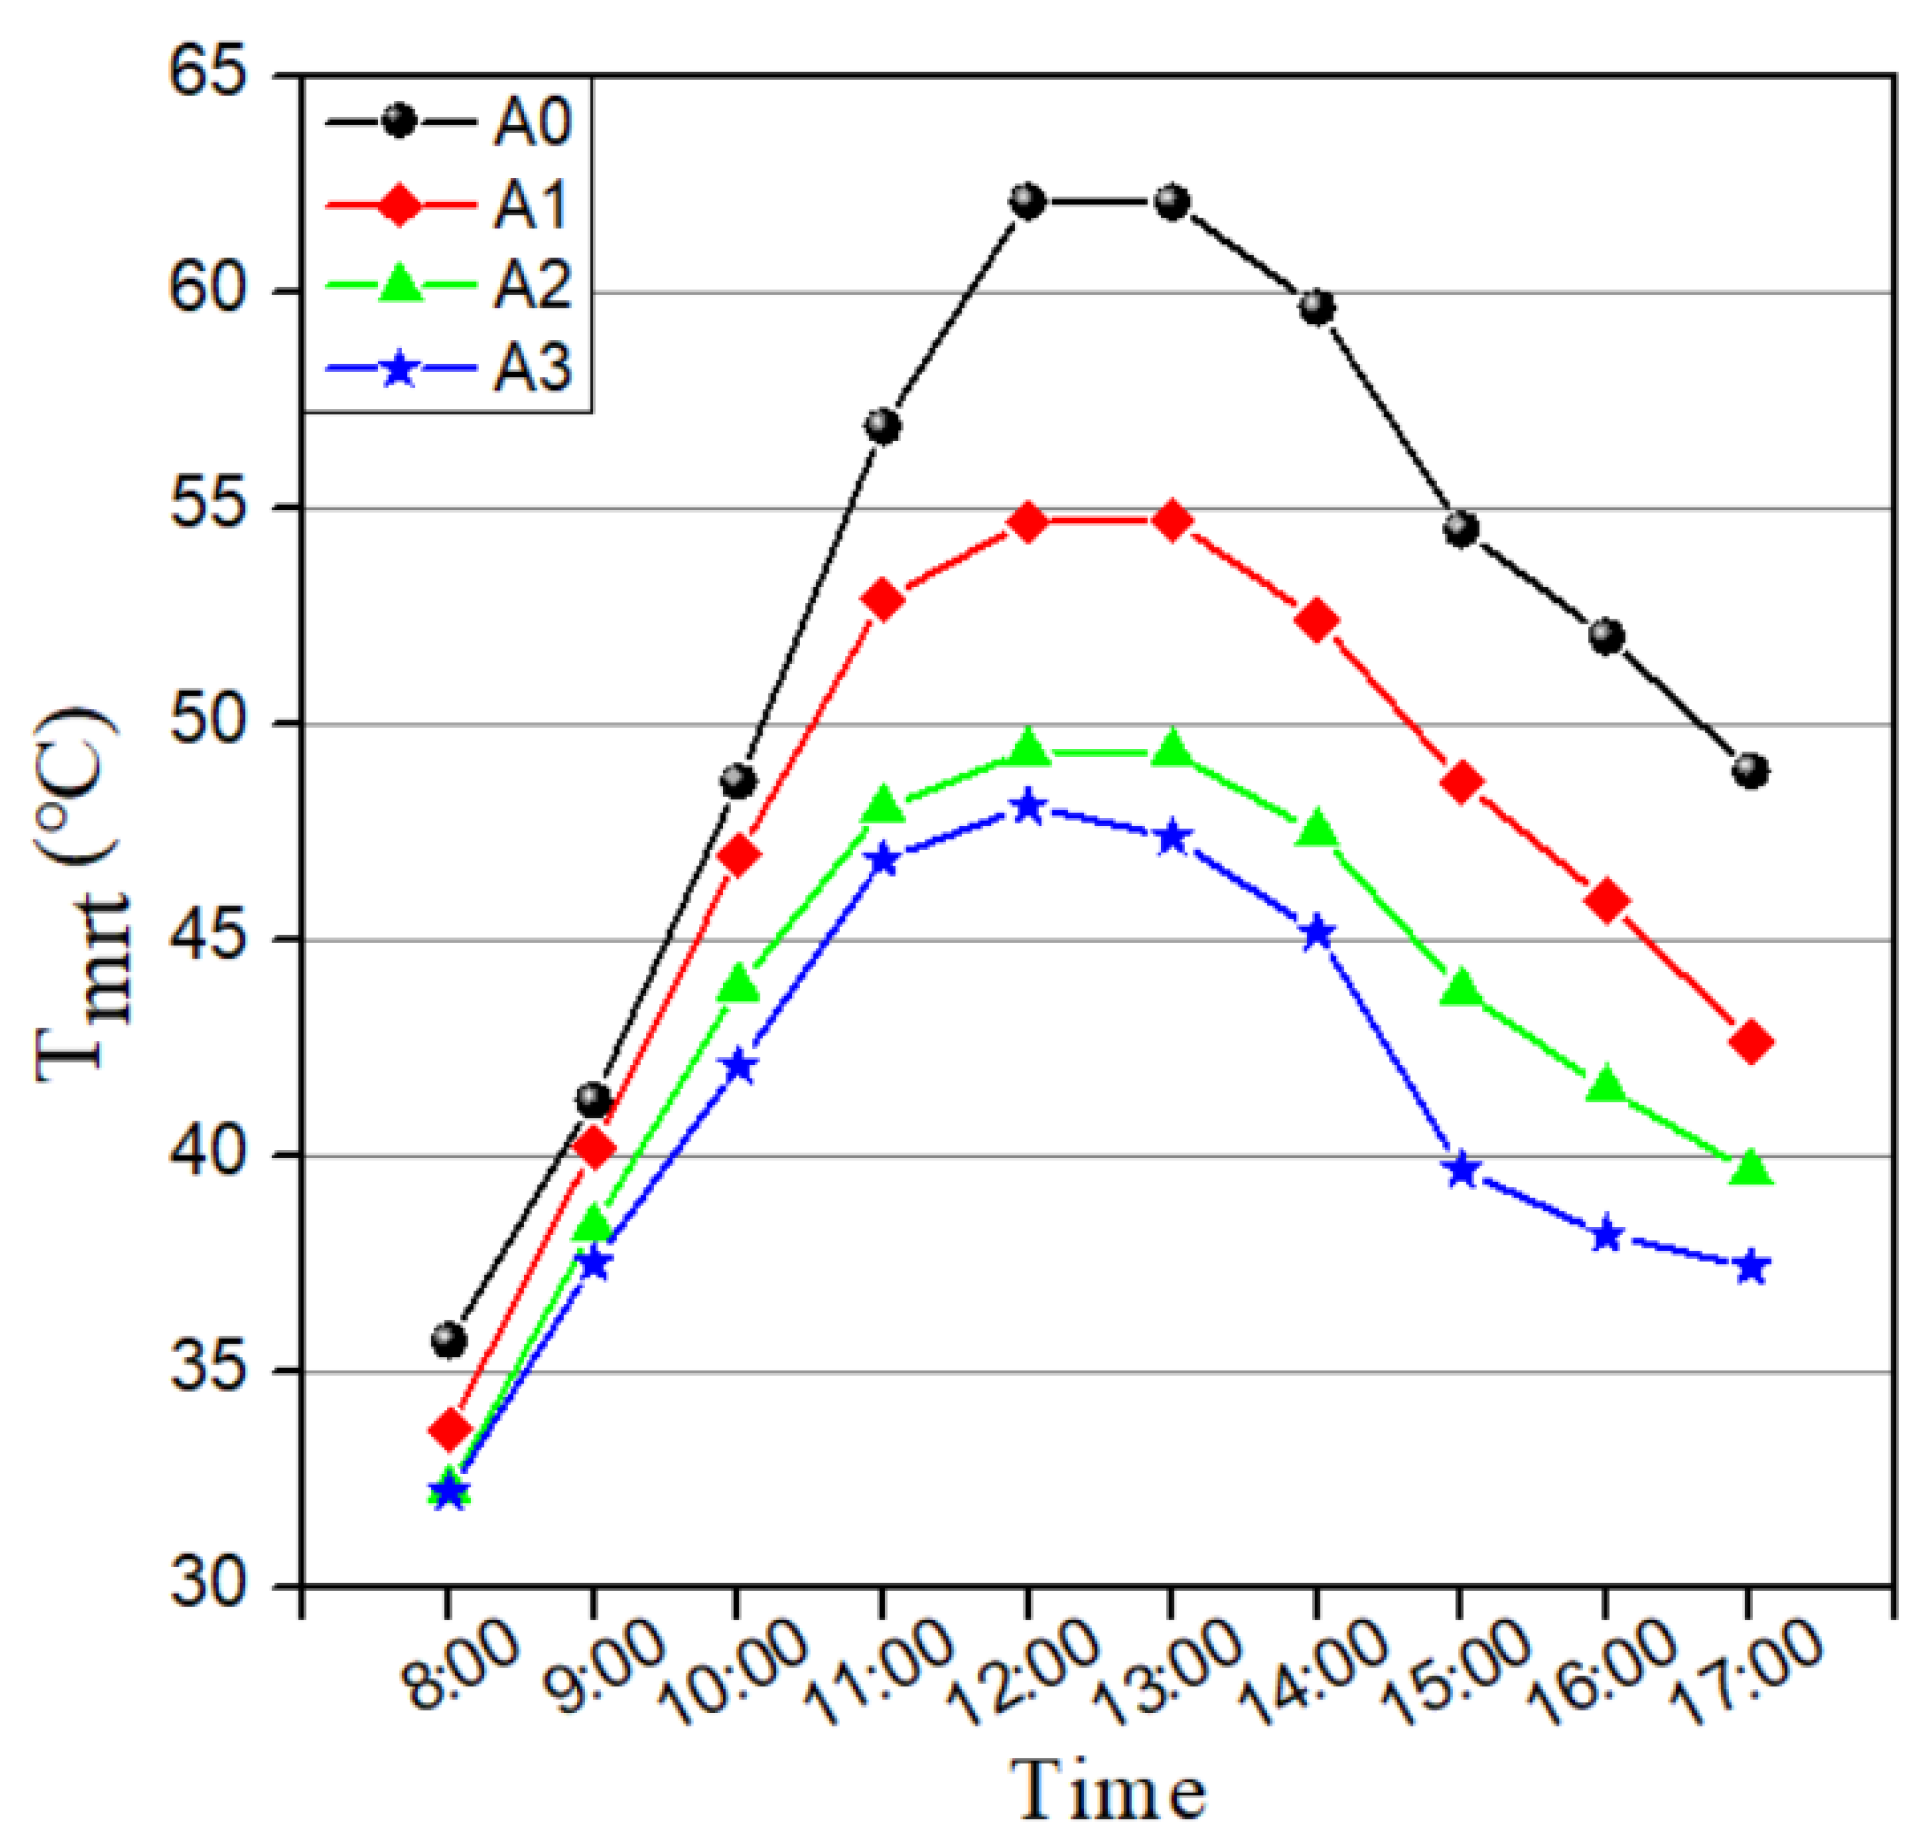
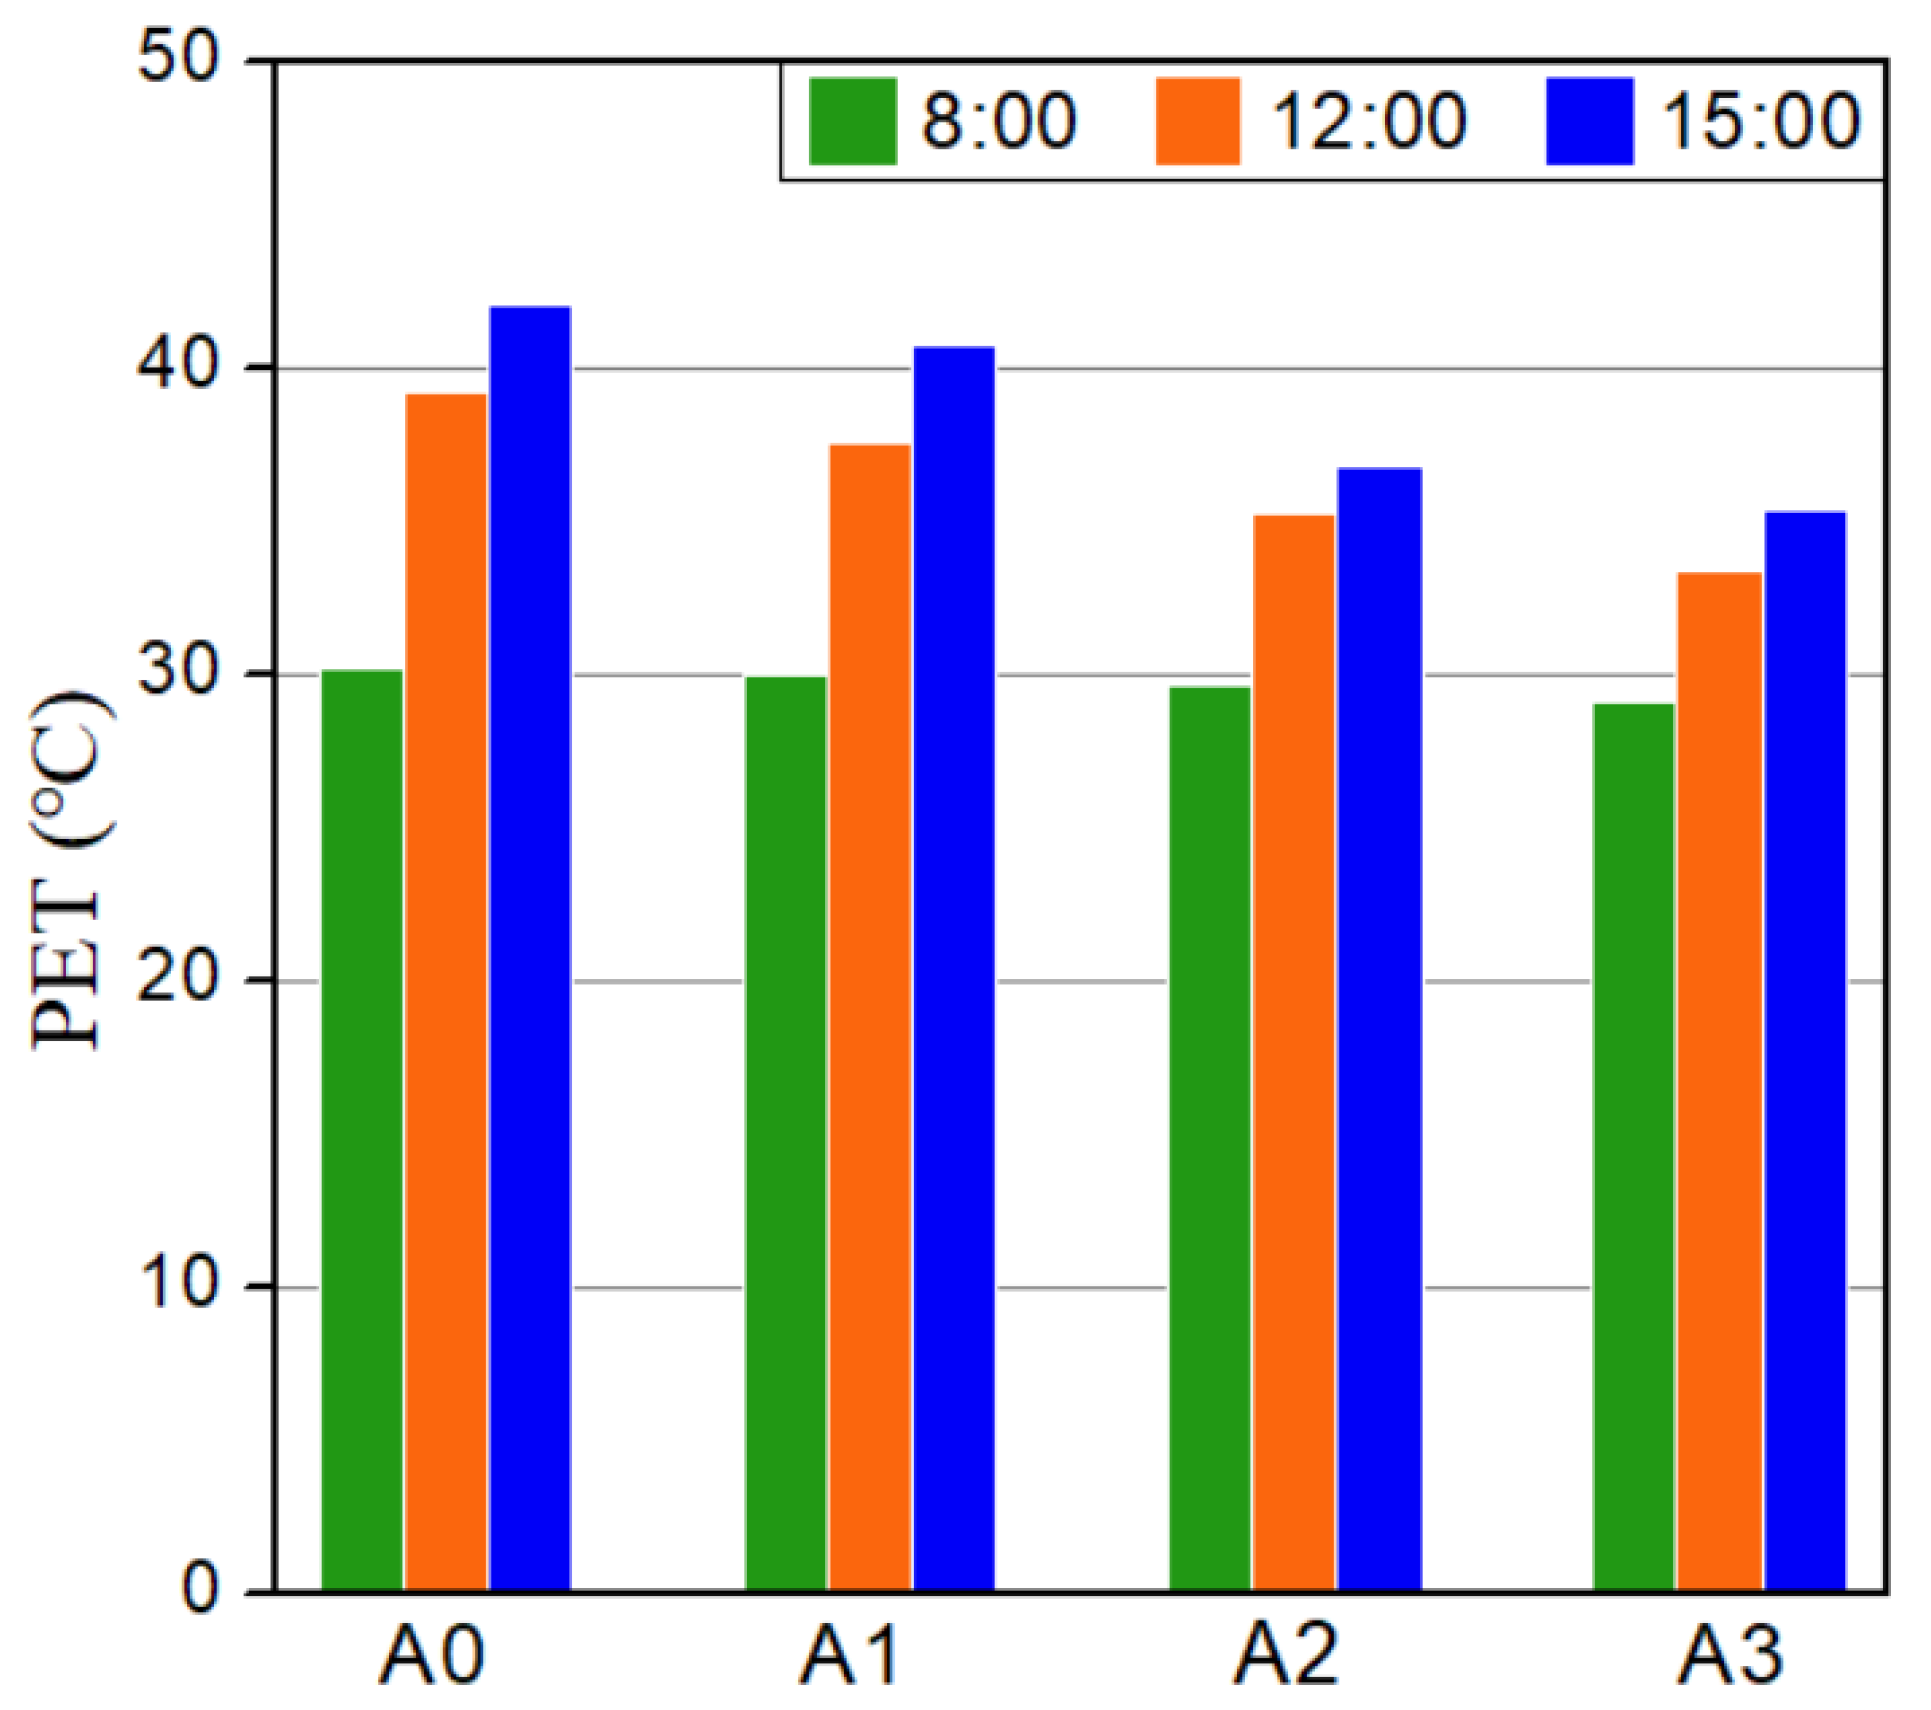
- An increase in the greening rate reduced the air temperature and improved outdoor thermal comfort. This effect became more pronounced as the greening increased from 25% to 45%. At a greening rate of 45%, the maximum Ta, Tmrt, and PET were 3.2 °C, 14.4 °C, and 6.9 °C lower, respectively, than in the base case.
- (3)
- As the H/W of the building increased, the shadow area during the day increased, reducing the SVF. The Ta, Tmrt, and PET were 2 °C, 8.7 °C, and 5.5 °C lower, respectively, when there were buildings on both sides of the open area (H/W = 0.8). An increase in the H/W from 0.8 to 1 did not further improve the outdoor thermal comfort. A negligible difference in the Tmrt and PET was observed between a H/W of 1 and 1.2. Therefore, increasing the building height improves the thermal environment of the campus in summer, but a higher building height does not necessarily mean a better thermal environment.
- (4)
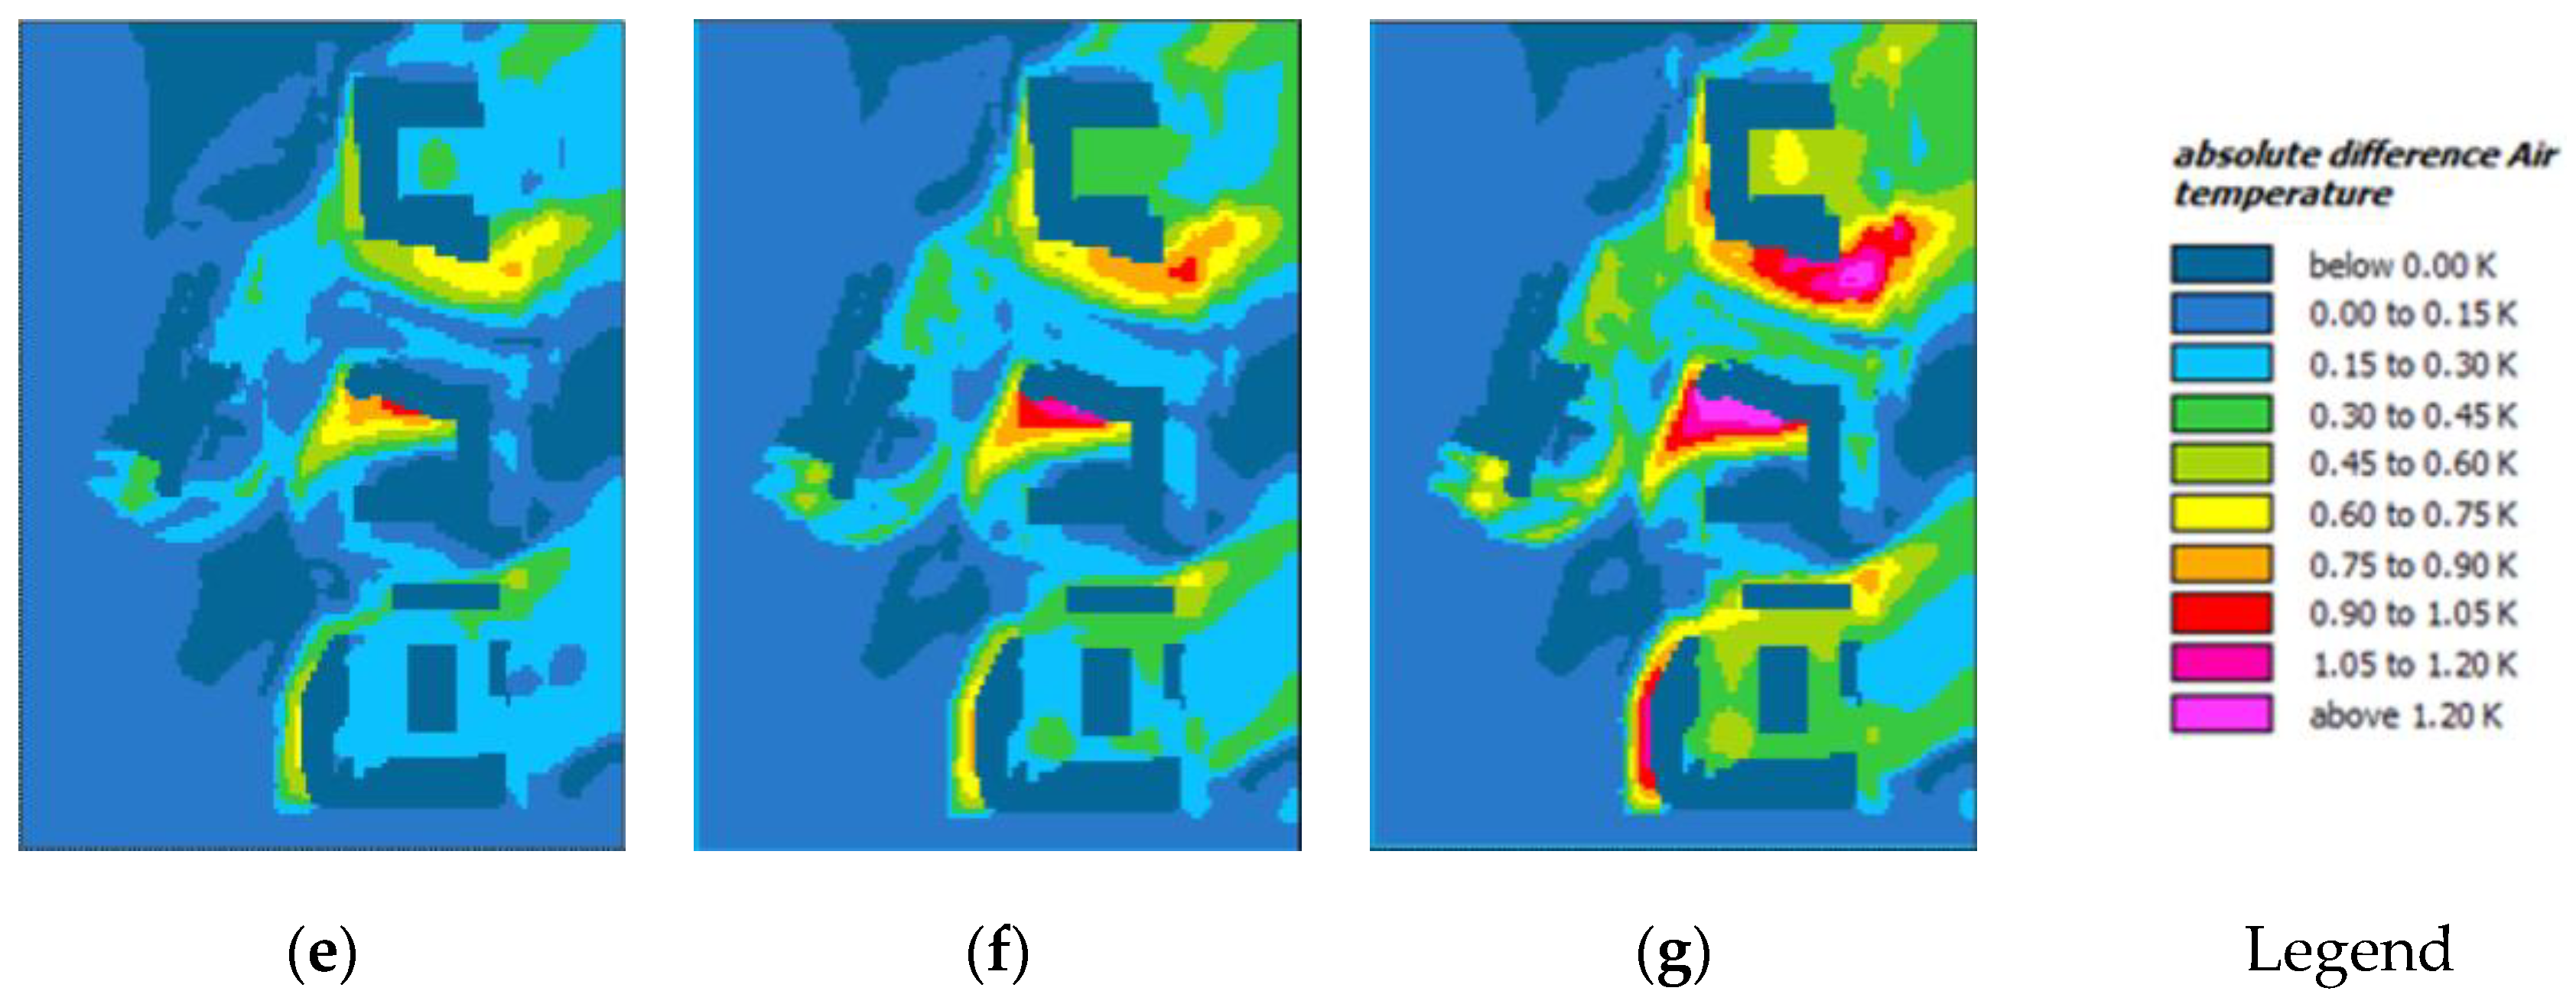
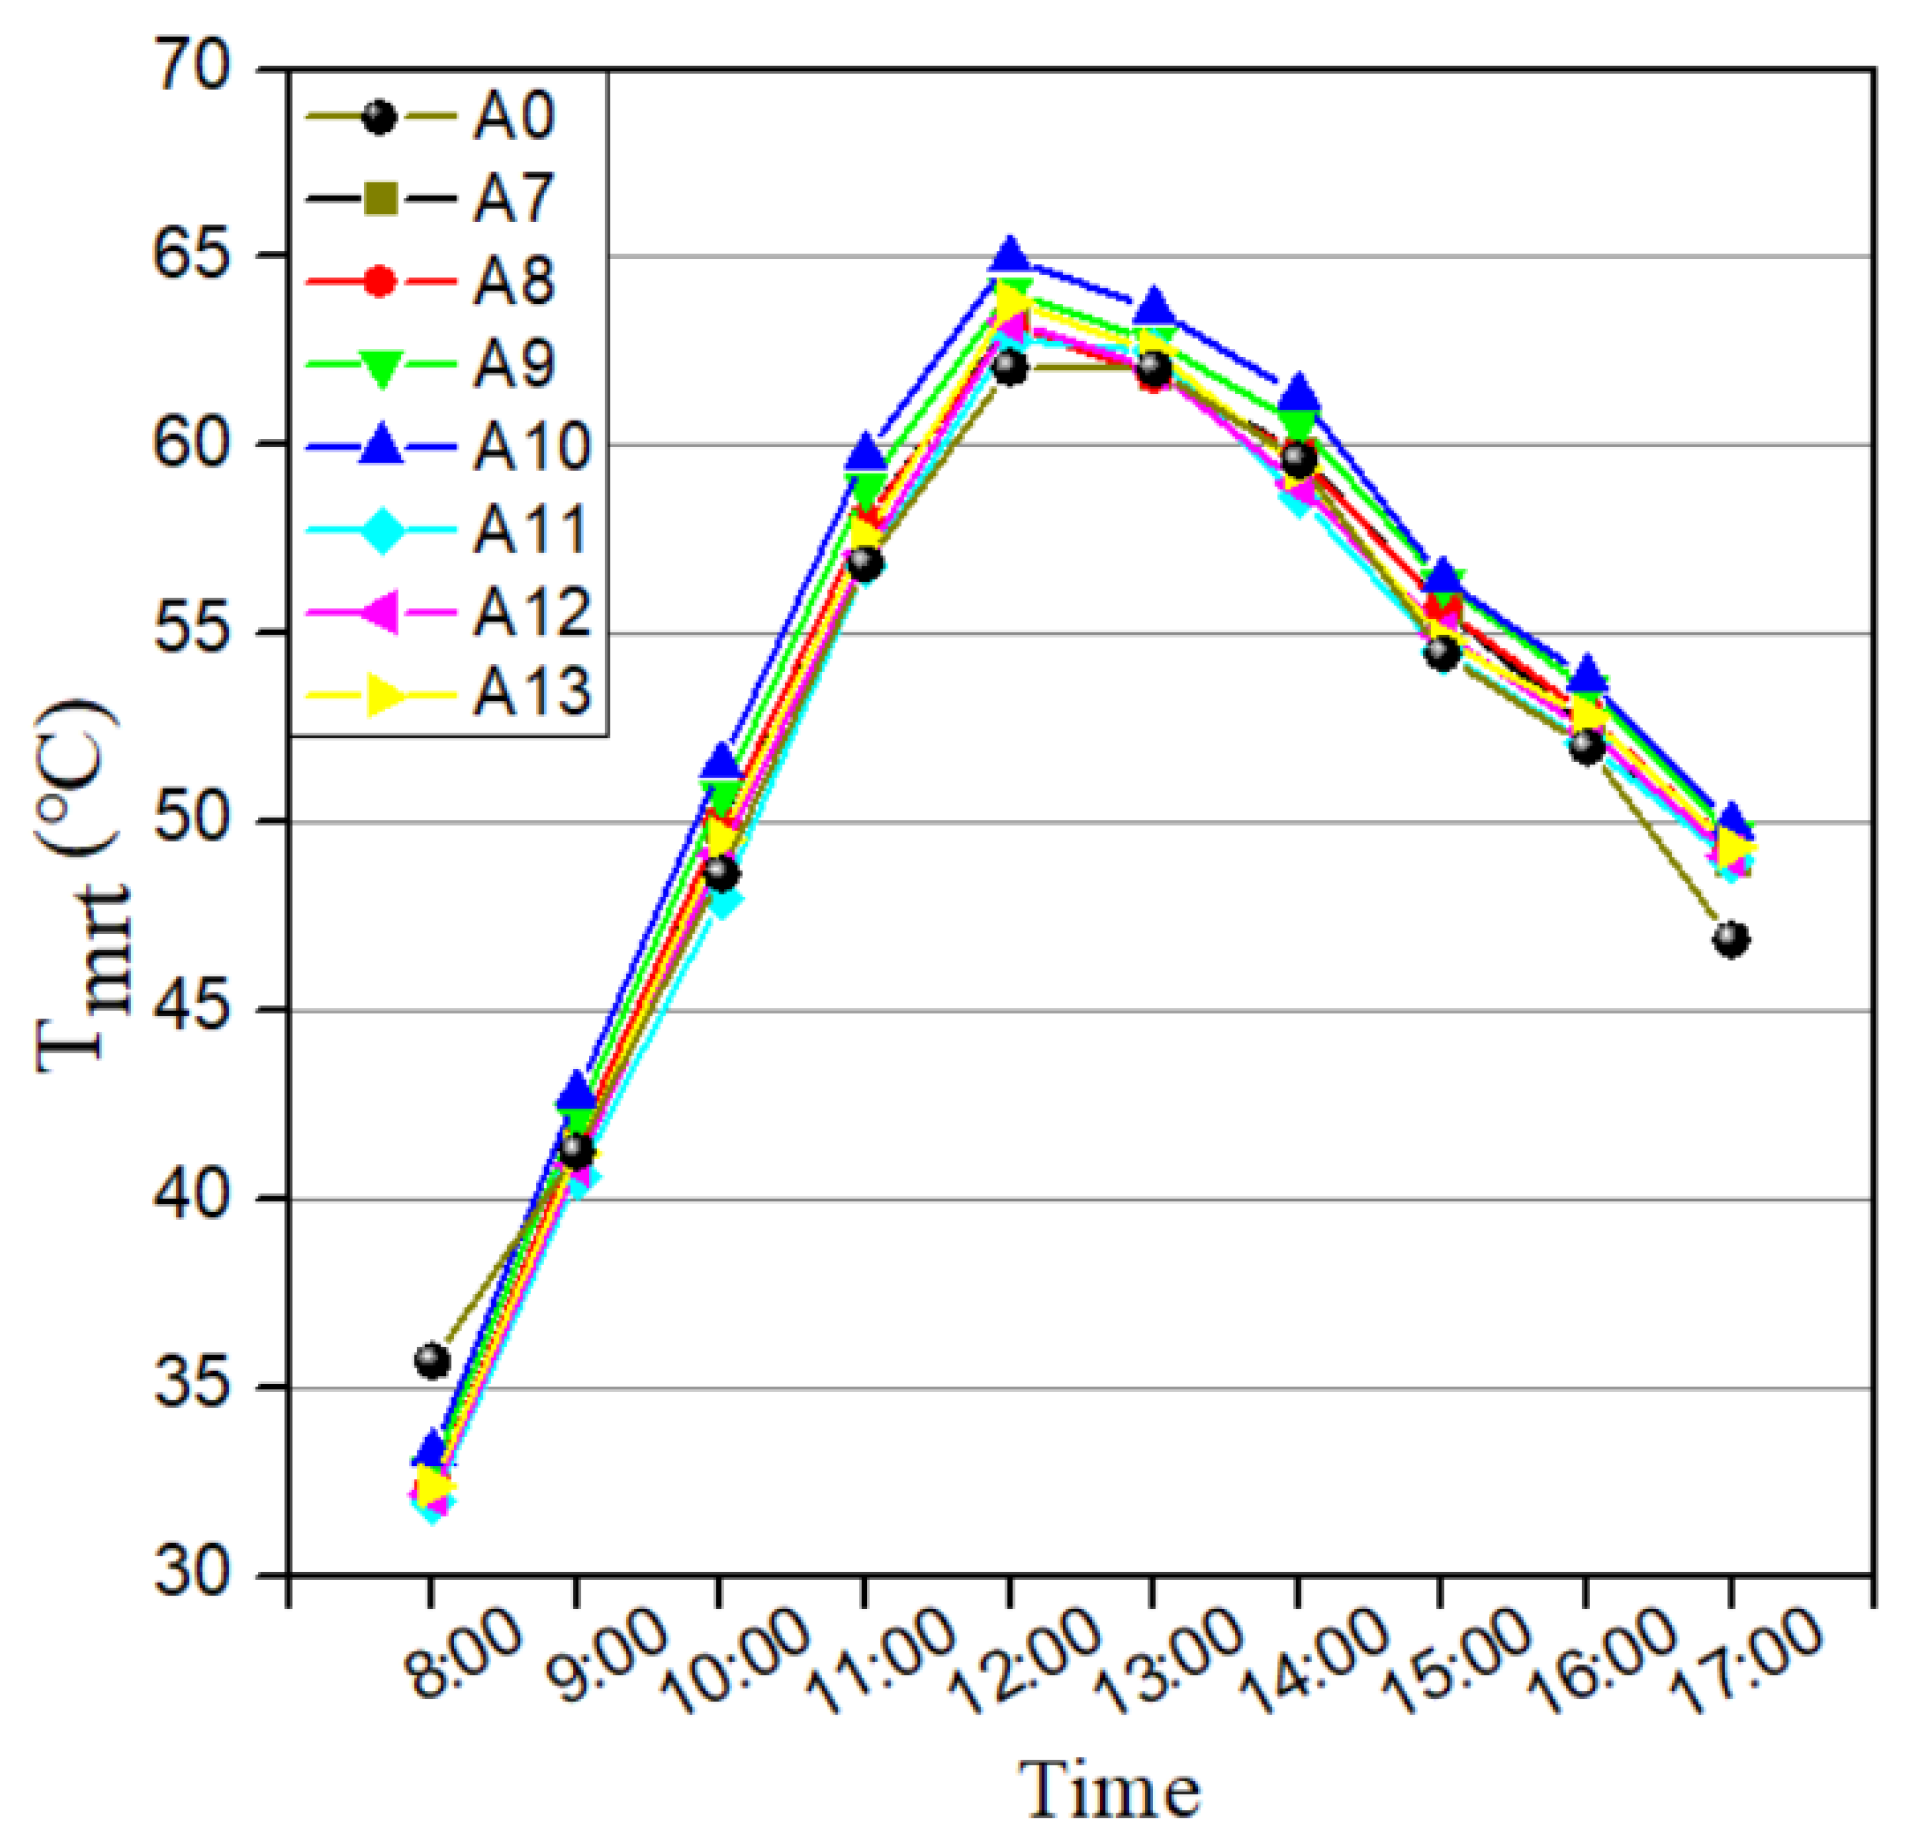
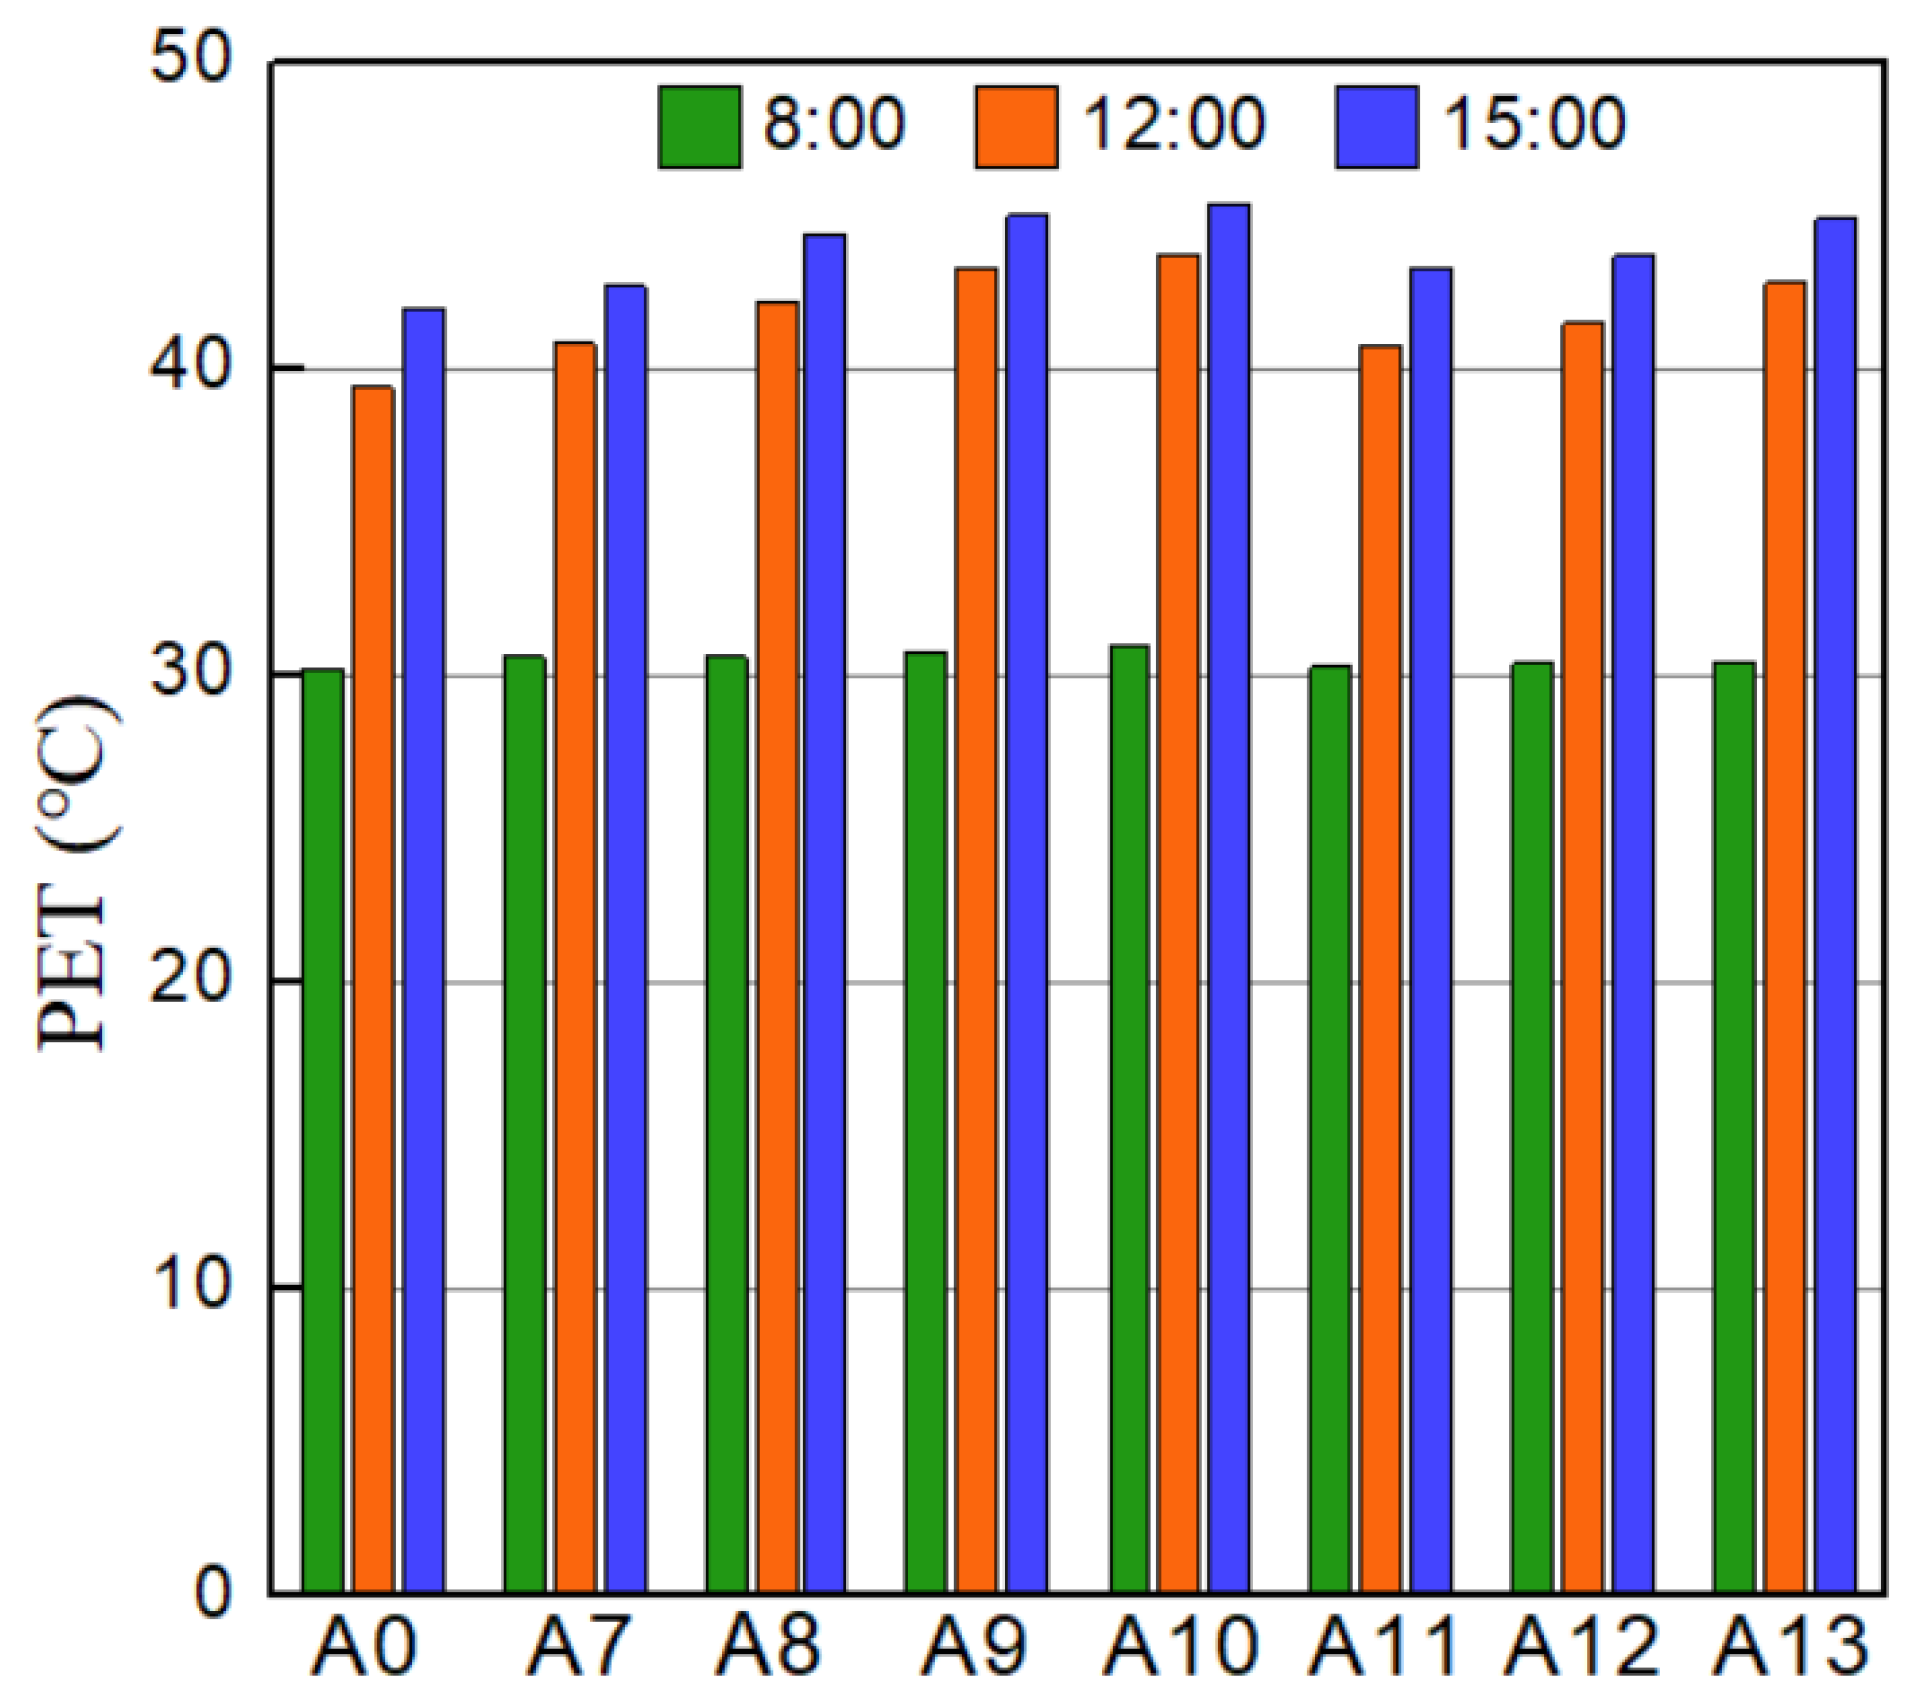
- The air temperature decreased with an increase in the surface albedo. As the albedo increased from 0.2 to 0.6, the maximum temperature dropped by 1.44 °C. However, a decrease in the temperature led to an increase in Tmrt and PET, especially in areas in building shadows. The Tmrt (PET) of the surface with an albedo of 0.6 was 3.7 °C (4.3 °C) higher than that of the base case. Therefore, the building and ground surfaces should not have a very high albedo.
- (5)
- Further studies will consider landscape design factors, annual climate characteristics, and students’ behaviors to provide more insights into optimizing the outdoor thermal comfort of the university campuses.
Author Contributions
Funding
Data Availability Statement
Acknowledgments
Conflicts of Interest
Nomenclature
| D | globe diameter, mm |
| G | solar radiation, W/m2 |
| RH | relative humidity, % |
| Ta | air temperature, °C |
| Tg | black globe temperature, °C |
| Tmrt | the mean radiation temperature, °C |
| Va | wind speed, m/s |
| Va0 | wind speed at 1.5 m, m/s |
| Va10 | wind speed at 10 m, m/s |
| z0 | distance from the ground at 1.5 m |
| z10 | distance from the ground at 10 m |
| Abbreviation | |
| H/W | height-to-width ratio |
| PET | physiological equivalent temperature, °C |
| PMV | predicted mean vote |
| SVF | sky view factor |
| UTCI | universal thermal climate index, °C |
| Greek Symbols | |
| ε | emissivity |
| Superscripts | |
| α | roughness index |
| Subscripts | |
| a | air |
| g | globe |
| mrt | mean radiation temperature |
References
- Lai, D.; Guo, D.; Hou, Y.; Lin, C.; Chen, Q. Studies of outdoor thermal comfort in northern China. Build. Environ. 2014, 77, 110–118. [Google Scholar] [CrossRef]
- Xu, M.; Hong, B.; Mi, J.; Yan, S. Outdoor thermal comfort in an urban park during winter in cold regions of China. Sustain. Cities Soc. 2018, 43, 208–220. [Google Scholar] [CrossRef]
- Zhang, L.; Yu, Z.; Liu, J.; Zhang, L. The numerical analysis of outdoor wind and thermal environment in a residential area in Liaocheng, China. IOP Conf. Ser. Earth Environ. Sci. 2018, 121, 052054. [Google Scholar] [CrossRef]
- An, F.; Liu, J.; Lu, W.; Jareemit, D. A review of the effect of traffic-related air pollution around schools on student health and its mitigation. J. Transp. Health 2021, 23, 101249. [Google Scholar] [CrossRef]
- Liu, J.; Cai, W.; Zhu, S.; Dai, F. Impacts of vehicle emission from a major road on spatiotemporal variations of neighborhood particulate pollution—A case study in a university campus. Sustain. Cities Soc. 2020, 53, 101917. [Google Scholar] [CrossRef]
- Liang, X.; Tian, W.; Li, R.; Niu, Z.; Yang, X.; Meng, X.; Jin, L.; Yan, J. Numerical investigations on outdoor thermal comfort for built environment: Case study of a Northwest campus in China. Energy Procedia 2019, 158, 6557–6563. [Google Scholar] [CrossRef]
- Zhang, L.; Zhang, L.; Jin, M.; Liu, J. Numerical Study of Outdoor Thermal Environment in a University Campus in Summer. Procedia Eng. 2017, 205, 4052–4059. [Google Scholar] [CrossRef]
- Lam, C.K.C.; Weng, J.; Liu, K.; Hang, J. The effects of shading devices on outdoor thermal and visual comfort in Southern China during summer. Build. Environ. 2022, 228, 109743. [Google Scholar] [CrossRef]
- Zhao, T.F.; Fong, K.F. Characterization of different heat mitigation strategies in landscape to fight against heat island and improve thermal comfort in hot–humid climate (Part I): Measurement and modelling. Sustain. Cities Soc. 2017, 32, 523–531. [Google Scholar] [CrossRef]
- Ghaffarianhoseini, A.; Berardi, U.; Ghaffarianhoseini, A.; Al-Obaidi, K. Analyzing the thermal comfort conditions of outdoor spaces in a university campus in Kuala Lumpur, Malaysia. Sci. Total Environ. 2019, 666, 1327–1345. [Google Scholar] [CrossRef]
- Berardi, U. The outdoor microclimate benefits and energy saving resulting from green roofs retrofits. Energy Build. 2016, 121, 217–229. [Google Scholar] [CrossRef]
- Abdallah, A.S.H.; Hussein, S.W.; Nayel, M. The impact of outdoor shading strategies on student thermal comfort in open spaces between education building. Sustain. Cities Soc. 2020, 58, 102124. [Google Scholar] [CrossRef]
- Eslamirad, N.; Sepúlveda, A.; De Luca, F.; Sakari Lylykangas, K. Evaluating Outdoor Thermal Comfort Using a Mixed-Method to Improve the Environmental Quality of a University Campus. Energies 2022, 15, 1577. [Google Scholar] [CrossRef]
- Sun, B.; Zhang, H.; Zhao, L.; Qu, K.; Liu, W.; Zhuang, Z.; Ye, H. Microclimate Optimization of School Campus Landscape Based on Comfort Assessment. Buildings 2022, 12, 1375. [Google Scholar] [CrossRef]
- Yola, L.; Adekunle, T.O.; Ayegbusi, O.G. The Impacts of Urban Configurations on Outdoor Thermal Perceptions: Case Studies of Flat Bandar Tasik Selatan and Surya Magna in Kuala Lumpur. Buildings 2022, 12, 1684. [Google Scholar] [CrossRef]
- Liu, L.; Liang, Z.; Liu, J.; Du, J.; Zhang, H. Field Survey on Local Thermal Comfort of Students at a University Campus: A Case Study in Shanghai. Atmosphere 2022, 13, 1433. [Google Scholar] [CrossRef]
- Huang, T.; Li, J.; Xie, Y.; Niu, J.; Mak, C.M. Simultaneous environmental parameter monitoring and human subject survey regarding outdoor thermal comfort and its modelling. Build. Environ. 2017, 125, 502–514. [Google Scholar] [CrossRef]
- Lai, D.; Zhou, X.; Chen, Q. Modelling dynamic thermal sensation of human subjects in outdoor environments. Energy Build. 2017, 149, 16–25. [Google Scholar] [CrossRef]
- Zhao, L.; Zhou, X.; Li, L.; He, S.; Chen, R. Study on outdoor thermal comfort on a campus in a subtropical urban area in summer. Sustain. Cities Soc. 2016, 22, 164–170. [Google Scholar] [CrossRef]
- Altunkasa, C.; Uslu, C. Use of outdoor microclimate simulation maps for a planting design to improve thermal comfort. Sustain. Cities Soc. 2020, 57, 102137. [Google Scholar] [CrossRef]
- Khalili, S.; Fayaz, R.; Zolfaghari, S.A. Analyzing outdoor thermal comfort conditions in a university campus in hot-arid climate: A case study in Birjand, Iran. Urban Clim. 2022, 43, 101128. [Google Scholar] [CrossRef]
- Aghamohammadi, N.; Fong, C.S.; Mohd Idrus, M.H.; Ramakreshnan, L.; Haque, U. Outdoor thermal comfort and somatic symptoms among students in a tropical city. Sustain. Cities Soc. 2021, 72, 103015. [Google Scholar] [CrossRef]
- He, X.; An, L.; Hong, B.; Huang, B.; Cui, X. Cross-cultural differences in thermal comfort in campus open spaces: A longitudinal field survey in China’s cold region. Build. Environ. 2020, 172, 106739. [Google Scholar] [CrossRef]
- Kumar, P.; Sharma, A. Study on importance, procedure, and scope of outdoor thermal comfort—A review. Sustain. Cities Soc. 2020, 61, 102297. [Google Scholar] [CrossRef]
- Cheng, V.; Ng, E.; Chan, C.; Givoni, B. Outdoor thermal comfort study in a sub-tropical climate: A longitudinal study based in Hong Kong. Int. J. Biometeorol. 2012, 56, 43–56. [Google Scholar] [CrossRef] [PubMed]
- Nie, T.; Lai, D.; Liu, K.; Lian, Z.; Yuan, Y.; Sun, L. Discussion on inapplicability of Universal Thermal Climate Index (UTCI) for outdoor thermal comfort in cold region. Urban Clim. 2022, 46, 101304. [Google Scholar] [CrossRef]
- Deng, J.-Y.; Wong, N.H.; Zheng, X. Effects of street geometries on building cooling demand in Nanjing, China. Renew. Sustain. Energy Rev. 2021, 142, 110862. [Google Scholar] [CrossRef]
- Li, J.; Liu, J.; Srebric, J.; Hu, Y.; Liu, M.; Su, L.; Wang, S. The Effect of Tree-Planting Patterns on the Microclimate within a Courtyard. Sustainability 2019, 11, 1665. [Google Scholar] [CrossRef] [Green Version]
- Kleerekoper, L.; Van Esch, M.; Salcedo, T.B. How to make a city climate-proof, addressing the urban heat island effect. Resour. Conserv. Recycl. 2012, 64, 30–38. [Google Scholar] [CrossRef]
- Teshnehdel, S.; Akbari, H.; Di Giuseppe, E.; Brown, R.D. Effect of tree cover and tree species on microclimate and pedestrian comfort in a residential district in Iran. Build. Environ. 2020, 178, 106899. [Google Scholar] [CrossRef]
- Xu, C.; Yan, C.; Ren, J.; Liu, J. Numerical analysis the effect of trees on the outdoor thermal environment and the building energy consumption in a residential neighborhood. IOP Conf. Ser. Earth Environ. Sci. 2020, 546, 032007. [Google Scholar]
- Jin, M.; Liu, J.; Zhang, L. Numerical Evaluation of the Impact of Green Wall on the Outdoor Thermal Environment. In Proceedings of the 2016 3rd International Conference on Materials Engineering, Manufacturing Technology and Control, Taiyuan, China, 27–28 February 2016. [Google Scholar]
- Aflaki, A.; Mirnezhad, M.; Ghaffarianhoseini, A.; Ghaffarianhoseini, A.; Omrany, H.; Wang, Z.-H.; Akbari, H. Urban heat island mitigation strategies: A state-of-the-art review on Kuala Lumpur, Singapore and Hong Kong. Cities 2017, 62, 131–145. [Google Scholar] [CrossRef] [Green Version]
- Wang, Y.; Akbari, H. The effects of street tree planting on Urban Heat Island mitigation in Montreal. Sustain. Cities Soc. 2016, 27, 122–128. [Google Scholar] [CrossRef]
- Abdi, B.; Hami, A.; Zarehaghi, D. Impact of small-scale tree planting patterns on outdoor cooling and thermal comfort. Sustain. Cities Soc. 2020, 56, 102085. [Google Scholar] [CrossRef]
- Gachkar, D.; Taghvaei, S.H.; Norouzian-Maleki, S. Outdoor thermal comfort enhancement using various vegetation species and materials (case study: Delgosha Garden, Iran). Sustain. Cities Soc. 2021, 75, 103309. [Google Scholar] [CrossRef]
- Yang, Y.; Zhou, D.; Wang, Y.; Ma, D.; Chen, W.; Xu, D.; Zhu, Z. Economical and outdoor thermal comfort analysis of greening in multistory residential areas in Xi’an. Sustain. Cities Soc. 2019, 51, 101730. [Google Scholar] [CrossRef]
- Liu, J.; Heidarinejad, M.; Pitchurov, G.; Zhang, L.; Srebric, J. An extensive comparison of modified zero-equation, standard k-ε, and LES models in predicting urban airflow. Sustain. Cities Soc. 2018, 40, 28–43. [Google Scholar] [CrossRef]
- Liu, J.; Heidarinejad, M.; Gracik, S.; Srebric, J. The impact of exterior surface convective heat transfer coefficients on the building energy consumption in urban neighborhoods with different plan area densities. Energy Build. 2015, 86, 449–463. [Google Scholar] [CrossRef]
- Xiong, K.; He, B.-J. Wintertime outdoor thermal sensations and comfort in cold-humid environments of Chongqing China. Sustain. Cities Soc. 2022, 87, 104203. [Google Scholar] [CrossRef]
- Hang, J.; Wang, D.; Zeng, L.; Ren, L.; Shi, Y.; Zhang, X. Scaled outdoor experimental investigation of thermal environment and surface energy balance in deep and shallow street canyons under various sky conditions. Build. Environ. 2022, 225, 109618. [Google Scholar] [CrossRef]
- Mahmoud, H.; Ghanem, H.; Sodoudi, S. Urban geometry as an adaptation strategy to improve the outdoor thermal performance in hot arid regions: Aswan University as a case study. Sustain. Cities Soc. 2021, 71, 102965. [Google Scholar] [CrossRef]
- Kakon, A.N.; Mishima, N.; Kojima, S. Simulation of the urban thermal comfort in a high density tropical city: Analysis of the proposed urban construction rules for Dhaka, Bangladesh. Build. Simul. 2009, 2, 291–305. [Google Scholar] [CrossRef]
- Wu, J.; Chang, H.; Yoon, S. Numerical Study on Microclimate and Outdoor Thermal Comfort of Street Canyon Typology in Extremely Hot Weather—A Case Study of Busan, South Korea. Atmosphere 2022, 13, 307. [Google Scholar] [CrossRef]
- Qaid, A.; Bin Lamit, H.; Ossen, D.R.; Shahminan, R.N.R. Urban Heat Island and Thermal Comfort Conditions at Micro-climate Scale in a Tropical Planned City. Energy Build. 2016, 133, 577–595. [Google Scholar] [CrossRef]
- Charalampopoulos, I.; Tsiros, I.; Chronopoulou-Sereli, A.; Matzarakis, A. Analysis of thermal bioclimate in various urban configurations in Athens, Greece. Urban Ecosyst. 2013, 16, 217–233. [Google Scholar] [CrossRef]
- Wang, S.; Chen, B.; Suo, J.; Zhao, J.R. Impact of building morphology and outdoor environment on light and thermal environment in campus buildings in cold region during winter. Build. Environ. 2021, 204, 108074. [Google Scholar] [CrossRef]
- Taleghani, M.; Berardi, U. The effect of pavement characteristics on pedestrians’ thermal comfort in Toronto. Urban Clim. 2018, 24, 449–459. [Google Scholar] [CrossRef]
- Del Serrone, G.; Peluso, P.; Moretti, L. Evaluation of Microclimate Benefits Due to Cool Pavements and Green Infrastructures on Urban Heat Islands. Atmosphere 2022, 13, 1586. [Google Scholar] [CrossRef]
- Liu, J.; Heidarinejad, M.; Nikkho, S.K.; Mattise, N.W.; Srebric, J. Quantifying Impacts of Urban Microclimate on a Building Energy Consumption—A Case Study. Sustainability 2019, 11, 4921. [Google Scholar] [CrossRef] [Green Version]
- Heidarinejad, M.; Gracik, S.; Sadeghipour Roudsari, M.; Khoshdel Nikkho, S.; Liu, J.; Liu, K.; Pitchorov, G.; Srebric, J. Influence of building surface solar irradiance on environmental temperatures in urban neighborhoods. Sustain. Cities Soc. 2016, 26, 186–202. [Google Scholar] [CrossRef] [Green Version]
- Hendel, M. Chapter 11: 6—Cool pavements. In Eco-Efficient Pavement Construction Materials; Pacheco-Torgal, F., Amirkhanian, S., Wang, H., Schlangen, E., Eds.; Woodhead Publishing: Sawston/Cambridge, UK, 2020; pp. 97–125. [Google Scholar]
- Pisello, A.L.; Cotana, F. The thermal effect of an innovative cool roof on residential buildings in Italy: Results from two years of continuous monitoring. Energy Build. 2014, 69, 154–164. [Google Scholar] [CrossRef]
- Rosso, F.; Pisello, A.L.; Cotana, F.; Ferrero, M. On the thermal and visual pedestrians’ perception about cool natural stones for urban paving: A field survey in summer conditions. Build. Environ. 2016, 107, 198–214. [Google Scholar] [CrossRef]
- Castaldo, V.L.; Coccia, V.; Cotana, F.; Pignatta, G.; Pisello, A.L.; Rossi, F. Thermal-energy analysis of natural “cool” stone aggregates as passive cooling and global warming mitigation technique. Urban Clim. 2015, 14, 301–314. [Google Scholar] [CrossRef]
- Salata, F.; Golasi, I.; Petitti, D.; De Lieto Vollaro, E.; Coppi, M.; De Lieto Vollaro, A. Relating microclimate, human thermal comfort and health during heat waves: An analysis of heat island mitigation strategies through a case study in an urban outdoor environment. Sustain. Cities Soc. 2017, 30, 79–96. [Google Scholar] [CrossRef]
- Yang, J.; Wang, Z.-H.; Kaloush, K.E.; Dylla, H. Effect of pavement thermal properties on mitigating urban heat islands: A multi-scale modeling case study in Phoenix. Build. Environ. 2016, 108, 110–121. [Google Scholar] [CrossRef] [Green Version]
- Meteoblue Weather. Available online: https://www.meteoblue.com/en/weather/historyclimate/climatemodelled/tianzhuangcun_china_12341129 (accessed on 23 November 2022).
- Jendritzky, G.; Nübler, W. A model analysing the urban thermal environment in physiologically significant terms. Arch. Meteorol. Geophys. Bioclimatol. Ser. B 1981, 29, 313–326. [Google Scholar] [CrossRef]
- Frank, R.S.; Gerding, R.B.; O’rourke, P.A.; Terjung, W.H. An urban radiation obstruction model. Bound. -Layer Meteorol. 1981, 20, 259–264. [Google Scholar] [CrossRef]
- Salata, F.; Golasi, I.; De Lieto Vollaro, R.; De Lieto Vollaro, A. Urban microclimate and outdoor thermal comfort. A proper procedure to fit ENVI-met simulation outputs to experimental data. Sustain. Cities Soc. 2016, 26, 318–343. [Google Scholar] [CrossRef]
- Matzarakis, A.; Rutz, F.; Mayer, H. Modelling radiation fluxes in simple and complex environments: Basics of the RayMan model. Int. J. Biometeorol. 2010, 54, 131–139. [Google Scholar] [CrossRef] [Green Version]
- Matzarakis, A.; Rutz, F.; Mayer, H. Modelling radiation fluxes in simple and complex environments—Application of the RayMan model. Int. J. Biometeorol. 2007, 51, 323–334. [Google Scholar] [CrossRef]
- Ali-Toudert, F.; Mayer, H. Numerical study on the effects of aspect ratio and orientation of an urban street canyon on outdoor thermal comfort in hot and dry climate. Build. Environ. 2006, 41, 94–108. [Google Scholar] [CrossRef]
- Emmanuel, R.; Rosenlund, H.; Johansson, E. Urban shading—A design option for the tropics? A study in Colombo, Sri Lanka. Int. J. Climatol. 2010, 27, 1995–2004. [Google Scholar] [CrossRef] [Green Version]
- Morakinyo, T.E.; Dahanayake, K.W.D.K.C.; Adegun, O.B.; Balogun, A.A. Modelling the effect of tree-shading on summer indoor and outdoor thermal condition of two similar buildings in a Nigerian university. Energy Build. 2016, 130, 721–732. [Google Scholar] [CrossRef]
- Middel, A.; Chhetri, N.; Quay, R. Urban forestry and cool roofs: Assessment of heat mitigation strategies in Phoenix residential neighborhoods. Urban For. Urban Green. 2015, 14, 178–186. [Google Scholar] [CrossRef]
- Taleghani, M. The impact of increasing urban surface albedo on outdoor summer thermal comfort within a university campus. Urban Clim. 2018, 24, 175–184. [Google Scholar] [CrossRef]
- Oke, T.R. Street design and urban canopy layer climate. Energy Build. 1988, 11, 103–113. [Google Scholar] [CrossRef]
- Lee, H.; Mayer, H. Maximum extent of human heat stress reduction on building areas due to urban greening. Urban For. Urban Green. 2018, 32, 154–167. [Google Scholar] [CrossRef]
- Lin, T.-P.; Tsai, K.-T.; Hwang, R.-L.; Matzarakis, A. Quantification of the effect of thermal indices and sky view factor on park attendance. Landsc. Urban Plann 2012, 107, 137–146. [Google Scholar] [CrossRef]
- El-Bardisy, W.M.; Fahmy, M.; El-Gohary, G.F. Climatic Sensitive Landscape Design: Towards a Better Microclimate through Plantation in Public Schools, Cairo, Egypt. Procedia Soc. Behav. Sci. 2016, 216, 206–216. [Google Scholar] [CrossRef] [Green Version]
- Vanos, J.K.; Warland, J.S.; Gillespie, T.J.; Kenny, N.A. Review of the physiology of human thermal comfort while exercising in urban landscapes and implications for bioclimatic design. Int. J. Biometeorol. 2010, 54, 319–334. [Google Scholar] [CrossRef]
- Lin, T.-P. Thermal perception, adaptation and attendance in a public square in hot and humid regions. Build. Environ. 2009, 44, 2017–2026. [Google Scholar] [CrossRef]
- Lam, C.K.C.; Hang, J.; Zhang, D.; Wang, Q.; Ren, M.; Huang, C. Effects of short-term physiological and psychological adaptation on summer thermal comfort of outdoor exercising people in China. Build. Environ. 2021, 198, 107877. [Google Scholar] [CrossRef]
- Huang, Z.; Cheng, B.; Gou, Z.; Zhang, F. Outdoor thermal comfort and adaptive behaviors in a university campus in China’s hot summer-cold winter climate region. Build. Environ. 2019, 165, 106414. [Google Scholar] [CrossRef]


| Measurement Point | Site Environment | Fisheye Photos | SVF | Measurement Point | Site Environment | Fisheye Photos | SVF |
|---|---|---|---|---|---|---|---|
| Point 1 |  |  | 0.799 | Point 2 |  |  | 0.526 |
| Point 3 |  |  | 0.157 | Point 4 |  |  | 0.531 |
| Point 5 |  |  | 0.531 | Point 6 |  |  | 0.728 |
| Point 7 |  |  | 0.778 | Point 8 |  |  | 0.855 |
| Instrument | Parameters | Accuracy | Measuring Range |
|---|---|---|---|
| iButton thermometer | Temperature | ±0.5 °C | −10~65 °C |
| iButton thermometer | Humidity | ±0.5 °C | 0~100% |
| JA-IAQ-50 multifunction tester | Wind speed | ±0.03 m/s | 0~2 m/s |
| JA-IAQ-50 multifunction tester | Globe temperature | ±0.5 °C | −20~120 °C |
| L99-FSFX anemometer | Wind speed | ±(0.5 + 0.05 × speed) m/s | 0~60 m/s |
| L99-FSFX anemometer | Wind direction | 0~360° | 1° |
| HOBO solar radiation sensor | Solar radiation | ±10 W/m2 | 0~1280 W/m2 |
| Fotric 225s-L24 camera | Surface temperature | ±2 °C | −20~350 °C |
| Fish-eye camera | Fisheye images | - | 180° |
| Variable | Value |
|---|---|
| Longitude, Latitude | 117°14′ E, 36°37′ N |
| Climate type | Cold climate |
| Simulation date | 17 August 2020 |
| Simulation duration | 48 h |
| Start time | 00:00 am |
| Spatial resolution | 3 × 3 × 3 m3 |
| Domain Size | 336 × 486 × 90 m3 |
| Model rotation | 14° |
| Wind speed at 10 m | 1.5 m/s |
| Wind direction | 225° |
| Surface albedo | Walls 0.2; Roofs 0.2 and 0.3 |
| Cases | Greening Rate |
|---|---|
| A1 | 25% |
| A2 | 35% |
| A3 | 45% |
| Cases | H/W | SVF | Building Height |
|---|---|---|---|
| A4 | 0.8 | 0.53 | 24 |
| A5 | 1 | 0.457 | 36 |
| A6 | 1.2 | 0.414 | 48 |
| Cases | Masonry Floor Albedo | Asphalt Floor Albedo |
|---|---|---|
| A7 | 0.3 | 0.3 |
| A8 | 0.3 | 0.4 |
| A9 | 0.3 | 0.5 |
| A10 | 0.3 | 0.6 |
| A11 | 0.4 | 0.2 |
| A12 | 0.5 | 0.2 |
| A13 | 0.6 | 0.2 |
Publisher’s Note: MDPI stays neutral with regard to jurisdictional claims in published maps and institutional affiliations. |
© 2022 by the authors. Licensee MDPI, Basel, Switzerland. This article is an open access article distributed under the terms and conditions of the Creative Commons Attribution (CC BY) license (https://creativecommons.org/licenses/by/4.0/).
Share and Cite
Yang, L.; Liu, J.; Zhu, S. Evaluating the Effects of Different Improvement Strategies for the Outdoor Thermal Environment at a University Campus in the Summer: A Case Study in Northern China. Buildings 2022, 12, 2254. https://doi.org/10.3390/buildings12122254
Yang L, Liu J, Zhu S. Evaluating the Effects of Different Improvement Strategies for the Outdoor Thermal Environment at a University Campus in the Summer: A Case Study in Northern China. Buildings. 2022; 12(12):2254. https://doi.org/10.3390/buildings12122254
Chicago/Turabian StyleYang, Lina, Jiying Liu, and Shengwei Zhu. 2022. "Evaluating the Effects of Different Improvement Strategies for the Outdoor Thermal Environment at a University Campus in the Summer: A Case Study in Northern China" Buildings 12, no. 12: 2254. https://doi.org/10.3390/buildings12122254