Article

Assessing the Impacts of Carbon Tax and Improved Energy Efficiency on the Construction Industry: Based on CGE Model

1
Center for Green Engineering and Sustainable Development, Chang’an University, Xi’an 710064, China
2
School of Economics and Management, Chang’an University, Xi’an 710064, China
3
College of Transportation Engineering, Chang’an University, Xi’an 710064, China
*
Author to whom correspondence should be addressed.
Buildings 2022, 12(12), 2252; https://doi.org/10.3390/buildings12122252
Submission received: 24 November 2022 / Revised: 5 December 2022 / Accepted: 13 December 2022 / Published: 17 December 2022
(This article belongs to the Section Construction Management, and Computers & Digitization)

Abstract

:
The rapid development of energy consumption and carbon emissions in the construction industry poses an enormous and negative challenge for China’s energy and environment. While maintaining moderate economic growth, it is particularly important to realize energy conservation and carbon reduction. Carbon tax policy, a direct tool to reduce carbon emissions, can effectively alleviate the environmental issues caused by construction activities. However, relying solely on a single method is insufficient to handle the complicated circumstances of China’s construction industry. This study explores the influence of carbon tax on the construction industry through adjustments to tax rates via developing a Computable General Equilibrium (CGE) model. Then, it analyzes how the carbon tax affects the economic and environmental variables by designing scenarios for recycling tax revenue and improved energy efficiency. The results indicate that the carbon tax rate of 40 RMB/t-CO2 is the most appropriate. At this tax level, the negative impacts of energy demand and emissions reduction on macroeconomy and construction industry are minimized. It was also determined that carbon tax revenue recycling to households and sectoral investment will realize the “weak double dividend” effect on the construction industry. Furthermore, improving energy efficiency in the construction industry will demonstrate the additional advantages of carbon tax. This study serves as a theoretical foundation for the Chinese government to develop various energy strategies to achieve low-carbon development in the construction industry.

1. Introduction

One of the largest energy consumers, resulting in substantial greenhouse gas (GHG) emissions, is the construction industry [1,2]. Statistics from the International Energy Agency (IEA) indicate that, in 2020, the construction sector accounts for 36% of the worldwide terminal energy consumption, which is also responsible for 37% of energy-related carbon emissions. China’s construction sector is the second largest in the world in terms of energy consumption, accounting for 46.7% of China’s total energy consumption [3]. China’s construction industry has an energy conservation potential of up to 74%, which will generate over 50% of the energy conservation required to accomplish the projected peak carbon emission by 2030 [4]. Therefore, China’s ability to meet its commitment under the Paris Agreement to reach its peak GHG emissions by 2030 directly depends on reducing the use of fossil fuels and improving energy efficiency in the construction industry. With increasing pressure to address critical energy and environmental issues, the development of low-carbon construction while maintaining steady economic growth is a substantial challenge for China’s construction industry. To reduce carbon emissions from the construction industry, it is crucial to find effective emission reduction strategies and optimize the energy structure through carbon policy.
Most people agree that carbon tax is an effective price-based policy mechanism for addressing the issues with carbon emissions [5,6,7]. The fundamental justification is that the financial incentives provided by carbon tax can successfully motivate participants, which has a significant impact on emission reduction. Currently, more than 20 countries have implemented carbon tax policy, including the United Kingdom, France, the United States, etc. [8,9]. Their experience shows that carbon tax has decisive advantages in reducing carbon emissions.
Whether the carbon tax policy is a “booster” or “hindrance” to economic and social development, and whether it helps to alleviate the pressure to reduce emissions, has been the focus of intense political and academic debate in China [10,11]. However, a carbon tax on industries that consume different types and amounts of energy will have varying degrees of impact [12]. Specific issues need to be addressed and analyzed on a case-by-case basis. Therefore, for the industry to promote sustainable growth, it is crucial to explore how the carbon tax affects economic and environmental variables, and to implement it as effectively as possible. The construction industry, as a national economic pillar industry in China, is facing serious pressure to mitigate emissions and economic pressure under the circumstance of peak carbon emissions [13,14]. This paper focuses on exploring emissions reduction policies for the construction industry, and studies the impact of carbon tax on the economy and environment at the industry level.
Nevertheless, carbon tax has, at least for the short-term, led to an increase in related energy prices, thus affecting enterprises’ investment and households’ consumption to the detriment of economic growth and social welfare [15,16]. To achieve a balance between economic growth and climate change mitigation via optimizing carbon tax policy, many scholars have suggested environmental tax reforms and analyzed double dividends by recycling tax revenues to taxpayers [17,18]. As a kind of price-based environmental regulation policy, carbon tax policy will enable enterprises to internalize their external costs and promote innovative technologies to improve energy efficiency [19,20,21]. Energy efficiency improvement is considered an efficient way to mitigate potential negative consequences arising from the carbon tax [22,23,24]. Some scholars have found that, when a new technology improves energy efficiency, it stimulates consumers and producers to use more energy, and the structure may even lead to more energy consumption [25]. Focusing on carbon tax and improved energy efficiency simultaneously, whether the double dividend effect of the construction industry can be realized is an important point for the construction industry to propose green economy policies.
This study is focused on assessing the impact of carbon tax and improving energy efficiency in the construction industry and verifying whether it achieves a double dividend based on the environmental, economic, and welfare indicators derived from the analysis, and then to propose suggestions for improvement. At present, many studies have neglected to take into account the unique traits of different industries, resulting in a uniform carbon tax for multiple industries and failing to find an industry-specific carbon tax policy [26].
Therefore, we apply the CGE model to compile the social accounting matrix (SAM) table based on the 2017 input–output table to evaluate the impact of carbon tax implementation in China’s construction industry. In addition, this paper investigates the “double dividend” hypothesis from an industry perspective by designing three carbon tax recycling schemes. Considering the characteristics of energy consumption in the construction industry, this study also simulates scenarios for improving energy efficiency and suggests reasonable energy-saving measures for industrial upgrading, thus contributing to specifically targeted low-carbon development plans and progress directions. This study contributes to the existing literature in three ways. Firstly, from an industry perspective, this paper integrates economic indicators to the CGE model such as gross domestic product (GDP), energy consumption, and government transfer payments to residents. In addition, a carbon tax block is included to investigate how it might affect other factors like output and emission. Secondly, we consider the idea of imposing carbon tax while recycling tax revenues to the government, households, and sectoral investment to achieve a “double dividend”. Finally, the combination of energy efficiency improvement and carbon tax policy is analyzed to simulate the variation of carbon emissions, economic growth, and social welfare in the context of various energy efficiency scenarios, investigating how well this relationship works.
The paper is structured as follows: After the introduction in Section 1, Section 2 analyzed previous research about the effects of carbon tax. In Section 3, the paper provides the methodological specifications, the data sources employed and scenario design. The simulation results and discussion under these scenarios are presented in Section 4, while conclusions and recommendations for policymakers are summarized in Section 5. All the equations of the CGE model are introduced in Appendix A.

2. Literature Review

A carbon tax, imposed based on the carbon content or carbon emissions in fossil fuels [27], aims to alleviate global warming by reducing GHG emissions. With a carbon tax, it is easier to implement a tax-based pricing mechanism than total volume control and trading. The carbon tax concept was first studied in the late 1980s [28], and its taxation mechanism was frequently used in subsequent research [29,30,31]. Later theoretical assessments aimed to further improve the carbon tax using economic tools and applied it to a variety of countries, e.g., Denmark and Finland [32,33]. The study of carbon tax effects has become a popular topic in the field of energy economics.
The most frequently accepted argument for the carbon tax effect is that an increase in enterprise cost following the implementation causes a drop in energy demand and reduction in carbon emissions. For another, a carbon tax would depress consumer demand and result in a loss of economic growth [34,35,36]. Therefore, some scholars have attempted to test the double dividend hypothesis of the carbon tax, i.e., the potential for environmental and economic benefits by implementing a carbon tax policy and then reusing other existing taxes or tax allocations to mitigate negative effects [37,38]. However, there is still substantial disagreement among economists about the possibility of a double dividend, which deserves further study [39,40]. Furthermore, energy efficiency, a key factor in production, is an effective measure that can be utilized to mitigate the negative consequences of a carbon tax [17,41,42]. The price factor of a carbon tax will encourage enterprises to advance technology and enhance energy efficiency in order to reduce final energy use [43]. In recent years, scholars have primarily focused on the implementation of a carbon tax rather than on those combining tax with other policies [44,45]. Hence, this paper focuses on the combination of carbon tax collection, recycling, and energy efficiency improvement in China’s construction industry.
The impacts of carbon tax implementation have been studied in various other countries. According to a study by Wesseh and Lin [46], if Liberia enacts a carbon tax policy that reduces carbon emissions in the range of 20–50%, it will reap economic benefits in terms of energy, employment, and welfare. Carroll and Stevens [47] estimated the impact of a carbon tax on the U.S. power sector, which indicates that a USD 10 carbon tax would observably reduce carbon emissions and produce a net revenue of $10.647 to $118.33 billion. In China, extant studies on carbon tax rarely distinguish between different industries. Some researchers have applied carbon taxes only at the national level, ignoring the fact that different industries each have their own industrial characteristics [38,48]. Therefore, this paper, from the perspective of China’s construction industry, aims to enrich the studies measuring the impact of carbon tax.
The installation of a carbon tax in the construction industry will lead to a series of impacts. In general, the classical methods of measuring policy effects are to assume that carbon tax is implied and to compare actual and expected energy savings, ignoring the responses of residents and enterprises [49,50]. In contrast, the CGE models provide an efficient policy analysis tool for estimating the effects of a carbon tax via a system of joint cubic equations derived from the behavior of all participants in maximizing their own gains [51,52]. Furthermore, the model examines the variations in market supply, demand, prices, and amounts for commodities in the entire economic system, as well as their relationship to changes in exogenous variables. The model allows researchers to investigate the macroeconomic impact of the economic system’s transition from one equilibrium condition to another. Frequently, the CGE model is used in energy forecasts and policy assessment [53,54]. For instance, Sabine et al. [55] estimated the environmental and economic changes of carbon tax on Reunion Island. Moreover, the CGE model is widely used for carbon tax assessment, not only to determine the overall economic cost, but also for more in-depth sectoral analyses.
Existing studies have focused on respective studies on the impact of carbon tax and energy efficiency improvement on emissions reduction, while a few studies have combined carbon tax policy with energy efficiency improvement. Furthermore, it is challenging to identify how carbon tax affects different industries since many analyses ignore the construction industry’s heterogeneity and apply the same tax rate to all industries. To measure the carbon tax impact on China’s construction industry, the SAM table is used to obtain the database and the parameters designed in the model. Then, a set of equations for maximizing the benefits of all participants is established through the CGE model. Proposing the carbon tax for China’s construction industry through the tax implementation, rebate, and energy effects to improve living standards and energy efficiency while achieving energy conservation and emission reduction.

3. Methodology

3.1. CGE Model Specifications

A novel carbon tax CGE model for China’s construction sector was first established to investigate the socio-economic, energy, and environmental impacts of the carbon tax. As defined by Walras general equilibrium theory, this model assumes that all factors are in a stable equilibrium in which optimal demand equals optimal supply. Moreover, it is assumed that all participants optimize their behavior (e.g., minimizing production costs for enterprises and maximizing welfare for consumers). Household income (e.g., from the production process) is used for goods, services, investments, and savings. Government tax revenues are utilized for consumption, investment, and transfer payments. In order to capture the interactions among different sectors and economic agents, the model proposed in this paper mainly consists of production, income–expenditure, trade, macroscopic-closure and market-clearing, and social welfare blocks, as the general framework shown in Figure 1. In particular, the carbon tax block is especially introduced to clarify the impact of carbon tax policy shocks in the construction industry. The detailed formulas for each module are shown in Appendix A.

3.1.1. Production Block

Each sector’s production functions, which contain equations for the producer’s production factor supply, constraint, production, and optimization condition equations, describe how intermediate inputs, capital, labor, and energy are employed to manufacture outputs. As shown in Figure 2, the entire production process is divided into four layers, and the output is described by multiple nested Constant Elasticity of Substitution (CES), Cobb–Douglas technology (C–D), and Leontief function. The highest level is total output, which is defined by labor–capital–energy and intermediate inputs. The second level consists of two parts: one part is the composite labor–capital bundle and energy through the C–D function, and another is composite intermediate inputs through the Leontief function. Through the C–D function, the labor–capital bundle at the third level is formed by combining labor and capital products, while electricity and fossil energy form an energy bundle. At the base, fossil energy consists of coal, oil, and gas. The electricity products are a combination of thermal power and clean power. For instance, at the top level, total output uses a CES function that incorporates the composite labor–capital–energy bundle and intermediate inputs:
Q i = μ i Q ( δ L K E Q L K E i ρ i Q + δ U Q U i ρ i Q ) 1 ρ i Q
P L K E i P U i = δ L K E δ U ( Q U i Q L K E i ) 1 ρ i Q
where Qi represents the quantity of the energy composite. QLKEi and PLKEi represent the quantity and price of the composite labor–capital bundle, respectively. QUi and PUi represent the quantity and price of the intermediate inputs, respectively. μ i Q and ρ i Q is the scale parameter and the elastic substitution parameter in sector i. δLKE and δU represent the share parameter of the composite labor–capital–energy bundle and intermediate inputs in sector i, respectively.
Other levels apply C–D functions. For example, the combined function of electricity is the C–D function, which is composed of thermal power and clean power:
Q E L i = μ i E L · Q T P i ρ i E L · Q C P i 1 ρ i E L
where QELi is the quantity of the electricity composite; QTPi and QCPi are the quantity of thermal power and clean power composite, respectively; μ i E L and ρ i E L are the scale parameter and elastic substitution parameter of electricity in sector i.

3.1.2. Income–Expenditure Block

This block describes how commodities and capital flow from government and households to the rest of this system. Every participant spends or gains from other participants to keep a balanced relationship between them.
Households receive income through labor, profit from enterprises, and transfers from the government and abroad, while the expenditures cover commodity demands, direct tax, capital investment, and savings. For government, it receives revenues through a variety of taxes and payments from abroad, comprising taxes, which are equal to the sum of commodity consumption, various transfers, and savings. Thus, the total savings are comprised of government, households, and foreign savings. These savings become new share capital in the next period by being transferred to the current investment, proving that total savings are the engine of total investment.

3.1.3. Trade Block

In the complete system of economic activity, domestic products supply the domestic market and export. There are two main sources of domestic consumer goods: domestic products are manufactured for domestic sales and others are imported.
The trade block describes the behavior of domestic enterprises and consumers, where a given type of goods can be exported and imported at the same time. To address the two-way trade matter, we have adopted the Armington hypothesis, which treats imported and domestic goods as differentiated products. By employing CES functions, we stimulate domestic demand versus domestic production and imported commodity. In addition, the substitution of imported and domestic goods can be shown in the Armington function. The demand ratio between imports and domestic is shown in Equations (4)–(6). When modeling the process of transformation of total output in domestic and foreign markets, we employ the Constant Elasticity Transformation (CET) function, which describes the allocation of output in the domestic market. The supply ratio between the export and domestic is shown in Equations (7)–(9):
Q Q i = γ m i [ δ d i ( Q D i ) ρ m i + δ m i ( Q M i ) ρ m i ] 1 ρ m i
Q D i = [ ( γ m i ) ρ m i δ d i P Q i P D i ] 1 1 ρ m i Q Q i
Q M i = [ ( γ m i ) ρ m i δ m i P Q i ( 1 + t m i ) P M i ] 1 1 ρ m i Q Q i
Q A i = γ e i ( ξ d i Q D i ρ e i + ξ e i Q E i ρ e i ) 1 ρ e i
Q D i = [ ( γ e i ) ρ e i ξ d i ( 1 + t i n d i ) P A i P D i ] 1 1 ρ e i Q A i
Q E i = [ ( γ e i ) ρ e i ξ e i ( 1 + t i n d i ) P A i P E i ] 1 1 ρ e i Q A i
where QQi and PQi represent the domestic demand and price; QDi and PDi are the quantity and the price of domestic production commodities; QMi and PMi are the quantity and the price of imported commodities. γ m i and γ e i denote scale parameters of functions. δ d i and δ m i are domestic and import share parameters of production function. ρ m i and ρ e i are the exponent of the Armington function and Transformation function, respectively. t m i represents the tariff rate. QAi and PAi are the quantity and price of domestic distribution. QEi and PEi are the quantity and the price of exported commodities. ξ d i and ξ e i are domestic and export share parameters of production function in the functions. t i n d i is the indirect tax rate. i represents the set of domestically produced, imported, and exported commodities.

3.1.4. Macroscopic-Closure and Market-Clearing Block

On the grounds of Lewis’s theory, developing countries have the typical characteristics of capital shortage and labor surplus. Therefore, we adopted the Lewis closure into our model and consider three balance principles of macroscopic closure: international payments, government budget, and investment-saving balance. For the international payments balance, foreign savings is assumed exogenous while the exchange rate is endogenous. For the government budget balance, it can be achieved by accounting for the financial budget, where the consumption is exogenous and savings is endogenous. In terms of the investment-saving balance, investments are determined by savings, which are considered to be flexible and can be balanced with external investments.
Market clearing indicates that total supply is equal to total demand for different commodities, where two principles are assumed. The first is the composite commodities market, which suggests that composite goods are applied to consumption for both government and households, savings, and intermediate inputs. The second is the factors market, which means full employment. The model’s output must be viewed as the establishment of a new equilibrium following an economic shock because the model is static. Furthermore, the new equilibrium obtained by numerical simulation is the result of the combined effect of the various correlated markets.

3.1.5. Carbon Tax Block

The model assumes that a fossil fuel’s carbon emissions are proportional to its quantity. A carbon tax on fossil fuels is modeled as a consumption tax, which is based on their CO2 concentration. The imposition of tax increases fuel costs and encourages enterprises to enhance energy efficiency through technological advancements. This block is the basis for tax calculation. We assume that no tax is imposed on the final demand component, and the tax is only collected by the use of fossil energy as an intermediate input. The carbon tax is equal to the carbon emissions from all types of fossil energy multiplied by a specific tax rate for each unit of carbon emissions, which are calculated by Equations (10) and (11):
E N C O 2 ( P S ) = C C Q X E N ( C C , P S ) · e m f ( C C )
T X E N C O 2 = P C O 2 · P S E N C O 2 ( P S )
where ENCO2(PS) represents the total carbon tax, which is the sum of carbon tax for all i sectors; QXEN(CC, PS) is intermediate energy demand; emf(CC) denotes the carbon emission coefficient of fossil energy; TXENCO2 represents a carbon tax levied on fossil energy; and PCO2 is the carbon costs of different fossil fuels.

3.1.6. Social Welfare Block

Many various welfare indicator functions are analyzed for the social welfare impact of public policies, and the one more commonly used in the CGE model is the Hicks equivalent change, which is generally used to measure the impact on the social welfare of the population after the external policy shocks. Based on the commodity’s price to the execution of the policy, the Hicks equivalent change measures the change in the utility level of the consumer after the adoption of the policy:
E V = i P Q i b × Q H i s i P Q i b × Q H i b
where EV represents the Hicks equivalent change in consumer welfare; P Q i b is the market price of commodity i before the implementation of tax policy; Q H i b and Q H i s is the households’ consumption before and after the policy implementation, respectively.

3.2. Database and Parameters

The SAM table is expanded on the basis of China’s national input–output table (IOT), which shows the interrelationships between parts of the socioeconomic system and organizes the macro statistical framework with the micro market and institutional information. As such, it is used as the primary data source for the CGE model. The Chinese input and output table (2017) is used in this study to create the SAM table, and the China Statistical Yearbook (2018) and the China Financial Yearbook are the key sources of cash flow information between the various accounts in the SAM table (2017). The model is primarily calibrated using 2017 as the base year, and the 2017 IOT is composed of 149 sectors assembled into 10 sectors—namely, agriculture, industry, construction, transport, service, coal, oil and gas, thermal power, and clean power (see Table 1). In this study, the carbon emission coefficient and elasticity of substitution in the CGE model are determined from pertinent literature [56,57].

3.3. Scenario Design

Calculations for the carbon tax are based on carbon emissions from fossil fuels. Carbon tax, as a carbon emissions reduction policy instrument, is objective to decrease fossil fuel consumption and reduce carbon emissions by increasing fossil energy taxes. Different carbon tax rates have been implemented by numerous countries to reduce the use of fossil fuels. In the UK, carbon emissions are taxed at 7 EUR/t (~53 RMB/t-CO2), in Japan at 1400 JPY/t (~84 RMB/t-CO2), and in Australia at 21 AUD/t (~100 RMB/t-CO2) [56,58]. On the basis of the framework design study from the Chinese Ministry of Finance, the starting point for the carbon tax should start at 10 RMB/t-CO2, which may be increased to 40 RMB/t-CO2 by 2020. In addition, the Planning Institute of the Ministry of Environmental Protection recommends an initial rise to 20 RMB/t-CO2 and later an increase to 50 RMB/t-CO2. Guangzhou, Shenzhen, Shanghai, and Beijing all have carbon trading prices of 20, 30, 40, and 60 RMB/t-CO2. Energy trends, however, do not reveal any reduction in energy use or carbon emissions. As shown in Table 2, we propose to set carbon tax rates of 20, 40, 60, 80, and 100 RMB/t-CO2, and the carbon tax revenue is recycled to households and sectoral investment in the CGE model to verify whether “double dividend” in the construction industry exists. At the same time, scenarios of energy efficiency improvement are simulated to suggest energy-saving measures for upgrading enterprises. Table 2 shows the scenario design for the CGE model simulations in the study.

4. Results and Discussion

4.1. The Impact of Carbon Tax on the Construction Industry

As shown in Figure 3, carbon emissions, output, and energy demand of the construction industry show a significant downward trend due to the implementation of the carbon tax. With the carbon tax rate gradually increasing from 20 to 100 RMB/t-CO2, the reduction of carbon emissions, output, and energy demand in the construction industry increased from 1.75%, 0.396%, and 1.855% to 7.002%, 1.854%, and 8.254%. Carbon emissions and energy demand dropped the most, since coal and oil are both crucial to the inputs of construction industry, accounting for a high percentage of total energy consumption structure. A carbon tax is based on the carbon content of fossil fuels. The imposition of carbon tax on the construction industry would increase the energy’s cost and price, driving enterprises to use less high-carbon and expensive energy, leading to a significant reduction of fossil energy demand and carbon emissions.
It was discovered through a comparison of various tax rate conditions that the impact of output loss increased with the carbon tax rate. There is a minor difference in the decline of construction output, when the carbon tax rate is 20–40 RMB/t-CO2. The total output, however, drops sharply when the tax rate is between 60 RMB/t-CO2 and 100 RMB/t-CO2. This is because a tax on carbon emissions will lead to higher energy costs and prices, which will reduce energy demand and, to some extent, affect the manufacture of products by enterprises, leading to a significant reduction in industrial output. The fossil fuel industry, especially coal, is essential to the construction industry. The primary factor is that coal is cheaper than other forms of energy, and that the carbon monoxide it produces during burning can be used as a reducing agent. However, a carbon tax would lead to higher costs and prices for coal and oil, and lower output of the construction industry.

4.2. The Impact of Carbon Tax on Macroeconomy

4.2.1. Macroeconomic Indicators

This paper analyzes the macroeconomic impact after the carbon tax imposition on the construction industry, specifically in terms of carbon emissions, total investment, total output, GDP, and social welfare.
Figure 4 shows that carbon emissions and total output have significantly decreased, while GDP and social welfare also show a decreasing trend. This finding is consistent with Shi et al. [58], who found that the implementation of carbon tax policy will inhibit economic and social welfare to some extent. While carbon tax will force enterprises to substitute essential components for energy inputs, the low elasticity of substitution of top-level production results in modest benefits in terms of labor and capital income, which are insufficient to offset the negative economic effects as a whole. In contrast to these indicators, total construction investment climbed marginally, owing to increasing demand for construction items because of urbanization. Furthermore, the rise in energy costs increased construction investment. As the increasing carbon tax rate from 80 to 100 RMB/t-CO2, the emissions reduction increases from 13.970% to 16.491%, but the reduction of total output, GDP, and social welfare rise from 2.783%, 1.253%, and 0.998% to 3.139%, 1.574%, and 1.234%, respectively, indicating that high-priced carbon tax will have significant passive consequences on macroeconomic indicators and related industries. As shown in Figure 4, while the total carbon emissions decline dramatically during the implementation of the carbon tax, GDP and social welfare decline less. Although the carbon tax does not realize a double dividend effect, the loss of GDP and social welfare is smaller than the amount of carbon emissions reduction. Therefore, compared to previous studies, the loss of GDP and social welfare caused by the implementation of carbon tax may be exaggerated.
To elucidate the impact of various carbon taxes on carbon emissions reduction and macroeconomy, this paper introduces the macroeconomic elasticity value of carbon emissions reduction as an evaluation index [59]. This index can reflect the relationship between carbon emissions reduction and macroeconomic indicators brought on by various carbon taxes, so as to determine how to strike a balance between maximizing emissions reduction and decreasing unfavorable macroeconomic impact. The following are an expression of the macroeconomic elasticity of carbon emissions reduction:
γ 1 = carbon   emissions   reduction   rate / total   investment   growth   rate
γ 2 = carbon   emissions   reduction   rate / total   output   decline   rate
γ 3 = carbon   emissions   reduction   rate / GDP   decline   rate
γ 4 = carbon   emissions   reduction   rate / social   welfare   decline   rate
Under different carbon tax rates, the greater the macroeconomic elasticity index of carbon emissions reduction, the smaller the relative macroeconomic loss and the greater the comprehensive benefit. As shown in Figure 5, when the carbon tax is 40 RMB/t-CO2, the elasticity index reaches its maximum value, representing the optimal socio-economic benefit and an obvious emissions reduction effect. Therefore, the most appropriate carbon tax rate for the construction industry is 40 RMB/t-CO2. When the carbon tax rate is between 20–40 RMB/t-CO2, the macroeconomic elasticity values γ2 and γ3 trend similarly, with an upward trend. This indicates that the passive impact on GDP and total output is less than the growth rate of carbon emissions reduction. When the carbon tax rate is between 40–80 RMB/t-CO2, γ1 and γ2 fall rapidly, suggesting that macroeconomic growth is more pronounced than carbon reduction with an increased carbon tax. When the carbon tax is between 80–100 RMB/t-CO2, the negative impact will be too large to be promoted as a current policy. γ4 trends suggest that social welfare will rise slightly with an increase in the carbon tax and then fall rapidly.

4.2.2. Energy Demand

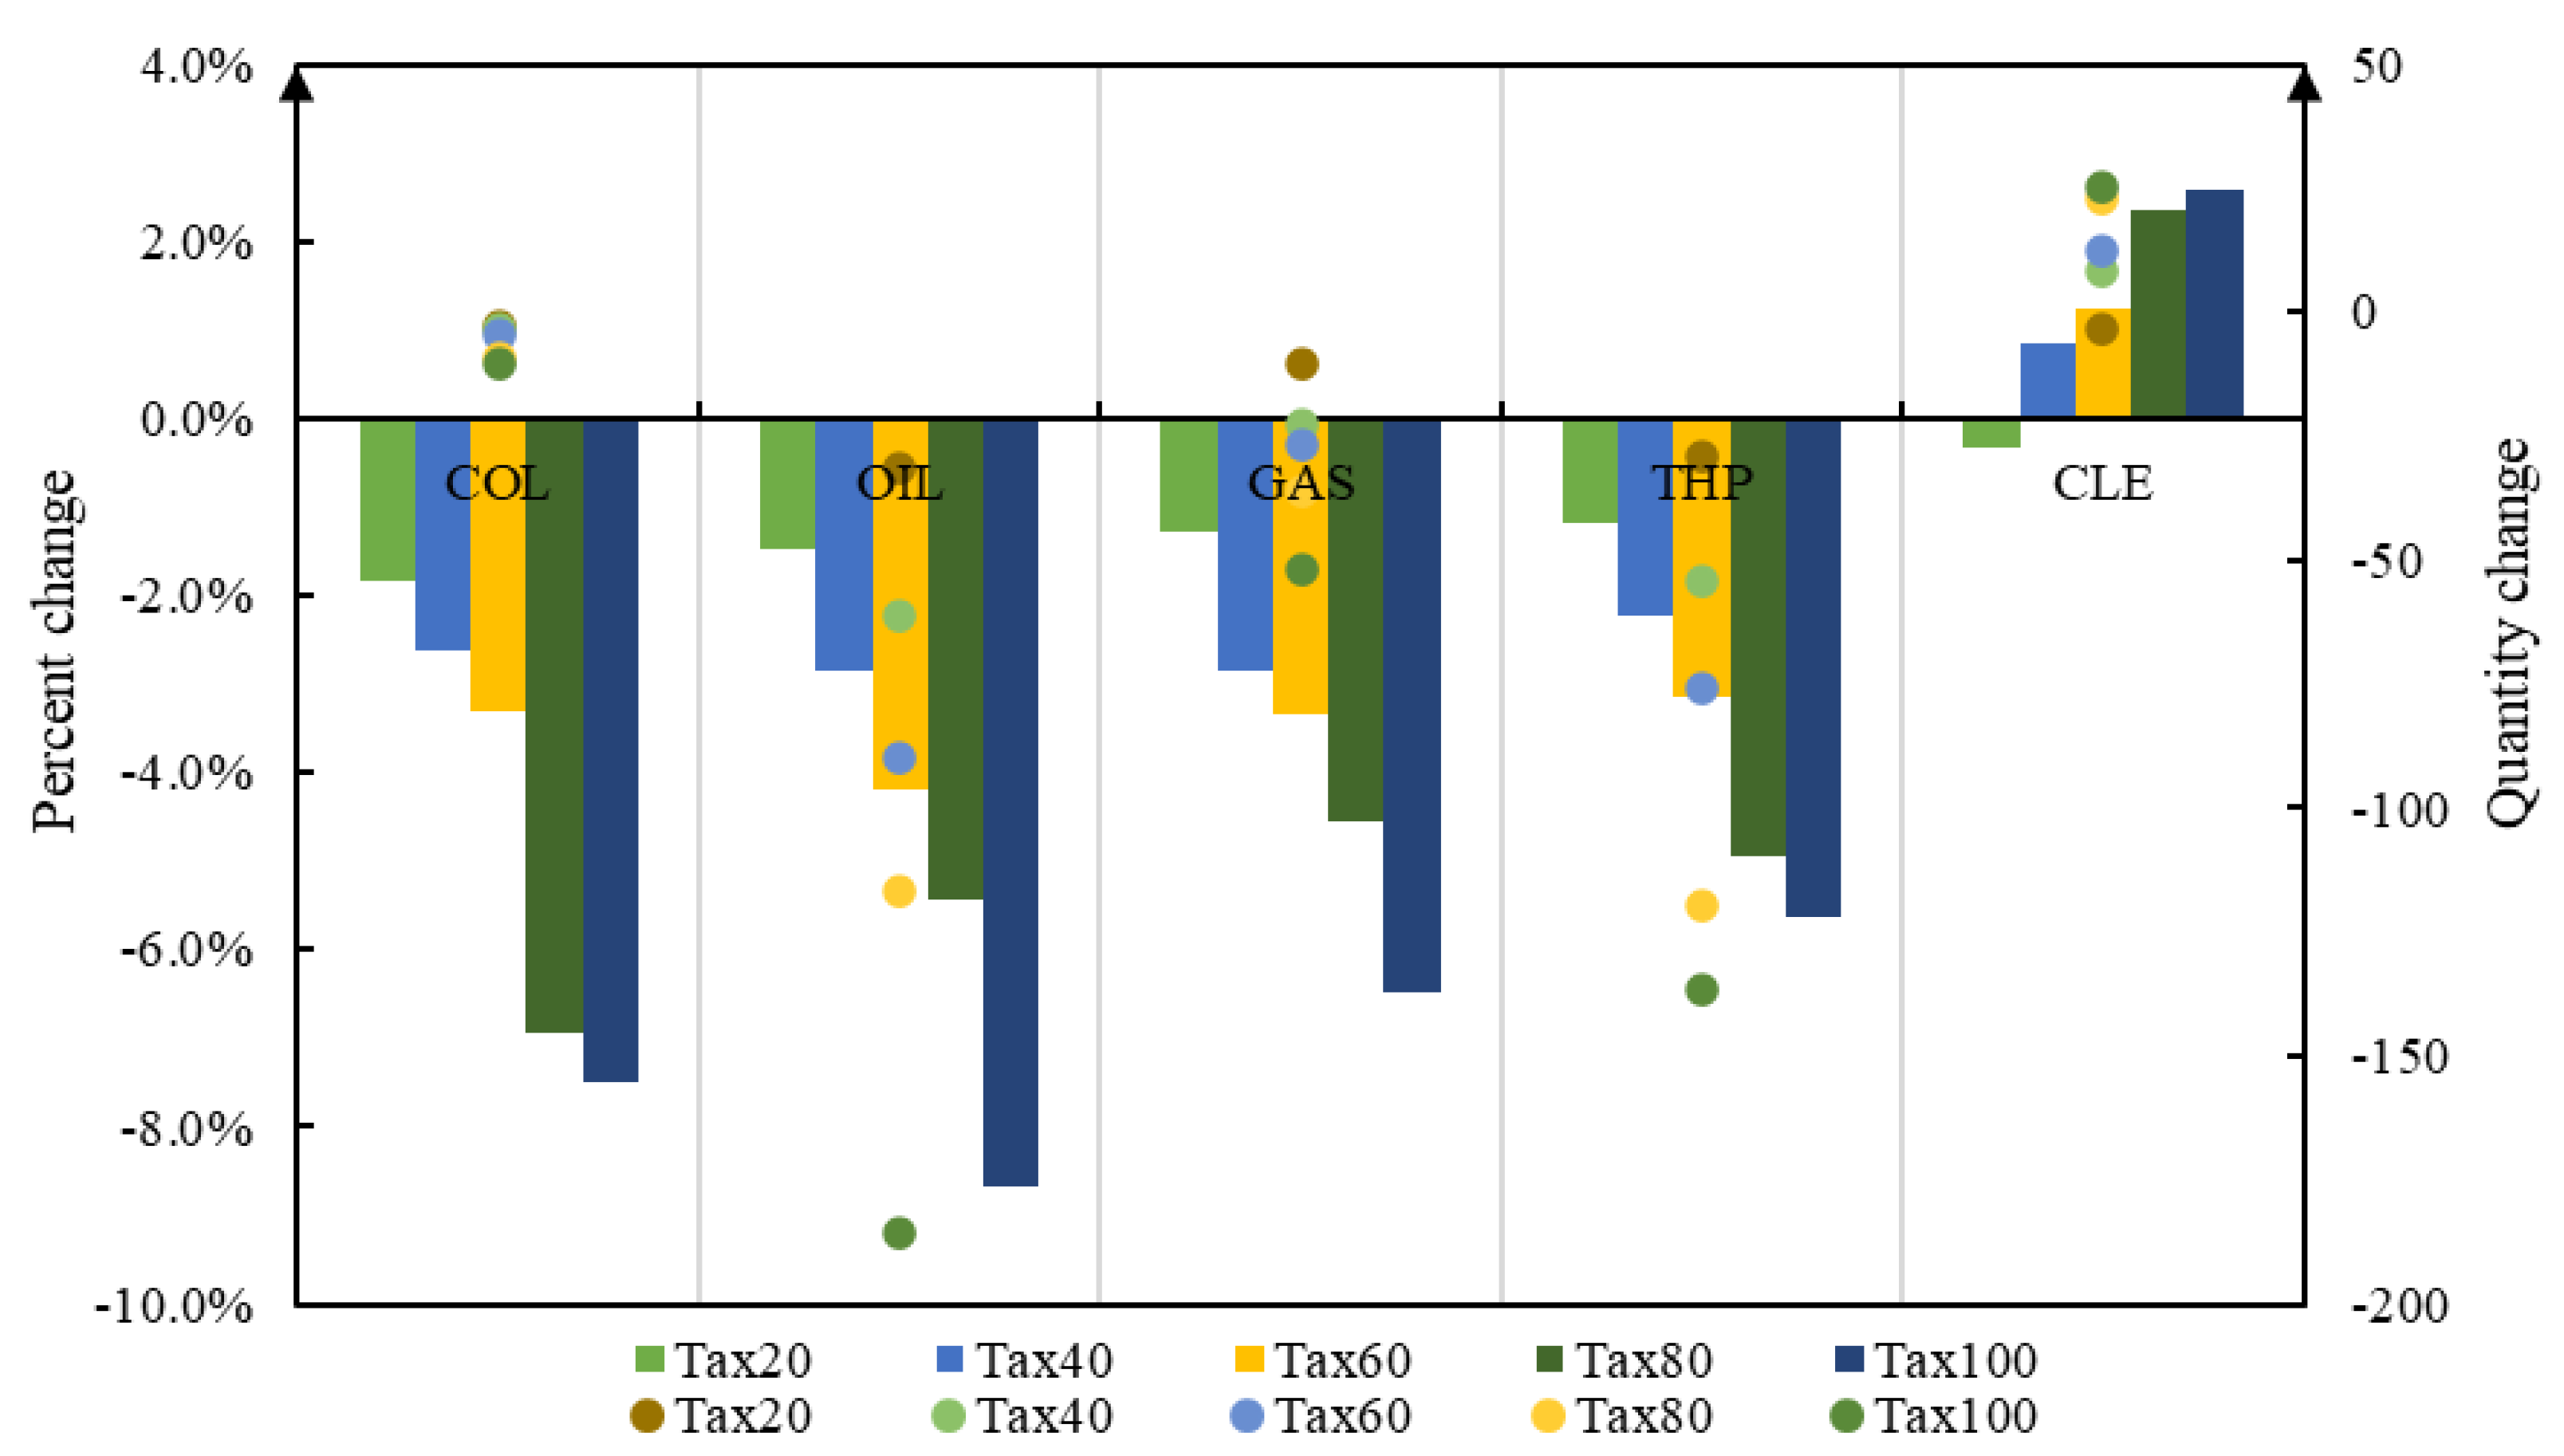
Figure 6 shows the relative and absolute impact on energy demand after the carbon tax. When the carbon tax increases from 20 to 100 RMB/t-CO2, the trends in absolute energy demand impact are broadly consistent with the relative impact, demand for oil decreases by 1.468–8.659%, coal decreases by 1.847–7.496%, natural gas decreases by 1.281–6.486%, and thermal power decreases by 1.189–5.620%. Conversely, clean power demand grows from −0.347% to 2.573%. This finding is consistent with those reported in other papers [57], who revealed that the clean power industry would enjoy the most obvious positive impacts following the imposition of carbon tax. In the construction industry, enterprises prefer low-cost oil to relatively expensive and inconvenient gas. When applying the same carbon tax rate on coal, oil, natural gas, clean power, and thermal power, this magnitude of emission reduction for various fossil energy may be influenced by the carbon tax rate and fossil fuel price; this magnitude of emission reduction for various fossil energy may be influenced by the carbon tax rate and fossil fuel price. Carbon tax is based on the carbon content of the fuel. Because of the high carbon content of oil, a carbon tax policy can have a drastic effect on the price of oil, causing enterprises to reduce oil demand in order to cut costs.
As a secondary energy source, thermal power does not produce direct carbon emissions, but it does produce significant indirect carbon emissions in the production process, resulting in carbon tax that indirectly affects thermal power demand. In addition, energy prices have risen, forcing enterprises to reduce their usage of fossil fuels to cut costs, resulting in an increased demand for clean power. Therefore, a separate carbon tax rate could be implemented for various energy species to encourage the use of clean and renewable energy across society and reduce carbon emissions.

4.2.3. Sector Impacts

Figure 7 shows the changes in carbon emissions generated by each sector after the implementation of carbon tax on construction sector. In general, carbon emissions decreased significantly across sectors, especially in the energy sectors. With an increasing carbon tax, the coal sector decreases sharply from −6.749% to −25.560%. This may be due to the significantly different emission factors of various fossil fuel energy sources, with coal having the highest emission factor. This is followed by the reduction in carbon emissions from −4.784% to −18.395% in the industry sector, which is significantly greater than in agriculture, construction, transportation, and services. We found that the carbon tax on the construction industry not only follows the “law of increasing marginal emissions”, i.e., the higher the carbon tax rate, the higher the reduction capacity and marginal reduction capacity of the carbon tax. At the same time, carbon tax on construction industry also obviously affects the linkage industries with close connection, and the closer the connection with the construction industry, the more obvious the emission reduction effect. This finding is in agreement with Zhao et al. [60], who revealed that a higher carbon price is helpful for enterprises taking some measures to reduce carbon emissions.
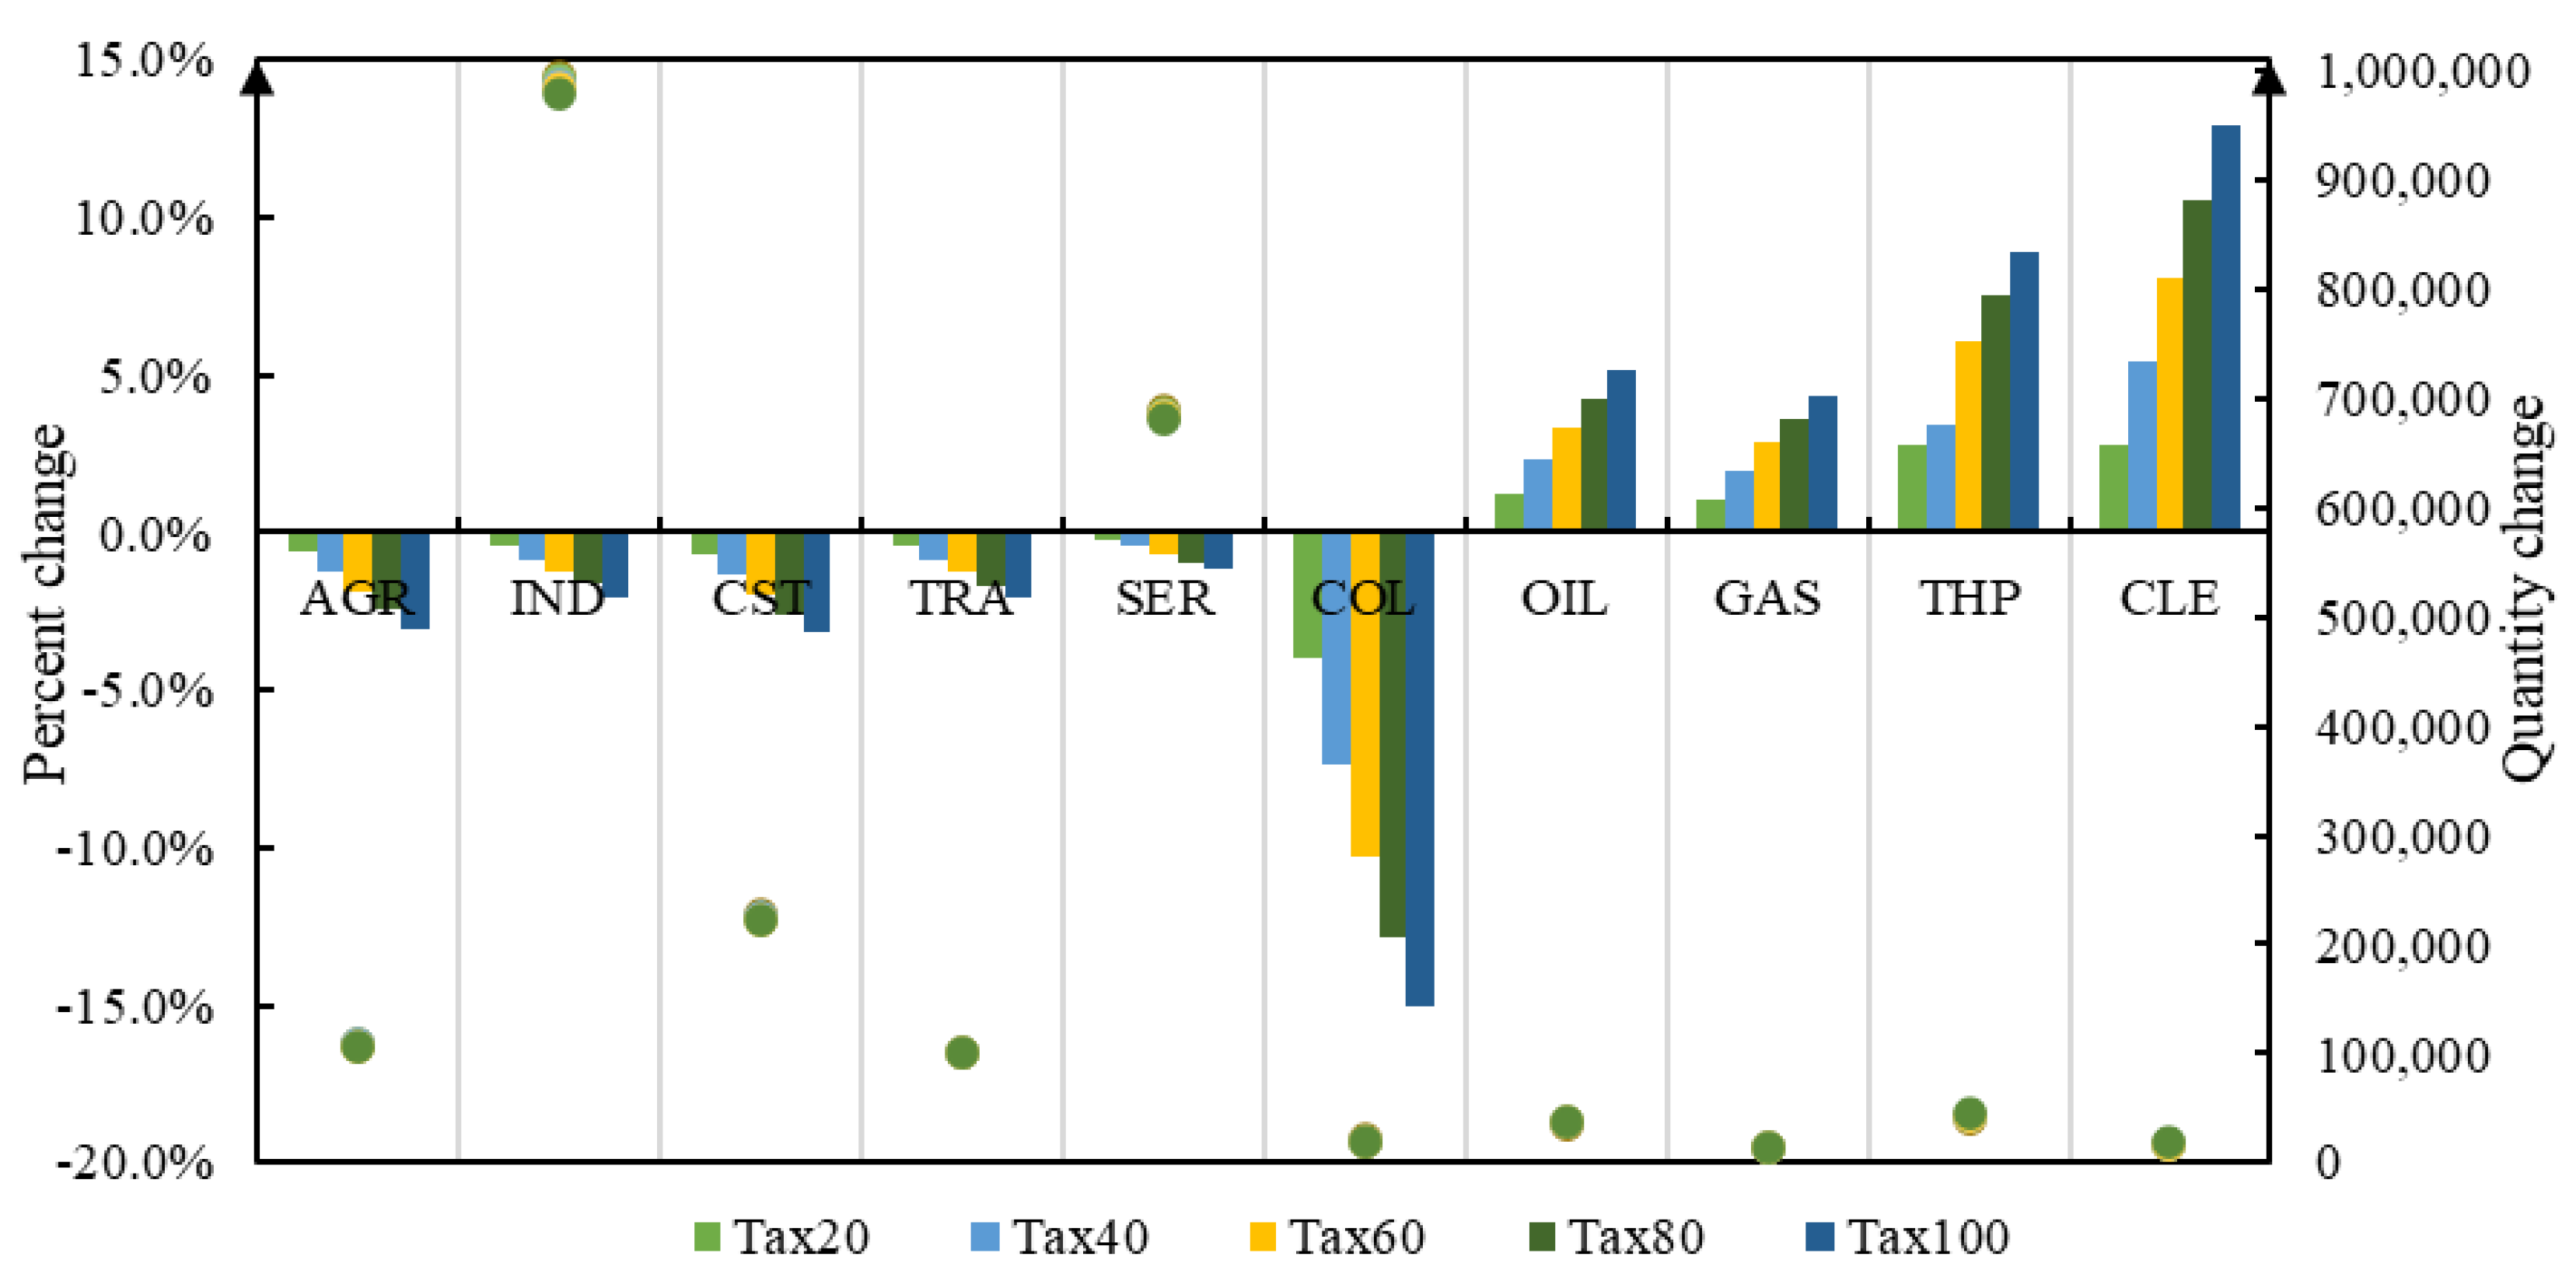
Figure 8 shows the impact of the construction industry’s carbon tax on the output of all sectors. As the carbon tax rises to 100 RMB/t-CO2, the output of the agriculture, industry, construction, transportation, and services sector show different decreasing trends, from −0.647%, −0.431%, −0.678%, and −0.434%, and −0.231% to −3.043%, −2.030%, −3.166%, −2.056%, and −1.193%. The coal sector, on the other hand, shows a significant drop in output from −3.971% to −15.070%. As opposed to the coal sector, the oil, natural gas, thermal power, and clean power sectors show a significant increase in output. The reason for this situation may be that the imposition of carbon tax causes enterprises to abandon coal with high carbon emissions and choose other energy sources with relatively low carbon emissions for alternative production. Meanwhile, due to the increased cost of carbon tax in the construction industry, the industry will directly generate increased costs and reduced production. Coal, the upstream industry of the construction sector, will cause significant production cuts in terms of output. The finding gains support from Chan and Zhao [61], who revealed that industry-level carbon tax will have asymmetric spillover effects on other related industries. Energy-intensive sectors will also suffer from the cost impact of energy price volatility, which will experience some degree of production reduction.
Combined with Figure 7 and Figure 8, it can be determined that the collection of a carbon tax on the construction industry can effectively reduce the carbon emissions of relevant departments. However, a carbon tax will also cause losses to their output value, especially in the coal sector, which is mainly dependent on energy for construction industry. The consumption of coal would be significantly impacted by a carbon tax. With an increased carbon tax, enterprises will be forced to reduce the use of coal and substitute it with other energy sources to reduce energy costs.

4.3. The Impact of Carbon Tax Revenue Recycling

The aforementioned findings imply that a carbon tax can successfully cut carbon emissions while also reducing the consumption of fossil fuels. However, the national economy, particularly social welfare, will dramatically decline. The carbon tax revenue recycling impact signifies how carbon tax gains are recycled in various ways to assist reduce economic expenses [56]. In order to realize revenue neutrality and reduce the passive socioeconomic impact, three scenarios are designed to model the impact of recycling tax revenue at an acceptable tax rate of 60 RMB/t-CO2 (Table 2).
The findings demonstrate that recycling carbon tax revenues not only mitigate the negative macroeconomic impacts but also improve energy efficiency and emissions control. Compared to the scenario without revenue recycling (Recy1), Recy2 scenario can mitigate the GDP loss and social welfare loss from 0.948% and 0.757% to 0.890% and 0.497%, respectively. Meanwhile, the energy demand and carbon emissions reduction respectively increase from 5.233% and 11.141% to 4.990% and 10.950%. In the Recy3 scenario, total output and GDP decrease to 0.842% and 0.833%, respectively, and the change in social welfare decreases from subtractive to 0.235% (Table 3).
The decrease in the price of most commodities in the recycling scenario is the primary reason for the increase in social welfare compared to the Recy1 scenario. Costs associated with carbon emissions and energy use rise as a result of carbon tax, resulting in increased manufacturing costs and commodity prices. Tax relief for households and sectoral investment, on the other hand, will lower manufacturing costs to some extent, which is a fundamental driver of dropping prices and a rebound in households’ consumption willingness [38]. In the sector investment, there are some stakeholders that adopt sustainability, such as low-carbon enterprises. Although the imposition of carbon tax increases energy prices, low enterprises’ economic loss would be minimal. Conversely, the recycling of carbon tax revenues into sector investments is an additional subsidy for low-carbon enterprises, which enhances the incentive for stakeholders to continue to adopt sustainability and directly stimulates a virtuous cycle of low-carbon production in the construction industry [62]. The recycling carbon tax scenario, as opposed to the Recy1 scenario, better realizes the double dividend mechanism of economic and social welfare, and can be a useful low-carbon policy tool.

4.4. The Impact of Improving Energy Efficiency

Carbon tax, as the previous results illustrate, can boost the cost of energy, applying to it a more expensive element of production. This will push up the cost of production for businesses, resulting in the reduction of enterprises’ production. To improve energy efficiency and reduce energy consumption, enterprises will also implement energy-saving technologies, especially in China where the price elasticity of demand for energy sources such as coal and oil is still relatively high. Therefore, in this paper, three scenarios are designed to simulate the impact of improving energy efficiency based on a tax rate of 60 RMB/t-CO2.
Table 4 shows the changes in the social subjects as a result of the increase in energy efficiency. By advancing technology, enterprises increase their energy utilization efficiency to 15% and significantly lower their carbon emissions from 7.790% to 20.510%. Compared to the Tax60 scenario, GDP, household income (HY), household savings (HS), and total investment (TINV) show a large upward trend, from 1.922%, 2.097%, and 1.318%, and 2.281% to 5.010%, 5.473%, 5.152%, and 5.960%, respectively. Meanwhile, household demand (HD), government revenue (GY), and government savings (GS) slightly increase. In contrast, government consumption (GC) declined from −1.259% to −3.252%.
From an environmental perspective, when energy efficiency is gradually improved, carbon emissions shift significantly, going from −7.790% to −20.510%. The reason is that improving energy efficiency efficaciously reduces the amount of fossil energy used, which results in a decrease in carbon emissions. However, at the same time, there is a potential risk that the improved energy efficiency will encourage the consumption of fossil energy, lower the cost of products, and to a certain extent restrain the use of cleaner energy. Carbon tax policies, which are levied on fossil energy, can avoid this risk and promote the industry’s demand for clean energy. Therefore, the combination of improved energy efficiency instrument and carbon tax policy should be used to make up for each other’s shortcomings, and achieve the promotion of cleaner energy use on the basis of reducing carbon emissions.
From a macro perspective, most economic participators derive some benefit from improving energy efficiency, as do households. To some extent, GS, as the carbon tax collector, will increase more tax revenue, leading to the associated TINV rising as well. Additionally, as government transfers to local welfare, households’ lives are also improved. This phenomenon arises because the carbon tax pushes companies to invest more in technology and increase the efficiency of energy use by improving the level of energy-related technologies, which increases output in all sectors and thus increases aggregate social demand.
All macroeconomic and welfare indicators increase in varying degrees. The results of the model show that the overall economy grows, although GC is declining. The macroeconomic impact of energy technology progress is positive, as shown in Table 4. Therefore, improving energy efficiency is of great practical significance for decreasing energy consumption and carbon emissions, while maintaining macroeconomic growth.

5. Conclusions and Policy Recommendations

5.1. Conclusions

The construction industry is a representative energy-intensive industry, leading to excessive resource consumption, rising environmental pollution, and carbon emissions. Under the dual pressure of energy and environment, how to maintain stable economic growth while developing a low-carbon construction industry is an urgent issue to be solved. Carbon tax is a promising tool to address the carbon emissions issue in China. However, most literature focuses on how the carbon tax affects the macroeconomic environment as a whole. The construction industry has unique characteristics with different impact mechanisms and outcomes. To estimate the impact of the carbon tax on the construction sector, macroeconomy, and social welfare, a CGE model is established in this paper. Meanwhile, three carbon tax revenue recycling schemes and energy efficiency improvement schemes are designed, respectively, to reduce the passive impact of a carbon tax on the macroeconomy and social welfare. The main conclusions of the implementation of carbon tax on the construction industry in China include:
(1) Carbon tax on the construction industry has a key role to play in reducing energy demand and carbon emissions in China. In addition, the higher the carbon tax rate, the lower the energy demand and carbon emissions. From the perspective of economic cost and emissions reduction, the carbon tax suitable for the construction industry is 40 RMB/t-CO2.
(2) Carbon tax has significant negative effects on the macroeconomy, households’ welfare, and output in numerous sectors, and the economic and welfare costs of carbon emissions reduction cannot be ignored. Moreover, the proper carbon tax rates vary depending on the category of energy. Coal and oil should be subject to higher carbon tax rates due to their higher carbon emissions, whereas clean energy sources should be subject to lower carbon tax rates.
(3) The “weak double dividend” effect of carbon tax is achieved by tax revenue recycling for households and sectoral investment. When carbon tax revenues are recycled to households and sectoral investment, the negative macroeconomy and social welfare consequences of carbon tax are greatly minimized. At the same time, additional energy savings and carbon reduction effects can be achieved.
(4) The carbon tax, along with the improvement of energy efficiency, can effectively reduce the economic and welfare costs of carbon emissions reduction and maintain moderate economic growth, increasing the welfare of the population, and the negative impact on the output of various production sectors is small, potentially producing a “double dividend” effect. The policy combination can suppress the output of high-emission sectors and have a positive effect on the optimization of the industrial structure, while promoting the development of clean power and strengthening the substitution of clean power for other energy sources.

5.2. Policy Recommendations

(1) The government should take industrial heterogeneity into account when drafting policies, and formulate carbon tax policies suitable for different industries. Given that the demand impact is a significant factor for a carbon tax to inhibit the development of the construction industry, it is crucial to pay attention to this effect and combine macro-political advice from the government with self-regulatory market mechanisms to reduce the loss.
(2) To lessen opposition to a carbon tax on construction industry, tax neutrality should be followed. In other words, carbon tax should be combined with tax revenue recycling strategy. When concentrating on social effects, the policy of combining a carbon tax with revenue recycling, returning to households and sectors’ investment through transfer payments, is more effective.
(3) Improving energy efficiency is critical to achieving a carbon-neutral country. Adoption of the latest energy technologies in the construction industry must be actively encouraged. Revenues from a carbon tax can be an effective means to promote the development of energy technology. This requires increased investment in energy-related science and technology research and development, especially to improve coal processing and conversion efficiency and clean utilization, accelerate clean energy development and utilization, and enhance the proportion of non-fossil energy in energy consumption.
The approach adopted in this paper has the advantage of applying the CGE model to accurately depict the impact of a carbon tax on the construction industry, which is highly dependent on fossil energy. In particular, the tax revenues’ recycling scenarios are utilized to achieve revenue neutrality for the government and boost energy efficiency. However, there are still certain limitations in which the model simplifies the market environment, which can be somewhat different from the actual situation, and it does not take dynamic influences into account, such as time. Therefore, we will continue the following points in our future research work. Firstly, subsequent studies should further accurate calibration of the parameters and introduce a dynamic CGE model to further combine the long and short-term impacts of carbon tax policy with energy efficiency improvement in the construction industry. Secondly, China’s economic system is relatively complex. To better match the characteristics of China’s economy, more policy tools should be considered to explore a successful combination of carbon emissions reduction and economic growth policies, promoting the sustainable development of China’s green economy.

Author Contributions

Conceptualization, Q.D. and Y.D.; Methodology, Y.D. and J.L.; Validation, Y.D. and L.B.; Writing—original draft preparation, Y.D.; Writing—review and editing, Y.D., J.L. and Y.Z.; Visualization, Y.D.; Supervision, Q.D. and Y.Z.; Project administration, L.B. All authors have read and agreed to the published version of the manuscript.

Funding

The research was funded by the National Natural Science Foundation of China (Grant No. 72171025), the Social Science Foundation of Shaanxi province (Grant No. 2020R008), the General Foundation for Soft Science of Shaanxi province (Grant No. 2022KRM012), the Foundation for Youth Innovation Team of Shaanxi Universities (Grant No. 21JP010), the Fundamental Research Funds for the Central Universities (Grant No. 300102231640), and the Youth Innovation Team of Shaanxi Universities.

Institutional Review Board Statement

Not applicable.

Informed Consent Statement

Not applicable.

Data Availability Statement

Not applicable.

Conflicts of Interest

The authors declare no conflict of interest.

Appendix A.

Appendix A.1. Production Block

U ( P S ) = ( X ( P S ) A P ( P S ) ) ( β ( P S ) A P ( P S ) C X ( P S ) P U ( P S ) ) s p ( P S )
P U ( P S ) = C C Q X ( C C , P S ) P C ( C C ) U ( P S )
V ( P S ) = ( X ( P S ) A P ( P S ) ) ( γ ( P S ) A P ( P S ) C X ( P S ) P V ( P S ) ) s p ( P S )
P V ( P S ) = ( 1 A V ( P S ) ) ( W γ L ( P S ) ) γ l ( P S ) ( R γ k ( P S ) ) γ k ( P S )
Q X ( C C , P S ) = u t ( C C , P S ) U ( P S )
P X ( P S ) = C C v t ( P S , C C ) P Q ( C C )
L ( P S ) = γ L ( P S ) P V ( P S ) V ( P S ) W
K ( P S ) = γ K ( P S ) P V ( P S ) V ( P S ) R
C X ( P S ) = A P ( P S ) 1 ( P S β ( P S ) s p ( P S ) P U ( P S ) 1 s p ( P S ) + γ ( P S ) s p ( P S ) P V ( P S ) 1 s p ( P S ) ) 1 1 s p ( P S )
U E N ( P S ) = u t 1 ( P S ) U ( P S )
U N E N ( P S ) = u t 2 ( P S ) U ( P S )
U N E N ( C C , P S ) = ( U E N ( P S ) A P E N ( P S ) ) ( β ( C C , P S ) A P E N ( P S ) C X E N ( P S ) P Q X E N ( P S ) ) s p e n ( P S )
Q X N E N ( C C , P S ) = u t n e n ( C C , P S ) U N E N ( P S )
P Q X E N ( C C ) = P C ( C C ) + P C O 2 e m f ( C C )
C X E N ( P S ) = A P ( P S ) 1 ( C C β ( C C , P S ) s p ( P S ) P Q X E N ( C C ) 1 s p e n ( P S ) ) 1 1 s p e n ( P S )

Appendix A.2. Income–Expenditure Block

H C ( C C ) = α h ( C C ) H Y P C ( C C )
G C ( C C ) = α g ( C C ) G Y P C ( C C )
C C P C ( C C ) H C ( C C ) + H S = W L S + R K S
G Y = P S r p t ( P S ) P X ( P S ) X ( P S ) + C C r d c t ( C C ) P Q D ( C C ) Q D ( C C ) + D T + T X E N C O 2
H S = s g H Y
G S = s g G Y
T S A V = H S + G S
I N V ( C C ) = α i ( C C ) T I N V P C ( C C )
I N V S = i v s T I N V
I N V F = T I N V C C P C ( C C ) I N V ( C C ) I N V S

Appendix A.3. Trade Block

Q ( C C ) = P S v t ( P S , C C ) X ( P S )
Q D ( C C ) = ( Q ( C C ) A T ( C C ) ) ( ε ( C C ) A T ( C C ) P Q ( C C ) P Q D ( C C ) ) s t ( C C )
E X P ( C C ) = ( Q ( C C ) A T ( C C ) ) ( ( 1 ε ( C C ) ) A T ( C C ) P Q ( C C ) P E X P ( C C ) ) s t ( C C )
Q D ( C C ) = ( Q ( C C ) A A ( C C ) ) ( δ ( C C ) A A ( C C ) P C ( C C ) P Q D ( C C ) ) s a ( C C )
I M P ( C C ) = ( Q C ( C C ) A A ( C C ) ) ( ( 1 δ ( C C ) ) A A ( C C ) P C ( C C ) P I M P ( C C ) ) s a ( C C )
P I M P ( C C ) = E X R w p i ( C C )
P C ( C C ) Q C ( C C ) = P Q D ( C C ) Q D ( C C ) + P I M P ( C C ) I M P ( C C )
P Q ( C C ) = ( 1 A T ( C C ) ) ( ε ( C C ) s t ( C C ) P Q D ( C C ) 1 s t ( C C ) + ( 1 ε ( C C ) ) s t ( C C ) P E X P ( C C ) 1 s t ( C C ) ) 1 1 s t ( C C )
P Q ( C C ) = P Q D ( C C )
P C ( C C ) = ( 1 A A ( C C ) ) ( δ ( C C ) s a ( C C ) P Q D ( C C ) 1 s a ( C C ) + ( 1 δ ( C C ) ) s a ( C C ) P I M P ( C C ) 1 s a ( C C ) ) 1 1 s a ( C C )
P Q D ( C C ) = P E X P ( C C )
P E X P ( C C ) = P Q D ( C C )
P E X P ( C C ) = E X R w p e ( C C )

Appendix A.4. Macroscopic-Closure and Market-Clearing Block

Q C ( C C ) = P S Q X ( C C , P S ) + H C ( C C ) + G C ( C C ) + I N V ( C C ) + S C ( C C )
C C P E X P ( C C ) E X P ( C C ) = C C P I M P ( C C ) I M P ( C C ) + I N V F
T I N V = T S A V
P S L ( P S ) = L S
P S K ( P S ) = K S
S C ( C C ) = α s ( C C ) I N V S P C ( C C )
( 1 i t ( P S ) ) P X ( P S ) = C X ( P S )
B T = C C P S v t ( P S , C C ) C X ( P S ) 1 i t ( P S ) X ( P S ) + C C P I M P ( C C ) I M P ( C C ) P S C C P C ( C C ) Q X ( C C , P S ) C C P C ( C C ) ( H C ( C C ) + G C ( C C ) + I N V ( C C ) + S C ( C C ) ) C C P E X P ( C C ) E X P ( C C )
G D P = C C P S P Q ( C C ) v t ( P S , C C ) X ( P S ) P S C C P C ( C C ) Q X ( C C , P S )

Appendix A.5. Carbon Tax Block

E N C O 2 ( P S ) = C C Q X E N ( C C , P S ) e m f ( C C )
T C O 2 = P S E N C O 2 ( P S )
P C C O 2 ( C C , P S ) = P C O 2
T X E N C O 2 = P C O 2 P S E N C O 2 ( P S )
T X C O 2 = P C O 2 P S ( E N C O 2 ( P S ) F P ( P S ) )

References

  1. Xu, G.; Wang, W. China’s Energy Consumption in Construction and Building Sectors: An Outlook to 2100. Energy 2020, 195, 117045. [Google Scholar] [CrossRef]
  2. Pradhan, B.K.; Ghosh, J. A Computable General Equilibrium (CGE) Assessment of Technological Progress and Carbon Pricing in India’s Green Energy Transition via Furthering Its Renewable Capacity. Energy Econ. 2022, 106, 105788. [Google Scholar] [CrossRef]
  3. Cheng, M.; Lu, Y.; Zhu, H.; Xiao, J. Measuring CO2 Emissions Performance of China’s Construction Industry: A Global Malmquist Index Analysis. Environ. Impact Assess. Rev. 2022, 92, 106673. [Google Scholar] [CrossRef]
  4. Price, L.; Khanna, N.; Zhou, N. Reinventing Fire: China-the Role of Energy EffiCiency in China’s Roadmap to 2050. Presqu’ile Giens (Hyeres Fr.) 2018, 38. [Google Scholar]
  5. Wang, Y.; Wang, F. Production and Emissions Reduction Decisions Considering the Differentiated Carbon Tax Regulation across New and Remanufactured Products and Consumer Preference. Urban Clim. 2021, 40, 100992. [Google Scholar] [CrossRef]
  6. Ding, J.; Chen, W.; Wang, W. Production and Carbon Emission Reduction Decisions for Remanufacturing Firms under Carbon Tax and Take-Back Legislation. Comput. Ind. Eng. 2020, 143, 106419. [Google Scholar] [CrossRef]
  7. Zepeda-Gil, C.; Natarajan, S. A Review of “Green Building” Regulations, Laws, and Standards in Latin America. Buildings 2020, 10, 188. [Google Scholar] [CrossRef]
  8. Luo, R.; Zhou, L.; Song, Y.; Fan, T. Evaluating the Impact of Carbon Tax Policy on Manufacturing and Remanufacturing Decisions in a Closed-Loop Supply Chain. Int. J. Prod. Econ. 2022, 245, 108408. [Google Scholar] [CrossRef]
  9. Luo, W.; Zhang, Y.; Gao, Y.; Liu, Y.; Shi, C.; Wang, Y. Life Cycle Carbon Cost of Buildings under Carbon Trading and Carbon Tax System in China. Sustain. Cities Soc. 2021, 66, 102509. [Google Scholar] [CrossRef]
  10. Levi, S. Why Hate Carbon Taxes? Machine Learning Evidence on the Roles of Personal Responsibility, Trust, Revenue Recycling, and Other Factors across 23 European Countries. Energy Res. Soc. Sci. 2021, 73, 101883. [Google Scholar] [CrossRef]
  11. Mardones, C. Pigouvian Taxes to Internalize Environmental Damages from Chilean Mining—A Computable General Equilibrium Analysis. J. Clean. Prod. 2022, 362, 132359. [Google Scholar] [CrossRef]
  12. Lin, B.; Jia, Z. The Energy, Environmental and Economic Impacts of Carbon Tax Rate and Taxation Industry: A CGE Based Study in China. Energy 2018, 159, 558–568. [Google Scholar] [CrossRef]
  13. He, J.; Yue, Q.; Li, Y.; Zhao, F.; Wang, H. Driving Force Analysis of Carbon Emissions in China’s Building Industry: 2000–2015. Sustain. Cities Soc. 2020, 60, 102268. [Google Scholar] [CrossRef]
  14. Li, B.; Han, S.; Wang, Y.; Li, J.; Wang, Y. Feasibility Assessment of the Carbon Emissions Peak in China’s Construction Industry: Factor Decomposition and Peak Forecast. Sci. Total Environ. 2020, 706, 135716. [Google Scholar] [CrossRef]
  15. Andersson, J.J. Carbon Taxes and CO2 Emissions: Sweden as a Case Study. Am. Econ. J. Econ. Policy 2019, 11, 1–30. [Google Scholar] [CrossRef] [Green Version]
  16. Freire-González, J.; Martinez-Sanchez, V.; Puig-Ventosa, I. Tools for a Circular Economy: Assessing Waste Taxation in a CGE Multi-Pollutant Framework. Waste Manag. 2022, 139, 50–59. [Google Scholar] [CrossRef] [PubMed]
  17. Feng, C.; Chang, K.; Lin, J.; Lee, T.; Lin, S. Toward Green Transition in the Post Paris Agreement Era: The Case of Taiwan. Energy Policy 2022, 165, 112996. [Google Scholar] [CrossRef]
  18. Matti, S.; Nässén, J.; Larsson, J. Are Fee-and-Dividend Schemes the Savior of Environmental Taxation? Analyses of How Different Revenue Use Alternatives Affect Public Support for Sweden’s Air Passenger Tax. Environ. Sci. Policy 2022, 132, 181–189. [Google Scholar] [CrossRef]
  19. Xu, B.; Xu, R. Assessing the Role of Environmental Regulations in Improving Energy Efficiency and Reducing CO2 Emissions: Evidence from the Logistics Industry. Environ. Impact Assess. Rev. 2022, 96, 106831. [Google Scholar] [CrossRef]
  20. Cheng, Y.; Sinha, A.; Ghosh, V.; Sengupta, T.; Luo, H. Carbon Tax and Energy Innovation at Crossroads of Carbon Neutrality: Designing a Sustainable Decarbonization Policy. J. Environ. Manag. 2021, 294, 112957. [Google Scholar] [CrossRef]
  21. Ren, S.; Hu, Y.; Zheng, J.; Wang, Y. Emissions Trading and Firm Innovation: Evidence from a Natural Experiment in China. Technol. Forecast. Soc. Chang. 2020, 155, 119989. [Google Scholar] [CrossRef]
  22. Yue, X.; Peng, M.Y.; Khalid, M.; Nassani, A.A.; Haffar, M.; Zaman, K. The Role of Carbon Taxes, Clean Fuels, and Renewable Energy in Promoting Sustainable Development: How Green Is Nuclear Energy? Renew. Energy 2022, 193, 167–178. [Google Scholar] [CrossRef]
  23. Yunzhao, L. Modelling the Role of Eco Innovation, Renewable Energy, and Environmental Taxes in Carbon Emissions Reduction in E−7 Economies: Evidence from Advance Panel Estimations. Renew. Energy 2022, 190, 309–318. [Google Scholar] [CrossRef]
  24. Zalejska-Jonsson, A.; Lind, H.; Hintze, S. Energy-Efficient Technologies and the Building’s Saleable Floor Area: Bust or Boost for Highly-Efficient Green Construction? Buildings 2013, 3, 570–587. [Google Scholar] [CrossRef] [Green Version]
  25. Du, H.; Chen, Z.; Zhang, Z.; Southworth, F. The Rebound Effect on Energy Efficiency Improvements in China’s Transportation Sector: A CGE Analysis. J. Manag. Sci. Eng. 2020, 5, 249–263. [Google Scholar] [CrossRef]
  26. Ramadhani, D.P.; Koo, Y. Comparative Analysis of Carbon Border Tax Adjustment and Domestic Carbon Tax under General Equilibrium Model: Focusing on the Indonesian Economy. J. Clean. Prod. 2022, 377, 134288. [Google Scholar] [CrossRef]
  27. Lin, B.; Li, X. The Effect of Carbon Tax on per Capita CO2 Emissions. Energy Policy 2011, 39, 5137–5146. [Google Scholar] [CrossRef]
  28. Pearce, D. The Role of Carbon Taxes in Adjusting to Global Warming. Econ. J. 1991, 101, 938. [Google Scholar] [CrossRef]
  29. Freeman, G.M.; Drennen, T.E.; White, A.D. Can Parked Cars and Carbon Taxes Create a Profit? The Economics of Vehicle-to-Grid Energy Storage for Peak Reduction. Energy Policy 2017, 106, 183–190. [Google Scholar] [CrossRef]
  30. Zhang, Y.; Qi, L.; Lin, X.; Pan, H.; Sharp, B. Synergistic Effect of Carbon ETS and Carbon Tax under China’s Peak Emission Target: A Dynamic CGE Analysis. Sci. Total Environ. 2022, 825, 154076. [Google Scholar] [CrossRef]
  31. Povitkina, M.; Carlsson Jagers, S.; Matti, S.; Martinsson, J. Why Are Carbon Taxes Unfair? Disentangling Public Perceptions of Fairness. Glob. Environ. Chang. 2021, 70, 102356. [Google Scholar] [CrossRef]
  32. Shobande, O.A.; Shodipe, O.T. Carbon Policy for the United States, China and Nigeria: An Estimated Dynamic Stochastic General Equilibrium Model. Sci. Total Environ. 2019, 697, 134130. [Google Scholar] [CrossRef] [PubMed]
  33. Bruvoll, A.; Larsen, B.M. Greenhouse Gas Emissions in Norway: Do Carbon Taxes Work? Energy Policy 2004, 32, 493–505. [Google Scholar] [CrossRef] [Green Version]
  34. Jiang, H.D.; Liu, L.J.; Deng, H.M. Co-Benefit Comparison of Carbon Tax, Sulfur Tax and Nitrogen Tax: The Case of China. Sustain. Prod. Consum. 2022, 29, 239–248. [Google Scholar] [CrossRef]
  35. Hu, H.; Dong, W.; Zhou, Q. A Comparative Study on the Environmental and Economic Effects of a Resource Tax and Carbon Tax in China: Analysis Based on the Computable General Equilibrium Model. Energy Policy 2021, 156, 112460. [Google Scholar] [CrossRef]
  36. Khastar, M.; Aslani, A.; Nejati, M. How Does Carbon Tax Affect Social Welfare and Emission Reduction in Finland? Energy Reports 2020, 6, 736–744. [Google Scholar] [CrossRef]
  37. Kula, E.; Evans, D. Dual Discounting in Cost-Benefit Analysis for Environmental Impacts. Environ. Impact Assess. Rev. 2011, 31, 180–186. [Google Scholar] [CrossRef]
  38. Kirchner, M.; Sommer, M.; Kratena, K.; Kletzan-Slamanig, D.; Kettner-Marx, C. CO2 Taxes, Equity and the Double Dividend—Macroeconomic Model Simulations for Austria. Energy Policy 2019, 126, 295–314. [Google Scholar] [CrossRef]
  39. Freire-González, J. Environmental Taxation and the Double Dividend Hypothesis in CGE Modelling Literature: A Critical Review. J. Policy Model. 2018, 40, 194–223. [Google Scholar] [CrossRef]
  40. Speck, S. Environmental Tax Reform and the Potential Implications of Tax Base Erosions in the Context of Emission Reduction Targets and Demographic Change. Econ. Polit. 2017, 34, 407–423. [Google Scholar] [CrossRef]
  41. Zhao, A.; Wang, J.; Sun, Z.; Guan, H. Environmental Taxes, Technology Innovation Quality and Firm Performance in China—A Test of Effects Based on the Porter Hypothesis. Econ. Anal. Policy 2022, 74, 309–325. [Google Scholar] [CrossRef]
  42. Dadzie, J.; Runeson, G.; Ding, G.; Bondinuba, F.K. Barriers to Adoption of Sustainable Technologies for Energy-Efficient Building Upgrade-Semi-Structured Interviews. Buildings 2018, 8, 57. [Google Scholar] [CrossRef] [Green Version]
  43. Du, Q.; Han, X.; Li, Y.; Li, Z.; Xia, B.; Guo, X. The Energy Rebound Effect of Residential Buildings: Evidence from Urban and Rural Areas in China. Energy Policy 2021, 153, 112235. [Google Scholar] [CrossRef]
  44. Dumortier, J.; Elobeid, A. Effects of a Carbon Tax in the United States on Agricultural Markets and Carbon Emissions from Land-Use Change. Land Use Policy 2021, 103, 105320. [Google Scholar] [CrossRef]
  45. Fu, Y.; Huang, G.; Liu, L.; Zhai, M. A Factorial CGE Model for Analyzing the Impacts of Stepped Carbon Tax on Chinese Economy and Carbon Emission. Sci. Total Environ. 2021, 759, 143512. [Google Scholar] [CrossRef]
  46. Wesseh, P.K.; Lin, B. Environmental Policy and ‘Double Dividend’ in a Transitional Economy. Energy Policy 2019, 134, 110947. [Google Scholar] [CrossRef]
  47. Carroll, D.A.; Stevens, K.A. The Short-Term Impact on Emissions and Federal Tax Revenue of a Carbon Tax in the U.S. Electricity Sector. Energy Policy 2021, 158, 112526. [Google Scholar] [CrossRef]
  48. Malerba, D.; Gaentzsch, A.; Ward, H. Mitigating Poverty: The Patterns of Multiple Carbon Tax and Recycling Regimes for Peru. Energy Policy 2021, 149, 111961. [Google Scholar] [CrossRef]
  49. Xiang, D.; Lawley, C. The Impact of British Columbia’s Carbon Tax on Residential Natural Gas Consumption. Energy Econ. 2019, 80, 206–218. [Google Scholar] [CrossRef]
  50. Liu, J.; Bai, J.; Deng, Y.; Chen, X.; Liu, X. Impact of Energy Structure on Carbon Emission and Economy of China in the Scenario of Carbon Taxation. Sci. Total Environ. 2021, 762, 143093. [Google Scholar] [CrossRef]
  51. Wing, I.S. Computable General Equilibrium Models for the Analysis of Economy–environment Interactions. Res. Tools Nat. Resour. Environ. Econ. 2011, 9, 255–306. [Google Scholar] [CrossRef]
  52. Guo, Z.; Li, T.; Shi, B.; Zhang, H. Economic Impacts and Carbon Emissions of Electric Vehicles Roll-out towards 2025 Goal of China: An Integrated Input-Output and Computable General Equilibrium Study. Sustain. Prod. Consum. 2022, 31, 165–174. [Google Scholar] [CrossRef]
  53. Weng, Y.; Chang, S.; Cai, W.; Wang, C. Exploring the Impacts of Biofuel Expansion on Land Use Change and Food Security Based on a Land Explicit CGE Model: A Case Study of China. Appl. Energy 2019, 236, 514–525. [Google Scholar] [CrossRef]
  54. Li, Y.; Su, B. The Impacts of Carbon Pricing on Coastal Megacities: A CGE Analysis of Singapore. J. Clean. Prod. 2017, 165, 1239–1248. [Google Scholar] [CrossRef]
  55. Sabine, G.; Avotra, N.; Olivia, R.; Sandrine, S. A Macroeconomic Evaluation of a Carbon Tax in Overseas Territories: A CGE Model for Reunion Island. Energy Policy 2020, 147, 111738. [Google Scholar] [CrossRef]
  56. Zhou, Y.; Fang, W.; Li, M.; Liu, W. Exploring the Impacts of a Low-Carbon Policy Instrument: A Case of Carbon Tax on Transportation in China. Resour. Conserv. Recycl. 2018, 139, 307–314. [Google Scholar] [CrossRef]
  57. Guo, Z.; Zhang, X.; Zheng, Y.; Rao, R. Exploring the Impacts of a Carbon Tax on the Chinese Economy Using a CGE Model with a Detailed Disaggregation of Energy Sectors. Energy Econ. 2014, 45, 455–462. [Google Scholar] [CrossRef]
  58. Shi, Q.; Ren, H.; Cai, W.; Gao, J. How to Set the Proper Level of Carbon Tax in the Context of Chinese Construction Sector? A CGE Analysis. J. Clean. Prod. 2019, 240, 117955. [Google Scholar] [CrossRef]
  59. Dannenberg, A.; Mennel, T.; Moslener, U. What Does Europe Pay for Clean Energy?—Review of Macroeconomic Simulation Studies. Energy Policy 2008, 36, 1318–1330. [Google Scholar] [CrossRef] [Green Version]
  60. Zhao, X.; Xue, Y.; Ding, L. Implementation of Low Carbon Industrial Symbiosis Systems under Financial Constraint and Environmental Regulations: An Evolutionary Game Approach. J. Clean. Prod. 2020, 277, 124289. [Google Scholar] [CrossRef]
  61. Chan, Y.; Zhao, H. Optimal carbon tax rates in a dynamic stochastic general equilibrium model with a supply chain. Econ. Model. 2022, 119, 106109. [Google Scholar] [CrossRef]
  62. Du, Q.; Yan, Y.; Huang, Y.; Hao, C.; Wu, J. Evolutionary Games of Low-Carbon Behaviors of Construction Stakeholders under Carbon Taxes. Int. J. Environ. Res. Public Health 2021, 18, 508. [Google Scholar] [CrossRef]
Figure 1. The framework of the CGE model.
Buildings 12 02252 g001
Figure 2. The framework of production block.
Buildings 12 02252 g002
Figure 3. Impact of carbon tax on the construction industry.
Buildings 12 02252 g003
Figure 4. Impact on macroeconomy indicators.
Buildings 12 02252 g004
Figure 5. Changing trend of macroeconomic elasticity value of carbon emissions reduction.
Buildings 12 02252 g005
Figure 6. The relative and absolute impact on energy demand.
Buildings 12 02252 g006
Figure 7. The variation of carbon emissions of all sectors.
Buildings 12 02252 g007
Figure 8. The variation of outputs of all sectors.
Buildings 12 02252 g008
Table 1. Description of sector classification.
No.Abbr.SectorsDescription
1AGRAgricultureAgriculture, forestry, animal husbandry and fishing industry
2INDIndustryManufacture of metal and non-metallic ore mining, chemical, machinery products, etc.
3CSTConstructionBuilding construction
4TRATransportationTransportation, warehousing and post
5SERServiceCulture, entertainment, health, education, information technology, service, etc.
6COLCoalMining and processing of coal
7OILOilExtraction of petroleum
8GASGasExtraction of natural gas
9THPThermal powerCoal, gas, gasoline, diesel and other fuels generate power to generate electricity
10CLEClean powerProduction and supply of clean power
Table 2. Scenarios for CGE model simulation.
ScenariosDescriptionCarbon Tax Rate
(RMB/t-CO2)
BAU--
Tax20The carbon tax rate is set as 20 RMB/t-CO220
Tax40The carbon tax rate is set as 40 RMB/t-CO240
Tax60The carbon tax rate is set as 60 RMB/t-CO260
Tax80The carbon tax rate is set as 80 RMB/t-CO280
Tax100The carbon tax rate is set as 100 RMB/t-CO2100
Recy1No tax revenue recycling, the carbon tax on construction revenue is considered a government fiscal revenue60
Recy2Recycling of carbon tax revenue to households60
Recy3Recycling of carbon tax revenue to households and sectoral investment60
IEE5%Improving energy efficiency by 5%60
IEE10%Improving energy efficiency by 10%60
IEE15%Improving energy efficiency by 15%60
Table 3. Impacts of different scenarios on macroeconomy and social variables.
VariablesPercentage Changes from Carbon Tax Exemption (%)
Recy1Recy2Recy3
Energy demand−5.233%−4.990%−4.245%
Carbon emissions−11.141%−10.950%−10.759%
Total output−0.951%−0.897%−0.842%
GDP−0.948%−0.890%−0.833%
Social welfare−0.757%−0.497%−0.235%
Table 4. Impacts of different scenarios on macroeconomy and social variables.
VariablesPercentage Changes from Improving Energy Efficiency (%)
IEE5%IEE10%IEE15%
GDP1.922%3.575%5.010%
HY2.097%3.903%5.473%
HD1.044%1.952%2.748%
HS1.318%2.713%5.152%
GY0.245%0.430%0.572%
GC−1.259%−2.331%−3.252%
GS0.245%0.430%0.572%
TINV2.281%4.249%5.960%
ENCO2−7.790%−14.569%−20.510%
Publisher’s Note: MDPI stays neutral with regard to jurisdictional claims in published maps and institutional affiliations.

