Article

Flexural Behavior of RC Beams with an Abrupt Change in Depth: Experimental Work

by
Sabry Fayed
1,
Emrah Madenci
2 and
Yasin Onuralp Özkılıç
2,*
1
Civil Engineering Department, Faculty of Engineering, KafrELShiekh University, KafrELShiekh 33511, Egypt
2
Department of Civil Engineering, Necmettin Erbakan University, 42090 Konya, Turkey
*
Author to whom correspondence should be addressed.
Buildings 2022, 12(12), 2176; https://doi.org/10.3390/buildings12122176
Submission received: 26 October 2022 / Revised: 20 November 2022 / Accepted: 5 December 2022 / Published: 8 December 2022
(This article belongs to the Special Issue New and Future Progress for Concrete Structures)

Abstract

:
The most crucial components in the case of roofs with two levels or a variable floor height are variable depth beams. In order to investigate the flexural behavior of reinforced concrete (RC) beams with varying depths under static loads, experimental research was conducted. Under the four-point bending flexural test, two reference beams with constant depth, six dapped beams at the soffit, and four dapped beams at the top were tested. For all beams with a 150 mm depth, a 100 mm increase in depth occurred at the middle span of the beams. The primary characteristics included the impact of increasing depth, the impact of stirrups’ absence and their various ratios, and the characteristics of the longitudinal bars at the locations of sudden depth changes in either the top or bottom bars. Both the cracks’ progression and the load-deflection relationship along the beam’s length were observed. The ultimate carrying load (Pu) was reduced by 23.56% and 27.35% as a result of the 100 mm increase in the half-span of the beam over the constant depth in case of changes at the top and soffit, respectively. The Pu was increased by a ratio ranging from 20.9% to 31.35% for the bottom dapped beams and by a ratio of 29.79% for the top dapped beams due to the various stirrup ratios in the dapped area. The ductility was significantly impacted by the elevated stirrup ratios in the dapped area. The predicted results and the experimental results matched when the Pu of the tested beams was evaluated using the strut and tie model.

1. Introduction

Dapped terminated beams and dapped beams at middle distance were used to categorize RC beams with a change in depth. The first type (dapped-end beams) [1,2,3,4,5] has been the subject of extensive research, but the second type (dapped beams at middle distance) has not yet been induced. Dapped terminated beams were employed in precast concrete constructions [1,6] because the slabs or the beams were manufactured on the columns or the corbels [7]. The late 20th century saw a rise in the use of these structures. Unexpected changes in the section result in zones of non-uniform stress distribution or a disruption in the flow, cutting off the flow of internal stresses [8]. These areas were named the moniker troubled region (D-Region). Traditional design techniques were not appropriate for these beams because the internal stress flow in the transition zones is extremely complicated. The strut and tie method (STM) [9,10,11,12,13,14] is one of the most well-known techniques for designing these beams. According to Figure 1, the nib flexure crack, direct shear fracture, re-entrant corner crack, nib inclined crack, and diagonal tension crack are the failure modes of dapped-end beams. Due to the disruption in the flow of the stresses around the discontinuities, discontinuities cause the sudden change areas caused by concentrated loads, also known as disturbed regions. It was investigated how disturbed sections including corbels, dapped-end beams, beams with apertures, and deep beams may be analyzed and designed using straightforward strut and tie models [15]. The disturbed regions of RC structures can be effectively analyzed and designed using the STM [16]. An experimental study looked at the impact of the stirrups, the bending shape of the longitudinal reinforcement, and the height of the dapped end on the shear capacity of RC dapped ended beams [17]. The findings demonstrated that the longitudinal bending reinforcement and inclined stirrups had a stronger impact on the shear resistance than the vertical stirrups. A review article [18] prompted numerous experimental studies to be conducted in order to investigate the structural behavior of RC-dappled end beams and to determine the impact of various loading configurations, self-compacting concrete types, and shear span-to-effective depth ratio values. Numerous experimental study variables were examined, including the quantity of nib reinforcements, primary flexural reinforcements, and the type of concrete used in the dapped-end area [19]. The ultimate load increased by 46.7% and 62.2% as the main flexural reinforcement and nib reinforcement amounts increased, respectively. Additionally, as the compressive strength of the beams increased, so did their shear strength for beams with dapped ends. The stiffness and maximum capacity increased with a lower shear span to depth (a/d) ratio of the dapped terminated beams [20]. The effects of the a/d ratio were also studied by Lu et al. [21], Ahmed et al. [22] and Hussain and Shakir [23].
Additionally, the impacts of fiber-reinforced concrete on the behavior of dapped-end beams were studied by Nordbrden et al. [24], Fu [25], Mohamed and Elliott [26], Zamri et al. [27], and Mihaylov et al. [28]. The strengthening of the dapped-end beams with various techniques was also studied by Gemi et al. [5], Aksoylu et al. [1], Özkılıç et al. [4], Gold et al. [29], Taher [30,31], and Tan [32].
The bar surface characteristics, bar diameter, concrete cover, development length, and the quantity of transverse reinforcement all affect the bond strength between the bars and the concrete. The bond strength of the spliced bars in the beams is strongly influenced by the transverse reinforcement. In comparison to steel bars of the same size with a moderate rib area, the transverse reinforcement in RC beams with a large relative rib area produced more advantageous improvements in the bond force [33]. The STM has been used by many researchers to examine the shear and flexural strengths of RC elements [34,35]. The strength of reinforced concrete deep beams was calculated using a strut-and-tie-based approach [36]. The strength of reinforced concrete pile toppers was calculated using a strut-and-tie model technique [37]. Experimental research on the crack pattern of straightforward RC beams subjected to flexural loads was conducted [38].

2. Research Significance

Some roofs have two levels due to design demands. In this instance, most structural designers used column and/or beam supports at the level difference to resolve the issue. As a result, RC beams with variable depth are needed as a structural element in this instance. Furthermore, investigations on RC beams with changing depth throughout the span are very limited. The compression side or the beam soffit are also possible locations for the depth modification. Many parameters can affect the behavior of these beams. As a result, the main goals of this research are to examine the effects of altering the depth of the beam, the configuration of the longitudinal tension and compression bars, and the number of stirrups close to the change in depth on the capacity and ductility of the beams.

3. Experimental Program

3.1. Specimen Details

Twelve reduced-scale RC beams (half-scale models) were tested in the experimental program. According to the Egyptian Code of Practice (ECP203-2017) [39], the RC beams were designed. In order to prevent shear failure, the specimens were strengthened against shear. Furthermore, the beams were made to collapse in the flexure in the middle part. All specimens were tested under a four-point bending test. The two control specimens (B0 and B0 *) had a constant depth (150 mm) while the remaining ten RC beams had two different depths (150 mm and 250 mm). The length of all beams was 1800 mm. The width and depth of the control beams were 80 mm and 150 mm, respectively. As shown in Figure 2, these two beams were strengthened with 2D12 mm (where D is the bar diameter) on the tension side and 2D8 mm in the compression side. While the stirrups of the middle third of each beam varied, the stirrups of the two shear spans were 8 mm@56.25 mm; B0 *’s middle stirrups were 8 mm@200 mm, and B0’s middle third was stirrup-free.
The change in depth for the other beams happened in the middle of the span. Six beams (group G1) underwent this alteration from the beam soffit, while the remaining four beams underwent it from the top (group G2). The cross-sectional dimensions of each beam were identical. The depth of each beam had two heights, 150 mm and 250 mm, and the width of each beam was 80 mm. The depth of the right half span was 150 mm, and the depth of the left half span was 250 mm. In other words, the depth of the beams increased by 100 mm in the center of the span. The beams of G1 and G2 are shown in Figure 3 and Figure 4, respectively. The same top secondary compression steel of 2D8 mm and the same bottom longitudinal bars of 2D12 mm were used to reinforce the RC beams for G1 and G2. All beams’ shear spans were 8 mm@56.25 mm.
The 1700 mm loaded span was divided into four identical distances (425 mm), each two were positioned at half of the span. The depth of each half span was either 250 mm or 150 mm. Each half span had two equal lengths (each one = 425 mm), one of which was a shear span and the other a pure bending moment. The stirrups were made to avoid shear failure during shear span. The stirrups’ amount was changed for the 425 mm bending moment portion either at large depth (250 mm) or at small depth (150 mm). For the purpose of examining the impact of stirrups’ quantity at the two depths, a total length of 850 mm was chosen as the pure bending distance.
Stirrups were not present in the middle of beams B0, B1, B2, B5, B1 *, and B2 *. The stirrups in the middle portion of beams B3, B6, and B3 * were 8 mm in diameter at 200 mm, while those on B4 and B4 * were 8 mm in diameter spaced at 100 mm. In case B5, the bottom bars continued in a straight line along the entire length of the beam. In addition, the bottom bars of 2D12 mm were inserted to a deeper depth of 250 mm and were extended by 280 mm after meeting the other bars. While the top bars of B2 * were also bent during the depth shift, the main tension bars of B2 were bent. In order to prevent slipping failure, the bottom tension bars for B1, B3, B4, and B5 intersected at the drop and were lengthened by 280 mm. The compression bars in beams B1 *, B2 *, B3 *, and B4 * underwent the same splices. With the exception of beam B6, all of the beams in the two groups experienced an abrupt change in inclination of 90° while B6 had a change inclining by 45° (Figure 3f). In this beam, a better, longer lap splice was also completed. A vibrator was employed to stop the separation of the particle board from the mixed concrete during the casting of the beams. Details of the tested specimens of group G1 and G2 are shown in Figure 3 and Figure 4.

3.2. Properties of the Materials Used

The normal strength concrete (NSC) combination utilized for the concrete patch was created utilizing the materials that were readily accessible. Sand, Portland cement, water, and gravel with a maximum aggregate size of 15 mm made up the mixture. W/C, or the water cement ratio, was 0.57. Table 1 lists the mix proportions per m³. Three 150 × 150 × 150 mm cubes of concrete were cast from the same RC beam concrete using the same curing procedure, in accordance with Egyptian Code [39]. The findings indicated that the 28-day concrete’s average cubic strength in compression was 21 MPa. Three cylinders with a 150 mm diameter and 300 mm height underwent the splitting test to assess the tension strength of the concrete. The concrete’s typical tensile strength was 2.15 MPa.
Three reinforcing bars were subjected to uniaxial tension tests using the universal testing machine (UTM) in accordance with Egyptian code [39] to determine their average proof and ultimate strengths. Figure 5 shows the stress–strain curves for the utilized bars. Normal mild steel (NMS) was used to create the vertical stirrups, which had an 8 mm diameter, while high tensile steel (HTS) was used to create the tension longitudinal bars, which had a 12 mm diameter. For NMS and HTS, the average proof strength was 251.22 MPa and 445 MPa, respectively. For NMS and HTS, the equivalent ultimate tensile strength was 344.21 MPa and 538.12 MPa, respectively.

3.3. Test Setup and Measurements

Figure 6 depicts the test arrangement employed in the current study. The hydraulic jack in operation had a 250 kN capability. The center of the loading steel beam was where the hydraulic jack exerted its load. To prevent local concrete crushing, this load was split into two equal loads that affected the tested beam using spreader beams. Further, one steel loading plate was used underneath each load to prevent concrete crushing. The tested beam had roller and hinge end supports. The four-point flexural test was performed on each RC beam. A 50 mm displacement gauge was employed to measure the beam’s deflection. The deflection at the mid-distance of the larger depth and smaller depth is represented by ∆1 and ∆3, respectively. The mid-span deflection at the depth change is measured as ∆2. The vertical side of the beams had marks where the cracks were formed. Readings of the load value, vertical deflections, and crack propagation were taken after each loading step. All beams were loaded at a rate of 20 to 25 kN per hour.

4. Experimental Results and Discussion

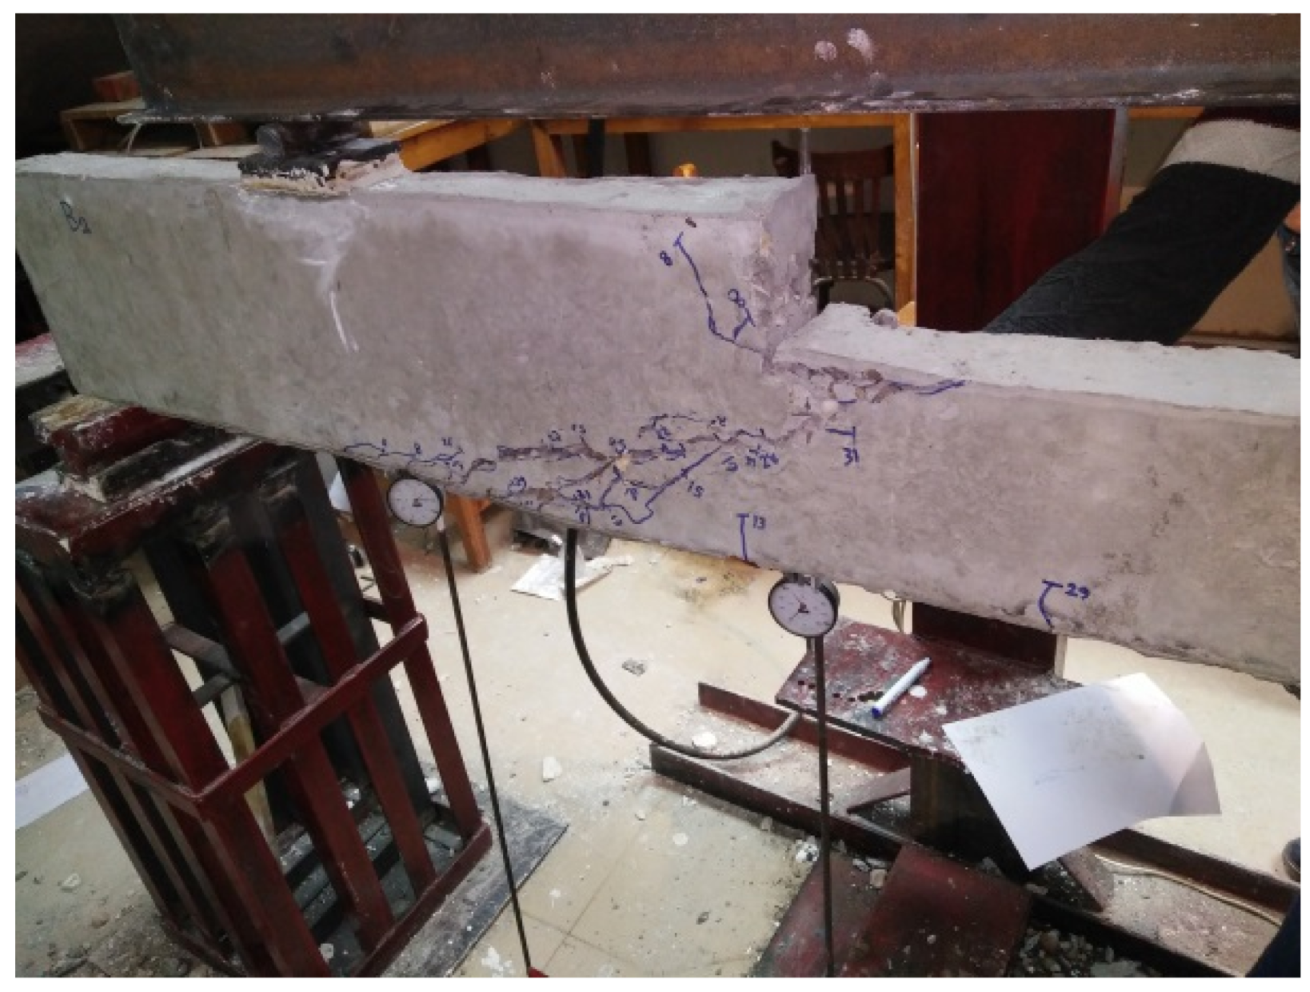
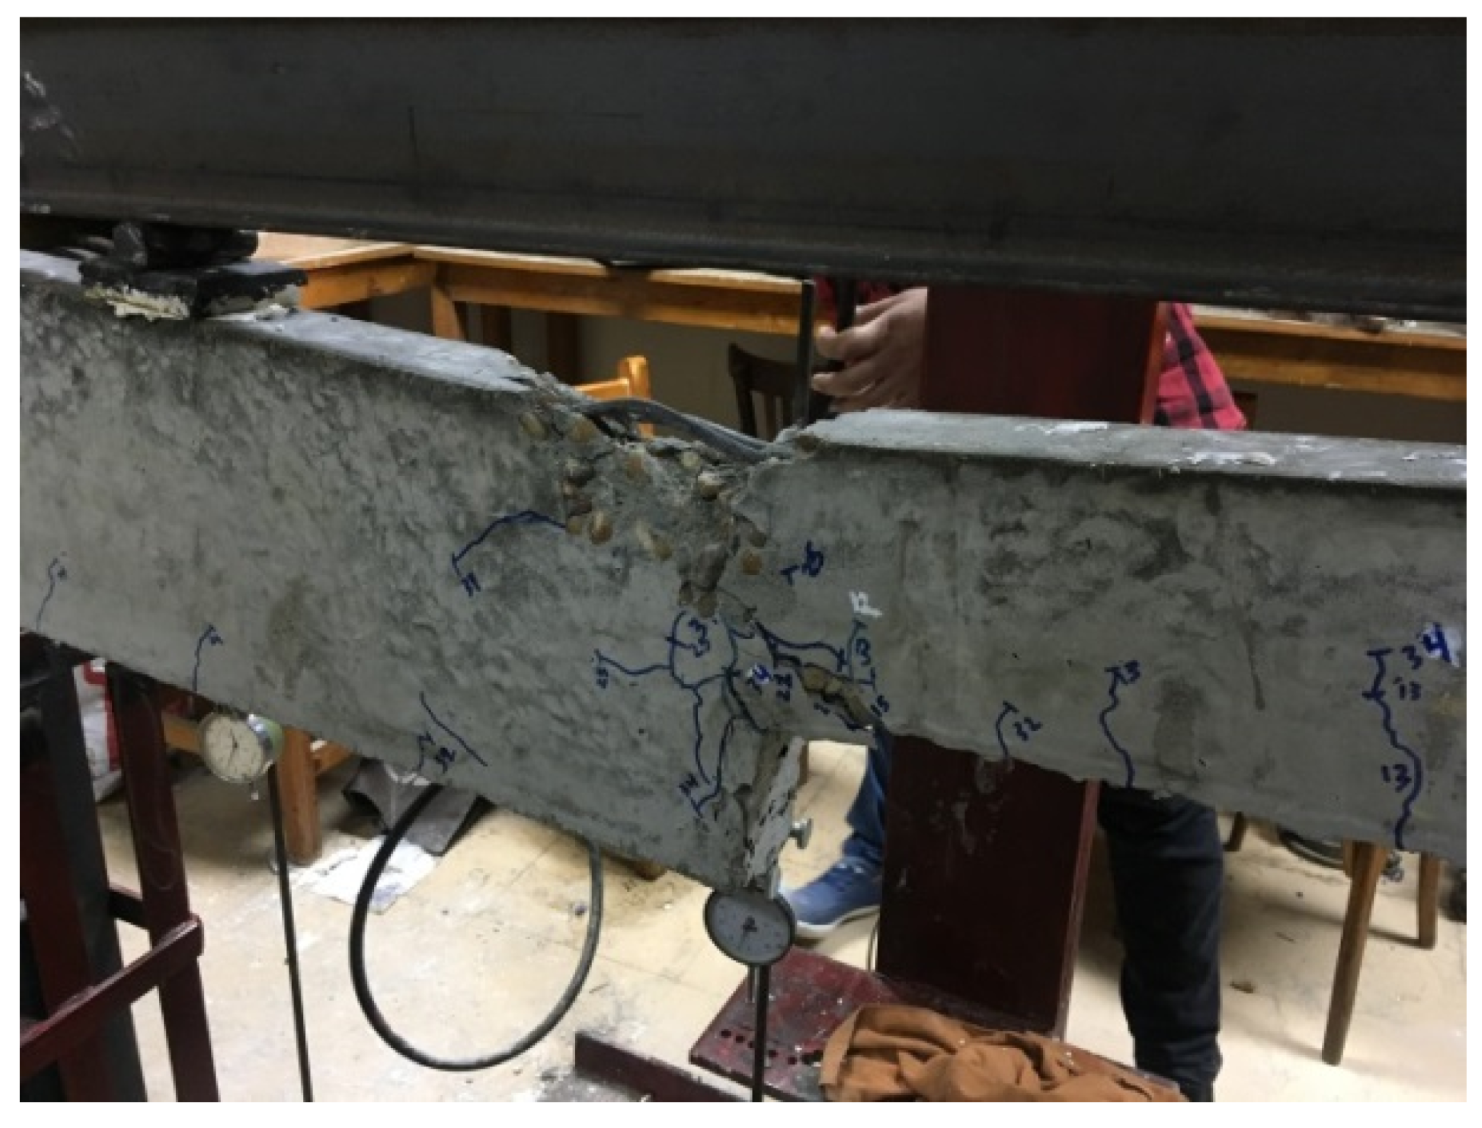
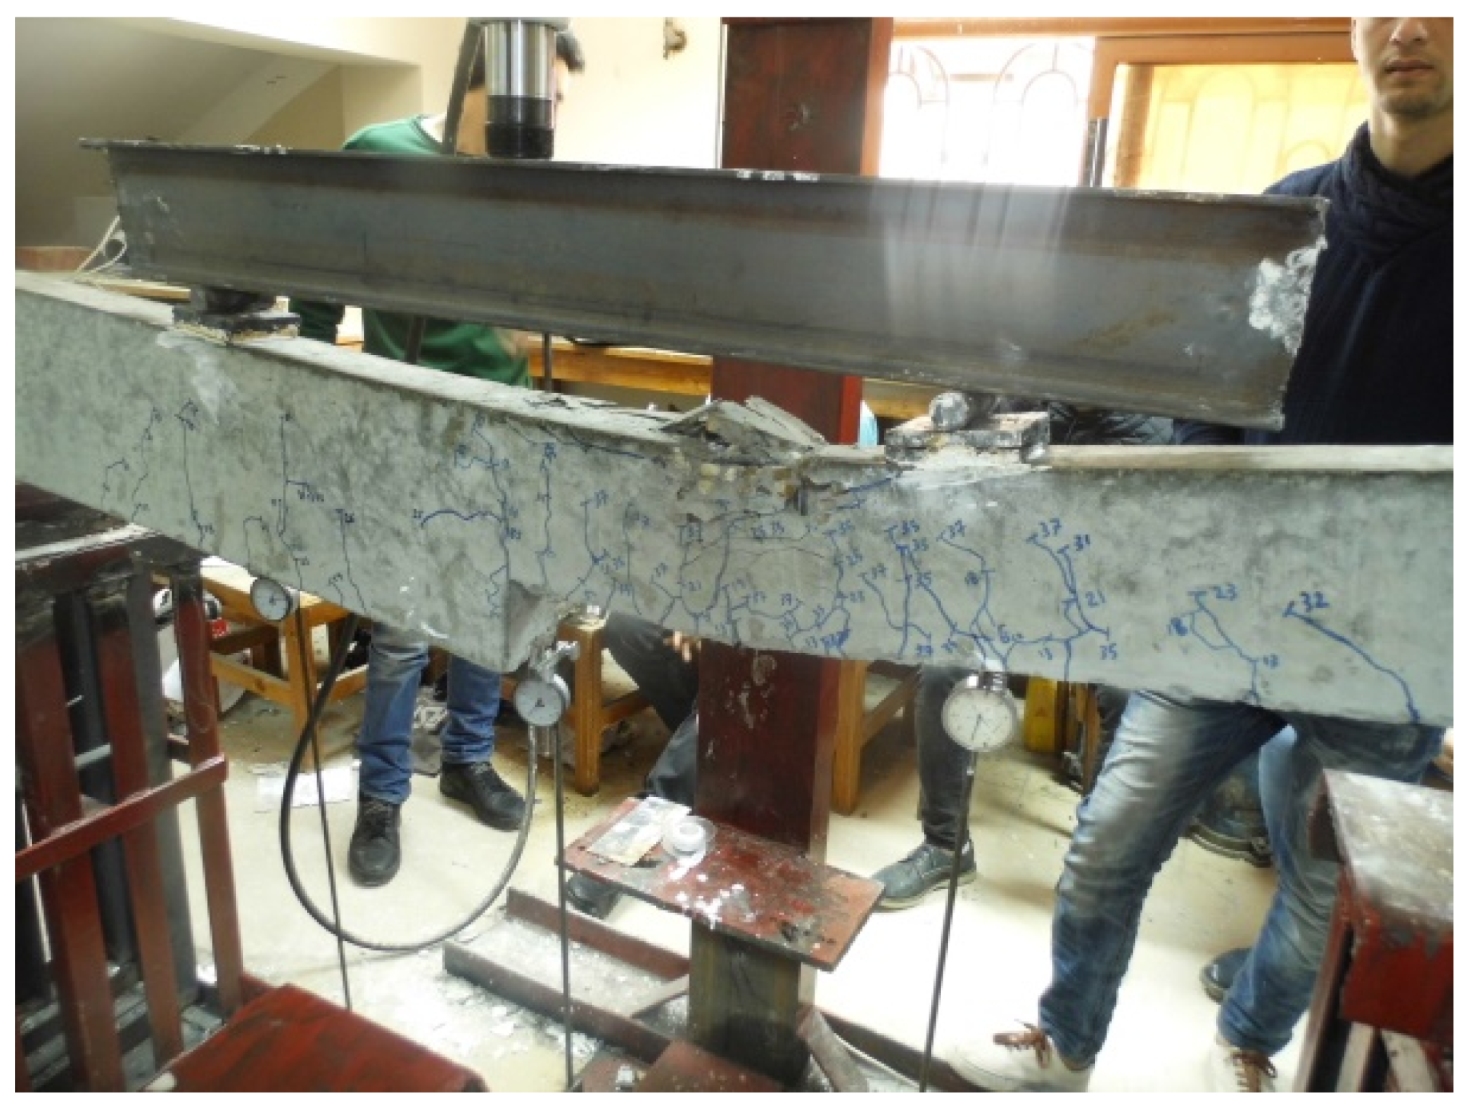
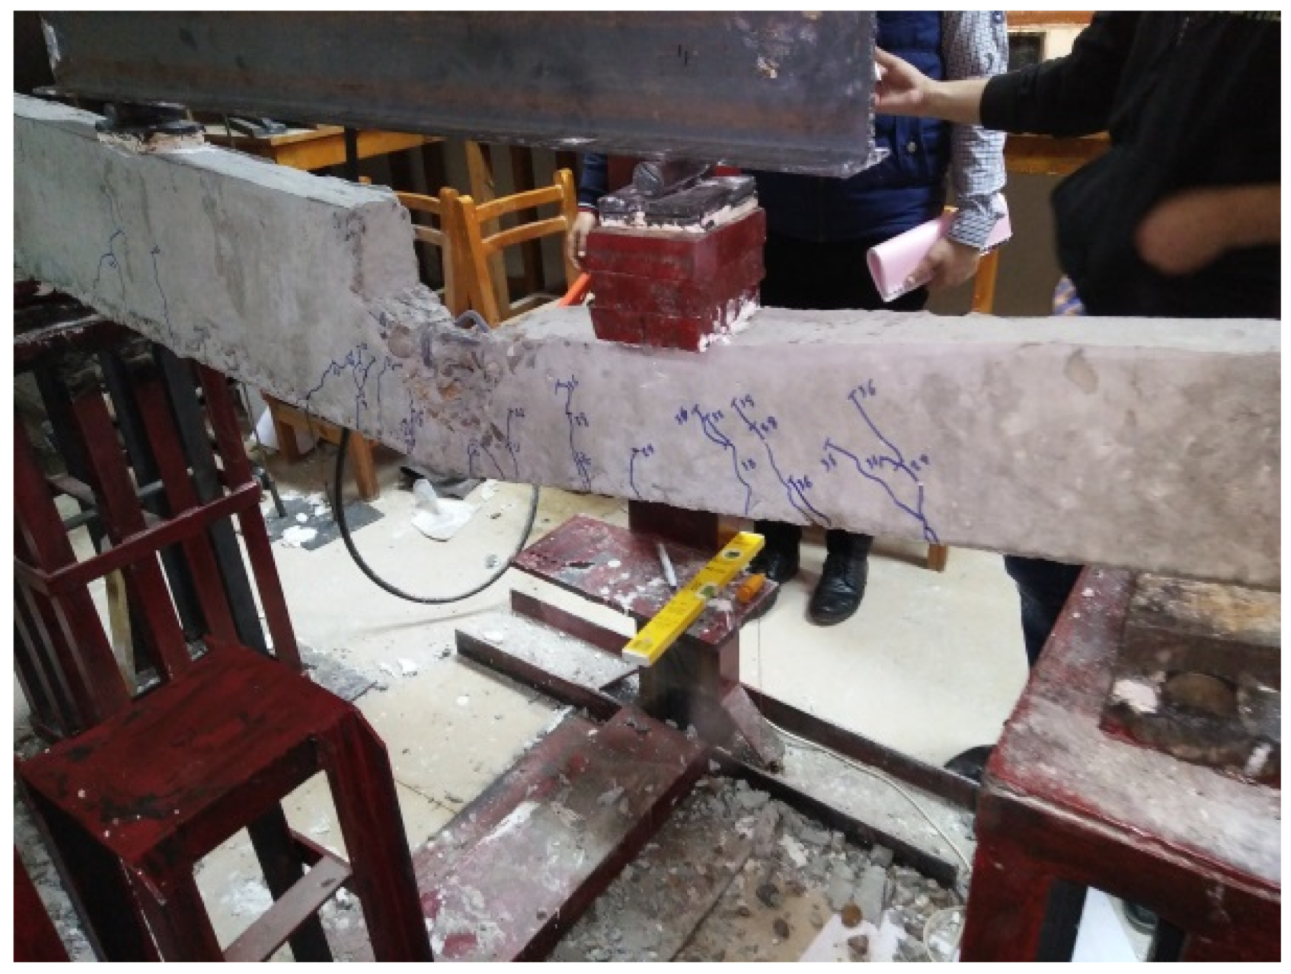
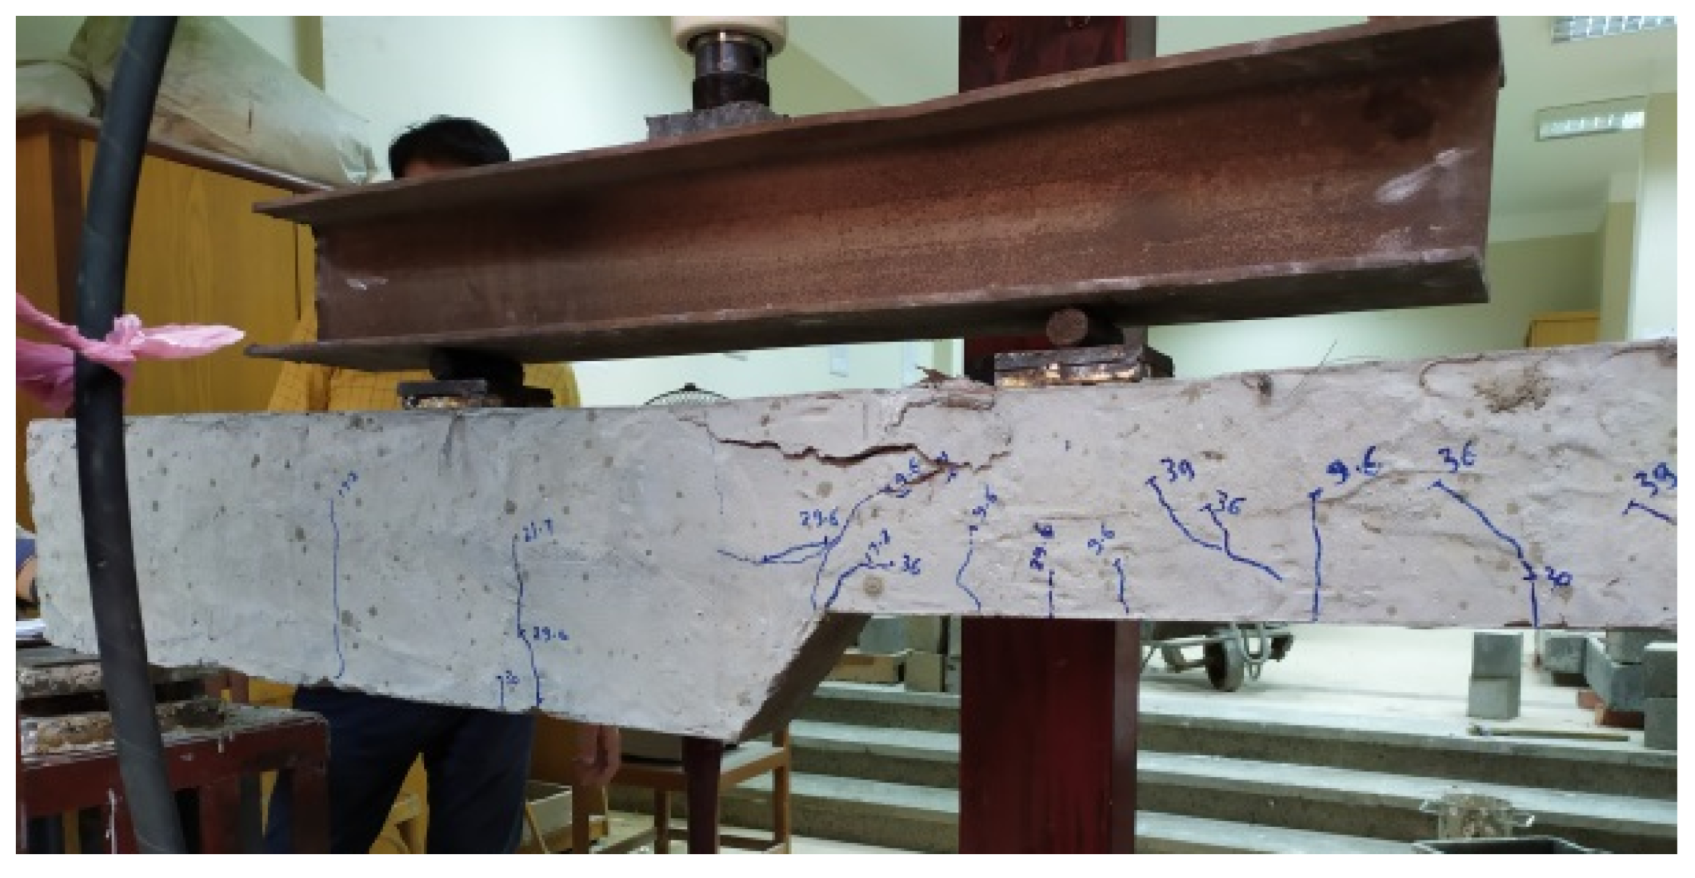
4.1. Crack Pattern and Modes of Failure

The experimental test findings showed that all beams had flexural failure mechanisms. In the middle span, flexural cracks started to show up on the beam soffit. Due to low concrete degree, the lack of stirrups in certain beams, or increasing the distance between stirrups in other beams, the failure occurred in the compression region where the steel bars buckled. The length and width of the flexural cracks expanded consistently, and as the compression steel bars buckled, they spread noticeably. When the beams were cast from a low compressive resistance material with an fcu of 21 MPa, all beams were intended to fail in the compression zone.
Figure 7 depicts the crack pattern of beam B0. It is clear that the bending stresses led to vertical cracks that extended from the bottom to the top (the compression zone). In the middle, the cracks first appeared. Second, the cracks started to show up at shear spans and started to tilt at about 45 degrees toward the two loading sites. The width and depth of the cracks grew as the loading increased, and by the end of the test, there were 24 cracks in total. Because there were no stirrups in the middle of the specimen, the compression steel bars buckled and caused the primary collapse. As depicted in Figure 7b, the buckled portion of the beam’s upper surface was near the right loading point.
The crack pattern of beam B0 * is depicted in Figure 8. The same cracks and failure manner as in the case of B0 were observed for this beam. The middle third’s use of the stirrups widened the cracks where 31 cracks were present in this beam. Additionally, the top bar’s buckling was less severe than that of B0’s. Figure 8b displays a picture of the B0 * after the test was completed.
The crack pattern of beam B1 is depicted in Figure 9. At maximum flexural stress, the impact of increasing the tension side beam depth was investigated. It was noted that there were more cracks that occurred at a lesser depth (150 mm) than at a greater depth (250 mm). It is obvious that the primary cause of the failure crack at the drop was the effect of the abrupt change in depth. Additionally, the upper bars buckled as a result of the center section’s lack of stirrups. The concrete cover disappeared. In total, 10 cracks were found, which indicated a decrease in ductility when compared to a comparable control beam B0. Four of them happened at the greater depth while six of them happened at the lesser depth. The main causes of the failure were the buckling of the top bars as well as the main tension crack in the middle.
The spread of the B1 * cracks is depicted in Figure 10. The first flexural crack took place at 33% of the ultimate load. Flexural failure was the specified type of failure. The top bars buckled at a distance between the right loading point and the drop, which was the primary cause of the failure. The lack of stirrups could be to blame for this. At the lower depth than at the higher depth, there were more flexural cracks. The major tension fracture in B1 occurred exactly vertically at the depth change; however, the same crack as that in B1 * emerged at the same depth change but was diagonal with a 30° inclination angle; it started at the greater depth and finished at the top of the smaller depth. Concrete was compressed (crushed) at the depth change in B1 while it happened at the shallower depth in B1 *.
Figure 11 depicts the beam B2 crack pattern. The lack of stirrups in the middle of the beam and the non-reinforcing steel link were also explored. There were no lap splices, and the bottom reinforcement of this beam was continuous across the beam span. This deficient beam experienced a premature failure as soon as the loading began. Because of the improper positioning of the bottom main bars, cracks developed at the drop location. The fissures grew wider and longer as the loading increased. The main lower beam bars parted downhill at the end of the loading, and the concrete cover fell with them. The bottom bars’ disruption was caused by the collapse of this beam. The total number of cracks was shown to be just two.
The upper bars’ connection splice during the depth change was skipped in B2 *. The beam’s flexural cracks were discovered to be extremely rare. This was due to the fact that the ultimate deflection at the center (∆2) was 184.34% larger than the ultimate deflection at the deeper point (∆1). It was demonstrated that the beam’s distorted shape was made up of two straight lines that met in the middle. The diagonal crack at the depth change location caused the compression–tension flexural failure of beam B2 *, as seen in Figure 12. It was demonstrated that the depth change at the compression side (B2 *) had a minimal impact on cracking and the beam’s capacity; however, the depth change at the tension side (B2) had a considerable impact and resulted in an early failure at the beginning of loading. The bending moment had to be resisted by steel bars in the tension and concrete blocks in the compression side, which is why this happened. As a result, the tension side’s defective, unspliced bars obviously reduced the beam’s capacity. By contrast, unspliced bars on the compression side had a slight effect on the beam’s capacity.
According to Figure 13, the B3 cracks radiated outward from the drop. Similar to beam B1, this beam also failed in compression flexure mode. The failure load was increased by using stirrups (8 mm@200 mm) in B3, but the failure mode remained unchanged. The outcomes also demonstrated that the middle portion’s employment of stirrups contributed to a decrease in both the width and depth of the cracks. Thirteen cracks were seen in total, 10 of which were at a depth of 150 mm and 3 were at a depth of 250 mm. When compared to B1 without stirrups, the use of 8 mm@200 mm as stirrups increased cracking and delayed failure.
The failure mode of beam B3 * is shown in Figure 14. The compression flexural failure occurred at the distance between the first stirrup, after the depth change, and the depth change. This beam had more flexural cracks than the two stirrup-free beams B1 * and B2 *. Because the splice in the tension bars had a strong impact while the splice in the compression bar had a minor impact, the cracking behavior of this beam, designated B3 *, was better than that of B3 with a change in depth at the beam soffit.
Failure occurred at the depth change for both beams B1 (without stirrups) and B3 (with 8 mm@200 mm) as a result of the lack of stirrups or insufficient stirrups in the area of the depth change. In contrast, as shown in Figure 15, the usage of 8 mm spaced at 100 mm in B4 was successful in moving the failure from the place of the depth change to the smaller depth area. With more stirrups, the collapse occurred later and the total load was higher. There were 14 cracks in total, 8 of which had a little depth of 150 mm and 6 of which had a depth of 250 mm. As depicted in Figure 15, the cracks in this beam were concentrated close to the loading point. In comparison to the other beams on which the test was conducted, the results showed that beam B4’s collapse needed the largest loads. The higher steel bars buckled, and tension cracks at the right half span with a smaller depth contributed to the failure of this beam.
The cracks in beam B4 * are depicted in Figure 16. The number of flexural cracks that occurred at the two depths was larger than that of B3 * due to an increase in the number of stirrups, showing how the cracks were more evenly spread as the stirrups of the central portion grew. The ductility of the beam improved and the breakdown was delayed as the cracks spread farther along the span. It is clear that there were more cracks in B4 (Figure 15) compared with B4 *.
Figure 17 depicts the cracks of B5. The impact of increasing the half-span depth on the crack pattern was seen in this beam. The bottom bars along the length of the two beams, B0 and B5, were the same length at 2D12 mm. Two 12 mm bars were also added to the larger depth of B5. As a result, unlike beam B1, this beam did not collapse at the drop site. There were 17 cracks in all, 10 of which had a depth of 150 mm and 7 of which had a depth of 250 mm. Near the loading point, at a smaller depth, the main crack was a tension crack. Because the stirrups were not positioned in the middle, the upper reinforcing bars were curled upward at a depth of 150 mm. Table 2 and Table 3 provide illustrations of all beam failure modes and locations.
The cracks in B6 are shown in Figure 18. Flexural failure on the compression side above the depth change near to the right loading plate was the failure mode of this beam. This happened as a result of the compression bar buckling in the shallower depth between the stirrups. Due to the good lap splice details and the good progression of the change, the fractures in the change region compared to the other beams were the least.

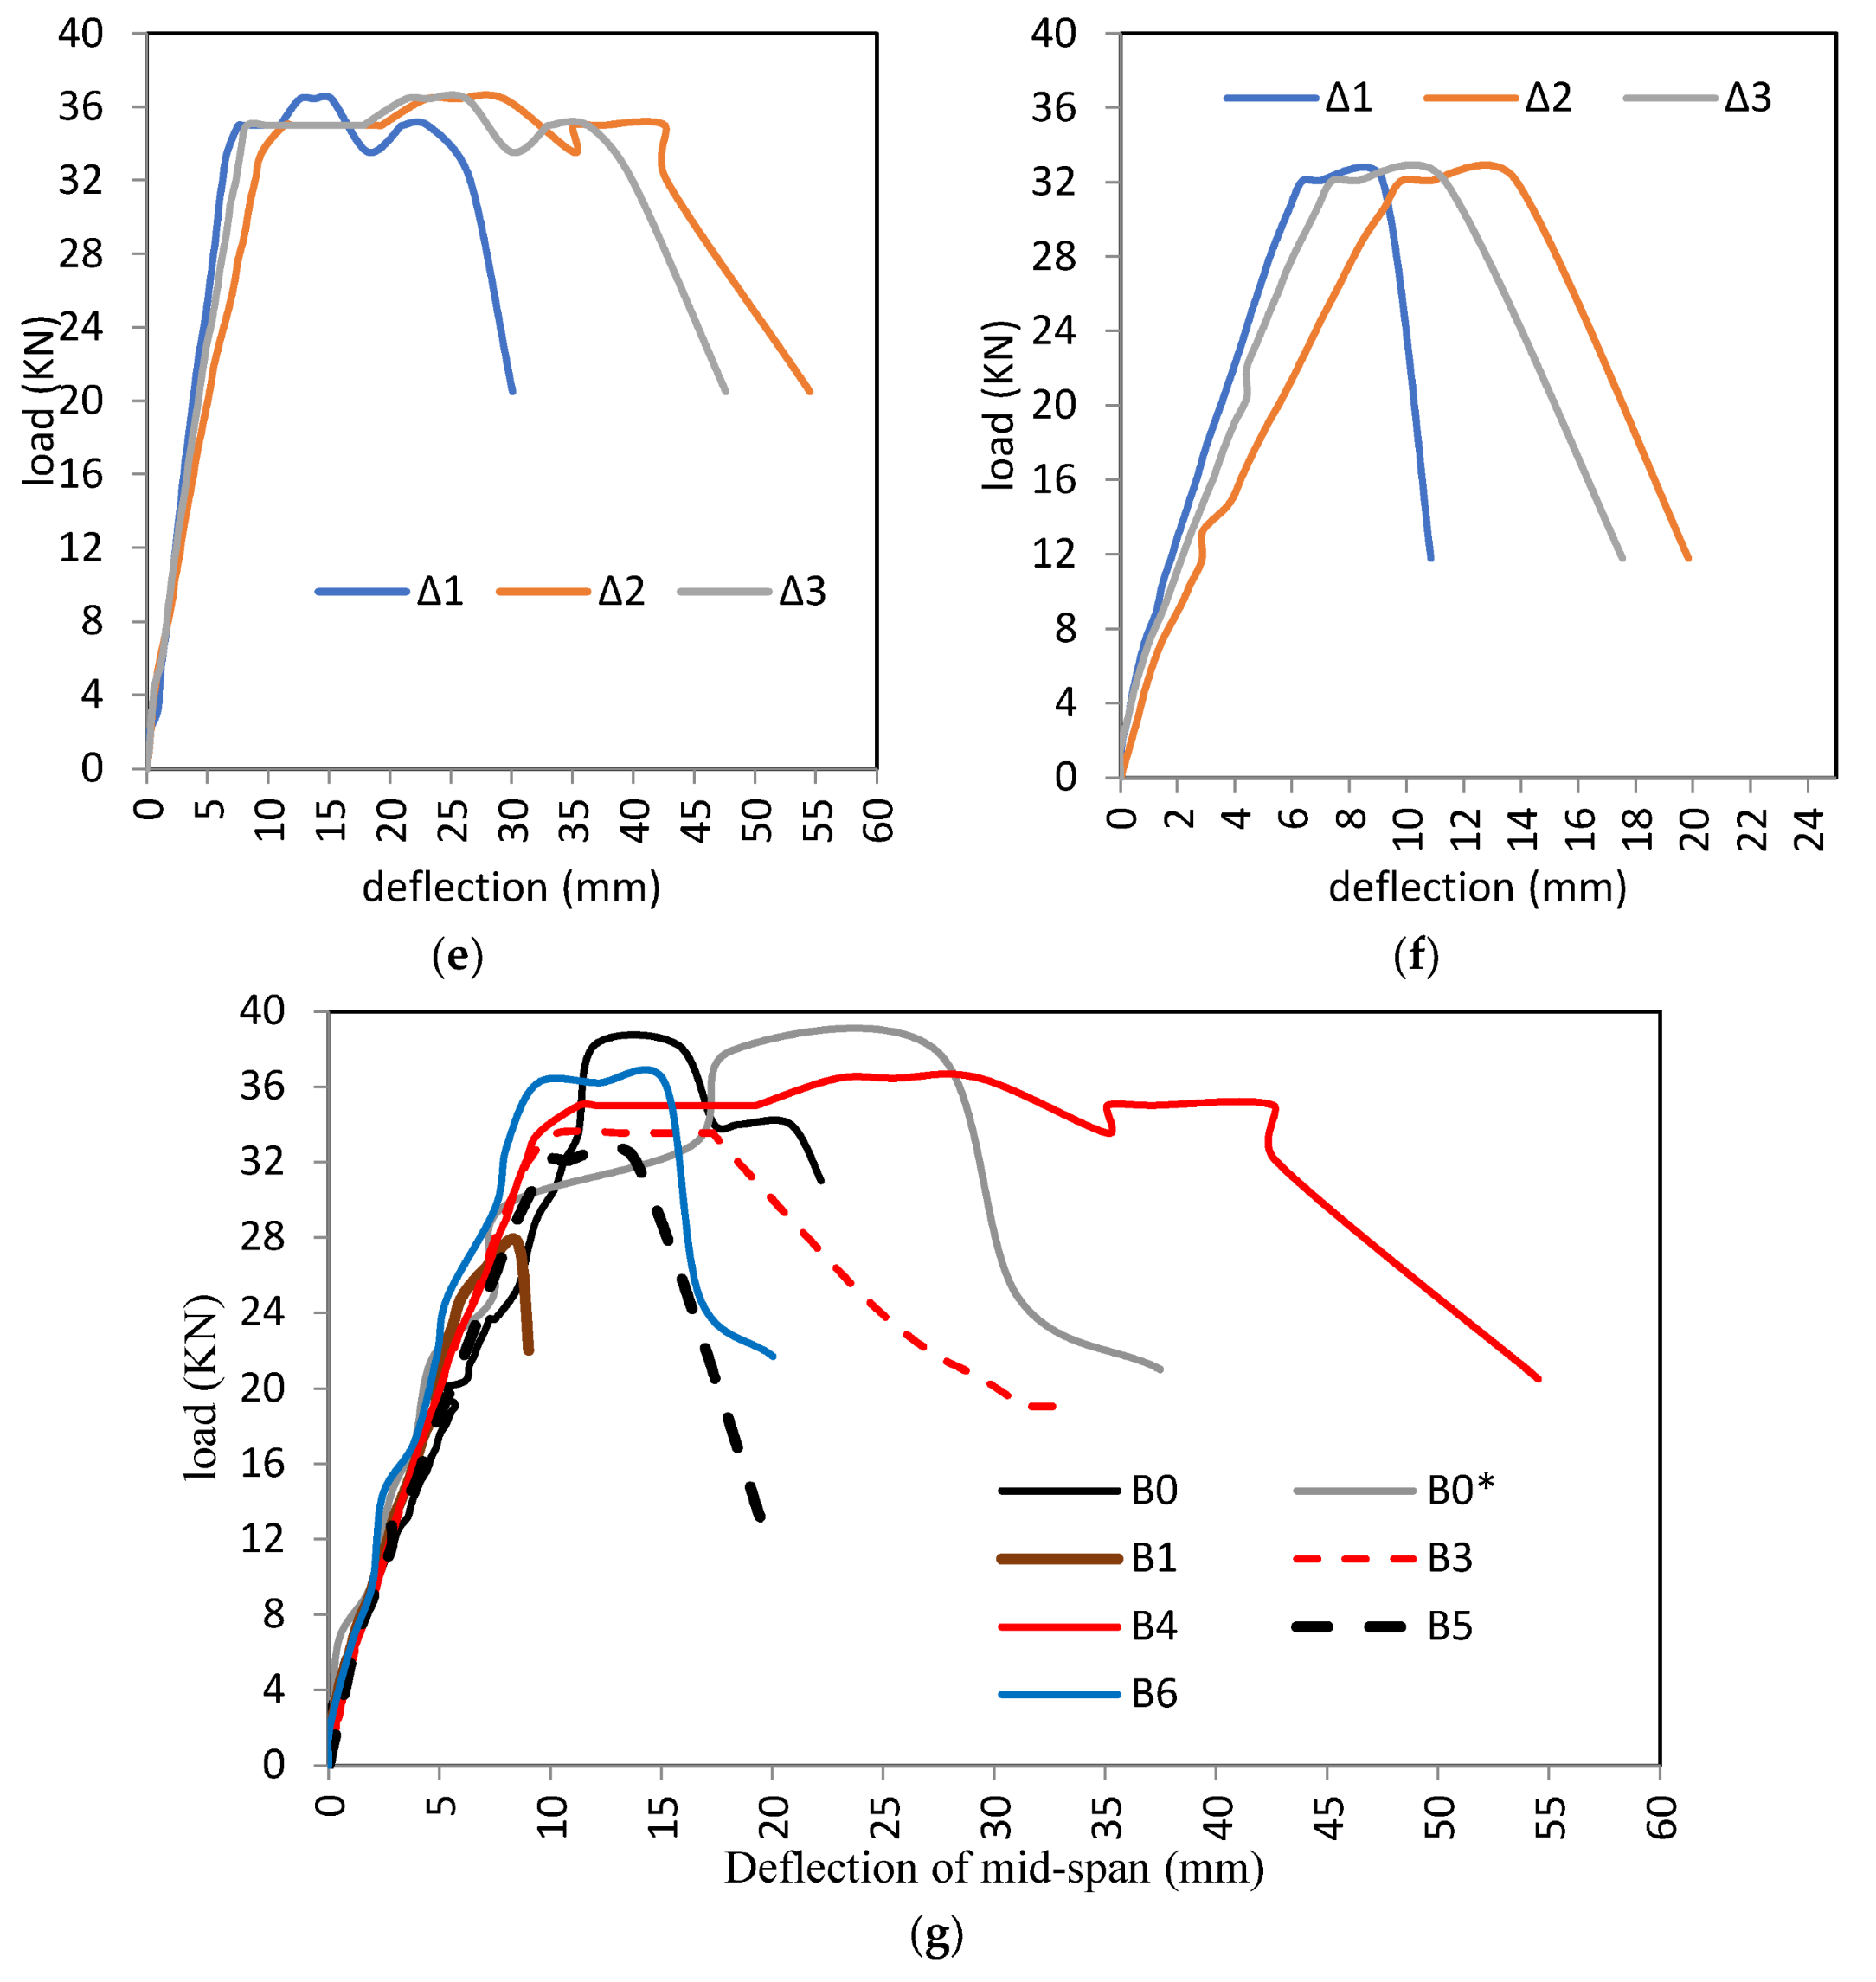
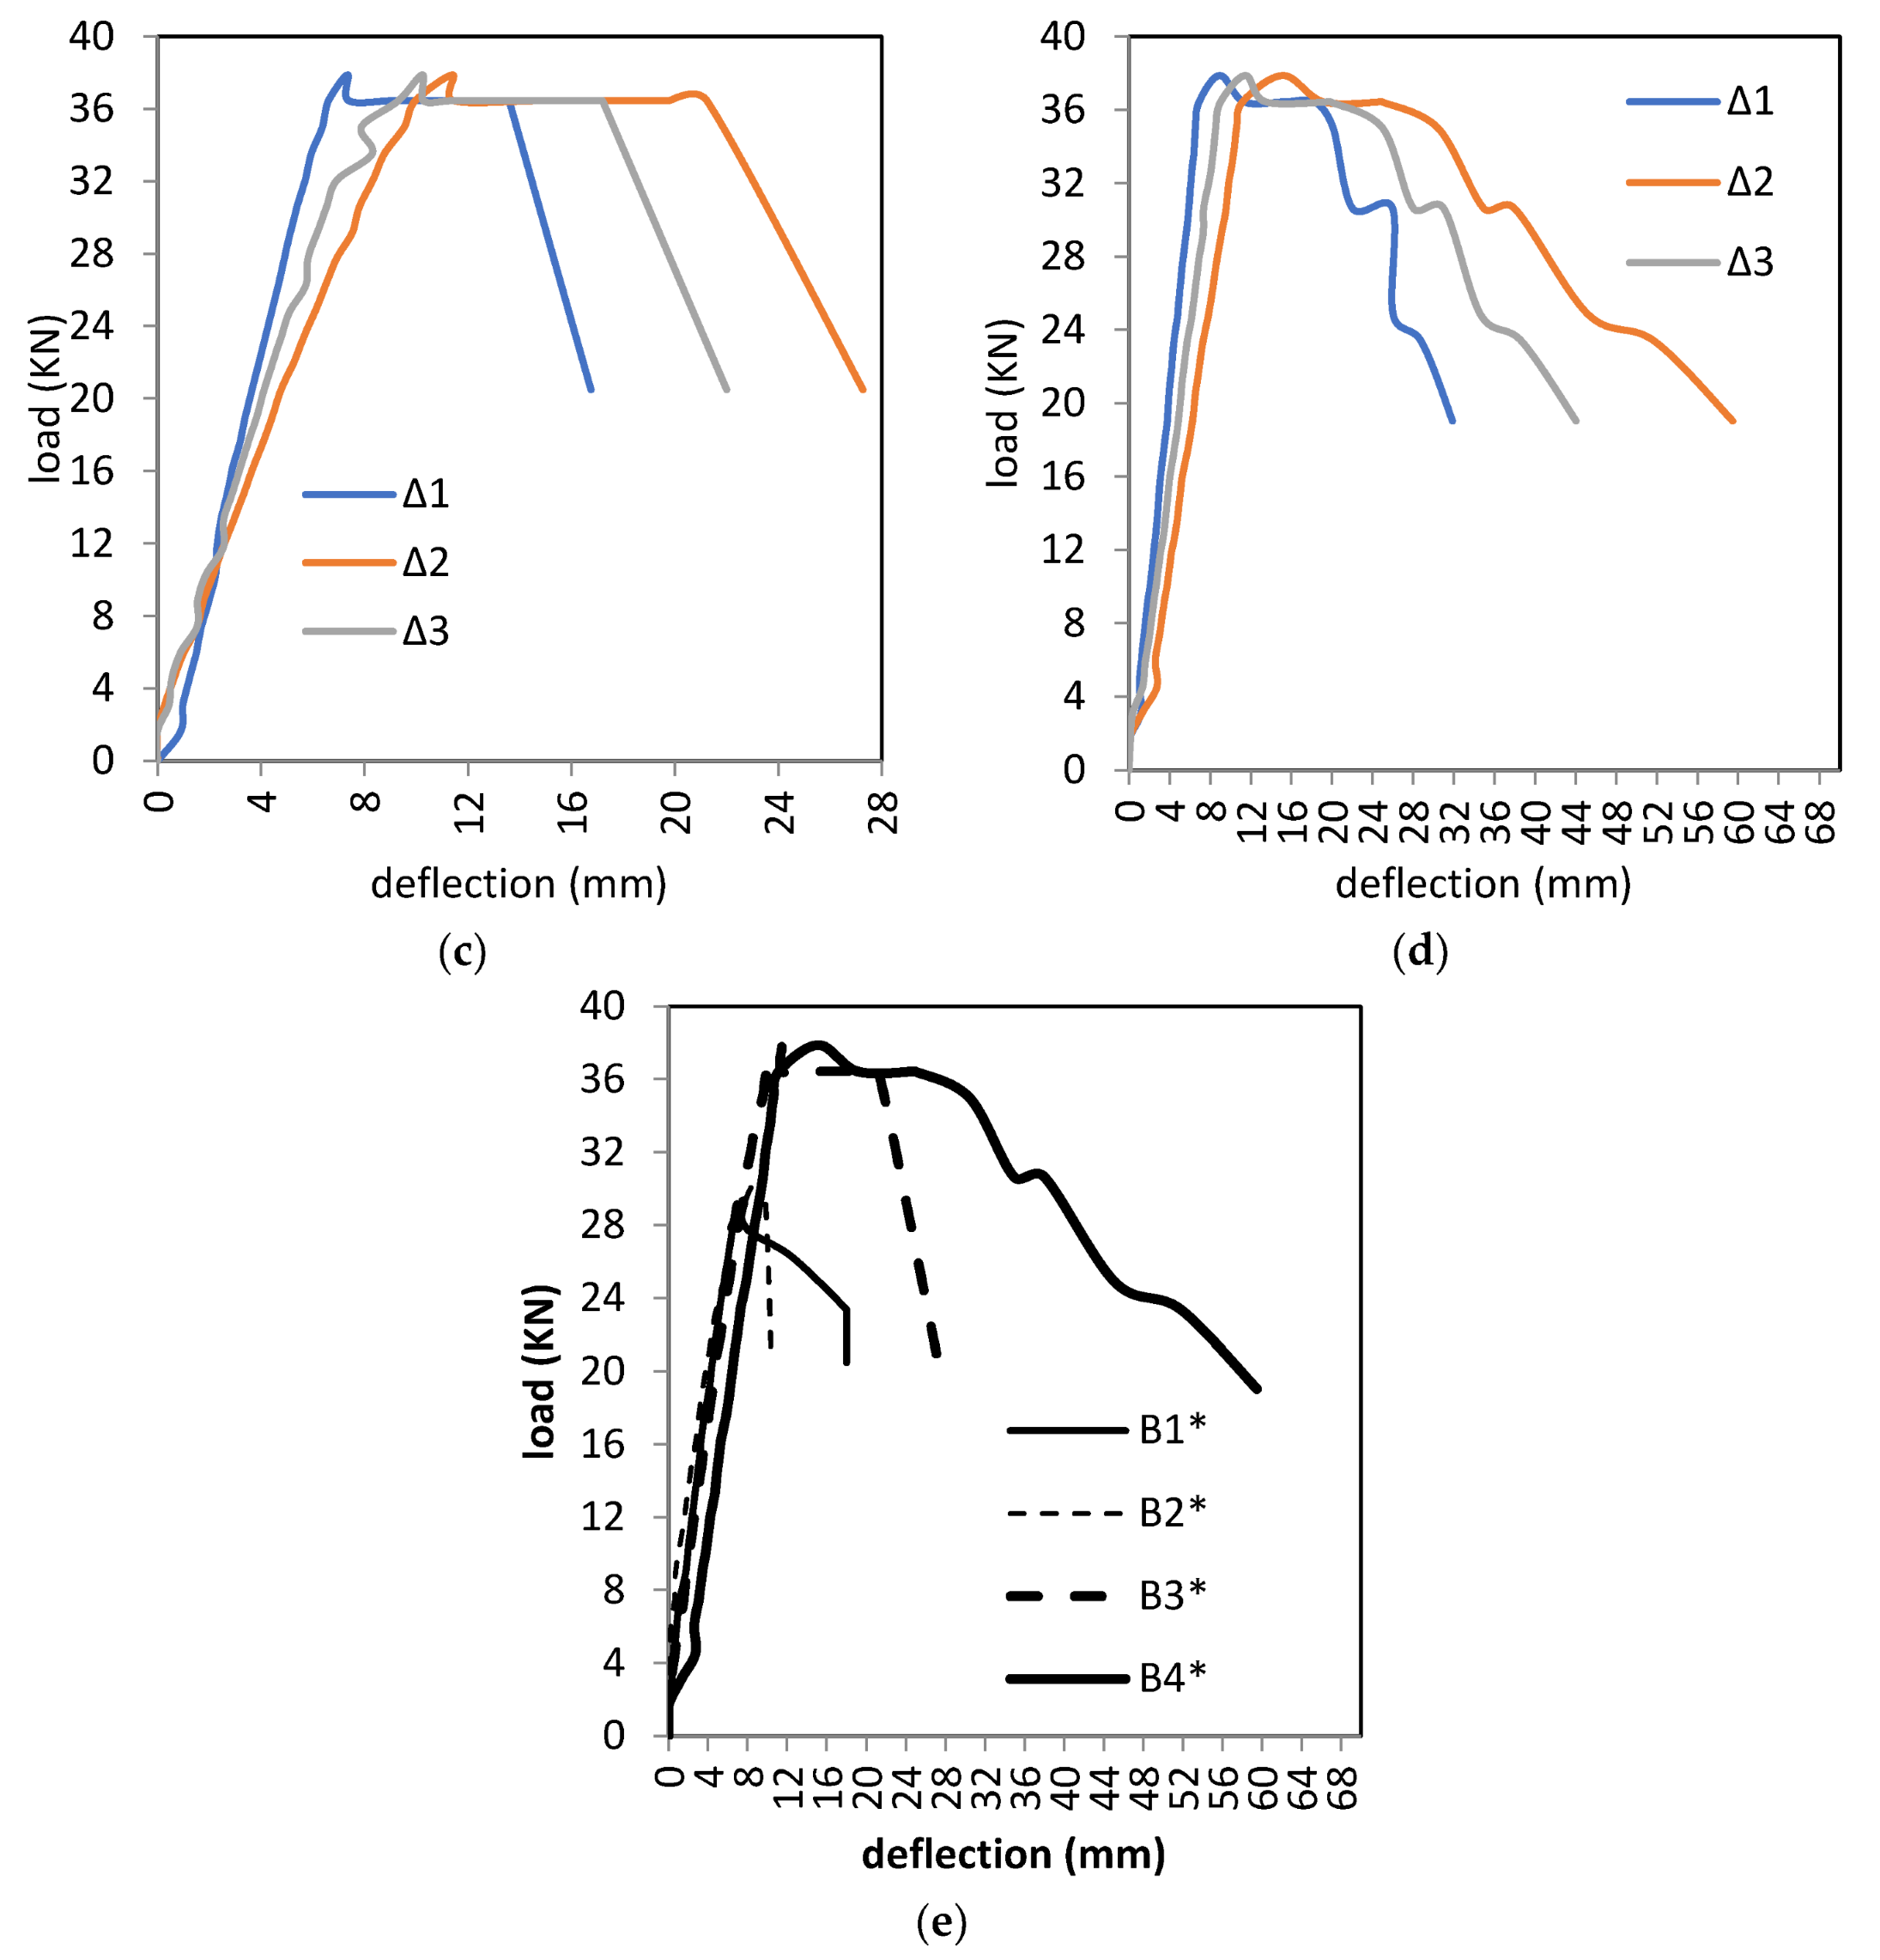
4.2. Comparison of Ultimate Loads

The results of the ultimate loads (Pu) and deflections (Δu) for all of the G1 beams as well as the control beams are shown in Table 2. Due to the occurrence of premature failure, the ultimate carrying load of B2 was of very limited value in comparison to the other beams. The incorrect bottom bar details caused the beam depth to increase for this reason. The bottom bar’s minor generated tension stress during loading time cracked the concrete cover, causing the bars to lengthen here. The ultimate carrying load for the two control beams was roughly equal. In the instance of beam B0 * with a constant depth along the span, the presence of the stirrups in the middle third had a minimal impact on the ultimate load. It was demonstrated that increasing the tension side beam depth abruptly reduced the carrying ultimate load of the tested beams in comparison to the control beams, regardless of whether they had stirrups in the middle third. The test revealed that the cause was not the specifics of the bottom bars’ splice. Despite the tension bars’ continuity along the beam’s span in B5, Pu decreased by 15.97% compared to control beam B0. B3, reinforced with 8 mm@200 mm stirrups, had a lower ultimate load (Pu) than B0, by 12.17%. The Pu of B4, strengthened by 8 mm@100 mm stirrups, was 4.58% lower than that of B0. Due to the lack of stirrups in the change region at the middle third, B1 had the highest ratio of decreasing the ultimate load (27.35%) compared to B0. The problem could not be resolved by using the stirrups or the continuity of lower bars in the depth change zone. This might be a result of the compression flexural stresses being placed more on the smaller depth than the larger depth due to the change in beam depth. Compared to the segment at the larger depth, the section at the small depth cracked and failed more quickly.
The impact of the tension bar extending, the quantity of stirrups, and their existence when carrying the maximum weight was substantial. The final load of B3, reinforced by 8 mm@200 mm stirrups, was 20.9% greater than that of B1. Additionally, the Pu of B4 with 8 mm@100 mm stirrup reinforcement was 31.35% greater than that of B1 without stirrup reinforcement. The ultimate load of the RC beams was significantly impacted by the stirrups present and their quantity in the changing area. Due to the bottom bars of the section’s shallow depth section extending along the beam span, the Pu of B5 was 15.67% larger than the Pu of B1. When the depth graduation was changed in the case of B6 by a 45-degree angle, the Pu increased by 30.4 % in comparison to B1. This happened as a result of the bottom bar splice’s careful craftsmanship. Additionally, by a tapering shift, the pressures were transferred from a smaller to a larger depth.
In Table 3, the Pu and Δu values of G2-beams are listed. The ultimate load achieved by G2-beams was lower than that of the control beam B0. The declining ratios were between 0.78% and 23.56%. Due to the increase in middle depth, which disrupted the compression stress flow, the Pu of B1 * reduced in comparison to B0. Beams B3 * and B4 * produced roughly the same ultimate load as the control beam B0 by varying the stirrup ratios in the middle portion. The ultimate load of B1 * without stirrups was 29.79% lower than the Pu of B3 * with stirrups. This might be as a result of the stirrups shortening the top bars’ buckling length and delaying their buckling, which increased the failure loads.
Because the bottom tension splices in the steel bars are responsible for moving the tension force from a larger depth to a smaller depth, the Pu of beams with a change in depth on the compression side was higher than that of identical beams with change in depth on the tension side. In contrast, as the compression forces were transferred through concrete blocks, splices in compression were unaffected.

4.3. Deflection Behavior

At three places, the deflections of each beam were measured in relation to the load (see Figure 6). Figure 19 and Figure 20 depict the load–deflection relationships for all G1 and G2 beams. The middle of the left half of the beam’s span is where deflection 1 was measured. Additionally, deflection Δ3 was measured at the middle of the beam’s right half span and was also noted at the change in Δ2’s middle span. At any level of the loading, the center deflection for all RC beams was greater than either the right or the left deflection. Due to the design of the deflection curve, it was expected that the middle span deflection would be the greatest. According to the elastic weight method, the following relationship can be used to evaluate the curvature (∆):
Δ = M e / EI .  
where Me is the elastic moment, E is the elasticity modulus of the concrete, and I is the moment of inertia. For all beams with the same level of force, the left deflection (∆1) was less than the right one (∆3). The flexure stiffness (EI) in the left part was higher than the EI in the right part for this reason. The deflection decreased as the EI increased. The findings demonstrated that up until the formation of the first break, the slope of each beam’s three deflection curves was equal.
When the cover dropped at the change, the deflections for B2 rose until failure happened at the change, after which they remained constant as the weight increased. For all beams except beam B2, Figure 19g and Figure 20e display the load–deflection curves for the middle deflection (∆2) for G1 and G2, respectively. This demonstrated that the stiffness of B4 and B3 was the same. Due to the stirrups that were present in the middle, B4 was also stiffer than B0. Due to the bottom bars’ continuity, B5 had a stiffer structure than B0.
In Table 2 and Table 3, ∆u is reported as the ultimate deflection of the center point (∆2) at the ultimate load of each beam. Because the ultimate load of B1 was lower than that of B0, it was discovered that the ∆u of B1 was 30.55% less than the ∆u of B0. Another factor was that the top bars buckled as a result of the middle section’s lack of stirrups. B3 ultimately deflected 30.55% less than B0, on average. Due to the use of stirrups spaced at 200 mm, the ∆u of B3 was 23.55% greater than the ∆u of B1. Additionally, the stirrups that were present in the middle at a distance of 100 mm prevented the buckling of the upper bars, resulting in the ∆u of B4 being 252.76% greater than that of B1. The area under the load–deflection curve was used as the definition of ductility. Because B4 had the largest stirrup-to-length ratio among all beams, it had the highest value in ductility.
It was demonstrated that the deflection behavior for all group G2 specimens (Figure 20) exhibited the same behavior as that of G1-beams (Figure 19). In comparison to the other beams, beam B4 * had the highest area under the curve (ductility) due to the stirrups’ increased ductility and postponed failure. Due to the splice and lack of stirrups, B2 * had the lowest ductility. The ultimate deflection of all beams was smaller than the ultimate deflection of the control beam B0 except B4 * due to the high stirrup ratio. The depth modification and the use of high stirrup ratios in the splice area boosted the ductility of the RC beams.

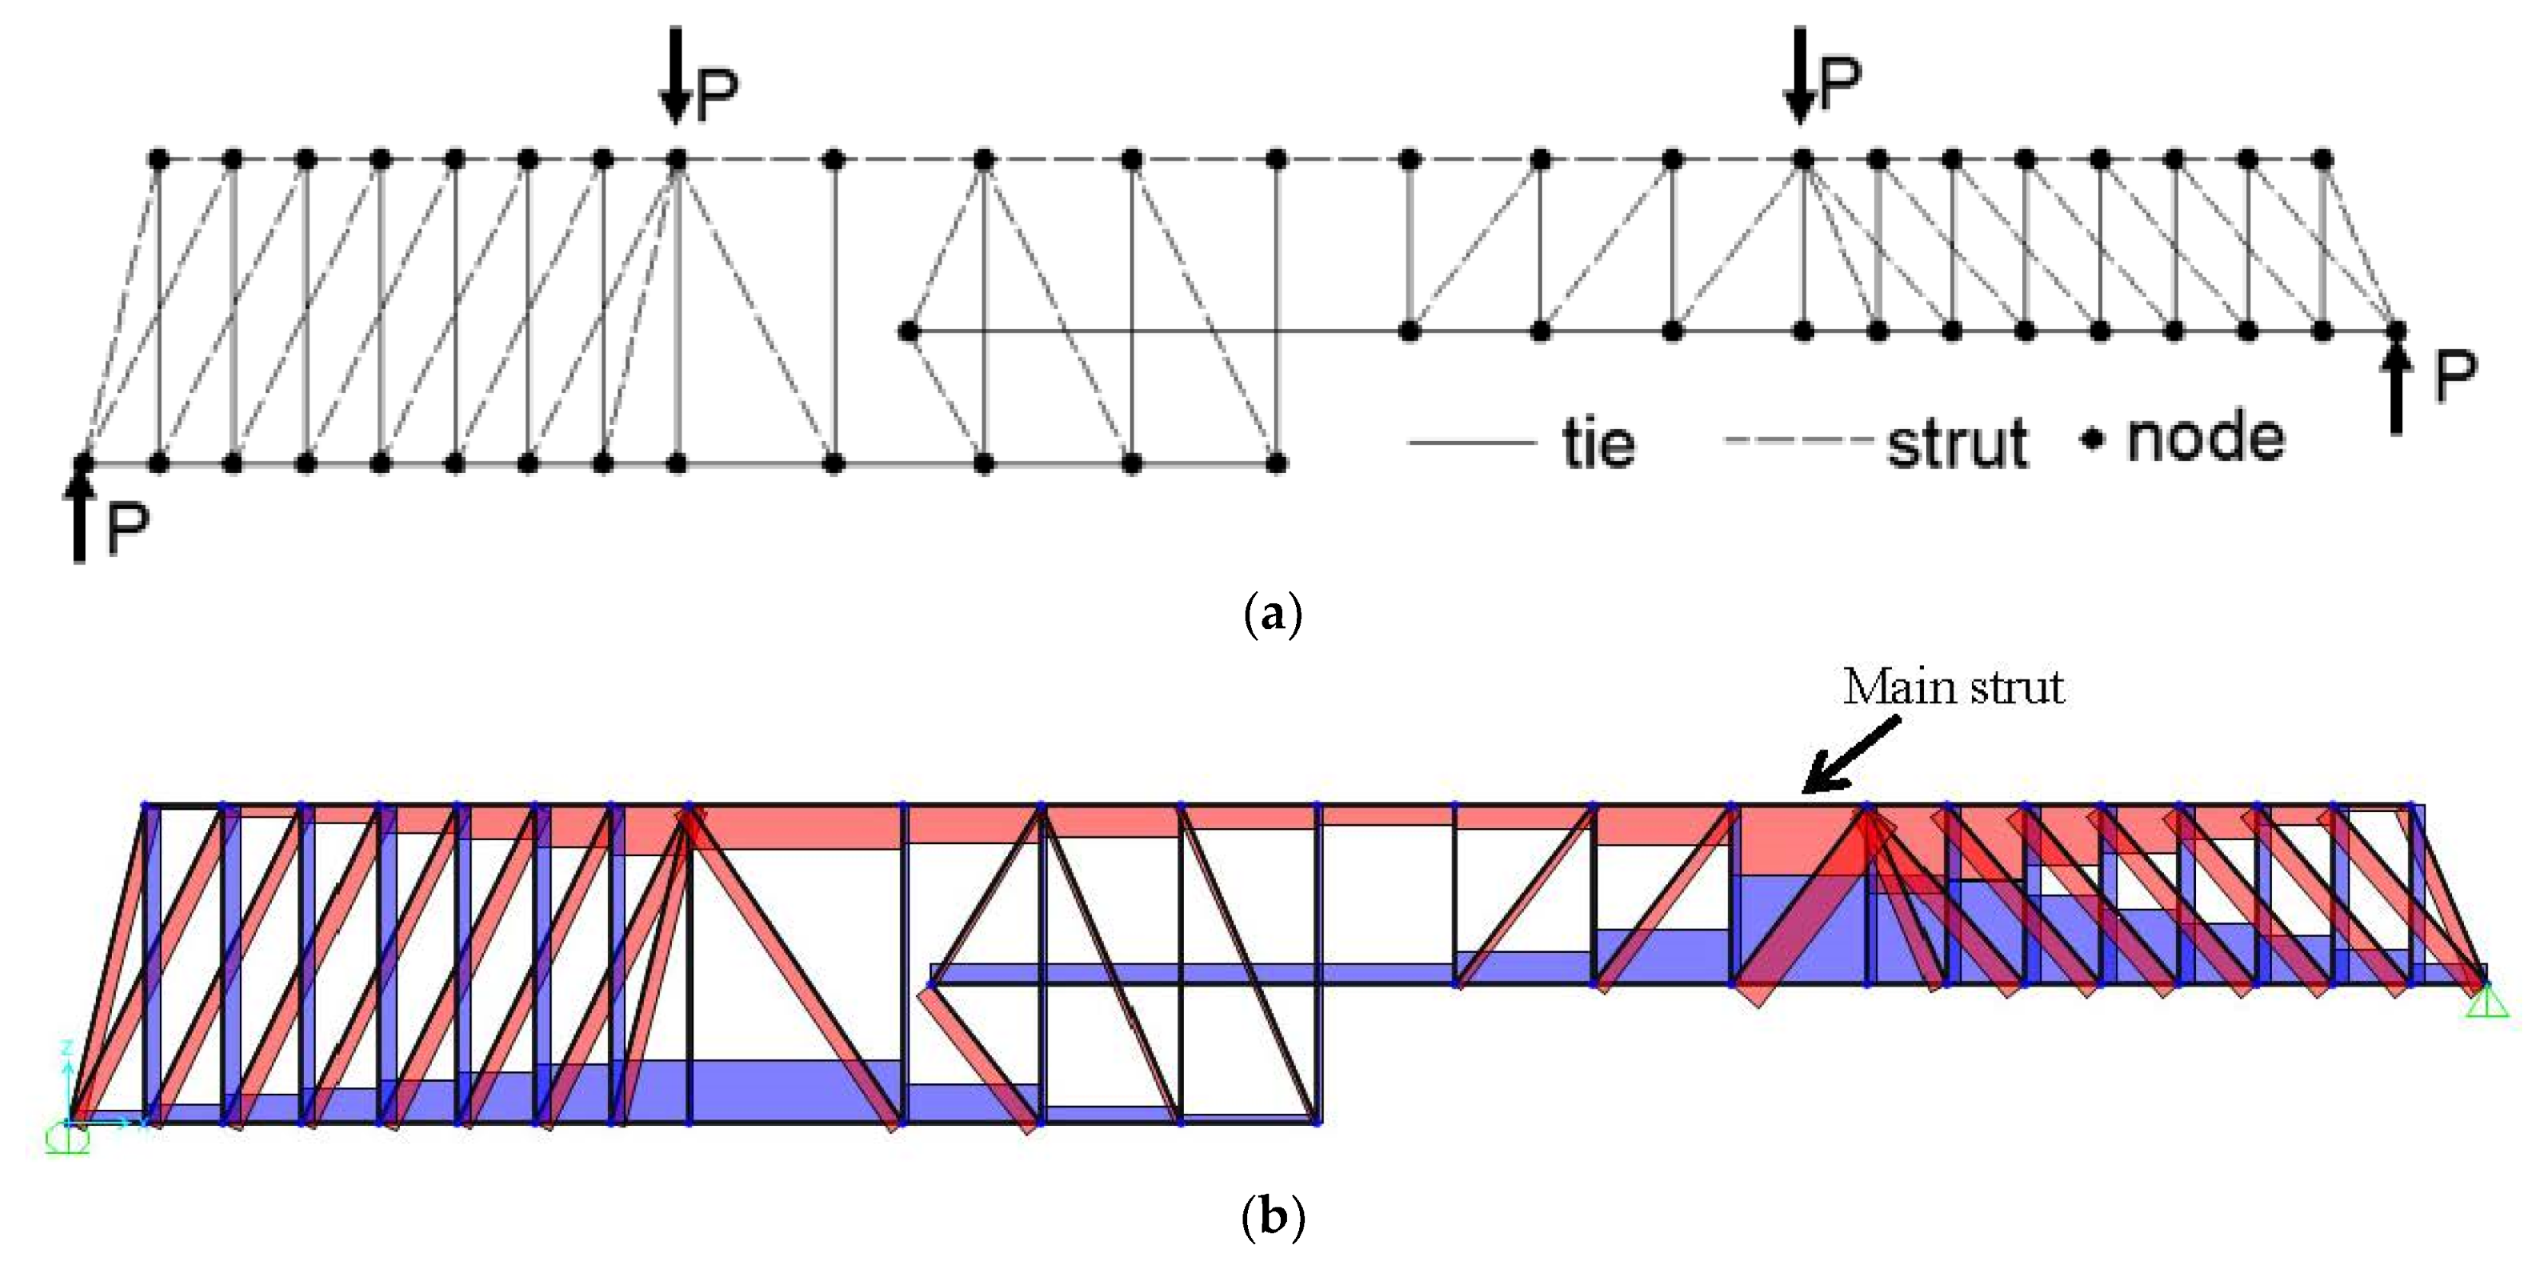
5. Strut and Tie Method (STM)

Researchers and professionals agree that the STM is a reasonable and suitable foundation for the design of cracked RC elements loaded in the bending and the shear. In order to predict the ultimate carrying load, some experimental samples from the current study were solved using the proposed STM in this section. The compression forces passed through the concrete (struts) and the tension forces (ties) generated along the reinforcing bars for the tested specimen B1 are represented by the STM in Figure 21.
The struts and ties were chosen to be appropriate with the cracks propagated during the testing of the RC beams in the current study in addition to the bars’ detailing, specially at the change in the depth. To calculate the forces in a truss model, the following conditions must be met based on the equations of appendix A of ACI 318-11 [40]:
  • Equilibrium has to be maintained.
  • Neglect was shown in the concrete components subject to tension stresses.
  • Forces in struts and ties are uniaxial.
  • External forces are applied at nodes, as depicted in Figure 21.
  • Strut width depends on the spacing between the struts while the ties’ spacing depends on the spacing between steel bars and stirrups.
To simulate the boundary circumstances during the experimental work, the supports at the two ends were chosen. The tie members for the STM elements took into account the area of steel employed in the specimen. Additionally, the pertinent modulus of elasticity was considered for both the steel and the concrete components. The model was resolved where multiple trials were done before the final model was undertaken. This was done after removing the concrete tension members that exceeded the concrete tensile strength. Equation (1) can be used to calculate the nominal resisting force in the compressive strut (Fs) in accordance with appendix A of ACI 318-11 as follows:
F s = 0.85 f c A c s β s = 0.85 × 21 × 80 × 40 × 0.75 = 42840   N      
Considering βs = 0.75, the cross-sectional area of the strut (Acs) can be calculated using Equation (2):
A c s = b s w s  
where bs and ws are the dimensions of the strut. Based on the experimental crack mapping and the forces developed in the proposed STM of the main strut, bs was considered the beam width (80 mm), and ws was taken as equal to half the beam width (40 mm). Thus, the nominal resisting force in the main strut was found to be Fs = 42,840 N.
By applying the force P shown in Figure 21, the compression force resulting in the main strut was found to be Fs = 3.29 P kN. The force diagrams of struts and ties of B1 are drawn in Figure 22. Thus, the required failure load according to the model of B1 was found to be Pu = 2P = 2 × 13,000 = 26,000 N, and the experimental result showed a failure load of 27,750 kN.
For specimen B4, the proposed STM and forces in the elements are shown in Figure 23. Thus, the required failure load according to the model of B4 was found to be Pu = 38,000 N, and the experimental result showed a failure load of 36,450 kN. It can be observed that the results obtained from the proposed model are in close agreement.

6. Conclusions

The effects of a sudden change in depth of reinforced concrete (RC) beams were experimentally investigated in this study. The effect of increasing depth, the impact of stirrups’ and their various ratios, and the splices of the longitudinal bars at the changing area either on the top or bottom bars were the study’s primary variables. In order to achieve this objective, 12 RC beam specimens in total were examined. The results were separated into two categories: conclusions for the compression side and conclusions for the tension side.
The following observations were made based on tests of RC beams with depth changes from the tension side:
The compression bars in the beams with constant depth or those with uneven depth buckled since there were no stirrups in the pure bending zones. With the lack of stirrups, changing the beam depth resulted in failure.
Using a lot of stirrups when the depth changes suddenly could cause the failure to spread outside the change region.
When a portion of the beam’s depth was increased, the distribution of cracks along the beam decreased while the crack at the shallower depth increased. As the depth of the beams increased, their flexural strength decreased by 27.75%.
With regard to the stirrups, the flexural capacity and ductility of the beams increased at the change in depth.
The experiments of RC beams with a change in depth from the compression side led to the following findings:
The failure was caused by compression forces as the depth without stirrups increased and concentrated the pressures at the top of the reduced depth. In the change zone, where the depth increased by 100 mm over 150 mm, the flexural capacity of the beams without stirrups decreased by 30%.
The flexural capacity of the beams in the change zone with the fewest stirrups, which increased by 100 mm over a depth of 150 mm, was equal to that of the beams with a constant depth of 150 mm.
The flexural capacity was barely affected by the stirrups being raised over their minimum values at the depth change, but the ductility was significantly affected.
The lap splice of the compression bars at the depth change had little impact on the flexural capacity but increased the ductility.
It can be seen that the results of the suggested strut and tie model (STM) model are in close accordance with the experimental results.

7. Future Work

However, significant research on variable RC beams, such as the following studies, has to be investigated:
Behavior of RC beams with different change ratios with depth at several distances from the support.
Effect of the shear span-to-beam depth ratio on the capacity of the variable depth beams.
Impact of shear reinforcement on the strength of the variable depth beams.
Influence of the tensile flexural reinforcement ratio and concrete grade on the capacity of the variable depth beams.
Behavior of variable depth beams considering the effects of all previous parameters.

Author Contributions

Conceptualization, S.F., E.M. and Y.O.Ö.; methodology, S.F., E.M. and Y.O.Ö.; formal analysis, S.F.; investigation, S.F.; data curation, Y.O.Ö.; writing—original draft preparation, S.F., Y.O.Ö. and E.M.; writing—review and editing, S.F., Y.O.Ö. and E.M.; visualization, S.F., Y.O.Ö. and E.M. All authors have read and agreed to the published version of the manuscript.

Funding

This research received no external funding.

Data Availability Statement

Not applicable.

Acknowledgments

The experimental tests were carried out in the reinforced concrete laboratory of the faculty of Engineering, Kafer Elshiekh University, Egypt.

Conflicts of Interest

The authors declare no conflict of interest.

References

  1. Aksoylu, C.; Özkılıç, Y.O.; Arslan, M.H. Damages on prefabricated concrete dapped-end purlins due to snow loads and a novel reinforcement detail. Eng. Struct. 2020, 225, 111225. [Google Scholar] [CrossRef]
  2. Aksoylu, C.; Özkılıç, Y.O.; Yazman, Ş.; Gemi, L.; Arslan, M.H. Experimental and Numerical Investigation of Load Bearing Capacity of Thinned End Precast Purlin Beams and Solution Proposals. Tek. Dergi 2021, 36, 102119. [Google Scholar]
  3. Özkılıç, Y.O.; Aksoylu, C.; Arslan, M.H. Experimental and numerical investigations of steel fiber reinforced concrete dapped-end purlins. J. Build. Eng. 2021, 36, 102119. [Google Scholar] [CrossRef]
  4. Özkılıç, Y.O.; Yazman, Ş.; Aksoylu, C.; Arslan, M.H.; Gemi, L. Numerical investigation of the parameters influencing the behavior of dapped end prefabricated concrete purlins with and without CFRP strengthening. Constr. Build. Mater. 2021, 275, 122173. [Google Scholar] [CrossRef]
  5. Gemi, L.; Aksoylu, C.; Yazman, Ş.; Özkılıç, Y.O.; Arslan, M.H. Experimental investigation of shear capacity and damage analysis of thinned end prefabricated concrete purlins strengthened by CFRP composite. Compos. Struct. 2019, 229, 111399. [Google Scholar] [CrossRef]
  6. Atta, A.; Taman, M. Innovative method for strengthening dapped-end beams using an external prestressing technique. Mater. Struct. 2016, 49, 3005–3019. [Google Scholar] [CrossRef]
  7. Elsanadedy, H.M. New moment-resisting beam-column joints to increase progressive collapse resistance of precast concrete buildings. J. Build. Eng. 2021, 44, 102884. [Google Scholar] [CrossRef]
  8. Sorguven, E.; Incir, S.; Highgate, J. Understanding loss generation mechanisms in a centrifugal pump using large eddy simulation. Int. J. Heat Fluid Flow 2022, 96, 108994. [Google Scholar] [CrossRef]
  9. Xia, Y.; Langelaar, M.; Hendriks, M.A. Automated optimization-based generation and quantitative evaluation of Strut-and-Tie models. Comput. Struct. 2020, 238, 106297. [Google Scholar] [CrossRef]
  10. Xia, Y.; Langelaar, M.; Hendriks, M.A. A critical evaluation of topology optimization results for strut-and-tie modeling of reinforced concrete. Comput. Aided Civ. Infrastruct. Eng. 2020, 35, 850–869. [Google Scholar] [CrossRef] [Green Version]
  11. El-Metwally, S.; Chen, W.-F. Structural Concrete: Strut-and-Tie Models for Unified Design; CRC Press: Boca Raton, FL, USA, 2017. [Google Scholar]
  12. Xia, Y.; Langelaar, M.; Hendriks, M.A. Optimization-Based three-Dimensional strut-And-Tie model generation for reinforced concrete. Comput. Aided Civ. Infrastruct. Eng. 2021, 36, 526–543. [Google Scholar] [CrossRef]
  13. El-Zoughiby, M.E. Z-Shaped Load Path: A Unifying Approach to Developing Strut-and-Tie Models. ACI Struct. J. 2021, 118, 35–48. [Google Scholar]
  14. Khosravikia, F.; Kim, H.s.; Yi, Y.; Wilson, H.; Yousefpour, H.; Hrynyk, T.; Bayrak, O. Experimental and numerical assessment of corbels designed based on strut-and-tie provisions. J. Struct. Eng. 2018, 144, 1–12. [Google Scholar] [CrossRef]
  15. Cook, W.D.; Mitchell, D. Studies of disturbed regions near discontinuities in reinforced concrete members. Struct. J. 1988, 85, 206–216. [Google Scholar]
  16. Shah, A.; Haq, E.; Khan, S. Analysis and design of disturbed regions in concrete structures. Procedia Eng. 2011, 14, 3317–3324. [Google Scholar] [CrossRef] [Green Version]
  17. Wang, Q.; Guo, Z.; Hoogenboom, P.C. Experimental investigation on the shear capacity of RC dapped end beams and design recommendations. Struct. Eng. Mech. 2005, 21, 221. [Google Scholar] [CrossRef]
  18. Shakir, Q.M. Reinforced concrete dapped end beams–state of the art. Int. J. Appl. Sci. 2018, 1, 44. [Google Scholar] [CrossRef] [Green Version]
  19. Aswin, M.; Mohammed, B.S.; Liew, M.; Syed, Z.I. Shear failure of RC dapped-end beams. Adv. Mater. Sci. Eng. 2015, 2015, 309135. [Google Scholar] [CrossRef] [Green Version]
  20. Abdul-Jawad, H.M. Modelling of dapped-end beams using Abaqus software. IJCIET 2018, 9, 1–10. [Google Scholar]
  21. Lu, W.-Y.; Lin, I.-J.; Yu, H.-W. Behaviour of reinforced concrete dapped-end beams. Mag. Concr. Res. 2012, 64, 793–805. [Google Scholar] [CrossRef]
  22. Ahmad, S.; Elahi, A.; Hafeez, J.; Fawad, M.; Ahsan, Z. Evaluation of the shear strength of dapped ended beam. Life Sci. J. 2013, 10, 1038–1044. [Google Scholar]
  23. Hussain, H.N.; Shakir, Q.M. Experimental Study of the Behavior of Reinforced Concrete Beams with Composite Dapped End under Effect of Static and Repeated Loads. Int. J. Appl. Sci. 2019, 2, 43. [Google Scholar] [CrossRef] [Green Version]
  24. Nordbrøden, H.H.; Weydahl, S.H. Testing of Fibre Reinforced Concrete Structures: Shear Capacity of Beams with Corbel-End. Master’s Thesis, Institutt for Konstruksjonsteknikk, Trondheim, Norway, 2012. [Google Scholar]
  25. Fu, Z. Use of Fibres and Headed Bars in Dapped end Beams; McGill University Libraries: Montreal, QC, Canada, 2004. [Google Scholar]
  26. Mohamed, R.; Elliott, K. Shear strength of short recess precast dapped end beams made of steel fibre self-compacting concrete. In Proceedings of the 33rd Conference on Our World in Concrete & Structures, Singapore, 25–27 August 2008; Singapore Concrete Institute: Singapore, 2008. [Google Scholar]
  27. Zamri, N.; Mohamed, R.; Elliott, K. Shear capacity of precast half-joint beams with steel fibre reinforced self-compacting concrete. Constr. Build. Mater. 2021, 272, 121813. [Google Scholar] [CrossRef]
  28. Mihaylov, B.; Rajapakse, C.; Berger, P.-H. Effect of steel fibers on the ultimate flexural behavior of dapped-end connections. Eng. Struct. 2022, 259, 114147. [Google Scholar] [CrossRef]
  29. Gold, W.J.; Blaszak, G.J.; Mettemeyer, M.; Nanni, A.; Wuerthele, M.D. Strengthening dapped ends of precast double tees with externally bonded FRP reinforcement. In Advanced Technology in Structural Engineering; ASCE: Reston, VA, USA, 2000; pp. 1–9. [Google Scholar]
  30. Taher, S. Strengthening of reentrant corner zone in recessed RC beams. In Proceedings of the Eleventh International Colloquium on Structural and Geotechnical Engineering, Cairo, Egypt, 17–19 May 2005. [Google Scholar]
  31. Taher, S.-D. Strengthening of critically designed girders with dapped ends. Proc. Inst. Civ. Eng. Struct. Build. 2005, 158, 141–152. [Google Scholar] [CrossRef]
  32. Tan, K.H. Shear strengthening of dapped beams using FRP systems, FRPRCS-5: Fibre-reinforced plastics for reinforced concrete structures Volume 1. In Proceedings of the Fifth International Conference on Fibre-Reinforced Plastics for Reinforced Concrete Structures, Cambridge, UK, 16–18 July 2001; Thomas Telford Publishing: London, UK, 2001; pp. 249–258. [Google Scholar]
  33. Esfahani, M.R.; Rakhshanimehr, M.; Mousavi, S.R. Bond strength of lap-spliced GFRP bars in concrete beams. J. Compos. Constr. 2013, 17, 314–323. [Google Scholar] [CrossRef]
  34. Khaja, M.N.; Sherwood, E.G. Does the shear strength of reinforced concrete beams and slabs depend upon the flexural reinforcement ratio or the reinforcement strain? Can. J. Civ. Eng. 2013, 40, 1068–1081. [Google Scholar] [CrossRef]
  35. Shobeiri, V. Determination of strut-and-tie models for structural concrete under dynamic loads. Can. J. Civ. Eng. 2019, 46, 1090–1102. [Google Scholar] [CrossRef]
  36. Park, J.-W.; Kuchma, D. Strut-and-tie model analysis for strength prediction of deep beams. ACI Struct. J. 2007, 104, 657. [Google Scholar]
  37. Park, J.; Kuchma, D.; Souza, R. Strength predictions of pile caps by a strut-and-tie model approach. Can. J. Civ. Eng. 2008, 35, 1399–1413. [Google Scholar] [CrossRef] [Green Version]
  38. Basha, A.; Fayed, S.; Elsamak, G. Flexural behavior of cracked RC beams retrofitted with strain hardening cementitious composites. KSCE J. Civ. Eng. 2019, 23, 2644–2656. [Google Scholar] [CrossRef]
  39. Ministry of Housing. Egyptian Code for Design and Construction of Reinforced Concrete Structures, (ECP 203-2007) 2017; Housing and Building National Research Center (HBRC): Giza, Egypt; Ministry of Housing: Cairo, Egypt, 2017.
  40. Committee, A. Building Code Requirements for Structural Concrete (ACI 318-08) and Commentary; American Concrete Institute: Farmington Hills, MI, USA, 2008. [Google Scholar]
Figure 1. Failure modes of the dapped-end beams; digits 1, 2, 3, 4, and 5 refer to a nib flexure crack, a direct shear crack, a re-entrant corner crack, a nib inclined crack, and a diagonal tension crack, respectively.
Buildings 12 02176 g001
Figure 2. Details of the control specimens: (a) control beam B0 and (b) control beam B0 *, dim. in mm.
Buildings 12 02176 g002
Figure 3. Details of the tested specimens of group G1: (a) B1, (b) B2, (c) B3, (d) B4, (e) B5, and (f) B6.
Buildings 12 02176 g003aBuildings 12 02176 g003b
Figure 4. Details of the tested specimens of group G2: (a) B1 *, (b) B2 *, (c) B3 *, and (d) B4 *.
Buildings 12 02176 g004
Figure 5. The stress–strain curves of the reinforcing bars.
Buildings 12 02176 g005
Figure 6. Test set-up and measurements of the deflections along the beam span.
Buildings 12 02176 g006
Figure 7. Crack pattern of the control beam B0: (a) crack pattern (b) buckling of the top bars.
Buildings 12 02176 g007
Figure 8. Crack pattern of the control beam B0 *: (a) crack pattern (b) the beam after the test.
Buildings 12 02176 g008
Figure 9. The crack pattern of beam B1.
Buildings 12 02176 g009
Figure 10. Crack pattern of beam B1 *.
Buildings 12 02176 g010
Figure 11. The crack pattern of beam B2.
Buildings 12 02176 g011
Figure 12. Crack pattern of beam B2 *.
Buildings 12 02176 g012
Figure 13. Crack pattern of beam B3.
Buildings 12 02176 g013
Figure 14. Crack pattern of beam B3 *.
Buildings 12 02176 g014
Figure 15. The crack pattern of beam B4.
Buildings 12 02176 g015
Figure 16. Crack pattern of beam B4 *.
Buildings 12 02176 g016
Figure 17. Crack pattern of beam B5.
Buildings 12 02176 g017
Figure 18. Crack pattern of beam B6.
Buildings 12 02176 g018
Figure 19. Load–deflection curves of the beams of G1. (a) B0; (b) B1; (c) B2; (d) B3; (e) B4; (f) B5; (g) ∆2 for all beams of G1.
Buildings 12 02176 g019aBuildings 12 02176 g019b
Figure 20. Load-deflection curves of beams of G2. (a) B1 *; (b) B2 *; (c) B3 *; (d) B4 *; (e) ∆2 for all beams of G2.
Buildings 12 02176 g020aBuildings 12 02176 g020b
Figure 21. The proposed STM of B1.
Buildings 12 02176 g021
Figure 22. The force diagram of the struts and ties of B1.
Buildings 12 02176 g022
Figure 23. The solution of B4: (a) The proposed STM and (b) The force diagram of struts and ties.
Buildings 12 02176 g023
Table 1. Components of the used mix (kg/m3).
MaterialGravelSandPortland CementWater
Amount1295596.15350200
Table 2. Results of the tested beams of group G1.
BeamPu (kN)Decrease in Pu
(%)
Decrease in Pu
(%)
Increase in Pu
(%)
∆u (mm)Failure TypeFailure Position
B038.21 *No--11.98Compression flexureClose to the loading point
B0 *37.92No1 *--22.17Compression flexureClose to the loading point
B127.7527.3526.821 *8.32Tension–compression flexureAt the drop
B23.191.991.82----Tension flexureAt the drop
B333.5512.1711.5220.910.28Tension–compression flexureAt the drop
B436.454.583.8731.3529.35Tension–compression flexureSmaller depth
B532.115.9715.3515.6713.81Compression flexureSmaller depth close to the loading point
B636.25.234.5330.4512.42Compression flexureAt the drop
* This beam was considered to be the control specimen.
Table 3. Results of the tested beams of group G2.
BeamPu (kN)Decrease in Pu
%
Increase in Pu
%
∆u (mm)Failure TypeFailure Position
B038.21 *--11.98Compression flexureClose to the loading point
B1 *29.2023.561 *6.97Compression flexureSmaller depth close to loads
B2 *30.6519.76--9.55Compression flexureAt the change
B3 *37.900.7829.7911.41Compression flexureSmaller depth close to the change
B4 *38.200.7829.7915.17Compression flexureSmaller depth close to the change
* This beam was considered to be the control specimen.
Publisher’s Note: MDPI stays neutral with regard to jurisdictional claims in published maps and institutional affiliations.

