Article

Shear Behavior of Granulated Blast Furnace Slag-Based Geopolymer-Reinforced Concrete Beams

Department of Civil Engineering, Faculty of Civil Engineering, Yıldız Technical University, Istanbul 34230,Turkey
*
Author to whom correspondence should be addressed.
Buildings 2022, 12(12), 2053; https://doi.org/10.3390/buildings12122053
Submission received: 27 October 2022 / Revised: 15 November 2022 / Accepted: 18 November 2022 / Published: 23 November 2022
(This article belongs to the Collection Advanced Concrete Materials in Construction)

Abstract

:
Active research is ongoing regarding the mechanical behavior of structural members manufactured from geopolymer concrete (GC), as it lacks standardized/codified manufacturing and design procedures. This study aims to address the shear behavior of GC beams. First, a consistent trial–error-based approach was used to develop the optimal mixture ratio (102.38/234.0 for NaOH/Na2SiO3) in terms of workability and consistency for the production of six (6) test specimens with span-to-depth ratios of (a/d) of 2.5, 3.5, and 4.5 and transverse reinforcement intervals of 10, 15, and 20 cm. Then, shear failure tests using a three-point bending setup were conducted and analyzed statistically. As a first attempt in the literature, an empirical expression for shear capacity prediction that was specifically tuned for GC beams was given. This expression, along with seven other similar expressions for ordinary concrete beams from the literature, and various practice codes were tested against a pool of experimental shear failure results given by four (4) different researchers. As a measure of the predictive capability, coefficient of variation (COV = standard deviation/average) values were obtained, and the lowest COV value of 0.305 suggested that the expression obtained the highest predictive capability, whereas more common practice codes such as ACI318, EN1992, and ENV1992 produced COV values of 0.435, 0.374, and 0.627, respectively. Finally, this study provides a working expression for the shear capacity estimation of GC beams and a mixture ratio for the practical manufacturing conditions of workability and consistency, with a slump value of 270 mm and a 90 min setting time.

1. Introduction

In the modern world, the construction industry is one the primary sources of environmental concern. These concerns have triggered a remarkable desire for the use of environmentally friendly materials and techniques [1,2,3]. In particular, manufacturing materials and techniques with low carbon emission levels and the capacity for recycling have attracted attention [4,5]. In parallel, research activity on eco-friendly and sustainable methods and materials are gaining momentum. In this context, one of the key ingredients of the industry for many years, ordinary Portland cement (OPC), has been put on the table. Calcination and combustion processes in the manufacturing of OPC are primary sources of greenhouse effects due to high carbon emissions [6]. In order to produce 1 ton of OPC, 0.8 to 1 ton of carbon is released into the atmosphere [7] and, in total, these clinker operations are directly responsible for 7% of the overall CO2 emissions worldwide [8], which accelerates global climate change. One promising product in this context is pozzolan-based geopolymer materials, addressed by Davidovis in 1979 [9], who cited its cement-like binding properties. Investigations started by examining this emerging material as a substitute for OPC. In [10], the authors provided a general review on the material properties of fly-ash-based geopolymer concrete (GC). They specifically addressed the compressive strength characteristics and resistance to aggressive environments and elevated temperature levels, and they concluded that it is on par with or even better than the OPC concrete in these aspects. In a more recent comprehensive review study [11], Ahmed et al. mentioned that with the usage of agricultural and industrial waste ashes as the primary binder rather than OPC, geopolymer concrete (GC) saves energy, reduces waste, cuts building costs, and lowers CO2 emissions. Regarding the structural properties of reinforced GC beams, it was concluded that the specification codes for OPC concrete beams, such as ACI 318, could predictably be developed and used for reinforced GC beams, since they behaved and failed in the same way as conventional OPC concrete beams. They concluded that these comparable results could improve the usage of the existing codes of practice for the design of structural elements utilizing GC. Studies in the literature on geopolymer concrete can be roughly divided into two parts. The first part is related to the material side, including the chemical properties, mixture ratios, and resistance to environmental factors. The second part consists of studies which address the mechanical behavior of structural members made from geopolymer concrete. The paragraphs below briefly address the current situation of the literature.
Being a new material, geopolymer-based concrete lacks standardized/codified manufacturing procedures. One key issue is related to the mixture ratios of the ingredients used to obtain a workable and easy-to-produce end product for the casting of structural members. In [12], Fang et al. addressed the workability and mechanical properties of fly ash slag concrete. They concluded that its short setting time and poor workability impede its structural applications. Many different recipes were suggested. In [13], Patankar et al. used Na2SiO3 and NaOH as activators with pozzolan selected as a fly ash. They found that an alkaline liquid/binder ratio beyond 0.25–0.35 resulted in segregation, whereas below this ratio, the workability was in question. Al Bakri et al. [14] found that an alkaline-liquid-to-binder ratio of 0.4 meets the practical considerations of consistency and workability. Krishna A.R. et al. also arrived at the same ratio of 0.4, and they showed that solutions prepared with higher molar concentrations consistently yielded higher compressive strengths [15]. In terms of the main mechanical parameters, such as Young’s modulus, studies indicate similar or higher values when compared with materials produced with OPC [16,17]. There is not yet an established universal consensus on the mixture ratios and ingredients, especially those for targeted structural performance levels, and this problem is open to debate.
Research on the mechanical aspects and applications of structures has been considerably limited with respect to the material-only studies, especially when dealing with the behavior under specific types of loadings, with shear being one of them. In [11], Ahmad et al. stressed that, unlike the structural members produced with OPC concrete, design equations and guides for GC are still fairly limited. An almost exhaustive list of studies in the literature, which are mostly experimental, is given here. In his dissertation, Chang [18] worked on geopolymer concrete beams made with fly ash pozzolan with average compressive strengths between 45 and 56 MPa. Nine (9) beams with different reinforcement ratios of 1.74%, 2.32%, and 3.14% and stirrup spacings of 75, 100, and 125 mm were tested. These beams, with a shear span-to-depth ratio (a/d) of 2.5, showed more ductile response when compared to the OPC concrete beams. A single mixture ratio was provided for their production, but no information was given on the workability or consistency of the geopolymer mortar. In another foundational study, Wu et al. [19] found that the shear capacity of GC beams is on par or even superior to the OPC concrete beams. For this purpose, they constructed 18 GC beams and 3 more OPC concrete control beams with different reinforcement ratios, heights, and depths. Including a mixture table for three different ratios of targeted compressive strengths, this study also did not address the links between the mixture and the compressive strength, workability, and consistency in a direct manner. Concerning the relationship between the molarity of the solutions in the production phase and the resulting shear capacity, Cheng Wu et al. found that similar response characteristics (ductility and crack width formation) were observed with respect to the OPC concrete beams in deep beam classification (a/d ≈ 2–2.4). The tested shear capacities were compared with the shear bearing formulae in the literature, which were produced for OPC concrete beams. It was seen that the best estimates were obtained with the formula of Choi et al. [20,21]. Another study [22] by Madheswaran et al. addressed the design aspect of the shear capacity for a mixture of slag-based and fly-ash-based GC beams. GC T-beams with an a/d ≈ 1.9–2.5 were manufactured with a selected mixture ratio and tested. The results were compared with the associated formulae from ACI 318-08 [23]. It was found that formulae used with the same compressive strength of the OPC concrete beam can be safely used to design the shear capacity of GC beams for a no stirrup case and for stirrup spacings of 120, 180, and 240 mm. In this study, it was also seen that similar fracture patterns were observed between the OPC concrete and slag-based GC beams. In [24], Huang et al. explored the usage of basalt fibers as shear and flexural reinforcements in GC beams. The effects of rectangular and spiral basalt shear reinforcements with same ratios were tested. It was found that the spiral specimens performed better in terms of the shearing failure. In another design-based study [25], Visintin et al. attempted to measure the shear friction capacity of slag-based GC beams in order to estimate the shear strength via a segmental approach which was originally developed for OPC concrete beams. They reported consistent results with the segmental approach after testing eight GC beams with flexural reinforcement ratios of 0.89, 1.07, and 1.34% and with shear span-to-depth ratios (a/d) of 2.0, 2.5, 3.0, and 3.5. In [26], Aldemir et al. compared the bending and shear performances of 12 beams made from OPC and geopolymer concrete beams with fresh and recycled aggregate. The specimens had a span-to-depth ratio of 0.5 to 1.65, and the average concrete compressive strengths were between 34 and 37 MPa. They concluded that the predictions based on TS500 were better than the predictions based on ACI318. Moreover, the TS500 predictions for the OPC concrete (69%) were better than those for the GC (58%). Yacob et al. [27] reported deformation patterns in the shear failure of four OPC and geopolymer concrete beam specimens. They used span-to-depth ratios of 2 and 2.4 and observed similar responses for both materials in terms of the ductility and failure mechanisms. In another study [28], Hawileh et al. tested beam specimens made from OPC and geopolymer concrete in three-point and four-point bending setups. They concluded that the normalized capacity of the geopolymer beams was on par with the beams made from ordinary concrete.
Our survey of the current literature, to the best of the authors’ knowledge, indicated no shear-capacity-estimating expression for structural members made from geopolymer concrete. As is well known, these types of empirical expressions are commonly used for the design of structural members made from ordinary concrete in the practice codes. In this study, as a first attempt in the literature, we developed an empirical shear-capacity-estimating expression specifically tuned for geopolymer beams based on the specimens we tested in a three-point bending setup. First, in the experimental part, different mixture ratios with sodium silicate and sodium hydroxide were tested for the determination of the optimal consistency and workability for the specimen preparation. The trial-and-error-based approach was used for the practical considerations. Then, the chosen mixture with the most suitable physical and mechanical properties was used to cast six geopolymer beams for the shear testing. We targeted the shear response by choosing shear span-to-depth ratios (a/d) of 2.5, 3.5, and 4.5 and prepared specimens without stirrups and with stirrup spacings of 10, 15, and 20 cm. The shear response of these beams was observed in the context of the general capacity, ductility, load–deflection relationship, strain in reinforcements, failure mode and crack pattern development, and other design issues mentioned in the codes (ACI318-19 [29], Eurocode 2 [30,31], TS500 [32], and NZS 3101 [33]) for OPC concrete members. In the end, a power-law-type expression was proposed for shear strength capacity estimation, which is based on the earlier studies [34,35] of the second author. Proposed equations, along with other numerous predictive shear capacity formulae [29,30,31,32,33,36], from the literature were compared with the test results of not only this study but also results of other experimental studies concerning the shear capacity of the GC beams [18,19,23,37]. By comparing the coefficients of variation (COV) values, the superior performance of the proposed equation was established with respect to other formulae [29,30,31,32,33,36] applied in a broad range of experiments [18,19,23,37] from the literature. Our conclusions also include the suggestion of the use of a clear mixture for practical consistency and workability issues during specimen preparation.

2. Experimental Program

Six different trial mixtures were investigated in order to identify the optimal features of slag-based GC in terms of its consistency, workability, and strength. A mixture with these desired features was selected for the production of beam members, which were then tested in a three-point bending setup. This section consists of two main parts. The first part includes information about the trial mixture ingredients, slump, and strength results for each mixture. The second part includes information about the experimental setup and the beams’ geometric properties, reinforcement, general testing, and instrumental considerations.

2.1. GC Mixture Design

2.1.1. Materials

Natural river sand with a moisture ratio of 4% and a unit weight of 2.61 t/m3 was mixed with crushed sand, including fine and coarse aggregates with unit weights of 2.66, 2.70, and 2.74 t/m3, respectively, for all the mixtures. The aggregate gradation used for all the mixtures is shown in Figure 1. As can be seen, the gradation percentiles are within the acceptable limits for the maximum aggregate sieve size (22.4 mm) according to TS-706 EN 12620 + A1 [38].
The binder, a granulated blast furnace slag (GBFS), was selected for all the mixtures and was obtained from a ready-mix concrete supplier, with the constitutive composition given in Table 1. The standard percentile and ratio values related to its usability in OPCC production were verified for the selected GBFS, and it was deemed suitable for the production of GC as well.
The mixtures mainly differ in terms of the selected weight ratios of the chemical activator and super plasticizer for the different mixtures. Chemical activator solutions of 8 mol sodium hydroxide (NAOH–unit mass of 1.30 t/m3) and 32% sodium silicate (Na2SiO3–unit mass of 1.35 t/m3) were prepared. In order to increase the workability, the Optima 100 (unit mass of 1.05 t/m3, pH: 4.00, chloride content <0.1%) superplasticizer was used.

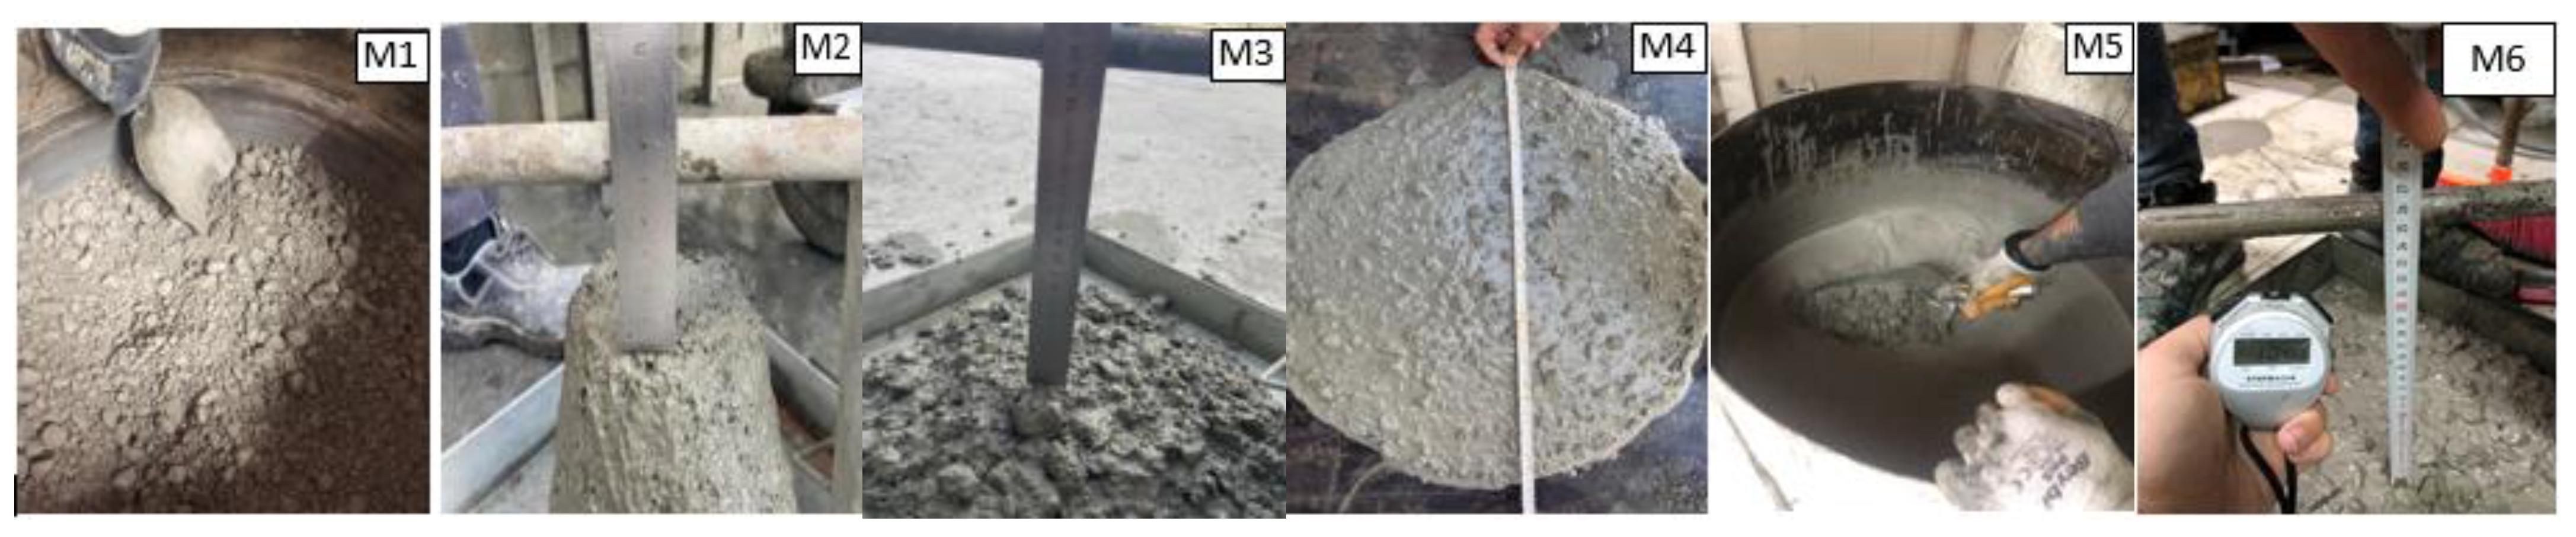
2.1.2. GC Mixing Procedure

A gravity mixer with a capacity of 0.15 m3 was used for the design of the mixtures. Their production began with the mixing of solid ingredients with predetermined (as indicated below) mass ratios from fine to coarse in order to increase the homogeneity. Coarse and fine aggregates were added first, which were followed by crushed and natural sands. Finally, GBFS was added, and this completed the dry mixture. The mass ratios for the dry mixture ingredients were the same for all attempts and are given as 450 kg/m3 for the GBFS, 322 kg/m3 for the naturel sand, 458 kg/m3 for the crushed sand, 354 kg/m3 for the fine aggregate, and 450 kg/m3 for the coarse aggregate. After a minimum of three minutes of dry mixture time, in order to ensure the mixture’s homogeneity, solutions of alkaline activators and superplasticizer were added, and the mixer continued to operate uninterrupted for three more minutes in this wet setting. In this way, the final mixture became ready for the formwork. Different mass ratios of sodium hydroxide, sodium silicate, and superplasticizer solutions, which were used with same dry mixtures, resulted in six different GC attempts (end mixtures), which were named as M1, M2, M3, M4, M5, and M6. The differences due to these altered alkaline liquid and superplasticizer proportions are discussed below.

2.1.3. GC Mixing Proportions

It is generally accepted that the water/binder ratio should be around 0.45 to 0.7 (TS 13515 [40]) for ordinary Portland cement concrete (OPCC). We started with the lower ratio of 0.2 for the iterations and progressed towards optimal mixture in order to document the effects of this important parameter over a broader range. Mixture 1, M1, included 29.25 kg/m3 of NaOH and 58.5 kg/m3 of Na2SiO3, which, in total, amounted to 20% of GBFS (fixed at 450 kg/m3). The amount of plasticizer used was 4.5 kg/m3 (1%). It was observed that this ratio was not enough for the activation of the binder, which resulted in premature coagulation, as can be seen in Figure 2. In mixture 2, M2, this ratio was doubled but resulted in a very poor workability (slump = 60 mm) with the same amount of plasticizer (1%) as M1. Nevertheless, cubic samples with a mean 3-day compressive strength of 23.41 MPa were obtained. In mixture 3, M3, the alkali liquid/binder ratio was kept same, but the amount of plasticizer was increased considerably (18%) in order to increase the workability of M2. This resulted in a favorable slump value of 210 mm, but in this case, a considerable loss in the compressive strength (3 days, 6.37 MPa) occurred. Moreover, a sudden loss in the initial consistency was observed within 15 min of mixing. Thus, we can conclude that despite its initial contribution to the workability, this plasticizer was ineffective in terms of sustaining the consistency at this very high ratio. In the literature [41,42,43,44,45], it is indicated that Na2SiO3 is the primary agent that effects the long-term workability and consistency, rather than NaOH. The fourth attempt, M4, was prepared with, respectively, 3× and 3.5× the amount of NaOH and Na2SiO3 used in M1. The plasticizer was decreased to 1%, the same as in M1. Although a 3-day compressive strength of 30.62 MPa was obtained, it was not possible to push the sudden loss in consistency beyond 25 min. For mixture 5, M5, without changing the plasticizer ratio (1%), we continued to experiment with higher ratios of NaOH and Na2SiO3, this time using 3.5× and 4.5× the amount used in M1. This proved to be too much, and significant segregation occurred. Finally, for mixture 6, M6, the selected values of 3.5× and 4× the amounts of NaOH and Na2SiO3 in M1 proved to be optimal in terms of the workability (slump 270 mm), consistency (beyond 90 min), and compressive strength (3 days, 35.1 MPa). The 9 cubes produced for M6 (3 for each of the 3-, 7-, and 28-day strength measurements) yielded standard deviations of 2.37, 2.39, and 4.83 MPa, which were deemed acceptable in terms of the homogeneity. It turned out that the alkaline-liquid-to-binder ratio of 0.75 was best suited for the intended GC. Table 2 summarizes the mixture ratios. Figure 2 includes the general steps for the mixtures within 10 min of mixing.
Table 2 also includes the average compressive strengths of the tested standard cubes (15 cm × 15 cm × 15 cm) made with each mixture. It is seen that the 3-day and 7-day compressive strengths are 0.54 and 0.71 of the 28-day compressive strength for M6 GC. These values are significantly higher than the typical values obtained for the OPC concrete, which attained 0.4 and 0.65 of the 28-day strength for 3 days and 7 days, respectively. Thus, with M6, a relatively faster arrival at the target strength occurred. No considerable change in the temperature occurred within one hour of the initial mixing before setup.

2.2. GC Test Beams

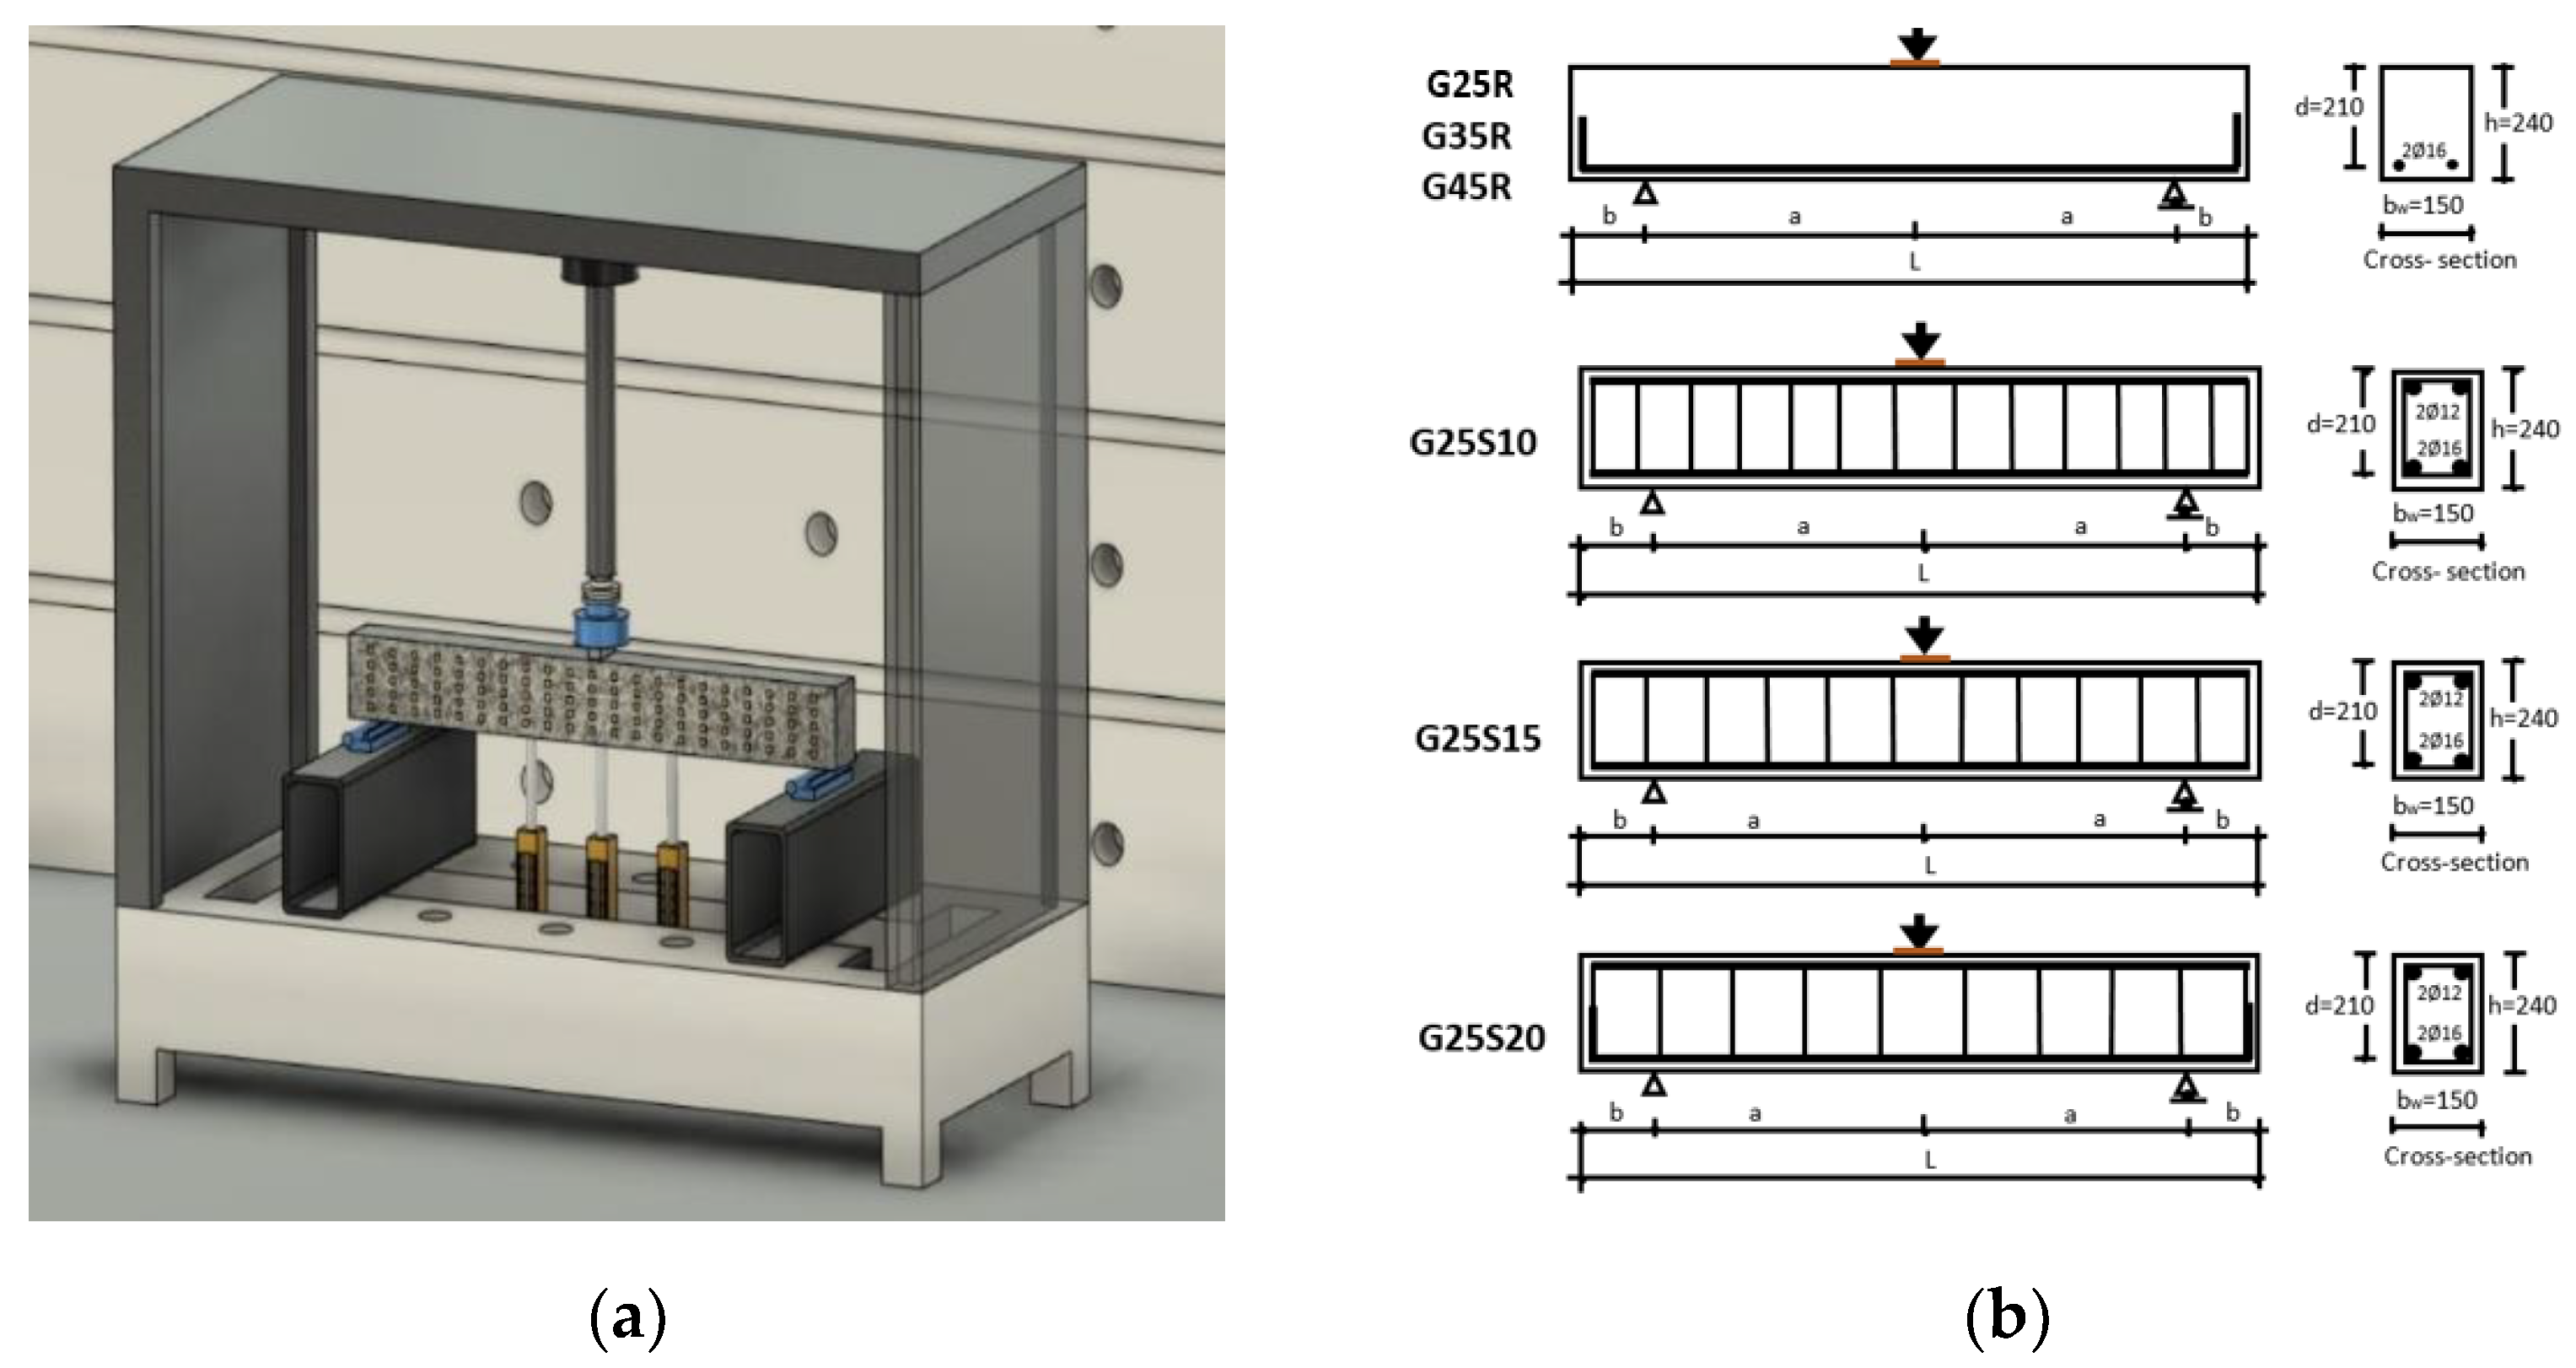
2.2.1. Test Setup and Instrumentation

The tested geopolymer beams manufactured with the M6 mixture ratio are shown in Figure 3a,b. These GC beams were tested in a three-point bending setup, and the shear responses were analyzed. The setup was displacement-controlled with a displacement rate of 30 μm/s. The applied load and mid-span deflections were monitored and recorded through a computer-aided data acquisition system. The beams were loaded beyond the ultimate load until the load dropped to approximately 80% of its peak value. A single actuator acting in the middle of the span was used with two steel supports, one being a roller and the other the pinned type. The disk-shaped actuator head pressed a steel block with a width and thickness of 5 cm and 4 cm, respectively, for the sake of a uniform load distribution. Vertical displacements at the mid-span and locations 20 cm left and right of the center were recorded via attached linear variable differential transformers (LVDTs) at these points.

2.2.2. Properties of Beams

In Figure 3b, the geometric properties and reinforcements for the GC beams can be seen. All the beams have the same cross-section geometry, with different lengths. The width (bw), effective depth (d), and free span length (2a) are 150 mm, 210 mm, and 1050/1470/1890 mm, respectively. Thus, the resulting shear span-to-depth ratios (a/d) of the beams are 2.5, 3.5, and 4.5, which strongly favors shear-dominated failure rather than bending. All the beams were reinforced with 2 Ø 16 bars of tension (ratio ρ = 1.28%) and 2 Ø 12 bars of compression (ratio ρ ′ = 0.72%), except for the beam without transverse reinforcements. As seen in Figure 3, there is a difference in the transverse reinforcement ratios. Four different values of this ratio ( ρ w), which ranged from 0% to 0.67%, were used. The beam labelling included a combination of letters and numbers: G to indicate the GC (geopolymer concrete) series; 2.5 to indicate the a/d; R for the reference beam without stirrups; and S to indicate the transverse reinforcement ( Ø 8) spacing of 10, 15, and 20 cm, which corresponded to different ratios of the transverse reinforcement in terms of the spacings. For example, a beam of series G with a transverse reinforcement spacing of 10 cm and with diameters of the tensile and compression reinforcements equal to 16 mm and 12 mm, respectively, is labelled as G25S10.
The properties of the beams are summarized in Table 3. While computing the upper limit for the transverse reinforcement ratio ρ w (ACI318 [22]), the target shear strength was taken as the shear strength corresponding to the yielding of the longitudinal reinforcement. In other words, the ratios of the transverse reinforcements in the beams were determined in such a way that they were smaller than the ratio computed from the shear strength, corresponding to the yielding of the longitudinal reinforcement, thus ensuring shear-dominated failure.
The material properties of the reinforcing bars are given in Table 4, where fy and fu are the yield and ultimate strengths of the longitudinal reinforcement, respectively, and fyw and fyw are the yield and ultimate strengths of the transverse reinforcement, respectively.

3. Results

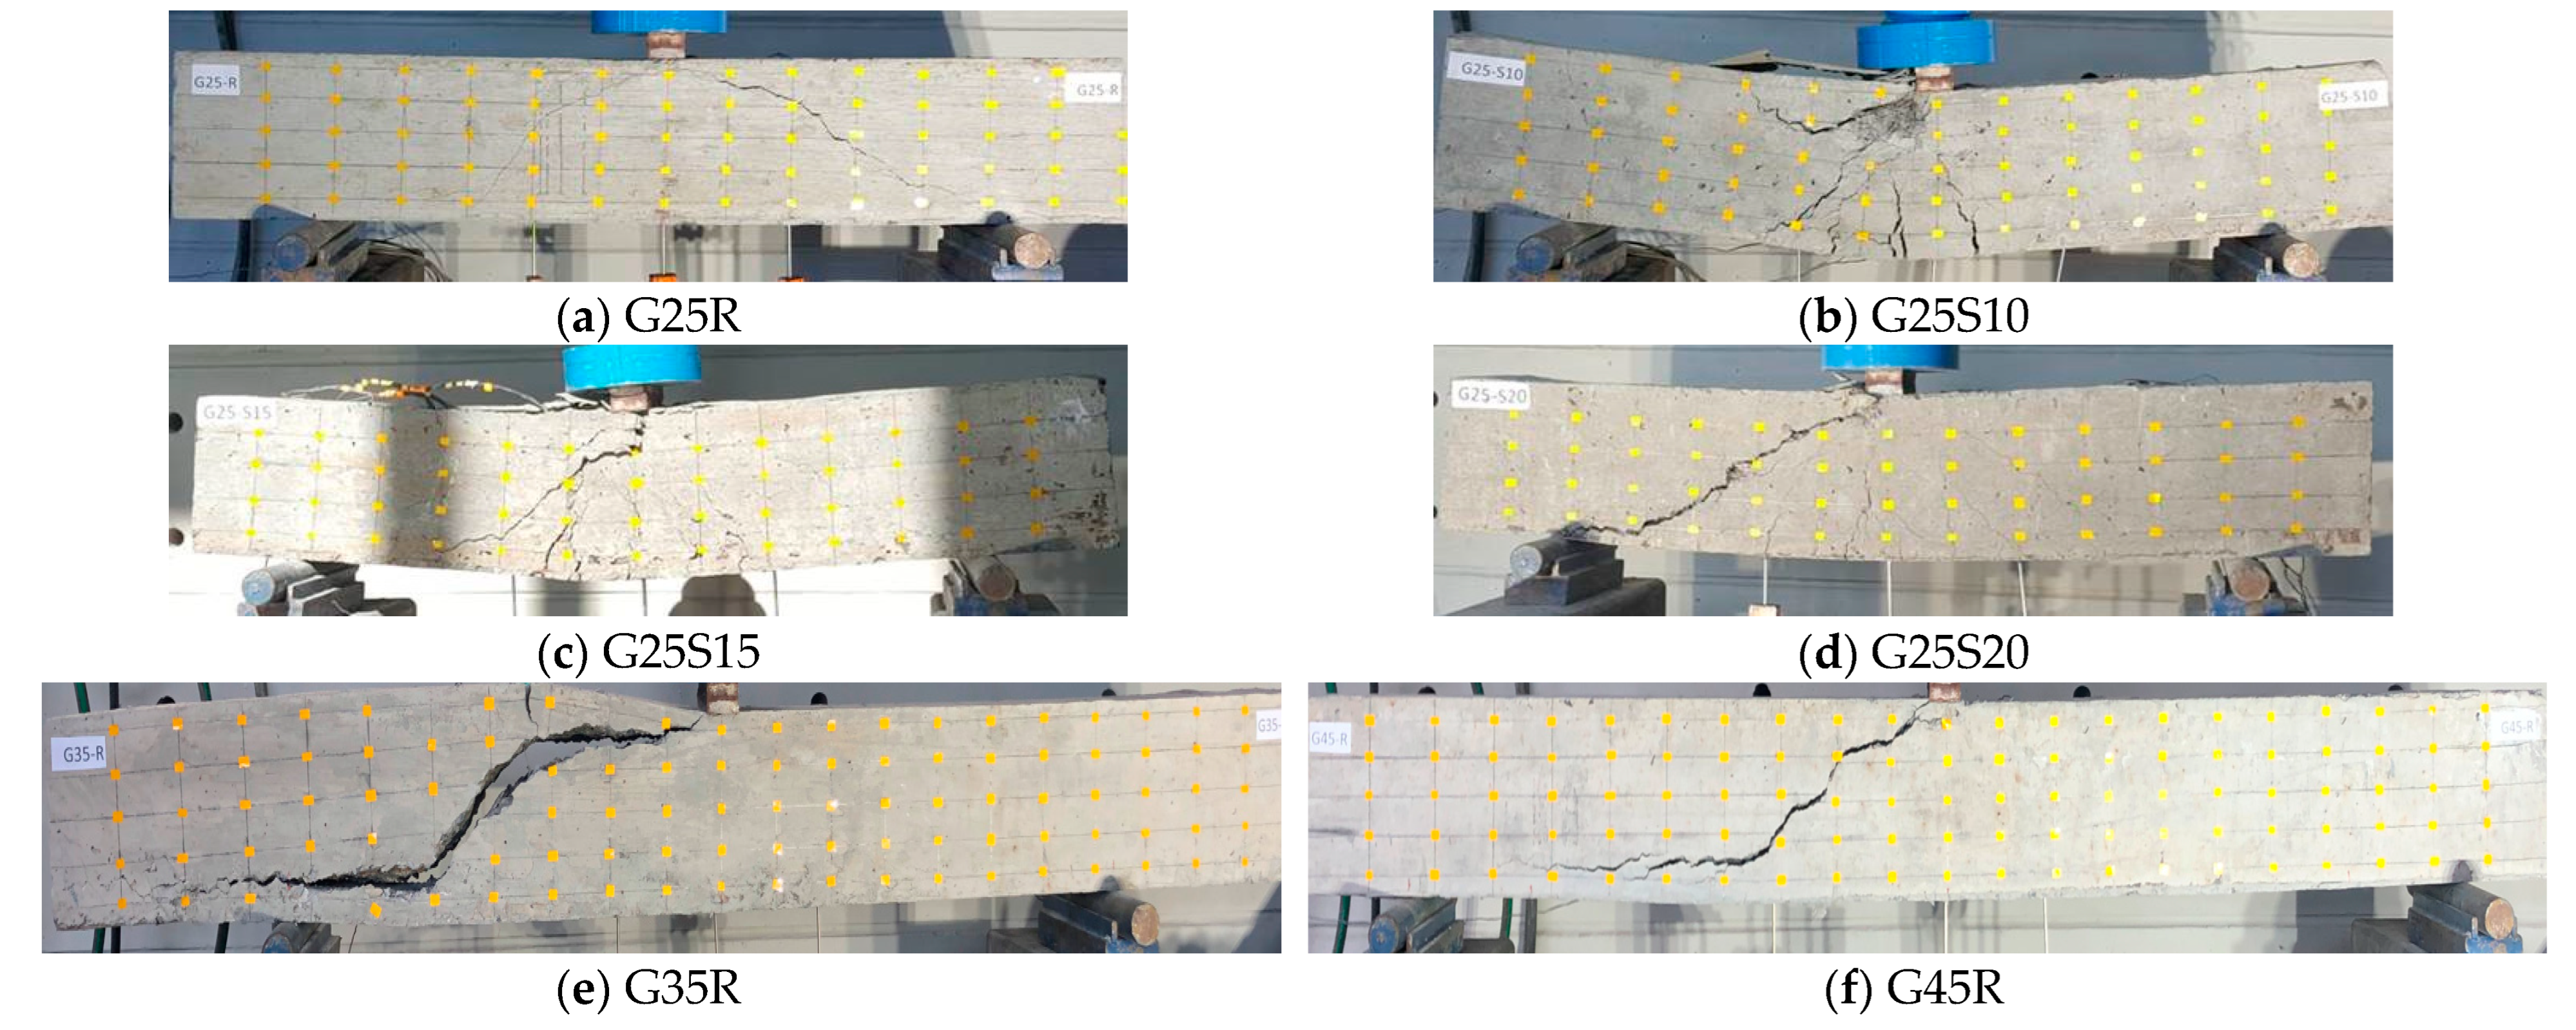
3.1. Crack Pattern and Failure Mode

Figure 4 shows the crack patterns of the reinforced GC beams, which are typical for the shear failure. Crack formations were observed between the load application point and the support in the early stages of loading in all the beams tested in the three-point bending configuration. In addition to diagonal shear cracks, some flexural cracks were also detected in the beams with higher transverse reinforcement ratios, as the shear strength, due to the shear reinforcement, came closer to the shear strength calculated based on the yielding of the longitudinal reinforcement. In general, the cracks started at the bottom of the beam close to the support and propagated in depth towards the load application point, with a diagonal configuration reminiscent of the typical shear failure for all beams. In the G25R and G25S20 beams, which were the two weakest ones in terms of the shear capacity, failure occurred as a result of clear diagonal cracks extending from the support to the load application point. No visible flexural cracks were observed on the G25R beam, whereas G25S20 had some traces of flexural cracks. Flexural cracks became more evident in the G25S15 and G25S10 beams as the shear capacity increased. However, both beams showed a failure mode with the shear fracture. The G25S10 beam showed local crushing of the concrete at the load application point. No slipping failure of the longitudinal reinforcements and transverse reinforcements was observed in any of the beams.

3.2. Peak Load and General Behavior

The test results are summarized in Table 5, which includes the cracking load, where the first major shear crack (diagonal) was observed, in addition to the peak (ultimate) load with the corresponding mid-span deflection. It is seen that the diagonal cracking load (Pcr) in the GC series of beams varies between approximately 30% and 67.5% of the maximum load carrying capacity (Pmax). As expected, similar to reinforced OPPC beams, the effect of the transverse reinforcement ratio on the shear capacity is significant. The ratio of the displacement when the beam reaches the diagonal crack strength to the displacement when it reaches the maximum shear capacity can be seen to vary between approximately 10% and 44%. Again, as expected, similar to reinforced OPCC beams, the effect of the transverse reinforcement ratio to the ductility is significant. The failure modes were dominated by shear for all the beams except for the G25S10 beam, which failed in a combined shear-flexural pattern.

3.3. Load-Deflection Relationship

Figure 5 shows the load–midspan deflection curves of the test beams. As the load increased, stiffness loss occurred due to crack formation and propagation in all the beams. There was a sudden loss in stiffness when the load reached around 180 kN for the beams with transverse reinforcements. Up to this point, in terms of the loading history, beams G25S15 and G25S20 had very similar stiffness responses. They had similar ultimate load values as well. The difference becomes apparent in the post-peak load values. It was observed that G25S15 behaved in a considerably more ductile fashion. Beam G25S10 had both a slightly higher stiffness and, again, a slightly higher ultimate load compared to the others, whereas its ductility was similar to that of the G25S15 beam. Beam G25R-G35R-G45R, lacking transverse reinforcement, performed poorly, as expected, and failed to reach even the half of the average ultimate load observed for the beams with transverse reinforcements. The ductility was also almost negligible, as the brittle shear crack of the GC dominated the response in the absence of transverse reinforcements. Overall, the effects of the increasing frequency of the transverse reinforcement on the stiffness, strength, and ductility gains were evident.

4. Shear Strength Predictions

The related equation given in ACI 318-19 states that the shear strength must exceed the shear demand, as shown in Equation (1):
Ø v n v u ,
where v n is the shear strength of an RC member and v u is the shear demand. The nominal shear strength of reinforced OPCC beams can be determined as the direct summation of the shear capacities of concrete and transverse reinforcements only:
v n = v c + v s ,
where v c is the shear strength of the concrete and v s is the shear strength of the stirrups. There is no shear strength relation cited for GC beams in the literature, whereas there are many for OPCC beams. Here, for the sake of enabling a comparison with the equation proposed in this study, some of the most common shear capacity equations were gathered. Table 6 includes these selected equations, which were specifically proposed for ordinary Portland cement concrete (OPCC) beams. These are the ACI318-19 Building Code [29], based on the experimental results of numerous beams; Turkish Building Code (TS500, 2000) [32], based on the adaptation of the ACI Code simplified equation; NZS 3101, (1995) [33]; EN (1992) [30,31]; CEB-FIP90 (1993) [46], a model code equation introduced empirically; and Zsutty’s equation (1968) [36], deduced by multiple regression analysis. The proposed equation stems from one of the earlier works of the corresponding author. In Arslan [35], the second author proposed the concrete’s shear capacity based on the basic principles of the mechanics and parametric study of experimental data. As indicated in Arslan [35], the contribution of the concrete to the shear strength can be taken as the cracking shear strength and can also be expressed as:
v c = 0.3 ( c d f c + ρ f c ) ( 300 d ) 0.28 ,
In this study, by adding the transverse reinforcement’s contribution to Equation (3), a combined shear strength equation was developed for the GC beams with transverse reinforcements based on the test results. Details of this derivation are given in the next section. All the equations were then applied to a database consisting of 31 GC specimens with transverse reinforcements (25 gathered from published experimental works in the literature and 6 from the current study: G25R-G35R-G45R, G25S10-15-20), so that the overall prediction performance of each one could be evaluated. Although no other equation in the literature was specifically tuned for GC, it is still noteworthy that the equations were tested with specimens from their own training pools, with each naturally favoring its own dedicated equation.

4.1. Contribution of Transverse Reinforcement to the Shear Strength and Proposed Equation

The general literature on the contribution of transverse reinforcement, including the key points, was summarized in Arslan et al. [34]. In ACI 318-19 [29], Frosch [47], and Zararis [48], three models were considered for the prediction the contribution of transverse reinforcement. The first model simply assumes that the whole capacity of the transverse reinforcement contributes to the shear strength, as follows:
v s = ρ w f y w
The second model was proposed by Frosch [47] and takes into account the number of transverse reinforcements crossed by the critical crack instead of the transverse reinforcement ratio. The model also includes a horizontal projection of the critical crack in order to account for the anchorage length of the transverse reinforcement.
The third model was proposed by Zararis [48] and defines the contribution of the transverse reinforcement to the shear strength of RC beams as:
v s = ( 0.25 a d + 0.5 ) ρ w f y w
In this study, the contribution of the transverse reinforcement ( v s ) to the shear strength for each tested beam was computed by subtracting the shear strength of the beams without transverse reinforcement ( v c ) from the shear strength of the beams with transverse reinforcement. Assuming that the compressive strengths of the concrete values are similar, a regression analysis was undertaken to identify the participation of the whole capacity ρ wfyw in the net contribution of the transverse reinforcement. In regard to the net contribution of ρ wfyw, it is assumed to be as a power law, as in Equation (6):
v u v c = 1.49 ( ρ w f y w ) 0.16
Then, Equations (3) and (6) can be directly added to express the total shear capacity of the GC beams, as given in Equation (7) below. The first part refers to concrete only and was developed for OPCC beams without any reinforcement, whereas the second part refers only to the transverse reinforcement contribution that is specifically fitted for GC beams with transverse reinforcement:
v n = 0.3 ( c d f c + ρ f c ) ( 300 d ) 0.28 + 1.49 ( ρ w f y w ) 0.16
Here, c is the depth of the compression zone above the tip of the diagonal crack, d is the effective depth, and ρ is the tensile reinforcement ratio.

4.2. Evaluation of the Proposed Equation

The proposed Equation (7) for the shear strength and equations given in the literature (Table 6) were tested against a pool of experiments which were gathered from the literature. In this general comparison, 25 specimens (beam tests) from four different studies (Chang et al. [18]; Wu et al. [19]; Lee et al. [37]; Madheswaran et al. [23]) and 6 specimens from this study were used. All the beams were made from GC, and almost all of them (29 out of 31) had a common a/d ratio of 2.5 in order to target the shear response. All the other parameters, including the heights, widths, lengths, effective depths (210 ≤ d ≤ 350 mm), reinforcement ratios (for longitudinal 1.28 ≤ ρ ≤ 3.14 (%), for transverse 0.52 ≤ ρ wfyw ≤ 5.11), and compressive strengths (26.20 ≤ fc ≤ 78.70 MPa), were different, which indicates a broad spectrum for the comparison of the prediction performance. The effects of fc, a/d, d, and ρ wfyw on the proposed shear strength are discussed below. The proposed model produced a mean value (MV), standard deviation (SD), and covariance (COV) of 1.46, 0.444, and 0.305, respectively, based on the ratios of the experimental shear strength to the proposed shear strength for 28 specimens. The collective results of the other equations in Table 6 can be seen in Table 7. Figure 6 visualizes the distribution of these ratios for the proposed equation.
Figure 6a–d show the dispersion of the ratios (experimental to proposed) with respect to the discrepancies of fc, a/d, ρ wfyw, and d, respectively. It is understood that the prediction quality of the proposed equation could not be directly linked to these parameters, as it is obvious from the graphs that no specific pattern can be observed. In fact, it can be suggested that the depth of the experimental pool of the beams (i.e., experimental data) is very limited, inhomogeneous, and not controlled, affecting our ability to infer the individual effects of the mentioned parameters on the prediction capability. Further research, including controlled experiments, is required to identify the individual effects of these parameters on the prediction capability and sensitivity analysis.
Table 7 summarizes the comparisons of the proposed equation and the equations of Table 6, the ACI318 Building Code [29], TS500, Turkish Standard code [32], NZS 3101, New Zealand Code [33], Eurocode EN (1992, standard method) [30], Eurocode ENV (1992, variable strut inclination method) [31], Eurocode EN1992:2004 (basic structural design) [30], and Zsutty [36]. The resulting coefficient of variation (COV) obtained via the proposed equation is 91% of that obtained via the NZS Code [33], 84% of that obtained via Zsutty’s equation, 70% of that obtained via ACI318 [29], and 73% of that obtained via TS500 [32]. ENV 1992 [30] performed the worst, with a COV value of 0.627. As seen in Table 7, the proposed equation for the shear strength of GC beams with transverse reinforcement is better than the others in terms of the accuracy and uniformity of the prediction.

5. Conclusions

The following conclusions can be drawn from the results of this study:
  • It can be seen that the proposed shear strength equation, Equation (7), for GC beams with a/d values as small as 2.5 (which is generally considered as the boundary between slender and deep beams) resulted in the lowest coefficient of variation (COV) value of 0.305 for the test data from four different studies. Hence, Equation (7) provides better results than the six codes of practice and Zsutty’s equation, which were proposed for the prediction of the shear strength of GC beams (Table 7). However, further research is required to verify the quality and universality of the proposed equation, since the test data for GC beams are still very limited in the literature.
  • The ratio of the experimental to the proposed shear strength does not seem to be affected by variations in the fc, a/d, ρ wfyw, and d in a clear manner. However, again, it is important to note that the test data were not homogeneous and not controlled for parameter variations. Thus, a sensitivity analysis was not possible.
  • It was observed that the strength of the GC over 28 days reached approximately 21~59% of the strength in 3 days and 71~76% in 7 days, respectively. In the OPC concrete, these values were approximately 40% in 3 days and 65% in 7 days. Thus, it is clear that GC gains strength more rapidly in the initial days compared to ordinary Portland cement concrete.
  • Considering the strength, consistency, and workability, the M6 mixture with an alkaline liquid/binder ratio of 0.75 is the most suitable mixture for the production of slag-based geopolymer concrete. It manages to maintain its consistency for approximately 90 min and has a slump value of 270 mm, which is practical for structural element manufacturing.
  • When the energy-dissipating capacities are examined, it is observed that the G25S10 beam has the highest ductility and the G25R beam has the lowest in the G25 series. As the distance between the transverse reinforcements decreases, the ductility level and ultimate load increases. While shear cracks dominated the failure mode in the G25R, G25S20, and G25S15 beams, shear-flexure cracks in the G25S10 beams caused their failure. It is seen that the failure mode changes from shear to bending as the transverse reinforcement spacing decreases in GC beams as well. These findings are similar to the behavior of OPC concrete beams, as reported in [19].
In future studies, with emerging data, more refined expressions should be considered. A paper concerning numerical simulations for a deeper understanding of the mechanical response of shear failure is currently being developed. Moreover, we are planning to include a mechanical analysis and performance evaluation of the shear retrofitting of damaged GC beams, as increasing the shear capacity via retrofitting has become a very actively employed method in the research field. The application of various retrofitting methods developed for ordinary concrete beams [49,50,51,52,53,54,55] would follow as a future research direction.

Author Contributions

Conceptualization, M.O. and G.A.; methodology, M.O.; validation, M.O. and G.A.; investigation, M.O.; data curation, G.A.; writing—original draft preparation, M.O. and G.A.; writing—review and editing, G.A.; supervision, G.A. All authors have read and agreed to the published version of the manuscript.

Funding

This work was supported by the Research Fund of the Yıldız Technical University, grant number FDK-2020-3820.

Data Availability Statement

The data presented in this study are available on request from the corresponding author. The data are not publicly available, as the data also forms part of an ongoing study.

Conflicts of Interest

The authors declare no conflict of interest.

References

  1. Mohan, H.T.; Jayanarayanan, D.; Mini, K.M. A Sustainable approach for the utilization of PPE biomedical waste in the construction sector. Eng. Sci. Technol. Int. J. 2022, 32, 101060. [Google Scholar] [CrossRef]
  2. Ferdous, W.; Manalo, A.; Siddique, R.; Mendis, P.; Zhuge, Y.; Wong, H.S.; Lokuge, W.; Aravinthan, T.; Schubel, P. Recycling of landfill wastes (tyres, plastics, and glass) in construction–A review on global waste generation, performance, application and future opportunities. Resour. Conserv. Recycl. 2021, 173, 105745. [Google Scholar] [CrossRef]
  3. Lim, Y.Y.; Thong, M.; Pham, T.M.; Kumar, J. Sustainable alkali activated concrete with fly ash and waste marble aggregates: Strength and Durability studies. Constr. Build. Mater. 2021, 273, 122795. [Google Scholar] [CrossRef]
  4. Venkatarama, R.B.V. Sustainable materials for low carbon buildings. Int. J. Low-Carbon Technol. 2009, 4, 175–181. [Google Scholar] [CrossRef] [Green Version]
  5. Turner, L.K.; Collins, F. G Carbon dioxide equivalent (CO2-e) emissions: A comparison between geopolymer and OPC cement concrete. Constr. Build. Mater. 2013, 43, 125–130. [Google Scholar] [CrossRef]
  6. Malhotra, V.M. Introduction: Sustainable development and concrete technology. Concr. Int. 2002, 24, 7. [Google Scholar]
  7. Davidovits, J. False Values on CO2 Emission for Geopolymer Cement/Concrete published in Scientific Papers; Technical Paper #24; Geopolymer Institute Library: Paris, France, 2015. [Google Scholar]
  8. Caijun, S.; Jiménez, A.F.; Palomo, A. New cements for the 21st century: The pursuit of an alternative to Portland cement. Cem. Concr. Res. 2011, 41, 750–763. [Google Scholar] [CrossRef]
  9. Davidovits, J. Geopolymers: Inorganic polymeric new materials. J. Therm. Anal. Calorim. 1991, 37, 1633–1656. [Google Scholar] [CrossRef]
  10. Al Bakri, M.; Mohammed, M.; Kamarudin, H.; Niza, H.I.K.; Zarina, Y. Review on fly ash-based geopolymer concrete without Portland Cement. J. Eng. Technol. Res. 2011, 3, 1–4. [Google Scholar] [CrossRef]
  11. Ahmed, H.U.; Mahmood, L.J.; Muhammad, M.A.; Faraj, R.H.; Qaidi, S.M.; Sor, N.H.; Mohammed, A.S.; Mohammed, A.A. Geopolymer concrete as a cleaner construction material: An overview on materials and structural performances. Clean. Mater. 2022, 5, 100111. [Google Scholar] [CrossRef]
  12. Fang, G.; Ho, W.K.; Tu, W.; Zhang, M. Workability and mechanical properties of alkali-activated fly ash-slag concrete cured at ambient temperature. Constr. Build. Mater. 2018, 172, 476–487. [Google Scholar] [CrossRef]
  13. Patankar, S.V.; Jamkar, S.S.; Ghugal, Y.M. "Effect of water-to-geopolymer binder ratio on the production of fly ash based geopolymer concrete. Int. J. Adv. Technol. Civ. Eng. 2013, 2, 79–83. [Google Scholar] [CrossRef]
  14. Al Bakri, A.M.M.; Kamarudin, H.; Karem, O.A.K.A.; Ruzaidi, C.M.; Rafiza, A.R.; Norazian, M.N. Optimization of Alkaline Activator/fly ASH Ratio on The Compressive Strength of Manufacturing fly ashed-based Geopolymer. Appl. Mech. Mater. 2012, 110–116, 734–739. [Google Scholar] [CrossRef]
  15. Rao, A.K.; Kumar, D.R. Effect of various alkaline binder ratio on geopolymer concrete under ambient curing condition. Mater. Today: Proc. 2020, 27, 1768–1773. [Google Scholar] [CrossRef]
  16. Chowdhury, S.; Mohapatra, s.; Gaur, M.; Dwivedi, G.; Soni, A. Study of various properties of geopolymer concrete–A review. Mater. Today: Proc. 2021, 46, 5687–5695. [Google Scholar] [CrossRef]
  17. Feng, K.N.; Ruan, D.; Pan, Z.; Collins, F.; Bai, Y.; Wang, C.M.; Duan, W.H. Effect of strain rate on splitting tensile strength of geopolymer concrete. Mag. Concr. Res. 2014, 66, 825–835. [Google Scholar] [CrossRef]
  18. Chang, E.H. Shear and Bond Behavior of Reinforced Fly Ash-Based Geopolymer Concrete Beams. Ph.D. Thesis, Curtin University of Technology, Department of Civil Engineering, Perth, Australia, 2009. [Google Scholar]
  19. Wu, C.; Hwang, H.J.; Shi, C.; Li, N.; Du, Y. Shear tests on reinforced slag-based geopolymer concrete beams with transverse reinforcement. Eng. Struct. 2020, 219, 110966. [Google Scholar] [CrossRef]
  20. Choi, K.K.; Hong-Gun, P.; Wight, J.K. Unified shear strength model for reinforced concrete beams-Part I: Development. ACI Struct. J. 2007, 104, 142. [Google Scholar]
  21. Choi, K.K.; Hong-Gun, P. Unified shear strength model for reinforced concrete beams Part II: Verification and simplified method. ACI Struct. J. 2007, 104, 153. [Google Scholar]
  22. Madheswaran, C.K.; Ambily, P.S.; Dattatreya, L.J.K.; Sathik, S.A.J. Shear Behavior of Reinforced Geopolymer Concrete Thin-Webbed T-Beams. ACI Mater. J. 2014, 111, 1. [Google Scholar]
  23. ACI 318-08; ACI Committee 318, Building Code Requirements for Structural Concrete (ACI 318-08) and Commentary. American Concrete Institute: Farmington Hills, MI, USA, 2008; 473p.
  24. Huang, Z.; Chen, W.; Hao, H.; Chen, Z.; Pham, T.M.; Tran, T.T.; Elchalakani, M. Shear behaviour of ambient cured geopolymer concrete beams reinforced with BFRP bars under static and impact loads. Eng. Struct. 2021, 231, 111730. [Google Scholar] [CrossRef]
  25. Visintin, P.; Ali, M.M.; Albitar, M.; Lucas, W. Shear behaviour of geopolymer concrete beams without stirrups. Constr. Build. Mater. 2017, 148, 10–21. [Google Scholar] [CrossRef]
  26. Aldemir, A.; Akduman, S.; Kocaer, O.; Aktepe, R.; Sahmaran, M.; Yildirim, G.; Almahmood, H.; Ashour, A. Shear behaviour of reinforced construction and demolition waste-based geopolymer concrete beams. J. Build. Eng. 2022, 47, 103861. [Google Scholar] [CrossRef]
  27. Yacob, N.S.; ElGawady, M.A.; Sneed, L.H.; Said, A. Shear strength of fly ash-based geopolymer reinforced concrete beams. Eng. Struct. 2019, 196, 109298. [Google Scholar] [CrossRef]
  28. Hawileh, R.A.; Badrawi, H.A.; Makahleh, H.Y.; Karzad, A.S.; Abdalla, J.A. Behavior of reinforced concrete beams cast with a proposed geopolymer concrete (GPC) mix. Int. J. Appl. Sci. Eng. 2022, 19, 1–11. [Google Scholar] [CrossRef]
  29. ACI 318-19; Building Code Requirements for Structural Concrete—Commentary on Building Code Requirements for Structural Concrete (ACI 318R-19). American Concrete Institute (ACI): Farmington Hills, MI, USA, 2019.
  30. EN 1992-1-1:2004; CEN. Eurocode 2: Design of Concrete Structures, Part 1-1: General Rules and Rules for Buildings. CEN: Brussels, Belgium, 2004.
  31. ENV 1992-1-1; CEN (Comité Européen de Normalisation). Eurocode 2: Design of Concrete Structures. Part 1-1: General Rules and Rules for Buildings. CEN: Brussels, Belgium, 1992.
  32. TS–500; Requirements for Design and Construction of Reinforced Concrete Structures. Turkish Standards Institute: Ankara, Turkey, 2000. (In Turkish)
  33. NZS 3101; New Zealand Standard Code of Practice for the Design of Concrete Structures (NZS 3101). NZS: Wellington, New Zealand, 1995.
  34. Arslan, G.; Keskin, R.S.O.; Birincioglu, M.I. Shear strength of steel-fibre-reinforced concrete beams with web reinforcement. Proc. Inst. Civ. Eng.-Struct. Build. 2019, 172, 267–277. [Google Scholar] [CrossRef]
  35. Arslan, G. Shear strength of reinforced concrete slender beams. Proc. Inst. Civ. Eng. Struct. Build. 2010, 163, 195–205. [Google Scholar] [CrossRef]
  36. Zsutty, T.C. Beam shear strength prediction by analysis of existing data. ACI J. 1968, 65, 943–951. [Google Scholar]
  37. Lee, K.M.; Choi, S.; Choo, J.F.; Choi, Y.C.; Yoo, S.W. Flexural and Shear Behaviors of Reinforced Alkali-Activated Slag Concrete Beams. Adv. Mater. Sci. Eng. 2017, 2017, 5294290. [Google Scholar] [CrossRef] [Green Version]
  38. TS-706 EN 12620+A1; Aggregates for Concrete. Turkish Standards Institute: Ankara, Turkey, 2009. (In Turkish)
  39. TS 15167-1; Ground Granulated Blast Furnace Slag for Use in Concrete, Mortar and Grout—Part 1: Definitions, Specifications and Conformity Criteria. Turkish Standards Institute: Ankara, Turkey, 2006. (In Turkish)
  40. TS 13515; Complementary Turkish Standard for Theimplementation of TS EN 206, Manufacturing and Conformity Assessment of Concrete Used In Situ and Precast Structures and Structural Precast Products for Buildings and Civil Engineering Structures. Turkish Standards Institute: Ankara, Turkey, 2021. (In Turkish)
  41. Cheng, H.; Lin, K.L.; Cui, R.; Hwang, C.L.; Cheng, T.W.; Chang, Y.M. Effect of solid-to-liquid ratios on the properties of waste catalyst–metakaolin based geopolymers. Constr. Build. Mater. 2015, 88, 74–83. [Google Scholar] [CrossRef]
  42. Ma, C.K.; Awang, A.Z.; Omar, W. Structural and material performance of geopolymer concrete: A review. Constr. Build. Mater. 2018, 186, 90–102. [Google Scholar] [CrossRef]
  43. Li, N.; Shi, C.; Zhang, Z.; Zhu, D.; Hwang, H.J.; Zhu, Y.; Sun, T. A mixture proportioning method for the development of performance-based alkali-activated slag-based concrete. Cem. Concr. Compos. 2018, 93, 163–174. [Google Scholar] [CrossRef]
  44. Yang, K.H.; Song, J.K.; Lee, K.S.; Ashour, A.F. Flow and Compressive Strength of Alkali-Activated Mortars. ACI Mater. J. 2009, 106, 50–58. [Google Scholar]
  45. Phoo-ngernkham, T.; Maegawa, A.; Mishima, N.; Hatanaka, S.; Chindaprasirt, P. Effects of sodium hydroxide and sodium silicate solutions on compressive and shear bond strengths of FA–GBFS geopolymer. Constr. Build. Mater. 2015, 91, 1–8. [Google Scholar] [CrossRef]
  46. CEB-FIP Model Code 90. Structural Effects of Time-Dependent Behaviour of Concrete, Comite Euro International du Béton, 6th ed.; Thomas Telford: London, UK, 1993; ISBN 978-2-88394-019-2.
  47. Frosch, R.J. Behavior of large-scale reinforced concrete beams with minimum shear reinforcement. ACI Struct. J. 2000, 97, 814–820. [Google Scholar] [CrossRef]
  48. Zararis, P.D. Shear strength and minimum shear reinforcement of reinforced concrete slender beams. ACI Struct. J. 2003, 100, 203–214. [Google Scholar] [CrossRef]
  49. Gemi, L.; Aksoylu, C.; Yazman, Ş.; Özkılıç, Y.O.; Arslan, M.H. Experimental investigation of shear capacity and damage analysis of thinned end prefabricated concrete purlins strengthened by CFRP composite. Compos. Struct. 2019, 229, 111399. [Google Scholar] [CrossRef]
  50. Aksoylu, C.; Yazman, Ş.; Özkılıç, Y.O.; Gemi, L.; Arslan, M.H. Experimental analysis of reinforced concrete shear deficient beams with circular web openings strengthened by CFRP composite. Compos. Struct. 2020, 249, 112561. [Google Scholar] [CrossRef]
  51. Özkılıç, Y.O.; Yazman, Ş.; Aksoylu, C.; Arslan, M.H.; Gemi, L. Numerical investigation of the parameters influencing the behavior of dapped end prefabricated concrete purlins with and without CFRP strengthening. Constr. Build. Mater. 2021, 275, 122173. [Google Scholar] [CrossRef]
  52. Arslan, M.H.; Yazman, Ş.; Hamad, A.A.; Aksoylu, C.; Özkılıç, Y.O.; Gemi, L. Shear strengthening of reinforced concrete T-beams with anchored and non-anchored CFRP fabrics. Structures 2022, 39, 527–542. [Google Scholar] [CrossRef]
  53. Özkılıç, Y.O.; Aksoylu, C.; Gemi, L.; Arslan, M.H. Behavior of CFRP-strengthened RC beams with circular web openings in shear zones: Numerical study. Structures 2022, 41, 1369–1389. [Google Scholar] [CrossRef]
  54. AL-Shalif, S.A.; Akın, A.; Aksoylu, C.; Arslan, M.H. Strengthening of shear-critical reinforced concrete T-beams with anchored and non-anchored GFRP fabrics applications. Structures 2022, 44, 809–827. [Google Scholar] [CrossRef]
  55. Allah, N.K.; El-Maaddawy, T.; El-Hassan, H. Geopolymer-and Cement-Based Fabric-Reinforced Matrix Composites for Shear Strengthening of Concrete Deep Beams: Laboratory Testing and Numerical Modeling. Buildings 2022, 12, 448. [Google Scholar] [CrossRef]
Figure 1. Aggregate gradation curve.
Buildings 12 02053 g001
Figure 2. Slump Tests.
Buildings 12 02053 g002
Figure 3. (a) Test Setup. (b) Reinforcement Configuration.
Buildings 12 02053 g003
Figure 4. Cracking patterns and failure modes of the tested beams.
Buildings 12 02053 g004
Figure 5. Load–deflection Curves: (a) G25 Series; (b) R Series.
Buildings 12 02053 g005
Figure 6. Experimental shear strength distribution by parameter. (a) Dispersion of the ratios of the experimental to the proposed shear strength for various values of the concrete compressive strength (fc); (b) slenderness ratio (a/d); (c) nominal transverse reinforcement strength ( ρ wfyw); (d) effective depth.
Buildings 12 02053 g006
Table 1. Chemical composition of GBFS.
Typical PropertyStandard Values 1Percentile (%)
SO3Maximum 2.50.15
Al2O3-14.83
Fe2O3-0.61
Na2O-0.80
K2O-1.10
ClMaximum 0.100.01
CaO + MgO + SiO2Minimum 66.6782.5
1 (TS 15167-1, [39]).
Table 2. The mixing ratios of the materials in the geopolymer mixture.
Compressive Strength (MPa)% of 28-Day Strength
MixtureNaOH
(kg/m3)/Na2SiO3
(kg/m3)
Superplasticizer (kg/m3)Slump
(mm)
3
Days
7
Days
28
Days
3
Days
7
Days
M129.25/58.54.5Coagulated---------------
M258.50/117.04.56023.4130.2939.780.590.76
M358.50/117.081.02106.3721.6330.610.210.71
M487.75/204.84.523030.6240.3254.900.560.73
M5102.38/263.34.5Segregated---------------
M6102.38/234.04.527035.1046.4565.000.540.71
Table 3. Properties of the beams.
Beamfc (MPa)s (cm) ρ w a/da (mm)b (mm)L (mm)
G25R56.0------2.55251751400
G25S1069.5100.672.55251751400
G25S1564.0150.452.55251751400
G25S2070.0200.342.55251751400
G35R48.26------3.57353652200
G45R62.39------4.59451552200
Table 4. Mechanical properties of the reinforcement.
Reinforcement Diameter Ø 8 Ø 12 Ø 16
fyw (MPa)fyw (MPa)fyw (MPa)fyw (MPa)fyw (MPa)fyw (MPa)
609.80788.34506.18662.39595.65739.83
Table 5. Critical loads and deflections of the beams.
BeamsFirst CrackUltimate StatusFinal Note
Pcr (kN)δcr (mm)TypeLocationPmax. (kN)δPmax. (mm)Damage Type
G25S2072.682.42ShearShear Span209.0115.78ShearThe experiment ended with a shear failure near the left support.
The experiment ended with a shear failure near the left support.
The experiment ended with a shear-flexure failure.
The experiment ended with a shear failure near the right support.
The experiment ended with a shear failure near the left support.
G25S1565.521.94Shear Shear Span 213.4316.04Shear
G25S1069.201.72Flexure Flexure Region221.0616.66Shear-Flexure
G25R70.201.68ShearShear Span103.903.82Shear
G35R50.163.24ShearShear Span75.745.98Shear
G45R63.476.48ShearShear Span82.5612.02Shear
Table 6. Summary of different shear strength models for OPCC beams.
ReferenceEquations 1
ACI 318 v n = ( 1 6 f c + ρ w f y w )   ( a / d ) 2.5
TS 500 v n = ( 0.2275 f c + ρ w f y w ) 0.22 f c
NZSBeams without stirrups
0.08 f c ( 0.07 + 10 ρ ) f c 0 ( a / d ) 2.0 v c = ( 0.07 + 10 ρ ) f c
Beams with stirrups
v n = ( v c + ρ w f y w )
EN 1992:2004 1 c o t θ 2.5 , v = 0.6 for f c 60 MPa , v = 0.9 f c 200 > 0.5 for f c > 60   MPa ,
v r d , s = 0.90 ρ w f y w c o t   θ , v r d , m a x = 0.9 v f c d ( c o t   θ / ( 1 + c o t 2 θ ) )
EN 1992 v R d 1 = 0.035 f c 2 / 3 k ( 1.2 + 40 ρ ) , v R d 2 = 0.03 v f c , v = 0.7 f c / 200 0.5 ,
ρ 0.02 , k = 1.6 d 1 , d in m, f c in MPa,
v n = m i n ( v R d 2 ;   v R d 1 + 0.90 ρ w f y w )
ENV 1992 v R d 2 = 0.06 v f c / ( c o t   θ + t a n   θ ) , v R d 3 = 0.9 ρ w f y w c o t   θ , v = 0.7 f c / 200 0.5 , 26.6 ° < θ < 45 ° , ρ w f y w 0.38 v f c , v n = min   ( v R d 2 ; v R d 3 )
Zsutty’s v c r = 2.2 ( f c ρ d / a ) 1 / 3 + ρ w f y w
1 (SI units).
Table 7. Verification of the proposed shear strengths for GC slender beams.
Exp/PredictionsMVSDCOV
1 Exp./2 Prop.1.4570.4440.305
Exp./ACI3181.5510.6750.435
Exp./TS5001.2920.5410.418
Exp./NZS1.1270.3780.336
Exp./EN19921.5320.5720.374
Exp./EN1992: 20041.6041.0210.637
Exp./ENV 19922.0161.2650.627
Exp./Zsutty’s1.2890.4700.365
1 Exp.= experimental, 2 prop.= proposed.
Publisher’s Note: MDPI stays neutral with regard to jurisdictional claims in published maps and institutional affiliations.

