Article

A Parametric Framework to Assess Generative Urban Design Proposals for Transit-Oriented Development

1
School of Architecture and Art, North China University of Technology, Beijing 100144, China
2
Centre for Design Innovation, Swinburne University of Technology, Hawthorn, VIC 3122, Australia
3
Edinburgh School of Architecture and Landscape Architecture, Edinburgh College of Art, The University of Edinburgh, Edinburgh EH1 1JZ, UK
4
Melbourne School of Design, University of Melbourne, Masson Rd, Parkville, VIC 3010, Australia
*
Author to whom correspondence should be addressed.
These authors contributed equally to this work.
Buildings 2022, 12(11), 1971; https://doi.org/10.3390/buildings12111971
Submission received: 4 October 2022 / Revised: 6 November 2022 / Accepted: 10 November 2022 / Published: 14 November 2022
(This article belongs to the Collection Strategies for Sustainable Urban Development)

Abstract

:
Urban design has been valuable in bringing the principles of transit-oriented development (TOD) into reality. However, a majority of recommendations summarized by scholars for promoting TODs through urban design have failed to promote the progress of the urban design. The main reason for this issue is the long-standing tradition of design decision-making based on designers’ experience and the lack of quantitative assessment feedback on design schemes. With the development of big data and artificial intelligence, optimisation-based generative design has been explored to overcome the limitations of experience-based urban design approaches. However, the techniques and workflows are still not mature enough for designers to adopt. In response to these challenges, this study proposes a framework that integrates the generative design method and data-driven decision-making approach for urban design solutions that better implement the basic principles of TODs. Based on the urban design intelligence for TODs, this framework uses parametric tools and models to evaluate the generative urban design proposals, providing timely feedback to support the design decisions. The framework is applied to a case study to examine the feasibility. It is demonstrated that this approach succeeds in selecting optimal TOD design solutions. The role of designers’ decision-making in generative urban design, as well as the importance of quantitative and qualitative assessment in experience-based decision-making, are highlighted.

1. Introduction

Transit-oriented development (TOD) is a planning strategy that promotes non-motorized travel modes through mixed-use, high-density, and walkable neighborhoods within walking distance of transportation stations. It is widely recognized as an essential paradigm for fostering sustainable urban development since it contributes to reducing air pollution and regional congestion, boosting economic development, and improving urban vitality [1,2]. On the one hand, TOD can reduce residents’ demands for private cars, thereby alleviating traffic congestion and reducing greenhouse gas emissions. Previous studies have established that residents of transit-oriented neighborhoods are more likely to travel by public transportation instead of driving and take more leisurely walks than residents of car-oriented neighborhoods [3]. TOD projects in many cities have contributed significantly to local GHG reduction goals. As an example, in the Chicago Metropolitan Region, the GHG emission of the average household in the neighborhoods near the transport station is reduced by 43 percent compared with non-TOD areas. According to SDG goals, combating climate change is currently an important task for all countries in the world. In this context, TOD should be greatly promoted to stop global warming. On the other hand, by reducing transportation costs and increasing employment opportunities, TOD can promote a robust regional economy. A number of studies have indicated that local taxes benefit from TOD through increasing land prices and sales tax revenues from restaurants and retailers [1,2]. In addition to promoting active transportation modes and facilitating regional economic development, TOD has the potential to bring vitality to communities. The mixed-land uses in TODs provide favorable conditions for various social activities and interactions [4]. It has been found that people living in TODs have significantly higher levels of connection with their neighbors than in other communities [5]. The performance of TODs is predicated on four major principles: (1) walkability—providing a pleasant, continuous, networked pedestrian environment along with a wide range of experiences and amenities; (2) transit accessibility—ensuring close proximity in distance or time for residents and workers to reach transit facilities; (3) density—optimizing employment and residential densities along transit corridors or station areas to promote walking and transit use; (4) diversity—providing access to retail, commercial, and civic services, employment, and recreational facilities without needing to travel by automobile [6,7]. A well-performed urban design can be a key mechanism for transforming these guidelines into successful cases. Jacobson and Forsyth [8] enumerated twelve aspects of good urban design initiatives for TODs (Table 1). These twelve elements are derived from the literature review and understood in depth through case studies. Of all the aspects, five are highlighted regarding place-making. First of all, designing on a human scale is fundamental to creating a pedestrian-friendly environment. According to environmental psychology, people are born with the perception of their surroundings. The characteristics of the built environment (such as the sense of enclosure, sky view factor, etc.) play a major role in the comfort that people feel in the space, and the comforts of the walking environment are closely related to residents’ travel demand [9,10]. For instance, the atmosphere created by excessively tall buildings with narrow streets tends to inhibit residents from moving around the streets. With this in mind, the walkability of residents can be facilitated by controlling the scale of buildings and streets. The ratio of building height to street width in TODs is supposed to be designed to improve the pedestrian experience. Second, public spaces emerge in the case studies as key components of TODs [10]. Open spaces not only provide opportunities for residents to interact and exercise, but also allow for various events. As suggested by case studies, the combination of transit stops and well-designed open spaces can improve the recognition of the TODs and increase transit ridership [8]. Third, pedestrian safety serves as an important factor for people to embrace the public spaces in TODs. Previous research has established that real and perceived traffic safety is closely related to residents’ walking behavior to transport [11]. In terms of urban design solutions in TOD, security is a consideration for the way the driveways and sidewalks are joined. To ensure people walk safely in transit-oriented neighborhoods, places such as parks require a ban on vehicle traffic [12]. Fourth, the variety of land use, visual experience and social aspects are all essential aspects in the design of public spaces. TODs need sufficient public spaces for walking and cycling, and also spaces to promote interaction among various social groups. It is generally accepted in urban design that the diversity in visual experiences creates a sense of place, which gives open spaces distinct characteristics, and therefore, enhances their attractiveness to residents. These have led to more people congregating in open spaces with more events taking place. Inviting and lively public spaces in TOD areas will, in turn, attract more residents to move in and bring about more transit ridership [2]. Fifth, street connections are essential for the creation of pedestrian movements [13]. Well-organized street patterns enable pedestrians and cyclists to move continuously in various ways [8]. Elaborate footpaths and cycle paths are the basis for residents to approach transit facilities. Subsequently, Ogra and Ndebele [14] generalized six variables that are vital for reaching the goals of the TODs, which are design, diversity, density, distance, destination, and demand management. In terms of the built environment design, it is pinpointed that providing various amenities is the key to walkable transit-oriented neighborhoods. According to previous studies, the diverse range of amenities can provide residents with abundant activities and thus stimulates walking and cycling trips [15,16]. In addition, all kinds of amenities make walking less boring and bring joy to pedestrians [12].
Based on the four principles, the above aspects (human scale, public spaces, safety, variety of visual experience, and amenity diversity) regarding urban design for TODs provide valuable suggestions for urban designers [17]. Nevertheless, useful advice plays an insignificant role in guiding potential urban design improvements. Few design initiatives are given quantitative or qualitative evaluations, which can result in a lack of evidence and feedback to support design decisions. Starting with good intentions but ending with poor design execution can result in no improvement or even harm to the surrounding environment [18]. Thinking further about this particular issue, it roots in a long tradition of the experience-based design workflow, i.e., designers use their own experience or personal preferences to determine the design solutions. In the majority of countries, the evidence-based design approach is not yet widespread. Therefore, some schemes are limited by the designers’ subjective opinions or clients’ requirements, and often fail to be effective TOD proposals. In recent years, parametric and generative design has received considerable attention, which explores potential solutions to decision-making issues in the field of architecture, urban design, and urban planning [19,20]. Using big data and algorithms, these approaches can yield unlimited possible solutions that are beyond one’s imagination, with automated optimization solutions based on predefined objectives [21,22,23,24,25,26]. Compared with the traditional decision-making approach, they are advantaged in overcoming the limitation of individual thoughts to inform more feasible alternatives, and are able to generate data-based feedback for each solution. To date, scholars have explored the potential of generative urban design in the light of various objectives. The works related to TODs centered around design generation and optimization, based on walkability or/and amenity distribution [21,24,27,28]. Using a walk score as an indicator, the network optimization model created by Tarek and Christoph [21] provided a promising insight for later studies. They used genetic algorithms (the natural selection-based approaches to solve both constrained and unconstrained optimization issues) to optimize the initially generated street network design and obtained a series of viable options. However, this approach was later criticized for lacking consideration of the impact of amenities on the street network. A new workflow to create street networks and amenity distribution schemes was developed by Yang et al. [17], which takes a good account of the interplay between amenities and networks and the adaptability of specific contexts. While the weakness is that they fail to provide information on building configurations that can be influenced by network layouts, which is inappropriate to be considered separately in urban design. Lima [24] et al. leveraged multiple optimization algorithms to create urban networks in terms of transit accessibility and infrastructure cost. Unfortunately, this approach idealises the local context, and its ability to solve real-world problems is uncertain. More importantly, the quantitative indicators still need to be complemented by qualitative dimensions [29]. This is because some solutions meet the quantitative metrics well, but are not preferred by residents due to the weakness in qualitative features (e.g., urban design quality, maintenance of historical sites, etc.) On account of the complexity of the urban system, design decisions cannot yet entirely rely on algorithms. Designers still have the responsibility to perform qualitative analysis and make the final decision. In response to these concerns, this paper proposes an original framework to evaluate and interpret generative urban design proposals for TODs. This is the first comprehensive framework that transforms urban design principles for TOD into an evaluation methodology that utilizes both data feedback and experts’ experience to guide designers in their decision-making. It is later applied to a case study in a TOD area in the city of Glen Eira, Melbourne, to validate its capacity to address real-world issues.

2. Data and Method

2.1. Assessment Indicators and Methods

Given its enlightening and objective-based optimization capabilities, the generative urban design method is utilized in the study to propose different solutions for TOD. A t the core of this study is the creation of an evaluation framework for these generative urban design proposals. On the basis of the good urban design recommendations summarized by Jacobson, Forsyth, Ogra, and Ndebele, the evaluation method is developed. For some aspects, indicators can be set up for quantitative assessment. (1) It is commonly recognized that the ratio of building height to street width has a strong relationship with how people feel in urban space. Therefore, it is chosen as the assessment indicator in the framework to reflect the comfort level of residents moving around in public spaces. As suggested by scholars, the ideal height-to-width ratios for public spaces are between 1:1 to 1:3 [30,31,32]. The ratios of design proposals that fall within this interval range are identified as the optimal ratios. (2) A walk score is a reliable metric of walkability recognized by many experts [33]. While most walkability metrics apply to a region, the walk score quantifies both the walkability of an area and the walkability of a housing unit. Visualizing the walkability of each housing unit in a TOD area is vital for evaluating design strategies. For example, different street network designs may result in the same regional walkability results, but contribute differently to the walkability results of each building block. Understanding the variation in walkability between individual units can help designers make trade-offs in their solutions. The Walk Score algorithm, which ranges from 0 to 100 scores, uses the distance decay function (Equation (1)) to rate locations based on the minimum distance to amenities in each category [34,35]. A higher score for a location means a more walkable level. (3) TODs encourage a wide variety of amenities. However, it is not the case that the greater the variety and number of amenities, the better. When the demand for amenities in an area exceeds the supply, it would be a loss for investors. The Amenity score is a metric that seeks to quantify the disparity between the supply and demand of various amenity types in an area, which can help the decision-makers to determine the right number and type of amenities. An Amenity score close to zero means that the supply of amenities in the study area is close to the demand. A value below zero for a certain amenity type means that it is not well configured and is in short supply. The opposite is true for amenity scores greater than zero [16]. (4) Two auxiliary metrics (Amenity Hits and street hits) provide information on people’s activities in TOD areas, which help designers reflect on their choices of amenity locations and the forms of the street networks. The indicator of Amenity Hits sums up the total number of residents visiting a certain amenity across all trips. The metric of Street Hits measures the total number of people using certain street segments on all trips. For each amenity or street segment, a higher score indicates a larger number of users. By further visualizing these two indicators, urban designers can intuitively understand the activeness of different parts of the study area in terms of amenities and streets, and thus adjust their design solutions.
Decay   ( x ) = 17.15 x 5 + 89.45 x 4 126.37 x 3 + 4.639 x 2 + 7.58 x + 99.5
Due to the complexity of urban design, not all the issues can be analyzed relying on indicators and evaluation criteria. Qualitative analysis is suggested for the following dimensions. (1) Public spaces are often designed to strike a balance between aesthetics, the scheduled activities to be accommodated, local regulations, and other aspects [36]. There is no consistent standard for the size and shape of public spaces. The reliable method for assessing the quality of public spaces is to use the public space index (PSI) [37]. This index involves a combination of more than forty factors in terms of inclusiveness, meaningful activities, comfort, safety, and pleasurability. Although this method is well-established, it takes months, or even years, for the evaluator to engage in observations. It is not a wise choice for urban designers due to the lack of timely and effective design feedback. What can be confirmed is that it is more desirable to have open space in TOD areas than not. For the specific size and form of the public space, urban designers are advised to make decisions based on 3D models and their own experiences. (2) The visual experience in public spaces is also a difficult element to quantify. A good way to analyze the visual experience in urban spaces is through the use of isovist [38]. The isovist is the area or volume of space visible from a given point in space, which intuitively reflects the visual–spatial qualities in the built environment [39]. According to Batty [40], factors such as area, perimeter, and the average distance of a series of isovists at different locations on a walking path can reflect changes in visual experience. In addition, 3D models and renderings are recommended to aid the analysis process. In light of this, the evaluation framework utilizes shapes and areas of isovist to assist designers in understanding the visual experiences in the existing built environment and their design proposals. Specifically, the shape and area of the isovist along a walking path are measured for the analysis of visual changes in public spaces. Previous literature has demonstrated the methodology of DecodingSpaces toolbox to be useful for isovist measurements [41,42].

2.2. Computational Tools and Overall Framework

Rhinoceros3D-Grasshopper (GH) is chosen as the platform to conduct the assessment process. Rhinoceros3D software and its inherited parametric design platform Grasshopper can be used by urban designers to create three-dimensional city models, visualizing simulations and analytic solutions in real-time. Compared with other 3D modeling software, Rhinoceros3D has its advantages in terms of data visualization and efficient parametric workflow. The parametric evaluation framework in this study relies heavily on 3D models and the visualization of spatial data. Taking street network design, for example, it has an impact on both visual diversity and regional walkability. City designers need to analyze the diversity of visual changes based on a three-dimensional spatial environment, and also need to get data feedback on walkability. These requirements make the Rhinoceros3D-Grasshopper (GH) platform a suitable choice. The following two plug-ins are used in the evaluation and generative process: the Urbano and the DeCodingspaces toolboxes. The Urbano tool is a useful analytical tool that provides measurable design feedback in terms of walkability and the activeness of amenities and streets. It utilizes data input from designers to simulate human activity in the city and evaluate design scenarios with built-in algorithms and metrics [16,43]. It is worth being used in this study because of its well-established workflow and compatibility with 3D models. The DeCodingspacestoolbox contains a variety of analytical and generative elements, which provides technical support for the generative design process. According to the previous literature, the DeCodingspaces toolbox is more functional and easier to use than other computationally generated methods [25,44,45,46]. The tool has the potential to become widespread, as urban designers and planners can operate it with a simple understanding of the data structure and the meaning of the parameters. Hence it serves as the obvious choice for this study. The overall framework can be divided into three steps: context modeling and assessment, computational generation of urban design proposals, and quantitative assessment and qualitative analysis of generative design proposals. Each step (including input parameters and operation methods) will be detailed in the following sections.

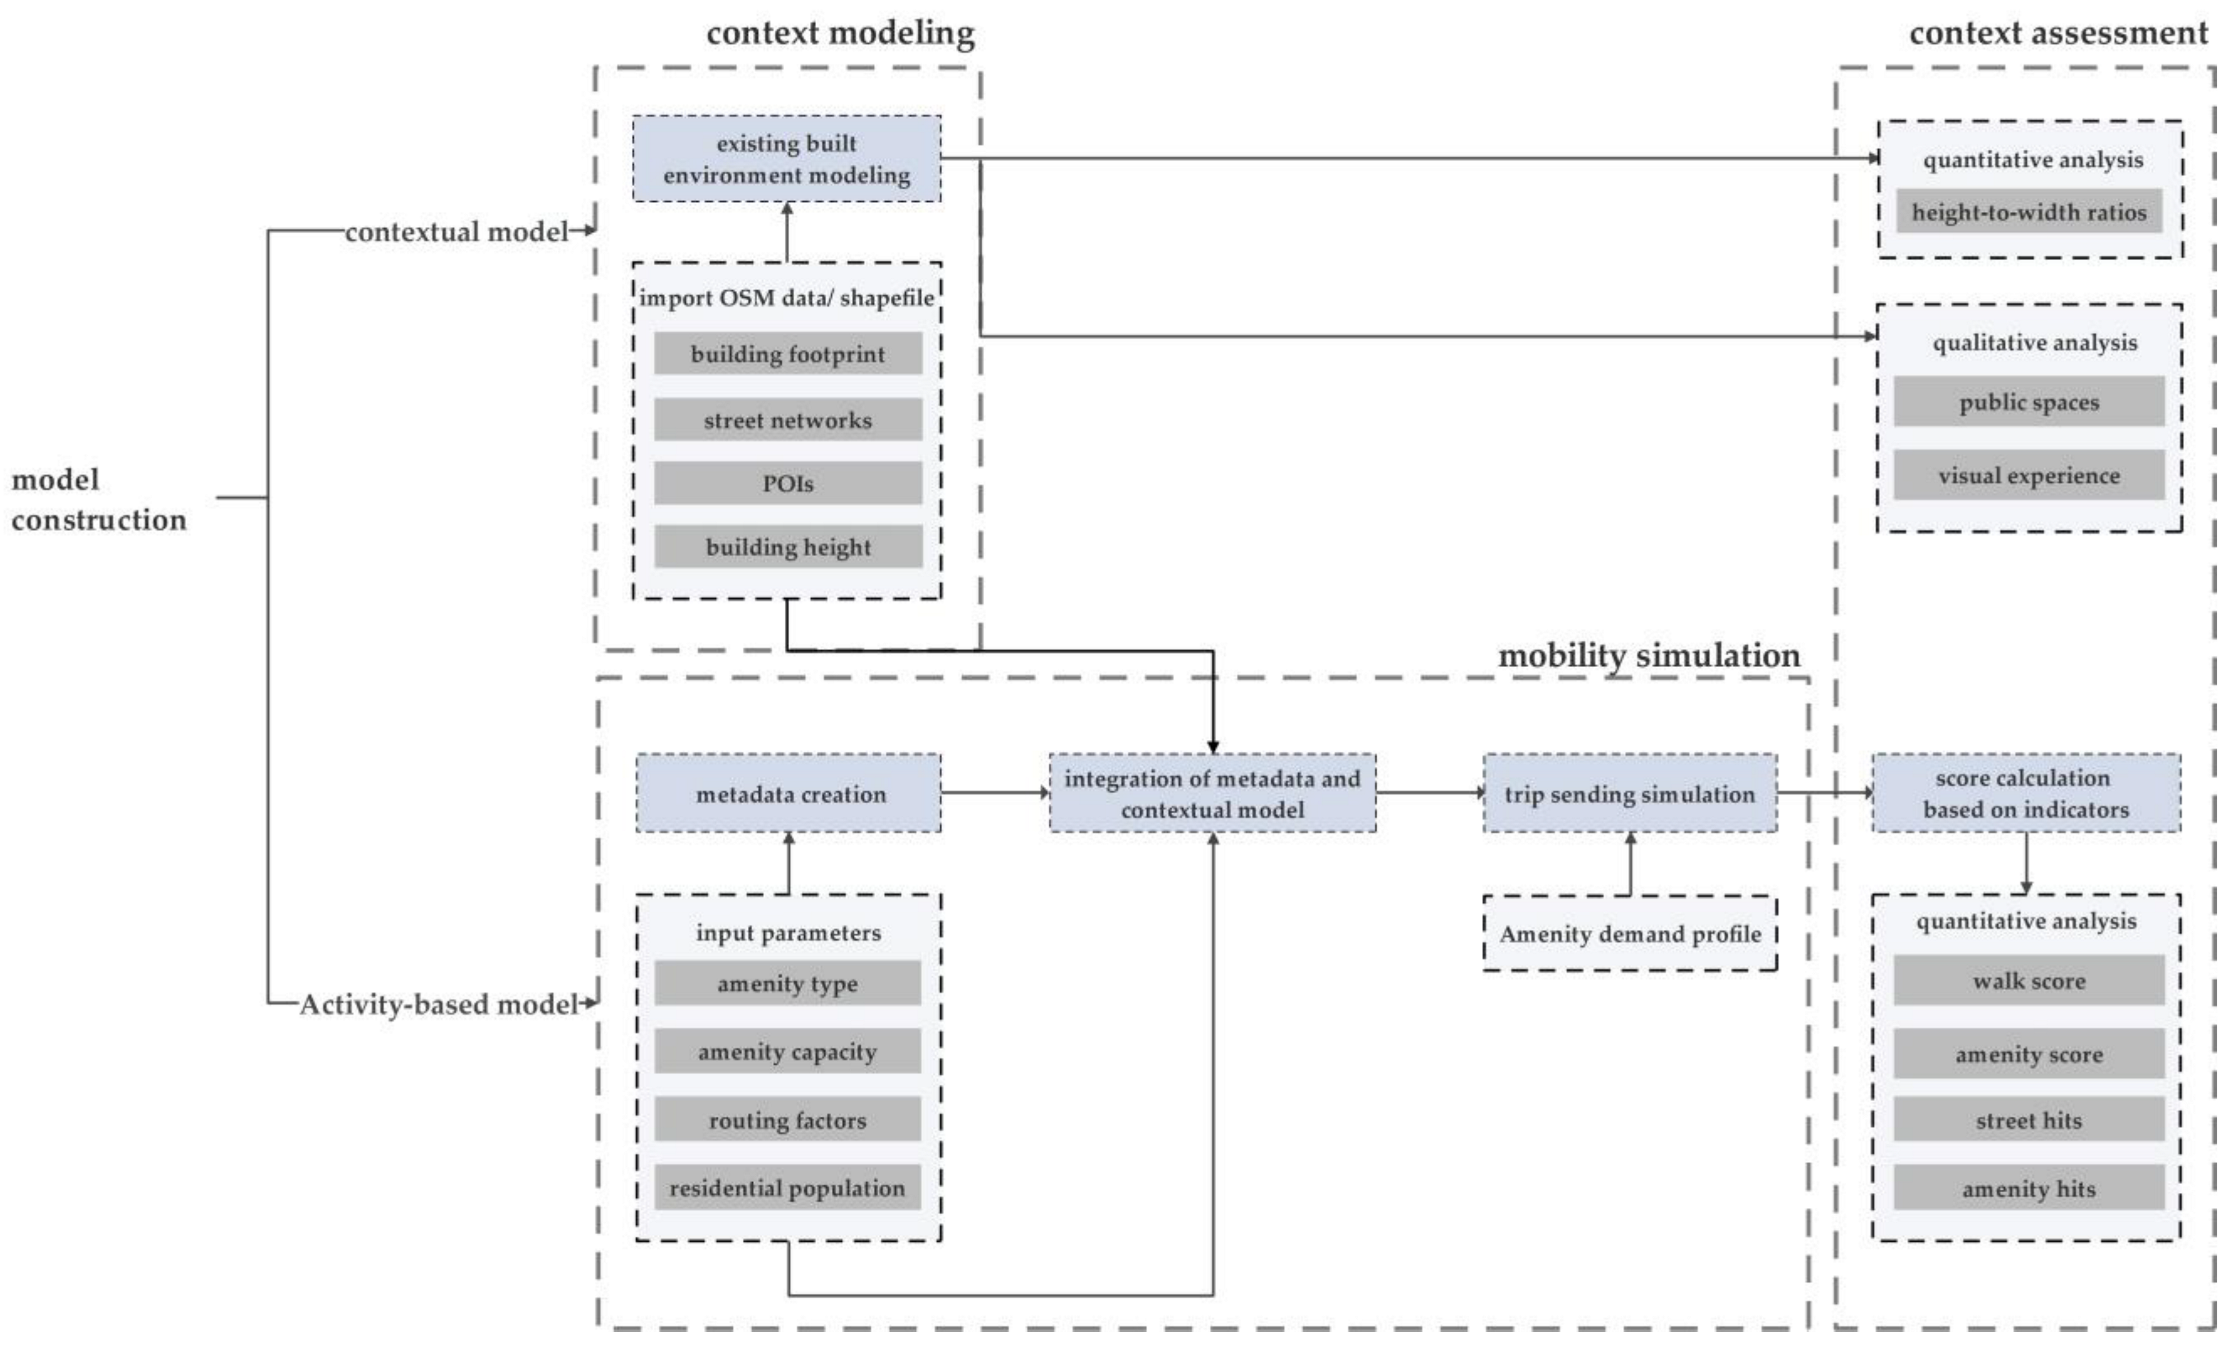
2.3. Context Modeling and Assessment

To inform the subsequent generative design solutions, the existing built environment needs to be modeled and evaluated. By measuring aspects such as the walk score and amenity score of the built environment, designers can realize the issues that need to be improved. The method of context modeling and assessment consists of three parts (Figure 1): context modeling, active mobility simulation, and context assessment. These three aspects are proposed based on the Urbano workflow [16,47]. According to the workflow, two models (the contextual model and activity-based model) and four metrics (walk score, amenity score, street hits, and amenity hits) are required to this end. The contextual model refers to the model of the existing built environment in Rhinoceros3D, which serves as the physical basis of the assessment process. The activity-based model is a model that estimates people’s activity trips according to different design scenarios in an area. It is a concept proposed by Joe et al. [15], which later becomes the theoretical foundation of the mobility simulation process in the Urbano workflow. The four metrics are used to quantify the results of active mobility simulation. All three aspects, with their components, will be introduced in detail in the following subsections. Table 2 illustrates the details of input parameters in these three aspects.

2.3.1. Context Modeling

There are three kinds of data that serve as the basis for modeling existing built environments: building footprints, street networks, and point of interest (POI), which can be either OSM data or shapefiles. POI refers to the place where an amenity is located. The building footprint shapefiles are available for download on the official government websites in many countries (such as the city of Melbourne and the city of New York). For establishing street networks and POI models, it is common to use OSM data since it is open to the public and available from the OpenStreetMap website (https://www.openstreetmap.org accessed on 10 August 2022). However, it is worth noting that the quality of POI data from the OSM website is not high, with fewer POI entries than other shapefile sources such as Google Maps [43]. The use of OSM data for POIs may lead to errors in the research. Therefore, it is suggested to use shapefiles in terms of POIs modeling. The three types of data can be parsed via the Urbano component and transformed into geometric shapes in Rhino [16].

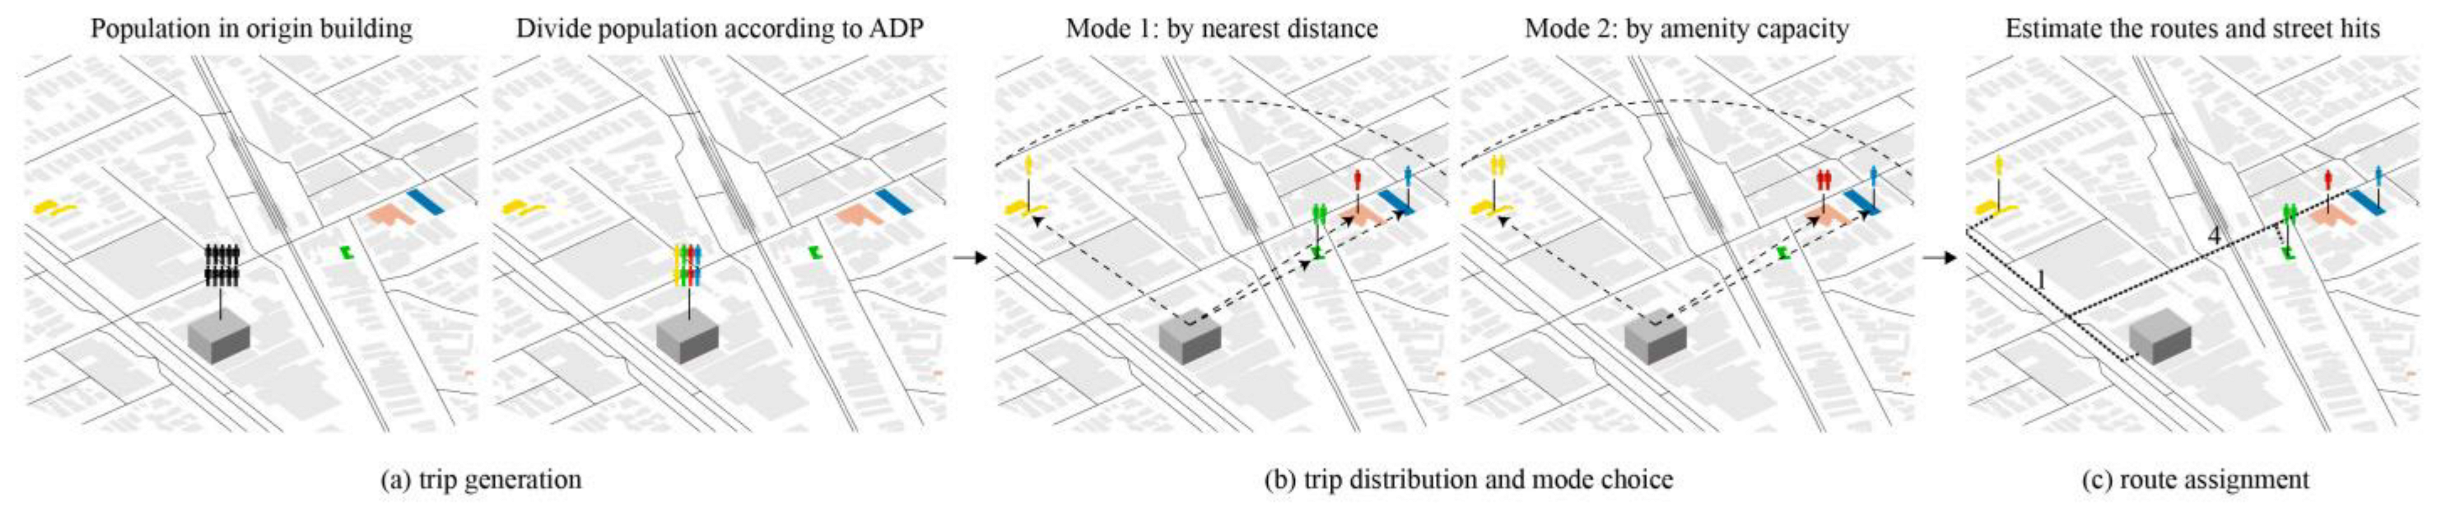
2.3.2. Mobility Simulation

Mobility simulation enables the designer to understand the impact of their design solutions on residents’ active mobility. It is fundamental to the subsequent evaluation process regarding walkability and amenity diversity, which are essential aspects of good TOD design. The mobility simulation comprises three parts, i.e., the metadata creation, the integration of metadata and contextual model, and the trip-sending simulation. Metadata creation prepares the necessary data for the trip-sending simulation. The parameters that must be included are Building height, Amenity type, and Amenity demand profile (ADP). Building height and Amenity type are metadata, which can be either customized by designers or extracted from OSM data. The metadata is supposed to be appended to geometric data and provide additional information, which requires the integration of metadata and contextual model. When the building geometry and Building height are combined, the population contained in the building can be calculated by the Urbano component. When Amenity type and POIs are combined, spatial points with amenity information are generated. ADP is an estimation of the proportion of residents participating in different activities in the study area, which is the driver of the trip-sending process [16]. The ADP data represents the weight of different activities or the activeness of different amenities in the area, which can be customized by designers or obtained directly from the Urbano dataset. The specific method can be referred to [43]. In light of the activity-based model [15], the trip-sending process in Urbano workflow can be explained in three parts—trip generation, trip distribution, mode choice, and route assignment (Figure 2). In this process, residential buildings are defined as the starting points, and amenities are as the destinations. For each building, (a) The population is divided according to the ADP to derive the number of people involved in different activities. (b) Those who are divided will be matched with the corresponding amenities within a walkable distance. Depending on the chosen mode of travel (e.g., by nearest destination and by amenity capacity), residents are allocated to amenities in different ways. (c) The routes are formed based on the starting point and destinations. As a result, visitors per amenity and per street segment can be calculated as amenity hits and street hits. The mobility simulations for all buildings in the area can be used to analyze regional mobility.

2.3.3. Context Assessment

A context assessment can help urban designers identify problems of the existing condition, which serves as a reference for the subsequent generative design evaluation. The assessment involves five metrics (height-to-width ratios, walk score, amenity score, amenity hits, and street hits) and two qualitative aspects (public spaces and visual experience). The mobility simulation lays the foundation for the calculation of the walk score and amenity score via Urbano components [16]. Based on the walk score methodology, the walk score for each activity trip in the mobility simulation can be measured. Amenity scores, on the other hand, can be derived from Amenity hits according to Equation (2) (where A stands for Amenity score, H stands for Amenity hits, and C stands for Amenity capacity). Other metrics and evaluation methods can be referred to in Section 2.1.
A= H/C − 1

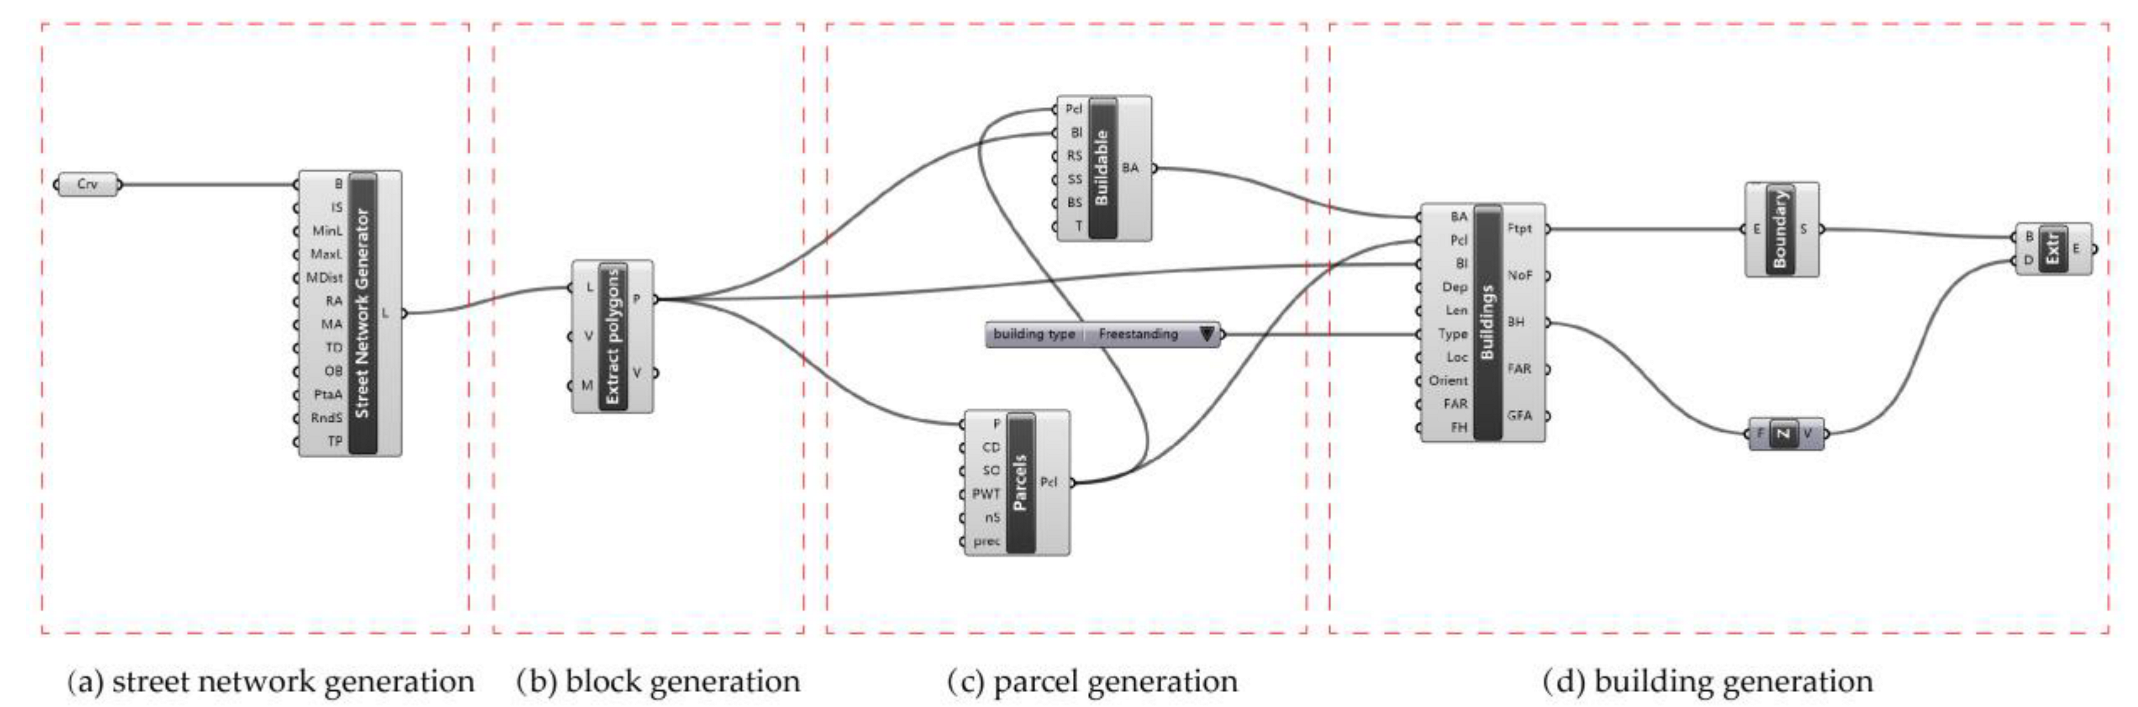
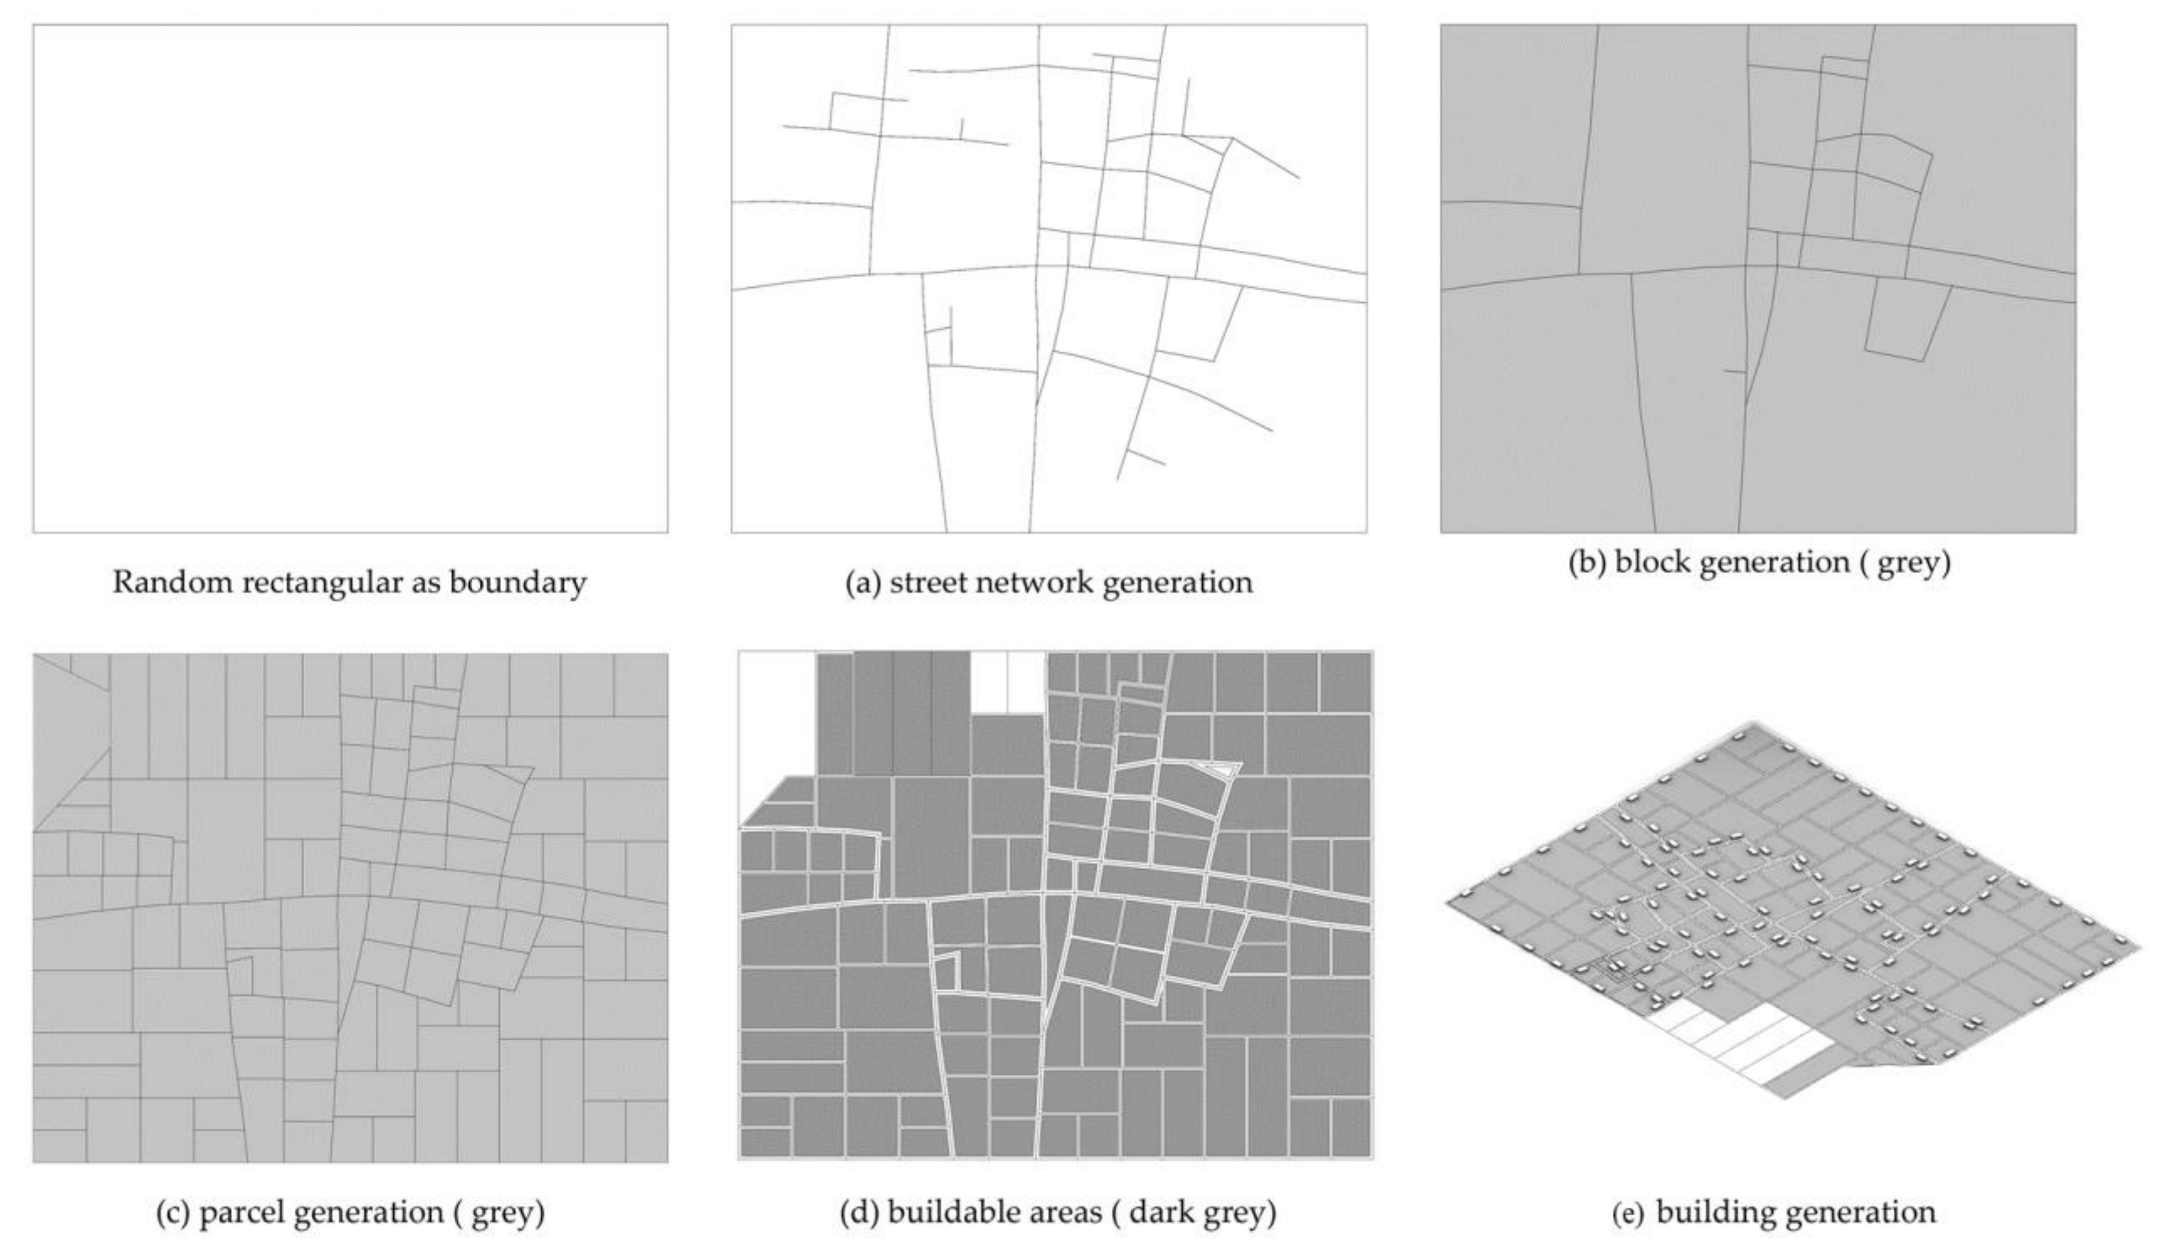
2.4. Computational Generation of Urban Design Proposals

After selecting the site based on the contextual model, parameters can be set for generative urban design solutions. Among various ways for computational generation of urban design proposals, this study follows the method proposed by Koenig et al. [45] via the DeCodingspaces toolbox. Unlike other generative design approaches, this method is not limited to the separate production of building schemes or street network solutions, but can generate street networks, plots, parcels, and buildings in sequence, forming a well-function system [25,45]. The consistency of multiple elements is crucial in urban design. The generative design process comprises five steps: street network generation, block generation, parcel generation, building generation, and amenity generation. The parameters used in each step with related information are listed in Table 3. Together, these parameters control the forms of streets, plots, and buildings.
Figure 3 shows the grasshopper components used in the computational generation process. The street network generation rests on a particular data structure—the instruction tree [45]. It has advantages in substituting sophisticated street networks with simple tree structures connected by nodes, which makes it easier for computing and mutating. The instruction trees determine the structure of the street networks and are mainly controlled by the parameters MDist, RA, TD, and MA [44]. Therefore, to generate street networks, these three parameters are required for the street network generator component (Figure 3a). In addition, parameter B is required to define the boundary of the street network. The output L returns a series of line segments representing the street network (Figure 4a). For the block generation (Figure 3b), the extract polygons component transforms street networks into their dual-directed graphs [44]. The output P creates polygons representing street blocks (Figure 4b). The parcel generation is based on the slicing tree structure [49], according to which the street blocks are divided into smaller polygons (parcels). The parcel component takes street block polygons as input (Figure 3c) and output Pcl as parcel polygons (Figure 4c). The building generation is based on simple calculations and extrusions, which consist of two steps. First, the buildable component takes the polygons of parcels and blocks as input to calculate BA as the buildable area in each parcel (Figure 3c). Second, the building component utilizes BA and parcel polygons to generate Ftpt (building footprint) and BH (building height) (Figure 3d). In this process, the parameters BT, Blen, and Bdep are required to control the building forms. The output Ftpt can be further extruded as building blocks via Extr component. All the optional parameters involved in the generative design process are used to refine the results.
The amenity generation is the basis for assessing the walkability of generative solutions. It is required that urban designers determine the type and number of amenities in their proposals depending on the client’s requirements or the zoning regulations. Information on the type and number of amenities needs to be added to generative design schemes in the form of metadata. The method can be referred to as the metadata creation in Section 2.3.1.

2.5. Quantitative Assessment and Qualitative Analysis of Generative Design Proposals
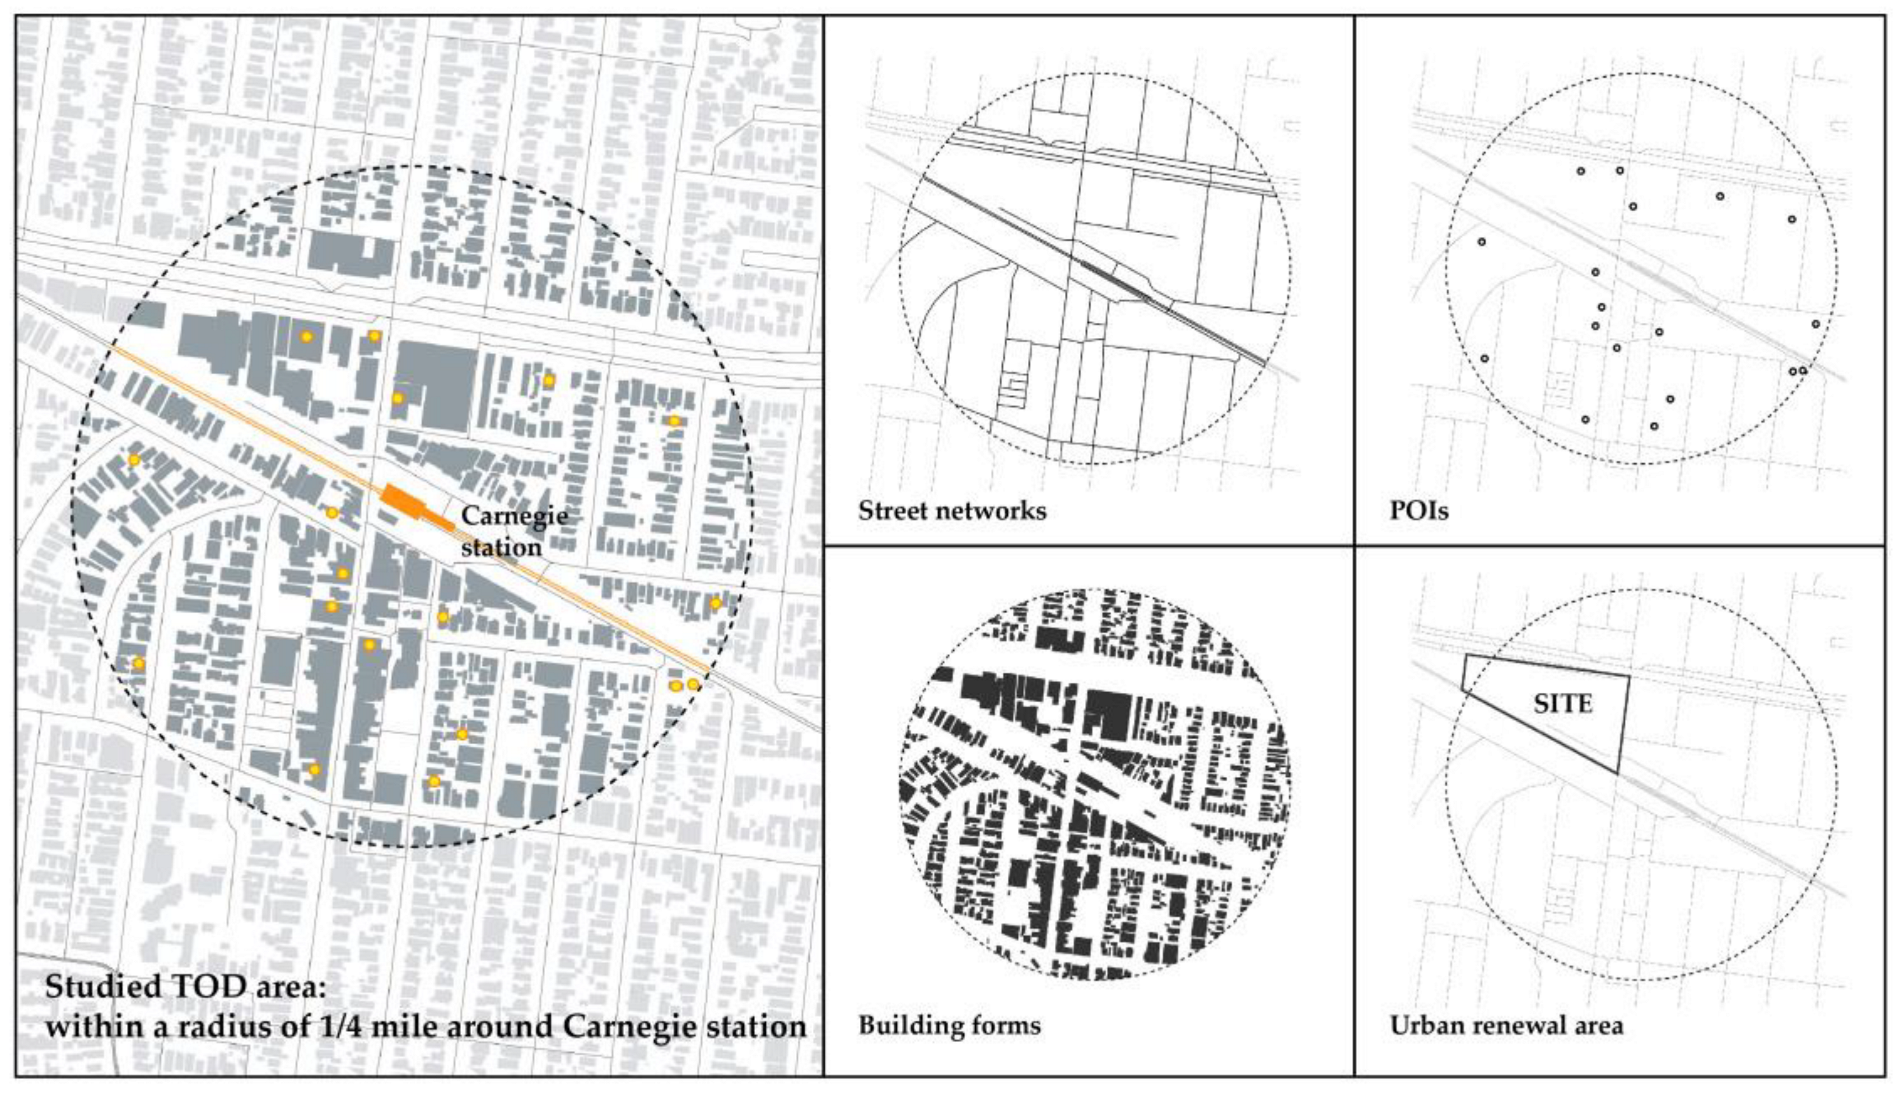
The quantitative assessment and qualitative analysis of generative design proposals are rooted in the evaluation methods proposed in Section 2.1. The quantitative assessment includes the measurement of height-to-width ratios, walk score, and amenity score. The walk score and amenity score calculation are based on mobility simulation, the method of which can be referred to in Section 2.3.2 and Section 2.3.3. For qualitative analysis, the visual experience analysis and public space analysis are involved. The workflow for quantitative assessment and qualitative analysis of generative design proposals is illustrated in Figure 5.

3. Case Study

3.1. Assessment of the Study Area

Carnegie is a major activity center in the City of Glen Eira, an inner suburb precinct located in Melbourne, Victoria. Due to the rapid growth of the population, the local government started a new planning process that aims to accommodate the growing population, while promoting new and sustainable development. One of the vital decisions was to direct population growth to areas near public transportation, and to transform these areas into mix-used, high-density, and walkable neighborhoods. The area within 1/4 miles of Carnegie station is selected as the study area, and an urban renewal site is identified as the site for the computational generation of design proposals (Figure 6).
First, the walkability of the study area is examined. The average walk score in the study area is calculated as 57.3, which indicates that there is still much room for improvement in local walkability. As can be seen from Figure 3, amenities in the area are clustered along the central axis, and the number gradually decreases as the distance from the station increases. Poor road connections in the northwest may affect accessibility to amenities. The hypothesis is, therefore, formulated that poor street connectivity and the uneven distribution pattern of amenities account for the unsatisfactory low walk score. Second, the average amenity scores, amenity hits, and street hits in the study area are calculated. Figure 7a shows the average amenity scores of the study area by amenity type. It can be found that the score of each amenity type is greater than zero. This reveals that the number of these six types of amenities available in the area is already sufficient to meet the needs of the residents. Therefore, there is no need to add more counterparts of the same type to the renewal site. Figure 7b visualizes the street hits and amenity hits in the study area. The darker the color, the higher the activeness of the street segments or amenities. It can be noticed that the renewal site features low street vitality and amenity occupancy, further validating the previous assumptions on walkability. This informs the designers to enhance street connectivity within the site.
According to the principles of good urban design in TODs, public spaces, such as streets and parks, need to be designed to increase their attractiveness to residents through a diversity of visual experiences. To explore the visual experiences of the existing built environment, a street segment adjacent to the renewal site is selected, with the shape and area of isovists being measured (Figure 8). It can be seen that there is a significant visual change from point A to B, with the view gradually opening up. This indicates that the present public space is visually attractive.
Further, the height-to-street width ratios (H/W) of the street-facing buildings in the renewal site are measured and recorded in Figure 9. All of these ratios are in the range of 1:1 to 1:3, indicating that the current public space is considered comfortable for pedestrians and has a sense of enclosure.

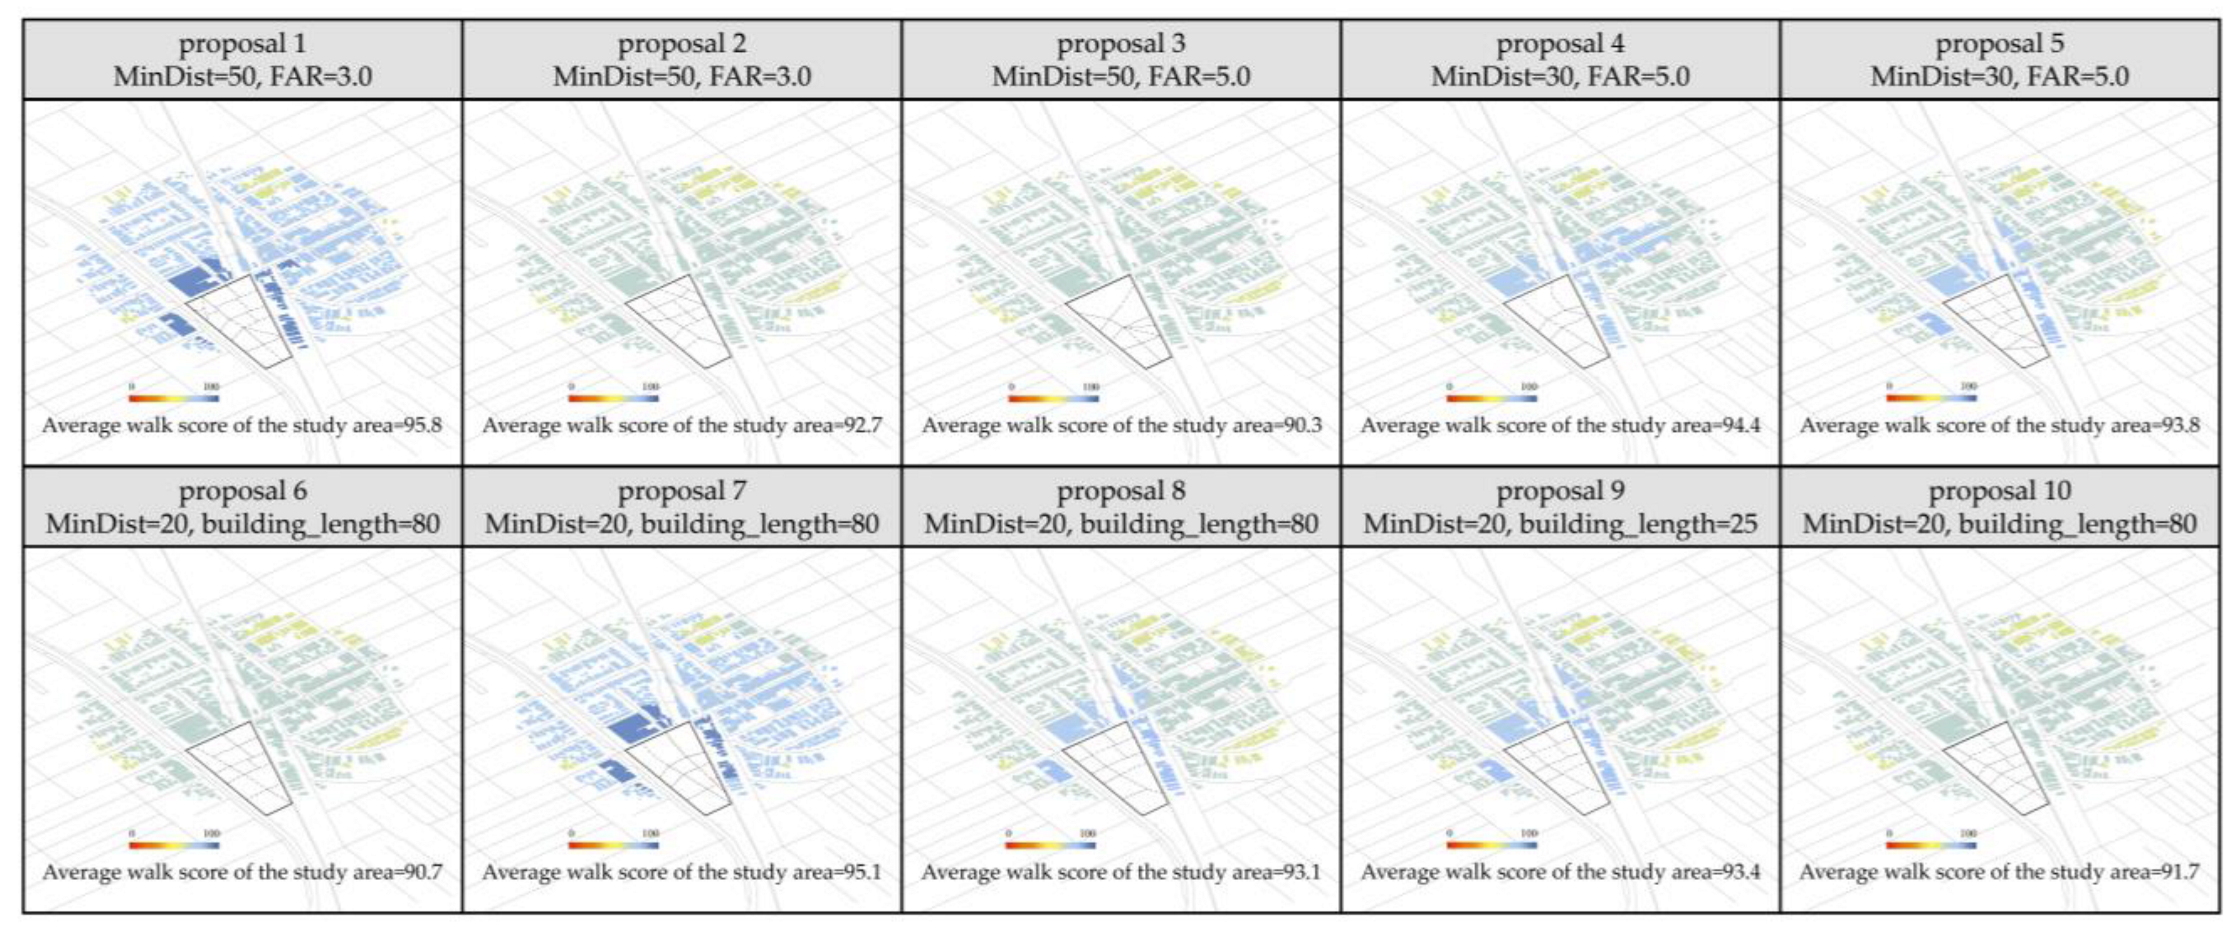
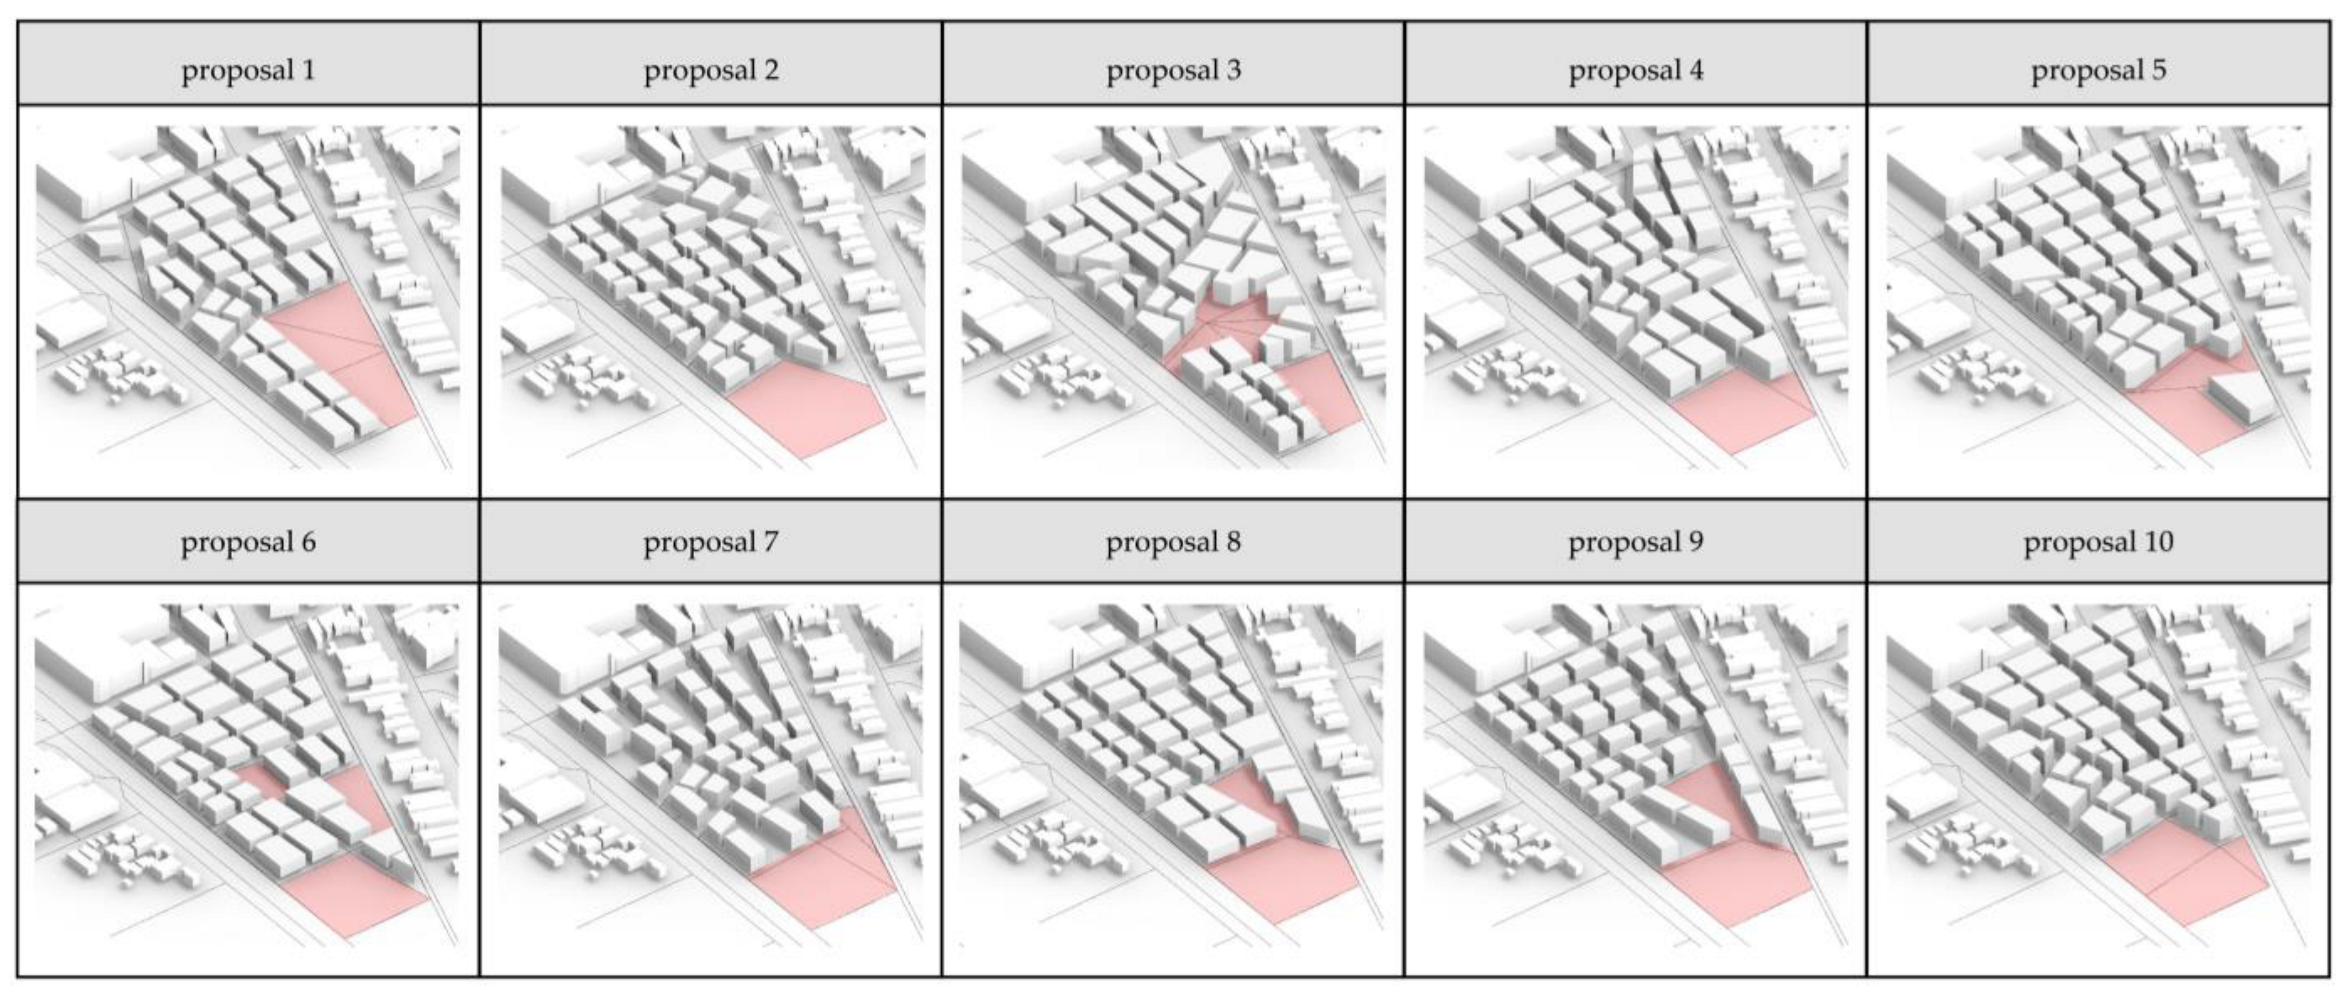
3.2. Generative Urban Design Proposals

The context assessment of the renewal site informs the creation and selection process of generative design solutions. According to the assessment results, the main issue of the renewal site is the underutilization of amenities and streets. This can be improved by increasing the number and type of amenities and changing the form of the road network. Regarding amenities, providing residents with a wealth of activities is not only a requirement of the TOD principles but also a practical necessity in Carnegie. According to the government report of Glen Eira activity centers [50], the survey on local amenities shows that 72 percent of residents want new retails and say they are overwhelmed by too many restaurants. Three types of amenities (butchers, newsagents, and bookstores) are most in demand by residents—accounting for 50 percent of the total population. Therefore, these three types are added to the generative schemes. After 25 iteration experiments, a total of 150 schemes are generated, of which ten representative schemes are selected. Compared with the original state, new design solutions need to enhance the walkability of the area with amenities that better meet the needs of the residents. As a result, design solutions with higher average walk scores and lower amenity scores are chosen. From these design alternatives, the experts select ten satisfactory options that can be further developed in terms of building forms, street patterns, and interesting public spaces. The input parameters of ten representative urban design proposals are recorded in Table 4.

4. Results and Discussion

To understand the role of generative urban design in facilitating transit-oriented development, this evaluation framework examines design solutions from the following five perspectives.

4.1. Walkability Assessment

This framework both quantifies the average walk score of the study area and visualizes the walk score of the housing units within the area (Figure 10). The average walk score represents the walkability of the studied TOD area, which allows designers to understand the impact of their solutions on the entire region. Of the ten scenarios, proposal 1 (average walk score = 95.8) and proposal 7 (average walk score = 95.1) provide the greatest enhancements to regional walkability. The walk score of the housing units, on the other hand, emphasizes the equity of walkability in the region. Even in areas with high walkability, there may exist households with poor walkability. While the overall walkability of the study area in Proposal 1 is higher, the variation is smaller in Proposal 7. This requires urban designers and urban planners to make trade-offs and think about improvements.

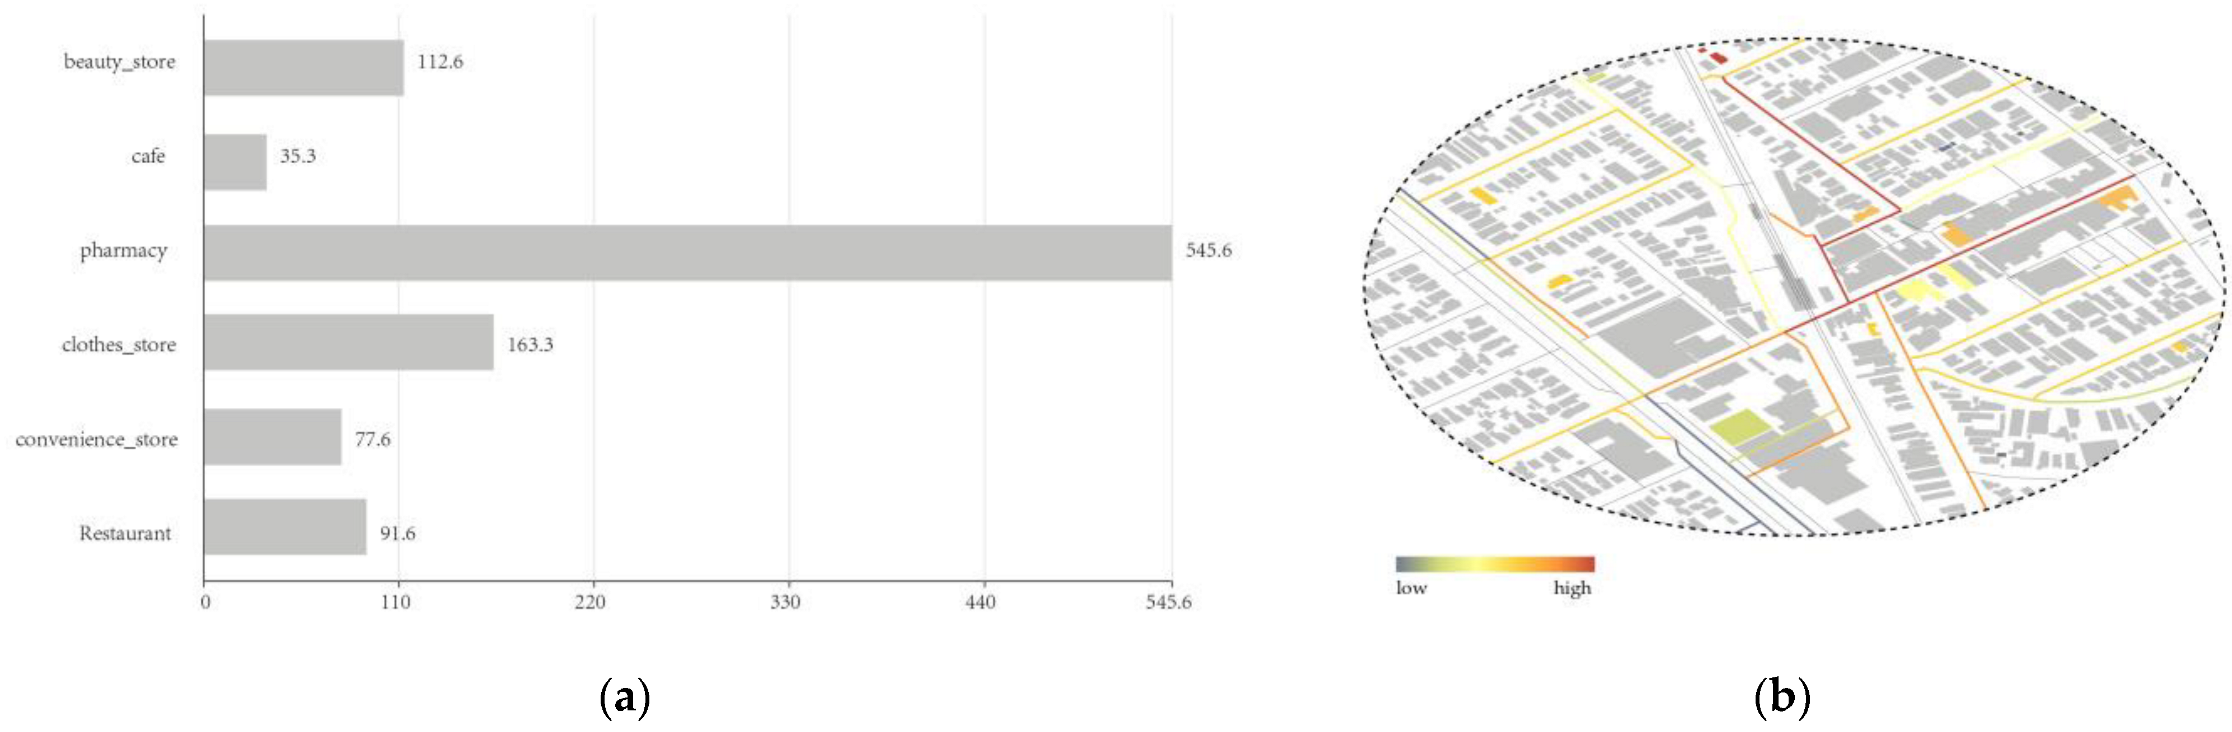
4.2. Amenity Assessment

According to the results of the amenity assessment (Table 5), Proposal 8 has the smallest amenity score among all options, meaning that it has the most reasonable configuration of amenities. The ten design scenarios are generated based on the same type (butchers, newsagents, and bookstores) and number (a total of five) of amenities, but yield different amenity scores. A possible explanation for this is the building density, location of amenities, and street network patterns vary in these design scenarios. In light of the trip-sending simulation process, the building-level population and the degree of connectivity of the street network determine the number of visitors to each amenity. In Urbano’s algorithm, the building height is a determinant of the building-level population. The amenity assessment enables designers to understand how different aspects of their design (building height, location of amenities, and road network patterns) can impact the relationship between supply and demand for local amenities.

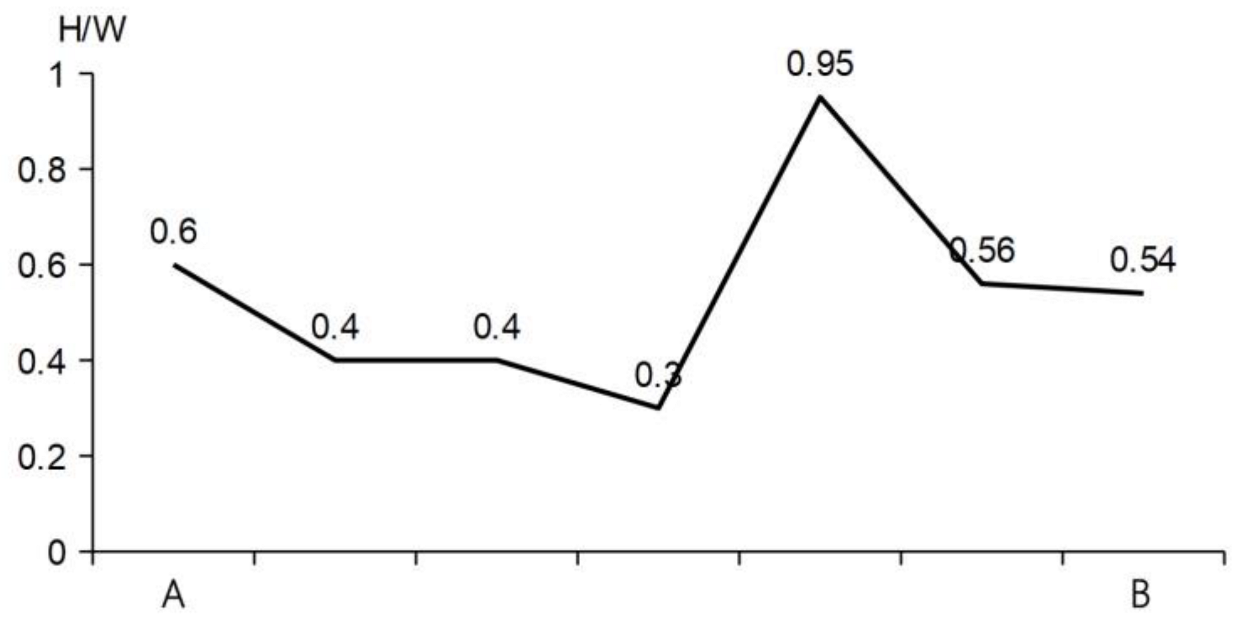
4.3. Height-to-Street Width Ratio Assessment

Figure 11 shows the height-to-street width ratios of buildings in 10 representative urban design proposals. It can be found that the ratio is more than 1:1 for all proposals except Proposals 1, 6, and 9, where H/W is basically between 1:1 and 1:3. This can be explained in two aspects. The first is that TOD promotes an increase in building density (floor area ratio). This is directly reflected in an increase in building heights. Secondly, the DecodingSpaces workflow leads to the uncertainty of the building heights, since it is difficult for designers to manually assign building height values when a large number of buildings are generated automatically. According to the algorithm of computational design generation, the building height is determined by the FAR value and building footprint. The building footprint is influenced by the buildable area in each plot, which has a tendency to be random. This reflects that the generative design is not yet ideal in terms of height control for building mass generation. Based on the results of the height-to-street width ratio assessment, it can be inferred that H/W tends to be desirable when the FAR is less than or equal to 3 in the TOD design.

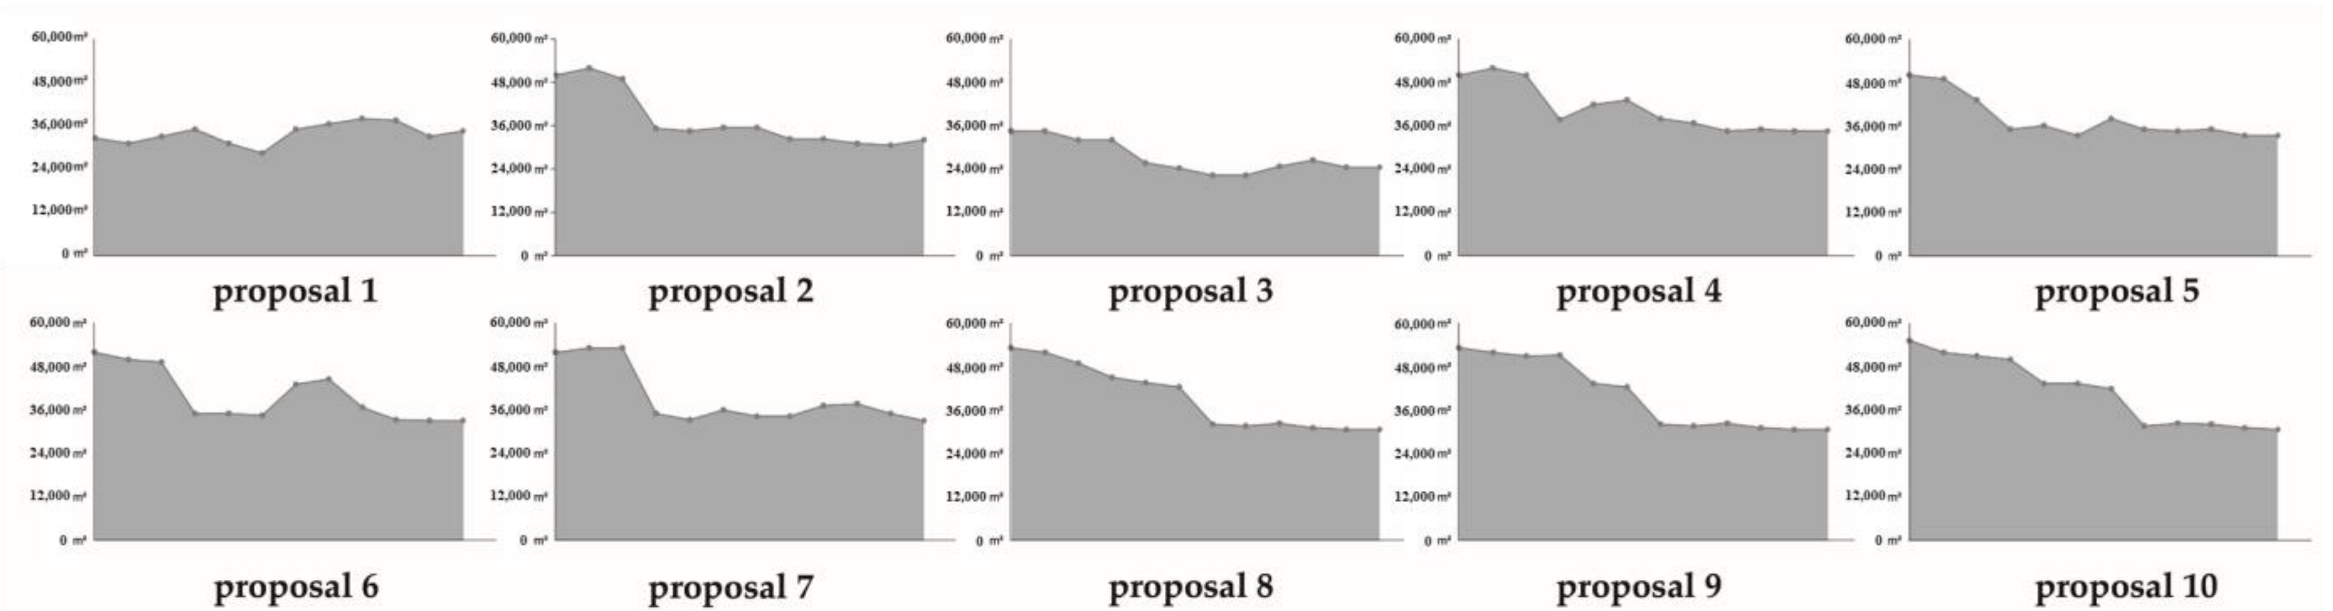
4.4. Visual Experience Analysis

The visual experience is difficult to measure directly through metrics, so the evaluation framework incorporates qualitative analysis regarding residents’ visual experiences, which is to use the variation in isovist areas to help urban designers understand the impact of their solutions on the visual experience of residents as they walk in public spaces. The same path as the context assessment (from point A to B) is selected for analysis. Figure 12 shows a variety of visual experiences of ten representative design proposals, which can be mainly divided into two categories—the field of vision that gradually becomes smaller (Proposal 2,5,6,7,8,9,10), and the field of vision with few changes (Proposal 1,3,4,5). There are no good or bad criteria for evaluating the changes in visual experience. Designers can make trade-offs depending on the atmosphere they want to create in the public spaces.

4.5. Public Space Analysis

As suggested in the assessment methods (Section 2.1), there is no specific standard for deciding the size and shape of public space. It depends on many factors, such as citizen preferences, local context, aesthetics, etc [38]. The 3D model can be used as a tool to assist the designers in decision-making. For the selection of public spaces in these ten proposals (Figure 13), the experts have given some suggestions. First, since the renovation site contains a variety of retail stores, the large public spaces near the street can be more attractive to visitors than scattered small public spaces. In addition, the public spaces that are located on the main axis can create a certain sense of sequence. Therefore, the public spaces in Proposals 3 and 8 are considered to be suitable choices.

4.6. Comprehensive Analysis

Taking into account the five aspects of the evaluation framework, Proposal 1 seems to be the optimal choice. However, this by no means indicates that it is flawless. Almost all the generative scenarios produced irregular building forms and undesirable building sizes in 25 iterations, which requires the designers to make further adjustments. The deficit suggests that although the smart algorithm is informative and powerful during the conceptual design stage, the intervention and engagement of experienced designers should not be overlooked. It also verifies two arguments made earlier in this paper: when considering generative urban design, one cannot focus on the road network alone and ignore other essential factors, such as the building layouts, and one cannot rely entirely on algorithms for design generation.

4.7. Strengths and Limitations of the Evaluation Framework

To the best of our knowledge, this is the first comprehensive framework that translates urban design recommendations for TOD into an evaluation methodology that utilizes both data feedback and experts’ experience to guide designers in their selection of options. Affirmatively, a relatively satisfactory proposal can be selected using this framework. The advantages of this framework are demonstrated in two aspects. Firstly, the computational design generation has been notoriously hard to interpret [25], which hindered its application in real-world problems. This framework contributes to the interpretability of computational generative urban design by providing useful explanations of generative design solutions (in terms of walkability, amenity accessibility, open space creation, visual experience, and hight-to-width ratio) to help designers understand their potential in TOD design. Secondly, the shortcomings of the optimization methods in the generative urban design proposed by previous studies are enhanced by the qualitative analysis methods and the intervention of experts’ experience. At the same time, the framework avoids the disadvantages of completely subjective decisions by designers (with no optimization objectives and decision criteria).
However, this assessment framework still has some areas that could be improved. On the one hand, safety as an important aspect of TOD design is not included in this framework due to the lack of a suitable evaluation method. On the other hand, because of the introduction of qualitative analysis in the framework, the various dimensions cannot be weighed in the assessment process by simply applying weights or other methods. Further research could usefully explore in terms of these two limitations.

5. Conclusions

Good urban design can play an important role in promoting TOD, and the enlightening and objective-based optimization capabilities of computational urban design bring new opportunities for city designers to realize good urban design. To help them better understand the role of generative urban design in TOD, this study proposes a novel evaluation framework that aims to assess and explain the use of generative design in TOD. The findings of the evaluation process emerge from five aspects. With regard to the walkability assessment, the walk score metric succeeds in allowing designers to filter out the generative design options that contribute the most to the walkability of a TOD area. However, considering the equity of walkability, designers and planners need to make further trade-offs. The amenity assessment clarifies that building heights, street network patterns, and amenity locations in generative design can influence the supply and demand for amenities in TOD areas. The height-to-street width ratio assessment points out the defects of generative design, i.e., the randomness of building generation and the difficulty of controlling building heights. For visual experience analysis, it is concluded that the impact of generative design on people’s visual experience is difficult to quantify and there is no fixed standard. The designer’s experience needs to be involved in the analysis. Regarding public space analysis, it is suggested in the literature that the shape and size of public spaces are determined by a variety of factors. Taking expert advice is the most effective way to make decisions in public space design. By combining the results of the five evaluations, a suitable design solution can be derived. In general, the evidence from this study strengthens the idea that neither experts’ judgment (e.g., qualitative analysis, manipulation of architectural form and scale) nor quantitative metrics can be absent in the evaluation process of generative urban design solutions.
The contribution of this study is two-fold. First of all, the study proposes the first comprehensive framework that transforms TOD urban design guidelines into an evaluation approach to assist designers in making decisions. Second, by offering helpful explanations of generative design solutions, the study contributes to the interpretability of computational generative urban design and enables designers to recognize the potential of these solutions in TOD design. Nevertheless, there is room for improvement in this framework. It could benefit from further exploration of integrating the safety evaluation into the assessment framework, as well as balancing quantitative and qualitative evaluations. In addition, the method for analyzing the size and shape of public space can be further improved.

Author Contributions

Conceptualization, W.Y. and X.H.; methodology, W.Y. and X.H.; software, W.Y.; validation, W.Y. and X.H.; formal analysis, W.Y.; investigation, W.Y. and X.H.; resources, X.H., M.W. and N.L.; data curation, W.Y. and X.H.; writing—original draft preparation, W.Y. and X.H.; writing—review and editing, M.W. and N.L.; visualization, W.Y.; supervision, X.H.; project administration, X.H., M.W. and N.L.; and funding acquisition, X.H. and M.W. All authors have read and agreed to the published version of the manuscript.

Funding

This project is funded by the National Natural Science Foundation of China (NSFC) [52208039], the National key R&D program “Science and Technology Winter Olympics” key project “Evacuation system and support technology for assisting physically challenged communities” [2020YFF0304900], the Beijing High-level Overseas Talents Support Funding, R&D Program of Beijing Municipal Education Commission (KM202210009008), the NCUT Young Scholar Development Project, and the Australian Research Council Linkage Project [LP190100089].

Data Availability Statement

The datasets of POI, street network, and building information used in this project are provided by Australian Urban Research Infrastructure Network (AURIN), OpentreestMap, and PSMA Australia (accessed on 10 August 2022).

Conflicts of Interest

The authors declare no conflict of interest.

References

  1. Thomas, R.; Bertolini, L. Transit-Oriented Development: Learning from International Case Studies; Springer International Publishing: Cham, Switzerland, 2020; Available online: http://link.springer.com/10.1007/978-3-030-48470-5 (accessed on 13 June 2022).
  2. Ibraeva, A.; de Correia, G.H.A.; Silva, C.; Antunes, A.P. Transit-oriented development: A review of research achievements and challenges. Transp. Res. Part A Policy Pract. 2020, 132, 110–130. [Google Scholar] [CrossRef]
  3. Cervero, R.; Radisch, C. Travel choices in pedestrian versus automobile oriented neighborhoods. Transp. Policy 1996, 3, 127–141. [Google Scholar] [CrossRef] [Green Version]
  4. Currie, G.; Stanley, J. Investigating links between social capital and public transport. Transp. Rev. 2008, 28, 529–547. [Google Scholar] [CrossRef]
  5. Kamruzzaman, M.; Wood, L.; Hine, J.; Currie, G.; Giles-Corti, B.; Turrell, G. Patterns of social capital associated with transit oriented development. J. Transp. Geogr. 2014, 35, 144–155. [Google Scholar] [CrossRef] [Green Version]
  6. Calthorpe, P.; Fulton, W.; Fulton, W.B. The Regional City; Island Press: Washington, DC, USA, 2001; 298p. [Google Scholar]
  7. Suzuki, H.; Cervero, R.; Iuchi, K. Transforming Cities with Transit: Transit and Land-Use Integration for Sustainable Urban Development; World Bank Publications: Washington, DC, USA, 2013; 233p. [Google Scholar]
  8. Jacobson, J.; Forsyth, A. Seven American TODs: Good Practices for Urban Design in Transit-Oriented Development Projects. JTLU. 2008. Available online: https://www.jtlu.org/index.php/jtlu/article/view/67 (accessed on 18 September 2022).
  9. Lynch, K. A Theory of Good City Form; MIT Press: Cambridge, MA, USA, 1981; 514p. [Google Scholar]
  10. Dittmar, H.; Ohland, G. The New Transit Town; Island Press: Washington, DC, USA, 2012. [Google Scholar]
  11. Owen, N.; Humpel, N.; Leslie, E.; Bauman, A.; Sallis, J.F. Understanding environmental influences on walking: Review and research agenda. Am. J. Prev. Med. 2004, 27, 67–76. [Google Scholar] [CrossRef] [PubMed]
  12. Gehl, J. Cities for People; Island Press: Washington, DC, USA, 2013. [Google Scholar]
  13. Forsyth, A. What is a walkable place? The walkability debate in urban design. Urban Des Int. 2015, 20, 274–292. [Google Scholar] [CrossRef] [Green Version]
  14. Ogra, A.; Ndebele, R. PDF Document of The Role of 6Ds: Density, Diversity, Design, Destination, Distance, and Demand Management in Transit Oriented Development (TOD). 2014. Available online: https://ujcontent.uj.ac.za/vital/%20access/manager/Repository/uj:5017/CONTENT1 (accessed on 12 August 2022).
  15. Castiglione, J.; Bradley, M.; Gliebe, J. Activity-Based Travel Demand Models: A Primer; Transportation Research Board: Washington, DC, USA, 2015. [Google Scholar]
  16. Szczepura-McLean, C. URBANO: A Computational Tool-Kit for Integrated Urban Design. New York. 31 December 2019, p. 23. Available online: https://ecommons.cornell.edu/handle/1813/102682 (accessed on 18 September 2022).
  17. Gutiérrez, J.; Cardozo, O.D.; García-Palomares, J.C. Transit ridership forecasting at station level: An approach based on distance-decay weighted regression. J. Transp. Geogr. 2011, 19, 1081–1092. [Google Scholar] [CrossRef]
  18. Setiawan, B. Towards the new urban agenda of safe cities: Urban crimes in four Indonesian cities. IOP Conf. Ser. Earth Environ. Sci. 2017, 99, 012037. [Google Scholar] [CrossRef]
  19. Nagy, D.; Villaggi, L.; Benjamin, D. Generative Urban Design: Integrating Financial and Energy Goals for Automated Neighborhood Layout. In Proceedings of the 2018 Symposium on Simulation for Architecture and Urban Design (SimAUD 2018), Delft, The Netherlands, 5–7 June 2018; Society for Modeling and Simulation International (SCS): Delft, The Netherlands, 2018. Available online: https://dl.acm.org/citation.cfm?id=3289775 (accessed on 16 September 2022).
  20. Qeisi, S.A.; Al-Alwan, H. Generative Urban Design Concepts and Methods: A Research Review. IOP Conf. Ser. Mater. Sci. Eng. 2021, 1090, 012085. [Google Scholar] [CrossRef]
  21. Rakha, T. Generative Urban Modeling: A Design Work Flow for Walkability-Optimized Cities. In Proceedings of the Fifth National Conference of IBPSA-USA (SimBuild 2012), Madison, Wisconsin, 1–3 August 2012; pp. 255–262. [Google Scholar]
  22. Hidalgo, C.A.; Castañer, E.; Sevtsuk, A. The amenity mix of urban neighborhoods. Habitat Int. 2020, 106, 102205. [Google Scholar] [CrossRef]
  23. Trubka, R.; Glackin, S.; Lade, O.; Pettit, C. A web-based 3D visualisation and assessment system for urban precinct scenario modelling. ISPRS J. Photogramm. Remote Sens. 2016, 117, 175–186. [Google Scholar] [CrossRef]
  24. Lima, F.; Brown, N.; Duarte, J. Urban Design Optimization: Generative Approaches towards Urban Fabrics with Improved Transit Accessibility and Walkability-Generative Approaches towards Urban Fabrics with Improved Transit Accessibility and Walkability. In Proceedings of the 2021 Computer-Aided Architectural Design Research in Asia (CAADRIA 2021), Hongkong, China, 29 March–1 April 2021; CAADRIA: Hongkong, China, 2021; pp. 719–728. Available online: http://papers.cumincad.org/cgi-bin/works/paper/caadria2021_055 (accessed on 27 June 2022). [CrossRef]
  25. Miao, Y.; Koenig, R.; Knecht, K. The Development of Optimization Methods in Generative Urban Design: A Review. In Proceedings of the Symposium on Simulation for Architecture and Urban Design (SimAUD 2020), Online, 25–27 May 2020; pp. 247–254. [Google Scholar]
  26. Shach-Pinsly, D.; Bindreiter, S.; Porat, I.; Sussman, S.; Forster, J.; Rinnerthaler, M. Multiparametric Analysis of Urban Environmental Quality for Estimating Neighborhood Renewal Alternatives. UP 2021, 6, 172–188. [Google Scholar] [CrossRef]
  27. Yang, Y.; Samaranayake, S.; Dogan, T. An Adaptive Workflow to Generate Street Network and Amenity Allocation for Walkable Neighborhood Design. In Proceedings of the Symposium on Simulation for Architecture and Urban Design (SimAUD 2020), Online, 25–27 May 2020; pp. 195–202. [Google Scholar] [CrossRef]
  28. Ortega, E.; MartÍN, B.; LÓPez-Lambas, M.E.; Soria-Lara, J.A. Evaluating the impact of urban design scenarios on walking accessibility: The case of the Madrid ‘Centro’district. Sustain. Cities Soc. 2021, 74, 103156. [Google Scholar] [CrossRef]
  29. Goodspeed, R. Scenario Planning for Cities and Regions: Managing and Envisioning Uncertain Futures; Lincoln Institute of Land Policy: Cambridge, MA, USA, 2020. [Google Scholar]
  30. Lynch, K.; Hack, G. Site Planning; MIT Press: Cambridge, MA, USA, 1984. [Google Scholar]
  31. Alexander, C. A Pattern Language: Towns, Buildings, Construction; Oxford University Press: Oxford, UK, 1977. [Google Scholar]
  32. Moughtin, C. Urban Design: Street and Square; Routledge: London, UK, 2007. [Google Scholar]
  33. Carr, L.J.; Dunsiger, S.I.; Marcus, B.H. Validation of Walk Score for estimating access to walkable amenities. Br. J. Sport. Med. 2011, 45, 1144–1148. [Google Scholar] [CrossRef] [PubMed] [Green Version]
  34. Hall, C.M.; Ram, Y. Walk score® and its potential contribution to the study of active transport and walkability: A critical and systematic review. Transp. Res. Part D Transp. Environ. 2018, 61, 310–324. [Google Scholar] [CrossRef]
  35. Walk Score Methodology. Walk Score. Available online: https://www.walkscore.com/methodology.shtml (accessed on 19 September 2022).
  36. Madanipour, A. Whose Public Space? International Case Studies in Urban Design and Development; Routledge: London, UK, 2013. [Google Scholar]
  37. Mehta, V. Evaluating Public Space. J. Urban Des. 2014, 19, 53–88. [Google Scholar] [CrossRef]
  38. Turner, A. Analysing the Visual Dynamics of Spatial Morphology. Environ. Plann B Plann Des. 2003, 30, 657–676. [Google Scholar] [CrossRef] [Green Version]
  39. Schneider, S.; König, R.; Weimar, B.U. Exploring the Generative Potential of Isovist Fields. In Proceedings of the Computer Aided Architectural Design in Europe (eCAADe 2012), Prague, Czech, 12–14 September 2012; pp. 355–364. [Google Scholar]
  40. Batty, M. Exploring Isovist Fields: Space and Shape in Architectural and Urban Morphology. Environ. Plan. B Plan. Des. 2001, 28, 123–150. [Google Scholar] [CrossRef]
  41. Kim, Y.; Jung, S.K. Distance-weighted isovist area: An isovist index representing spatial proximity. Autom. Constr. 2014, 43, 92–97. [Google Scholar] [CrossRef]
  42. Stamps, A.E., III. Isovists, enclosure, and permeability theory. Environ. Plan. B Plan. Des. 2005, 32, 735–762. [Google Scholar] [CrossRef]
  43. Yang, Y.; Samaranayake, S.; Dogan, T. Using Open Data to Derive Local Amenity Demand Patterns for Walkability Simulations and Amenity Utilization Analysis. In Proceedings of the Blucher Design Proceedings, Porto, Portugal, 11–13 September 2016; Editora Blucher: Porto, Portugal, 2019; pp. 665–674. Available online: http://www.proceedings.blucher.com.br/article-details/34315 (accessed on 15 April 2022).
  44. Koenig, R.; Treyer, L.; Schmitt, G. Graphical Smalltalk with My Optimization System for Urban Planning Tasks. In Proceedings of the Computer Aided Architectural Design in Europe (eCAADe 2013), Delft, The Netherlands, 18–20 September 2013; pp. 355–364. [Google Scholar] [CrossRef]
  45. Koenig, R.; Miao, Y.; Knecht, K.; Buš, P.; Mei-Chih, C. Interactive Urban Synthesis. In Computer-Aided Architectural Design Future Trajectories; Çağdaş, G., Özkar, M., Gül, L.F., Gürer, E., Eds.; Springer: Singapore, 2017; pp. 23–41, (Communications in Computer and Information Science; vol. 724); Available online: http://link.springer.com/10.1007/978-981-10-5197-5_2 (accessed on 27 October 2022).
  46. Koenig, R.; Schmitt, G. Backcasting and a New Way of Command in Computational Design. In CAADence in Architecture, Back to Command; Budapest University of Technology and Economics, Faculty of Architecture: Zurich, Switzerland, 2016; pp. 15–25. Available online: http://hdl.handle.net/10890/16274 (accessed on 27 October 2022).
  47. Urbano-A New Tool to Promote Mobility-Aware Urban Design, Active Transportation Modeling and Access Analysis for Amenities and Public Transport. In Proceedings of the 2018 Symposium on Simulation for Architecture and Urban Design (SimAUD 2018), Delft, The Netherlands, 15 June 2018; Society for Modeling and Simulation International (SCS): Delft, The Netherlands, 2018. Available online: https://dl.acm.org/citation.cfm?id=3289778 (accessed on 15 April 2022).
  48. Knecht, K.; König, R. Automatische Grundstücksumlegung Mithilfe von Unterteilungsalgorithmen und Typenbasierte Generierung von Stadtstrukturen; Springer Nature: Berlin, Germany, 2012. [Google Scholar]
  49. Knecht, K.; König, R. Generating floor plan layouts with kd trees and evolutionary algorithms. In Proceedings of the Generative Art Conference, Milan, Italy, 15 December 2010; pp. 238–253. [Google Scholar]
  50. Glen Huntly Activity Centre. Glen Eira City Council. 2017. Available online: https://www.gleneira.vic.gov.au/our-city/planning-for-the-future/from-project-to-policy/glen-huntly-activity-centre (accessed on 30 October 2022).
Figure 1. The workflow of context modeling and assessment.
Buildings 12 01971 g001
Figure 2. Trip-sending simulation process for each building.
Buildings 12 01971 g002
Figure 3. The grasshopper components used in computational generation process.
Buildings 12 01971 g003
Figure 4. The results of each step in the generative design process (with random rectangle as boundary and default input parameters).
Buildings 12 01971 g004
Figure 5. The workflow for quantitative assessment and qualitative analysis of generative design proposals.
Buildings 12 01971 g005
Figure 6. Profile of the study area.
Buildings 12 01971 g006
Figure 7. (a) Average amenity scores of the study area by amenity type; (b) The activeness of streets and amenities in the study area.
Buildings 12 01971 g007
Figure 8. Visual experience analysis of the renewal site.
Buildings 12 01971 g008
Figure 9. The height-to-street width ratios of the street-facing buildings in the renewal site (The x-axis represents, from left to right, the height-to-width ratio of the buildings passing from point A to B).
Buildings 12 01971 g009
Figure 10. Walk scores of 10 representative urban design proposals.
Buildings 12 01971 g010
Figure 11. Height-to-street width ratios of buildings in 10 representative urban design proposals (The x-axis represents, from left to right, the height-to-width ratio of the buildings passing from point A to B).
Buildings 12 01971 g011
Figure 12. The area of isovist from point A to B in 10 representative urban design proposals.
Buildings 12 01971 g012
Figure 13. The public spaces in 10 representative urban design proposals.
Buildings 12 01971 g013
Table 1. The summary of twelve aspects of good urban design initiatives for TODs.
TopicsAspectsDescriptions
processTimeTOD design should take into account changes over time and future possibilities.
Engagement with publicThe visions of different stakeholders should be considered in the whole design process.
ProgrammingArrange events and activities for the public in open spaces.
MaintenanceManage the budget to ensure investment in maintenance and landscaping.
placesScaleDesign at a human scale to create a comfortable walking environment.
Public spaces for human useCreate public space for pedestrian activities
SafetyCreate safe walking environments and public spaces.
Variety and complexityPay attention to the variety of land use, visual experience, and social aspects.
ConnectionsConnecting places to create good walking and cycling experiences (including building and outdoor connections, sidewalk connections, cycling path connections, etc.)
facilitiesPedestrian facilitiesDesign safe and vibrant sidewalks
TransitConnect transportation facilities and the surrounding environment
Car movement and parkingEnsure a safe and comfortable pedestrian environment. Adjust the direction and speed of cars through urban design. Parking spaces should be designed to meet the demands while not impeding walking.
Table 2. The details of input parameters of context modeling and assessment.
ParametersData typeWhen to SelectData SourceReference
Building footprintOSM/ shapefileMust be selected when
creating a contextual model.
OSM: from OpenStreetMap website; Shapefile: from governments, developers, etc.[16,43]
Street networksOSM/ shapefileMust be selected when
creating a contextual model.
OSM: from OpenStreetMap website; Shapefile: from governments, developers, etc.[16,43]
POIsOSM/ shapefileMust be selected when
creating a contextual model.
OSM: from OpenStreetMap website; Shapefile: from governments, developers, etc.[16,43,47]
Building heightOSM/ shapefileMust be selected when
creating a contextual model.
OSM: from OpenStreetMap website; Shapefile: from governments, developers, etc.[16,43]
Amenity typemetadataMust be selected for
mobility simulation.
It can be customized by the designer or extracted from the OSM data.[16,43]
Amenity capacitymetadataOptional for mobility simulation.It can be customized by the designer or derived from the Urbano database.[16,27]
Routing factorsmetadataOptional for mobility simulation. Use it only when the bike score calculation is needed.It can be customized by the designer[16,27]
Residential populationmetadataOptional for mobility simulation.It can be customized by the designer or calculated by Urbano components.[16]
Amenity demand profileCSVMust be selected for
mobility simulation.
It can be an be customized by the designer or derived from the Urbano database.[16,43]
Table 3. The information of input parameters in generative urban design process.
ParametersExplanationRequired/OptionalStepReference
BBoundary to generate street networksrequiredStreet network generation[45]
IS Street segments as the
starting points for generation
optionalStreet network generation[45]
MDistThe shortest distance between
the start and end of a street segment
requiredStreet network generation[44,45]
RARandom angle defining the
direction of the street segments
requiredStreet network generation[44,45]
TDTree depth for controlling branch levels of tree structures to define the size of street networksrequiredStreet network generation[44,45]
MAMaximum number of arms for crossroadsrequiredStreet network generation[45]
RndSRandom seed number for choosing
the generative street network pattern
optionalStreet network generation[45]
BABuildable area on each parcelrequiredStreet network generation[45]
BTBuilding types (including block building, row building, and free-standing)requiredbuilding generation[45,48]
BlenThe length of the buildingrequiredbuilding generation[45]
BdepThe depth of the buildingrequiredbuilding generation[45]
FARFloor area ratio. It determines the building
height when the building footprint is defined
optionalbuilding generation[45]
OrientationBuilding setback from the streetoptionalbuilding generation[45]
Table 4. Input parameters of 10 representative urban design proposals.
Input Parameters Proposal 1Proposal 2Proposal 3Proposal 4Proposal 5
MDist5050503030
MA44444
RA1010101010
TD55555
RndS21556
BTblblblblbl
Blen8080808080
Bdepdefault = 15default = 15default = 15default = 15default = 15
FAR33555
Orientation3.143.143.143.143.14
Input parametersProposal 6Proposal 7Proposal 8Proposal 9Proposal 10
MDist2020202020
MA44444
RA1010101010
TD55555
RndS35226
BTblrwblrwbl
Blen80default = 2580default = 2580
Bdepdefault = 15default = 15default = 15default = 15default = 15
FAR33333
Orientation3.143.143.143.143.14
“bl” for block building. “rw” for row building.
Table 5. Average amenity scores of 10 representative urban design proposals.
Proposal 1Proposal 2Proposal 3Proposal 4Proposal 5
Average
amenity scores
50.148.176.768.359.3
Proposal 6Proposal 7Proposal 8Proposal 9Proposal 10
Average
amenity scores
50.262.538.641.352.1
Publisher’s Note: MDPI stays neutral with regard to jurisdictional claims in published maps and institutional affiliations.

