Article

Predicting Chemical Shrinkage in Hydrating Cements

1
School of Transport & Civil Engineering, Technological University Dublin, Bolton Street, D01 K822 Dublin, Ireland
2
Collegium Basilea (Institute of Advanced Study), Hochstrasse 51, 4053 Basel, Switzerland
3
School of Civil, Structural and Environmental Engineering, University College Cork, T12 K8AF Cork, Ireland
*
Author to whom correspondence should be addressed.
Buildings 2022, 12(11), 1972; https://doi.org/10.3390/buildings12111972
Submission received: 15 August 2022 / Revised: 8 November 2022 / Accepted: 10 November 2022 / Published: 14 November 2022
(This article belongs to the Section Building Materials, and Repair & Renovation)

Abstract

:
This paper presents a prediction of chemical shrinkage volume created during the hydration of two cements over time using a thermodynamic model. Chemical shrinkage in hydrating cements is a result of internal volume change over time within sealed conditions due to exothermic reactions during hydration and the resulting precipitation of solid hydrates. Each precipitated phase will contribute to chemical shrinkage due to their individual reactions and stoichiometric properties. As these factors (including early age, drying and autogenous nature) contribute to the overall shrinkage of concrete which may cause long-term performance problems, they are important properties to understand. The current paper presents a thermodynamic model that quantifies the chemical shrinkage volume created during the first 1000 days of hydration using the cemdata18 database and a series of discrete solid phases (DSPs) to represent C-S-H, which has not been quantified in the literature to date. DSPs account for the amorphous and poorly crystalline nature of C-S-H in cement, and its incongruent dissolution behavior of C-S-H as calcium is released in solution more so than silicon. A description of chemical shrinkage in hydrating cements is provided, along with a review of past methods used to quantify its development over time. The paper also shows the linear relationship between chemical shrinkage and the overall degree of hydration.

1. Introduction

Cracking in concrete has a significant influence on its strength and durability performance, and shrinkage, in its many forms (autogenous, plastic, drying), contributes to the development of microcracks in the interfacial transition zone (ITZ) between the cementitious matrix and the aggregates. Cracking leads to increases in porosity and permeability that provide preferential pathways for the ingress of chloride and (bi)carbonate ions, which have a detrimental effect on the embedded steel resulting in pitting and carbonation. Chemical shrinkage during hydration in a sealed environment and the volume imbalance between the clinker and solid-phase reactions has been referred to in the literature as the “Le Chatelier’s” contraction [1], and may lead to internal tensile stresses later on within the cement matrix. As hydration progresses, the volume of the unreacted clinker minerals, as well as the newly formed hydrate phases and their mix water, reduces with time as the clinker reacts and water is consumed. This topic was the subject of a PhD study [2] (subsequently published as a book [3]) which established the method as a practical means of characterizing cement hydration kinetics.
Chemical shrinkage is a very complex process, as each clinker phase and solid hydrate has its own unique reaction with water over time. Indeed, as some phases react faster than others, the rate increases can vary with time, w/c ratio and temperature [4], as well as cement fineness [5,6]. Chemical shrinkage has, therefore, direct links with the degree of hydration, as reported in the literature [1,6], and the heat of hydration [6,7]. Yodsudjai and Wang [8] found that higher C3A and C4AF proportions in the clinker will lead to higher degrees of chemical shrinkage, as their hydration is associated with large changes in volume. To add to our understanding of volume changes during hydration, there is strong evidence that tricalcium aluminate reacts to form metastable intermediate solid [9] (hexagonal CxAHy type) phases, which then react and redissolve to precipitate stable cubic hydrogarnet (C3AH6), as summarised below:
2C3A + 27H → C4AH19 + C2AH8
2C3A + 21H → C4AH13 + C2AH8
C4AH19 + C2AH8 → 2C3AH6 + 15 H
Alongside these reactions, and persisting over a longer time (hours to days), the AFt-SO4 (ettringite) initially formed re-dissolves as its phase boundary is crossed to re-precipitate as the AFm analogue (‘monosufate’). An equilibrium is established between the aqueous phase, AFt, AFm and hydrogarnet phases after the first few days of hydration, requiring mass transfer through the pore solution with commensurate changes in aluminate hydrate volume. Such complex reactions contribute to the change in total volume, which is measured as chemical shrinkage.
Research on chemical shrinkage in cements has focused on the influence of additions such as cellulose nanofibrils [10], nanosilica [11], glass powder [12], ye’elimite [13], calcium sulphoaluminate cements [14] and limestone-calcined clay cements [15], which indicates that this is an area of active investigation and importance.
Although the study of chemical shrinkage during cement hydration is well established, surprisingly few simulations of its prediction have been made. Most focus on explicit reaction schemes in which stoichiometric reactions are presumed not to interact or compete with each other [16]. Thermodynamic models have been successfully used to model phase volume changes over time [17,18,19] using the cemdata18 [20] and PSI Nagra [21] databases. This research presents a new method to predict the development of chemical shrinkage during hydration in commonly used commercial cements using an easy to use and run geochemical model. The model uses a series of discrete solid phases (DSPs) based on the CSH-3T end members in the cemdata18 thermodynamic database, which reduces computation time considerably with no loss in accuracy. Modelling the dynamic evolution of cements during their hydration can be computationally intense. In particular, the simulation of non-ideal solid solutions of hydrates places considerable demand on the code, particularly where more than one solid solution series is to be simulated.

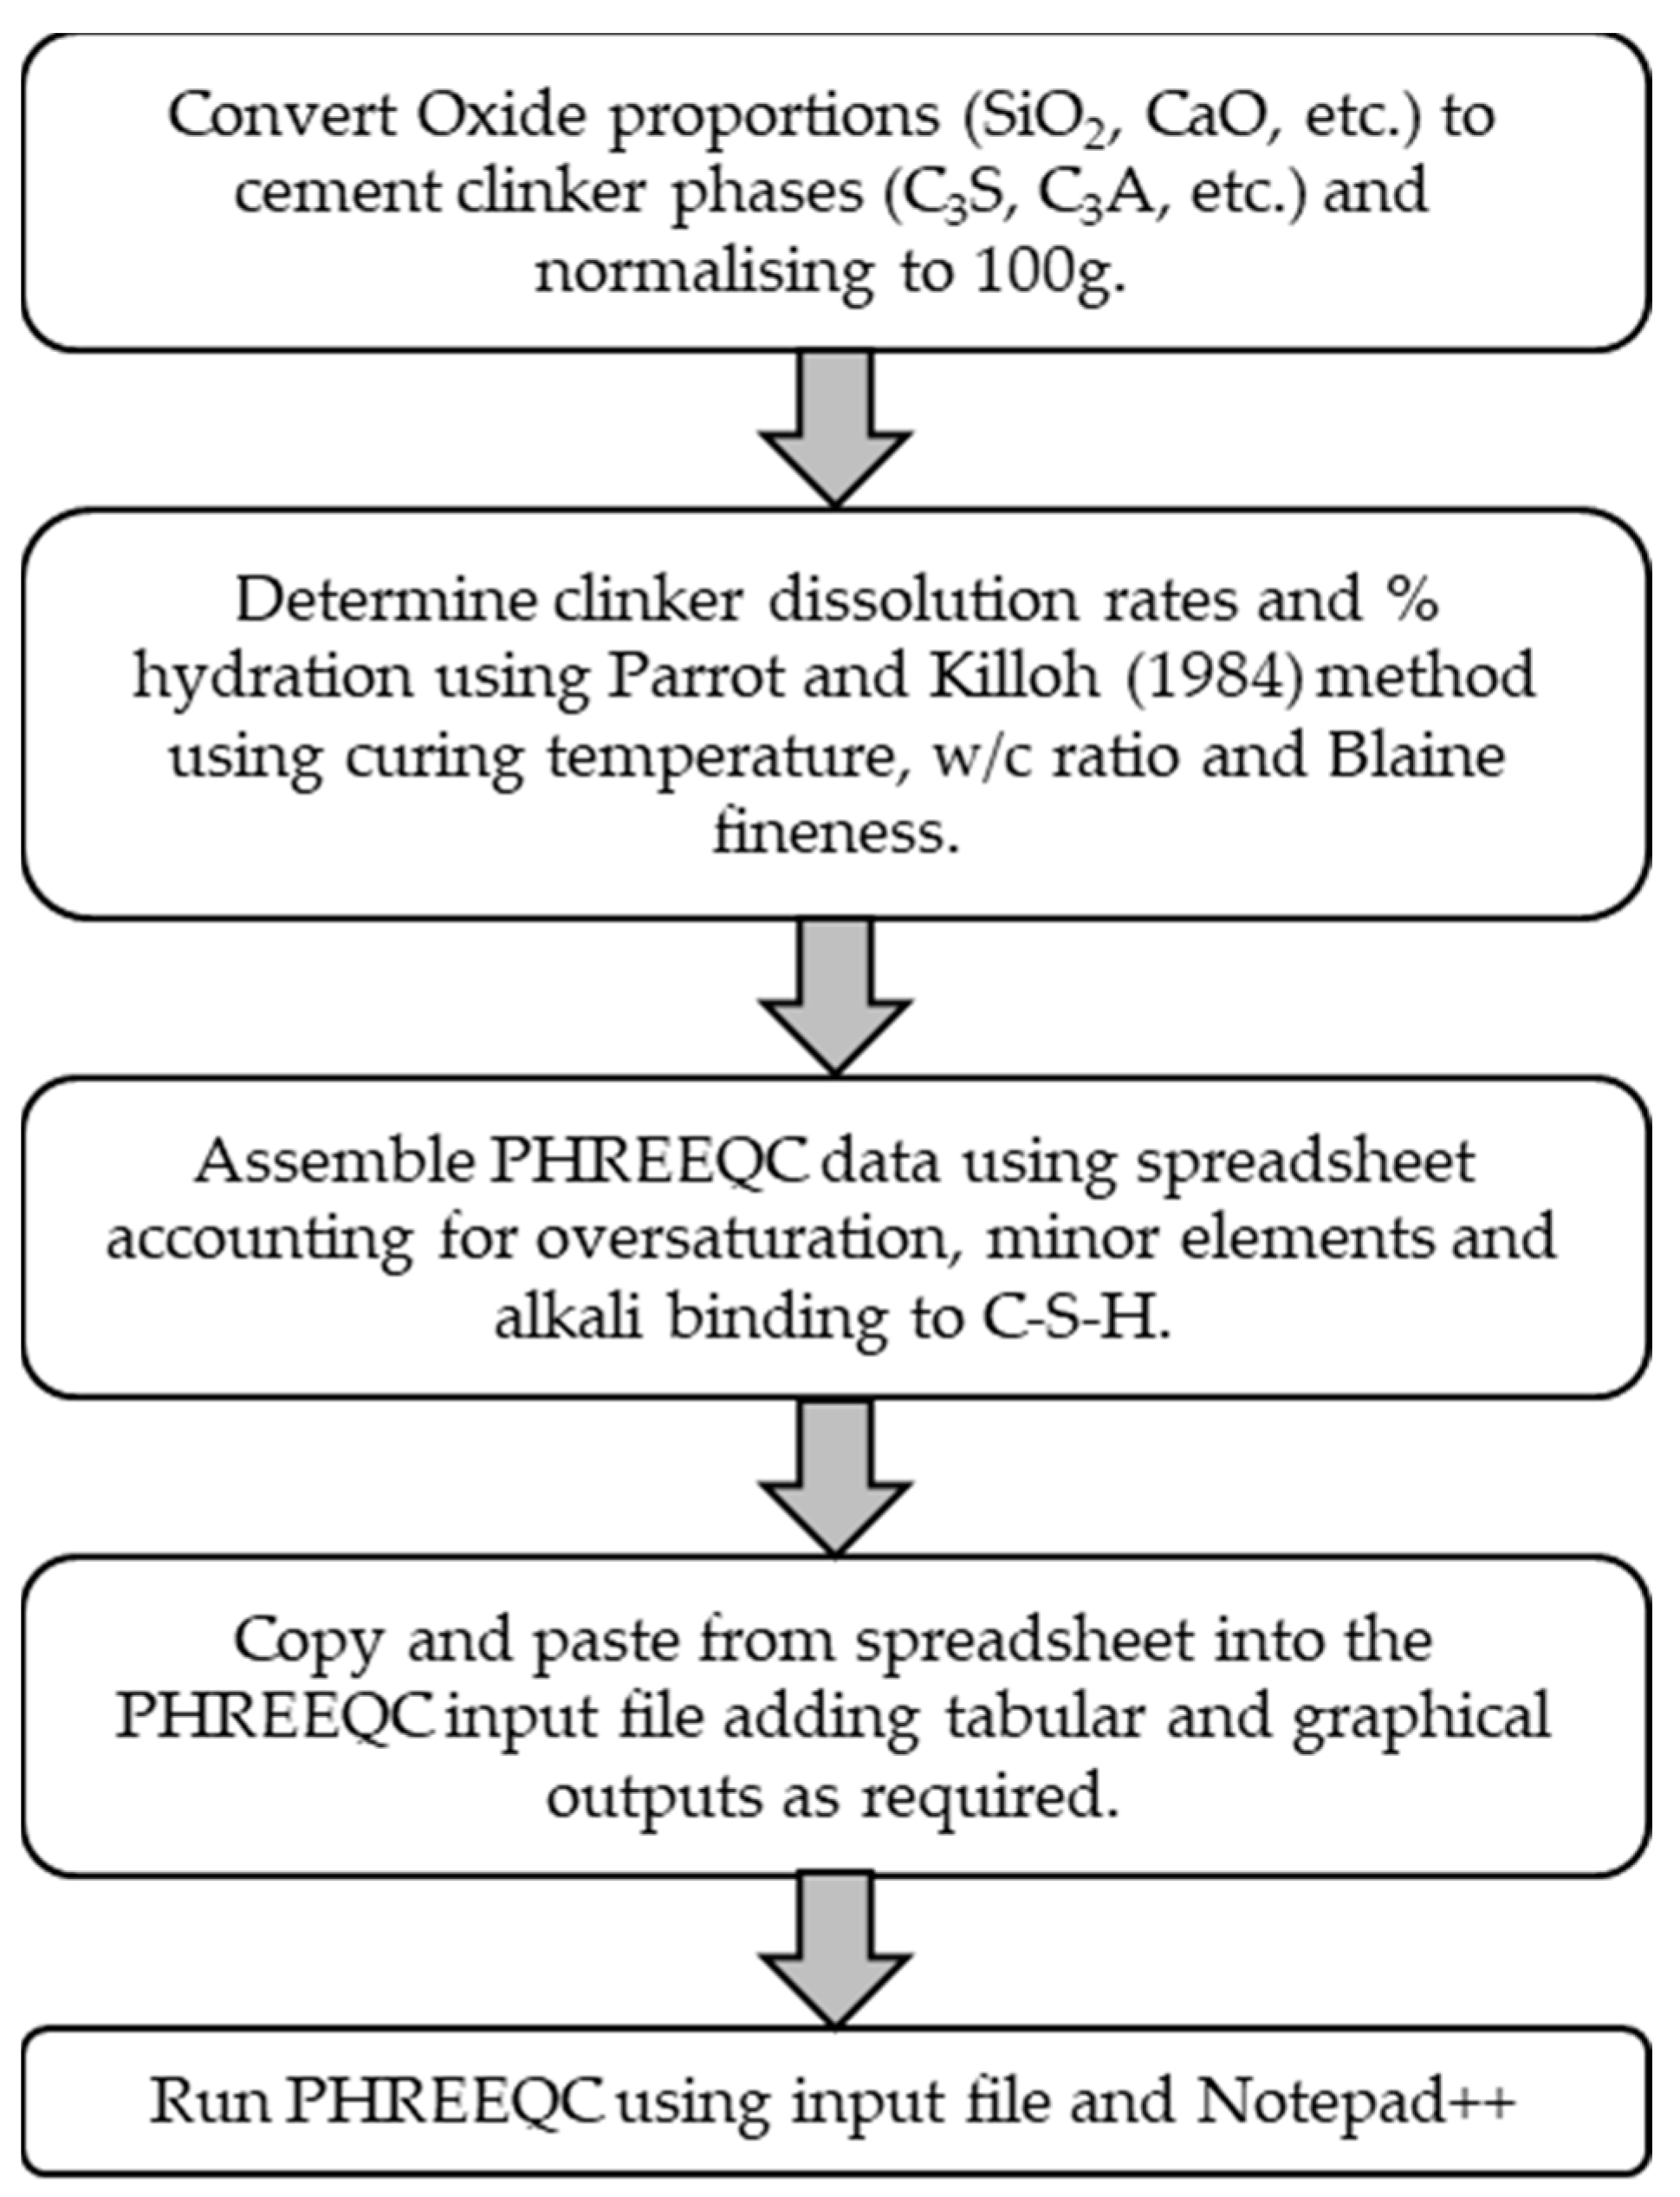
2. Thermodynamic Modelling

2.1. OPC Clinker Rate Equations

The oxide breakdown of the two cements under analysis here are described in Table 1 in terms of their oxide proportions and are normalised to 100 g of cement. The CEM I cement has ~2.9% limestone powder content by mass, compared to ~11.23% in the CEM II/A-L, which are both within the limits of EN197-1 [22]. Thermodynamic modelling was performed using PHREEQC [23] using input data to describe the normative clinker content, its dissolution rate, and accounting for minor constituents, oversaturation and alkalis binding to the C-S-H [24,25,26]. Anhydrite (CaSO4) is used here as gypsum. The modelling method employed is summarised in the flow diagram in Figure 1.

2.2. C-S-H Gel

Previous work by Holmes et al. [26] has demonstrated how the C-S-H gel phase can be modelled as a series of discrete solid phases (DSPs) using suitable end members in the cemdata18 database. Dissolution reactions and solubility products for the DSP for the CSH-3T model can be calculated on a spreadsheet and suitably formatted such that the user simply needs to copy and paste directly into PHREEQC. At this point, the CSH-3T model can be written into the PHREEQC input file and used to model the hydration of OPC. Modelling cement hydration requires accounting for the “kinetic dissolution” of the clinker phases over time [27], oversaturation during the first 12 h of hydration [17] and the binding of alkalis by the C-S-H [28].

2.3. Full Hydration Analysis
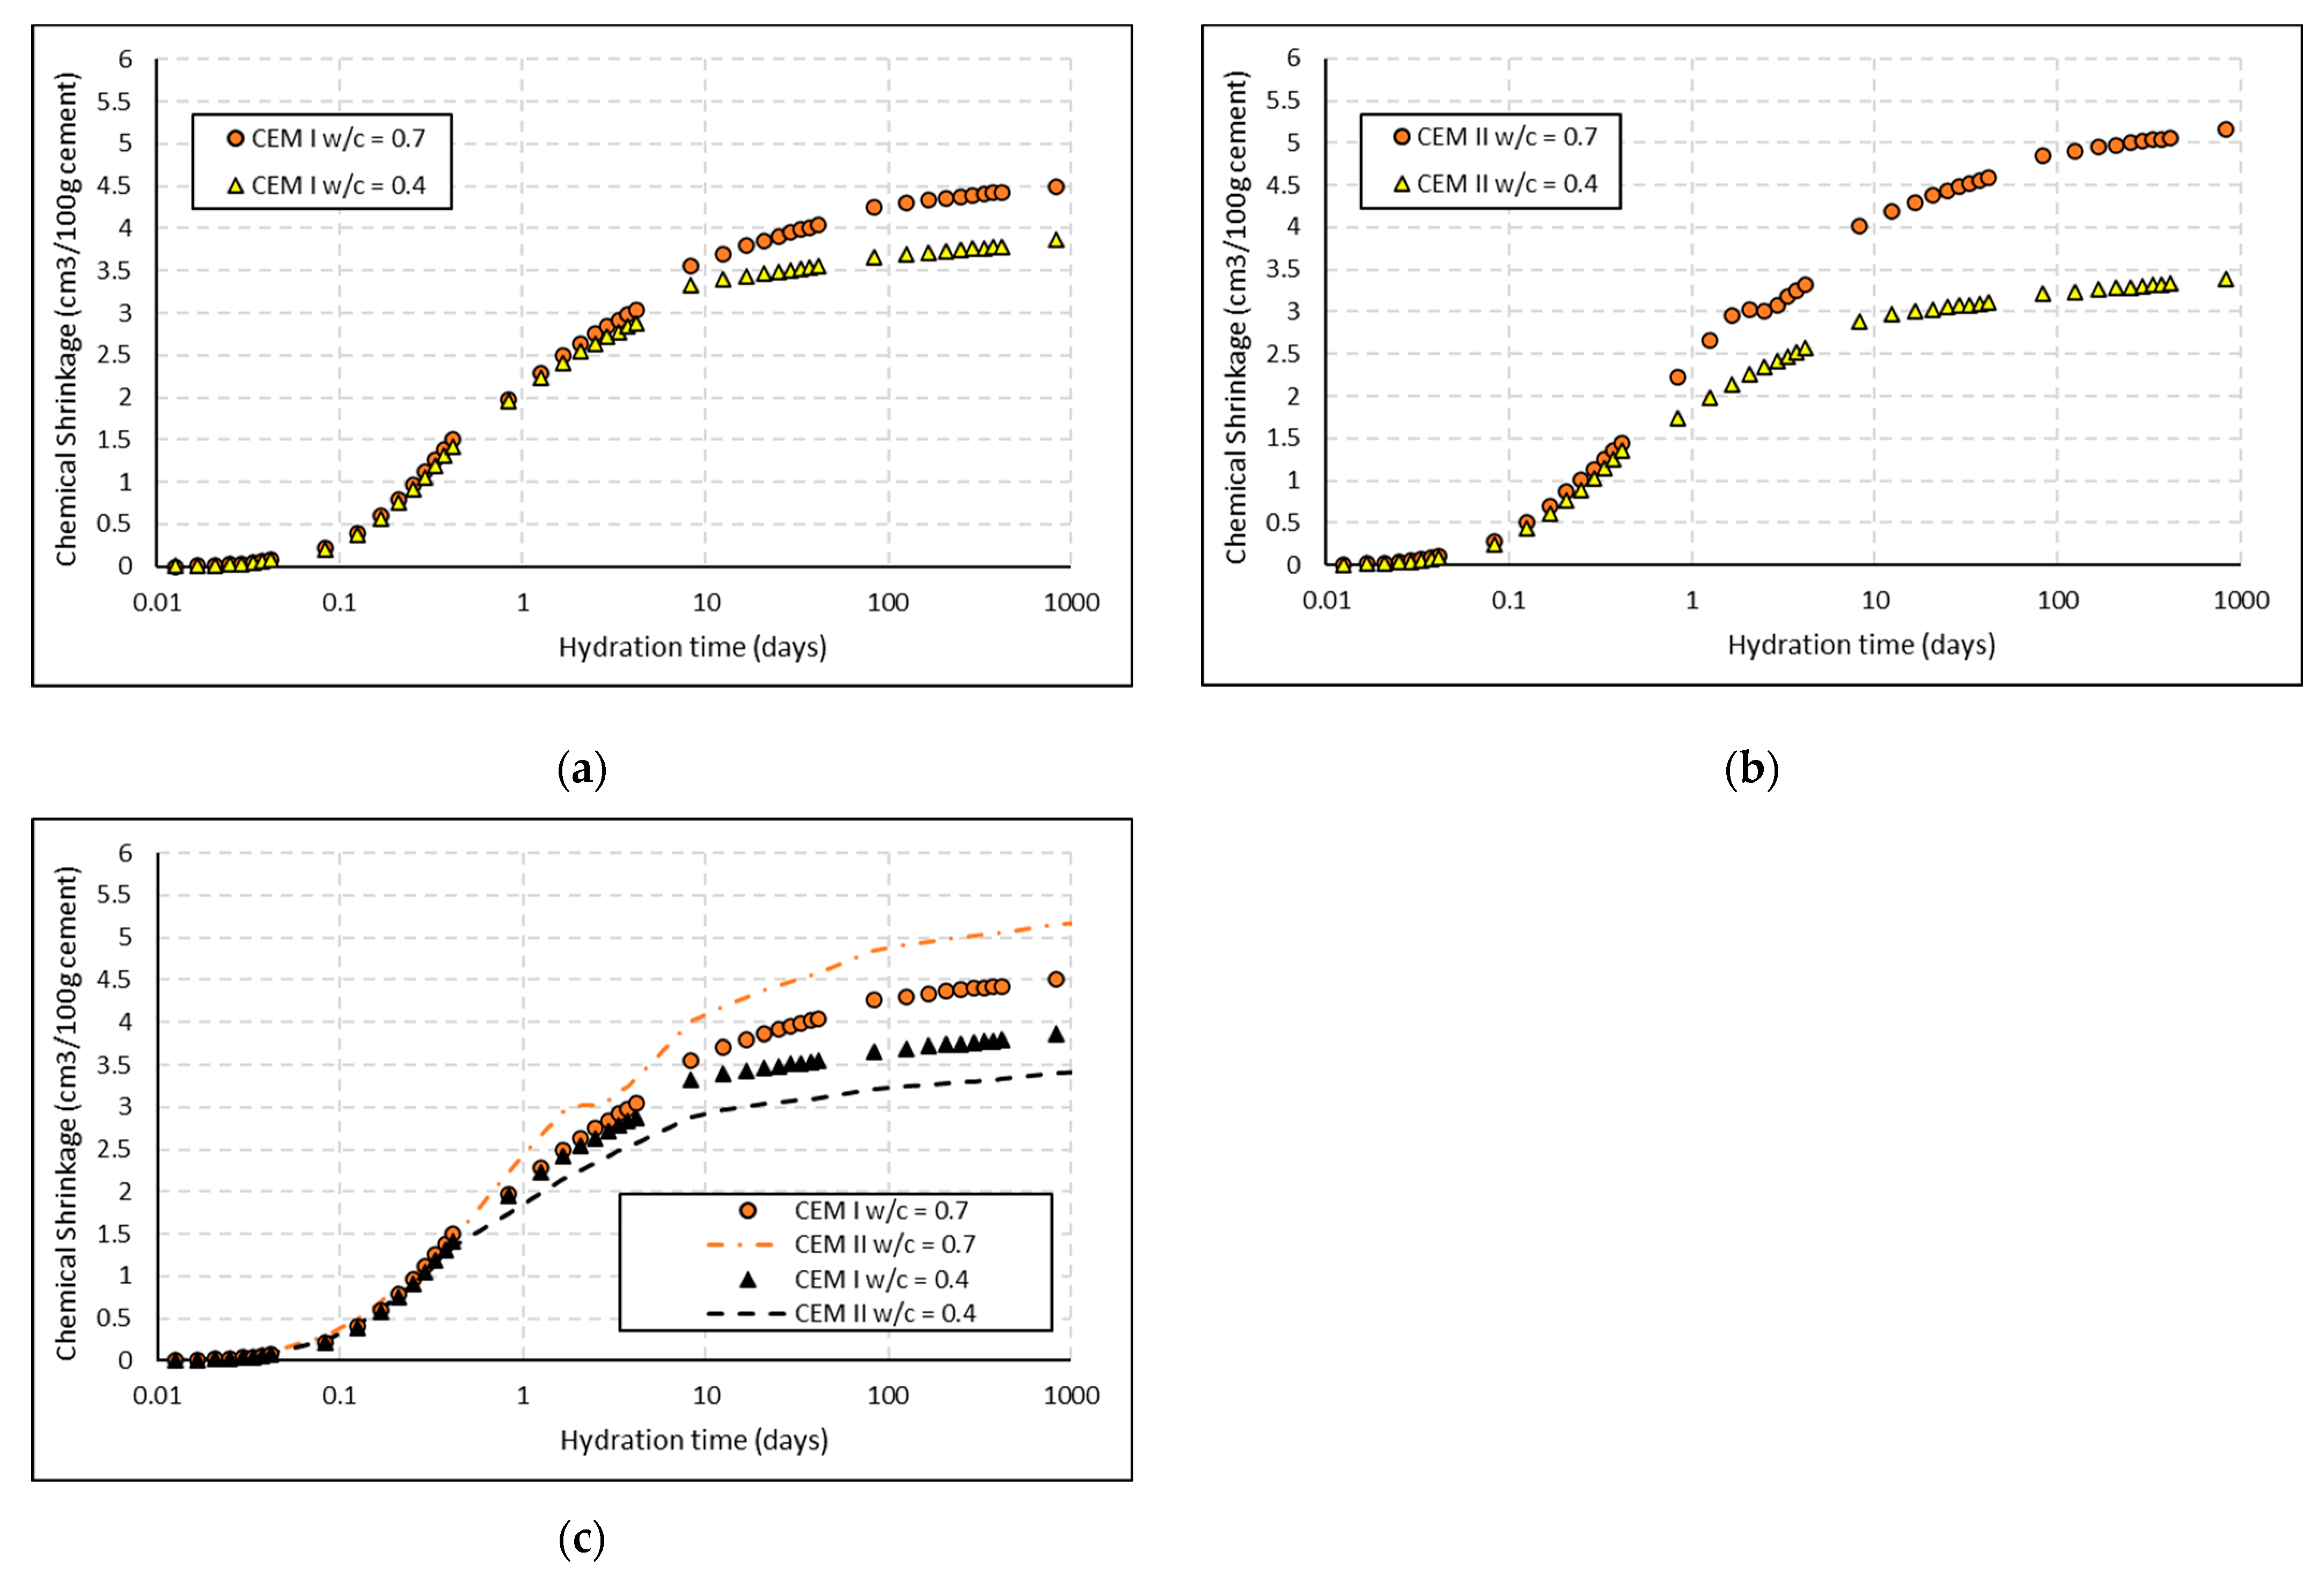
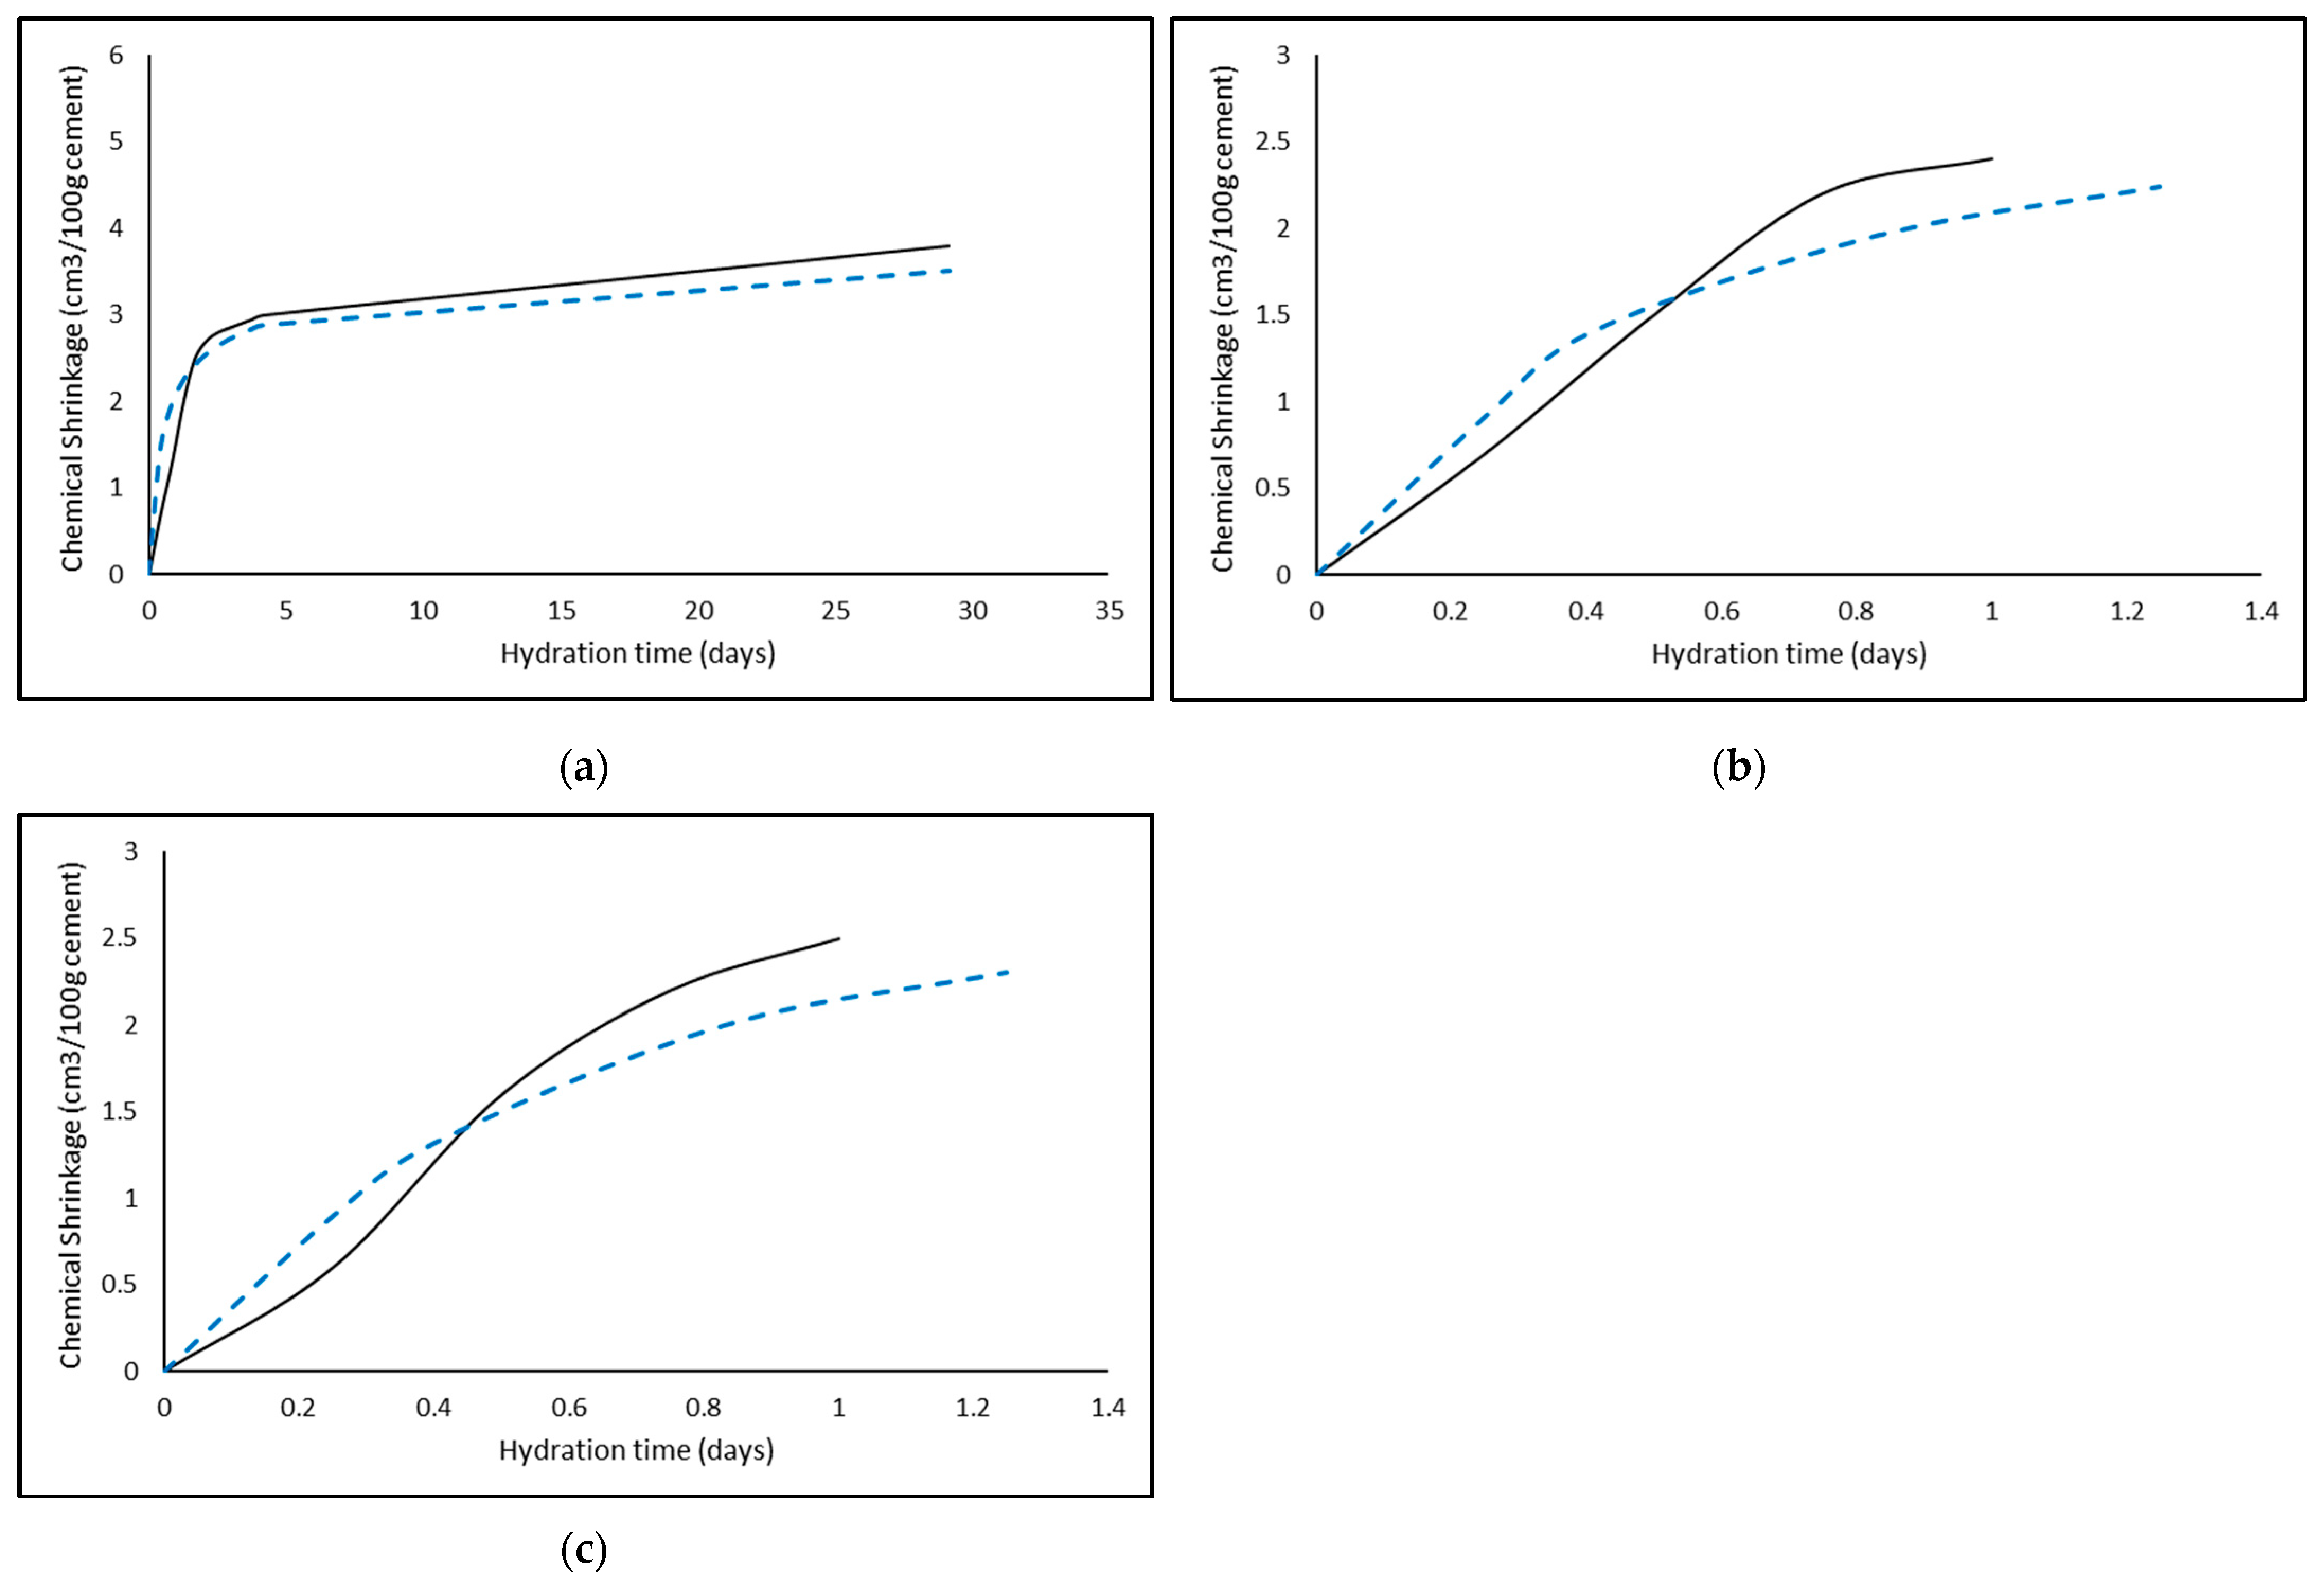
An excel spreadsheet defines the PHREEQC input for every time step to model 1000 days of hydration as 47 individual solutions, with the results available in tabular and/or graphical formats. For this work, the output includes the volumes of the clinker (including gypsum and calcite), solid hydrates (C-S-H, portlandite, hydrotalcite, brucite, ettringite, monocarbonate and hydrogarnet), the pore water and chemical shrinkage. The predicted change in the clinker (including calcite and gypsum), solid hydrates, pore water and, ultimately, chemical shrinkage for the two cements and w/c ratios described in Table 1 are shown for the two cements for w/c = 0.4 and 0.7 in Figure 1. It appears that most chemical shrinkage occurs within 11 days, as indicated in the simulation. Previous work by the authors provides more detailed phase assemblages showing the dissolution of individual clinkers (C3S, C3A, etc.) and predicted hydrate phases [24].

3. Discussion

Figure 2 shows the predicted chemical shrinkage for the two cements described in Table 1. As it can be seen, the shrinkage in the CEM I cement (3.89 cm3/100 g) is slightly higher than the CEM II/A-L (3.42 cm3/100 g) in the 0.4 w/c ratio, but lower in the 0.7 w/c ratio (4.52 cm3/100 g compared to 5.18 cm3/100 g, respectively) due to the higher clinker and lower calcite contents. Merzouki et al. [7] found that increasing the w/c ratio speeds up the degree of hydration, which has been confirmed here. The presence of limestone binder in cement has been shown to yield slightly higher compressive strengths [18]. While it is largely believed that this was due to additional nucleation and growth sites available due to the presence of limestone, De Weerdt et al. [29] argued that it cannot be solely attributed to this, as no significant differences were observed in the long-term binder reactions. In terms of chemical shrinkage, ref. [29] believes that the stabilisation of ettringite and the precipitation of monocarbonate due to the presence of limestone results in an increase in volume, which in turn reduces porosity with the corresponding improvements in compressive strength, as reported in the literature [18,29]. As a result, the measured chemical shrinkage from a cement binder with 5% limestone showed an increase in chemical shrinkage. This is true here, but only for the higher w/c ratio.
As chemical shrinkage is related to the rate of clinker dissolution which controls the release of ions into solution and the corresponding formation and volume of solid hydrates, the rate and amount of clinker dissolving is paramount. The Parrott and Killoh equations [27] used here were developed specifically for OPC systems, and do not account for the faster rate of clinker dissolution and solid hydrate precipitation provided through additional nucleation sites from the limestone powder [24]. This would be more evident in the CEM II/A-L cement, which has significantly more limestone (Table 1). This is an area of research which is urgently required by cement hydration modelers.
Due to the lack of evidence around the nucleation, growth, shell formation and diffusion theory used by [27], Julliand et al. [30] presented an alternative mechanism which is based around geochemical behaviour where clinker dissolution is initially dominated by the formation of surface pitting followed by a step retreat. This approach was found to account for the rapid decrease in reaction upon contact with water and agreed with experimental findings in the literature. Finally, it has been well reported in the literature [2,6] that chemical shrinkage and degree of hydration have a linear relation, which has also been shown here (Figure 3).
Figure 4 shows comparisons between the predicted chemical shrinkage (in cm3/100 g cement) and measured results from the literature with a w/c ratio of 0.4 for CEM I (Figure 4a,b) and CEM II cements (Figure 4c). As it can be seen, there is a reasonable comparison (~8%) between the thermodynamically predicted and experimentally measured results early on, with some divergence over time.
Figure 5 shows a comparison between the predicted chemical shrinkage from the model here and experimentally measured data in the literature. As may be shown, there is reasonably good agreement between both, irrespective of the type of cement.

4. Conclusions

The current paper presents a thermodynamic model that quantifies the chemical shrinkage volume created during the first 1000 days of hydration using the cemdata18 database and a series of discrete solid phases (DSPs) to represent C-S-H, which has not been quantified in the literature to date. These results show a linear correlation between degree of hydration and chemical shrinkage for CEM I and CEM II/A-L cements using thermodynamic modelling. The results show higher chemical shrinkage in the CEM I cements for the lower w/c ratio only, which agrees with previous work in this area. However, the difference is relatively minor. The model used here provides an easy-to-use method to estimate the amount of chemical shrinkage in a hydrating cement, and if it might lead to long-term cracking and reduced durability performance over time. The cements used here are commercially available and well used in concrete and mortars, but this approach could be extended to the new generation of more sustainable cements under development using appropriate input parameters. The use of DSPs provides an accurate and stable method to model the behaviour of C-S-H gel in PHREEQC, avoiding the use of the solid solution data block, which can have a high computational time and load.

Author Contributions

Conceptualization, methodology, project administration, writing and software: N.H.; physical chemistry and writing: M.T.; writing and software: D.K. All authors have read and agreed to the published version of the manuscript.

Funding

This research is supported through a US–Ireland grant tri-funded by the National Science Foundation (NSF, 1805818), Science Foundation Ireland (SFI, 17/US/3424), and the Department for the Economy of Northern Ireland (DfE, USI 127).

Institutional Review Board Statement

Not applicable.

Informed Consent Statement

Not applicable.

Data Availability Statement

Not applicable.

Acknowledgments

The authors acknowledge the assistance of Colin Walker, Andy Watson and Andy West.

Conflicts of Interest

The authors declare no conflict of interest.

References

  1. Bouasker, M.; Mounanga, P.; Turcry, P.; Loukili, A.; Khelidj, A. Chemical shrinkage of cement pastes and mortars at very early age: Effect of limestone filler and granular inclusions. Cem. Concr. Compos. 2008, 30, 13–22. [Google Scholar] [CrossRef] [Green Version]
  2. Geiker, M. Studies of Portland Cement Hydration by Measurements of Chemical Shrinkage and a Systematic Evaluation of Hydration Curves by Means of the Dispersion Model. Ph.D. Thesis, Technical University of Denmark, Lyngby, Denmark, 1983. [Google Scholar]
  3. Geiker, M.; Lyngby Technical University of Denmark; DTH; Institute of Mineral Industry (IMI). Studies of Portland Cement Hydration by Measurements of Chemical Shrinkage and a Systematic Evaluation of Hydration Curves by Means of the Dispersion Model: Lyngby DTH Licentiatafhandling; Technical University of Denmark: Lyngby, Denmark, 1983; Available online: https://books.google.ie/books?id=HEVjGwAACAAJ (accessed on 8 November 2022).
  4. Geiker, M.; Knudsen, T. Chemical shrinkage of portland cement pastes. Cem. Concr. Res. 1982, 12, 603–610. [Google Scholar] [CrossRef]
  5. Bentz, D.P.; Geiker, M.R.; Hansen, K.K. Shrinkage-reducing admixtures and early-age desiccation in cement pastes and mortars. Cem. Concr. Res. 2001, 31, 1075–1085. [Google Scholar] [CrossRef]
  6. Pang, X.; Bentz, D.P.; Meyer, C.; Funkhouser, G.P.; Darbe, R. A comparison study of Portland cement hydration kinetics as measured by chemical shrinkage and isothermal calorimetry. Cem. Concr. Compos. 2013, 39, 23–32. [Google Scholar] [CrossRef] [Green Version]
  7. Merzouki, T.; Bouasker, M.; El Houda Khalifa, N.; Mounanga, P. Contribution to the modeling of hydration and chemical shrinkage of slag-blended cement at early age. Constr. Build. Mater. 2013, 44, 368–380. [Google Scholar] [CrossRef]
  8. Yodsudjai, W.; Wang, K. Chemical shrinkage behavior of pastes made with different types of cements. Constr. Build. Mater. 2013, 40, 854–862. [Google Scholar] [CrossRef]
  9. Jupe, A.C.; Turrillas, X.; Barnes, P.; Colston, S.L.; Hall, C.; Häusermann, D.; Hanfland, M. Fast in situ X-ray-diffraction studies of chemical reactions: A synchrotron view of the hydration of tricalcium aluminate. Phys. Rev. B Cover. Condens. Matter Mater. Phys. 1996, 53, R14697–R14700. [Google Scholar] [CrossRef]
  10. Zhang, Z.; Scherer, G.W. Measuring chemical shrinkage of ordinary Portland cement pastes with high water-to-cement ratios by adding cellulose nanofibrils. Cem. Concr. Compos. 2020, 111, 103625. [Google Scholar] [CrossRef]
  11. De Siqueira, A.A.; Cordeiro, G.C. Properties of binary and ternary mixes of cement, sugarcane bagasse ash and limestone. Constr. Build. Mater. 2022, 317, 126150. [Google Scholar] [CrossRef]
  12. Wang, Y.; Li, J.; He, X.; Zheng, Z.; Su, Y.; Zhao, H.; Yang, J.; Strnadel, B. Effects of wet-grinded superfine waste glass on the fresh properties and reaction characteristic of cement pastes. Constr. Build. Mater. 2020, 247, 118593. [Google Scholar] [CrossRef]
  13. Bullerjahn, F.; Skocek, J.; Ben Haha, M.; Scrivener, K. Chemical shrinkage of ye’elimite with and without gypsum addition. Constr. Build. Mater. 2019, 200, 770–780. [Google Scholar] [CrossRef]
  14. Ke, G.; Zhang, J.; Liu, Y. Shrinkage characteristics of calcium sulphoaluminate cement concrete. Constr. Build. Mater. 2022, 337, 127627. [Google Scholar] [CrossRef]
  15. Hay, R.; Li, L.; Celik, K. Shrinkage, hydration, and strength development of limestone calcined clay cement (LC3) with different sulfation levels. Cem. Concr. Compos. 2022, 127, 104403. [Google Scholar] [CrossRef]
  16. Mounanga, P.; Khelidj, A.; Loukili, A.; Baroghel-Bouny, V. Predicting Ca(OH)2 content and chemical shrinkage of hydrating cement pastes using analytical approach. Cem. Concr. Res. 2004, 34, 255–265, Erratum in Cem. Concr. Res. 2005, 35, 423–424. [Google Scholar] [CrossRef] [Green Version]
  17. Lothenbach, B.; Winnefeld, F. Thermodynamic modelling of the hydration of Portland Cement. Cem. Concr. Res. 2006, 36, 209–226. [Google Scholar] [CrossRef]
  18. Lothenbach, B.; Le Saout, G.; Gallucci, E.; Scrivener, K. Influence of limestone on the hydration of Portland cements. Cem. Concr. Res. 2008, 38, 848–860. [Google Scholar] [CrossRef]
  19. Lothenbach, B.; Matschei, T.; Möschner, G.; Glasser, F.P. Thermodynamic modelling of the effect of temperature on the hydration and porosity of Portland cement. Cem. Concr. Res. 2008, 38, 1–18. [Google Scholar] [CrossRef] [Green Version]
  20. Lothenbach, B.; Kulik, D.A.; Matschei, T.; Balonis, M.; Baquerizo, L.; Dilnesa, B.; Miron, G.D.; Myers, R.J. Cemdata18: A chemical thermodynamic database for hydrated Portland cements and alkali-activated materials. Cem. Concr. Res. 2019, 115, 472–506. [Google Scholar] [CrossRef] [Green Version]
  21. Thoenen, T.; Hummel, W.; Berner, U.; Curti, E. The PSI/Nagra Chemical Thermodynamic Database 12/07; Paul Scherrer Institut: Villigen, Switzerland, 2014. [Google Scholar]
  22. British Standards Institute. BS EN 197-1; Cement: Composition, Specification and Conformity Criteria for Common Cements. British Standards Institute: London, UK, 2000.
  23. Parkhurst, D.L.; Appelo, C.A.J. Description of Input and Examples for PHREEQC Version 3—A Computer Program for Speciation, Batch-Reaction, One-Dimensional Transport and Inverse Geochemical Calculations; Technical Report; U.S. Geological Survey: Denver, CO, USA, 2013.
  24. Holmes, N.; Tyrer, M.; West, R.; Lowe, A.; Kelliher, D. Using PHREEQC to model cement hydration. Constr. Build. Mater. 2022, 319, 126129. [Google Scholar] [CrossRef]
  25. Holmes, N.; Kelliher, D.; Tyrer, M. Thermodynamic Cement Hydration Modelling using HYDCEM. In Proceedings of the Civil Engineering Research in Ireland (CERI), Cork, Ireland, 27–28 August 2020. [Google Scholar]
  26. Holmes, N.; Walker, C.; Tyrer, M.; Kelliher, D. Deriving Discrete Solid Phases from CSH-3T and CSHQ End-Members to Model Cement Hydration in PHREEQC. In Proceedings of the Civil Engineering Research in Ireland (CERI) Conference, Dublin, Ireland, 25–26 August 2022; pp. 28–33. [Google Scholar]
  27. Killoh, L.J.; Parrot, D.C. Prediction of Cement Hydration. Br. Ceram. Proc. 1984, 35, 41–53. [Google Scholar]
  28. Hong, S.Y.; Glasser, F.P. Alkali binding in cement pastes: Part I. The C-S-H phase. Cem. Concr. Res. 1999, 29, 1893–1903. [Google Scholar] [CrossRef]
  29. De Weerdt, K.; Ben Haha, M.; Le Saout, G.; Kjellsen, K.; Justnes, H.; Lothenbach, B. Hydration mechanisms of ternary Portland cements containing limestone powder and fly ash. Cem. Concr. Res. 2011, 41, 279–291. [Google Scholar] [CrossRef]
  30. Juilland, P.; Gallucci, E.; Flatt, R.; Scrivener, K. Dissolution theory applied to the induction period in alite hydration. Cem. Concr. Res. 2010, 40, 831–844. [Google Scholar] [CrossRef]
Figure 1. Modelling flow diagram.
Buildings 12 01972 g001
Figure 2. Predicted phase assemblages for the two cements.
Buildings 12 01972 g002
Figure 3. Predicted chemical shrinkage over time for the (a) CEM I and (b) CEM II/A-L cements and (c) a comparison of both.
Buildings 12 01972 g003
Figure 4. Relationship between predicted chemical shrinkage and degree of hydration (using [22]) for the (a) CEM I and (b) CEM II cements.
Buildings 12 01972 g004
Figure 5. Comparison between predicted (dashed line) and measured (solid line) chemical shrinkage from (a) CEM I [8], (b) CEM I [1] and (c) CEM II [1] with a 0.4 w/c cement.
Buildings 12 01972 g005
Table 1. Cement oxide proportions (from XRF) and clinker phase compositions.
Oxide ProportionsPhase Composition g/100 g
(g/100 g Cement)CEM ICEM II/A-LPhaseCEM ICEM II/A-L
SiO219.0417.50C3S60.7951.23
Al2O35.014.60C2S6.849.94
Fe2O32.832.60C3A8.207.55
CaO63.4062.00C4AF8.327.66
MgO2.312.30Calcite2.9011.23
Na2O0.280.26Gypsum4.313.99
K2O0.540.50K2SO40.870.81
CaO (free)1.711.62Lime1.651.57
CO21.325.10Na2SO40.280.26
SO32.652.45K2O0.050.05
Periclase0.901.00Na2O0.150.14
Blaine (m2/kg)386474MgO2.232.23
Loss in ignition-7.22SO32.562.37
Publisher’s Note: MDPI stays neutral with regard to jurisdictional claims in published maps and institutional affiliations.

