Article

Effect of Sand-to-Cement Ratio on Mechanical Properties of Foam Concrete

1
Key Laboratory of Ministry of Education for Geomechanics and Embankment Engineering, Hohai University, Nanjing 210098, China
2
Geotechnical Engineering Research Center of Jiangsu Province, Nanjing 210098, China
3
Engineering Research Center of Dredging Technology of Ministry of Education, Hohai University, Changzhou 213000, China
4
Department of Civil and Environmental Engineering, Shenzhen, Harbin Institute of Technology, Shenzhen 518055, China
*
Author to whom correspondence should be addressed.
Buildings 2022, 12(11), 1969; https://doi.org/10.3390/buildings12111969
Submission received: 27 September 2022 / Revised: 2 November 2022 / Accepted: 10 November 2022 / Published: 13 November 2022
(This article belongs to the Section Building Materials, and Repair & Renovation)

Abstract

:
Foam concrete, as an important construction and building material, mainly consists of small inner pores (produced by preformed foam) and foam walls (i.e., the concrete surrounding the small inner pores). The effect of density and air volume quantity on compressive strength has been investigated in many previous studies. However, the findings on the relationship between compressive strength and water-to-cement ratio (Rwc) are controversial from different studies. The possible reason may be the effect of sand-to-cement ratio (Rsc), which has not been considered in pervious studies. In this study, a series of compressive tests on foam concrete with various Rwc and Rsc were conducted at a fixed air volume quantity. The results show that when Rwc was 0.5–1.0, the compressive strength increased along Rwc, different from the change of the concrete without foam. The enhance effect from the foam walls was dominant. When Rwc was larger than 1, the slurry was too thin to preserve the bubble for the Rsc of 2. However, for the Rsc of 5, the slurry performed well and its compressive strength remained constant, which was different from the increase stage with Rwc of 0.5–1.0. It was because of the enhanced effect caused by the decrease in the number of small holes, which almost offset the weakening effect for the Rwc on the strength. The enhance effect due to the decrease in the number of small holes can be normalized by the water-to-solid ratio (Rws). Except the results in the constant stage, the compressive strength increased with the increase of Rws, irrelevant to the Rsc. It indicates that the sand and cement had the same function on the decrease in the number of small holes. In order to get the same compressive strength, the cement can be replaced by the sand in the increase stage. The research results are expected to improve the quality control and the engineering efficiency of foam concrete.

Graphical Abstract

1. Introduction

Foam concrete (i.e., cellular concrete) is a lightweight porous concrete that has been applied widely to civil and traffic engineering fields such as road fills, partition walls and heat insulation materials [1,2,3,4]. Foam concrete is typically produced of a slurry of cement (or fly ash), sand and water. Particularly pure cement and water with the foaming agent are recommended by suppliers [5]. The foam concrete slurry can be poured or pumped into moulds, or directly into structural elements. After solidification, the foamed concrete can be taken out from the mould. The solidified foam concrete mainly consists of small inner pores and foam walls, where this kind of structure has been proved to enhance impact resistance [6]. Due to the existence of the inner pores, the density of foamed concrete ranges from 300 to 1500 kg/m3 [7,8]. The history of foam concrete can be traced back to the early 1920s and the production of autoclaved aerated concrete was used primarily as insulation [9]. The composition, physical properties and production of foamed concrete were studied in detail for the first time in the 1950s and 1960s [10]. Following this study, new admixtures were developed in the late 1970s and early 1980s, which led to the commercial use of foamed concrete in the building field. Kearsley has reported that the compressive strength of foam concrete drops exponentially with the reduction in density [11], whereas the compressive strength of foam concrete was less sensitive to slight change of the water-to-cement ratio (Rwc) than traditional concrete [12,13]. Taking the difference between densities of air content and solid content into consideration, it has been found that air volume quantity was largely dependent on dry density [14], and air voids that govern the porosity of foamed concrete are considered to have significant influence on compressive strength [15]. Various physical models were also proposed to predict the relationship between the compressive strength and air volume quantity [16,17,18]. Except the effect of air volume quantity, the Rwc was also an important factor.
For the foam concrete at a fixed air volume quantity, it is found that the compressive strength increases with Rwc contrary to the behaviour of conventional concrete/mortar [19,20,21]. This interesting phenomenon can be explained by the air-to-cement ratio (Rac). According to Feret’s formula [19], the strength is inversely proportional to Rwc and Rac in the pore walls. As well known, the larger the Rwc, the smaller the volume of entrained air in the pore walls. When Rwc ranges from 0.60 to 0.80, the volume of the entrained air is the predominant factor on strength. However, different conclusions on the relationships between compressive strength and Rwc were given by other studies. Van et al. [22] established the relationships between compressive strength and dry density of foam concrete with various Rwc. When Rwc ranges from 0.4 to 0.8, the optimal Rwc was between 0.53 and 0.58. The Rwc of 1, 0.8 and 0.6 was identically used as the control variable to make the test sample, and a new type of drilling support material was developed [23]. It was found that 0.6 was the optimal Rwc. Jones and McCarthy [24] stated that the compressive strength of foam concrete is not influenced by the small changes in Rwc. Liu et al. [25] found that the compressive strength first increased and then remained constant or slightly decreased as Rwc increased. These controversial conclusions indicated that the influence of foam walls on the compressive strength has not been fully understood. It may be because the effect of sand-to-cement ratio (Rsc) was not taken into account.
On the other hand, a series of microscopic studies on the foam concrete with various values of Rwc were conducted. Based on the results of scanning electron microscopy images, it was found that smaller Rwc resulted in the inner pores with a larger size in foam concrete [25,26,27]. It would increase the number of the connection between the adjacent inner pores, which would lead to the deterioration of the concrete structures surrounding the small inner pores and thus the decrease in the compressive strength of foam concrete. For the pore walls in the foam concrete, sand, cement and water are used and thus also affect the connection between the adjacent inner pores. However, the effect of sand was not taken into account based on the previous studies.
For concrete, the influence of Rsc on the mechanical properties of concrete has a critical value (i.e., between 5.00 and 6.00) [28]. When it reached the range of 0.37–0.41, the concrete strength reaches the best work performances [29]. Different from traditional concrete, the relationship between strength and Rsc of foamed concrete was controversial. When the design density was 1900–2200 kg/m3 under different Rsc, the compressive strength was proportional to the Rsc [30]. Amidah et. al [31] indicates that the strength of foamed concrete decreases with the increase of sand content. However, the influence of Rwc on the condition of different Rsc has not been studied. In this study, compressive tests on foam concrete with various values of Rwc were conducted. The measured modulus of elasticity and compressive strength are presented and discussed. To consider the effect of Rsc, foam concretes with low and high Rsc were chosen. Moreover, the water-to-solid ratio (Rws) was used to investigate the dominant effect on the compressive strength of foam concrete [32]. The experimental results provided a reference for the study of mechanical properties and a research idea for improving the economic benefits of concrete.

2. Materials and Experimental Program

2.1. Experimental Program

As shown in Table 1, foam concrete samples with various Rsc and values of Rwc were used in this study. For all tests, the pore volume content remained at 42 ± 2%. The commonly used Rwc was 2 according to the standard of CJJ T 177-2012 [33]. In order to explore the variation of Rwc under different Rsc, Rsc of 5 was chosen. Based on the similar wet density, Rwc was calculated. Moreover, the value of Rws is based on the given Rwc ratio and Rsc. The Rws was defined as follows:
R w s = m w m c + m s
where Rws is the water-to-solid ratio, mw is the mass of water, mc is the mass of cement and ms is the mass of sand. Equation (1) was rewritten as follows:
R w s = R w c 1 + R s c
where Rwc is the water-to-cement ratio and Rsc is the sand-to-cement ratio. Four values of Rwc in the range 0.50–1.00 were selected for the tests with low Rsc, and five values of Rwc in the range 0.65–1.55 for that with high Rsc. Corresponding to the Rsc, these nine tests are referred to as 2-X and 5-X where the letter X indicates Rwc. For each value of Rwc, three duplicate specimens of different age (i.e., 3, 7 and 28 days) were tested.

2.2. Materials

2.2.1. Water and Cement

Tap water and P.O. 42.5 cement produced by China Anhui Conch Cement Co., Ltd. (Wuhu, China) were chosen for the fresh slurry; the related chemical composition and physical properties has been investigated by Huang [34]. The basic properties of the cement are listed in Table 2. The density of cement used in the paper was 3.16 g/cm3, according to the method of ASTM C188-17 [35]. The compressive strengths at the ages of 3 and 28 days are 27 and 45 MPa, respectively.

2.2.2. Sand

A river sand was utilized as the fine aggregate of foam concrete. Its particle size distribution was obtained according to ASTM D 422-63 [36] and is shown in Figure 1. The density of sand particles used in the paper was 2.52 g/cm3, according to the ASTM C128-15 [37]. Its fine grain content is 2.70% with a maximum size of 5 mm. Its uniformity coefficient and curvature coefficient are 2.67 and 1.04, respectively. Based on ASTM D 2487-11 [38], the sand is divided into poorly graded sand (SP).

2.2.3. Foaming Agent

A vegetable protein foaming agent with a density of 40 kg/m3 was chosen. This type of foaming agent could produce air bubbles with high stability, resistant to the slurry mixed by cement, sand and water.

2.3. Experimental Procedure

2.3.1. Sample Preparation

The method to produce the foam concrete slurry was adopted from American Concrete Institute [39,40], Kearsley and Wainwright [41] and Gencel and Bilir [42]. The determination of mix proportion and wet density of samples was determined according to CJJ T 177-2012 [33]. The foam concrete samples were prepared following the procedure shown in Figure 2. Based on Table 1, the desired masses of foaming agent, cement, sand and water were calculated first. The cement, sand and water with these calculated masses were then poured into a 0.15 m3 horizontal mixer and mixed at a rate of 40 rpm until the foam concrete slurry was uniform. Subsequently, the foaming agent was diluted in a certain proportion of water and started the foaming device. A certain amount of foam was added to the mixer with stirring until it reached a uniform and stable state. Meanwhile, the wet density was weighed. If it was less than the design wet density, the foam was increased until it arrived at the slurry design value. The wet density of foam concrete was 1200 ± 40 kg/m3 (from 1180 to 1236 kg/m3) for the Rsc of 2, but 1000 ± 50 kg/m3 (from 975 to 1045 kg/m3) for the Rsc of 5, as listed in Table 1. Finally, the fresh slurry was poured into moulds with a dimension of 100 mm × 100 mm × 100 mm and remained static for 24 h. After demoulding, the foam concrete was maintained at the standard condition (i.e., 20 ± 2 °C; RH > 95%) for 3, 7 and 28 days.

2.3.2. Compressive Tests

The compressive strength tests of the foam concrete complied with the Chinese Foamed Concrete standard (JG/T 266-2011). A compression testing machine (DNS 300, with measurement range from 0 to 300 kN and measurement accuracy of 0.5% of the indicated value, Changchun Sinotest Equipment Co., Ltd., Wuxi, China) was used to carry out the compressive strength tests. The sample is first placed vertically on the platform of the compression testing machine. Then, the uniform load application and distribution can be promoted by setting a gasket cap at the end of the sample. Prior to applying the load, it was confirmed that the loading platforms touch the top of the sample. LVDT principle was used to control the displacement and loading rate of 1 mm/min. The strain rate of the test was 0.05% per second for each sample, and the corresponding compressive stress-strain curve was recorded for analysis. The elastic modulus of the sample is determined from the slope of the stressstrain curve ranging from zero to the point whose strain is 50% of the strain at the peak stress, according to Shao et al. [43].

2.3.3. Scanning Electron Microscope (SEM) Tests

A scanning electron microscope (SEM, Rock Hill, SC, USA; JSM-7800F with 20 kV acceleration voltage, 30 mA lasing current) was used to analyse the microstructure of samples after compression tests. The results were first binarized by software Image J (x64) v1.8.0(National Institutes of Health, Bethesda, MD, USA) and equivalent circle diameter was measured for further analysis.

3. Experimental

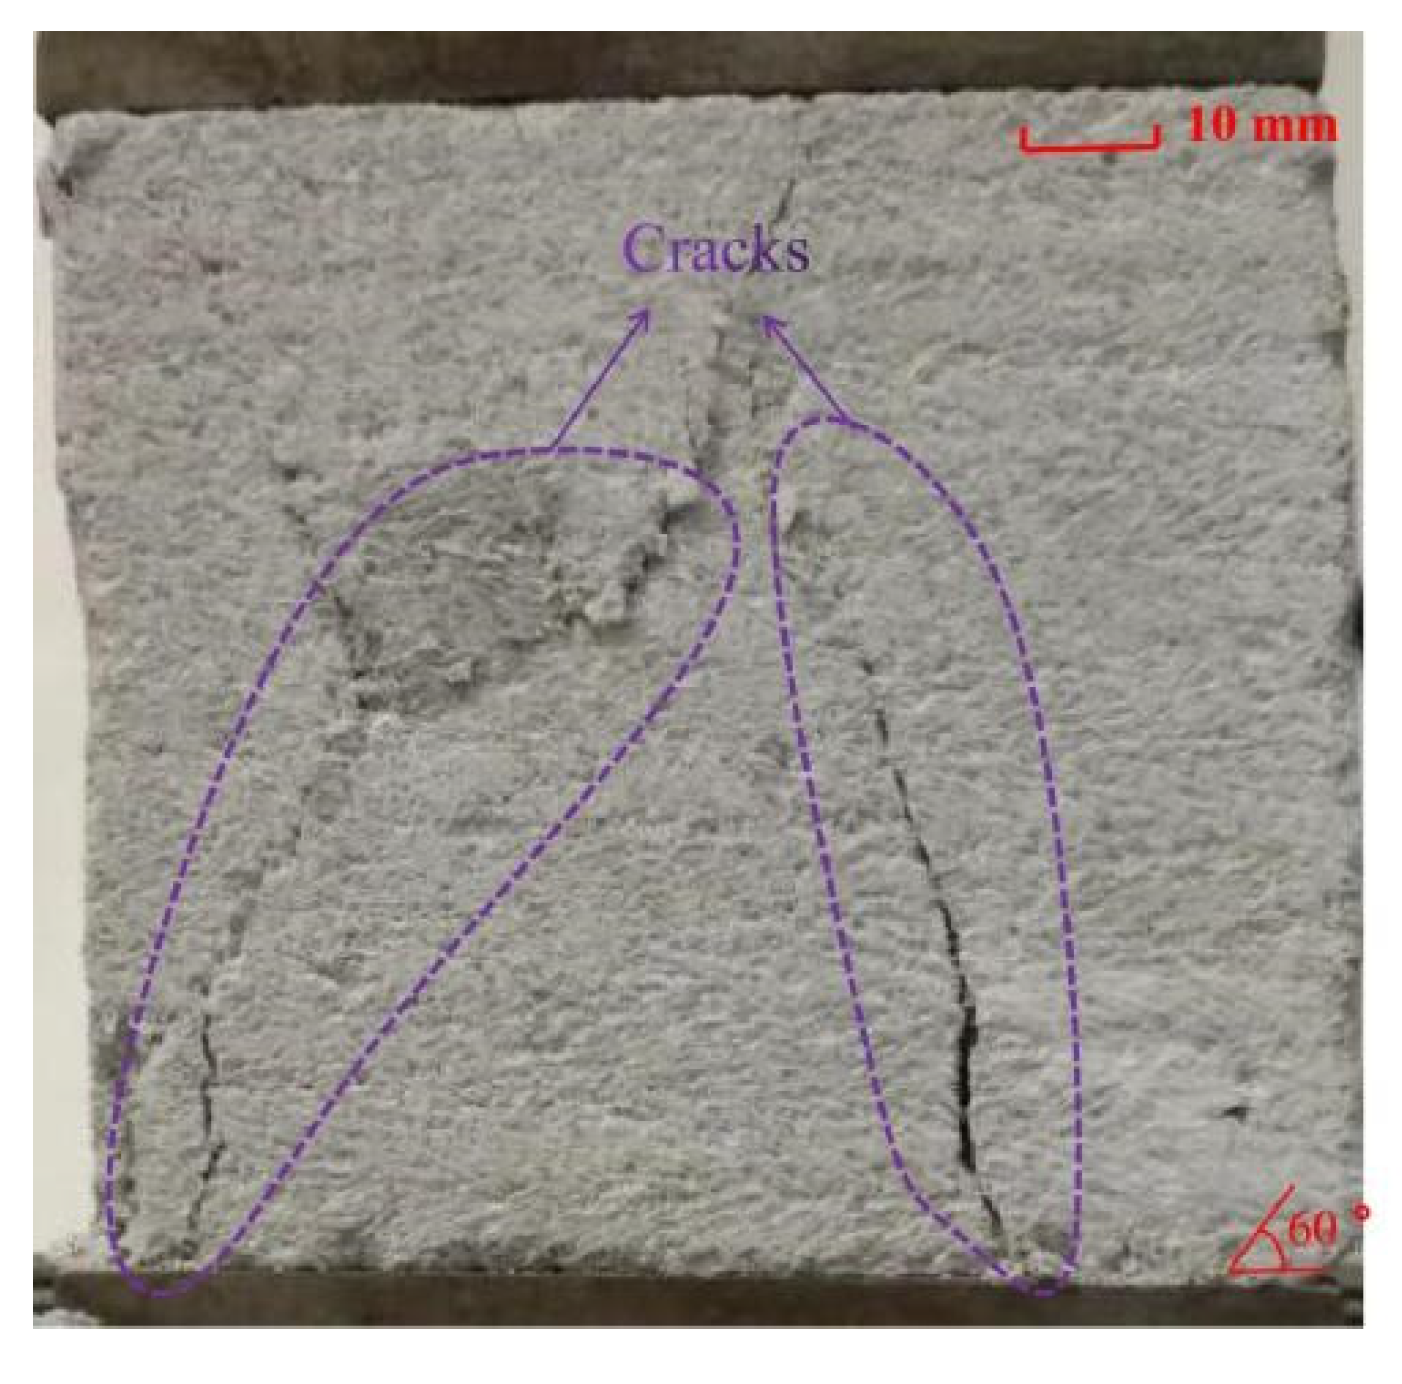
3.1. Damage to Samples

Figure 3 shows the photos of the damaged sample after the compressive test. For foam concrete, local failure was observed and two cracks mainly occurred at the middle owing to the stress concentration. There was a crack slope by about 60 degrees from the middle to the lower left corner, causing oblique section damage. It may indicate that the high oblique tensile stresses occurred at the corner. Another crack ran parallel to the vertical side. It may be due to the bending moment caused by the oblique tensile stresses at the top. When the crack occurred, the pressure decreased significantly. At this time, the sample was considered to be damaged.

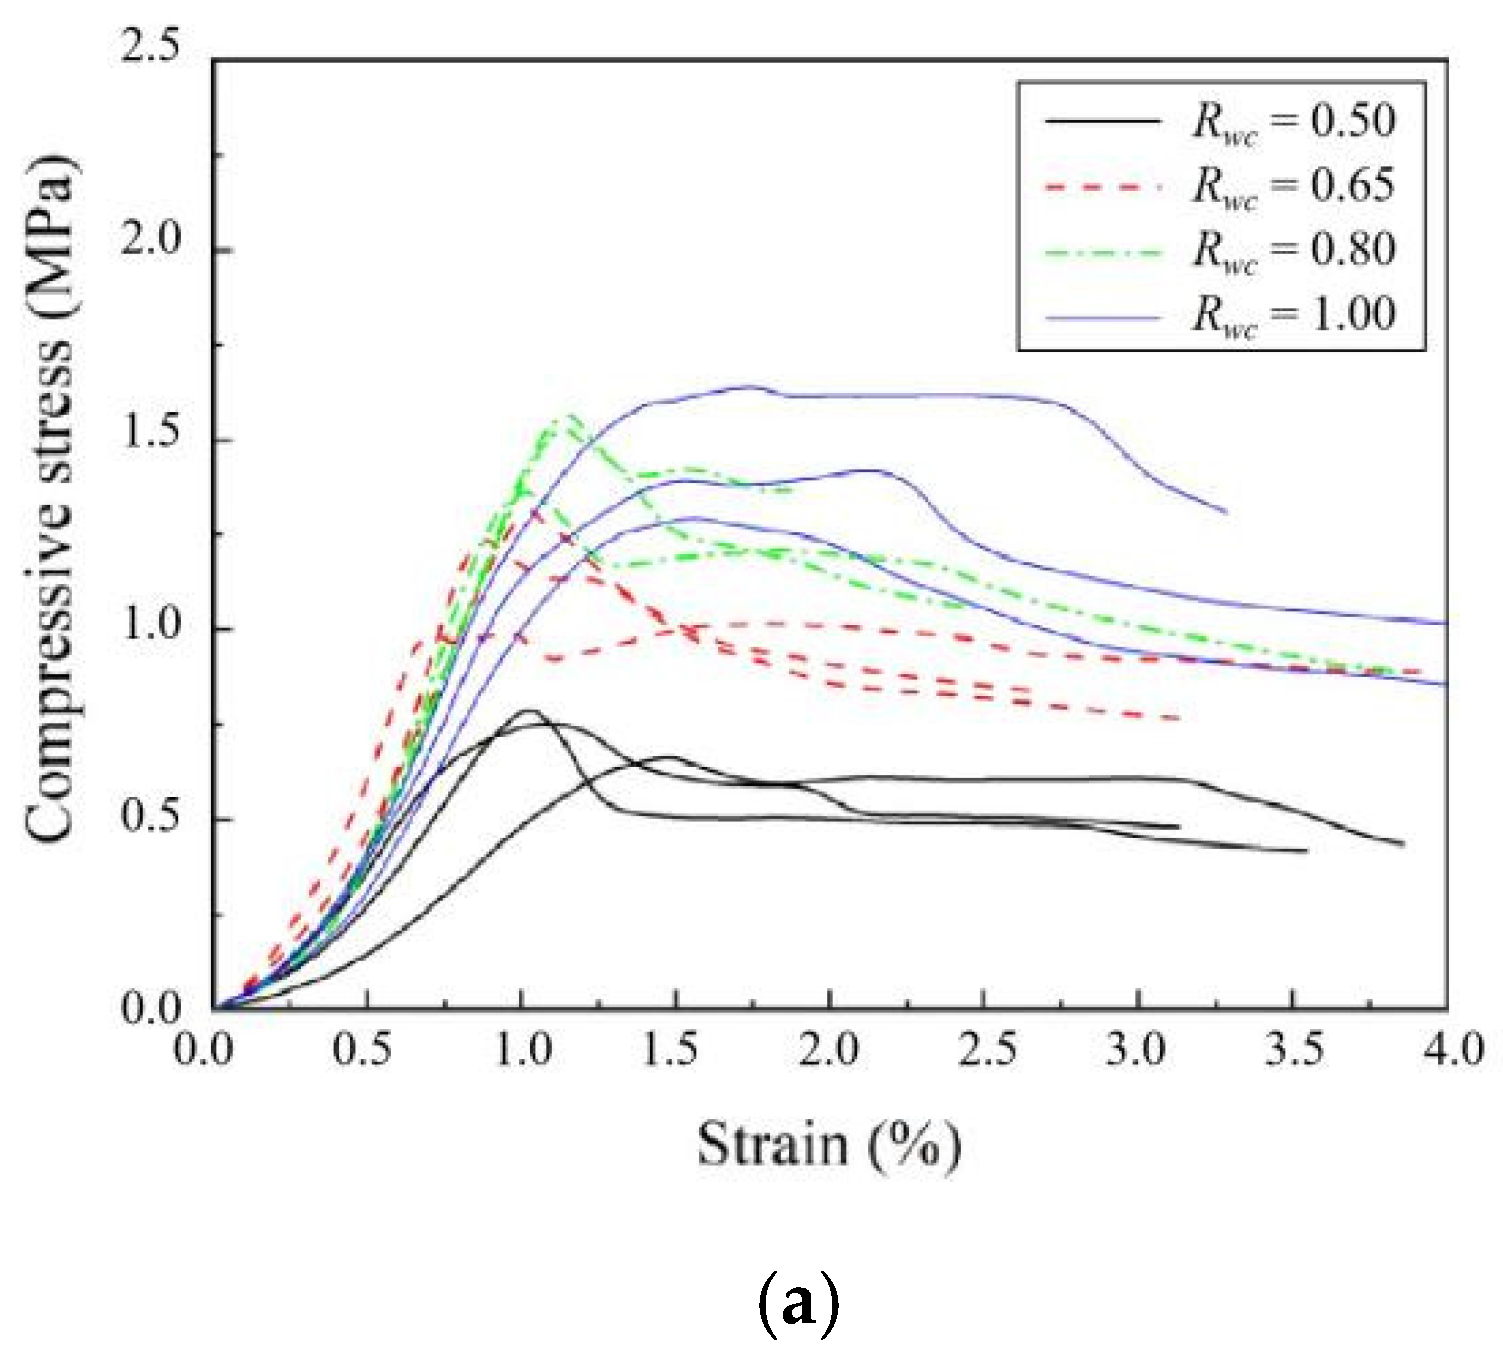
3.2. Stress-Strain Results

Figure 4a shows the compressive stress-strain curves of foam concrete at 3 days when Rsc is 2. As previously stated, besides these four values of Rwc, the foam concretes with the Rwc of 0.40 and 1.15 were also tested. For the foam concrete with the Rwc of 0.40, the fresh slurry was too stiff and thus the air bubbles produced by the foaming agent were broken by the solid phase in the fresh slurry. However, for the foam concrete with the Rwc of 1.15, the slurry was too thin to preserve the bubble [1]. The foam concretes with these two Rwc are not shown in the figure. For the Rwc ranging from 0.50 to 1.00, each curve exhibited an initial linear increase before yield point. The higher the Rwc, the steeper the curve at the beginning. As the strain increased further, a non-linear increase occurred until the peak stress point. The corresponding strain at peak stress ranged from 1 to 1.5%, which was two times larger than that of conventional concrete/mortar (i.e., 0.30% from Nicolo et al. [44]), indicating that the foam concrete could undergo large deformation and have better impact resistance behaviour. The relatively large deformation was caused by the high air volume quantity (i.e., 42%) of the foam concrete. Beyond the peak value, the stress decreased with the strain. After the strain of 2%, the compressive stress for most curves remained constant. It should be noted that the peak stress also increased as Rwc increased. The peak stress for the Rwc of 1.00 was approximately 1.7 MPa, two times that for the Rwc of 0.50.
Similar changes in compressive stress for various Rwc at the ages of 7 and 14 days are shown in Figure 4b,c, respectively. As the age of the foam concrete increased, the compressive stress increased. For example, with the increase of age from 3 to 28 days, the maximum peak stress for the Rwc of 1.00 increased from 1.7 to 3.2 MPa. Similarly, the slope of the curve in the initial linear stress-strain relationship also increased with Rwc. These results were caused by the increase in the degree of hydration of the cement. It indicates that the compressive stress depended on the age of the foam concrete. However, the strain at peak stress remained between 1 and 1.5%, indicating that the strain at the peak stress was irrelevant to the age of the foam concrete.
Figure 5 shows the change in the compressive stress of foam concrete with the Rsc of 5. The compressive stress of foam concrete with the Rsc of 5 was much lower than that with the Rsc of 2. For example, the peak stress of foam concrete with the Rsc of 5 only ranged from 0.03 to 0.60 MPa, which is only approximately 20% of that with the Rsc of 2. The decrease in the compressive stress was attributed to the decrease in the cement content. For the slurry producing foam concrete walls, the cement content was about 28 ± 2% for the Rsc of 2, but 14 ± 2% for the Rsc of 5. It should be noted that the available range of Rwc was from 0.50 to 1.00 for the foam concrete with the Rsc of 2, but from 0.65 to 1.55 for that with the Rsc ratio of 5. The difference in the range of Rwc may be due to the effect of Rsc.

4. Discussion

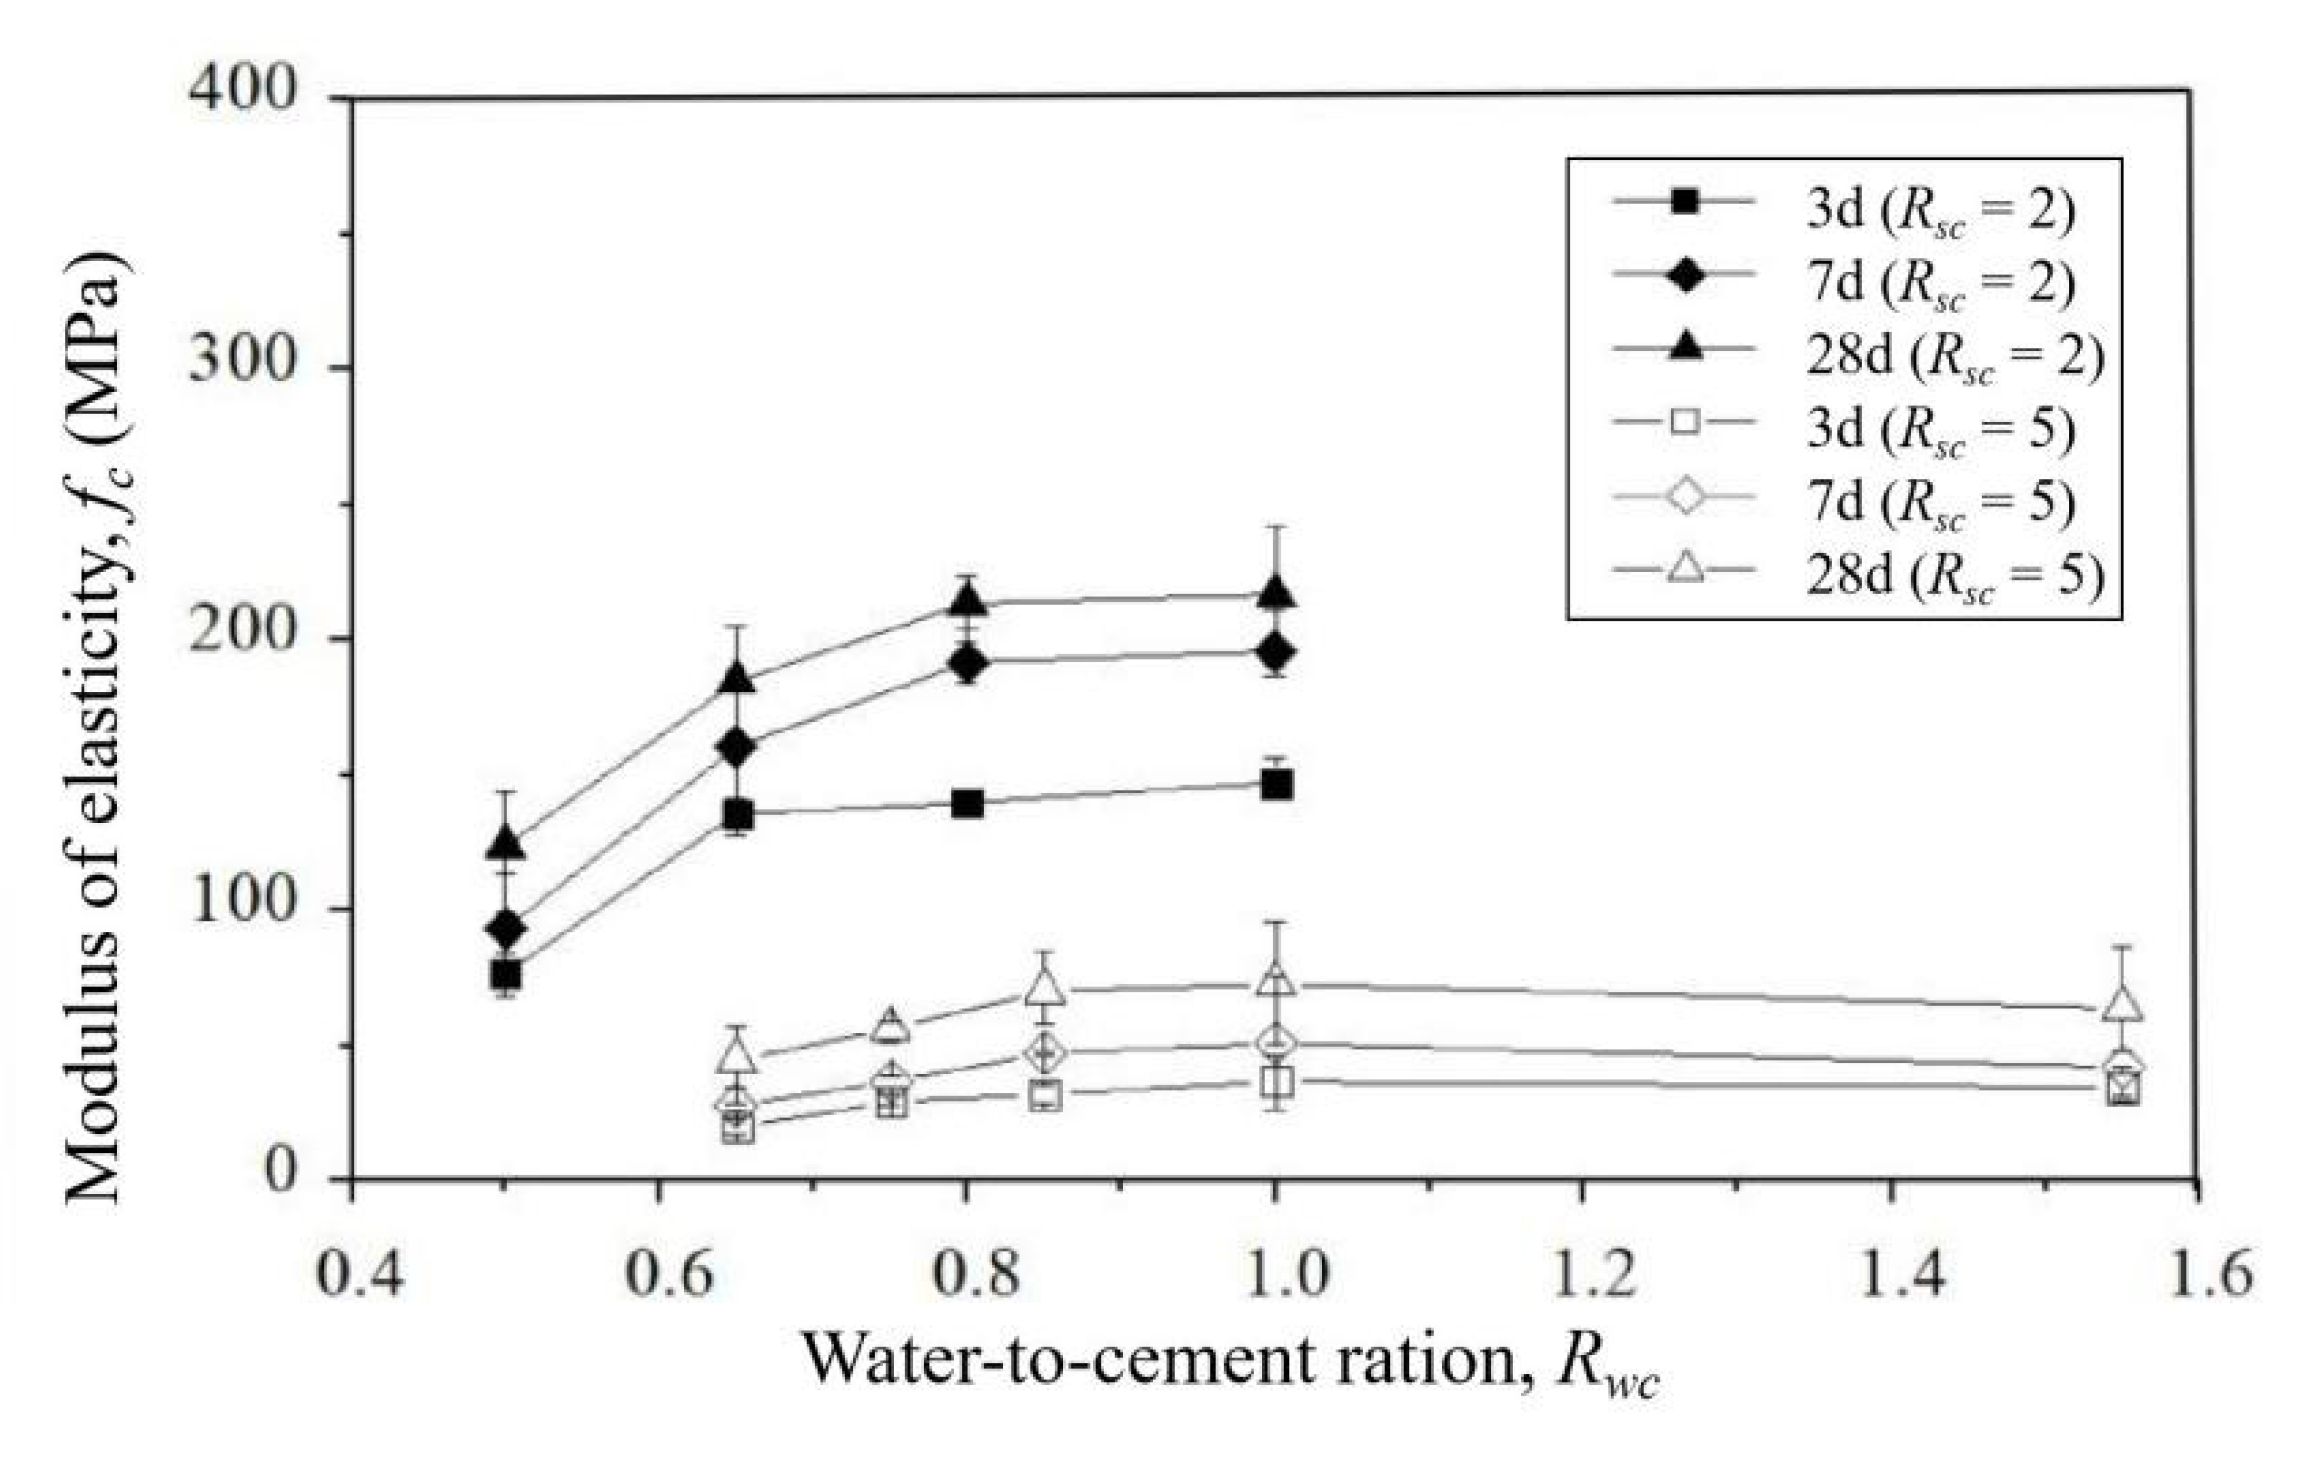
4.1. Elasticity Modulus

Figure 6 shows the change of elasticity modulus at the ages of 3, 7 and 28 days in relation to Rwc. For the Rsc of 2, the increase in the elasticity modulus with Rwc was observed at all ages. For the age of 28 days, the modulus of elasticity was approximately 220 MPa for the Rwc of 1.00, but only approximately 120 MPa for the Rwc of 0.50. It was reported that the elasticity modulus value of foamed concrete was four times lower than the normal concrete [7]. Similar experimental results were also found by Brady et al. [45]. When the density was in the range of 500–1600 kg/m3, the elastic modulus was between 1.00 and 12 kN/m3, respectively. Different from the Rsc of 2, the elasticity modulus with the Rsc of 5 first increased as Rwc increased from 0.65 to 0.85 and then remained almost constant. However, there was no observed trend that the elastic modulus of concrete remained almost constant. It was because the sand content was not considered in previous references [46,47]. Moreover, the magnitude of the elasticity modulus with the Rsc of 5 was lower than that with the Rsc of 2. For 28 days, the maximum of elasticity modulus for the Rsc of 5 was approximately 70 MPa, which is only 33% that of the Rsc of 2.

4.2. Compressive Strength

Figure 7 shows the change of compressive strength at the ages of 3, 7 and 28 days in relation to Rwc. Similar to the changes of the elasticity modulus, the compressive strength with the Rsc of 2 increased monotonously with Rwc. Meanwhile, Van et al. [22] studied the Rsc between 0 and 2, and the compressive strength after 28 days was 0.35–1.36 MPa, which was consistent with the trend of this paper. The effects of the Rwc were also reported by Tam et al. [19] and De Rose and Morris [48]. It was due to the decrease in the number of small holes on the foam walls. The enhance effect from the foam walls was dominant. Figure 8 and Figure 9 show the microscopic images of small holes in foam concrete at the ages of 28 days with the Rsc of 2 and 5 [19]. These photos are taken by a special camera which can magnify the pore about 300 diameters. For foam concrete with Rsc of 2, when the Rwc increases from 0.50 to 1.00, the number of small holes decreases by 57.14% and the average diameter decreases by about 66.94%. For foam concrete with Rsc of 5, when the Rwc increases from 0.65 to 1.55, the number of small holes decreases by 75.00% and the average diameter decreases by about 66.06%. As Rwc increases, the number and the diameter of the small holes both decrease, irrelevant to its Rsc. It results in the better structure of the pore walls for larger Rwc and thus the larger compressive strength. However, different changes in compressive strength were observed for the Rsc of 5. As Rwc increased, the compressive strength of foam concrete with the Rsc of 5 first increased when Rwc varied from 0.65 to 0.85 and then remained almost constant when Rwc was larger than 0.85. This type of change in the compressive strength was also reported by Liu et al. [25]. It indicates that Rwc at inflection point should be chosen when the small holes on the walls of the foam has been decreased to low levels.
The compressive strength is plotted with elasticity modulus for the Rsc of 2 and 5 at all ages in Figure 10. For a fixed air volume quantity, the compressive strength increased as a power function with an increasing elasticity modulus, regardless of Rwc and Rsc. Similar results were also reported by Jones and McCarthy [7]. It indicates that the elasticity modulus just depended on the compressive strength. It also indicates that the compressive strength could be used to investigate the mechanical properties of foam concrete.

4.3. Water-to-Solid Ratio

As previously stated, the changes of the elasticity modulus and compressive strength with the change of Rws was caused by the number of small holes in foam concrete. In order to analyze the effect of the quality of foam concrete slurry on the small holes, Rws was used to consider the effect of Rsc in this study. Figure 11 shows the relationship between the compressive strength and Rws of foam concrete excluding the results when the constant compressive strength at the Rsc of 5. For each age, the compressive strength increased with Rws. The larger the Rws, the smaller the increase rate was. It was noted that the Rsc in most cases ranged from 0 to 2 according to the previous studies [19,25,26], indicating that the cement was enough. In this condition, the compressive strength mainly depended on Rws as follows:
f c = β * log ( 10 * R w s )
where fc is compressive strength and β is a constant representing the age. It should be noted that the change of compressive strength was irrelevant to the Rsc when Rws was more than about 0.11. For a fixed Rws, the compressive strength remained constant when cement was replaced by sand. It indicates that the Rsc should be designed as large as possible. The Rws was used to consider the effect of Rsc on the compressive strength of cement slurry and a mathematical formula was proposed. This provides a reference for future study of mechanical properties.

5. Conclusions

According to the measured compressive test results, the following conclusions may be drawn.
  • For the case Rsc of 2, the compressive strength increased along the Rwc direction when Rwc was in the range of 0.5–1.0. It was due to the decrease in the number of small pores on the foam wall, resulting in the enhancement of the foam walls. When Rwc was larger than 1, the slurry was too thin to hold the bubbles.
  • Compared with Rsc of 5, the slurry performed well and its compressive strength remained constant, different from the increase stage with Rwc of 0.5–1.0. It was due to the enhance effect owing to the decrease in the number of small holes that almost offset the weaken effect due to the Rwc on the strength.
  • The enhance effect due to the decrease in the number of small holes can be normalized by Rws. Except the results in the constant stage, the compressive strength increased with the increase of Rws, irrelevant to the Rsc. It indicates that the sand and cement had the same function on the decrease in the number of small holes. In order to get the same compressive strength, the cement can be replaced by the sand in the increase stage.
  • In the future, the thermal properties could be considered and suitable models could be chosen to study the effect of Rsc on the thermal properties of foam concrete. In addition, sand content maximization needs to be explored for more cost-effective concrete.

Author Contributions

Conceptualization, J.L., Y.W. and R.C.; methodology, J.L., R.C. and Y.W.; software, T.G. and R.C.; validation, T.G., R.C. and Y.W.; formal analysis, J.L., T.G., R.Chen. and Y.W.; investigation, J.L. and R.C.; resources, Y.W. and T.G.; data curation, J.L. and T.G.; writing—original draft preparation, J.L., T.G. and R.C.; writing—review and editing, Y.W. and R.C.; visualization, T.G.; supervision, Y.W.; project administration, J.L.; funding acquisition, J.L. All authors have read and agreed to the published version of the manuscript.

Funding

This research was funded by the National Natural Science Foundation of China, grant number No. 51608152, and the Fundamental Research Funds for the Central University (B210202034, B200204036 and B200204032).

Institutional Review Board Statement

Not applicable.

Informed Consent Statement

Not applicable.

Data Availability Statement

The data presented in this study are available in article.

Acknowledgments

The authors would like to acknowledge the financial support from a research grant (No. 51608152) provided by the National Natural Science Foundation of China and the Fundamental Research Funds for the Central University (B210202034, B200204036 and B200204032).

Conflicts of Interest

The authors declare no conflict of interest.

References

  1. Ramamurthy, K.; Nambiar, E.K.K.; Ranjani, G.I.S. A classification of studies on properties of foam concrete. Cem. Concr. Compos. 2009, 31, 388–396. [Google Scholar] [CrossRef]
  2. Amran, Y.H.M.; Farzadnia, N.; Ali, A.A.A. Properties and applications of foamed concrete; a review. Constr. Build. Mater. 2015, 101, 990–1005. [Google Scholar] [CrossRef]
  3. Wei, S.; Huang, Z.X.; Zu, X.D.; Qiangqiang, X.; Xin, J. Influence mechanism of foamed concrete coating thickness on the blast resistance of RC walls. Materials 2022, 15, 5473. [Google Scholar] [CrossRef]
  4. Gencel, O.; Nodehi, M.; Ustaoğlu, A.; Sarı, A.; Kaplan, G.; Bayraktar, Q.; Sutcu, M.; Ozbakkaloglu, T. Foam concrete produced with recycled concrete powder and phase change materials. Sustainability 2022, 14, 7458. [Google Scholar] [CrossRef]
  5. Ailar, H.; Tuan, N.; Priyan, M. Enhancing the strength of pre-made foams for foam concrete applications. Cem. Concr. Compos. 2018, 87, 164–171. [Google Scholar] [CrossRef]
  6. Liu, J.; Ren, Y.; Chen, R.; Wu, Y.; Lei, W. The effect of pore structure on impact behavior of concrete hollow brick, autoclaved aerated concrete and foamed concrete. Materials 2022, 15, 4075. [Google Scholar] [CrossRef] [PubMed]
  7. Jones, M.R.; Mccarthy, A. Preliminary views on the potential of foamed concrete as a structural material. Mag. Concr. Res. 2005, 57, 21–31. [Google Scholar] [CrossRef]
  8. Gołaszewski, J.; Klemczak, B.; Smolana, A.; Gołaszewska, M.; Cygan, G.; Mankel, C.; Peralta, I.; Röser, F.; Koenders, E. Effect of foaming agent, binder and density on the compressive strength and thermal conductivity of ultra-light foam concrete. Buildings 2022, 12, 1176. [Google Scholar] [CrossRef]
  9. Sach, J.; Seifert, H. Foamed concrete technology: Possibilities for thermal insulation at high temperatures. Ceram. Forum Int. 1999, 76, 23–30. [Google Scholar]
  10. Valore, R.C. Cellular concrete part 1 composition and methods of production. ACI J. Proc. 1954, 50, 773–796. [Google Scholar]
  11. Kearsley, E.P. The use of foamed concrete for affordable development in third world countries. Concr. Serv. Mank. Appropr. Concr. Technol. 2006, 3, 232. [Google Scholar]
  12. Jones, M.R.; McCarthy, A. Behaviour and Assessment of Foamed Concrete for Construction Applications; Thomas Telford: London, UK, 2005. [Google Scholar]
  13. Sokołowska, J.J. Long-Term compressive strength of polymer concrete-like composites with various fillers. Materials 2020, 13, 1207. [Google Scholar] [CrossRef] [Green Version]
  14. Kearsley, E.P.; Wainwright, P.J. Porosity and permeability of foamed concrete. Cem. Concr. Res. 2001, 31, 805–812. [Google Scholar] [CrossRef]
  15. Babu, D.S.; Tamilselvan, T.; Lim, H.; Wee, T. Air-void system of foamed concrete and its effect on mechanical properties. ACI Mater. J. 2006, 103, 45–52. [Google Scholar] [CrossRef]
  16. Hoff, G.C. Porosity-strength considerations for cellular concrete. Cem. Concr. Res. 1972, 2, 91–100. [Google Scholar] [CrossRef] [Green Version]
  17. Kearsley, E.P.; Wainwright, P.J. The effect of porosity on the strength of foamed concrete. Cem. Concr. Res. 2002, 32, 233–239. [Google Scholar] [CrossRef]
  18. Narayanan, N.; Ramamurthy, K. Prediction relations based on gel-pore parameters for the compressive strength of aerated concrete. Concr. Sci. Eng. 2000, 1, 206–212. [Google Scholar]
  19. Tam, C.T.; Lim, T.Y.; Lee, S.L. Relationship between strength and volumetric composition of moist-cured cellular concrete. Mag. Concr. Res. 1987, 39, 12–18. [Google Scholar] [CrossRef]
  20. Neville, A.M. Properties of Concrete. In The English Language Book Society, 3rd ed.; Pitman Publishing Limited: London, UK, 1981. [Google Scholar]
  21. Sánchez-Mendieta, C.; Galán, J.J.; Martinez-Lage, I. Physical and hydraulic properties of porous concrete. Sustainability 2021, 13, 910562. [Google Scholar] [CrossRef]
  22. Van Kim, D.V.; Xuan, N.; Tho, V.D.; Bulgakov, B.I.; Alexandrova, O.V. Modelling of the effect of the water-cement ratios on properties foam concrete. J. Phys. 2019, 1425, 012189. [Google Scholar] [CrossRef] [Green Version]
  23. Ning, W.; Chang, L.; Jie, W. Influence of water-grey ratio on pressure strength and permeability of borehole-support foam concrete. Coal Sci. Technol. Mag. 2020, 41, 18–21. [Google Scholar] [CrossRef]
  24. Jones, M.R.; Mccarthy, A. Heat of hydration in foamed concrete: Effect of mix constituents and plastic density. Cem. Concr. Res. 2006, 36, 1032–1041. [Google Scholar] [CrossRef]
  25. Liu, Z.; Zhao, K.; Hu, C.; Tang, Y. Effect of water-cement ratio on pore structure and strength of foam concrete. Adv. Mater. Sci. Eng. 2016, 11, 9520294. [Google Scholar] [CrossRef] [Green Version]
  26. Qian, Z.; Li, L.; Gao, Z.; Hu, F. Research on the effect of different superplasticizers on the properties of foam concrete. Coal Ash 2014, 6, 44–46. (In Chinese) [Google Scholar]
  27. Chung, S.Y.; Lehmann, C.; Elrahman, M.A.; Stephan, D. Pore characteristics and their effects on the material properties of foamed concrete evaluated using micro-CT images and numerical approaches. Appl. Sci. 2017, 7, 550. [Google Scholar] [CrossRef]
  28. Guo, Z. Study on the influence of sand-to-cement ratio and particle size on the characteristics of cement mortar. Constr. Technol. 2020, 49, 103–106. [Google Scholar] [CrossRef]
  29. Jia, H.; Guhua, L. The influence of sand ratio on concrete performance in the case of fixed powder paste. In Proceedings of the International Conference on Civil Engineering, Architecture and Building Materials, Haikou, China, 24–25 May 2014. [Google Scholar]
  30. Othman, R.; Jaya, R.P.; Muthusamy, K.; Sulaiman, M.; Duraisamy, Y.; Abdullah, M.; Przybył, A.; Sochacki, W.; Skrzypczak, T.; Vizureanu, P.; et al. Relation between density and compressive strength of foamed concrete. Materials 2021, 11, 2967. [Google Scholar] [CrossRef]
  31. Hamidah, M.S.; Azmi, I.; Ruslan, M.R.A.; Kartini, K.; Fadhil, N.M. Optimization of foamed concrete mix of different sand-cement ratio and curing conditions. Use of Foamed Concrete in Construction. Dundee(GB) 2005, 37–44. [Google Scholar]
  32. Wong, H.H.C.; Kwan, A.K.H. Rheology of cement paste: Role of excess water to solid surface area ratio. J. Mater. Civ. Eng. 2008, 20, 189–197. [Google Scholar] [CrossRef]
  33. Industry Standard CN-CJ; CJJ T 177-2012 Technical Regulations for Filling Engineering of Bubble Mixed Lightweight Soil. Urban Construction: Shanghai, China, 2012.
  34. Huang, L. 28-day report of Conch Cement quality inspection report. EB/OL 2016, 13, 8. [Google Scholar]
  35. ASTM Standard C 188-17; ASTM Standard Test Method for Density of Hydraulic Cement. ASTM International: West Conshohocken, PA, USA, 2017.
  36. D 422-63; ASTM Standard Test Methods for Particle-Size Analysis of Soils. ASTM International: West Conshohocken, PA, USA, 2007.
  37. ASTM Standard C 128-15; ASTM Standard Test Method for Relative Density (Specific Gravity) and Absorption of Fine Aggregate. ASTM International: West Conshohocken, PA, USA, 2015.
  38. ASTM Standard D 2487-11; ASTM Standard Practice for Classification of Soils for Engineering Purposes (Unified Classification System). ASTM International: West Conshohocken, PA, USA, 2012.
  39. ACI 523; Guide for Cast-in-Place Low-Density Cellular Concrete. ACI (American Concrete Institute): Farmington Hills, MI, USA, 2006.
  40. ACI 523; Guide for Cellular Concrete above 50 lb/ft3 (800 kg/m3). ACI (American Concrete Institute): Farmington Hills, MI, USA, 2014.
  41. Kearsley, E.P.; Wainwright, P.J. The effect of high fly ash content on the compressive strength of foamed concrete. Cem. Concr. Res. 2001, 31, 105–112. [Google Scholar] [CrossRef]
  42. Gencel, O.; Bilir, T.; Bademler, Z.; Ozbakkaloglu, T. A detailed review on foam concrete composites: Ingredients, properties, and microstructure. Appl. Sci. 2022, 12, 5752. [Google Scholar] [CrossRef]
  43. Shao, C.J.; Xu, Y.F.; Chen, B.; Ding, P.F. Experimental study of strength characteristics of foam concrete. Sci. Technol. Eng. 2016, 16, 270–274. [Google Scholar]
  44. Nicolo, B.D.; Pani, L.; Pozzo, E. Strain of concrete at peak compressive stress for a wide range of compressive strengths. Mater. Struct. 1994, 27, 206–210. [Google Scholar] [CrossRef]
  45. Brady, K.C.; Jones, M.R.; Watts, G.R. Specfication for foamed concrete. In Application Guide AG39; TRL Limited: Crowthorne, UK, 2001. [Google Scholar]
  46. Zhou, Z.; Hu, J.F.; Li, F.; Zhang, J.J.; Lei, M.F. Elastic modulus prediction model of foamed concrete based on the walsh formula. Appl. Sci. 2022, 12, 5142. [Google Scholar] [CrossRef]
  47. Tan, X.J.; Chen, W.Z.; Yang, D.S.; Liu, H.Y.; Chan, A.H.C. Experimental and theoretical studies on effect of height-to-diameter ratios on failure forms and mechanical characteristics of foamed concrete. J. Mater. Civ. Eng. 2019, 31, 04018341. [Google Scholar] [CrossRef]
  48. De Rose, L.; Morris, J. The influence of mix design on the properties of microcellular concrete. In Specialist Techniques and Materials for Construction; Dhir, R.K., Handerson, N.A., Eds.; Thomas Telford: London, UK, 1999; pp. 185–197. [Google Scholar]
Figure 1. Particle size distribution of sand used in foam concrete.
Buildings 12 01969 g001
Figure 2. The work process of preparing foam concrete.
Buildings 12 01969 g002
Figure 3. Sample after compressive test (dimension 100 mm × 100 mm).
Buildings 12 01969 g003
Figure 4. Stress-strain curves of foam concrete at the ages of (a) 3, (b) 7 and (c) 28 days with the Rsc of 2 at various Rwc.
Buildings 12 01969 g004aBuildings 12 01969 g004b
Figure 5. Stress-strain curves of foam concrete at the ages of (a) 3, (b) 7 and (c) 28 days with the Rsc of 5 at various Rwc.
Buildings 12 01969 g005
Figure 6. Relationship between modulus of elasticity and water-to-cement ratio (Rwc).
Buildings 12 01969 g006
Figure 7. Development of compressive strength based on different sand-to-cement ratio (Rsc).
Buildings 12 01969 g007
Figure 8. Microscopic images of small holes at the ages of 28 days with the sand-to-cement ratio (Rsc) of 2 at the water-to-cement ratio (Rwc) of (a) 0.50, (b) 0.65 and (c) 1.00.
Buildings 12 01969 g008
Figure 9. Microscopic images of small holes at the ages of 28 days with the sand-to-cement ratio (Rsc) of 5 at the water-to-cement ratio (Rwc) of (a) 0.65, (b) 0.85 and (c) 1.55.
Buildings 12 01969 g009
Figure 10. Relationship between compressive strength and modulus of elasticity.
Buildings 12 01969 g010
Figure 11. Relationship between compressive strength and water-to-solid ratio (Rws).
Buildings 12 01969 g011
Table 1. Composition of foam concrete mixtures.
Test IDAir Volume Quantities (m3/m3)Wet Density
(kg/m3)
Water-to-Cement Ratio (Rwc)Water-to-Solid Ratio (Rws)
S2-0.50.4211800.500.17
S2-0.6511960.650.22
S2-0.812440.800.27
S2-1.012361.000.33
S5-0.6510020.650.11
S5-0.759750.750.13
S5-0.8510010.850.14
S5-1.010131.000.17
S5-1.5510451.550.26
Table 2. Main chemical composition and physical properties of cement.
CompositionContent (%)Physical Properties
SiO220.4MaterialP.O 42.5
Al2O34.4Blaine fineness (m2/kg)338
Fe2O32.2SoundnessQualified
CaO64.9Initial setting time (min)90
MgO1.3Final setting time (min)250
SO32.03 d compressive strength (MPa)27.4
Na2O0.128 d compressive strength (MPa)45.0
K2O0.3
Loss of ignition4.4
Publisher’s Note: MDPI stays neutral with regard to jurisdictional claims in published maps and institutional affiliations.

