Article

Experimental Study on the Overall Stability of Corroded H-Shaped Steel Beams

Department of Civil Engineering, College of Civil Engineering and Architecture, Hainan University, Haikou 570228, China
*
Author to whom correspondence should be addressed.
Buildings 2022, 12(11), 1923; https://doi.org/10.3390/buildings12111923
Submission received: 7 September 2022 / Revised: 18 October 2022 / Accepted: 1 November 2022 / Published: 8 November 2022
(This article belongs to the Special Issue Advances in Steel Structures: Testing, Modelling and Design)

Abstract

:
The degradation of the overall stability of corroded rolled H-shaped steel beams under bending conditions has not been extensively studied. In the present study, monotonic tensile tests and overall stability tests were conducted on seven rolled H-shaped steel beams that were subjected to electrochemical corrosion in order to discuss the influence of corrosion on the material’s mechanical properties and the overall stability of steel beams under bending conditions. The test results have indicated that the strength, the elastic modulus, and the elongation of the steel declined with an increase in the corrosion rate of the steel beams, and an obvious plastic deterioration phenomenon was observed. In addition, all of the steel beams with different degrees of corrosion were subjected to overall flexural–torsional buckling failure. The stiffness and the overall stability ultimate bearing capacity of the corroded steel beams decreased with the increase in the corrosion rate, and the overall stability of the test beams with a high design corrosion rate degraded significantly. Furthermore, by using the finite element numerical simulation analysis software ABAQUS, a double-reduction corrosion model of the sectional dimensions and the material’s mechanical properties was established. The overall stability ultimate bearing capacities of the steel beams that were subjected to three-point bending and the corresponding load–lateral displacement curves were analyzed. In addition, the finite element numerical simulation results were compared with the test results for verification. Subsequently, the influence of the initial bending on the overall stability ultimate bearing capacity of the steel beams was analyzed by virtue of the verified finite element model. This study will provide a test basis for the evaluation of the bearing capacity of existing rolled H-shaped steel members, as well as an experimental basis and finite element model reference for the follow-up study on the degradation of the mechanical properties of the corroded rolled steel members.

1. Introduction

Steel buildings have advanced rapidly in recent years, owing to resource recycling, a high degree of industrialization, a short construction period, and good seismic performance [1]. However, steel beams are the main load-bearing components of steel structures, as well as a major contributor to the stability of steel structures, and the overall instability of steel beams that is caused by plane bending is one of the common instabilities of steel structures [2]. Engineering accidents that are caused by instabilities still occur and, therefore, researchers worldwide have conducted numerous relevant studies on the stability of steel beams. Hradil et al. [3] used thin-walled ferritic stainless steel members as the research object and proposed an overall stability calculation model considering material nonlinearity. Fortan et al. [4] studied the torsional buckling behavior of 13 welded stainless steel I-beams by four-point bending tests. Ranjithkumar et al. [5] studied the lateral–torsional buckling behavior of steel beams that were reinforced with steel plates by finite element analysis software. Gang et al. [6,7,8] conducted stability tests and numerical simulations in order to systematically study the overall flexural–torsional buckling behavior of H-shaped steel beams that were welded using Q460GJ and Q690 plates. Additionally, the authors compared the tests and the numerical results with existing codes of various countries in order to validate the applicability of these codes. Lee et al. [9] studied the influence of the slenderness ratio of the flange of high-strength I-beams on their flexural–torsional buckling behavior. In the previous studies, most of the scholars adopted uncorroded steel beams as the research objects for their overall stability. Therefore, the overall stability of corroded steel beams needs to be further studied.
Owing to stress, the working environment, and other factors, steel members are corroded over time, which results in mass loss, a reduction in the sectional area, a deterioration of the mechanical properties of the steel, a deterioration in the bearing capacity of the members, and a reduction in the overall safety of steel buildings [10,11,12,13,14,15,16]. Scholars have progressed in the study of the degradation of the mechanical properties of corroded bending members. Wu et al. [17] studied the effect of local corrosion on the bearing capacity of I-shaped steel beams that were reinforced at the end by conducting a bearing test. Based on the bending tests of corroded beams, Sheng et al. [18] established a back-propagation neural network prediction model for determining the ultimate bearing capacity of H-shaped steel beams, owing to sulphate corrosion and load. Ahn et al. [19,20,21] conducted sheer leading tests on steel plate girders with corroded webs, discussed the influence of corrosion on the shear behavior and the shear strength of webs, and also carried out a load test on CFRP-reinforced corroded steel plate beams in order to evaluate the CFRP reinforcement method. Zhang et al. [22,23] studied the flexural buckling behavior of corroded H-shaped steel beams using a four-point bending test and proposed an equation for the bending and the buckling resistance of corroded H-shaped steel beams. Moreover, based on the research that is associated with corroded-member reinforcement, bending tests were conducted on five corroded H-shaped steel beams that were bonded with carbon-fiber-reinforced polymer plates in order to study the bending resistance of these beams. Fiolek et al. [24] studied the local buckling behavior of highly corroded hot-rolled box-section beams in bending. Liu et al. [25] analyzed the degradation of the shear capacity of I-girders with local corrosion at the end by the finite element method. Tzortzinis et al. [26,27,28,29] studied the bearing capacity of the natural corrosion beams of a decommissioned bridge. Saad-Eldeen et al. [30,31] evaluated the ultimate strength of corroded ship steel box girders based on experiments and numerical simulations. Jelovica et al. [32] conducted the ultimate flexural strength test on web sandwich beams that were corroded to different degrees in order to discuss the influence of corrosion on the ultimate strength of sandwich beams. Tohidi et al. [33] pointed out that the corrosion at the end of steel plate beams reduced the bearing capacity of the bridge and put forward a method for predicting the bearing capacity at the end of corroded steel plate beams based on the back-propagation neural network. Jagtap et al. [34] studied the feasibility of strengthening corroded steel beams with carbon-fiber-reinforced polymer via an experiment and finite element simulation analysis. Bao et al. [35] conducted an experimental study on the degradation of the web bearing capacity of corroded steel bridges.
It can be seen that, for the research of corroded bending members, most scholars tend to focus on the degradation of the in-plane bending resistance and the shear performance of members, while there are only a few studies on the degradation of the overall stability of corroded bending members. An H-shaped cross section is one of the most common section forms in steel structure engineering. Hot-rolled H-shaped steel is superior to I-shaped steel and welded H-shaped steel and has become one of the most highly consumed steel products. Therefore, the aim of the present study is to study the influence of corrosion on the overall stability of rolled H-shaped steel beams under bending conditions. In this study, seven rolled H-shaped steel beams were divided into three groups according to the designed corrosion rates for an electrochemical accelerated corrosion test. Additionally, an overall stability test was conducted on the corroded steel beams using the three-point loading method. In addition, the influence of the corrosion conditions on the overall stability ultimate bearing capacity, the deflection, and the strain of the rolled H-shaped steel beams was analyzed. Finally, a double-reduction corrosion model of the sectional dimensions and the mechanical properties of the material was proposed and validated using the test results.

2. Test Profile

2.1. Parameters of the Steel Beam Specimens

In this study, Q235 rolled H-shaped steel beams that were manufactured by the Guangxi Liuzhou Steel Group with sectional dimensions of 150 mm × 75 mm × 5 mm × 7 mm were used as specimens in order to study the degradation law of the overall stability of these corroded beams when they were subjected to a concentrated load in the mid-span. Based on the designed corrosion rate, the specimens were divided into three test groups, i.e., A0, A1, and A2, of which the designed corrosion rates were 0% (one specimen), 6% (three specimens), and 12% (three specimens), respectively. In this study, seven specimens in total were tested. The detailed specifications of the test beams are listed in Table 1.

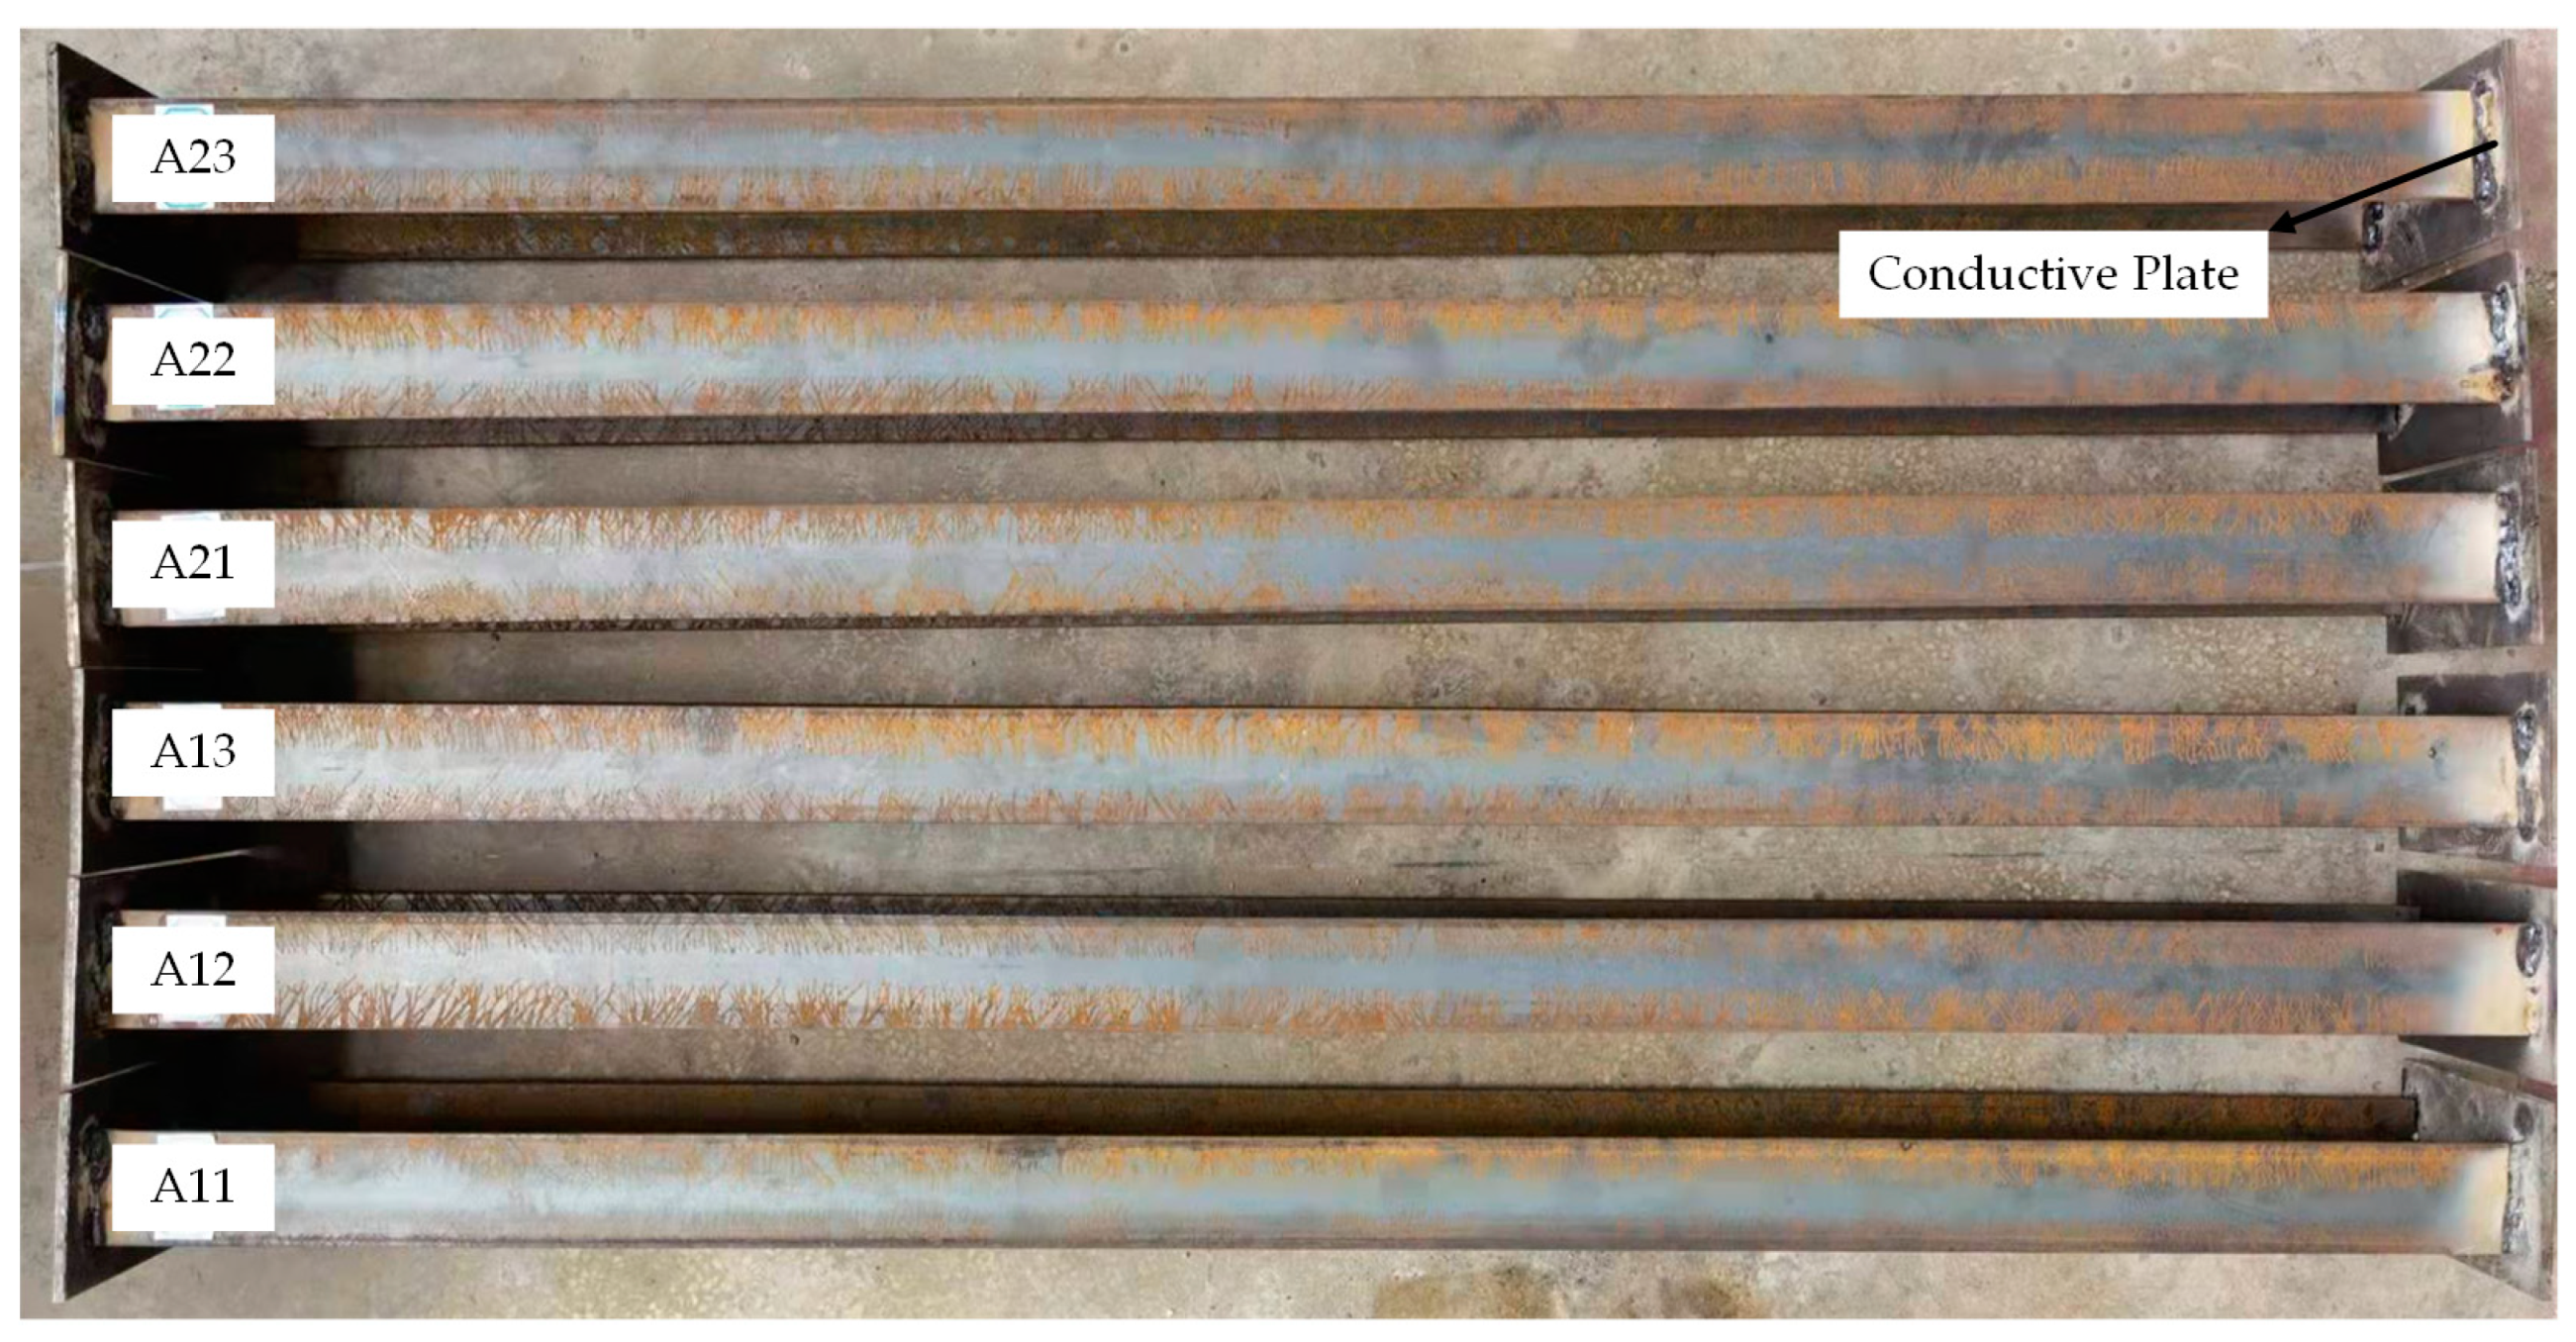
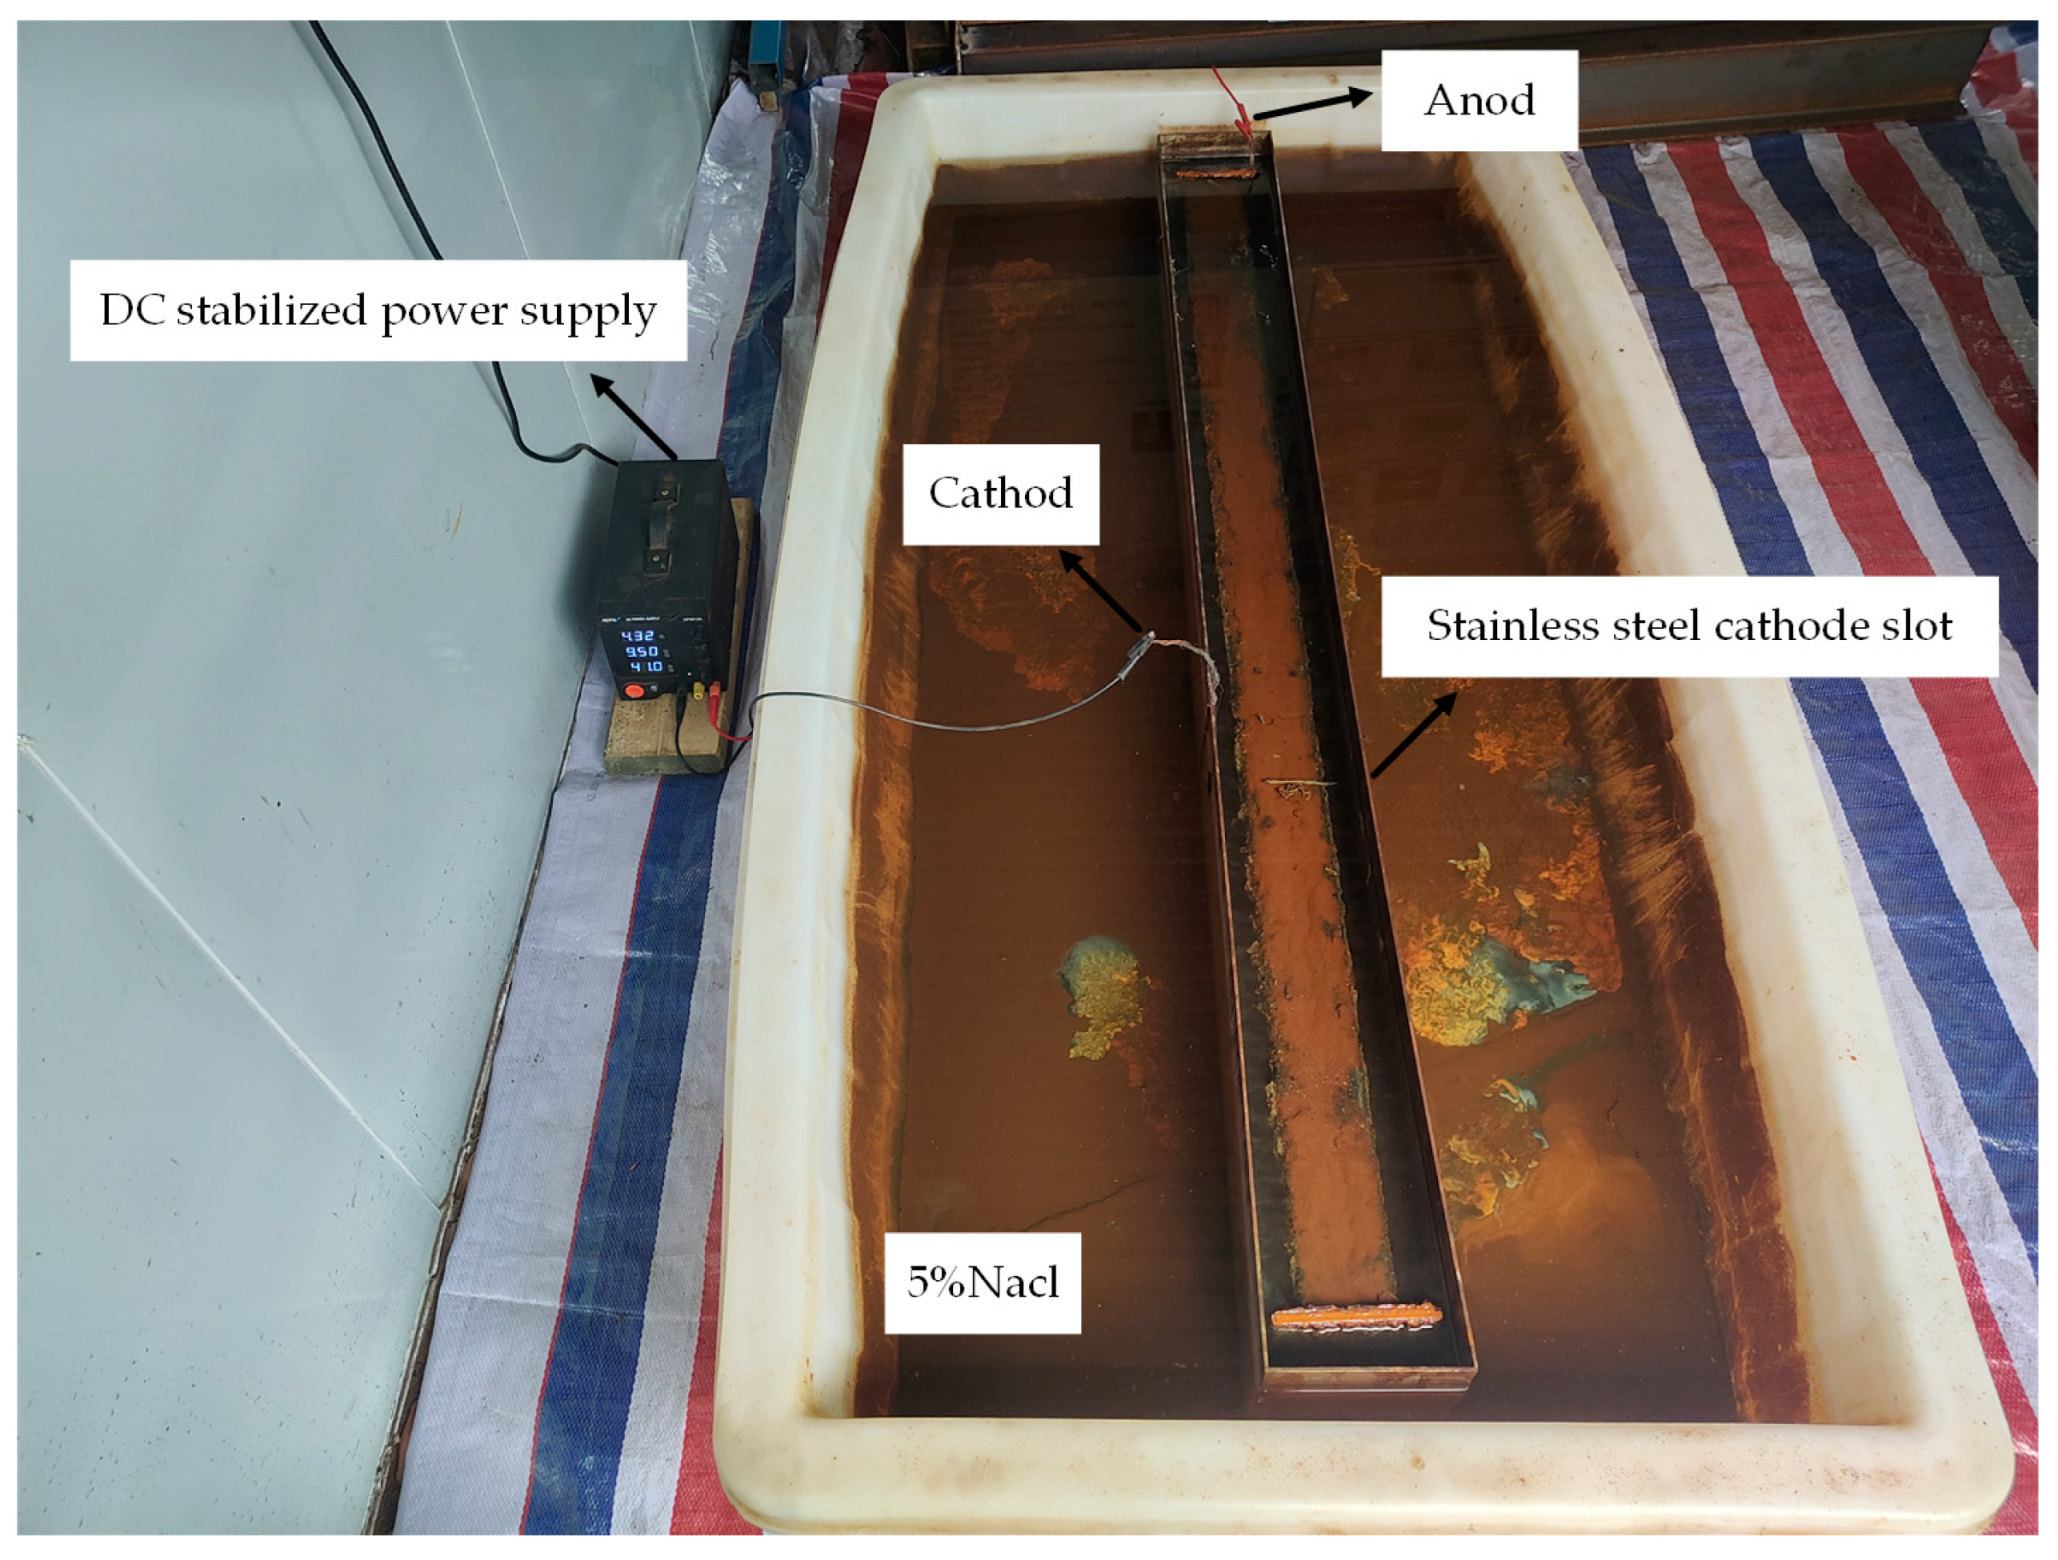
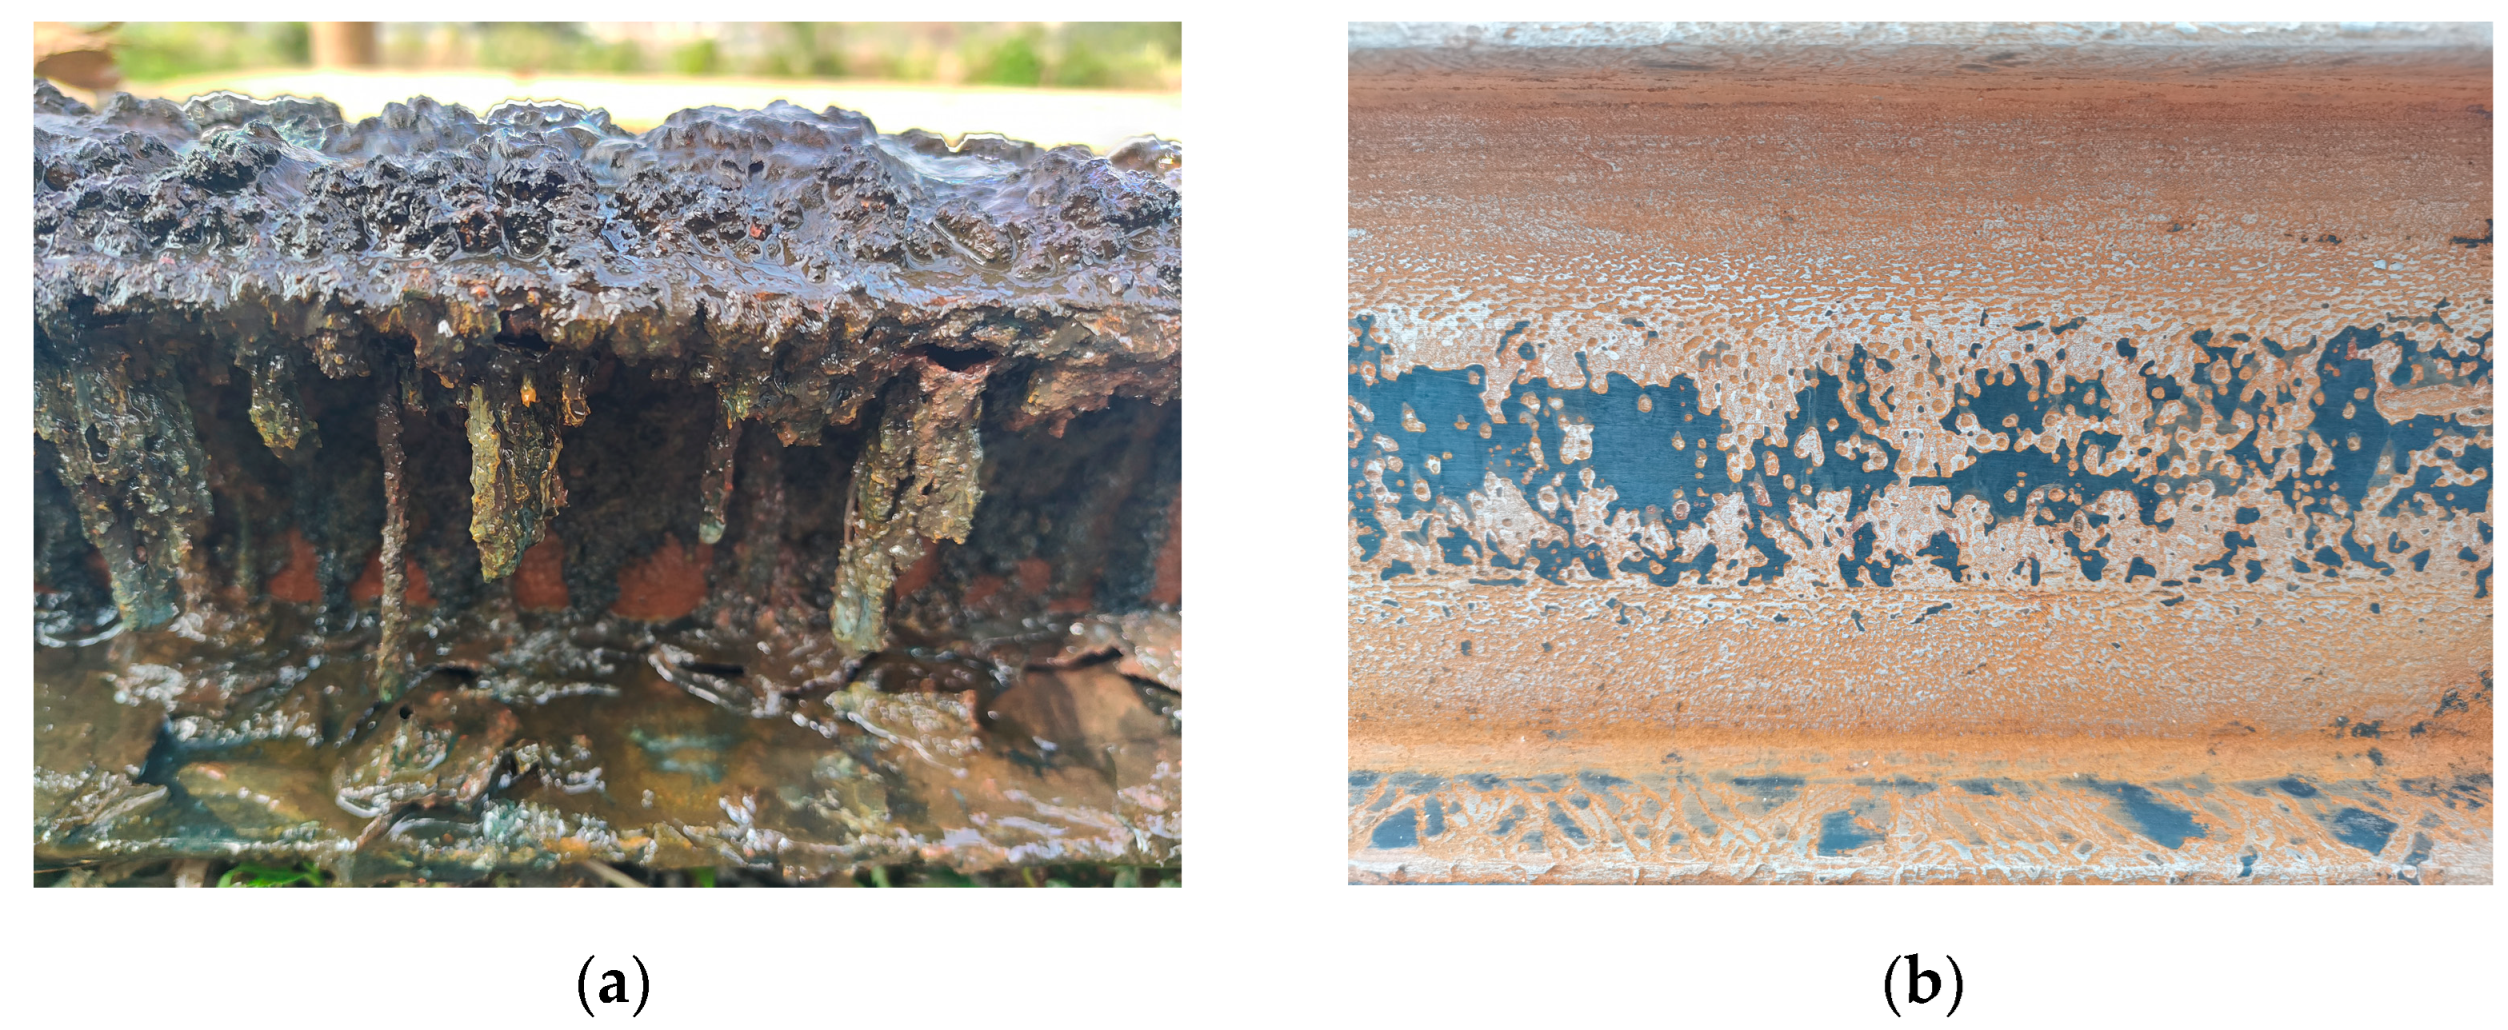
2.2. Accelerated Corrosion of the Steel Beams

According to the principle of electrochemistry, the H-shaped steel beams were electrified for the accelerated corrosion, and the corrosion rate η was introduced in order to evaluate their corrosion degree. According to Faraday’s law, the mass of the reduction products after electrolysis is directly proportional to the product of the current intensity and the electrifying time. Therefore, the theoretical accelerated corrosion time can be determined by transformation. Equation (1) expresses the corrosion rate η of the steel beams and Equation (3) is used for calculating the theoretical accelerated corrosion time.
η = Δ m / m a
Δ m = m a m b
t = Δ m F Z / ( M i )
where m a and m b are the total masses of the steel beams before and after corrosion, respectively, and Δ m is the corrosion mass of the steel beams. Additionally, i is the current intensity of the DC-stabilized power supply, M is the molar mass of the iron, and t is the electrifying time. Furthermore, F is the Faraday constant and Z is the absolute value of the valency of the ferric ions.
In the test, H-shaped steel beams were immersed in an electrified accelerated corrosion water tank with a 5% NaCl solution in order to ensure uniform corrosion. In addition, steel current conducting plates were welded at both ends of the steel beams in order to avoid the uneven corrosion of the steel beams that was caused by the bottom contact of the lower flanges and the direct connection of wires to the steel beams when they were immersed. Furthermore, these plates facilitated the direct connection of the wires to the steel beams when the beams were immersed. Moreover, enclosed rectangular slots were created according to the dimensions of the steel beams. As shown in Figure 1 and Figure 2, a MESTEK-DP3010A DC stabilized power supply that was made in China was employed to provide a constant current of 9.5 A for accelerated corrosion. The anode was connected to the steel current conducting plates and the cathode was connected to a homemade 201 stainless steel cathode slot.
Upon reaching the designed corrosion rate for electrifying corrosion, the steel beam specimens were removed, were soaked in 10% dilute hydrochloric acid, and were cleaned with a steel wire brush in order to remove rust. Subsequently, the specimens were neutralized with limewater and aired. After the conducting plates were removed, the treated steel beam specimens were weighed, and these masses were compared with the initial masses of the specimens. Finally, the actual corrosion rates of the specimens were calculated, and the results are listed in Table 2.

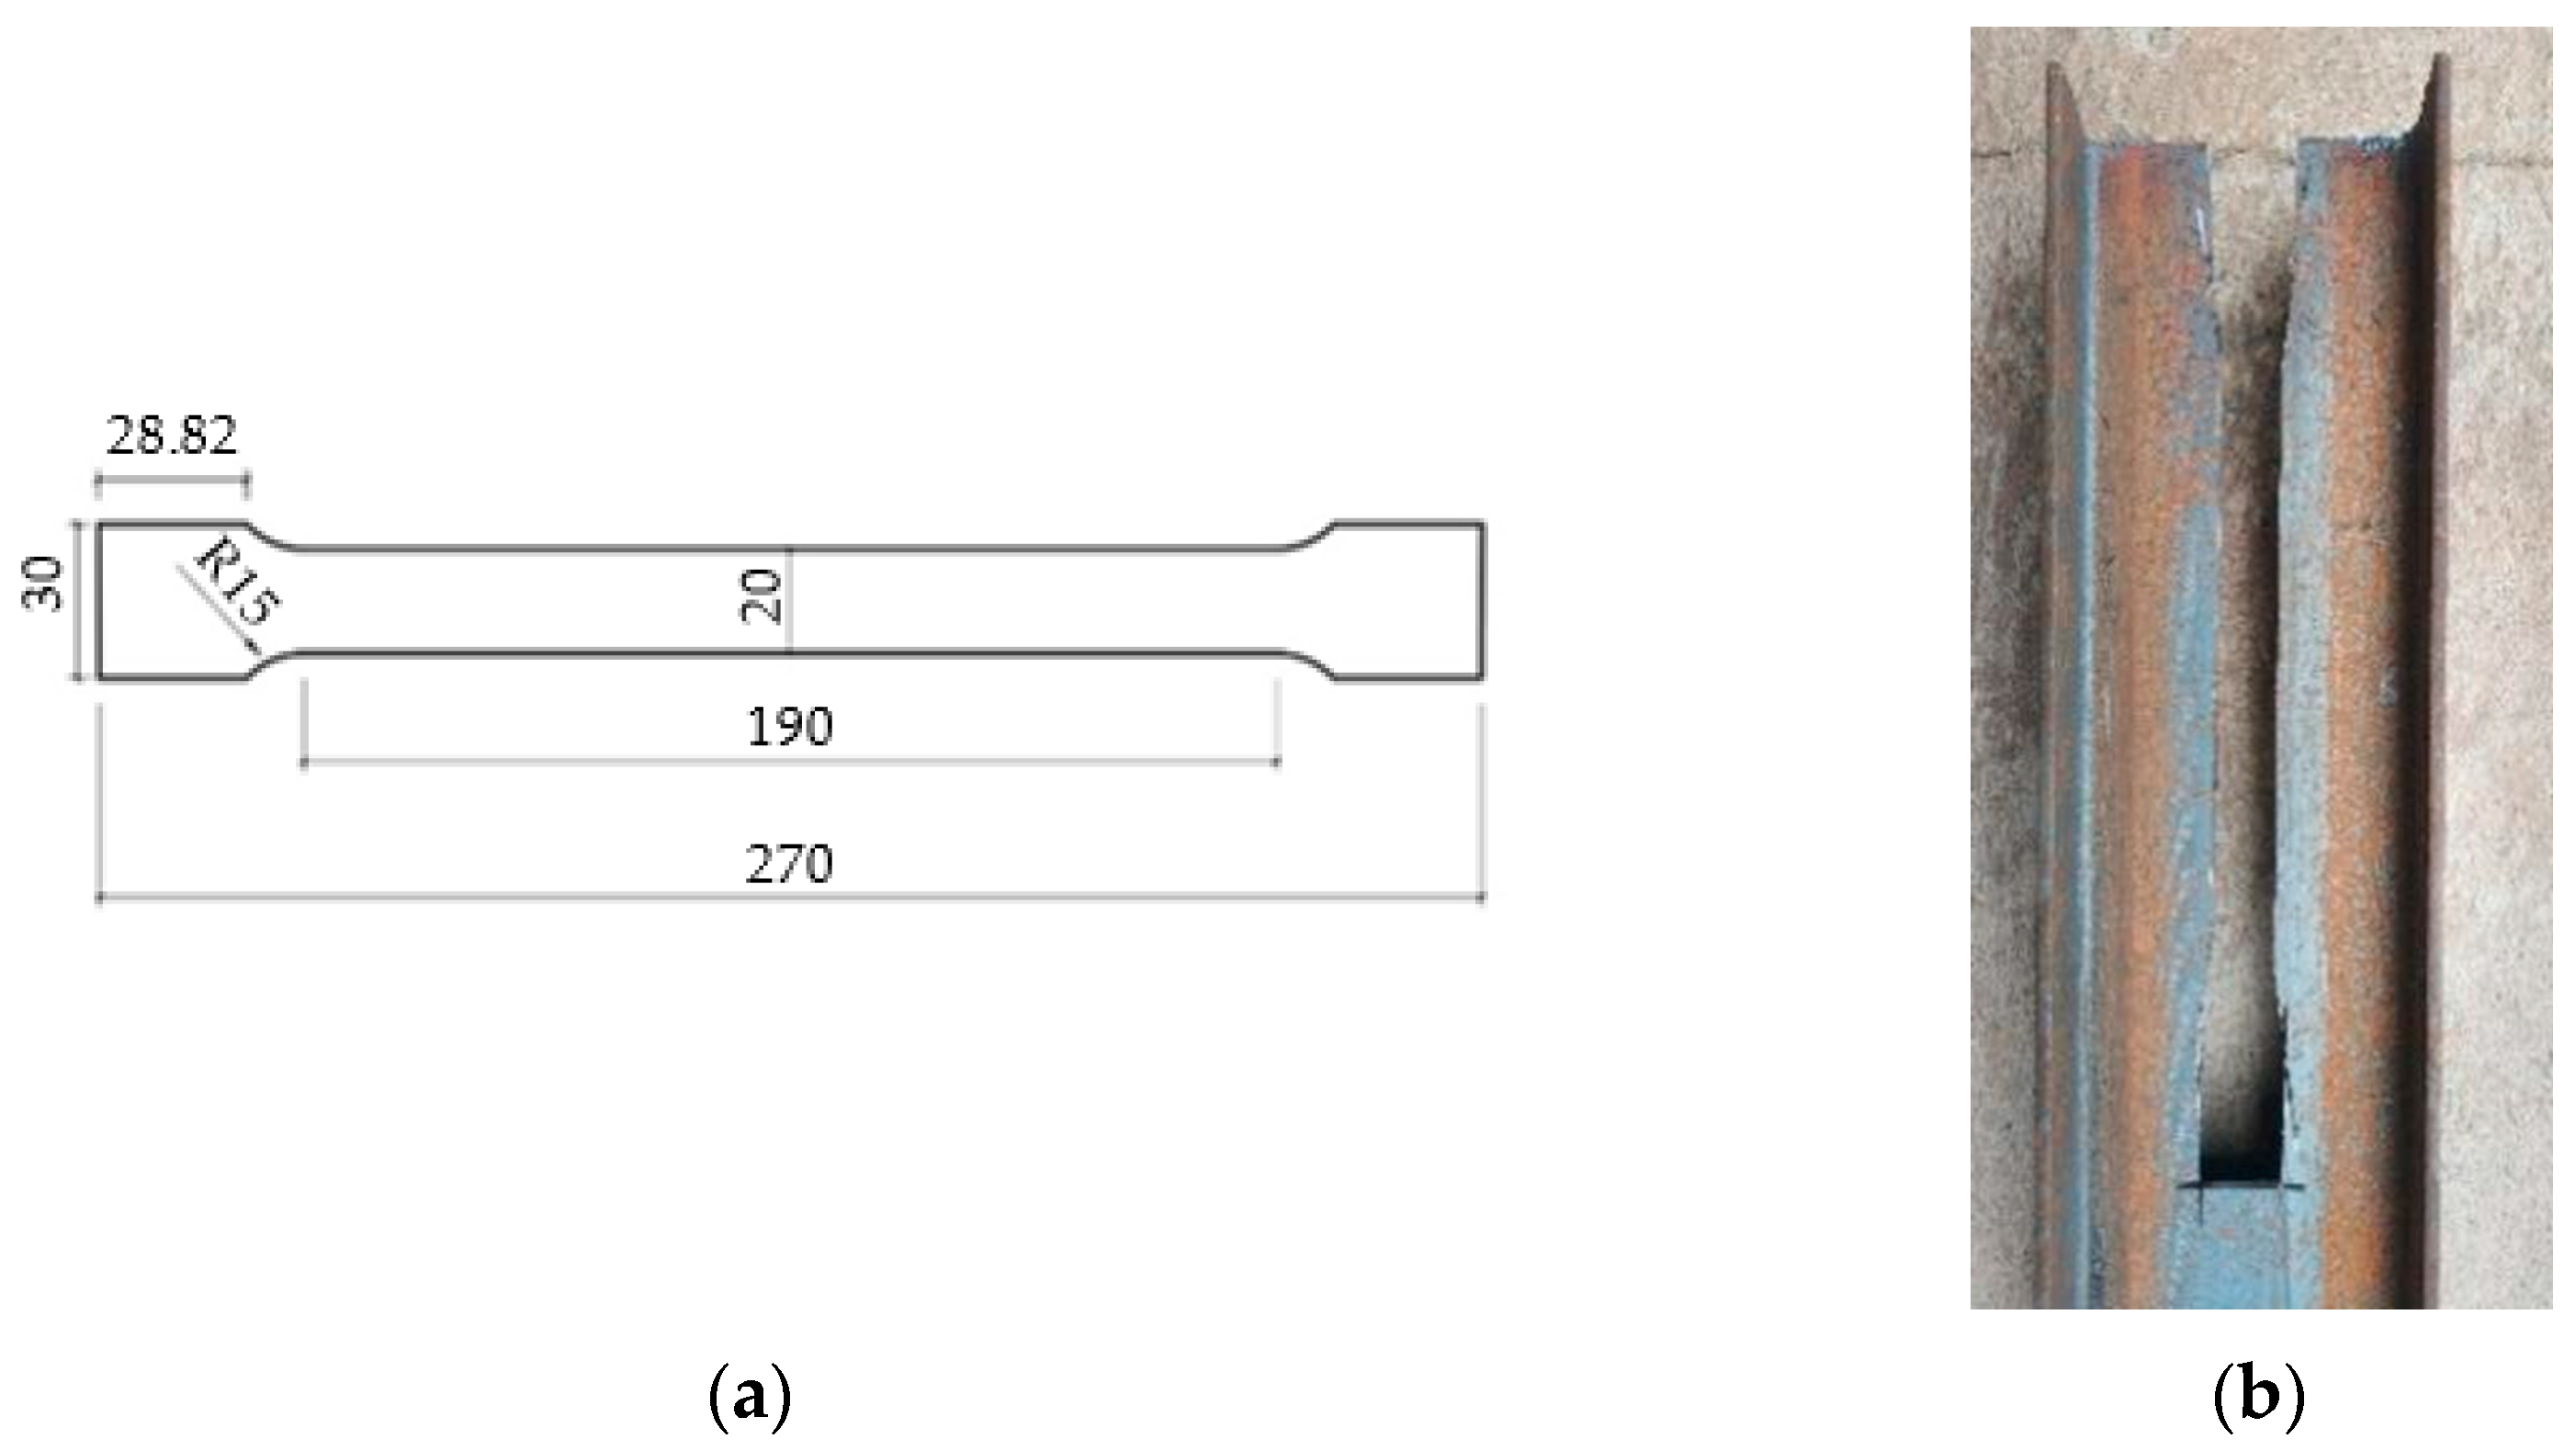
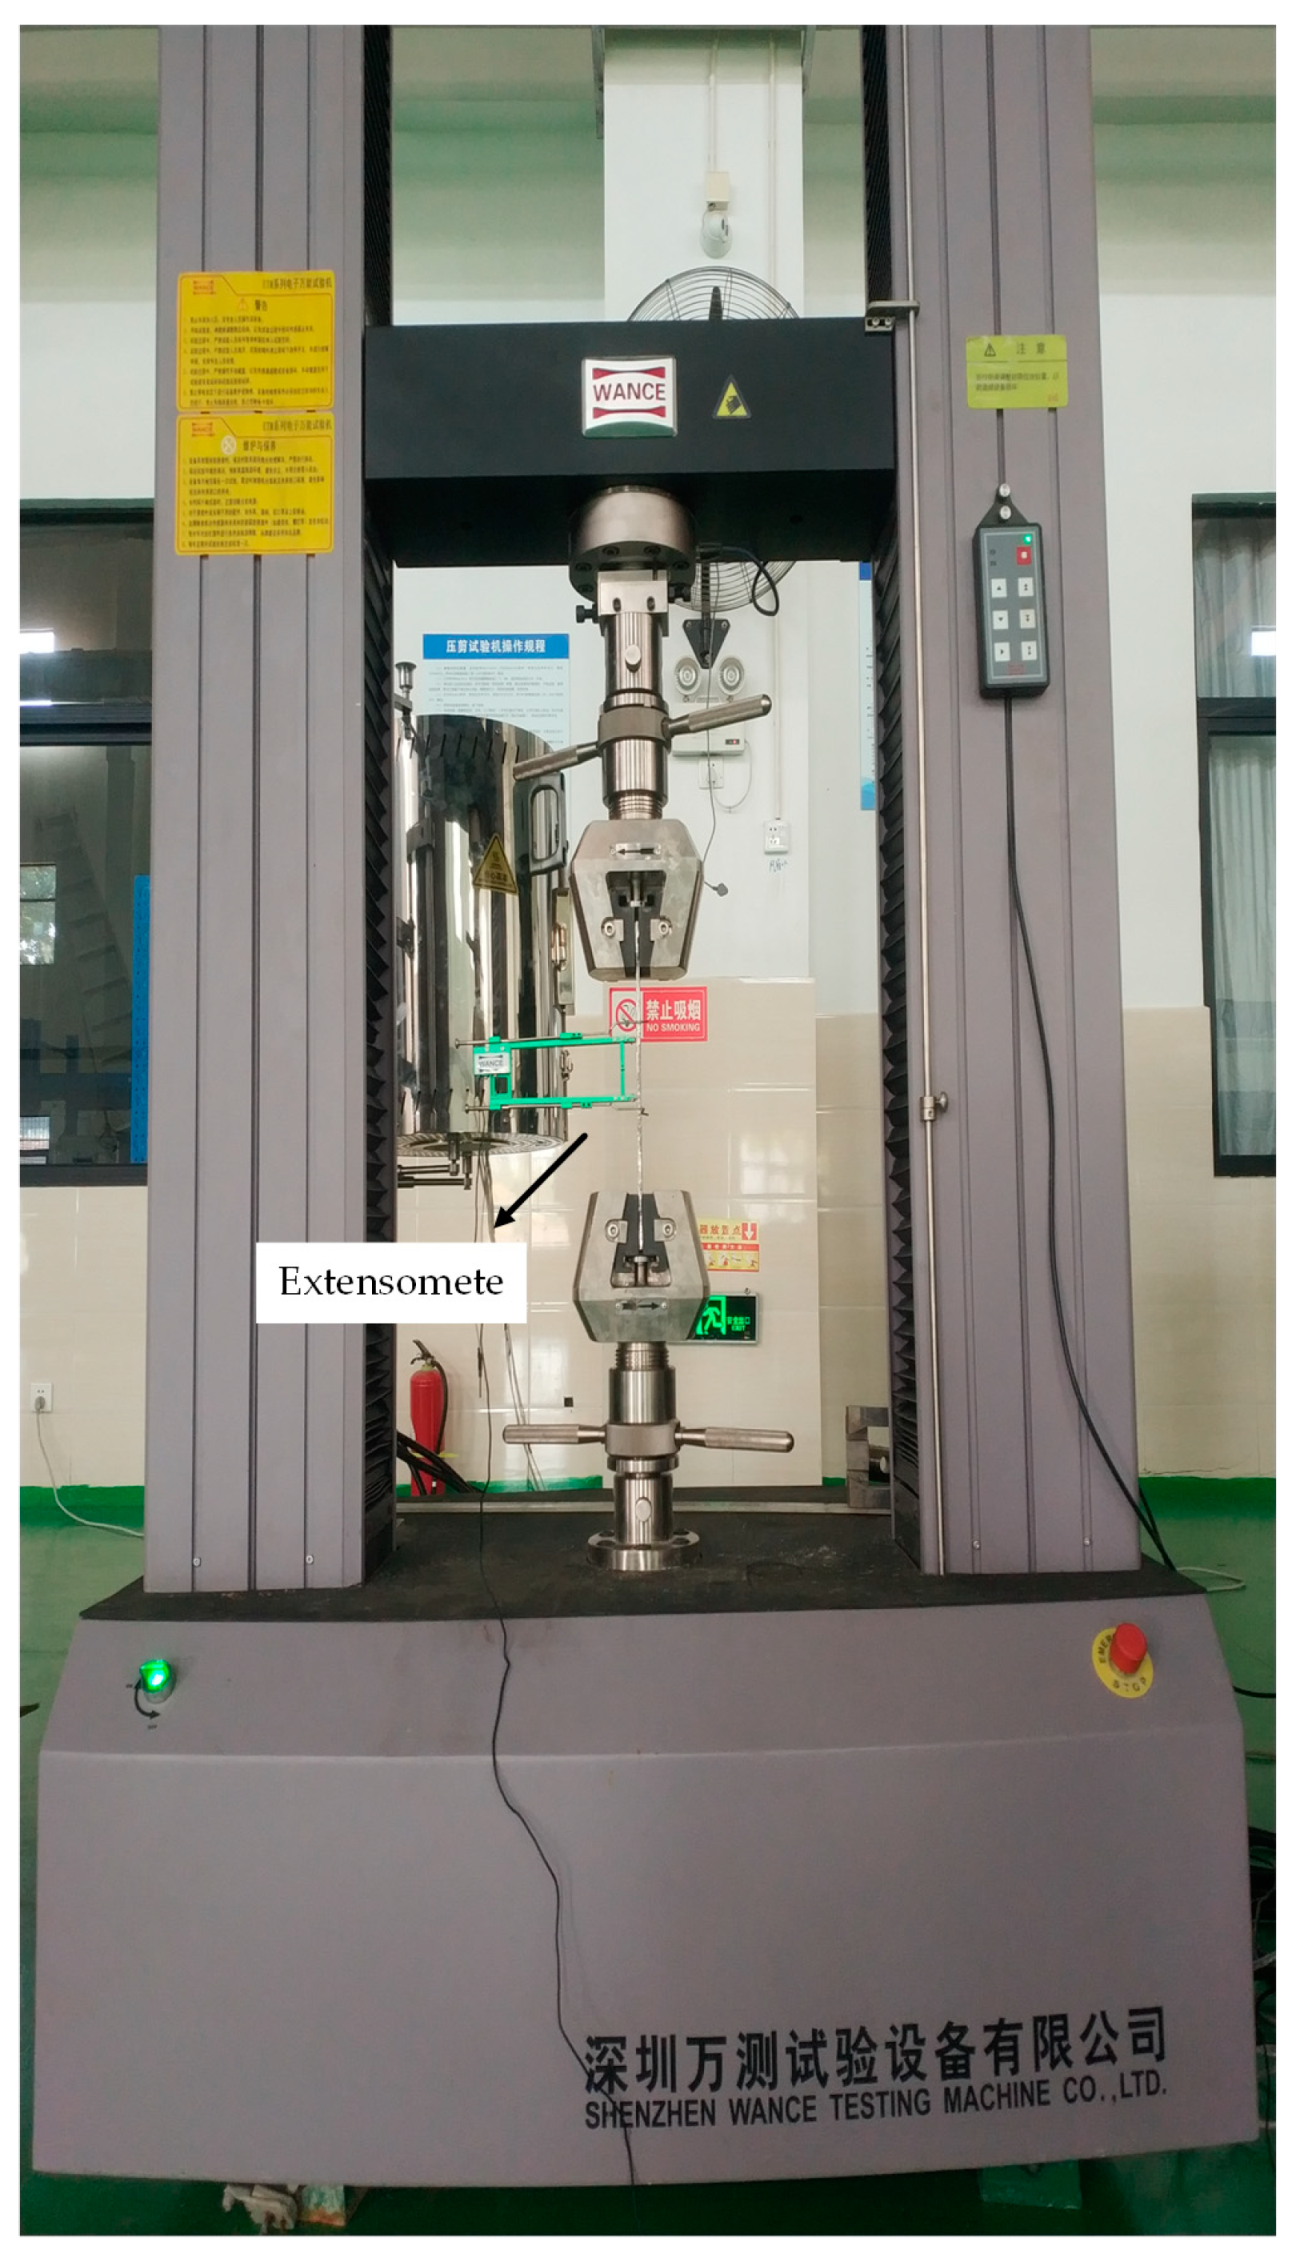
2.3. Mechanical Tests on the Corroded Steel Beams

Several irregular corrosion pits were observed on the surfaces of the steel beams after the corrosion products on these surfaces were brushed away, as shown in Figure 3. These corrosion pits resulted in mass loss and changes in the geometric dimensions of the steel beams, which further resulted in the degradation of the mechanical properties of these beams. In order to effectively study the overall stability of the corroded H-shaped steel beams, we studied the influence of the degree of corrosion of the Q235 steel beams on the degradation of the mechanical properties of the material after the accelerated corrosion test.
The Q235 tensile specimens that were cut from the steel beams after the accelerated corrosion test, as well as the cutting position and the processing size, were recorded, as shown in Figure 4. According to the relevant regulations that are presented in [36], the tensile specimens were prepared for and subjected to a static tensile test on a WANCE-ETM105D universal testing machine that was manufactured by China Wance Testing Machine Co., Ltd. (Shenzhen, China). The deformation of the tensile specimens was measured by a WANCE extensometer that was made in China, with a gauge distance of 50 mm. The tensile test results are shown in Figure 5.

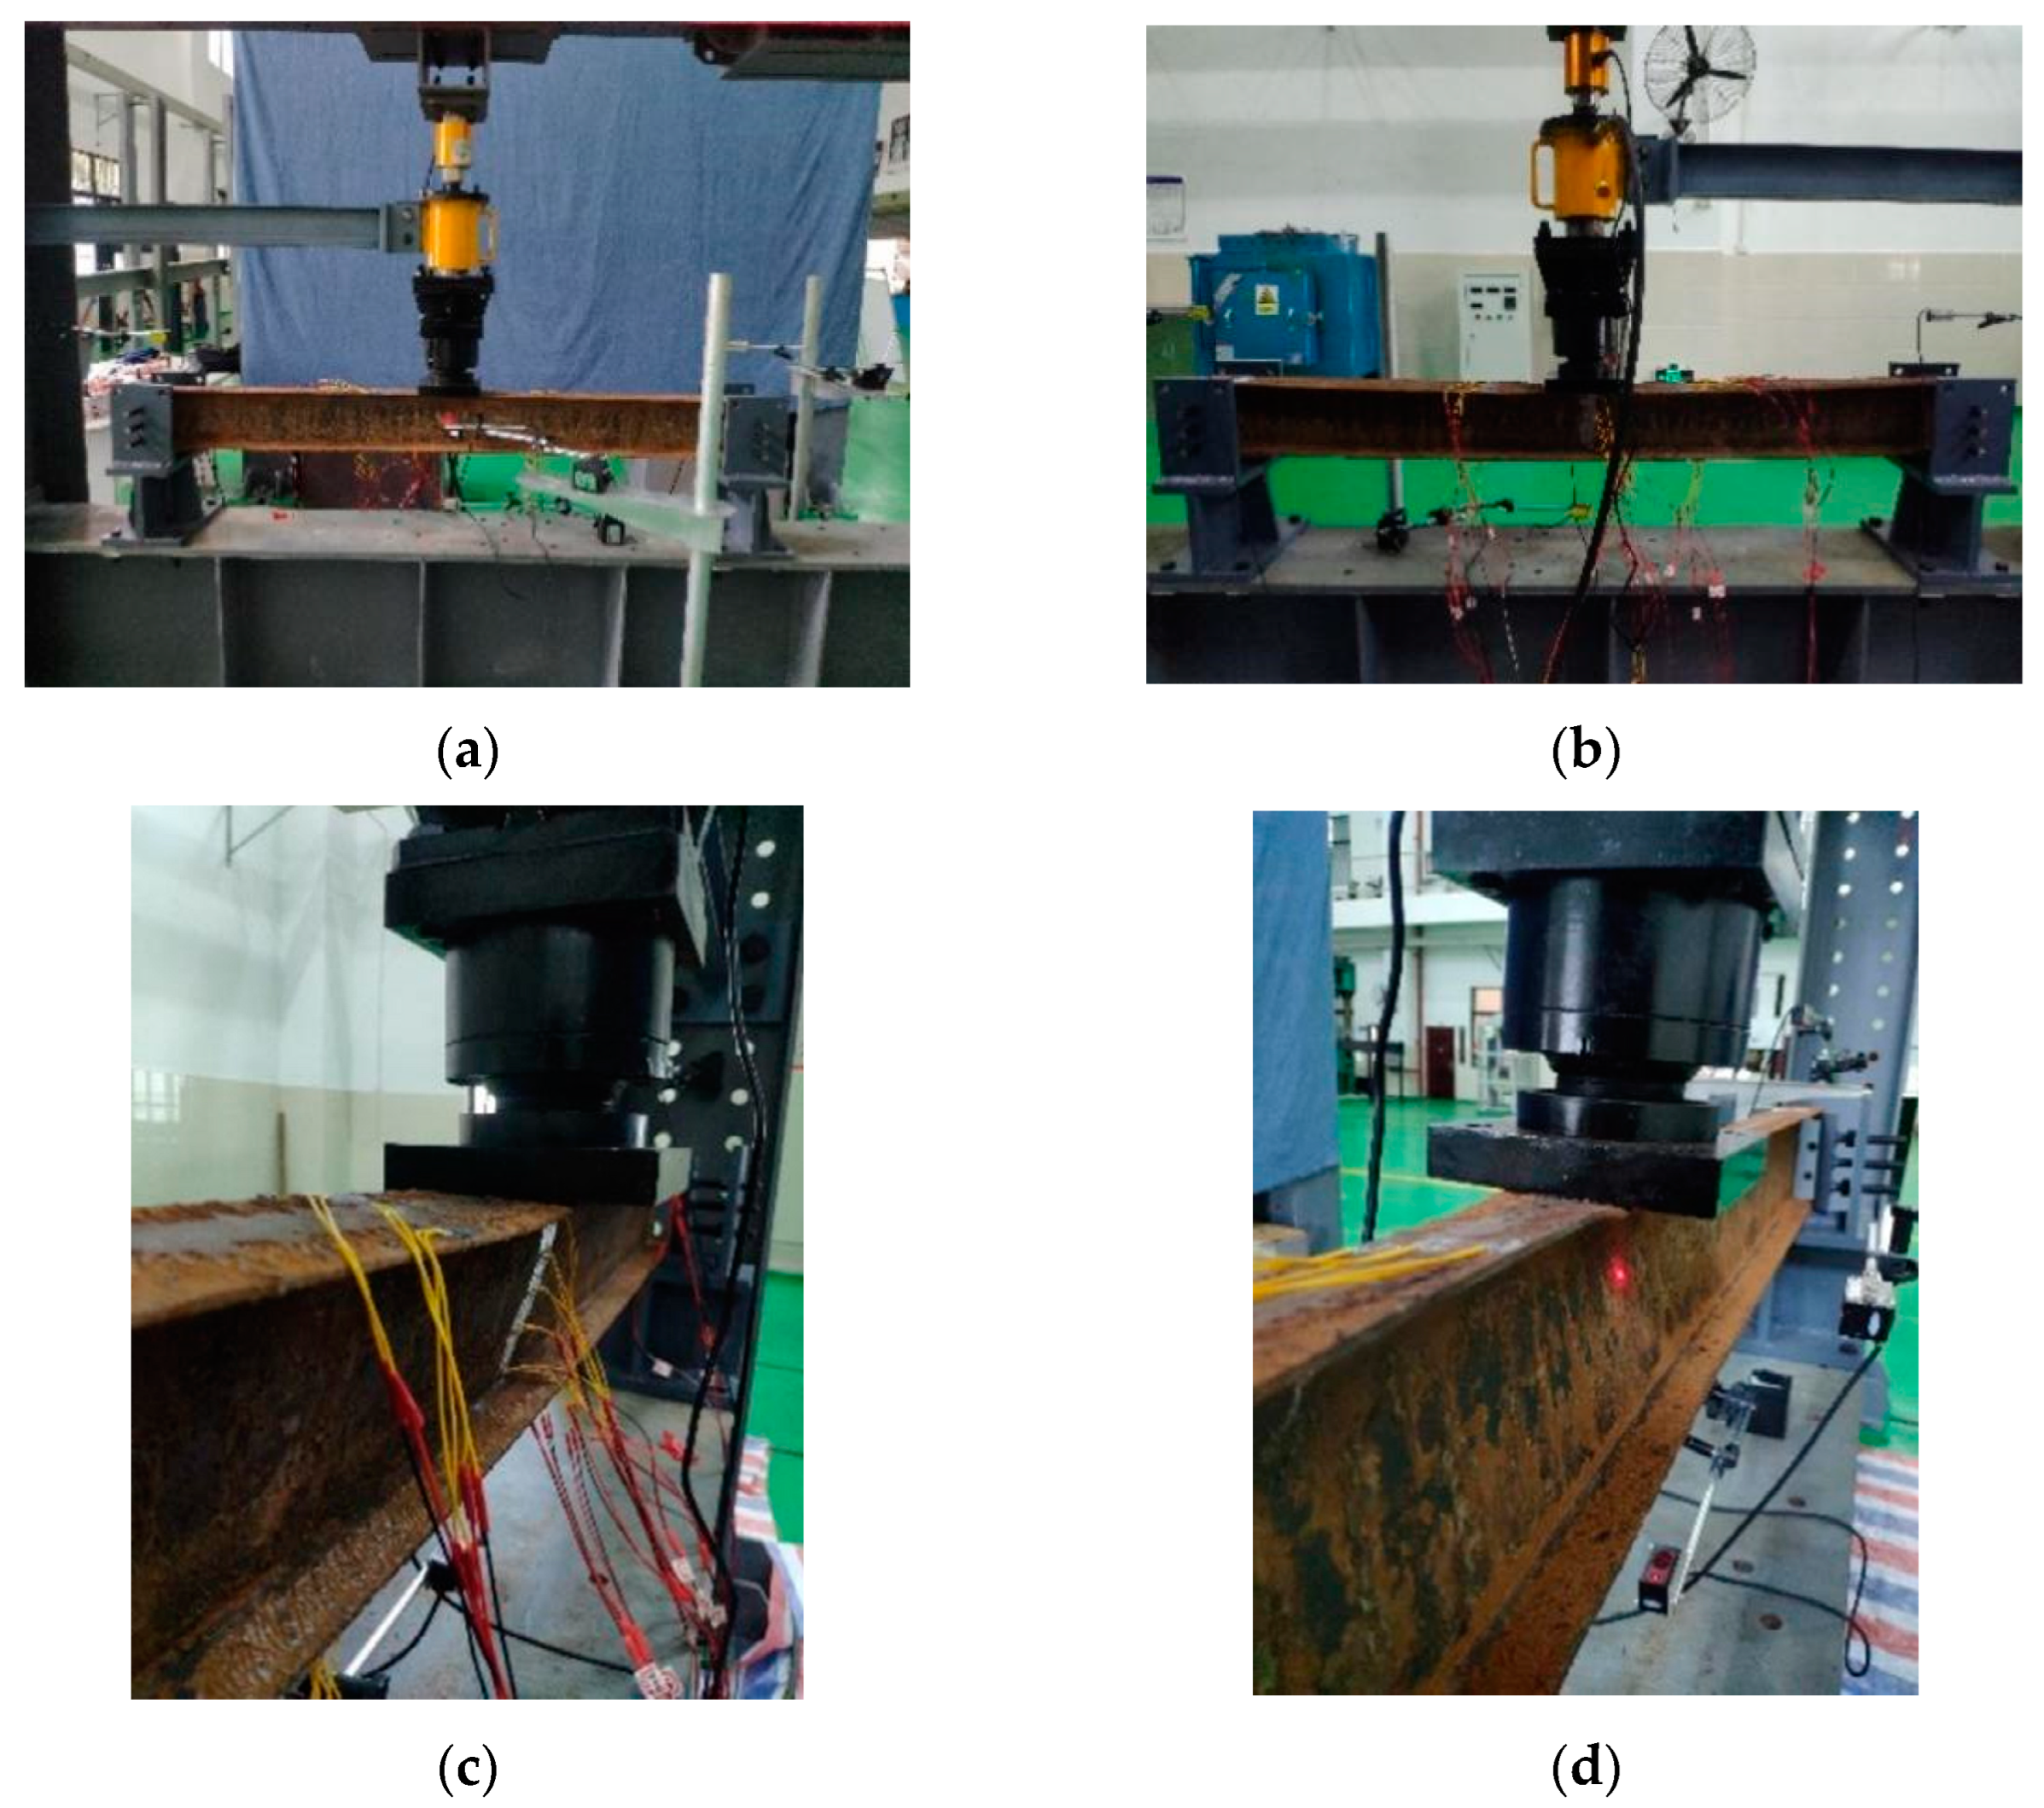
2.4. Overall Stability Test of the Corroded Steel Beams

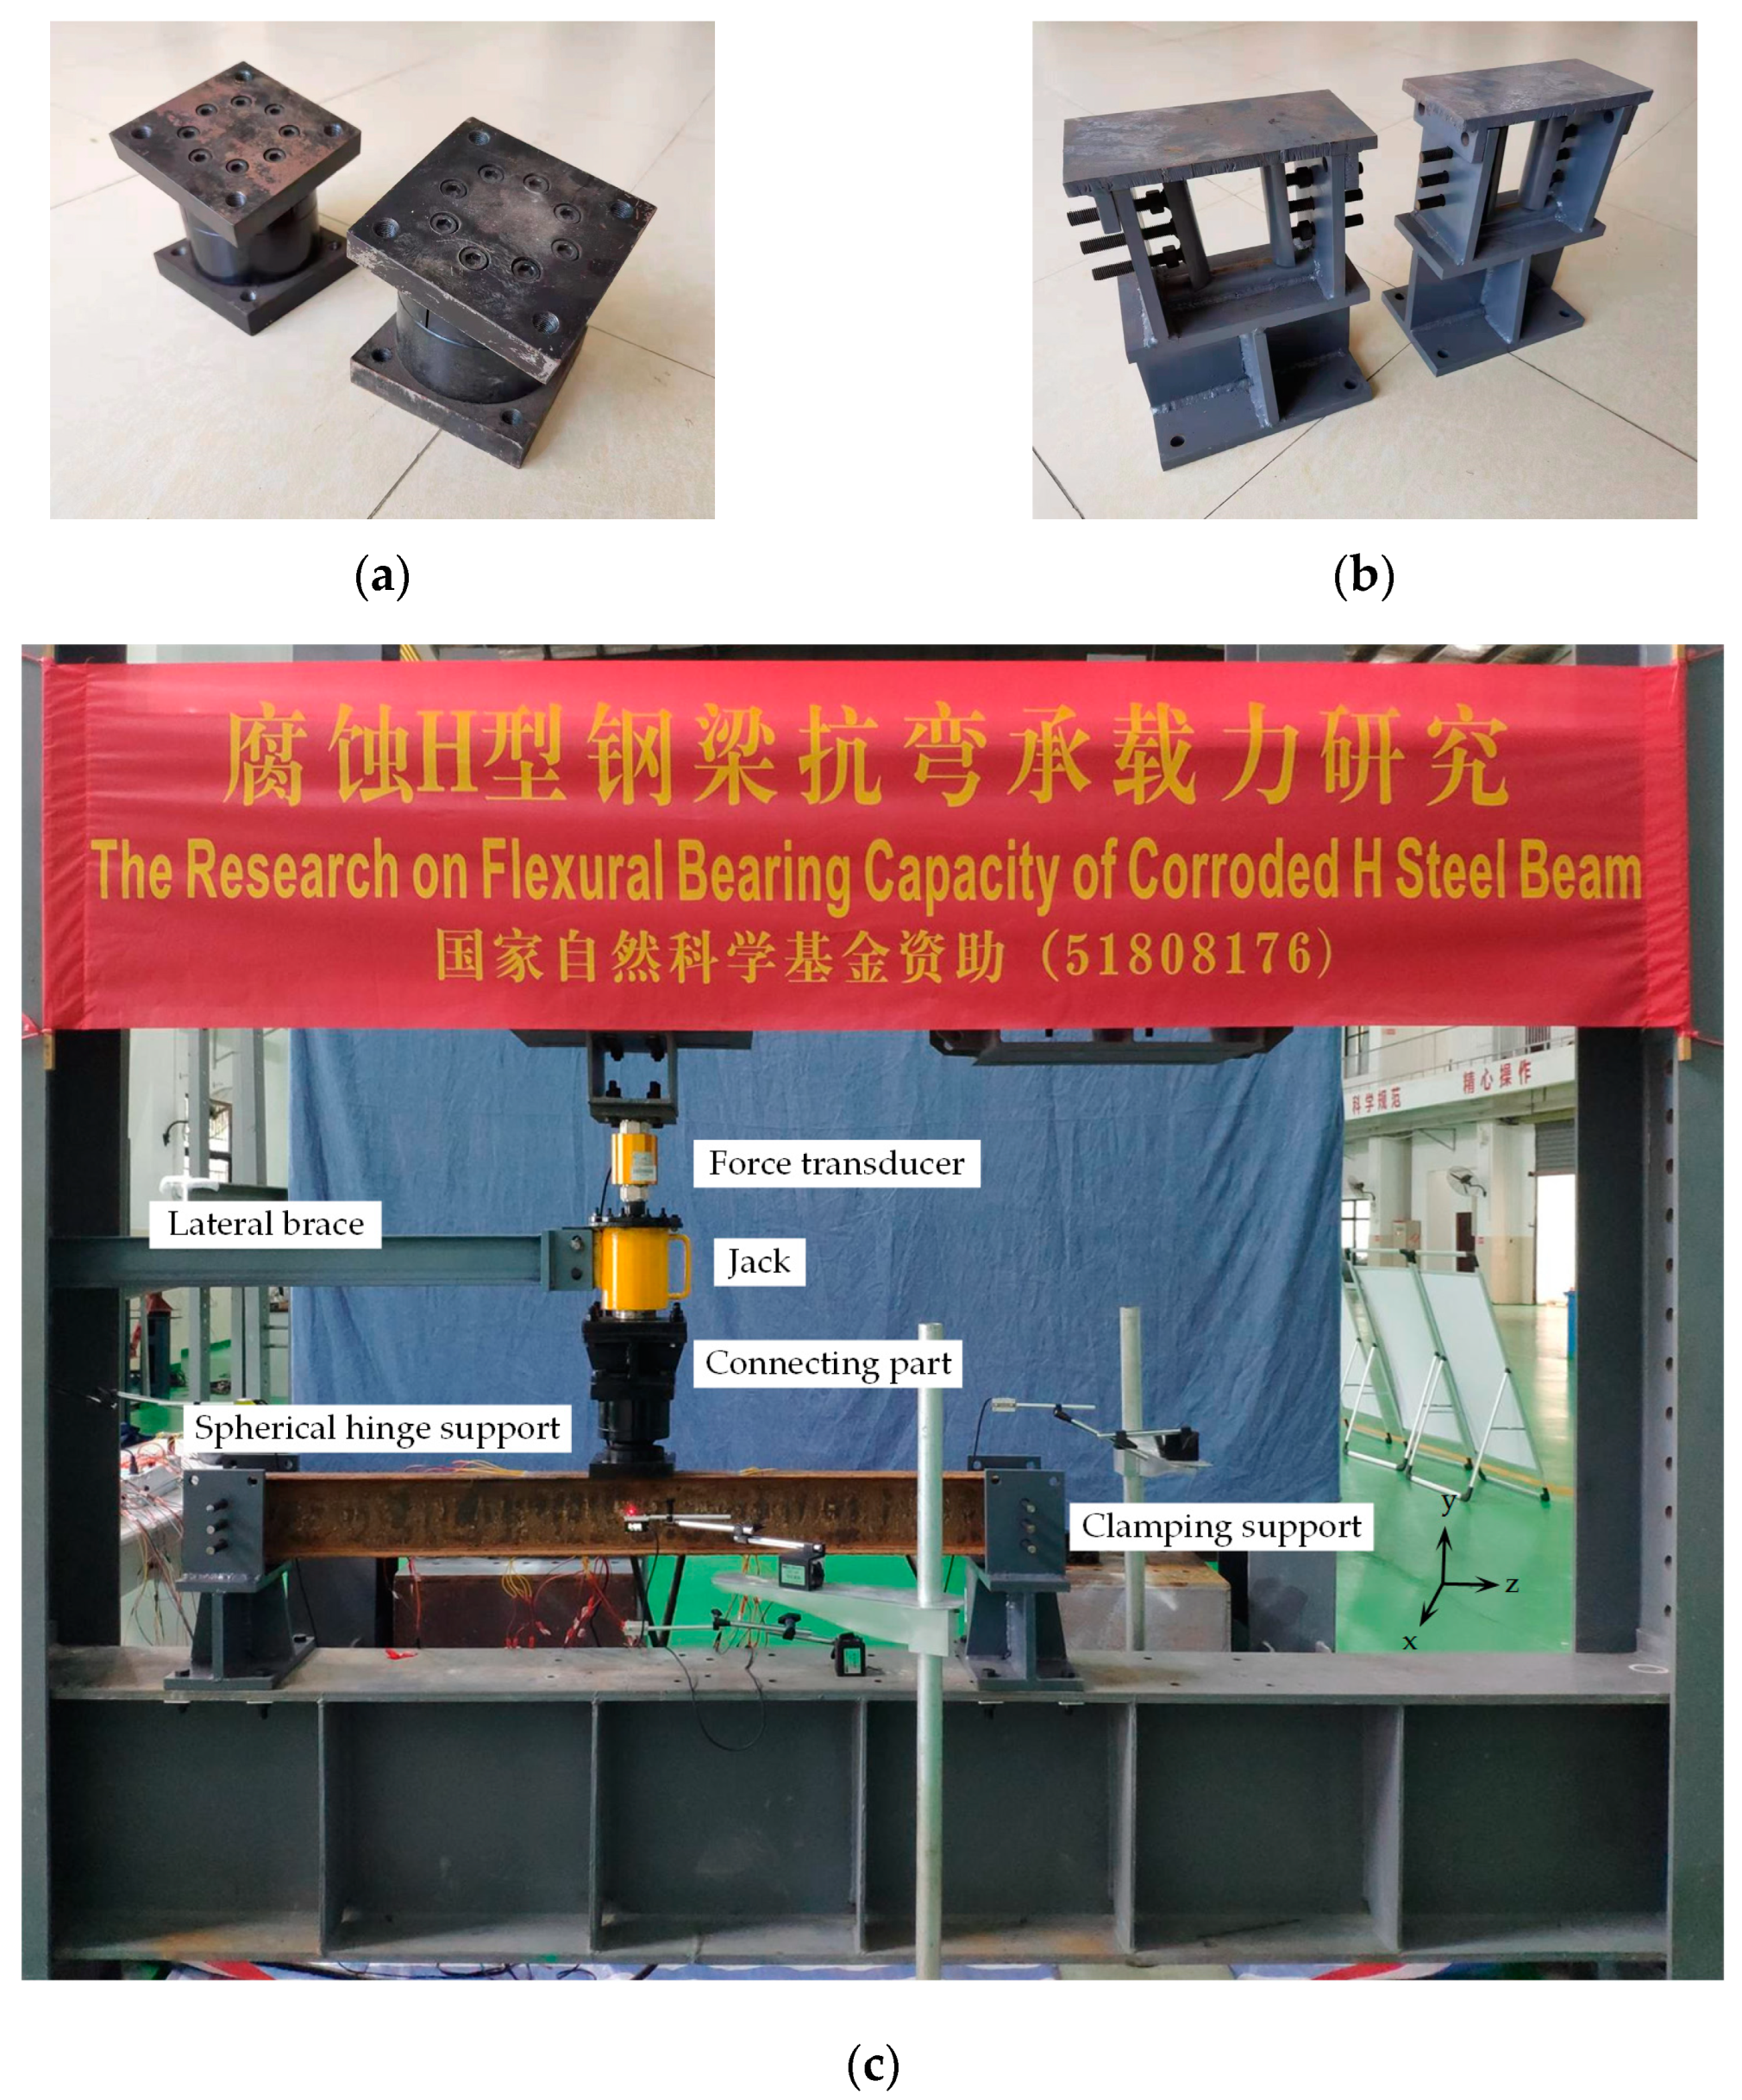
2.4.1. Loading Device and Support Design

An overall stability test was conducted on the steel beam specimens after the accelerated corrosion test, and a 20 t jack was adopted for the loading test in the three-point loading mode. In order to release the lateral constraint of the traditional jack on the specimens during loading, and to allow the steel beams to undergo free lateral buckling in the loading process, an improved loading device was adopted in this study, as shown in Figure 6a,b. The device connected the spherical hinge support with the jack using bolts, and the jack applied a load to the mid-span of the steel beam through the spherical hinge support. During the loading process, the spherical hinge support ensured that the load position of the test beam remained unchanged, and the load was always vertically downward when the test beam being twisted. A BLR-1 force transducer that was manufactured by Shanghai East China Instrument Factory was located in the upper part of the jack in order to accurately collect the load that was applied to the beam. In addition, the jack was provided with a lateral brace that was connected to the reaction frame at the transverse position in order to improve the overall stability of the loading device and to ensure a smooth test. The beam support was designed in the ideal “clamping support” form. Additionally, adjustable half-round steel was used at both ends of the support to constrain the lateral displacement at the end of the steel beam and the axial torsion around the specimen. Furthermore, the half-round steel that was welded at the bottom of the support constrained the vertical displacement at the end of the steel beam, which allowed free rotation around the x-axis and the axial constraint of the steel beam could be released. Figure 6c displays the various devices and the loading diagram of the overall stability test.

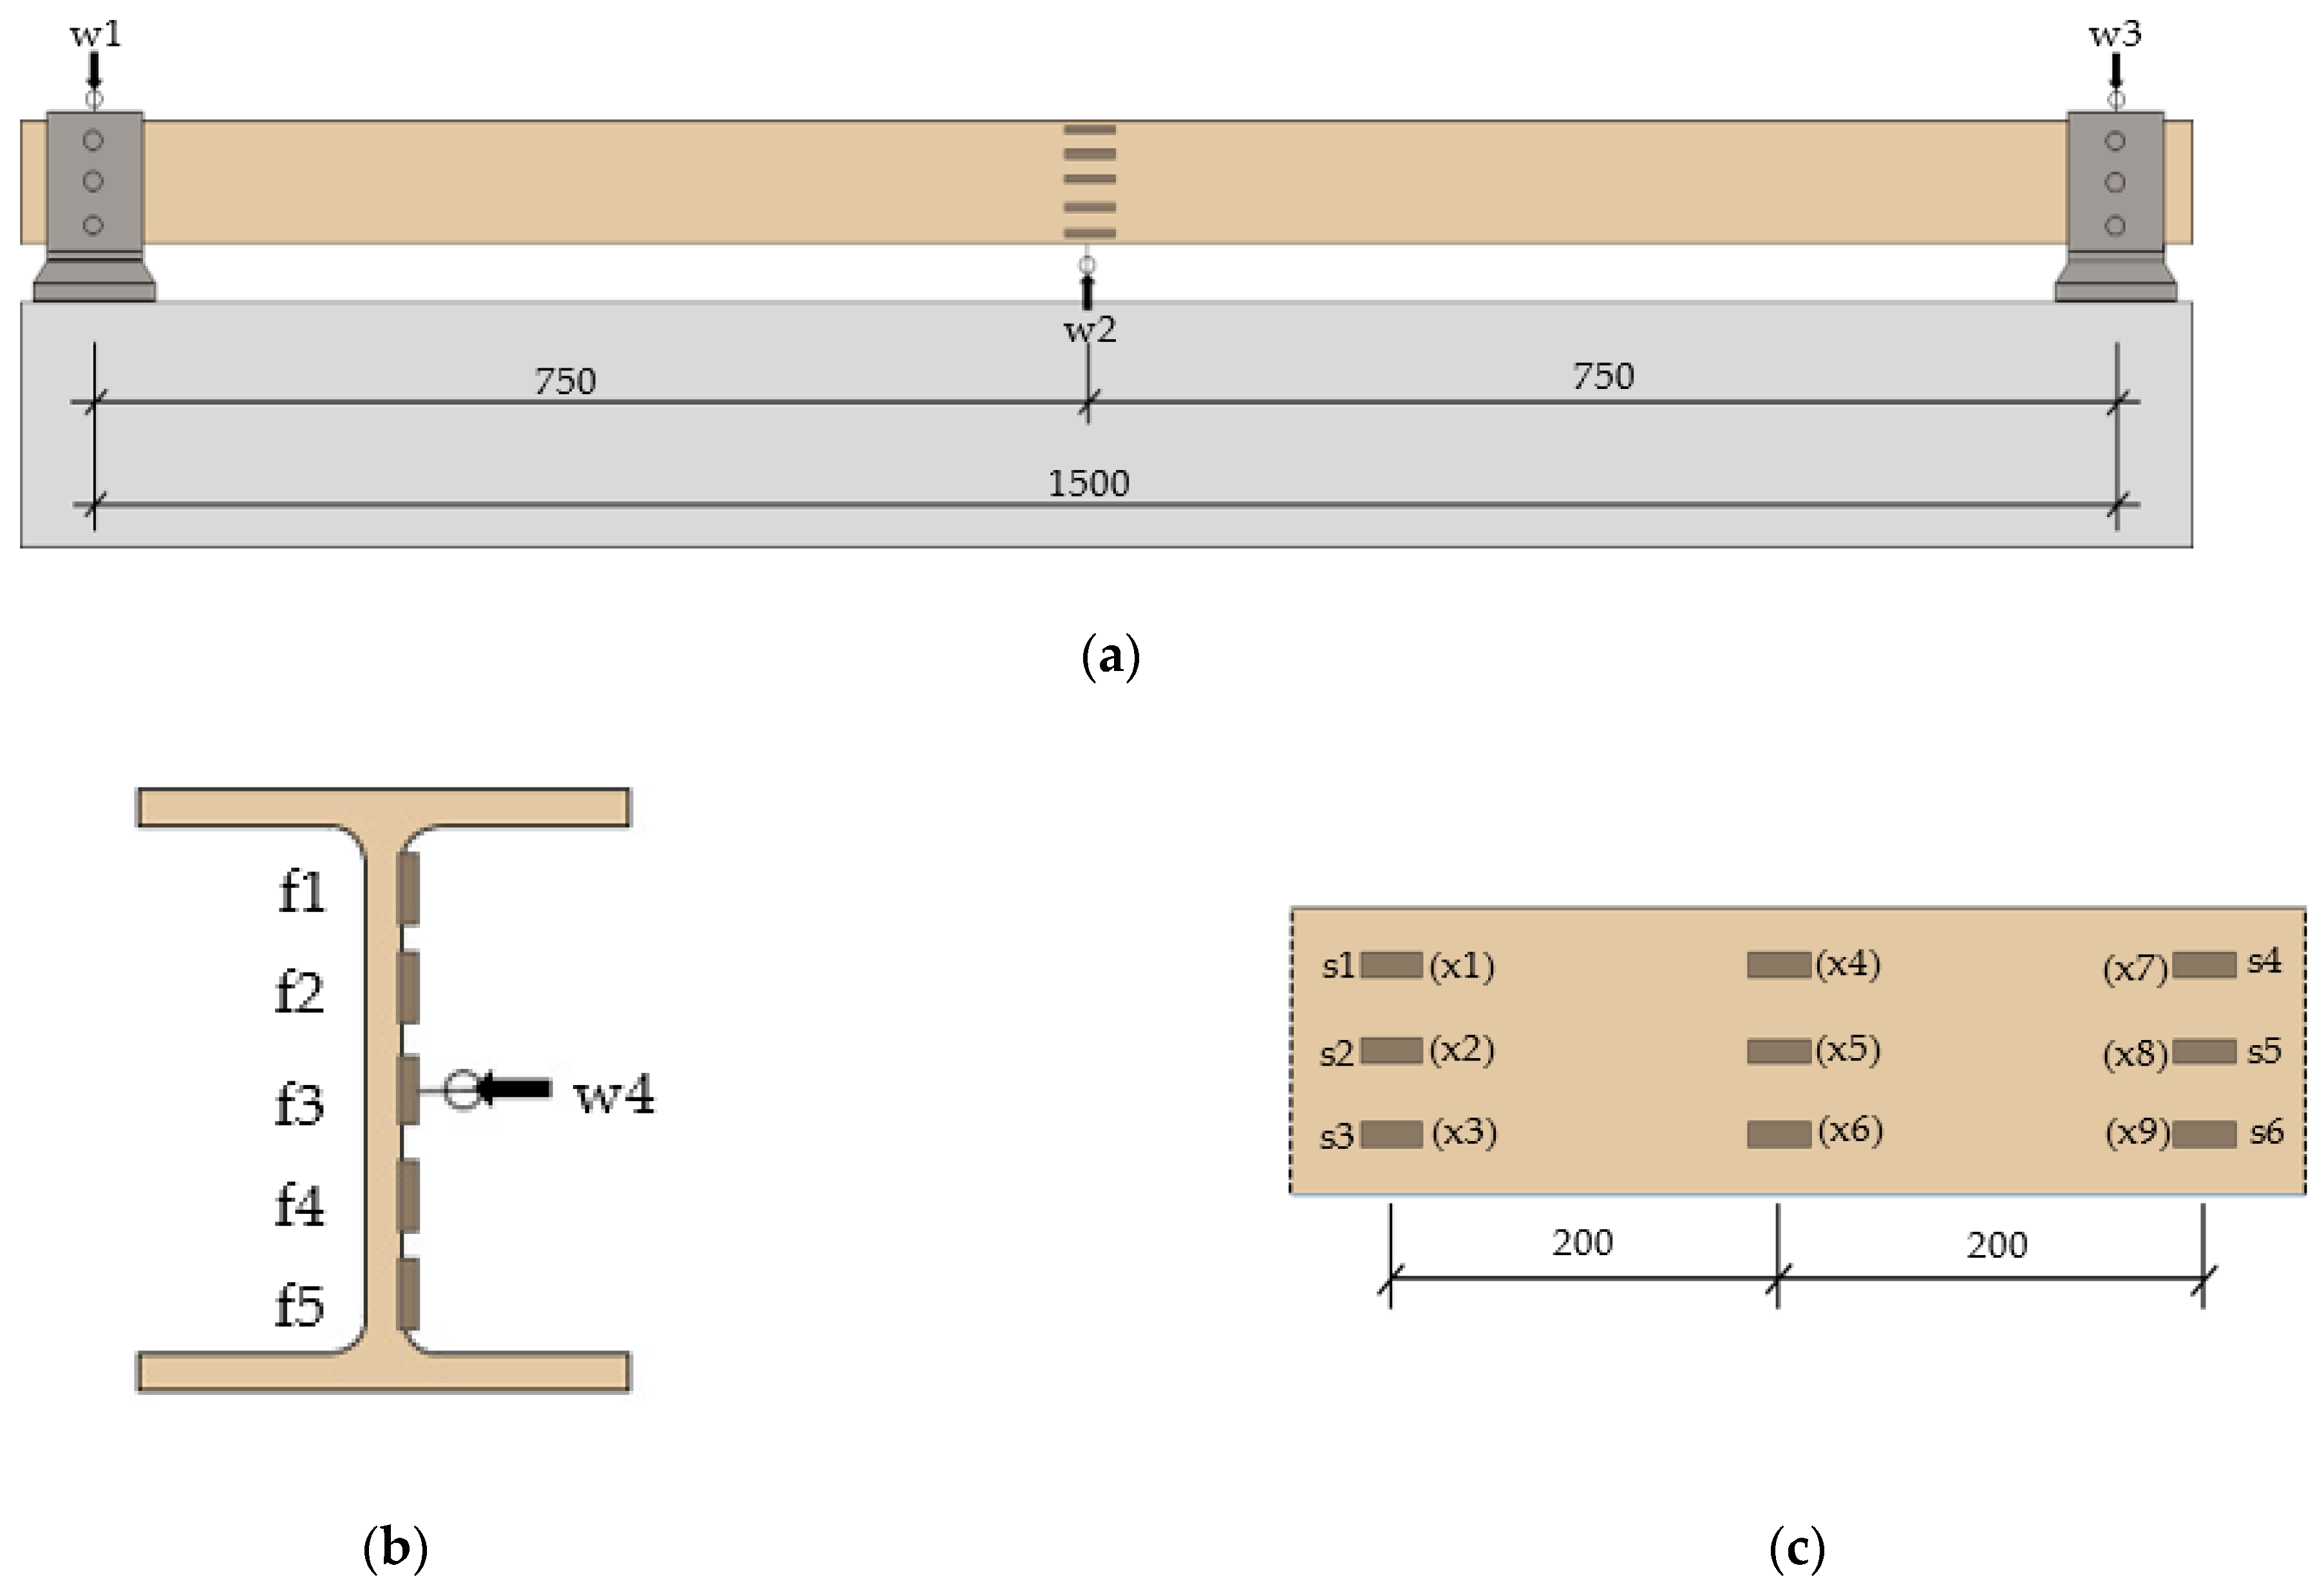
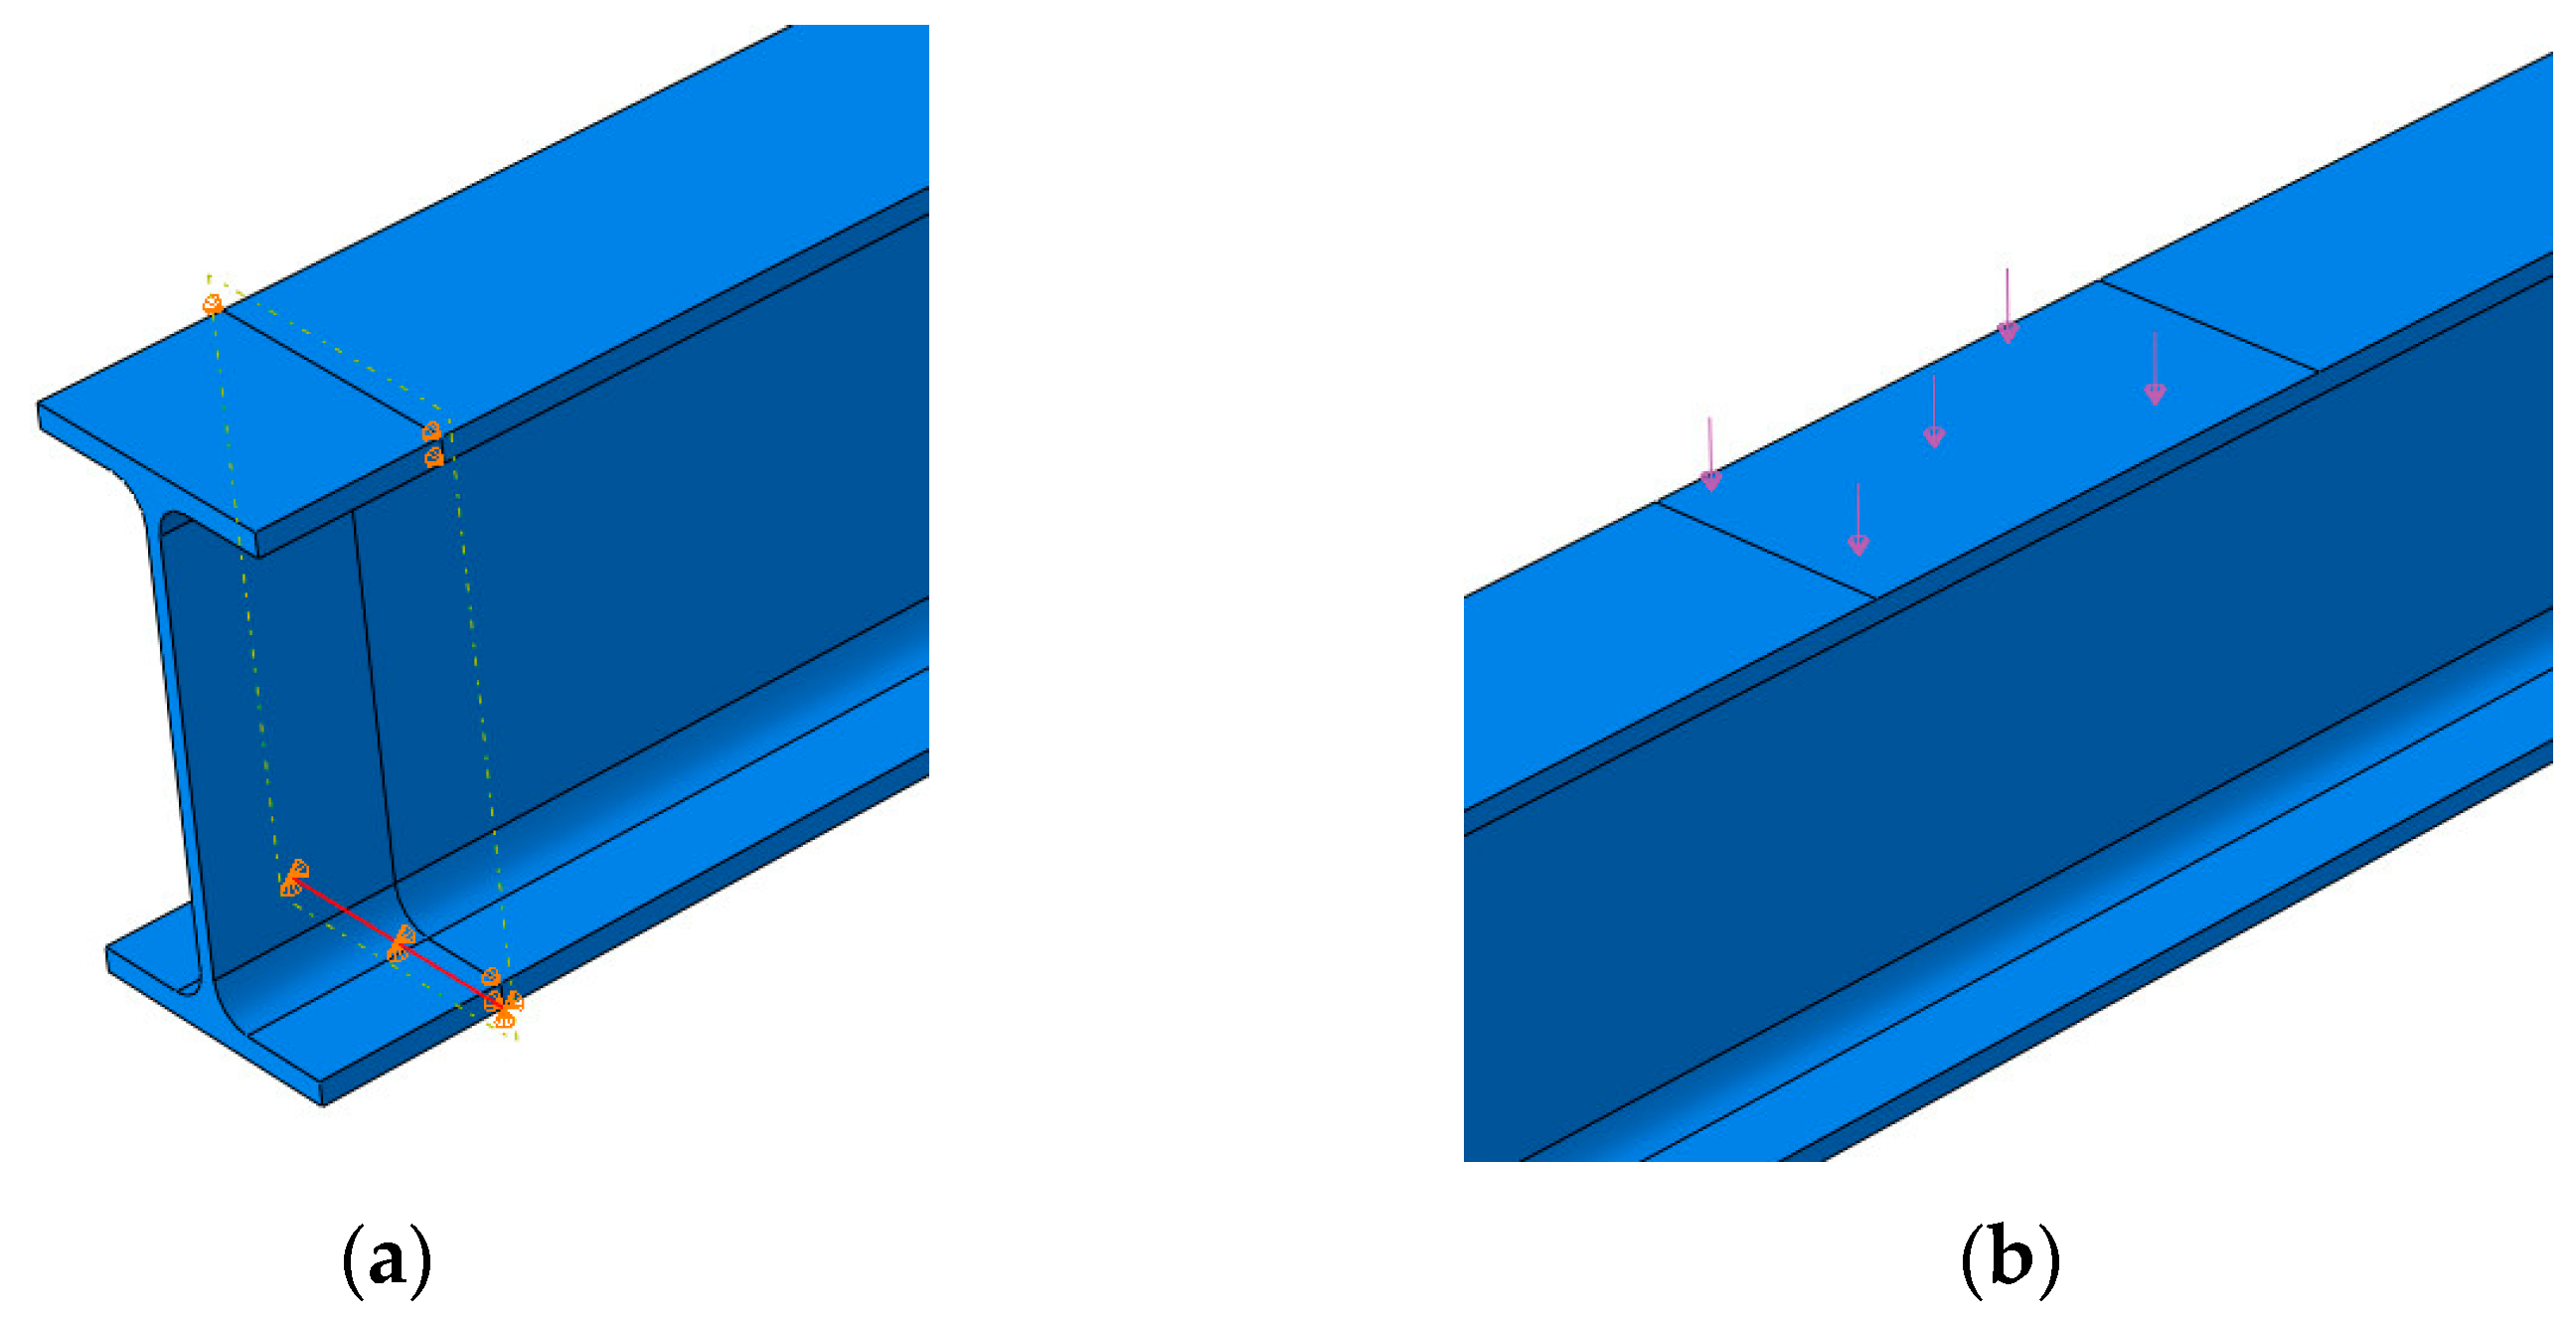
2.4.2. Arrangement of the Measuring Points

In order to monitor the overall instability of the test beams, four LGKG-C1050 laser displacement meters, which were made in China, were arranged on each specimen, including three vertical displacement meters (w1, w2, and w3) and one horizontal displacement meter (w4). These meters were used to monitor the mid-span vertical displacement of the steel beams, the vertical settlement of the supports at both ends, and the mid-span lateral horizontal displacement of the steel beams. Each test beam was equipped with 20 strain gauges, including six (s1–s6) and nine (x1–x9) strain gauges on the upper and lower flanges, respectively, and five (f1–f5) on the webs. The arrangement of the measurement points is illustrated in Figure 7.

3. Test Process and Analysis of the Results

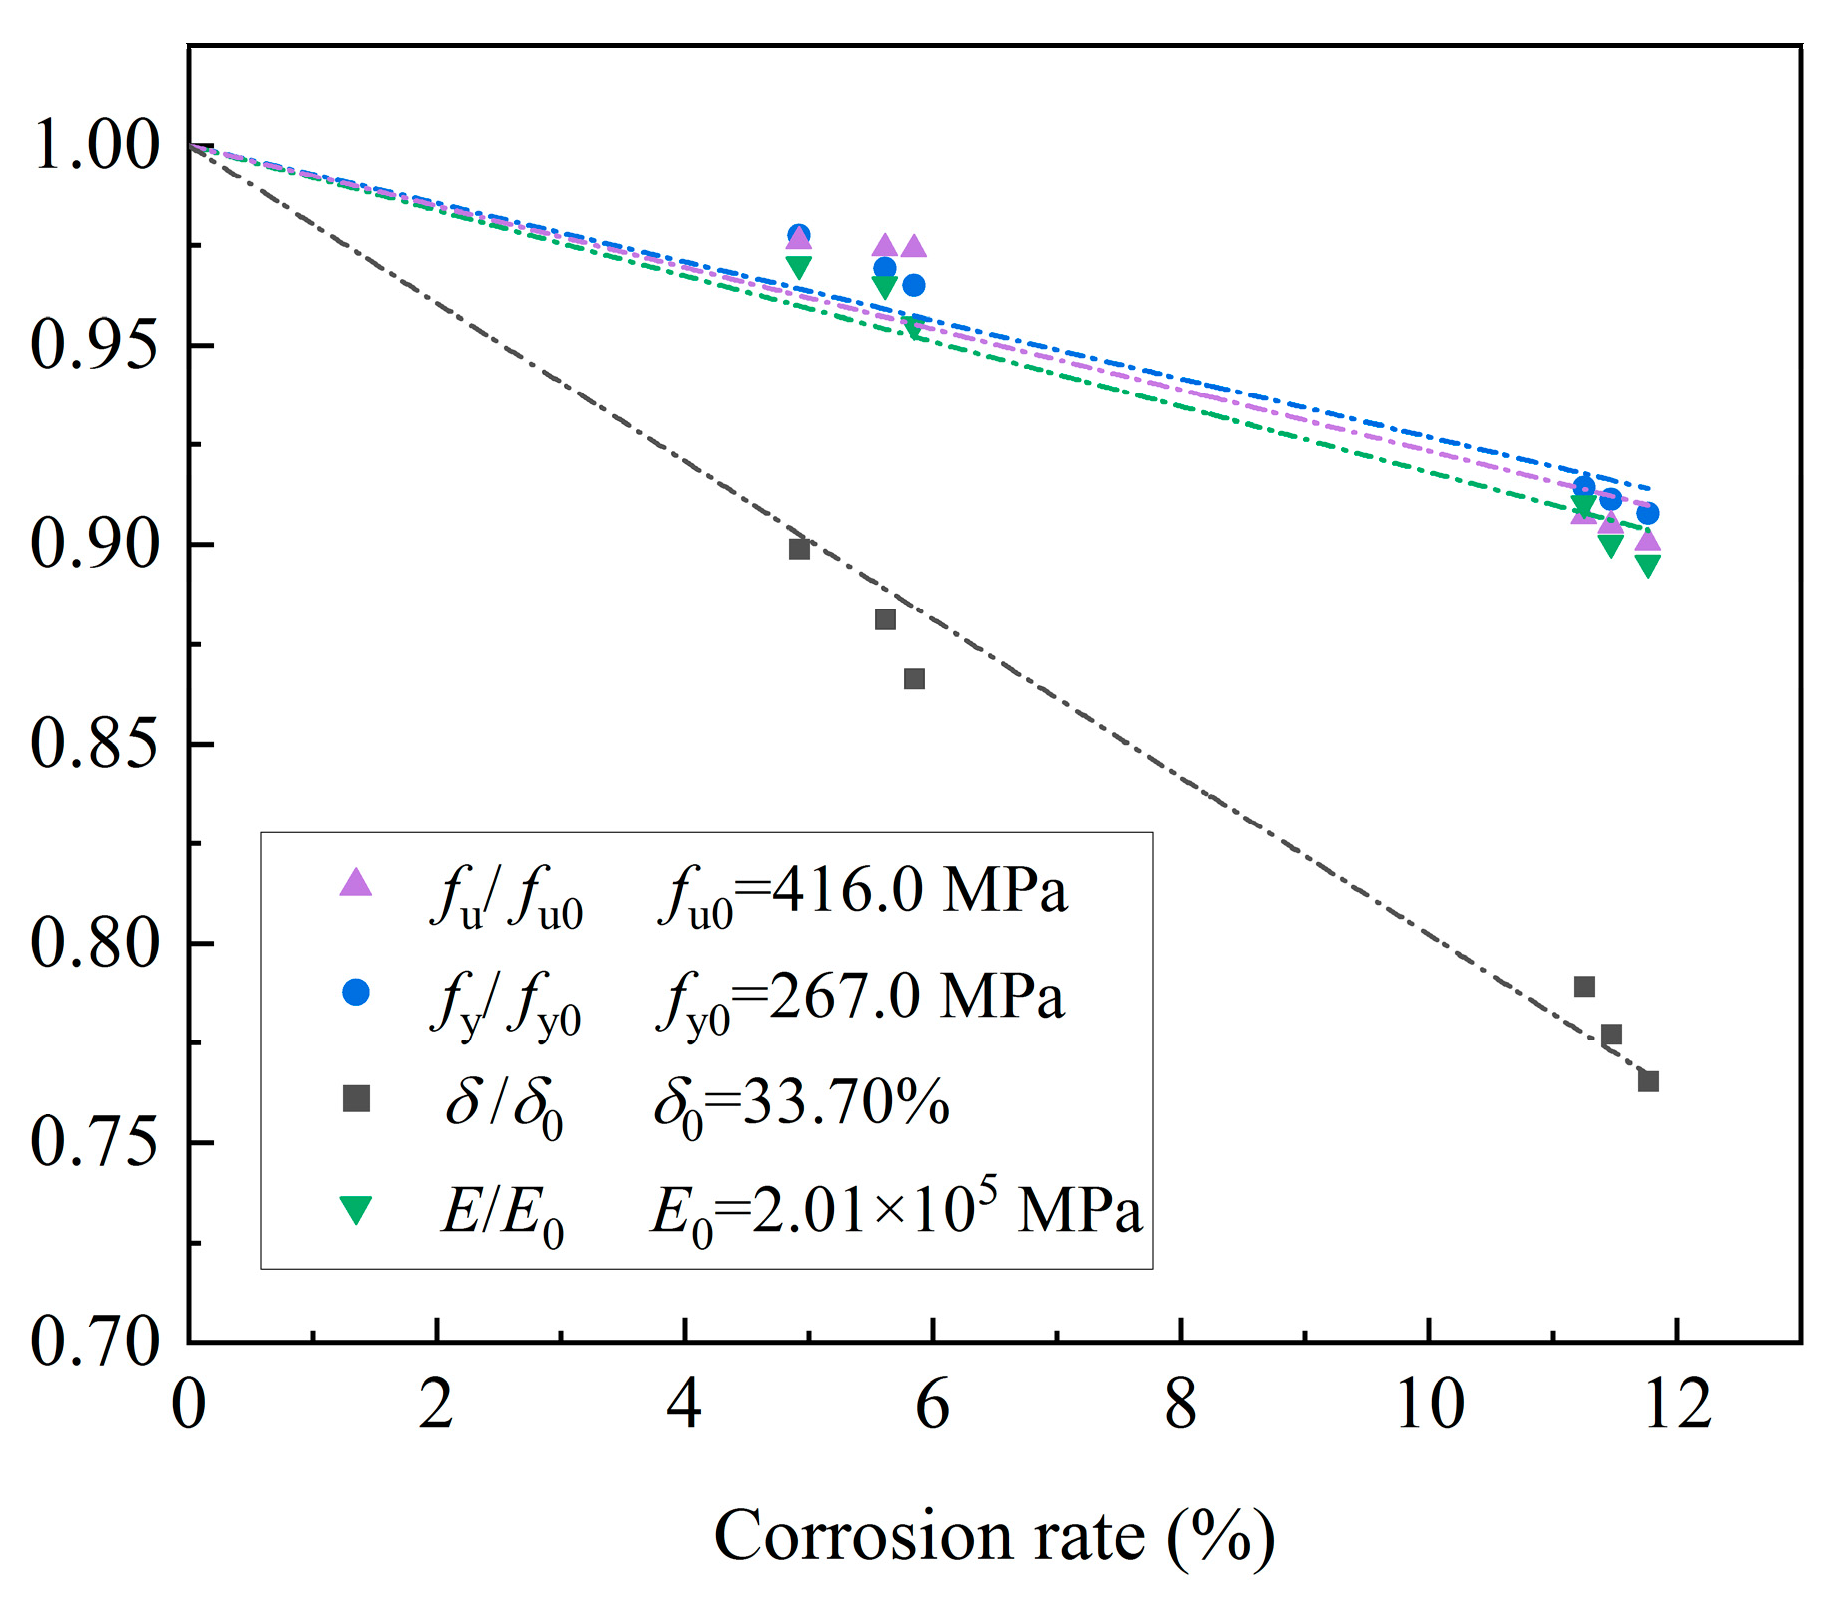
3.1. Mechanical Test Results and Analysis of the Corroded Steel Beams

The degradation of the mechanical properties of steel affects the bearing capacity of corroded steel beams. Therefore, this study focused on the degradation law of the yield strength fy, the ultimate strength fu, the elastic modulus E, and the elongation δ of the steel with an increase in the corrosion rate. The failure modes according to the monotonic tensile tests of the specimens that were cut from the corroded steel beams are shown in Figure 8. Table 3 lists the mechanical test results of these specimens. The yield strength fy, the ultimate strength fu, the elastic modulus E, and the elongation δ of the steel were found to exhibit different downward trends with the aggravation of corrosion.
Based on the mechanical test data that are presented in Table 3, the quantitative relationship between the various mechanical property indices of the corroded steel beam and the corrosion rate η′ can be established as follows:
f u / f u 0 = 1 0.7657 η
f u / f y 0 = 1 0.7309 η
E / E 0 = 1 0.8185 η
δ / δ 0 = 1 1.9783 η
where fu and f u 0 are the ultimate strengths of the corroded and uncorroded steel, respectively, fy and f y 0 are the yield strengths of the corroded and uncorroded steel, respectively, E and E0 represent the elastic moduli of the corroded and uncorroded steel, respectively, and δ and δ0 are the elongation of the corroded and uncorroded steel, respectively.
Figure 9 displays the regression fitting of the test data for each expression. The yield strength, the ultimate strength, the elastic modulus, and the elongation ratio of the steel decreased linearly with an increase in the corrosion rate. This can be attributed to the corrosion pits with different areas that were generated and randomly distributed on the steel surface, which destroyed the integrity of the cross section and weakened the steel properties. With the aggravation of corrosion, the areas and the depths of the corrosion pits increased further. The defects possibly depended on the stress concentration, thereby leading to further degradation of the strength and the ductility of the steel beams with an increase in the corrosion rate. The change in the elongation ratio was more obvious than the decreases in the elastic modulus and the strength ratio, which indicated that corrosion has a considerable impact on the plastic deformation behavior of steel.

3.2. Overall Stability Test Process of the Corroded Steel Beams and Result Analysis

3.2.1. Loading Process

A 20 t hydraulic jack was used for loading during this test. Before the formal loading, the estimated ultimate bearing capacity of the test was obtained by a loading simulation analysis and a calculation with the finite element software, then the specimens were preloaded at 25% of the estimated ultimate bearing capacity in order to reduce the friction of the device and the displacement of the support; the measuring equipment was inspected in order to ensure that could work normally. During the formal loading, a graded loading system was employed based on the estimated ultimate bearing capacity. Before the load reached 75% of the estimated ultimate bearing capacity, 15% of this value was applied for each grade. When the total load was up to 75% of the estimated ultimate bearing capacity of the specimen, 5% of this value was applied for each grade until the ultimate state was achieved. When the load was reduced to approximately 80% of the ultimate bearing capacity, the test was terminated and the load at each grade was maintained for 3 min.

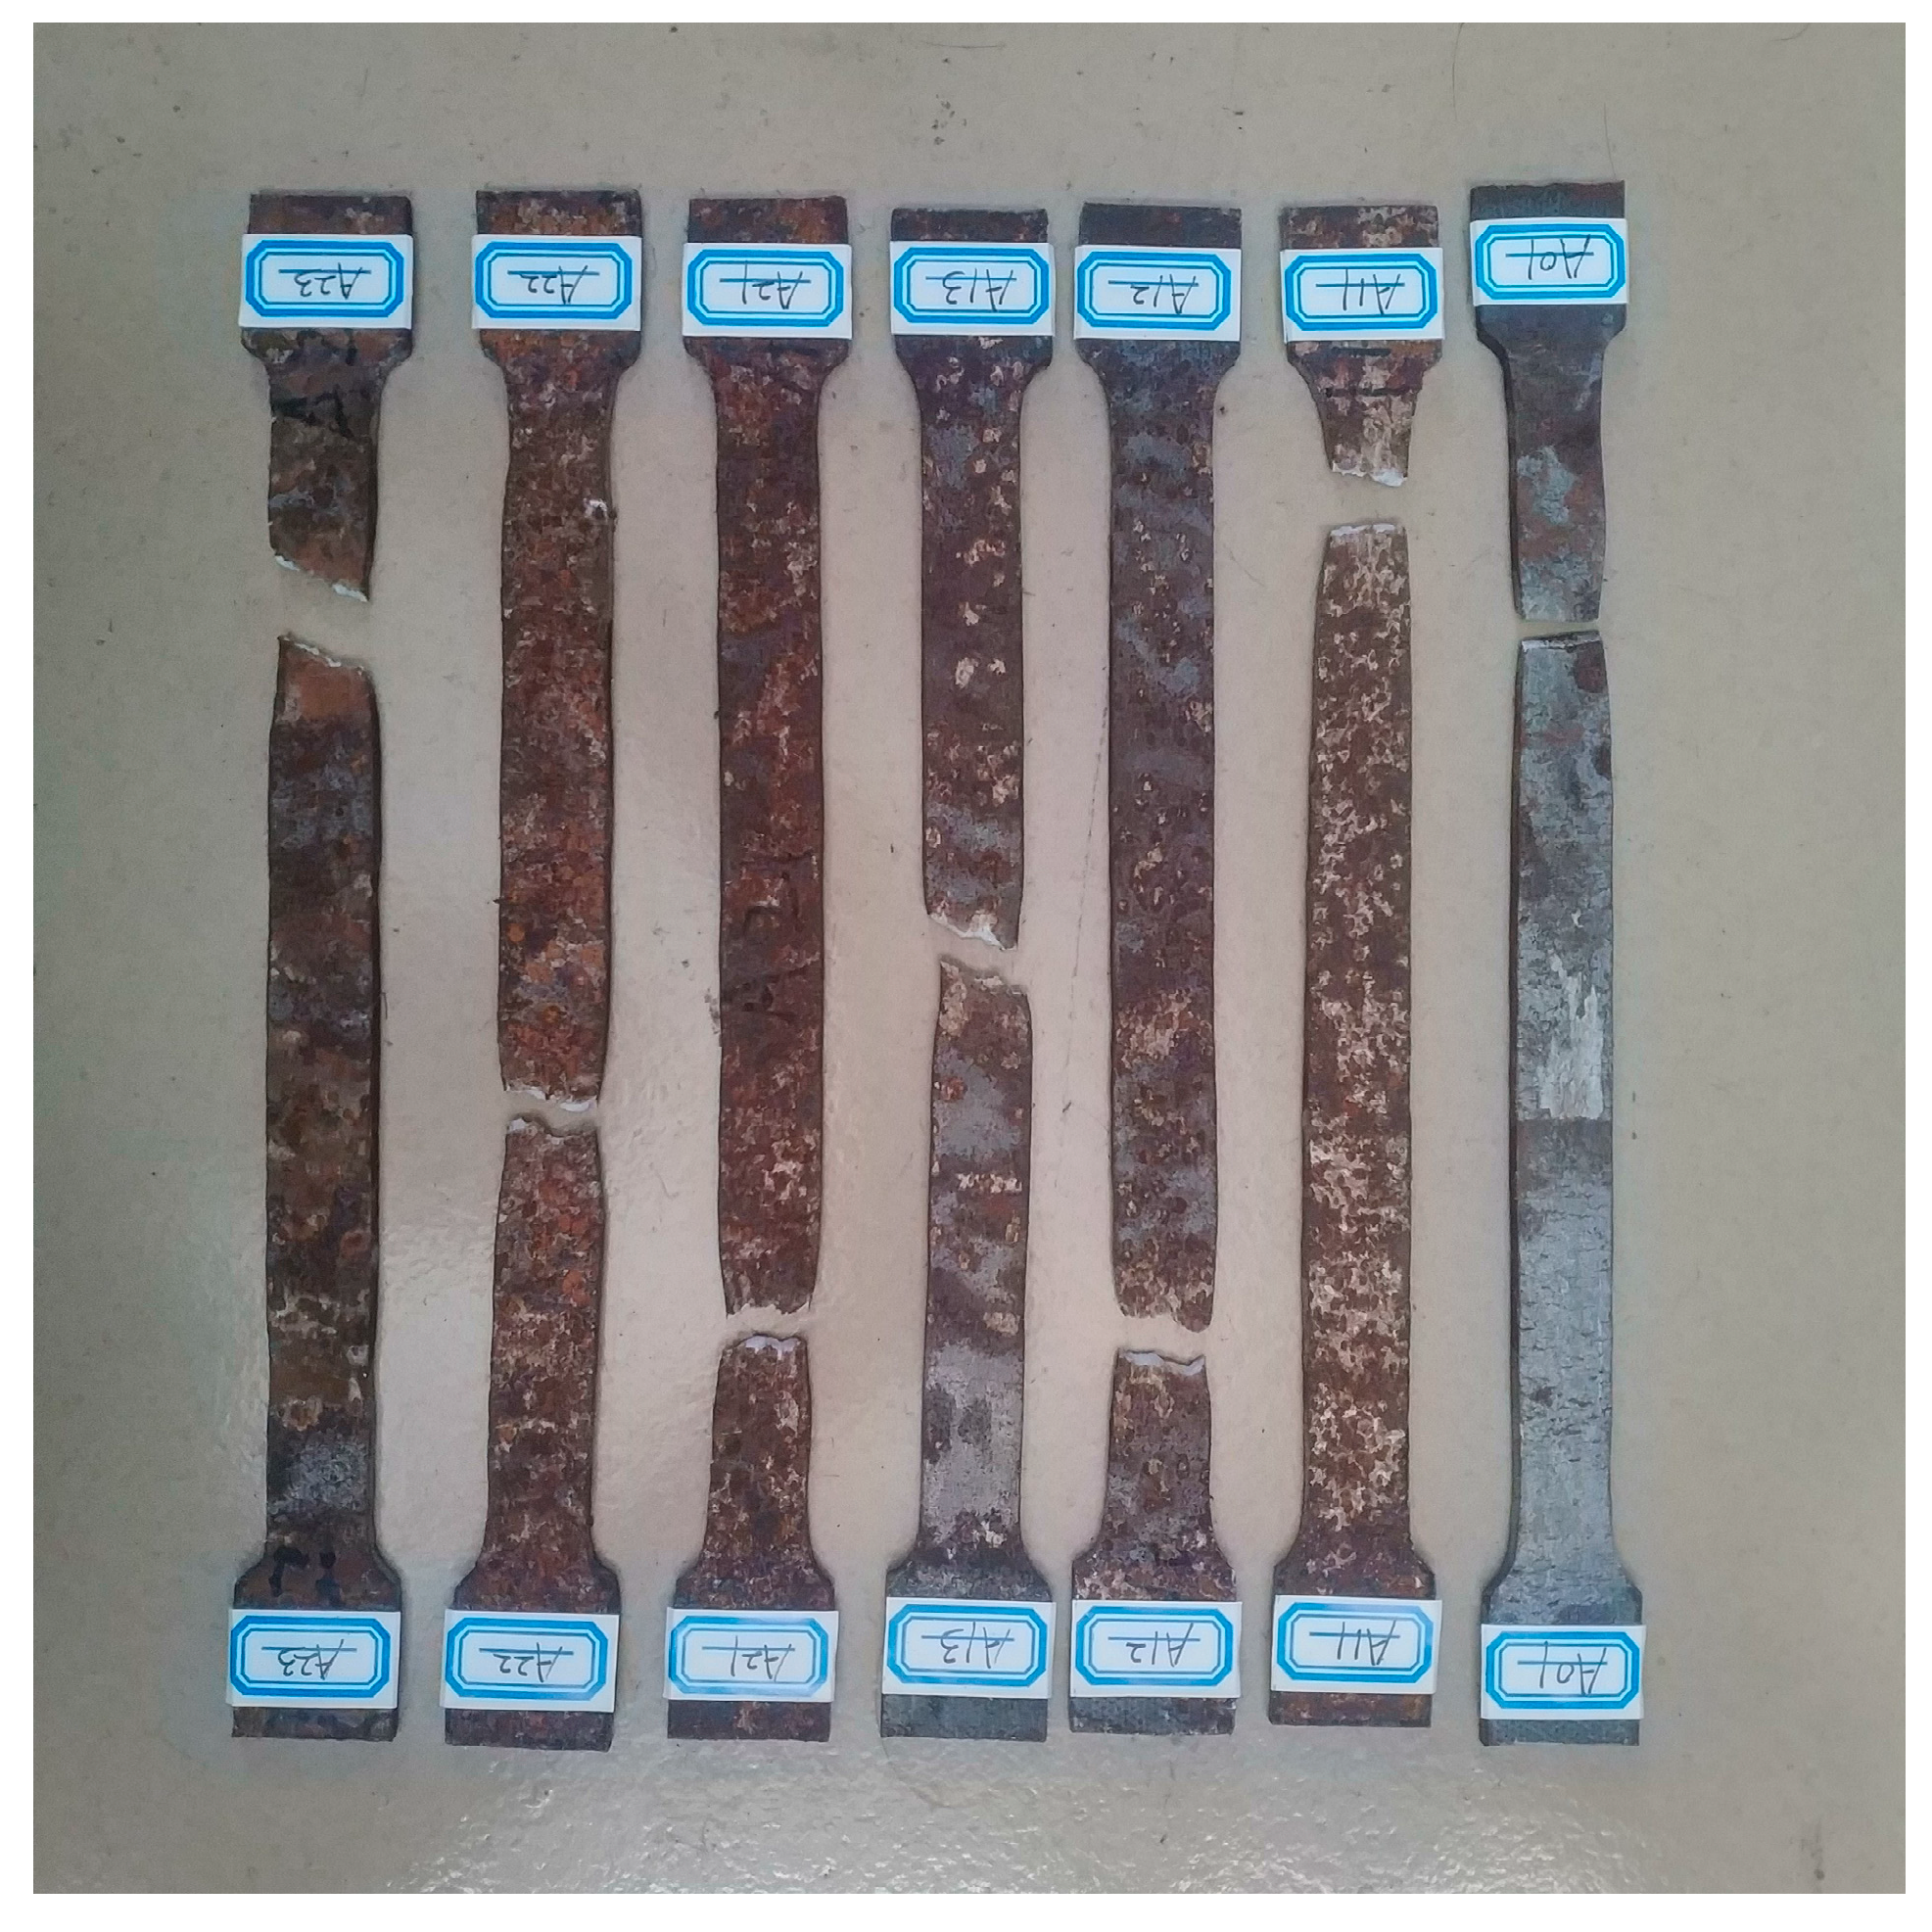
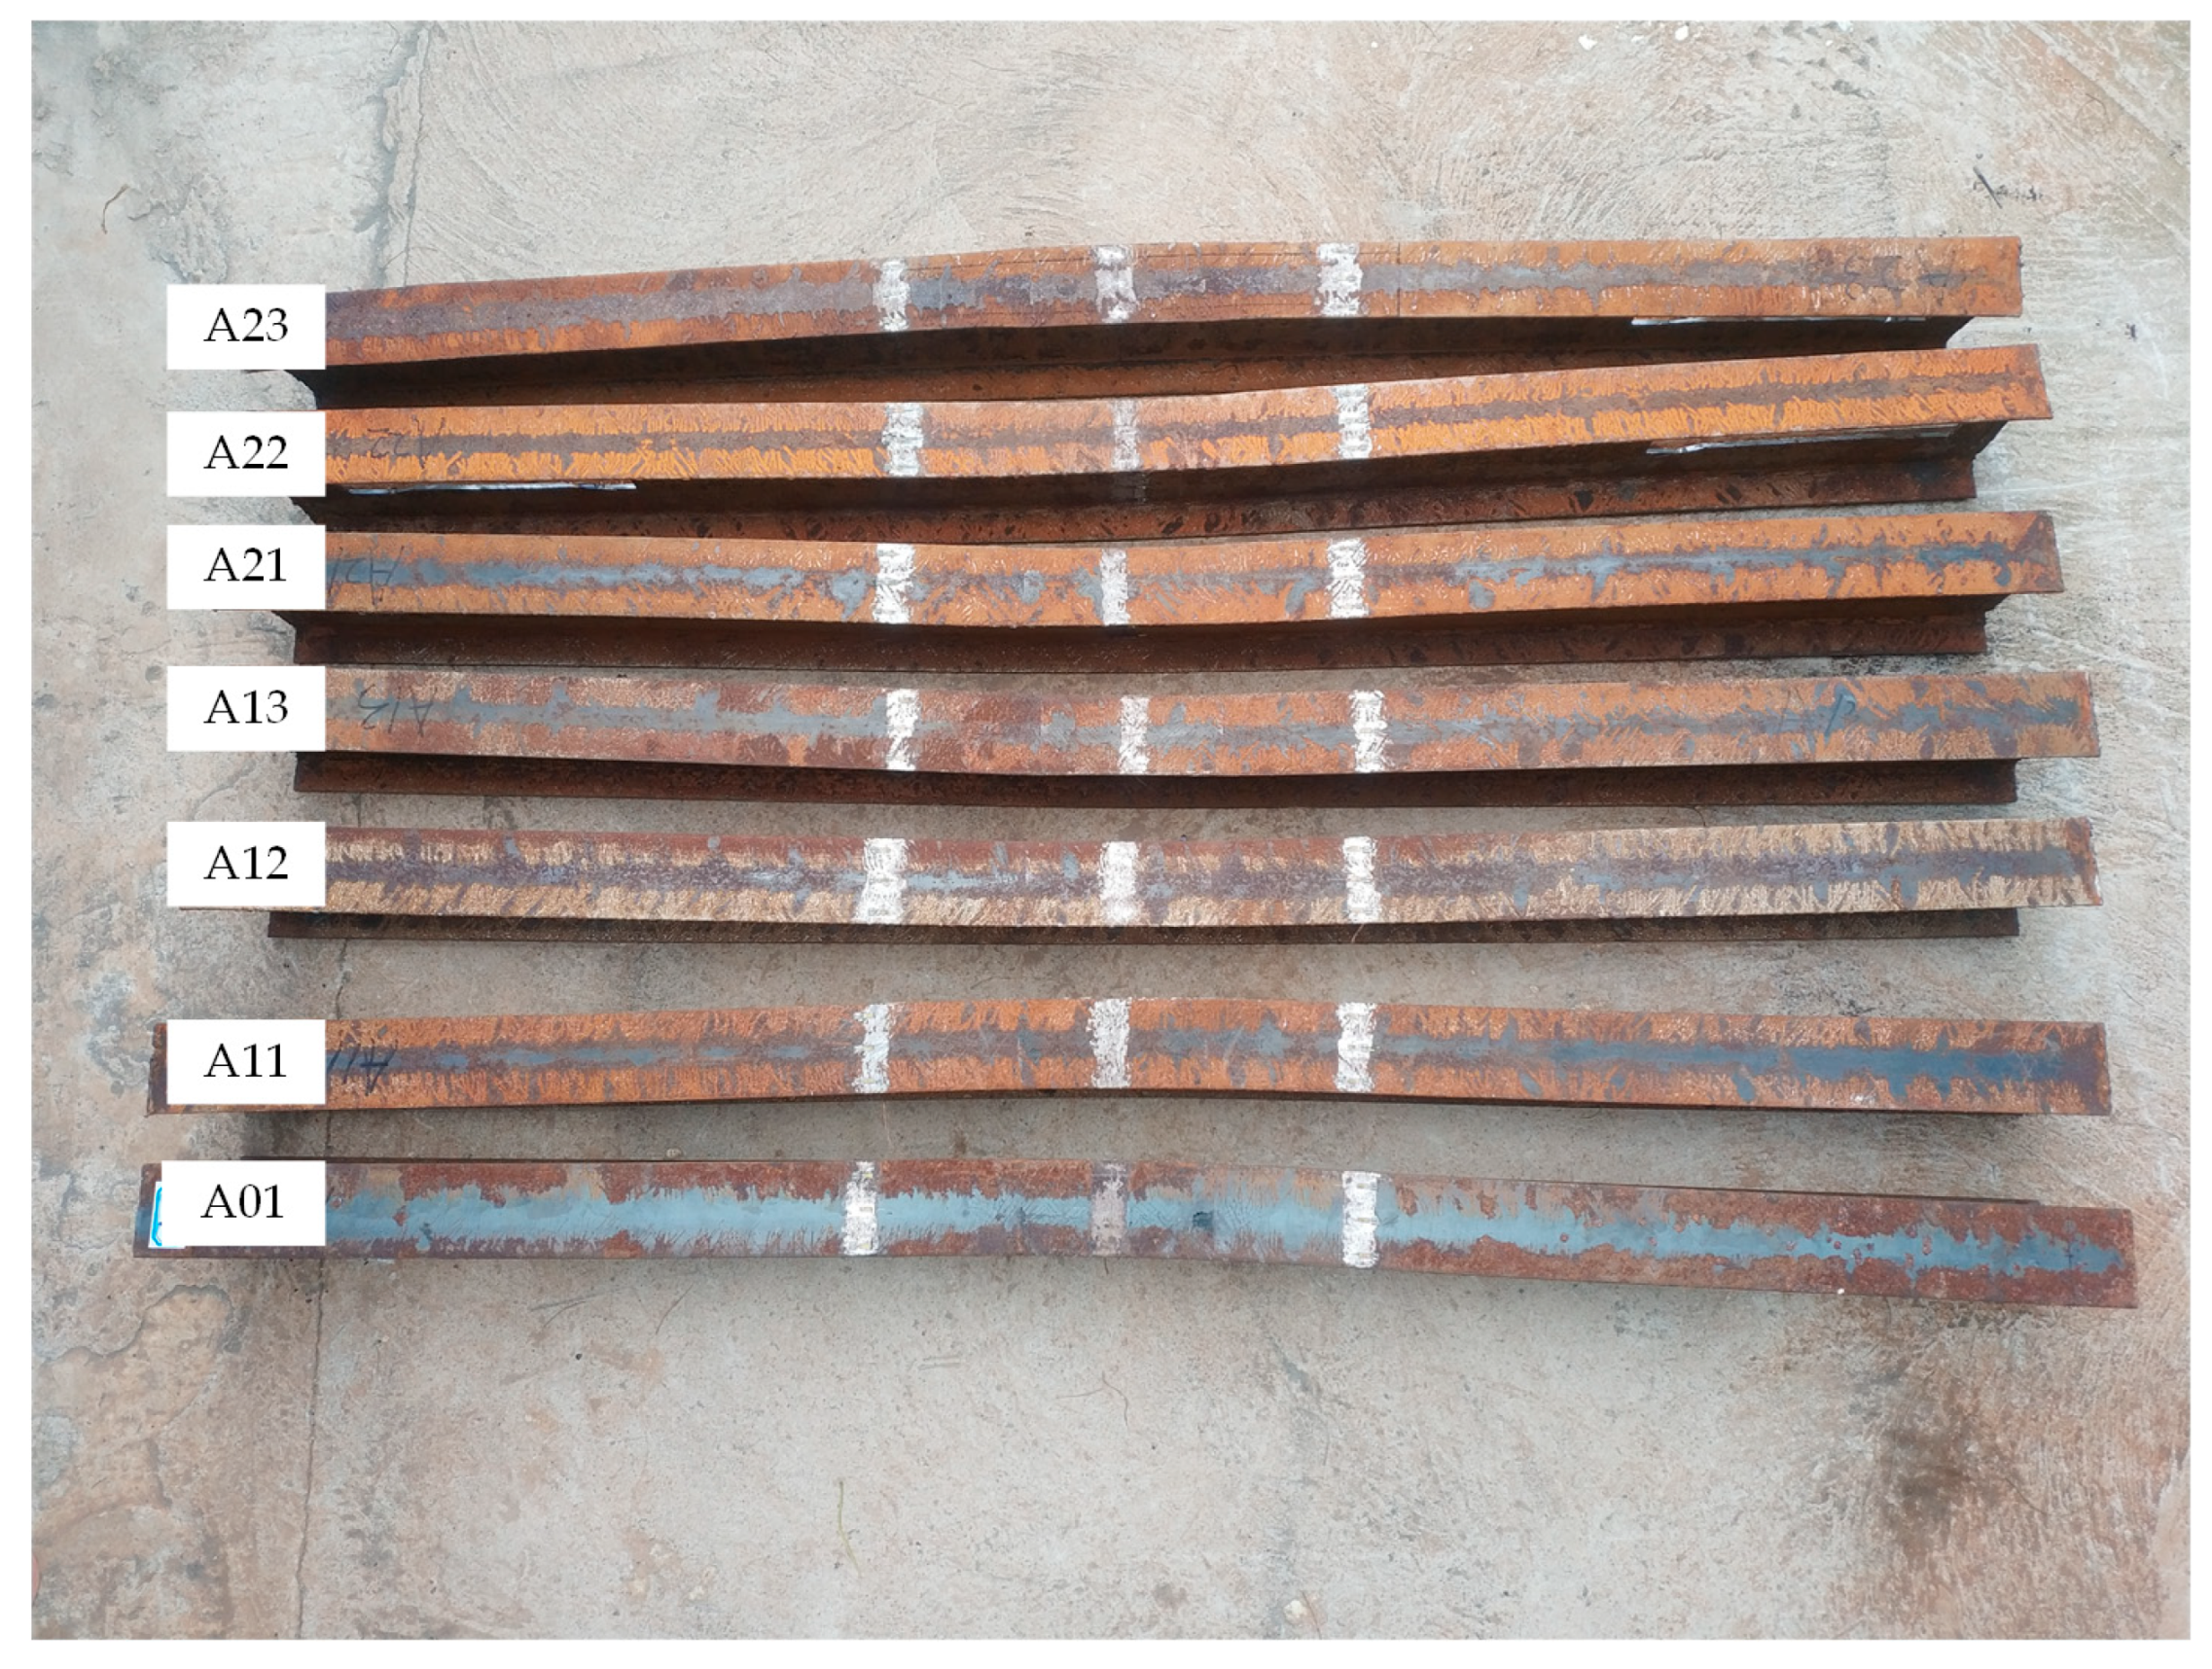
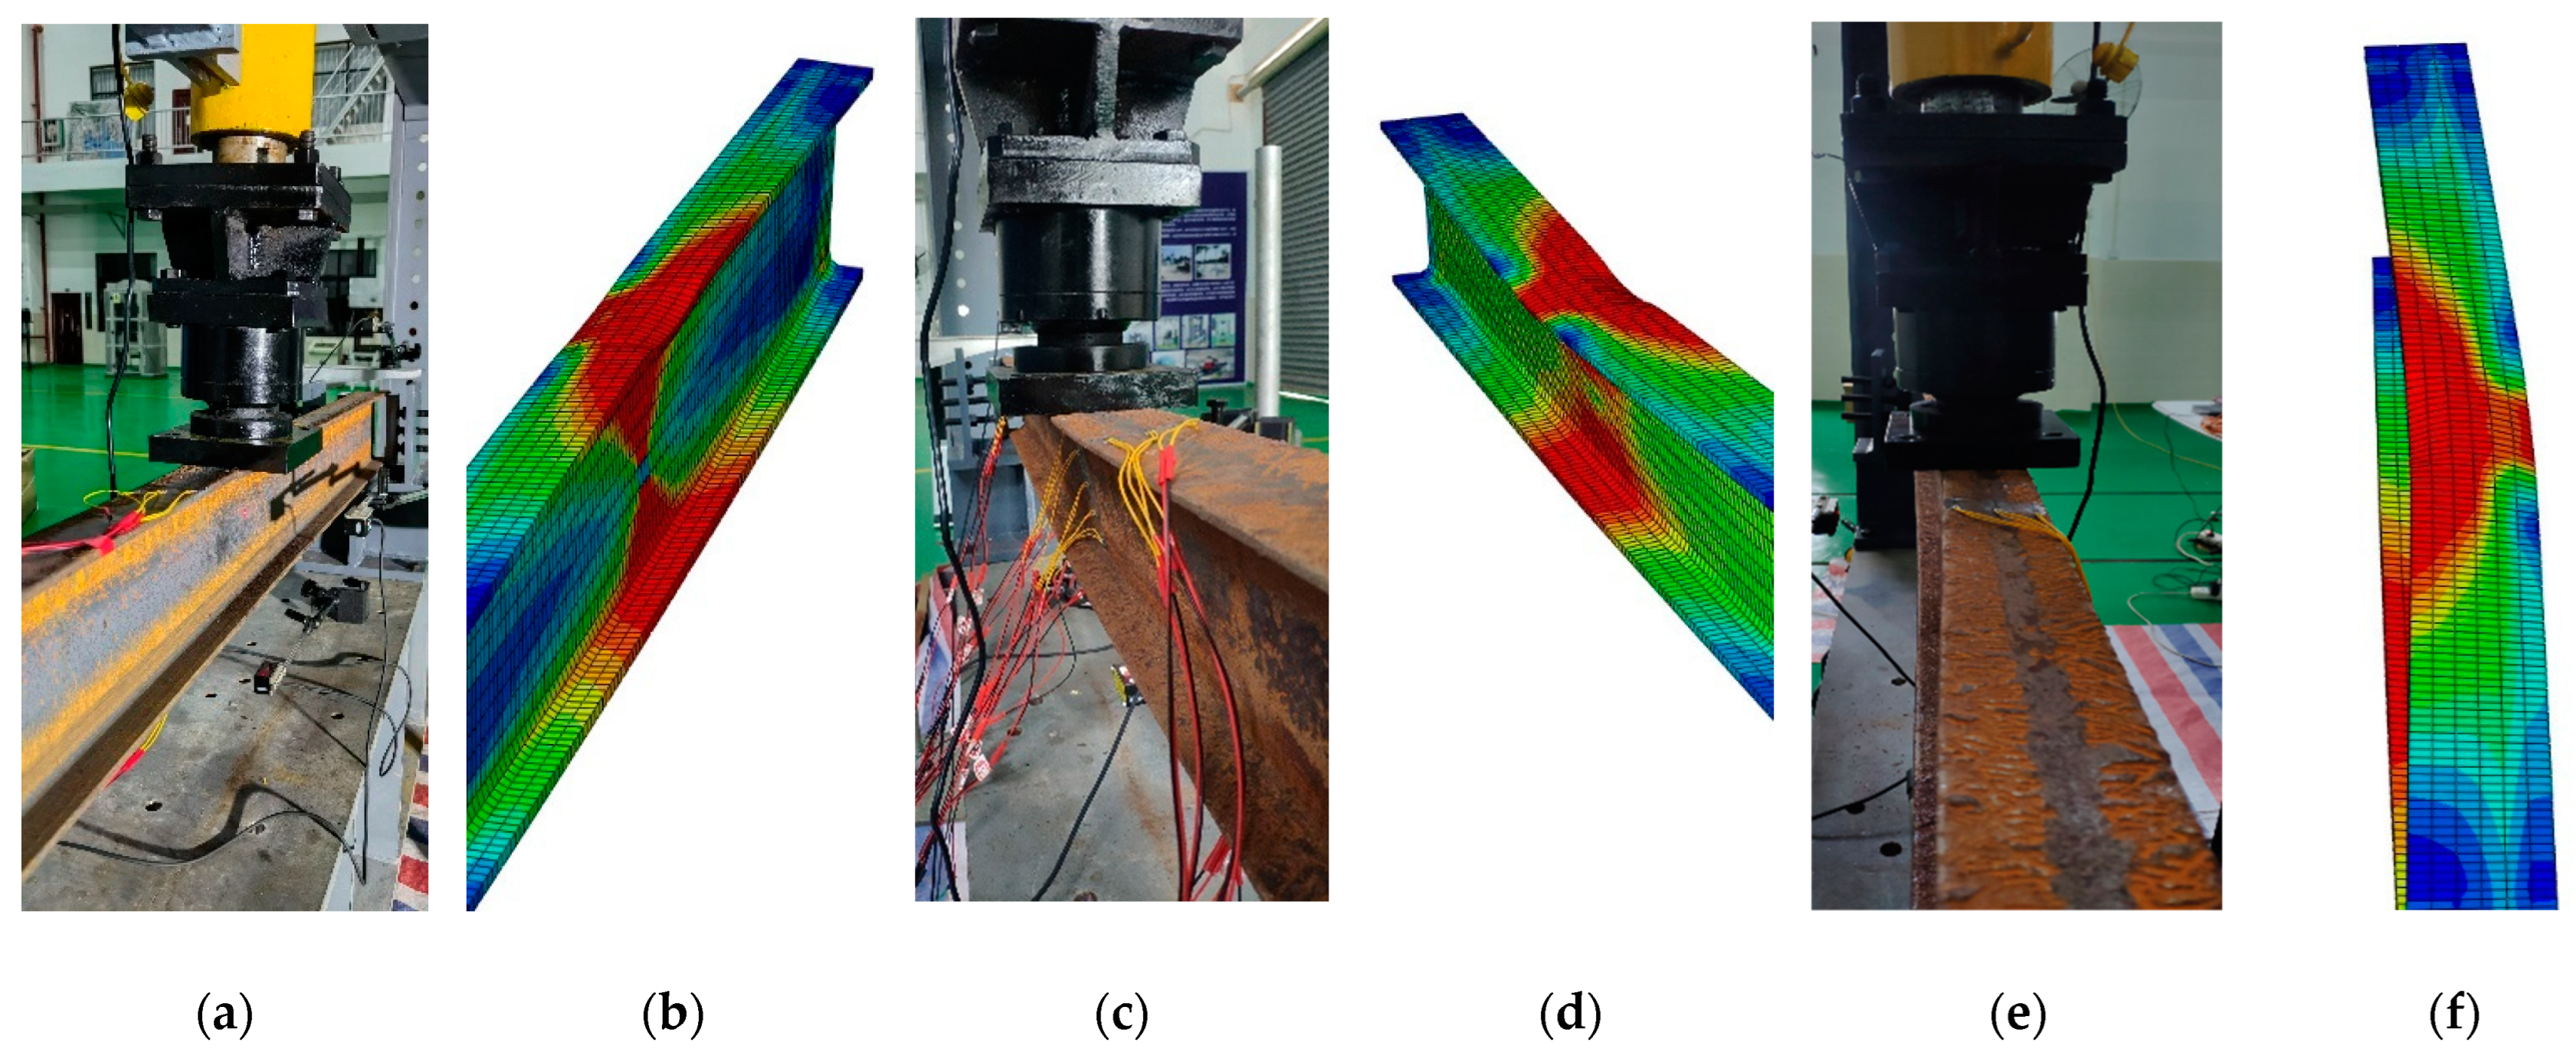
3.2.2. Overall Stability Test Phenomenon of the Corroded Steel Beams

A three-point loading test was conducted on the test beams, and all of the test beams were subjected to typical overall instability failure modes. As shown in Figure 10, the corrosion rates of the three groups of test beams did not influence their failure modes substantially. At the initial loading stage, the steel beams mainly suffered bending deformation in the web plane. This deformation could be monitored using displacement meters, in which the vertical displacement of the steel beam increased slowly, and the lateral displacement changed slightly. As the load was applied continuously, the steel beam was laterally displaced, and the displacement increased rapidly. At the later loading stage, the lateral displacement increased continuously, and torsion was observed. After reaching the critical state, the bearing capacity of the test beam decreased, whereas the lateral displacement and the torsion continuously increased. Finally, an obvious out-of-plane overall torsional buckling was observed. The test beams that were in group A2 experienced overall torsional buckling earlier than those of groups A0 and A1. This was owing to the increase in the corrosion rate that caused the strength, the stiffness, and the plasticity of the steel beams to reduce further, thereby reducing their overall stability and causing the overall torsional buckling to occur early. After unloading, most of the test beams were subjected to obvious residual deformation, as shown in Figure 11, which indicated that the test beams suffered overall instability in the elastic–plastic stage.

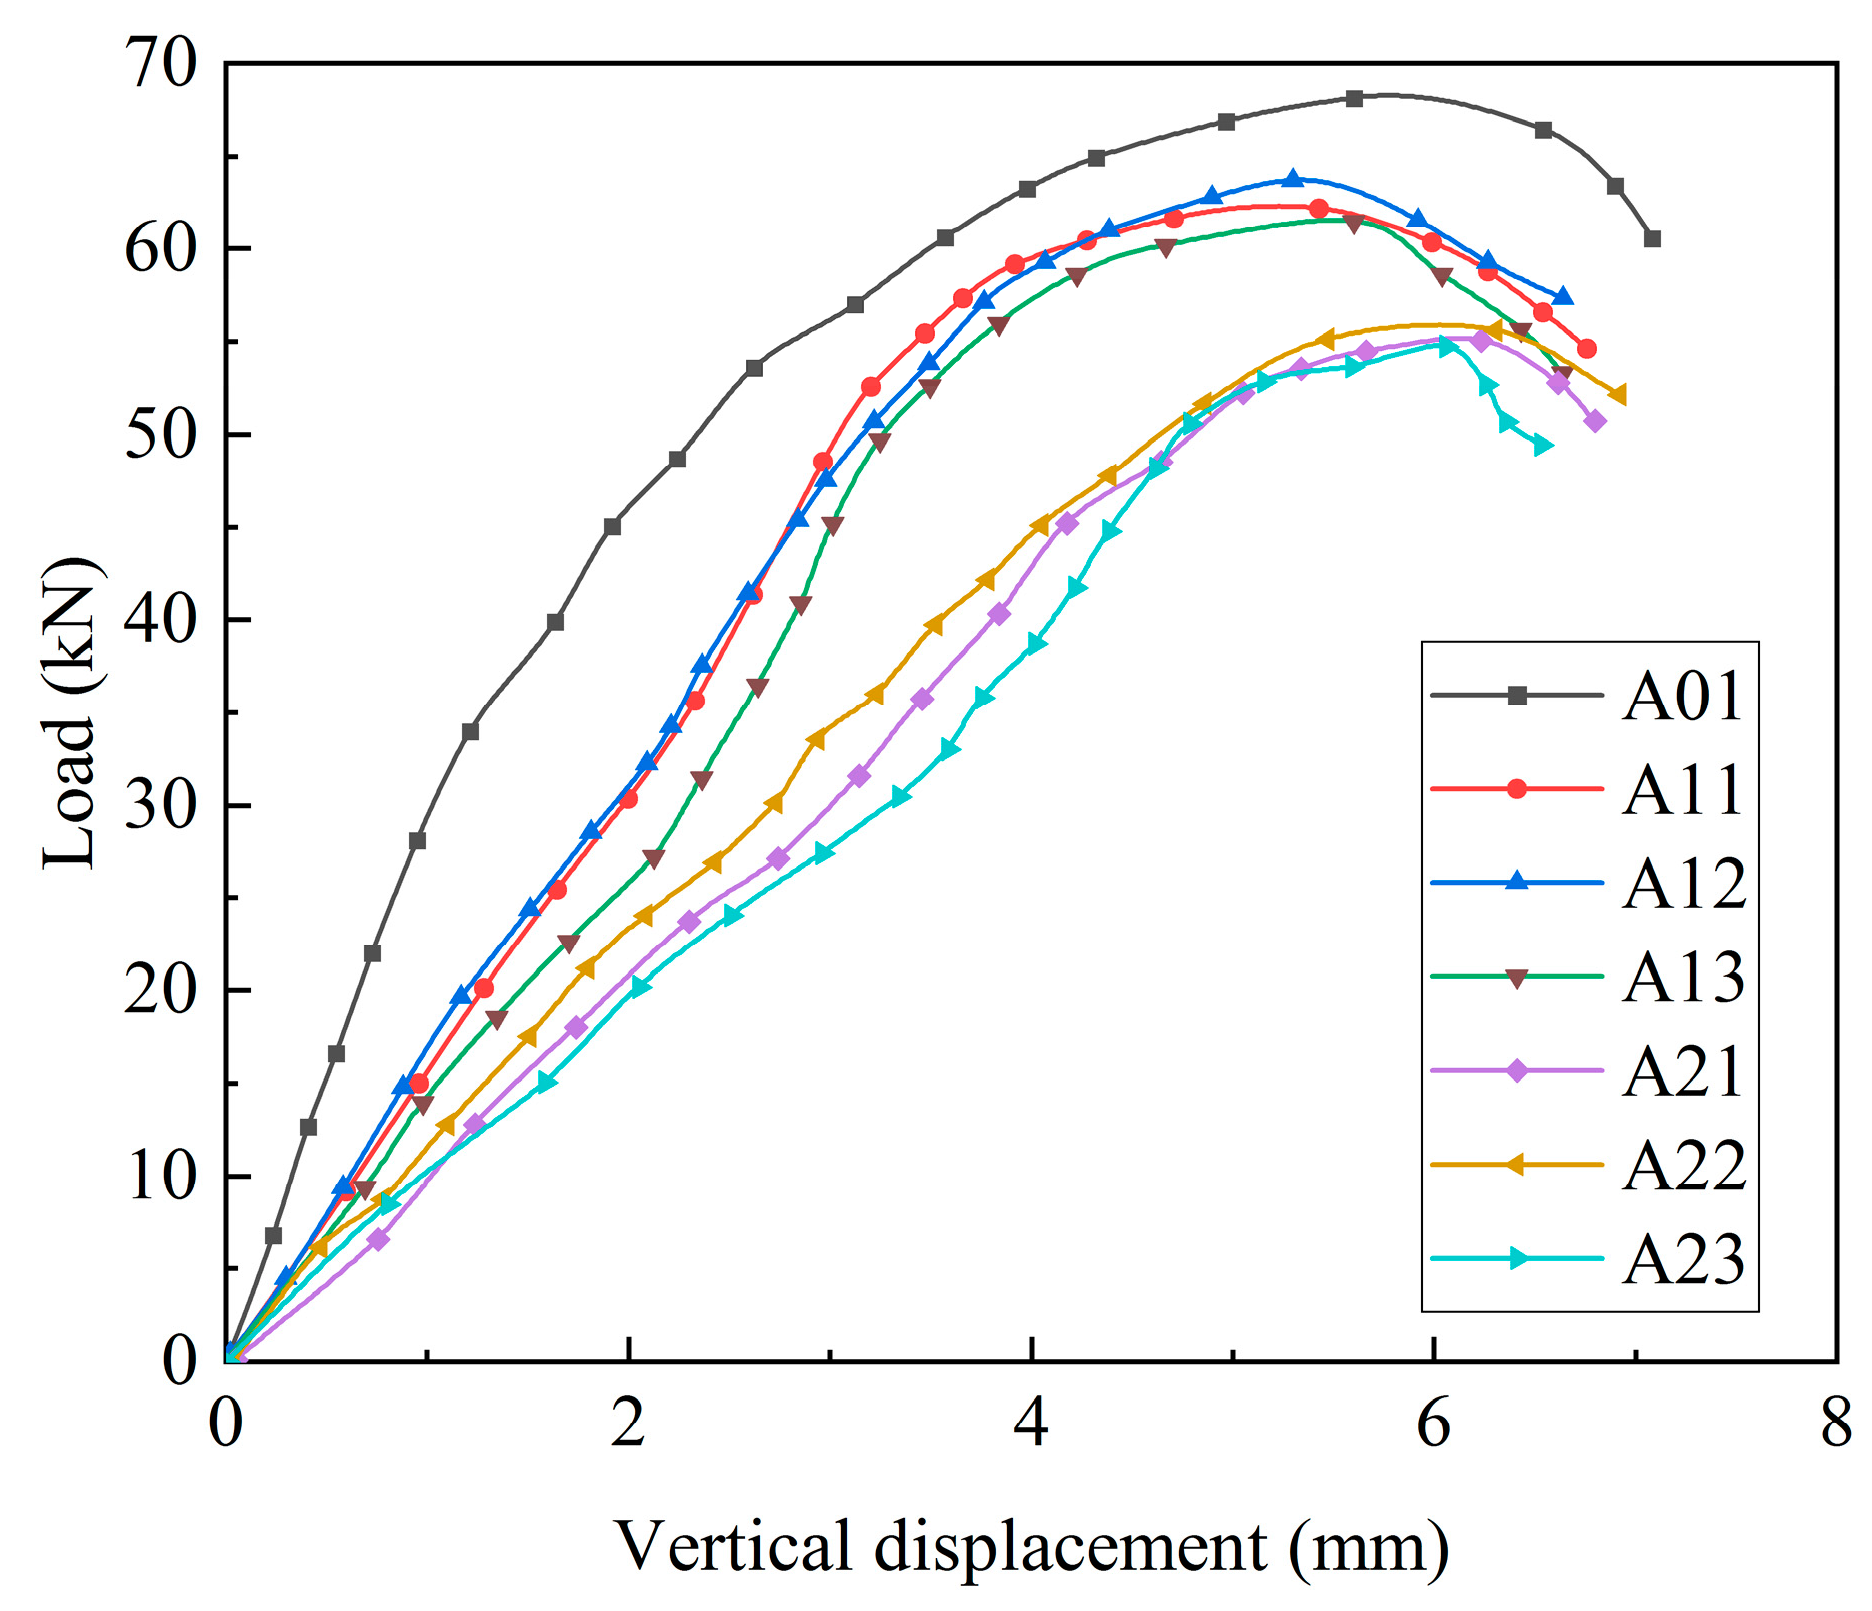
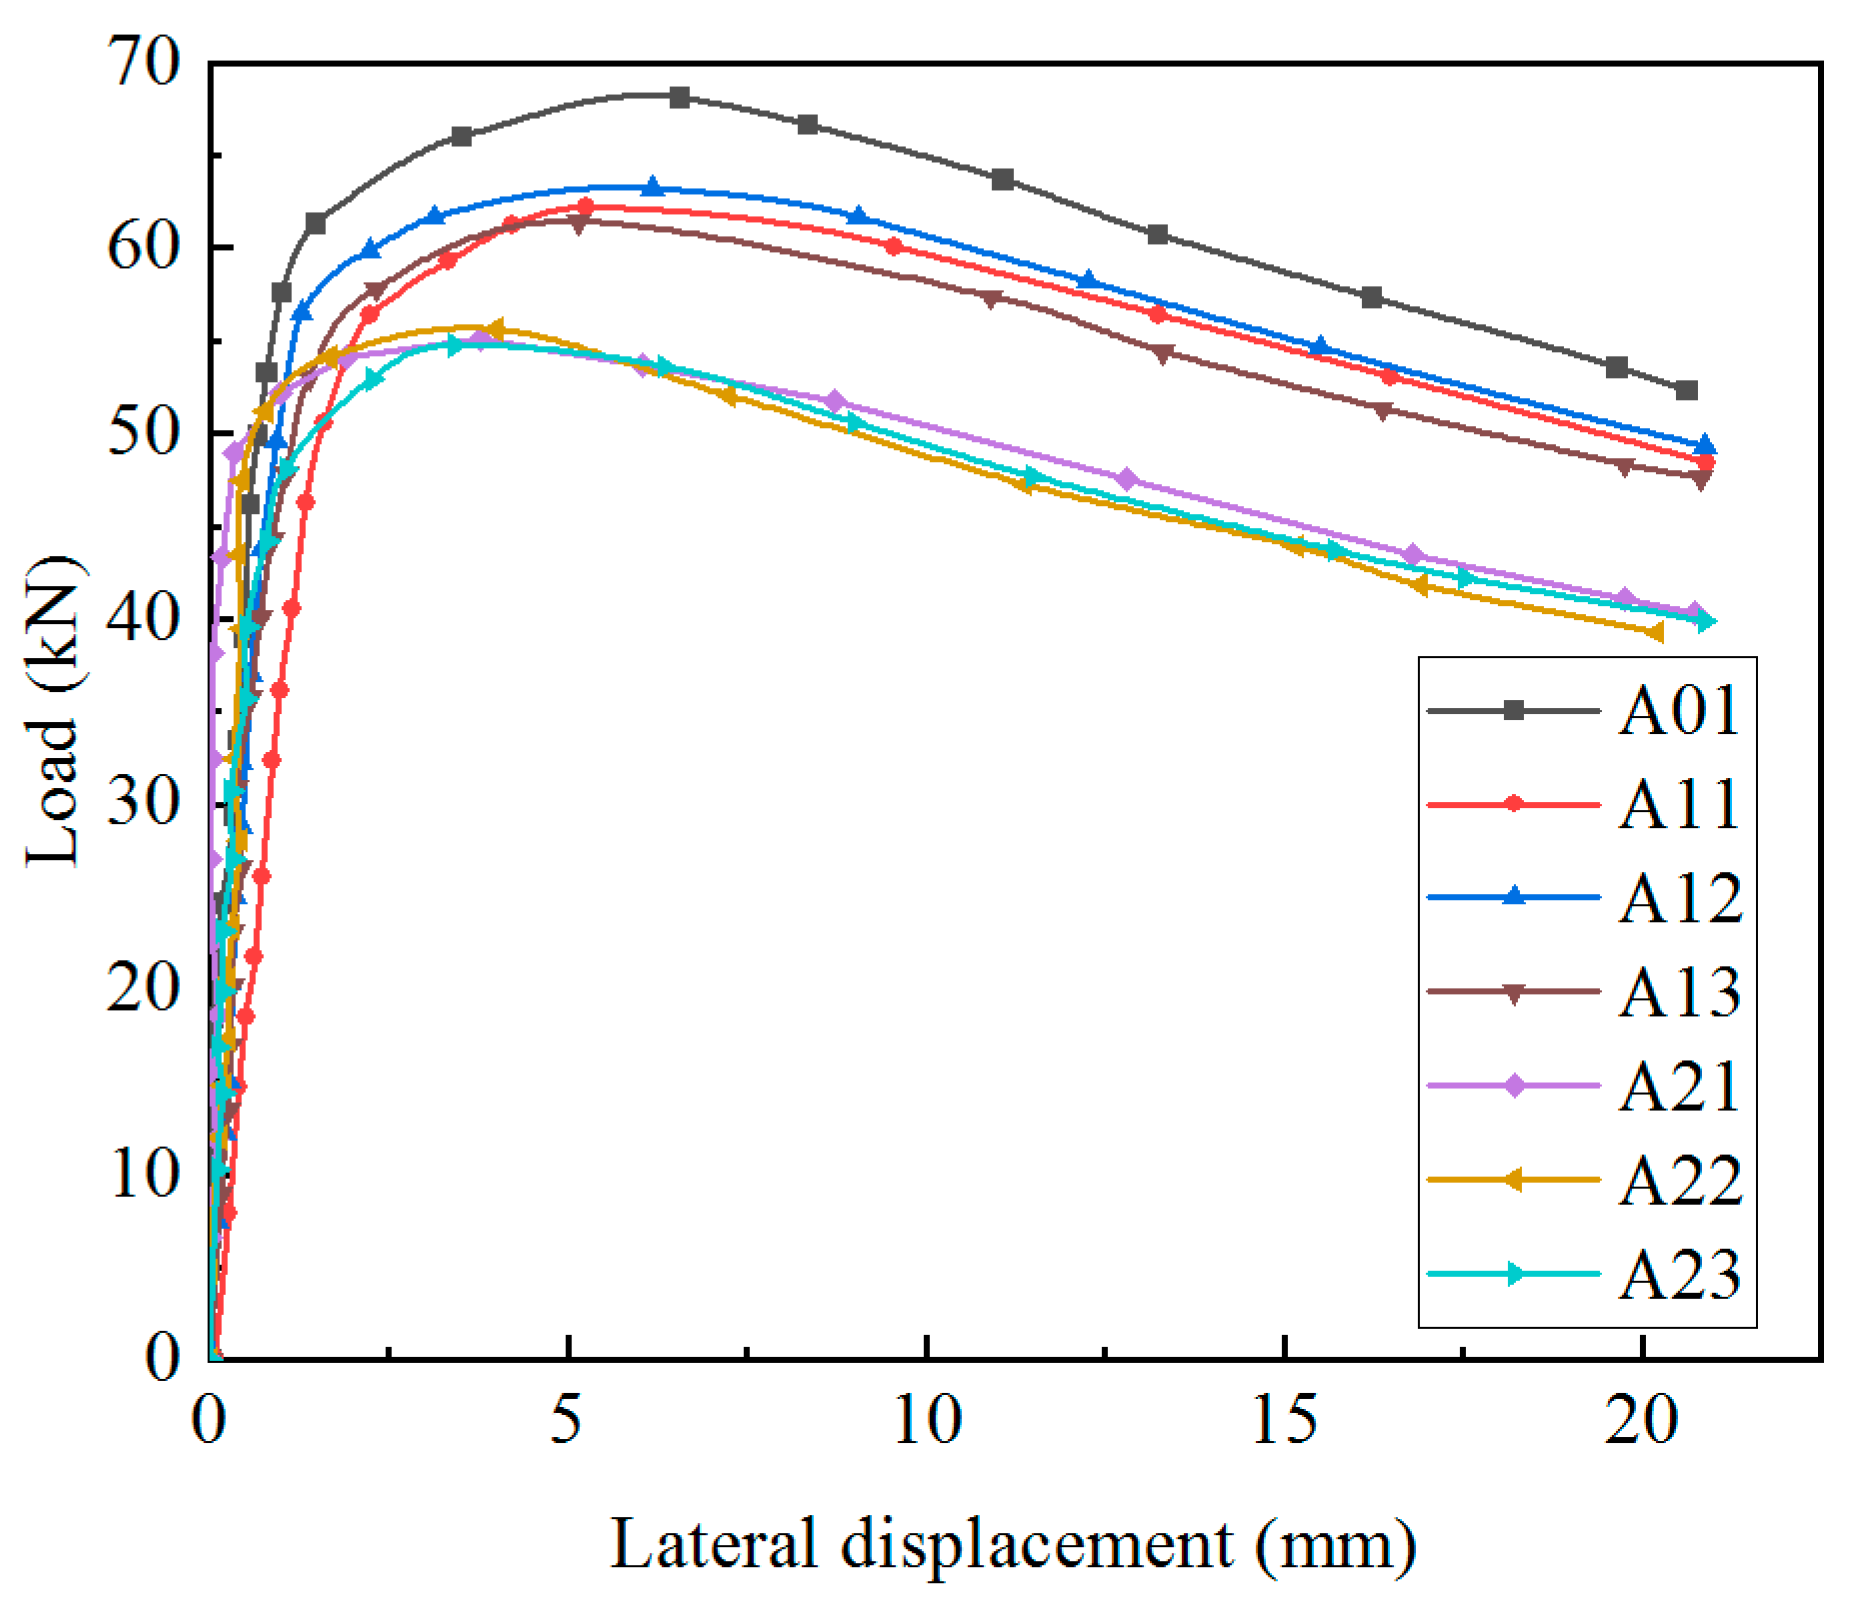
3.2.3. Analysis of the Load–Displacement Curves

Figure 12 and Figure 13 present the load–vertical displacement and the load–lateral displacement curves, respectively, of the three groups of the corroded steel beams. The figures show that the mid-span vertical displacements and the lateral displacements of the test beams increased with the continuous application of load during the loading process; additionally, the elastic working stages of the load-bearing steel beams decreased with the aggravation of corrosion. At the elastic working stage, the load–displacement curves exhibited a linear relationship and the mid-span vertical displacements increased further than the lateral displacements. At this stage, the test beams mainly suffered in-plane bending deformation, and almost no out-of-plane lateral bending or torsion occurred around the z-axis. With the increase in load, the test beams entered the elastic–plastic working stage, and the load and the displacement maintained a nonlinear increase relationship. The lateral displacements increased rapidly with the load, and the test beams experienced out-of-plane lateral deformation. After the load reached its peak value, the test beams entered the failure stage. With the attenuation of the load, the vertical and lateral displacements increased sharply. Simultaneously, the test beams lost their bearing capacities, experienced obvious out-of-plane torsional deformation, and were subjected to overall flexural–torsional buckling failure.
Table 4 lists the ultimate load Qexp and the corresponding ultimate moment Mexp of the test beams with different corrosion degrees. The table shows that the overall stability ultimate bearing capacities of the test beams decreased with an increase in the corrosion rate. When the average corrosion rate reached 5.46% and 11.50%, the overall stability ultimate bearing capacities reduced by 8.30% and 18.95%, respectively, which was a decrease of approximately 1.10 kN for every 1% of the corrosion rate. By comparing the load–vertical displacement curves of the test beams in groups A0, A1, and A2, the rate of change in displacement increased with the increase in the corrosion rate, which indicated that corrosion had a major impact on the stiffness values and the bearing capacities of the steel beams. The comparison between the load–lateral displacement curves revealed that, with the increase in the corrosion rate, the lateral displacements corresponding to the peak load declined. This was because corrosion weakened the plastic deformation abilities of the steel beams, which caused the three-point bending beams to suffer flexural–torsional buckling early, and the overall stability ultimate bearing capacities were reduced. More specifically, corrosion negatively impacted the overall stability of the rolled H-shaped steel beams.

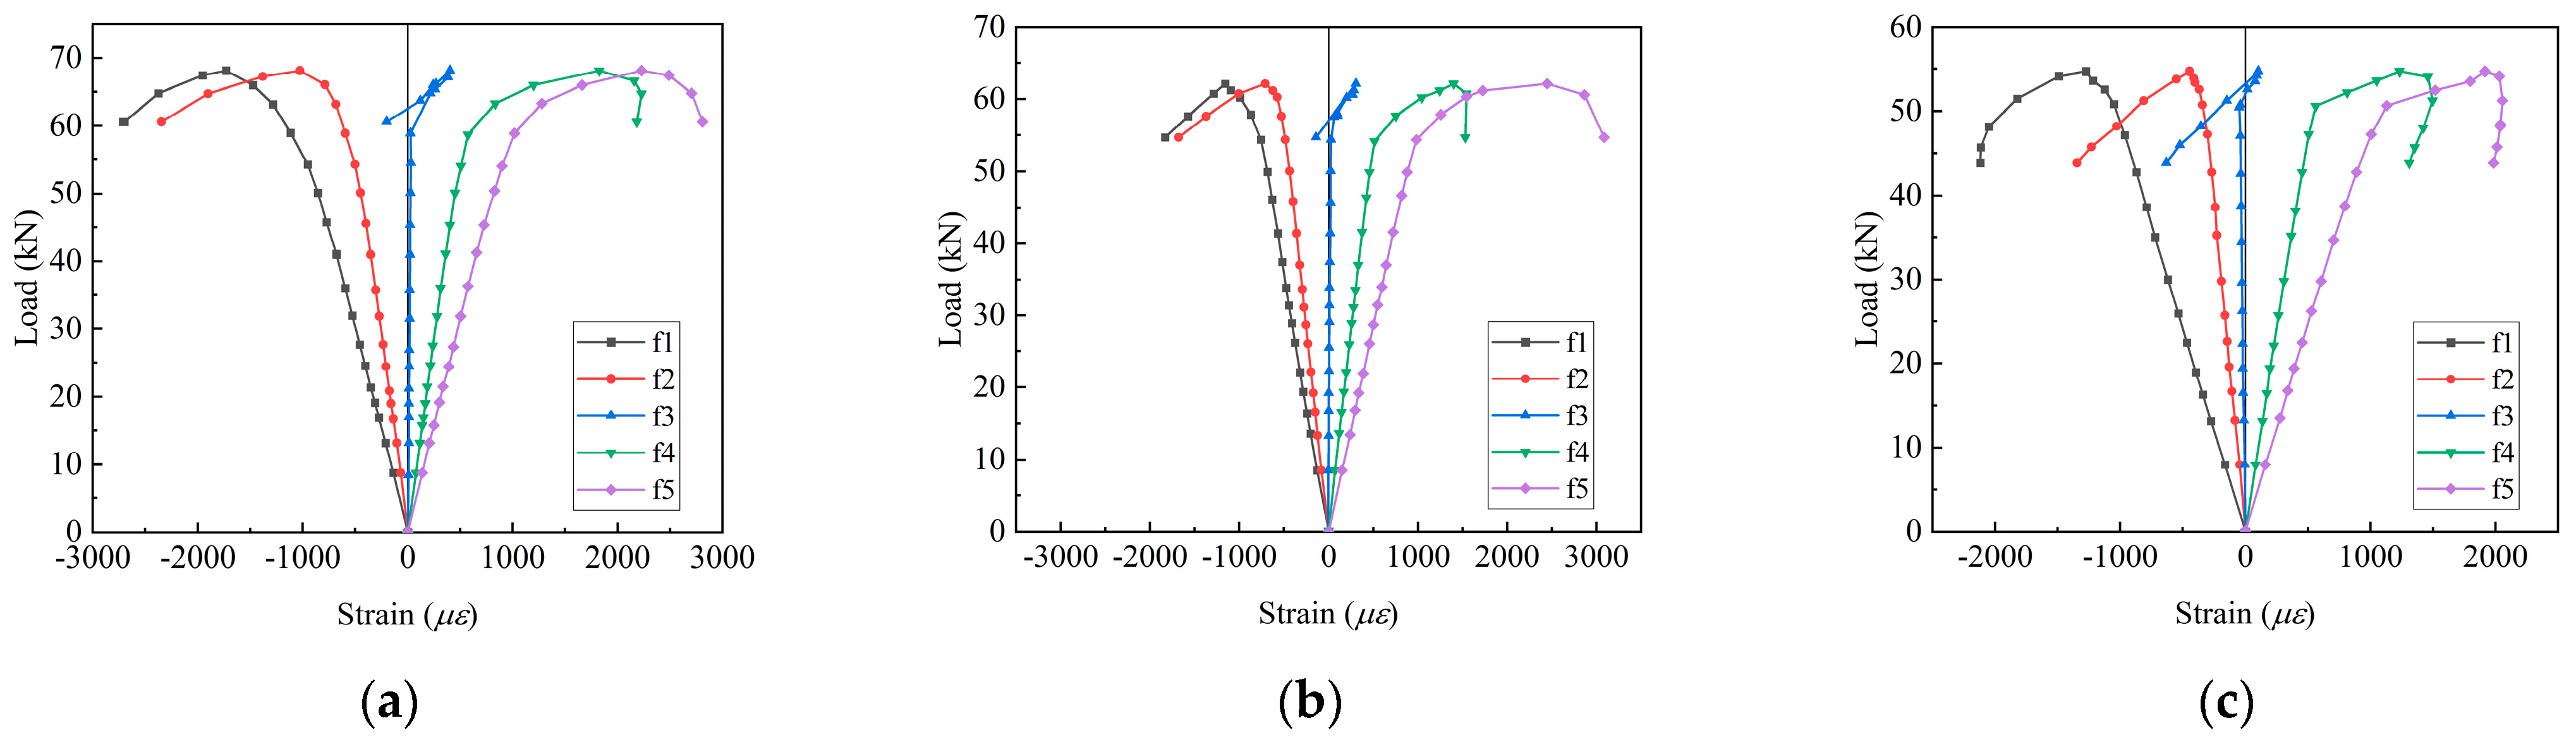
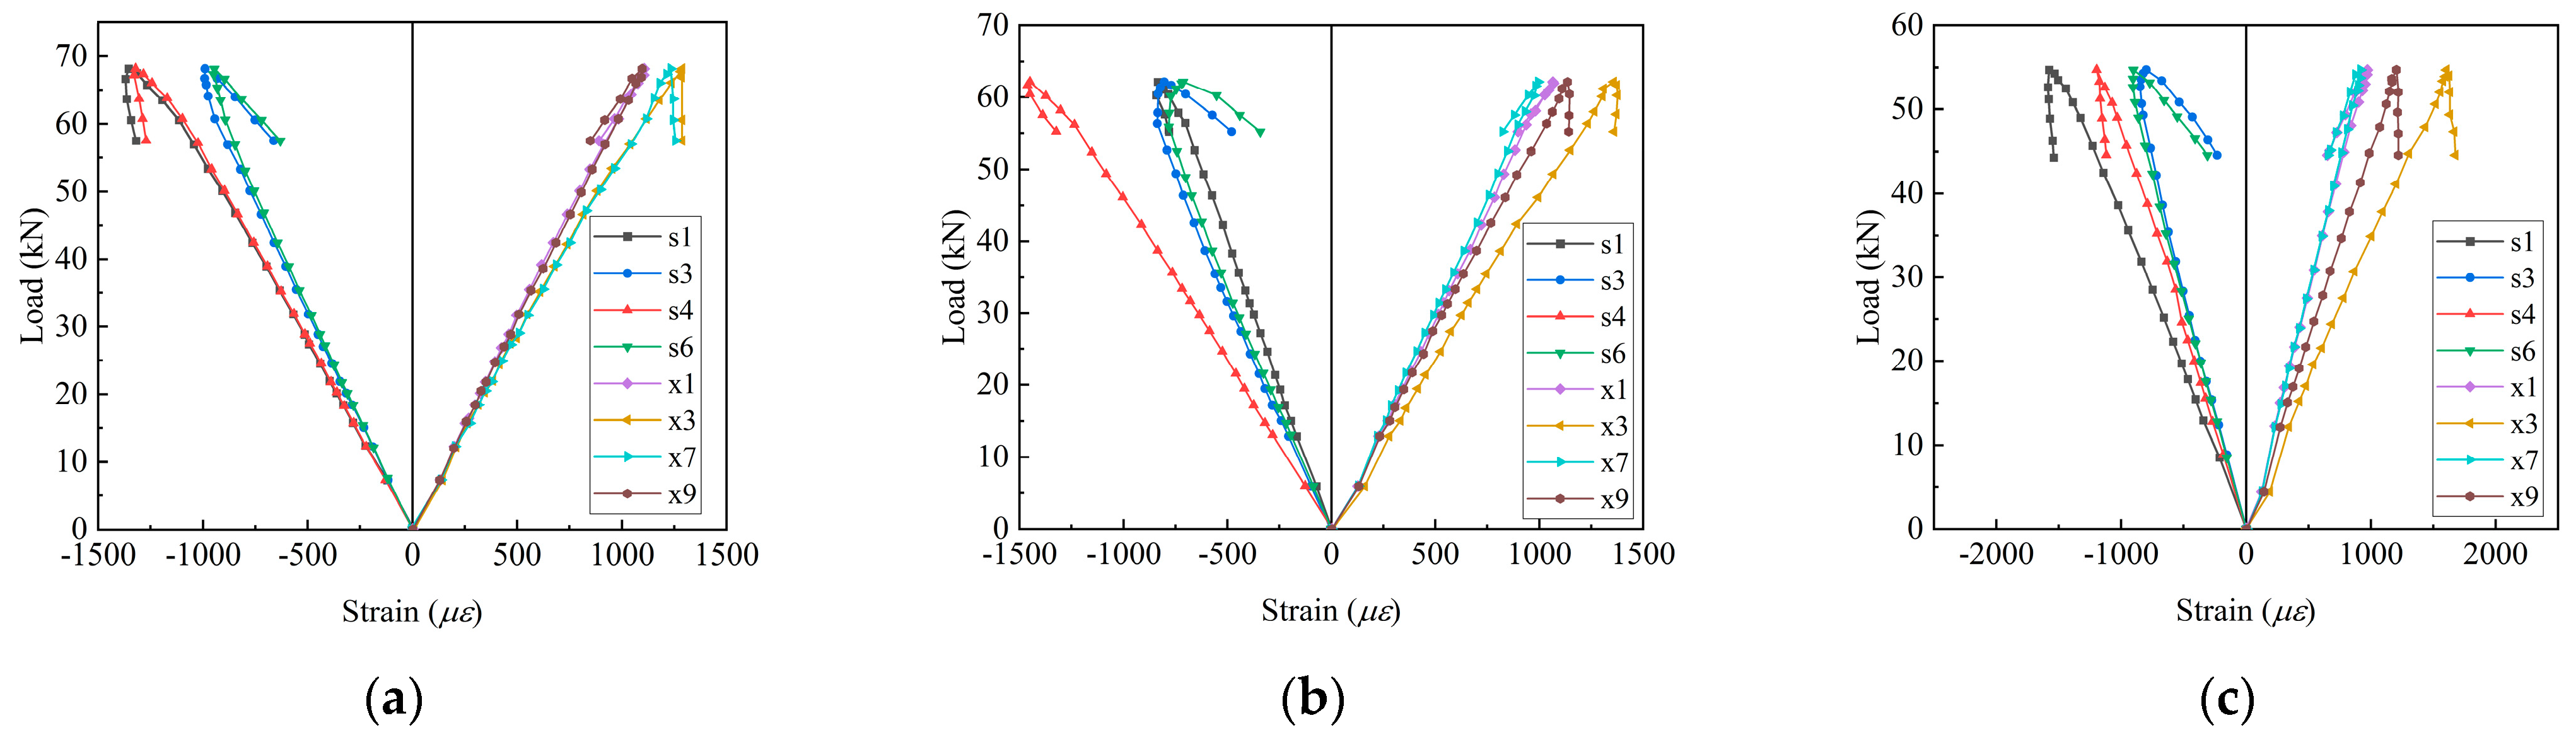
3.2.4. Analysis of Load–Strain Curves

The test beams A01, A11, and A23 were used as examples for the analysis, and the load–strain curves of their webs and flanges are shown in Figure 14 and Figure 15, respectively. During the initial loading period, the test beams were in the elastic working stage, and the strains at all of the web and flange measuring points of the test beams were linearly correlated with the load. Before the buckling of the mid-span section, the strain at the web mid-span measuring point f3 tended to zero, which complied with the plane-section assumption. With the continuous increase in the load, the test beams began to gradually bend laterally and the compressive strain values at the upper flange measuring points s1, s3, s4, and s6 increased. Additionally, the tensile strain values at the lower flange measuring points x1, x3, x7, and x9 increased. During the later loading period, the strain values at measuring points f1 and f2 in the compression zone and f4 and f5 in the tensile zone of the web increased rapidly, and the strains at the symmetrical measuring points at both ends of the upper and lower flanges diverged. In addition, during the declining stage of the bearing capacity, the flange strain increased slightly and even decreased. This was because the test beams were subjected to lateral bending and torsion, and with the aggravation of deformation and the increase in the warping stress, the strain at measuring points s1, s3, s4 and s6 changed greatly. The upper flanges of the test beams that were under compression suffered lateral bending first, and the specimens were twisted around the z-axis under the conditions of overall instability, which further led to the lateral deformation of the lower flanges. Therefore, the strain value at the lower flange measuring point had less changes compared with that at the upper flange measuring point.
Additionally, the increase in the corrosion rate resulted in mass loss and the reduction in the sectional area of the steel beams, which further caused a considerable decline in the flexural–torsional performance of the specimens and the occurrence of overall flexural–torsional buckling. The load–strain curves of the symmetrical measuring points on the flanges of the uncorroded test beams were close. However, local corrosion pits on the surface of the corroded test beams were uneven in depth and distribution, which resulted in an inconsistency in the degradation degree of the local steel properties at the symmetrical measuring points, and further caused a difference in the load–strain curves.

3.2.5. Comparison of Test Results and Relevant Codes of Various Countries

In order to better evaluate the overall stability bearing capacity of corroded steel beams, the overall stability bearing capacity of the test beams under the action of concentrated force in the mid-span was determined by calculation methods in the relevant codes. The material mechanical property parameters of the corroded test beams were taken from Table 3, and the section parameters were subjected to reduction according to the uniform corrosion in calculation [37]. In addition, the calculated design values were compared with the relevant test values, as shown in Table 5.
(1)
The Chinese code GB 50017-2017 [38] adopts the overall stability coefficient for calculation, and the calculation of the overall stability ultimate bearing capacity of bending members is based on Formula (8) as follows:
M x φ b W x f
where M x is the design value of the maximum bending moment, W x is the gross section modulus of the beams, and φ b is the overall stability coefficient of the beams.
In the code, the overall stability coefficient φ b of rolled H-shaped simple steel beams with a biaxial symmetrical section can be calculated according to the following formula:
φ b = β b 4320 λ y 2 A h W x [ 1 + ( λ y t 1 4.4 h ) 2 ] 235 f y
where λ y is the slenderness ratio for winding around the minor axis, and β b is the equivalent bending moment coefficient, which can be specifically calculated according to Appendix C of GB 50017-2017. A is the gross sectional area, h is the sectional height, and t1 is the thickness of the compression flange.
When φ b > 0.6 according to Formula (9), it should be replaced by φ b in Formula (10) as follows:
φ b = 1.07 0.282 φ b 1.0
Then, the overall stability ultimate bearing capacity of rolled H-shaped steel beams can be calculated as follows:
M x = φ b W x f y
(2)
In European code EN 1993–2005 [39], there are four classes of cross sections according to the width–thickness ratio, and the test members that have been selected in this paper are Class-1 cross section. The formula for calculating the overall stability ultimate bearing capacity of bending members is as follows:
M x χ LT W x f y
where W x is the section modulus, the plastic section modulus of full-section yield is taken for Class 1–2 cross sections, and χ LT is the flexural–torsional buckling reduction factor.
In the code, the following formula can be adopted for calculation for the rolled or equivalent welded sections:
χ LT = 1 ϕ LT + ϕ LT 2 β ƛ LT 2 min ( 1.0 , 1 ƛ LT 2 )
where
ϕ LT = 0.5 1 + α LT ( ƛ LT ƛ LT , 0 ) + β ƛ LT 2
ƛ LT = W x f y M cr
where M cr is the elastic critical moment for lateral–torsional buckling. In the code, the curves are divided into four types, i.e., a, b, c, and d, according to the class and height–width ratio of the cross sections. For rolled H-shaped members with h / b 2 , the curve parameters are determined according to the type-b curve, that is, imperfection factor α LT = 0.34 , the plateau length of the lateral–torsional buckling curves for rolled sections ƛ LT , 0 = 0.4 , and the correction factor for the lateral–torsional buckling curves for rolled sections β = 0.75 .
When this method is adopted for calculation, the flexural–torsional buckling reduction factor needs to be corrected as follows:
χ LT , mod = χ LT f 1.0
f = 1 0.5 ( 1 k c ) [ 1 2.0 ( ƛ LT 0.8 ) 2 ] 1.0
In the code, the correction factor for moment distribution k c is 0.86 under the action of concentrated load in the mid-span.
(3)
American code ANSI/AISC360-2016 [40] adopts the load and resistance factor design method for the design and the calculation of the overall stability of bending members. In the code, limit state formulas of the three classes of the cross sections are provided, including compact and noncompact or slender-element sections respectively. For the biaxial symmetrical thick I-shaped cross section, Formula (18) should be employed for calculation as follows:
M x ϕ b M n
where ϕ b is the resistance factor for flexure, and the constant value is 0.9. For M n , according to the relationship among l y , l p , and l r , the lateral flexural–torsional buckling of bending members falls into three cases. In this paper, the members belong to the second case, that is, l p < l y < l r , and the elastic–plastic lateral flexural–torsional buckling of members can be specifically calculated as follows:
M n = C b [ M p ( M p 0.7 W x f y ) ( l y l p l r l p ) ] M p
M p = W px f y
where W px is the plastic section modulus, W x is the elastic section modulus, l y is the length of the segment without lateral support, C b is the flexural–torsional buckling correction factor for the supported segment with uneven bending moment distribution, l p is the limiting laterally unbraced length for the limit state of yielding, and l r is the limiting unbraced length for the limit state of inelastic lateral–torsional buckling.
l p and l r can be determined based on the following formula:
l p = 1.76 i y E / f y
l r = 1.95 i r E 0.7 f y I t W x h 0 + ( I t W x h 0 ) 2 + 6.67 ( 0.7 f y E ) 2
i r 2 = I y C w W x
C w = I y h 0 2 4
where h 0 is the distance between the flange centroids, i y is the radius of gyration, i r is the effective radius of gyration, I t is the torsional constant, I y is the moment of inertia, and C w is the warping constant.
Flexural–torsional buckling correction factor C b can be calculated according to Formula (25) as follows:
C b = 12.5 M max 0.5 M max + 3 M A + 4 M B + 3 M C 3.0
where M max is the absolute value of the maximum moment in the unbraced segment, M A is the absolute value of the moment at the quarter point of the unbraced segment, M B is the absolute value of the moment at the centerline of the unbraced segment, and M C is the absolute value of the moment at the three-quarter point of the unbraced segment.
According to the comparison values between the test results that are presented in Table 5 and the relevant codes, the calculated values that are based on Chinese code GB 50017-2017, European code EN 1993–2005, and American code ANSI/AISC 360-16 are all smaller than the test values of groups A0, A1, and A2; that is, the calculated results that are based on the relevant codes of various countries tend to be safe. The ratio of the test values to uncorroded specimens and the calculated values based on GB 50017-2017 is 1.198, while the ratios to the calculated values based on EN 1993–2005 and ANSI/AISC 360-16 are 1.104 and 1.082, respectively. The results reveal that the calculated results that are based on GB 50017-2017 are the most conservative, while those that are based on BS EN 1993-1-1 and ANSI/AISC 360-16 are slightly conservative but relatively close. Therefore, the three methods can all be employed for the overall stability design of Q235 rolled H-shaped steel beams. For corroded specimens, the average ratio of the test values to the calculated values based on ANSI/AISC 360-16 is 1.080; therefore, the calculation method that is based on ANSI/AISC 360-16 can be adopted in order to roughly estimate the overall stability ultimate bearing capacity of Q235 corroded rolled H-shaped steel beams.

4. Finite Element Model Calculation

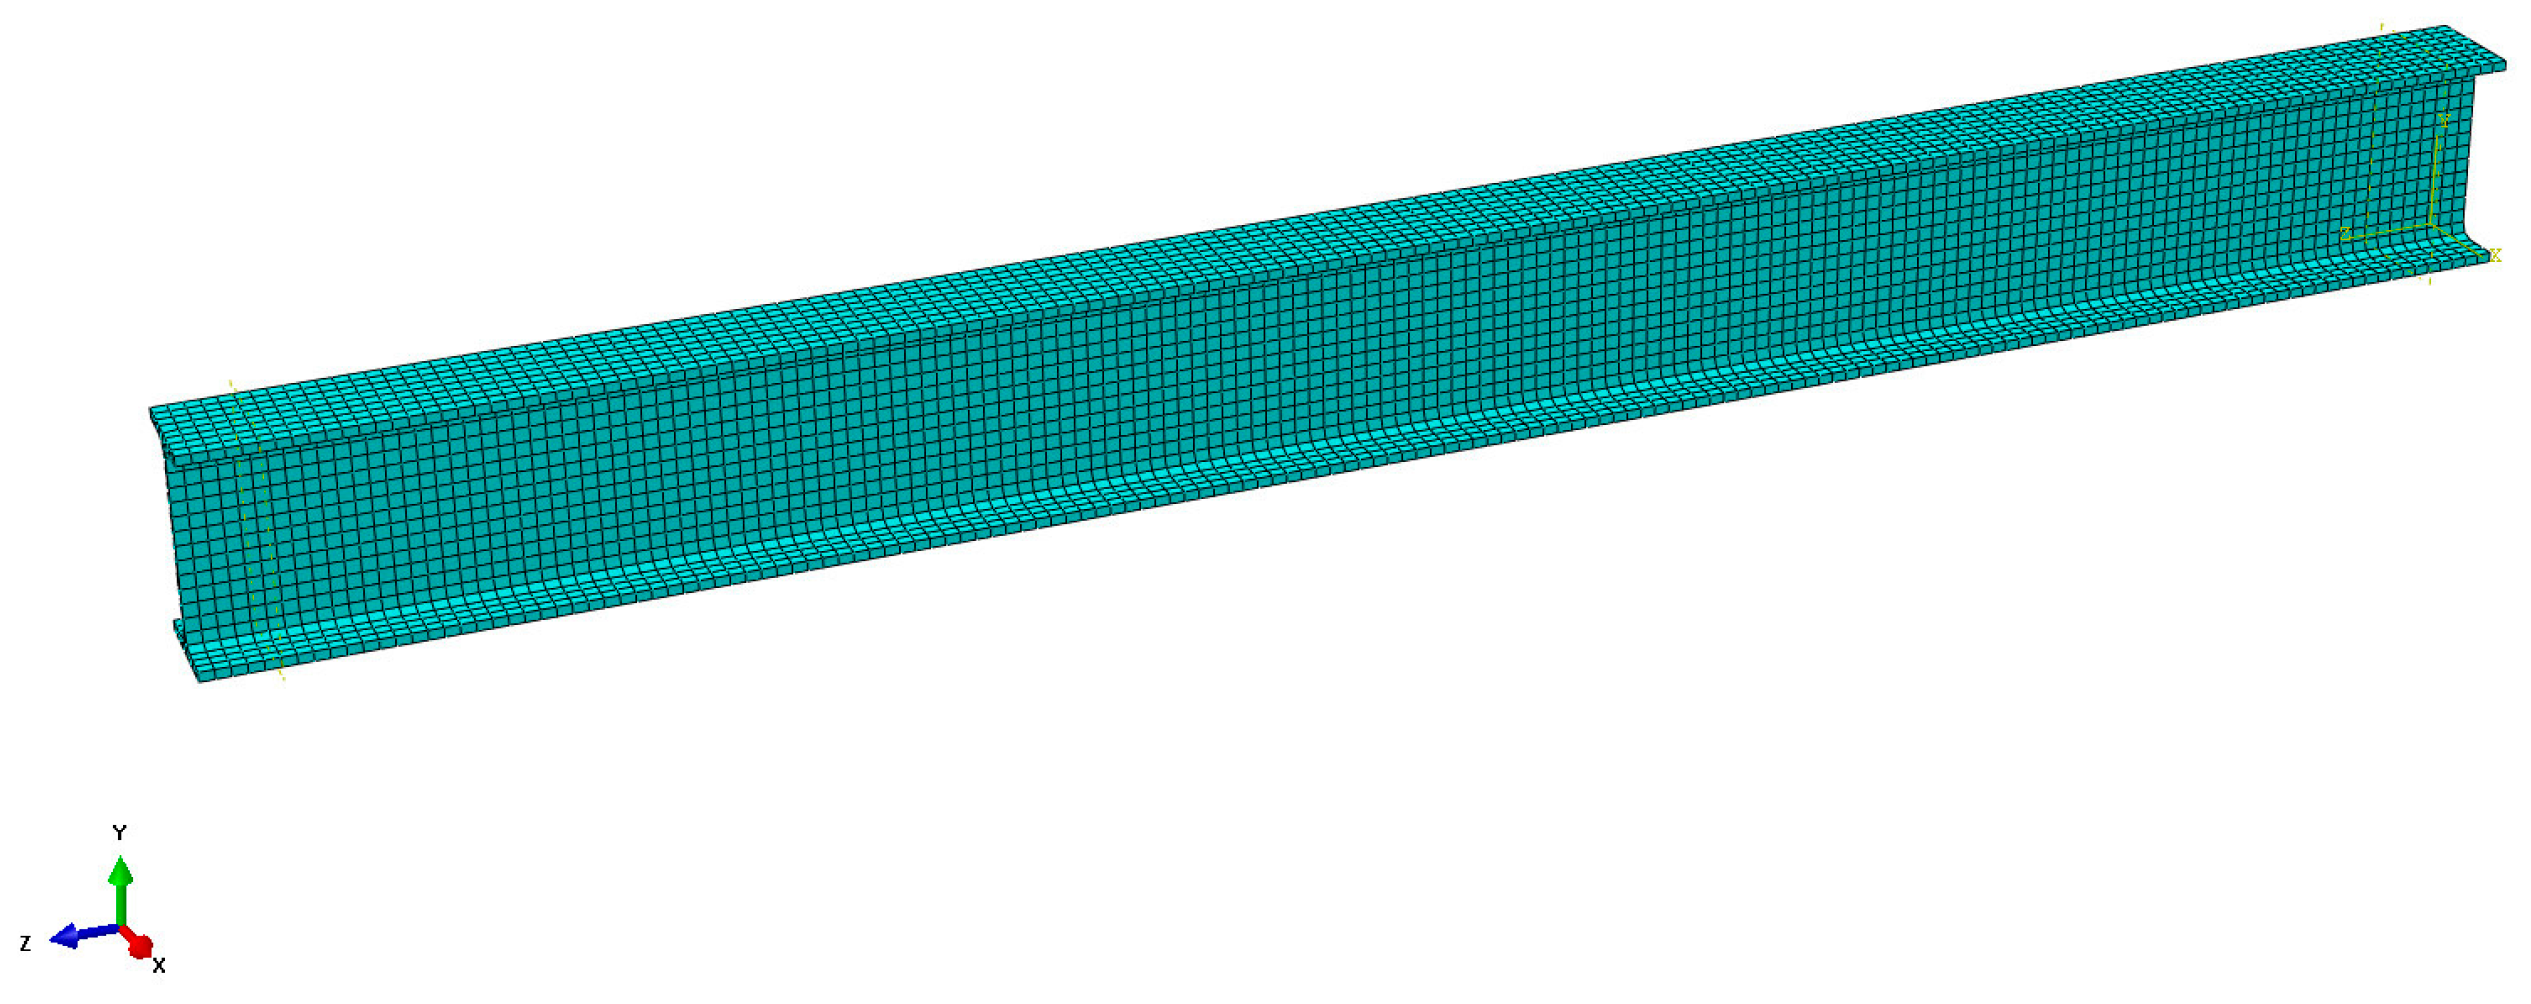
4.1. Finite Element Modelling of the Corroded Steel Beams

The finite element analysis software ABAQUS [41] was applied for numerical simulation and calculation in order to further study and validate the degradation law of the overall stability ultimate bearing capacity of corroded rolled H-shaped steel beams that were subjected to three-point bending. The C3D8R three-dimensional solid element was used for the model. This solid element had eight nodes, and each node contained three linearly reduced integration elements with translational degrees of freedom. Additionally, the applied method was suitable for the analysis of the buckling and the distortional deformation of the structures. Furthermore, the displacement solutions were highly accurate, and the model was not prone to shear locking under the action of flexural loading. Therefore, this method could be suitably applied for the solution analysis of large deformations of the model. After sensitivity analysis and the comprehensive consideration of the calculation accuracy and the workload, the mesh size of the model was finally determined to be 12 mm, as shown in Figure 16. In this study, the following two methods were employed in order to explore the influence of corrosion on the steel beam specimens: (1) uniform reduction in the sectional dimension, that is, only the reductions in the sectional dimensions of the steel beams that were caused by corrosion were considered and (2) double-reduction, that is, the mechanical properties of the material and the sectional dimensions of the steel beams were considered for exploring the actual influence of corrosion. Additionally, the yield strengths and the elastic moduli of the steel beams were calculated using Equations (5) and (6). Furthermore, the Poisson’s ratio υ of the material was 0.3, the reduction in the sectional fillet size was ignored, and the dimensions of the flange and the web were reduced uniformly and, as a whole, according to the measured corrosion rate and the calculation method of the sectional reduction that was reported in [37]. Table 6 presents a comparison between the test and the numerical simulation results of the two reduction methods. The constraints in the numerical model were treated according to the actual support constraints in the test. More specifically, the y-direction and z-direction displacements were constrained at one end of the lower flanges of the beams, the y-direction displacement was constrained at the other end, and the x-direction displacements of 16 points were constrained on both sides of the upper and lower flanges at the beam ends. Additionally, the loads were applied at the positions corresponding to the test, as shown in Figure 17. Furthermore, an initial bending of l/1000 was introduced as the initial geometric defect of the members, and subsequently, a buckling risk analysis was conducted.

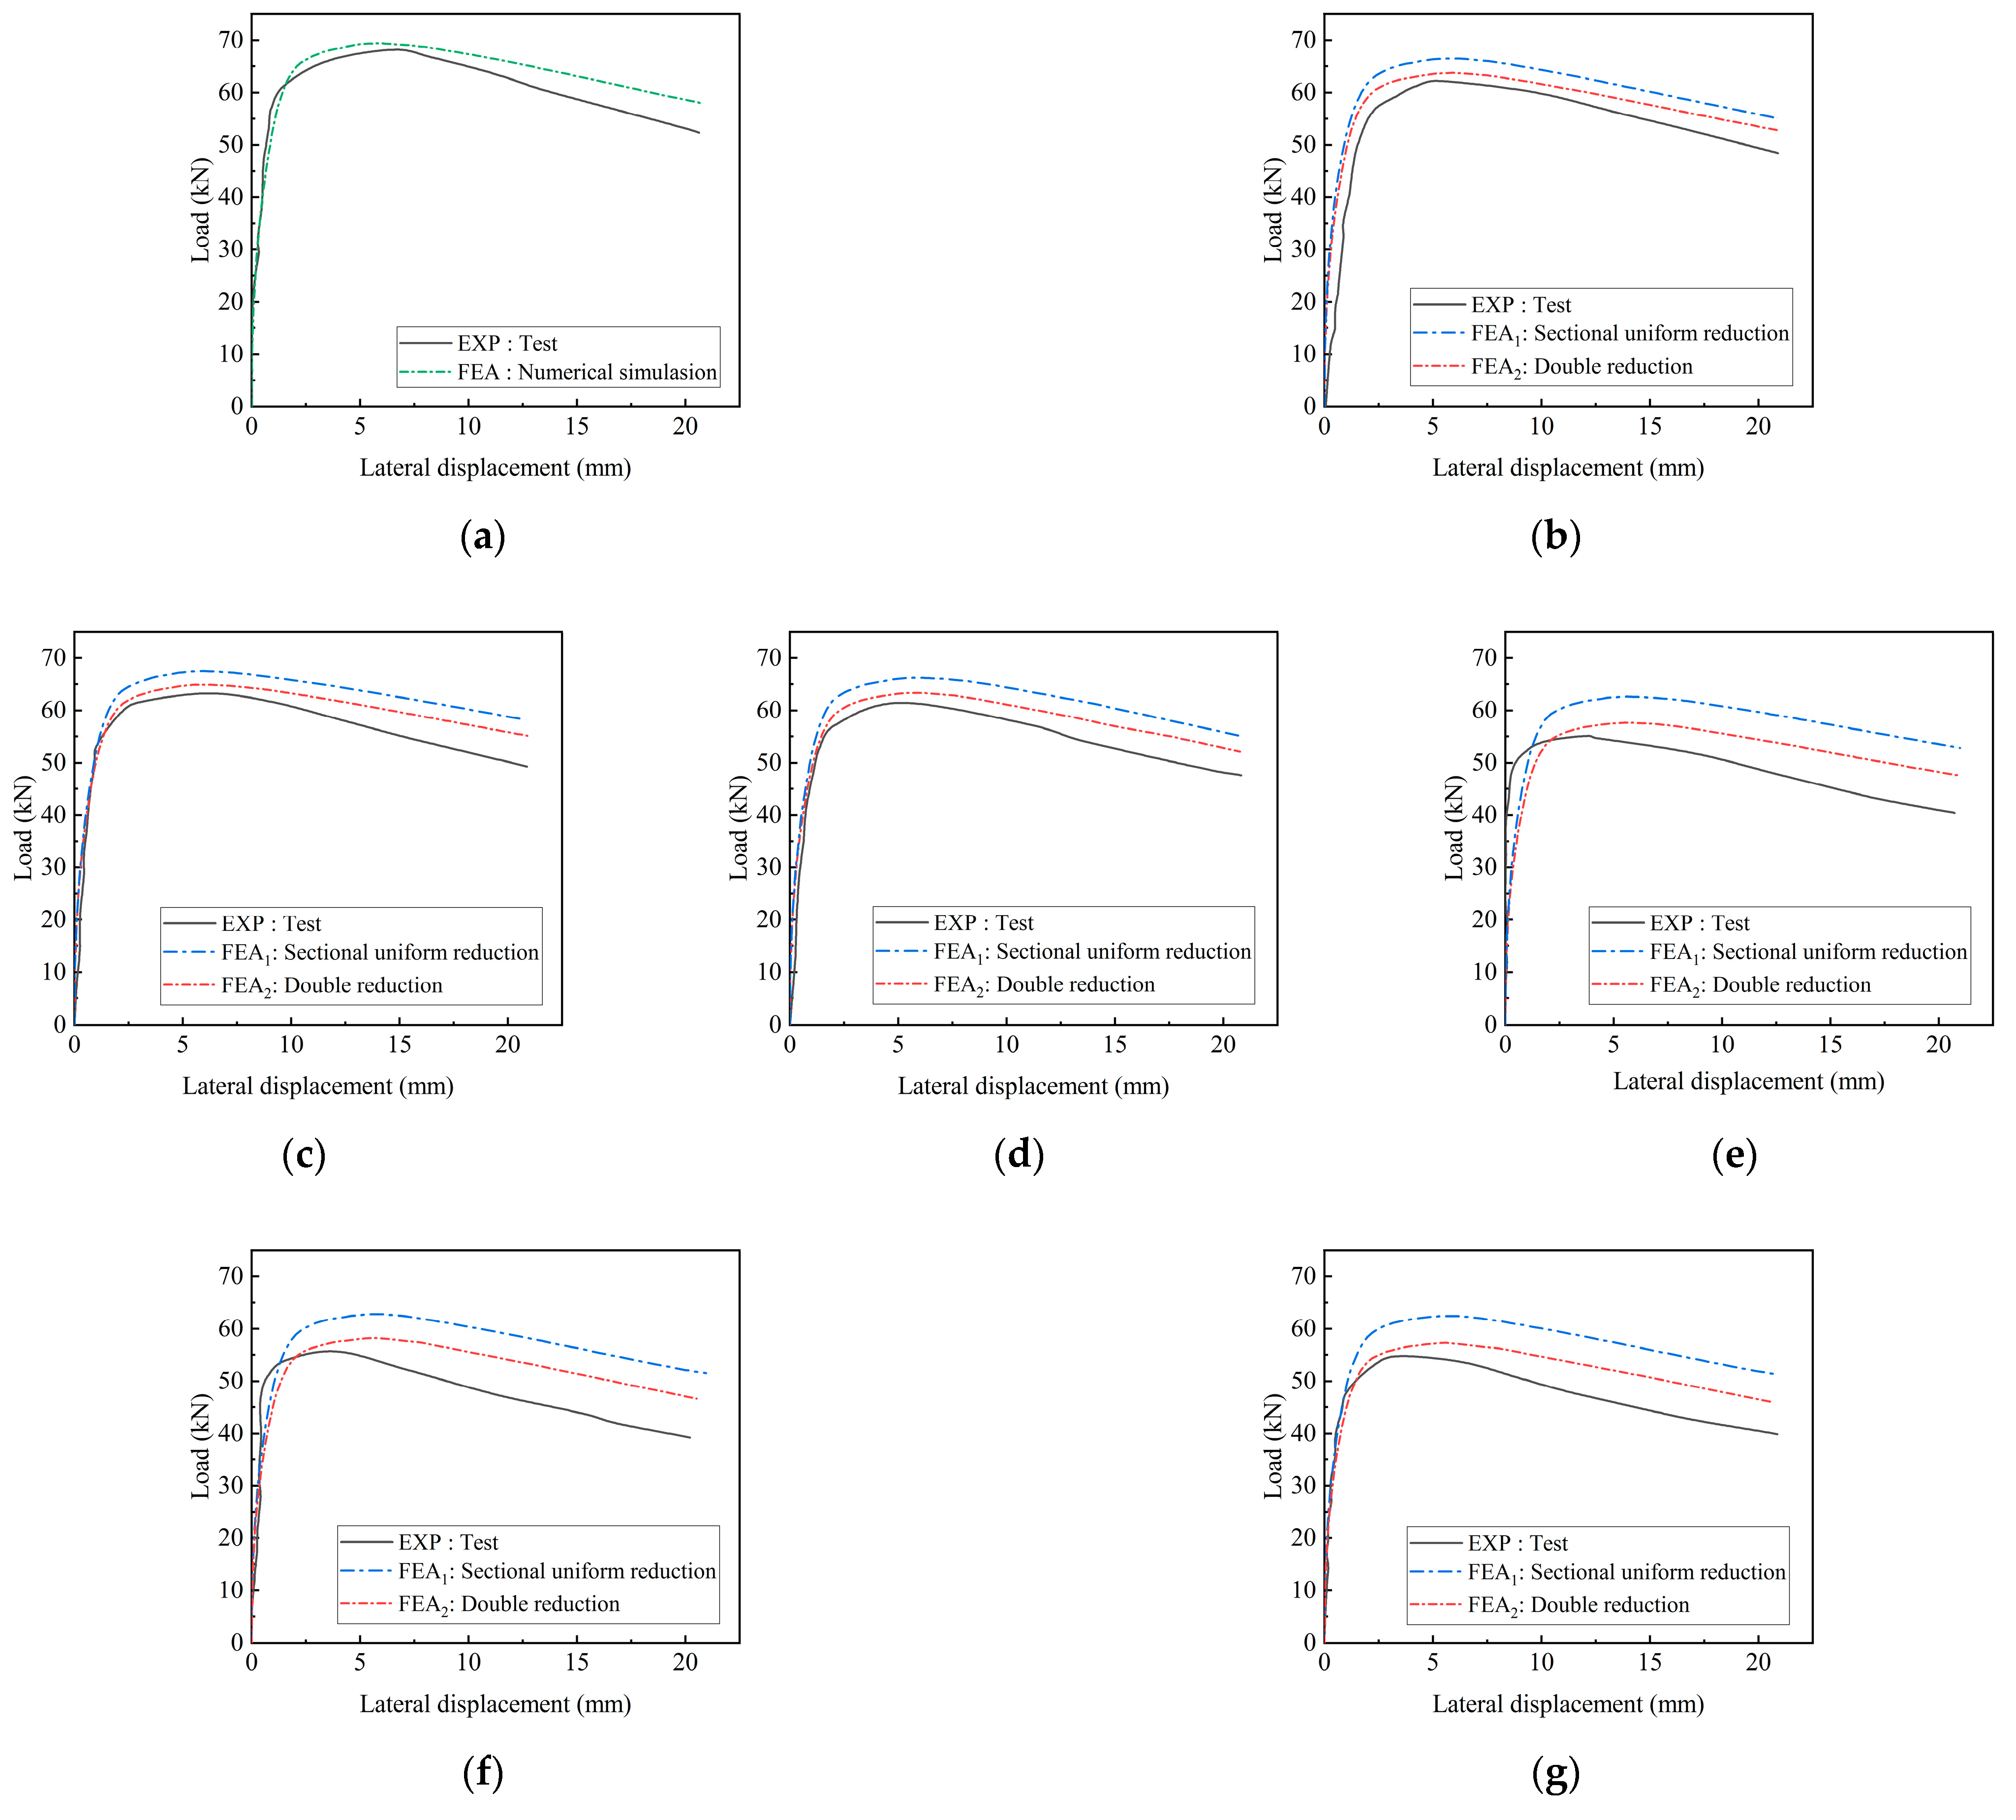
4.2. Comparison between the Failure Modes Obtained from the Test and Numerical Simulation

A comparison between the failure modes of the test beams that were obtained from the test and the numerical simulations is shown in Figure 18. According to the comparison, the failure mode that was obtained from the numerical simulation was observed to be in good agreement with the failure mode that was obtained from the test, and the bending degree, the position, the twisting degree, and the direction were consistent between the test and the numerical simulations. Therefore, the loading failure that was obtained from the numerical simulations can be preliminarily considered to be a good fit for that obtained from the test.

4.3. Comparison between the Numerical Simulation Results of the Corroded Steel Beams

Table 6 presents a comparative analysis of the overall stability test results and the numerical simulation results. The relevant data in the table reveal that the numerical simulation results are larger than the test results, and the deviation of the numerical simulation results tends to increase with an increase in the corrosion rate. This is because the steel beam corrosion model does not fully consider the stress concentration that is caused by the uneven distribution and the depth differences of the corrosion pits; however, the influence of the stress concentration on the test results tends to be obvious with an increase in the corrosion rate. The relative deviation between the calculation results of the double-reduction numerical model and the overall stability test results is 1.86–4.73%, with an average deviation of 3.31% and a standard deviation of 1.22%. Compared with the calculation results of the sectional uniform reduction numerical model, the average deviation that was obtained from the double-reduction numerical model was reduced by 5.69% and the standard deviation decreased by 3.08%. Therefore, the error between the overall stability ultimate bearing capacity that was calculated using the double-reduction model and that obtained from the overall stability test results was found to be small, and the calculation results were more accurate than the test results. Therefore, the proposed method is suitable for overall flexural–torsional buckling of simply supported corroded steel beams under concentrated loads at the mid-span.
The comparison between the load–lateral displacement curves of the specimens in each group and the numerical simulation curves is shown in Figure 19, in which EXP represents the test curves and FEA1 and FEA2 represent the numerical simulation curves of the sectional uniform reduction model and the double-reduction model, respectively. The comparison between the curves revealed that the numerical simulation results of the double-reduction model were increasingly consistent with the trend of the test results; however, certain deviations still existed, which were caused by the eccentricity of the test device during the loading and the friction between the clamping support and the steel beam. In addition, because the numerical model did not consider the stress concentration arising from uneven corrosion, a certain rusty part yielded and entered the elastic–plastic working stage early, which also slightly impacted the results. Overall, when it is compared with the sectional uniform reduction model, the double-reduction model can more effectively reduce the corrosion damage simulation error and can simulate the influence of corrosion on the bearing capacities of the steel beams that are subjected to three-point bending.

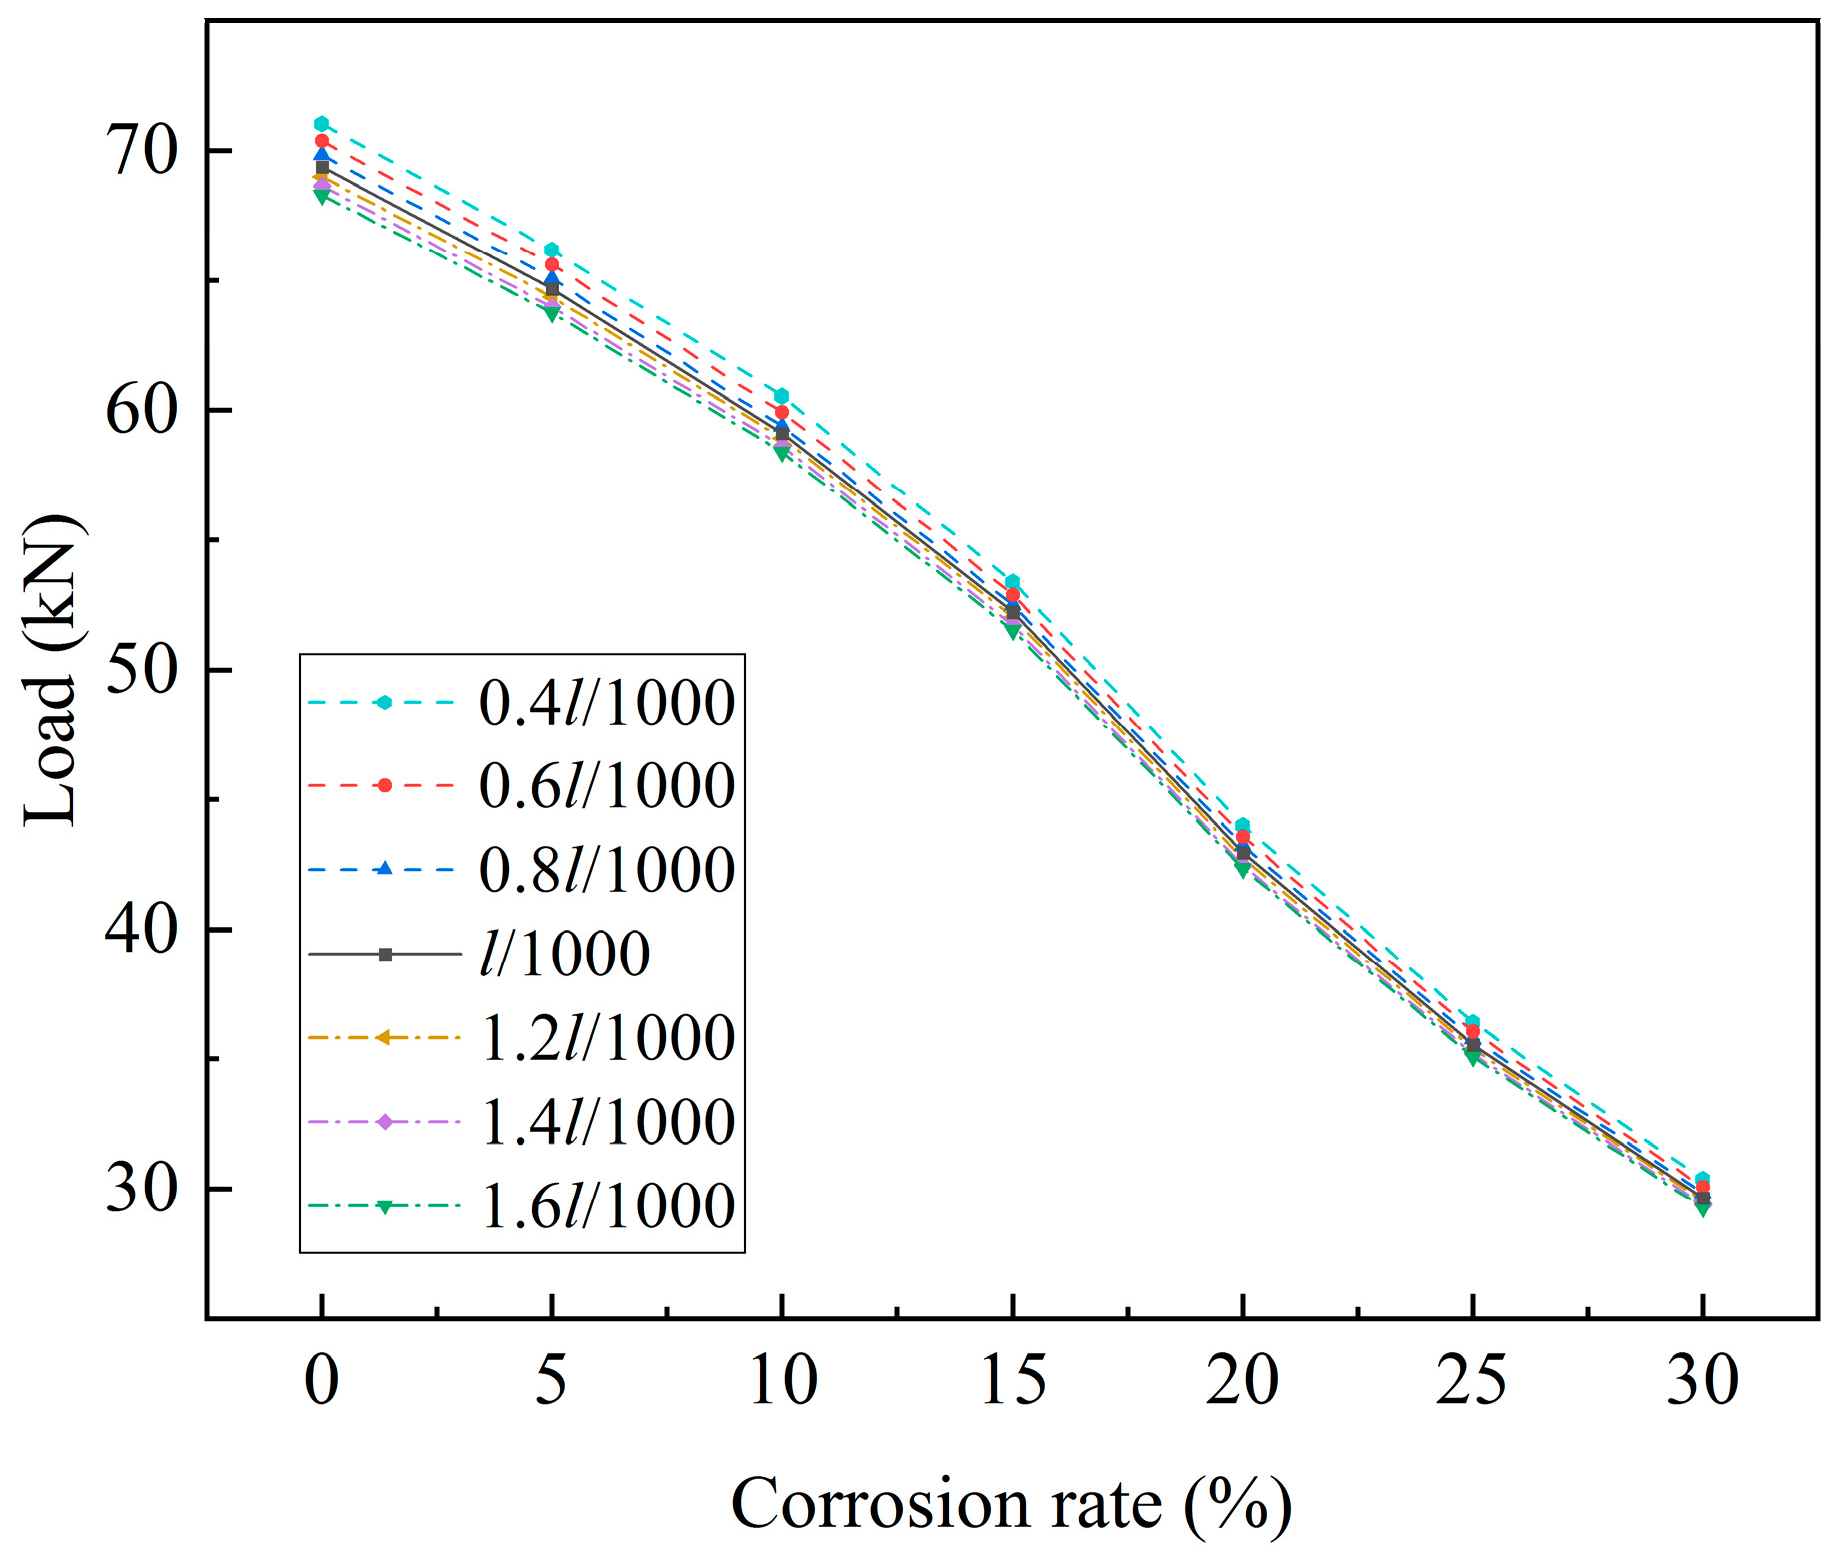
4.4. Influence of Initial Bending on the Overall Stability Ultimate Bearing Capacity of Corroded Steel Beams

In practical engineering, there must be certain initial geometric defects in the steel frame structure and its members, and the initial defects are an important factor leading to the instability of the bending members. In this paper, the verified finite element model was employed in order to discuss the influence of initial bending on the overall stability ultimate bearing capacity of corroded rolled H-shaped steel beams. For comparative analysis, the calculation model of this example was consistent with the test beams in specification. Besides, the initial bending value of the verified model, namely l/1000, was increased and decreased by 20%, 40%, and 60% respectively, and several groups of corrosion rates were introduced in order to calculate the overall stability ultimate bearing capacity. The change rate in the overall stability ultimate bearing capacity that was caused by initial bending is shown in Table 7.
As can be seen from Table 7 and Figure 20, the overall stability ultimate bearing capacity of the steel beams decreased with the increase in the initial bending. When the initial bending value l/1000 increased by 60%, the overall stability ultimate bearing capacity decreased by 1.38% on average. When the initial bending value l/1000 decreased by 60%, the overall stability ultimate bearing capacity increased by 2.36% on average, that is, the initial bending affects the overall stability ultimate bearing capacity of corroded steel beams to some extent, and the influence tended to decline when the initial bending value was greater than l/1000. Compared with the results of the model example with an initial bending value of l/1000, the overall stability ultimate bearing capacity decreased with the increase in the corrosion rate. In addition, the decline of the overall stability ultimate bearing capacity increased with the increase in the corrosion rate within the range of 0–20% and tended to slow down when the corrosion rate was greater than 20%.

5. Conclusions

In order to explore the degradation law of the performance of corroded steel beams, in this study, rolled H-shaped steel beam members were subjected to electrochemical accelerated corrosion. The mechanical tests and the overall stability tests were conducted on the corroded H-shaped steel beam specimens. In addition, the ABAQUS software was adopted for the finite element simulation and analysis, and the following conclusions were drawn:
(1)
The quantitative relationship between various mechanical properties and the corrosion rate was established. With an increase in the corrosion rate of the beams, the yield strength, the ultimate strength, the elastic modulus, and the elongation of the steel degraded to different degrees, among which the degradation of the elongation was the most obvious. This indicated that corrosion has a major impact on the plastic deformation ability of steel;
(2)
In this test, an improved loading device was employed in order to release the lateral constraint of a traditional jack on the specimens during loading. The H-shaped steel beams with different corrosion degrees were found to have similar failure modes and were subjected to overall instability failure, which was in accordance with the expectation from the test. The ultimate bearing capacities of the corroded steel beams were lower than those of the uncorroded steel beams. The higher the corrosion rate, the lower the overall stability ultimate bearing capacity. Compared with the test beams with a corrosion rate of 6%, those with a corrosion rate of 12% had a substantially lower overall stability ultimate bearing capacity. With the aggravation of corrosion, the elastic working stages of the beams that were subjected to three-point bending were shortened; the lateral displacement corresponding to the peak load was reduced; the strength, the stiffness, and the stability of the steel beams were further degraded; and flexural–torsional buckling occurred early. Serious corrosion will lead to the significant degradation of the overall stability of the members. In addition, after comparing the test results with the calculated values that were based on the relevant codes of various countries, it was found that the calculated results that were based on Chinese code G are the most conservative, while those that were based on European code E and American code A tend to be conservative but are relatively close. Therefore, the three methods can all be employed for the overall stability design of Q235 rolled H-shaped steel beams, and the calculation method that is based on A can be adopted to roughly calculate the overall stability ultimate bearing capacity of Q235 corroded rolled H-shaped steel beams;
(3)
In this study, two methods were adopted in order to construct the numerical models of the corroded H-shaped steel beams, that is, the uniform reduction in the sectional dimensions and the double-reduction in the mechanical properties of the material and sectional dimensions. Through comparative analysis, the calculation results that were obtained from the double-reduction method were found to be in better agreement with the test results than that of the other method. This can better reflect the actual stress state of the corroded steel beams and the degradation of the mechanical properties of the material. Therefore, these results can be used as a reference for similar tests and simulations;
(4)
The influence of the initial bending on the overall stability ultimate bearing capacity of corroded steel beams has been explored by several groups of the verified finite element models. It has been found that the decline of the overall stability ultimate bearing capacity of steel beams increases with the increase in the corrosion rate within the range of 0–20% and tends to slow down when the corrosion rate exceeds 20%. The overall stability ultimate bearing capacity of corroded steel beams decreases with the increase in the initial bending, and the influence of the initial bending on the overall stability ultimate bearing capacity of corroded steel beams tends to decline when the value is greater than l/1000.

Author Contributions

Funding acquisition, L.L.; Methodology, L.L., H.F., Y.Z. and X.X.; investigation, L.L., H.F., Y.Z., and X.X.; Conceptualization, L.L. and H.F.; Writing—Review and Editing, L.L., H.F., Y.Z. and X.X.; Supervision, L.L.; Writing—original draft, H.F. All authors have read and agreed to the published version of the manuscript.

Funding

This work was supported by the High-level Natural Science Foundation of Hainan Province of China (grant number 2019RC055); the specific research fund of The Innovation Platform for Academicians of Hainan Province (grant number YSPTZX202111); and the National Natural Science Foundation of China (grant number 51808176).

Data Availability Statement

Data presented in this research are available upon request from the corresponding author.

Conflicts of Interest

We confirm that we do not have any commercial or associative interest that represents a conflict of interest in connection with the work submitted. We confirm that we have given due considerations to the protection of intellectual property that is associated with this research and that there are no impediments to publication, with respect to intellectual property.

References

  1. Wang, J.J.; Zhao, J.D.; Hu, J.Y. Review and thinking on development of building industrialization in China. China Civ. Eng. J. 2016, 49, 1–8. [Google Scholar] [CrossRef]
  2. Liu, Z.K.; Jin, L.J.; Zhou, X.H.; Ma, Y.W. State-of-the-art on research of direct analysis method of steel members with global instability. J. Build. Struct. 2021, 42, 1–12. [Google Scholar] [CrossRef]
  3. Hradil, P.; Fülöp, L.; Talja, A. Global stability of thin-walled ferritic stainless steel members. Thin-Walled Struct. 2012, 61, 106–114. [Google Scholar] [CrossRef]
  4. Fortan, M.; Rossi, B. Lateral Torsional Buckling of Welded Stainless Steel I-Profile Beams: Experimental Study. J. Struct. Eng. 2021, 147, 04020342. [Google Scholar] [CrossRef]
  5. Ranjithkumar, M.; Usha Priya, B.T.; Punitha Kumar, A. Lateral torsional buckling of steel beams strengthened by steel plate. Mater. Today Proc. 2022, 49, 1670–1673. [Google Scholar] [CrossRef]
  6. Xiong, G.; Yang, B.; Wang, S.B.; Xu, G.Y.; Dai, G.X.; Nie, S.D.; Hu, Y.; Zhang, W.F. Tests on lateral torsional buckling behavior of welded Q460GJ structural steel beams. Eng. Mech. 2016, 33, 214–218. [Google Scholar] [CrossRef]
  7. Yang, B.; Zhang, Y.; Xiong, G.; Elchalakani, M.; Kang, S.-B. Global buckling investigation on laterally-unrestrained Q460GJ steel beams under three-point bending. Eng. Struct. 2019, 181, 271–280. [Google Scholar] [CrossRef]
  8. Xiong, G.; Feng, Y.; Peng, Q.; Kang, S.-B.; Zhang, Y.; Fan, Y.-L. Lateral-torsional buckling behaviour of 690 MPa high strength steel beams. Structures 2021, 33, 3999–4010. [Google Scholar] [CrossRef]
  9. Lee, C.-H.; Han, K.-H.; Uang, C.-M.; Kim, D.-K.; Park, C.-H.; Kim, J.-H. Flexural Strength and Rotation Capacity of I-Shaped Beams Fabricated from 800-MPa Steel. J. Struct. Eng. 2013, 139, 1043–1058. [Google Scholar] [CrossRef]
  10. Gathimba, N.; Kitane, Y. Effect of surface roughness on tensile ductility of artificially corroded steel plates. J. Constr. Steel Res. 2021, 176, 106392. [Google Scholar] [CrossRef]
  11. Imperatore, S.; Rinaldi, Z. Experimental behavior and analytical modeling of corroded steel rebars under compression. Constr. Build. Mater. 2019, 226, 126–138. [Google Scholar] [CrossRef]
  12. Kim, H.-S.; Dao, D.K.; Shin, C.-H.; Jeong, Y.-S.; Kim, I.-T. Compressive strength evaluation of circular tubular short columns with locally corroded ends. J. Constr. Steel Res. 2018, 149, 31–40. [Google Scholar] [CrossRef]
  13. Oszvald, K.; Tomka, P.; Dunai, L. The remaining load-bearing capacity of corroded steel angle compression members. J. Constr. Steel Res. 2016, 120, 188–198. [Google Scholar] [CrossRef]
  14. Kim, Y.-B.; Toledo, K.K.; Jeong, Y.-S.; Song, S.-Y.; Kim, I.T. Residual compressive strength of locally corroded intermediate tubular steel columns. Eng. Fail. Anal. 2022, 138, 106375. [Google Scholar] [CrossRef]
  15. Karagah, H.; Shi, C.; Dawood, M.; Belarbi, A. Experimental investigation of short steel columns with localized corrosion. Thin-Walled Struct. 2015, 87, 191–199. [Google Scholar] [CrossRef]
  16. Garbatov, Y.; Soares, C.G.; Parunov, J.; Kodvanj, J. Tensile strength assessment of corroded small scale specimens. Corros. Sci. 2014, 85, 296–303. [Google Scholar] [CrossRef]
  17. Wu, B.; Cao, J.-L.; Kang, L. Influence of local corrosion on behavior of steel I-beams subjected to end patch loading: Experiments. J. Constr. Steel Res. 2017, 135, 150–161. [Google Scholar] [CrossRef]
  18. Sheng, J.; Xia, J.W.; Ma, R.W. Experimental study on the coupling effect of sulfate corrosion and loading on the mechanical behavior of steel and H-section beam. Constr. Build. Mater. 2018, 189, 711–718. [Google Scholar] [CrossRef]
  19. Kim, I.-T.; Lee, M.-J.; Ahn, J.-H.; Kainuma, S. Experimental evaluation of shear buckling behaviors and strength of locally corroded web. J. Constr. Steel Res. 2013, 73, 75–89. [Google Scholar] [CrossRef]
  20. Ahn, J.-H.; Cheung, J.-H.; Lee, W.-H.; Oh, H.; Kim, I.-T. Shear buckling experiments of web panel with pitting and through-thickness corrosion damage. J. Constr. Steel Res. 2015, 115, 290–302. [Google Scholar] [CrossRef]
  21. Ahn, J.-H.; Kainuma, S.; Yasuo, F.; Takehiro, I. Repair method and residual bearing strength evaluation of a locally corroded plate girder at support. Eng. Fail. Anal. 2013, 33, 398–418. [Google Scholar] [CrossRef]
  22. Zhang, Z.X.; Xu, S.H.; Mu, L.; Peng, S.Y. Experimental and Theoretical Investigation on Flexural Behavior of Corroded Steel Beams Strengthened by CFRP Plate. KSCE J. Civ. Eng. 2020, 24, 2160–2172. [Google Scholar] [CrossRef]
  23. Zhang, Z.X.; Xu, S.H.; Wang, H.; Nie, B.; Su, C. Flexural buckling behavior of corroded hot-rolled H-section steel beams. Eng. Struct. 2021, 229, 111614. [Google Scholar] [CrossRef]
  24. Fiolek, P.; Jakubowski, J. Local buckling of highly corroded hot-rolled box-section beams. J. Constr. Steel Res. 2019, 157, 359–370. [Google Scholar] [CrossRef]
  25. Liu, C.; Miyashita, T.; Nagai, M. Analytical Study on Shear Capacity of Steel I-Girders with Local Corrosion nearby Supports. Procedia Eng. 2011, 14, 2276–2284. [Google Scholar] [CrossRef] [Green Version]
  26. Tzortzinis, G.; Knickle, B.T.; Bardow, A.; Breña, S.F.; Gerasimidis, S. Strength evaluation of deteriorated girder ends. I: Experimental study on naturally corroded I-beams. Thin-Walled Struct. 2021, 159, 107220. [Google Scholar] [CrossRef]
  27. Tzortzinis, G.; Knickle, B.T.; Bardow, A.; Breña, S.F.; Gerasimidis, S. Strength evaluation of deteriorated girder ends. II: Numerical study on corroded I-beams. Thin-Walled Struct. 2021, 159, 107216. [Google Scholar] [CrossRef]
  28. Tzortzinis, G.; Breña, S.F.; Gerasimidis, S. Experimental testing, computational analysis and analytical formulation for the remaining capacity assessment of bridge plate girders with naturally corroded ends. Eng. Struct. 2022, 252, 113488. [Google Scholar] [CrossRef]
  29. Tzortzinis, G.; Ai, C.; Breña, S.F.; Gerasimidis, S. Using 3D laser scanning for estimating the capacity of corroded steel bridge girders: Experiments, computations and analytical solutions. Eng. Struct. 2022, 265, 114407. [Google Scholar] [CrossRef]
  30. Saad-Eldeen, S.; Garbatov, Y.; Soares, C.G. Effect of corrosion severity on the ultimate strength of a steel box girder. Eng. Struct. 2013, 49, 560–571. [Google Scholar] [CrossRef]
  31. Saad-Eldeen, S.; Garbatov, Y.; Soares, C.G. Ultimate strength assessment of corroded box girders. Ocean Eng. 2013, 58, 35–47. [Google Scholar] [CrossRef]
  32. Jelovica, J.; Romanoff, J.; Ehlers, S.; Aromaa, J. Ultimate strength of corroded web-core sandwich beams. Mar. Struct. 2013, 31, 1–14. [Google Scholar] [CrossRef] [Green Version]
  33. Tohidi, S.; Sharifi, Y. Load-carrying capacity of locally corroded steel plate girder ends using artificial neural network. Thin-Walled Struct. 2016, 100, 48–61. [Google Scholar] [CrossRef]
  34. Jagtap, P.R.; Pore, S.M. Strengthening of fully corroded steel I-beam with CFRP laminates. Mater. Today Proc. 2021, 43, 2170–2175. [Google Scholar] [CrossRef]
  35. Bao, A.; Guillaume, C.; Satter, C.; Moraes, A.; Williams, P.; Kelly, T.; Guo, Y. Testing and evaluation of web bearing capacity of corroded steel bridge girders. Eng. Struct. 2021, 238, 112276. [Google Scholar] [CrossRef]
  36. General Administration of Quality Supervision, Inspection and Quarantine of the People’s Republic of China. Metallic Materials-Tensile Testing-Part1: Method of Test at Room Temperature; GB/T 228.1-2010; Standards Press of China: Beijing, China, 2010. [Google Scholar]
  37. Luo, L.S.; Chen, Z.H.; Zhao, X.L.; Zhang, Y. Deterioration model for resistance of steel member in atmospheric environment. Struct. Eng. 2019, 35, 02. [Google Scholar] [CrossRef]
  38. Ministry of Housing and Urban-Rural Development of the People’s Republic of China. Standard for Design of Steel Structures: GB 50017-2017; China Architecture & Building Press: Beijing, China, 2017. (In Chinese) [Google Scholar]
  39. European Committee for Standardization. Eurocode 3: Design of Steel Structures: Part 1-1: General Rules and Rules for Buildings: EN 1993–2005; European Committee for Standardization: Brussels, Belgium, 1992. [Google Scholar]
  40. AIC. Specification for Structural Steel Buildings: ANSI/AISC 360-2016; American Institute of Construction: Chicago, IL, USA, 2016. [Google Scholar]
  41. ABAQUS, Version 6.10; Hibbit, Karlsson & Sorenson: Pawtucket, RI, USA, 2010.
Figure 1. Specimens to be corroded.
Buildings 12 01923 g001
Figure 2. Electrochemical corrosion test.
Buildings 12 01923 g002
Figure 3. Specimens after corrosion: (a) Corrosion products; (b) Surface morphology of the specimens.
Buildings 12 01923 g003
Figure 4. Processing of the tensile specimens: (a) Processing size; (b) Sampling location.
Buildings 12 01923 g004
Figure 5. Static tensile test.
Buildings 12 01923 g005
Figure 6. Components and loading equipment used for the overall stability test: (a) Spherical hinge support; (b) Clamping support; (c) Loading.
Buildings 12 01923 g006
Figure 7. Arrangement of the strain gauges and displacement meters: (a) Arrangement of the vertical displacement meters; (b) Arrangement of the strain gauges on the webs and the lateral displacement meters; (c) Arrangement of the strain gauges on the upper and lower flanges.
Buildings 12 01923 g007
Figure 8. Failure mode of the tensile specimens.
Buildings 12 01923 g008
Figure 9. Relationship between the mechanical properties and corrosion rate of the steel beams.
Buildings 12 01923 g009
Figure 10. Failure mode of the steel beam: (a) Before testing; (b) After testing; (c) After testing; (d) After testing.
Buildings 12 01923 g010
Figure 11. Steel beam after unloading.
Buildings 12 01923 g011
Figure 12. Load–vertical displacement curves of the corroded steel beams.
Buildings 12 01923 g012
Figure 13. Load–lateral displacement curves of the corroded steel beams.
Buildings 12 01923 g013
Figure 14. Load–strain curves of the web: (a) Test beam A01; (b) Test beam A11; (c) Test beam A23.
Buildings 12 01923 g014
Figure 15. Load–strain curves of the flange: (a) Test beam A01; (b) Test beam A11; (c) Test beam A23.
Buildings 12 01923 g015
Figure 16. Finite element mesh division.
Buildings 12 01923 g016
Figure 17. Constraints and loading of the steel beams: (a) Application of the constraints; (b) Application of the loads.
Buildings 12 01923 g017
Figure 18. Comparison between the failure modes of specimens: (a) Test beam A01; (b) Numerical simulation A01; (c) Test beam A13; (d) Numerical simulation A13; (e) Test beam A21; (f) Numerical simulation A21.
Buildings 12 01923 g018
Figure 19. Comparison between the load–lateral displacement curves obtained from the test and numerical simulations: (a) Test beam A01; (b) Test beam A11; (c) Test beam A12; (d) Test beam A13; (e) Test beam A21; (f) Test beam A22; (g) Test beam A23.
Buildings 12 01923 g019
Figure 20. Overall Stability Ultimate Bearing Capacity of the Data Model Example.
Buildings 12 01923 g020
Table 1. The detailed specifications of the test beam specimens.
MaterialClear Span
/mm
Height
/mm
Width
/mm
Web
Thickness
/mm
Flange
Thickness
/mm
Fillet
Radius
/mm
Quantity
Q23515001507557107
Table 2. Results of the accelerated corrosion test.
Specimen No.Designed
Corrosion Rate η/%
Initial Mass of the Steel Beam ma/gDesigned
Corrosion Mass Δm/g
Electrifying Time t/hMass of the Steel Beam after Corrosion mb/gActual
Corrosion Rate η′/%
A01 0%20,0160020,0160%
A11 6%19,7101182.6119.1718,6045.61%
A12 6%20,3601221.6123.1019,3584.92%
A13 6%20,4101224.6123.4119,2175.85%
A21 12%20,3102437.2245.6017,98111.47%
A22 12%20,5102461.2248.0218,20311.25%
A23 12%20,0602407.2242.5817,69911.77%
Table 3. Mechanical property indices of the specimens.
Specimen No. η′/% fy/Mpa fu/Mpa E/Mpa δ/%
A01 0267.0416.02.01 × 10533.7
A11 5.61258.8405.31.94 × 10529.7
A12 4.92261.0406.01.95 × 10530.3
A13 5.85257.6405.11.92 × 10529.2
A21 11.47243.3376.41.81 × 10526.2
A22 11.25244.1377.31.83 × 10526.6
A23 11.77242.4374.61.80 × 10525.8
Note: Two groups of mechanical tests were conducted for each corrosion rate, and the specimens from the same corroded steel beam were considered. The average value of these two tests was considered to be the mechanical property indices of steel.
Table 4. Experimental results.
No.η’/%Qexp/kNMexp/kN·m
A01068.1025.54
A115.6162.1823.32
A124.9263.6823.88
A135.8561.5123.07
A2111.4755.0620.65
A2211.2555.6020.85
A2311.7754.7320.52
Table 5. Comparison of Test Results and Code Values.
No.η′/%Mexp/kN∙mMu, GB/kN∙mMu, EC3/kN∙mMu, ANSI/kN∙mMexp/Mu, GBMexp/Mu, EC3Mexp/Mu, ANSI
A01025.5421.3123.1423.601.1981.1041.082
A115.6123.3219.5021.0421.651.1961.1081.077
A124.9223.8819.8121.3721.981.2051.1171.086
A135.8523.0719.3620.8621.491.1921.1061.074
A2111.4720.6517.2018.4319.151.2011.1201.078
A2211.2520.8517.3018.5819.261.2051.1221.083
A2311.7720.5217.0818.2819.021.2011.1231.079
Note: Mu, GB is the critical buckling moment calculated according to GB 50017-2017, Mu, EC3 is the critical buckling moment calculated according to BS EN 1993-1-1, Mu, ANSI is the critical buckling moment calculated according to ANSI/AISC 360-16.
Table 6. Comparison between the experimental results and numerical simulation results.
No.η′/%Qexp/kNQ1/kNQ2/kND1/%D2/%
A01068.1069.3769.371.86%1.86%
A115.6162.1866.4963.696.93%2.43%
A124.9263.6867.4764.905.95%1.92%
A135.8561.5166.2163.347.64%2.98%
A2111.4755.0662.6257.6113.73%4.63%
A2211.2555.6062.7458.1712.84%4.62%
A2311.7754.7362.4357.3214.07%4.73%
Note: η′ refers to the actual corrosion rate of the steel beams. Additionally, Qexp is the test result, Q1 represents the numerical simulation result of the uniform reduction in the cross section, and Q2 represents the numerical simulation result from the double-reduction model. Furthermore, D1 and D2 are the relative deviations.
Table 7. Influence of Initial Bending on the Overall Stability Ultimate Bearing Capacity of Steel Beams.
Corrosion Rate/%Initial BendingUltimate Bearing
Capacity/kn
Change Rate in the Ultimate Bearing Capacity/%
0%0.4 l/100071.032.39
0.6 l/100070.391.47
0.8 l/100069.840.68
l/100069.37-
1.2 l/100068.99−0.55
1.4 l/100068.63−1.07
1.6 l/100068.31−1.53
5%0.4 l/100066.162.27
0.6 l/100065.611.42
0.8 l/100065.070.59
l/100064.69-
1.2 l/100064.37−0.49
1.4 l/100063.97−0.99
1.6 l/100063.77−1.42
10%0.4 l/100060.542.40
0.6 l/100059.931.37
0.8 l/100059.380.44
l/100059.12-
1.2 l/100058.94−0.30
1.4 l/100058.61−0.86
1.6 l/100058.40−1.22
15%0.4 l/100053.402.22
0.6 l/100052.881.22
0.8 l/100052.490.48
l/100052.24-
1.2 l/100052.06−0.35
1.4 l/100051.73−0.98
1.6 l/100051.54−1.34
20%0.4 l/100043.992.42
0.6 l/100043.581.47
0.8 l/100043.230.65
l/100042.95-
1.2 l/100042.72−0.54
1.4 l/100042.46−1.14
1.6 l/100042.32−1.47
25%0.4 l/100036.402.33
0.6 l/100036.071.41
0.8 l/100035.800.65
l/100035.57-
1.2 l/100035.40−0.48
1.4 l/100035.19−1.07
1.6 l/100035.09−1.35
30%0.4 l/100030.402.46
0.6 l/100030.081.38
0.8 l/100029.840.57
l/100029.67-
1.2 l/100029.56−0.37
1.4 l/100029.41−0.88
1.6 l/100029.28−1.31
Publisher’s Note: MDPI stays neutral with regard to jurisdictional claims in published maps and institutional affiliations.

