1. Introduction
The straight web consumes a significant portion of the girder weight to resist shear forces and often requires transverse stiffeners to prevent shear buckling instability. An efficient way to improve the design and reduce the construction cost of steel projects is to use corrugated webs. This solution aids in reducing the web thickness, decreases or eliminates the need for stiffeners, and enhances buckling stability [
1,
2,
3,
4,
5].
Corrugated web steel girders (CWSGs) are manufactured by welding thin-walled corrugated steel sheets to flat top and flat bottom flanges. Due to improvements in automation and manufacturing, corrugation of the web can be economically fabricated using coarse or dense geometries and can be shaped as trapezoids, triangles, or even sinusoidal [
2,
6]. Increasing the shear stress beyond the compressive strength causes web shear buckling. Thus, the ultimate shear strength of the corrugated web is limited by the compressive strength of the web. In a CWSG, the web is the primary component to resist shear forces, while the flanges are the resisting elements against bending. Consequently, the contribution of corrugated web panels to resist bending is commonly neglected due to the accordion effect phenomenon [
7,
8]. Steel beams and girders with corrugated webs may experience three modes of shear buckling: local, global, and interactive. The primary mode of failure in girders with coarse corrugations is local shear buckling, while girders with densely corrugated webs tend to fail by global shear buckling. Interactive shear buckling is a state that is neither local nor global. Past studies [
1,
2,
9,
10,
11,
12] showed that local shear buckling is characterized by the flattening of some of the web folds, whereas global shear buckling is marked by the flattening of the entire depth of the corrugated web panel (more details in
Section 2) [
1,
5,
6,
8].
The shear failure mechanism of trapezoidal corrugated steel webs was studied extensively by Leblouba et al. [
11]. There are generally three loading stages for a corrugated web steel beam or girder: pre-buckling, buckling, and post-buckling stages [
5,
11,
13]. Equations for predicting the global shear buckling of corrugated webs are based on the theory of elastic buckling of plates [
14]. The development of the theory of global shear buckling of corrugated webs was founded on the fact that the global shear buckling of corrugated webs can be considered a local shear buckling of slender webs. The depth-to-width ratio of the element determines the slenderness of the plated web. This proportion is defined as the ratio of the web’s depth to the corrugation length for a corrugated web.
Studies were conducted to identify the factors that affect the web’s ultimate shear strength [
10,
12,
15,
16,
17,
18,
19,
20,
21,
22]. Several analytical studies concluded that the ultimate shear strength of corrugated web girders depends on the web depth and corrugation length ratio. The ultimate shear strength of a corrugated web is 4 to 5 times the web’s compressive strength for a slenderness ratio between 2.0 and 3.5 [
1]. The ultimate shear strength of corrugated webs is also affected by the shape or pattern of the corrugations (i.e., trapezoidal, triangular, sinusoidal, etc.). For instance, the ultimate shear strength of a trapezoidal web is 3.8 times the web’s compressive strength for a rectangular-shaped corrugation pattern. The width of the web may also influence the ultimate shear strength. The ultimate shear strength of a trapezoidal web is 2.7 times the web’s compressive strength for a web width of 1.0 to 1.5 times the web’s depth [
8,
23]. The analysis of previous mathematical models [
14,
18,
24,
25,
26] and the comparison with their results demonstrated that the model proposed by Hassanein and Kharoob [
10] predicts well the shear strength of corrugated web girders with the same fold widths, and for webs with different fold widths, the model by Moon et al. [
13] is better. Moreover, the same study demonstrated that the proposal of Leblouba et al. [
11] best predicts the strengths of corrugated web steel girders with the same fold widths and stocky corrugated webs. Despite the large number of investigations on the behavior of corrugated web steel girders, studies on their design optimization are limited in the published literature.
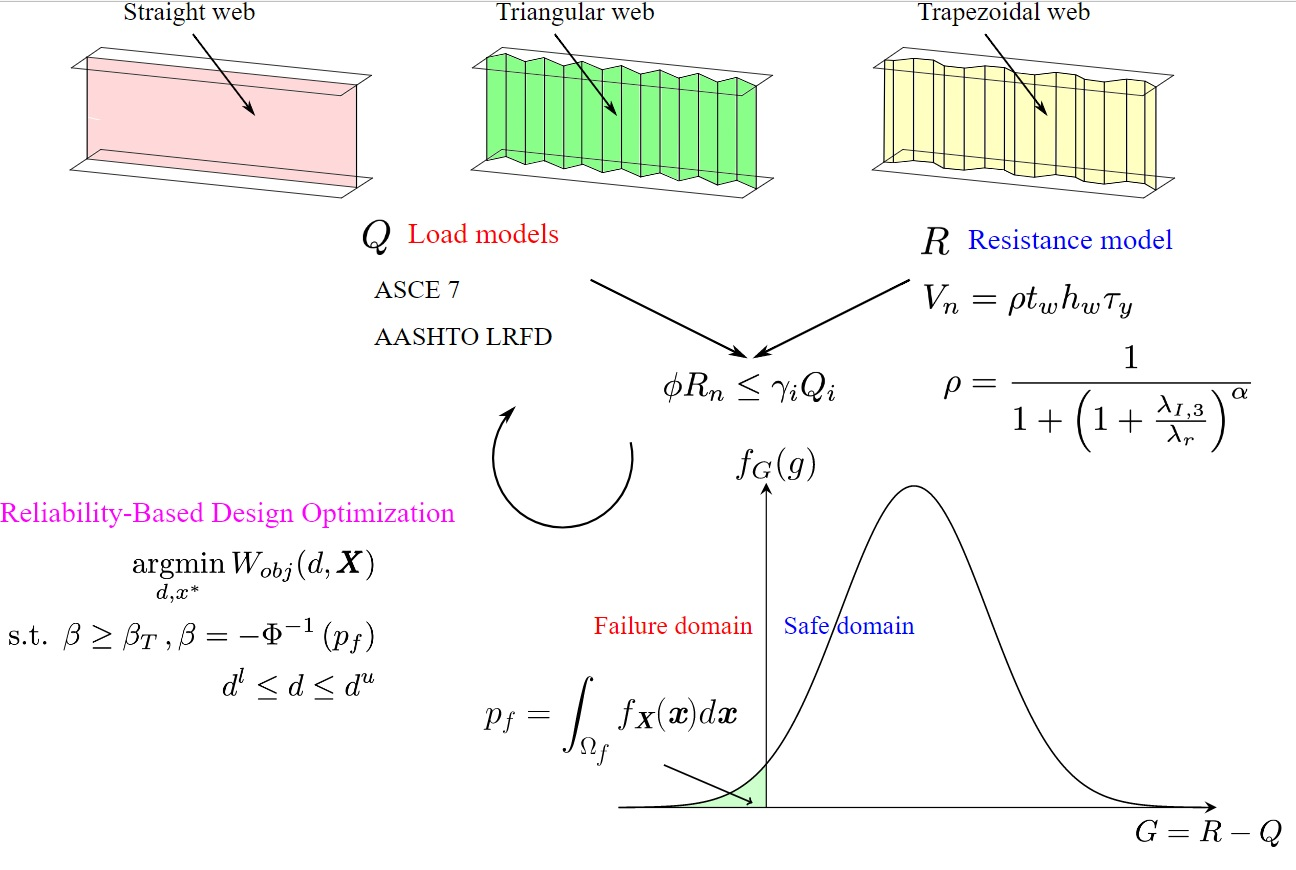
Reliability-based design optimization (RBDO) is an optimization process for a system or component typically characterized by multiple design parameters. A probabilistic reliability function first describes the reliability requirement. The objective is to find the set of design parameters that will at least meet the target reliability of the system or component subject to an optimization criterion.
In the present work, shear-critical steel beam specimens with different web corrugation patterns were tested in the laboratory until failure to investigate their shear failure mechanisms. Test results are presented and discussed, considering the stages from the pre-buckling stage to ultimate failure. Then, a parametric study is conducted considering previously published test results by the authors in [
11,
23]. The parametric study includes the effects of material strength and the different corrugation geometry configurations on the shear response of tested specimens with reference to the shear response of the straight web plate specimen. Finally, a reliability-based design optimization (RBDO) problem is proposed and formulated to design corrugated web steel girders to meet the target safety requirements of AISC 360 [
27]. The objective of the optimization is to minimize the weight/volume of steel used in the web while satisfying the constructability, serviceability, and target reliability indices. An application was selected as a case study from the AISC 360 design examples [
28].
2. Shear Buckling of Corrugated Web Beams
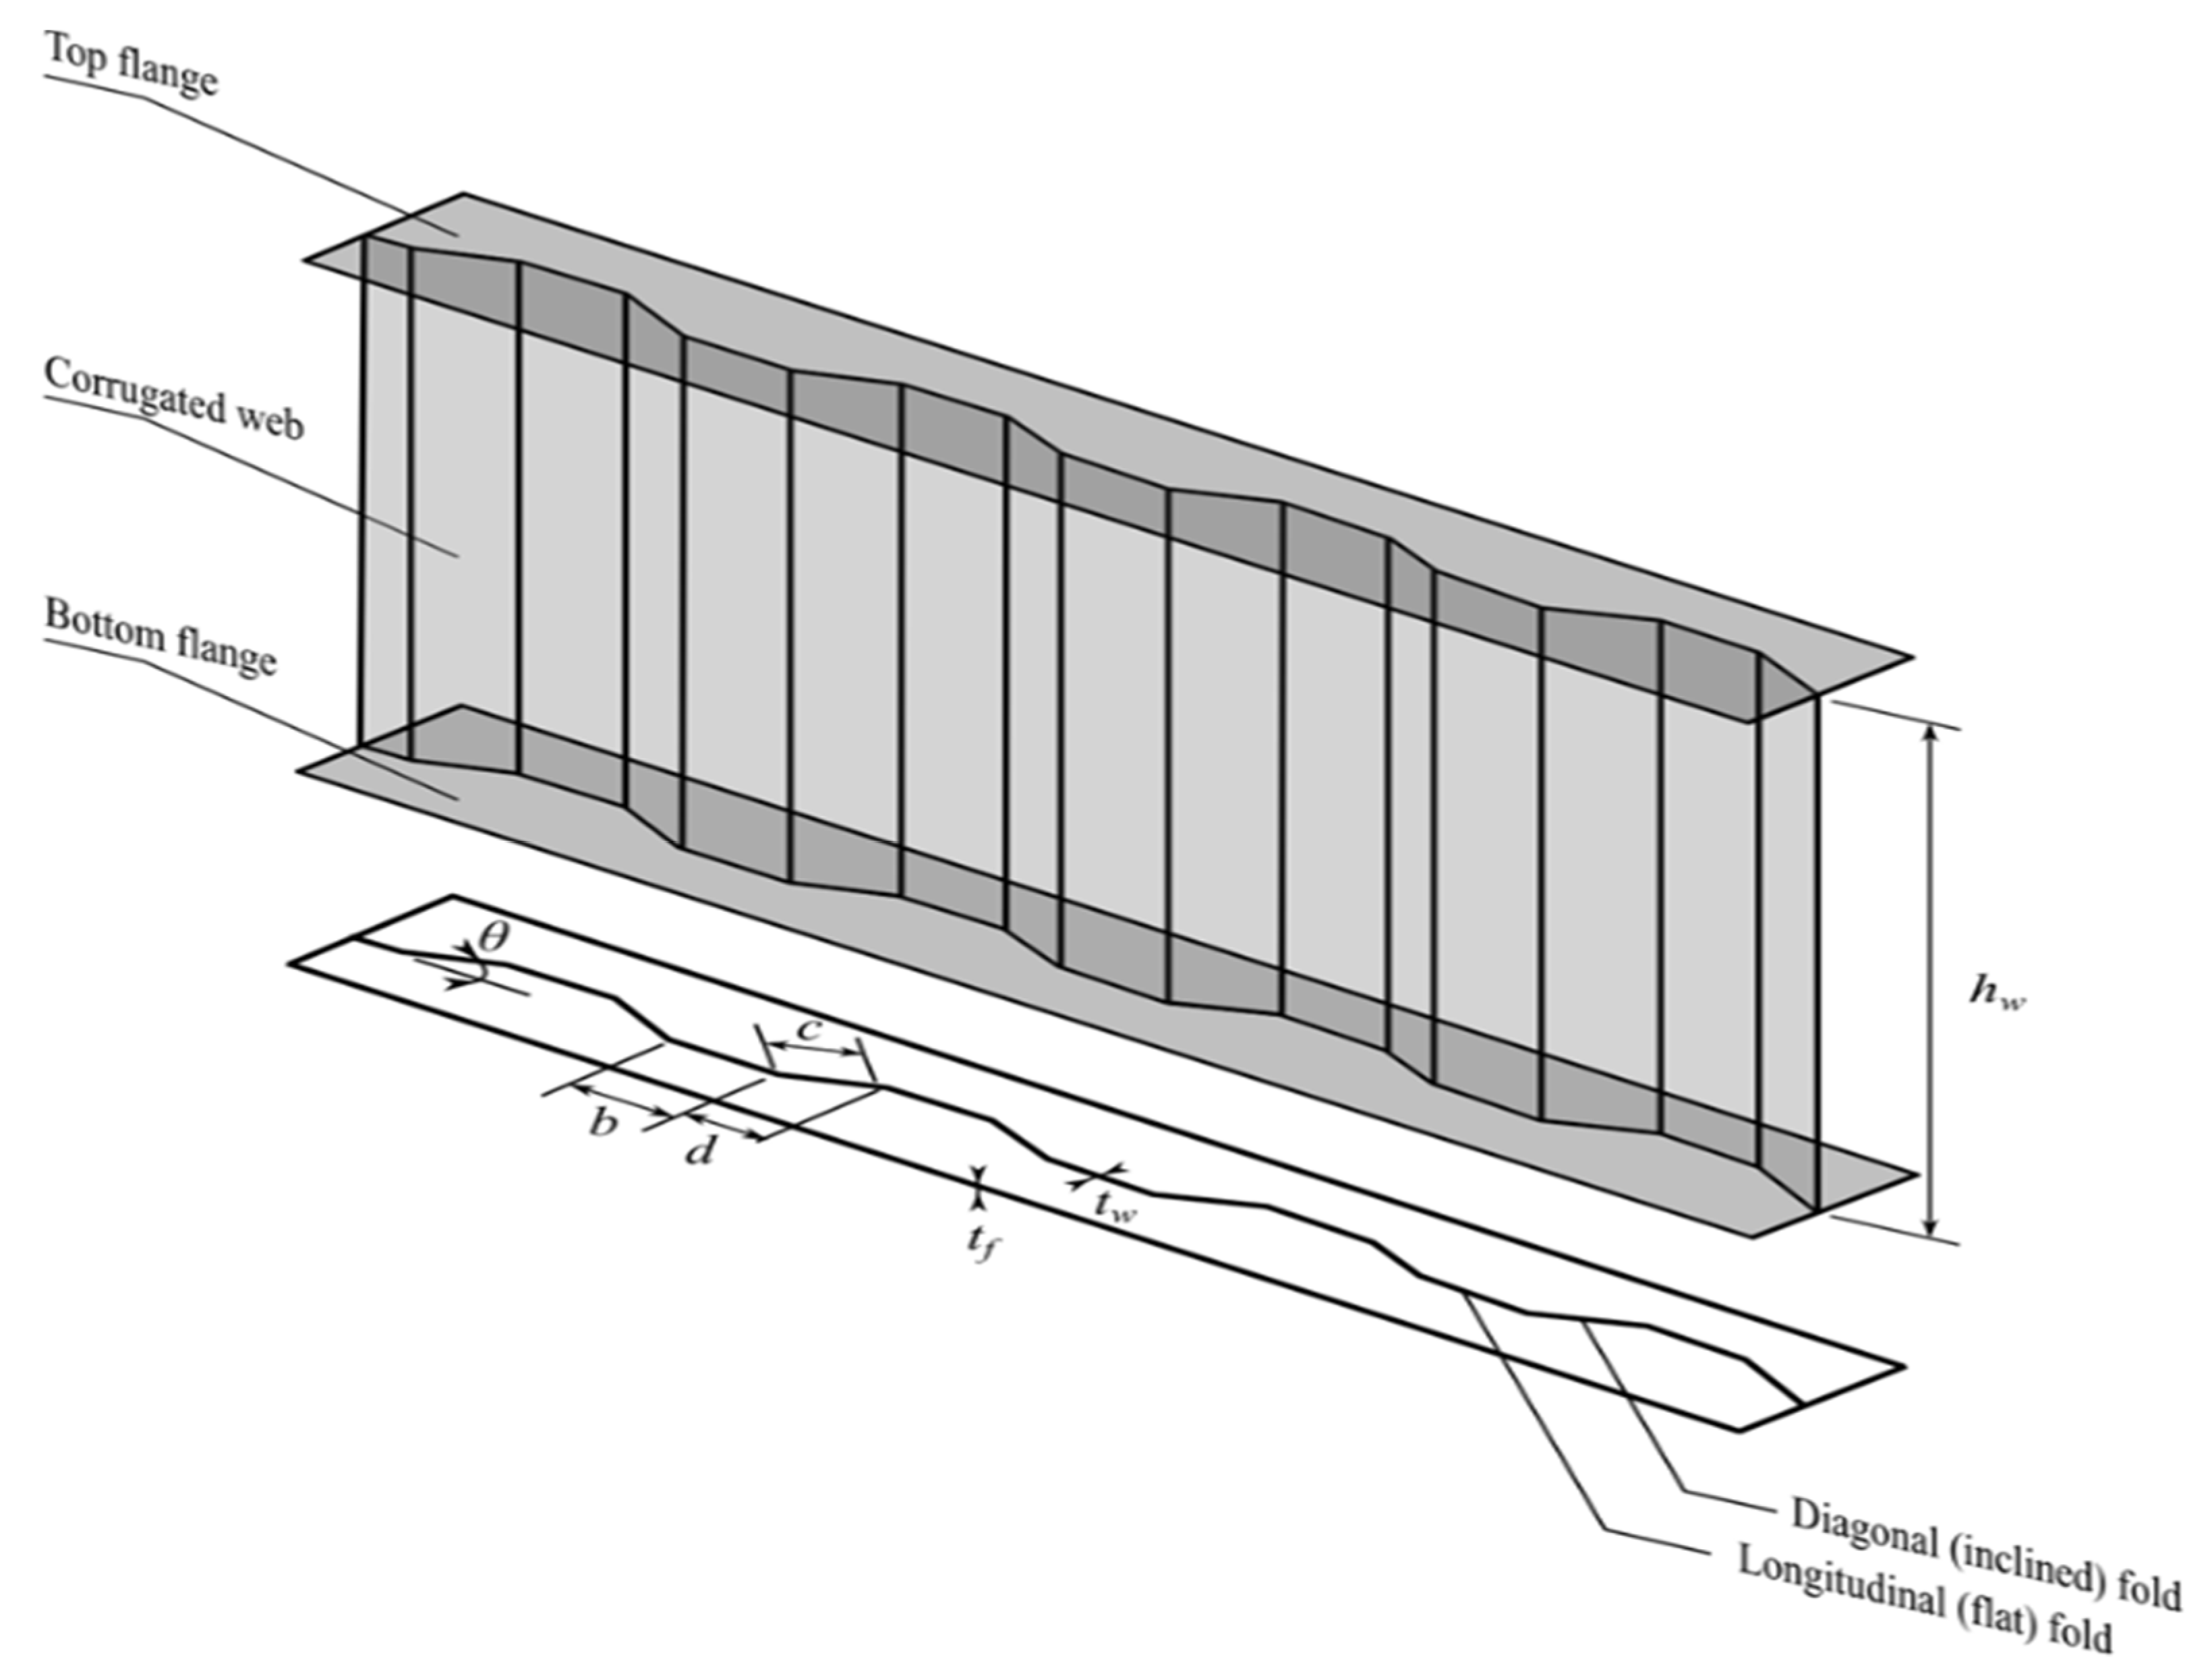
As stated earlier, the shear buckling of corrugated web panels (
Figure 1) can be either local, global, or interactive, depending on the geometric properties of the web itself and its individual folds. Many researchers [
2,
12,
15,
22,
24] attempted to study the shear buckling phenomenon through linear buckling analysis (LBA). Finite element-based LBA is carried out by solving the eigenproblem, in which only the web’s geometry and the material’s elastic properties are required as inputs. The analysis results are used to find a lower-bound estimate of the buckling load.
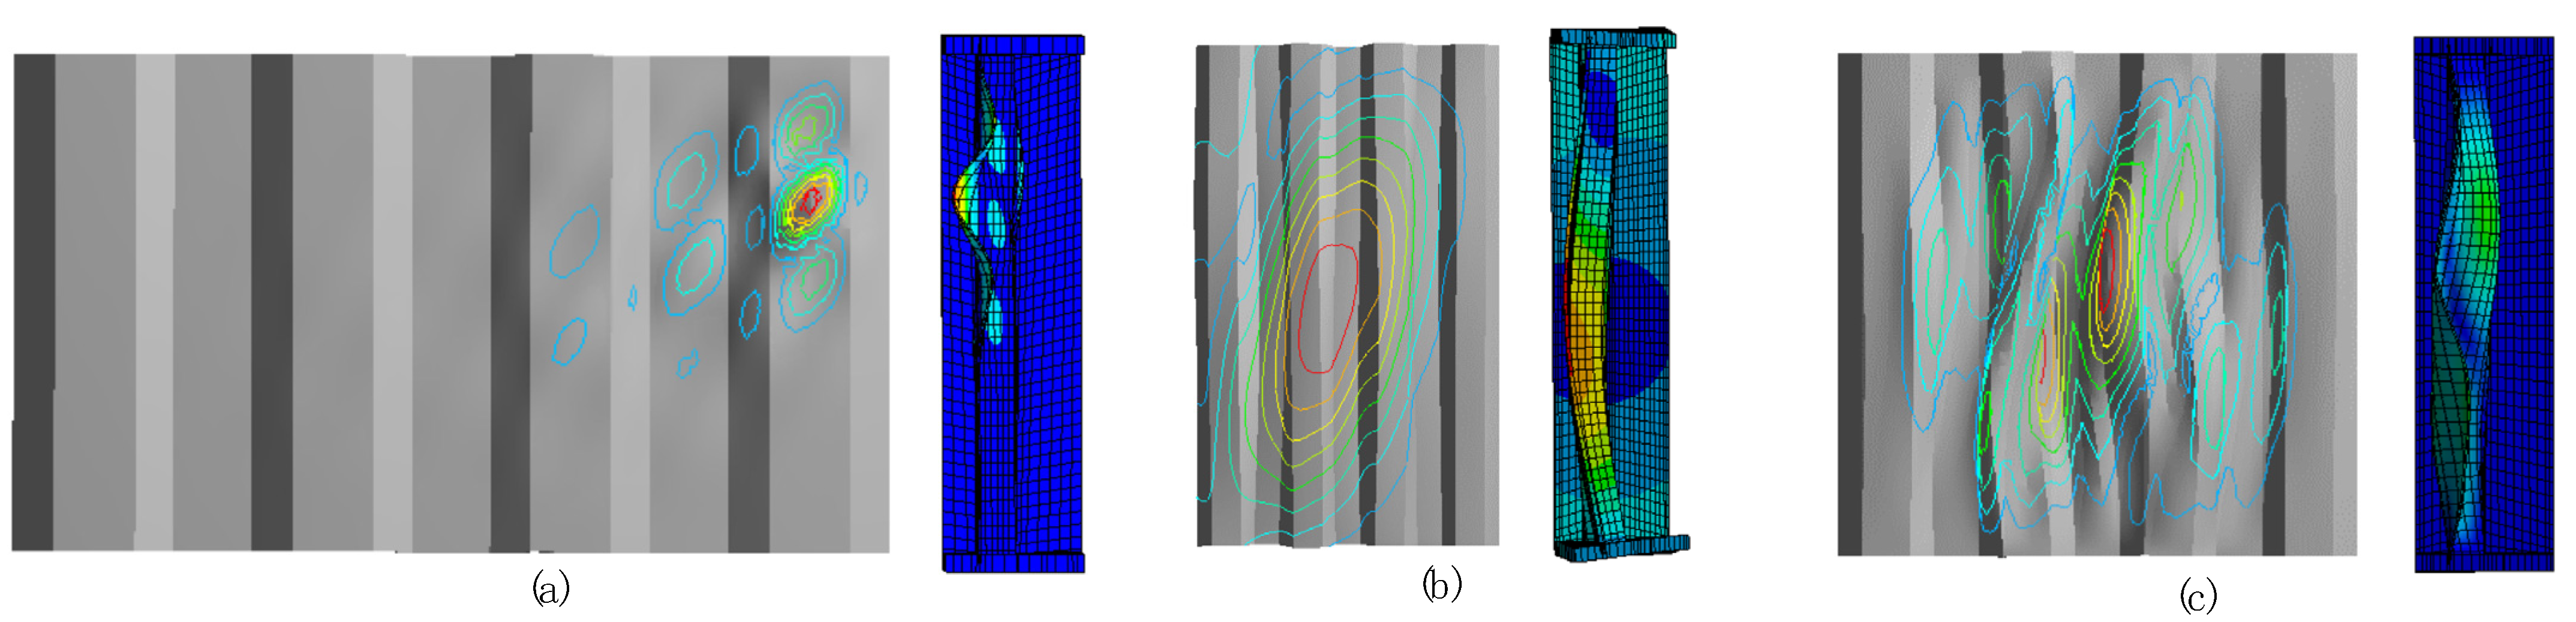
In this study, three finite element models were developed and analyzed using linear buckling analysis. The geometry of each model was prepared in such a way as to observe the three shear buckling modes.
Figure 2 shows each web’s primary failure mode alongside the vertical profile’s deformed shape. The local shear buckling mode shown in
Figure 2a) occurred only in the longitudinal flat folds of the web, and the profile shows that the out-of-plane deformations are localized in a small region of the web depth. The global shear buckling (
Figure 2b) involved the entire web, and the out-of-plane deformations covered the whole web depth, depicting a similar behavior commonly seen in pin-ended columns subjected to the Euler first buckling mode.
Figure 2c shows that the interactive shear buckling, which, as in the global buckling, also involves several folds; however, the buckles are localized only in a part of the web.
Generally, to estimate the shear buckling of corrugated and straight web steel beams, the isotropic plate buckling theory [
14] is used. Guo and Sause [
2] tested this theory on trapezoidal corrugated webs through experimental and finite element analysis and proved that the estimate of the shear buckling stresses was accurate. The local elastic shear buckling stress,
, is given by Elgaaly et al. [
6]:
For straight web plates, the width
, and for triangular webs,
, whereas for trapezoidal webs,
.
is the coefficient of local shear buckling;
is Young’s modulus, and
is web material Poisson’s ratio. For a corrugated web with simply supported edges,
5.34, while for clamped edges,
8.98 [
6].
Similarly, for estimation of the global elastic shear stress,
, the theory of orthotropic plate buckling developed by [
29] is used:
where
is the coefficient of global shear buckling and
and
are the stiffnesses calculated per unit length of the web in the longitudinal and transverse bending directions. Elgaaly et al. [
6] recommended
for a corrugated web when the web is simply supported by the flanges of the beam and
for a corrugated web when the web and the flanges are clamped together.
Various formulas for estimation of the interactive shear stress,
, were developed by several researchers who considered the interaction between the two shear buckling failure modes (i.e., local and global) and the yielding of material. All formulas share the below form:
where
is the yield shear stress according to the yield criterion of von Mises and
is the web uniaxial yield stress. The parameter
in Equation (3) will be equal to zero if the interaction considers only the local and shear buckling; however, when the interaction also involves material yielding, then
is not equal to zero.
Leblouba et al. [
11] developed a mathematical model that can provide a prediction of the load carrying capacity of CWSGs with trapezoidal webs. The nominal shear buckling strength,
, is determined as follows:
where
presents the normalized shear strength of the CWSGs, which is a function of the interactive slenderness ratio denoted by
:
where
1.4,
1.7, and
Equation (6) is the interactive shear stress given by Equation (3) with
and
.
3. Experimental Program
In a large experimental program, a total of twelve (12) shear-critical beam specimens with various web configurations were tested: one beam with a straight web, two with triangular corrugated webs, and the remainder with trapezoidal corrugated webs. Out of the twelve beams, eight results were published in a previous study by the same authors, [
11,
23]. The remaining four specimens are newly fabricated and tested.
Figure 3 shows a typical plated and corrugated web beam specimen. Specimen geometry characteristics are reported in
Table 1. Three typical depths, 305, 410, and 505 mm, are considered to investigate the web depth effect,
, on the shear behavior of corrugated beam specimens with trapezoidal webs. In addition, similar beams made of two different corrugation angles, 30° and 45°, are also included to study the effects of the corrugation angle,
, if any. The angles considered are common in practical applications.
Each beam consisted of two thick flanges, either 1.2 mm or 2 mm-thick steel web plates, and three stiffeners: one in the center and two at each end of the beam (see
Figure 3), except B20-505-45-N, with only two middle stiffeners. The stiffeners in the B-series beams had a width of 75 mm and a thickness of 12 mm, while the rest of the beams had a width of 50 mm and a thickness of 10 mm. In the B series beams, the flanges were
150 mm-wide and
12 mm-thick, while in the rest of the beams, the width of the flanges was 100 mm, having a thickness of 10 mm.
The straight web (i.e., specimen P20-300) and the triangular corrugated web (i.e., specimens TG20-300-30 and TG20-300-45) were continuously welded to the top and bottom flanges. However, welding was applied to all beam specimens with trapezoidal corrugated webs, considering a combination of continuity and intermittent techniques. On one side, the welding was applied continuously, while intermittent welding was considered throughout the longitudinal folds of the corrugation.
The beams were made of two distinct mild steel sheets. Material properties were obtained from tensile tests conducted on strips with a 400 mm-length cut from the same material used when making the CWSGs. For the 1.2 mm-thick webs, the average yield strength of the material was determined to be 230 MPa, while for the 2 mm-thick webs, the average yield strength was determined to be 290 MPa, except B20-305-30, B20-305-45, and B20-505-45, which were manufactured from a different steel sheet with an average yield strength of 680 MPa. The average Young’s modulus was 200 GPa for all specimens.
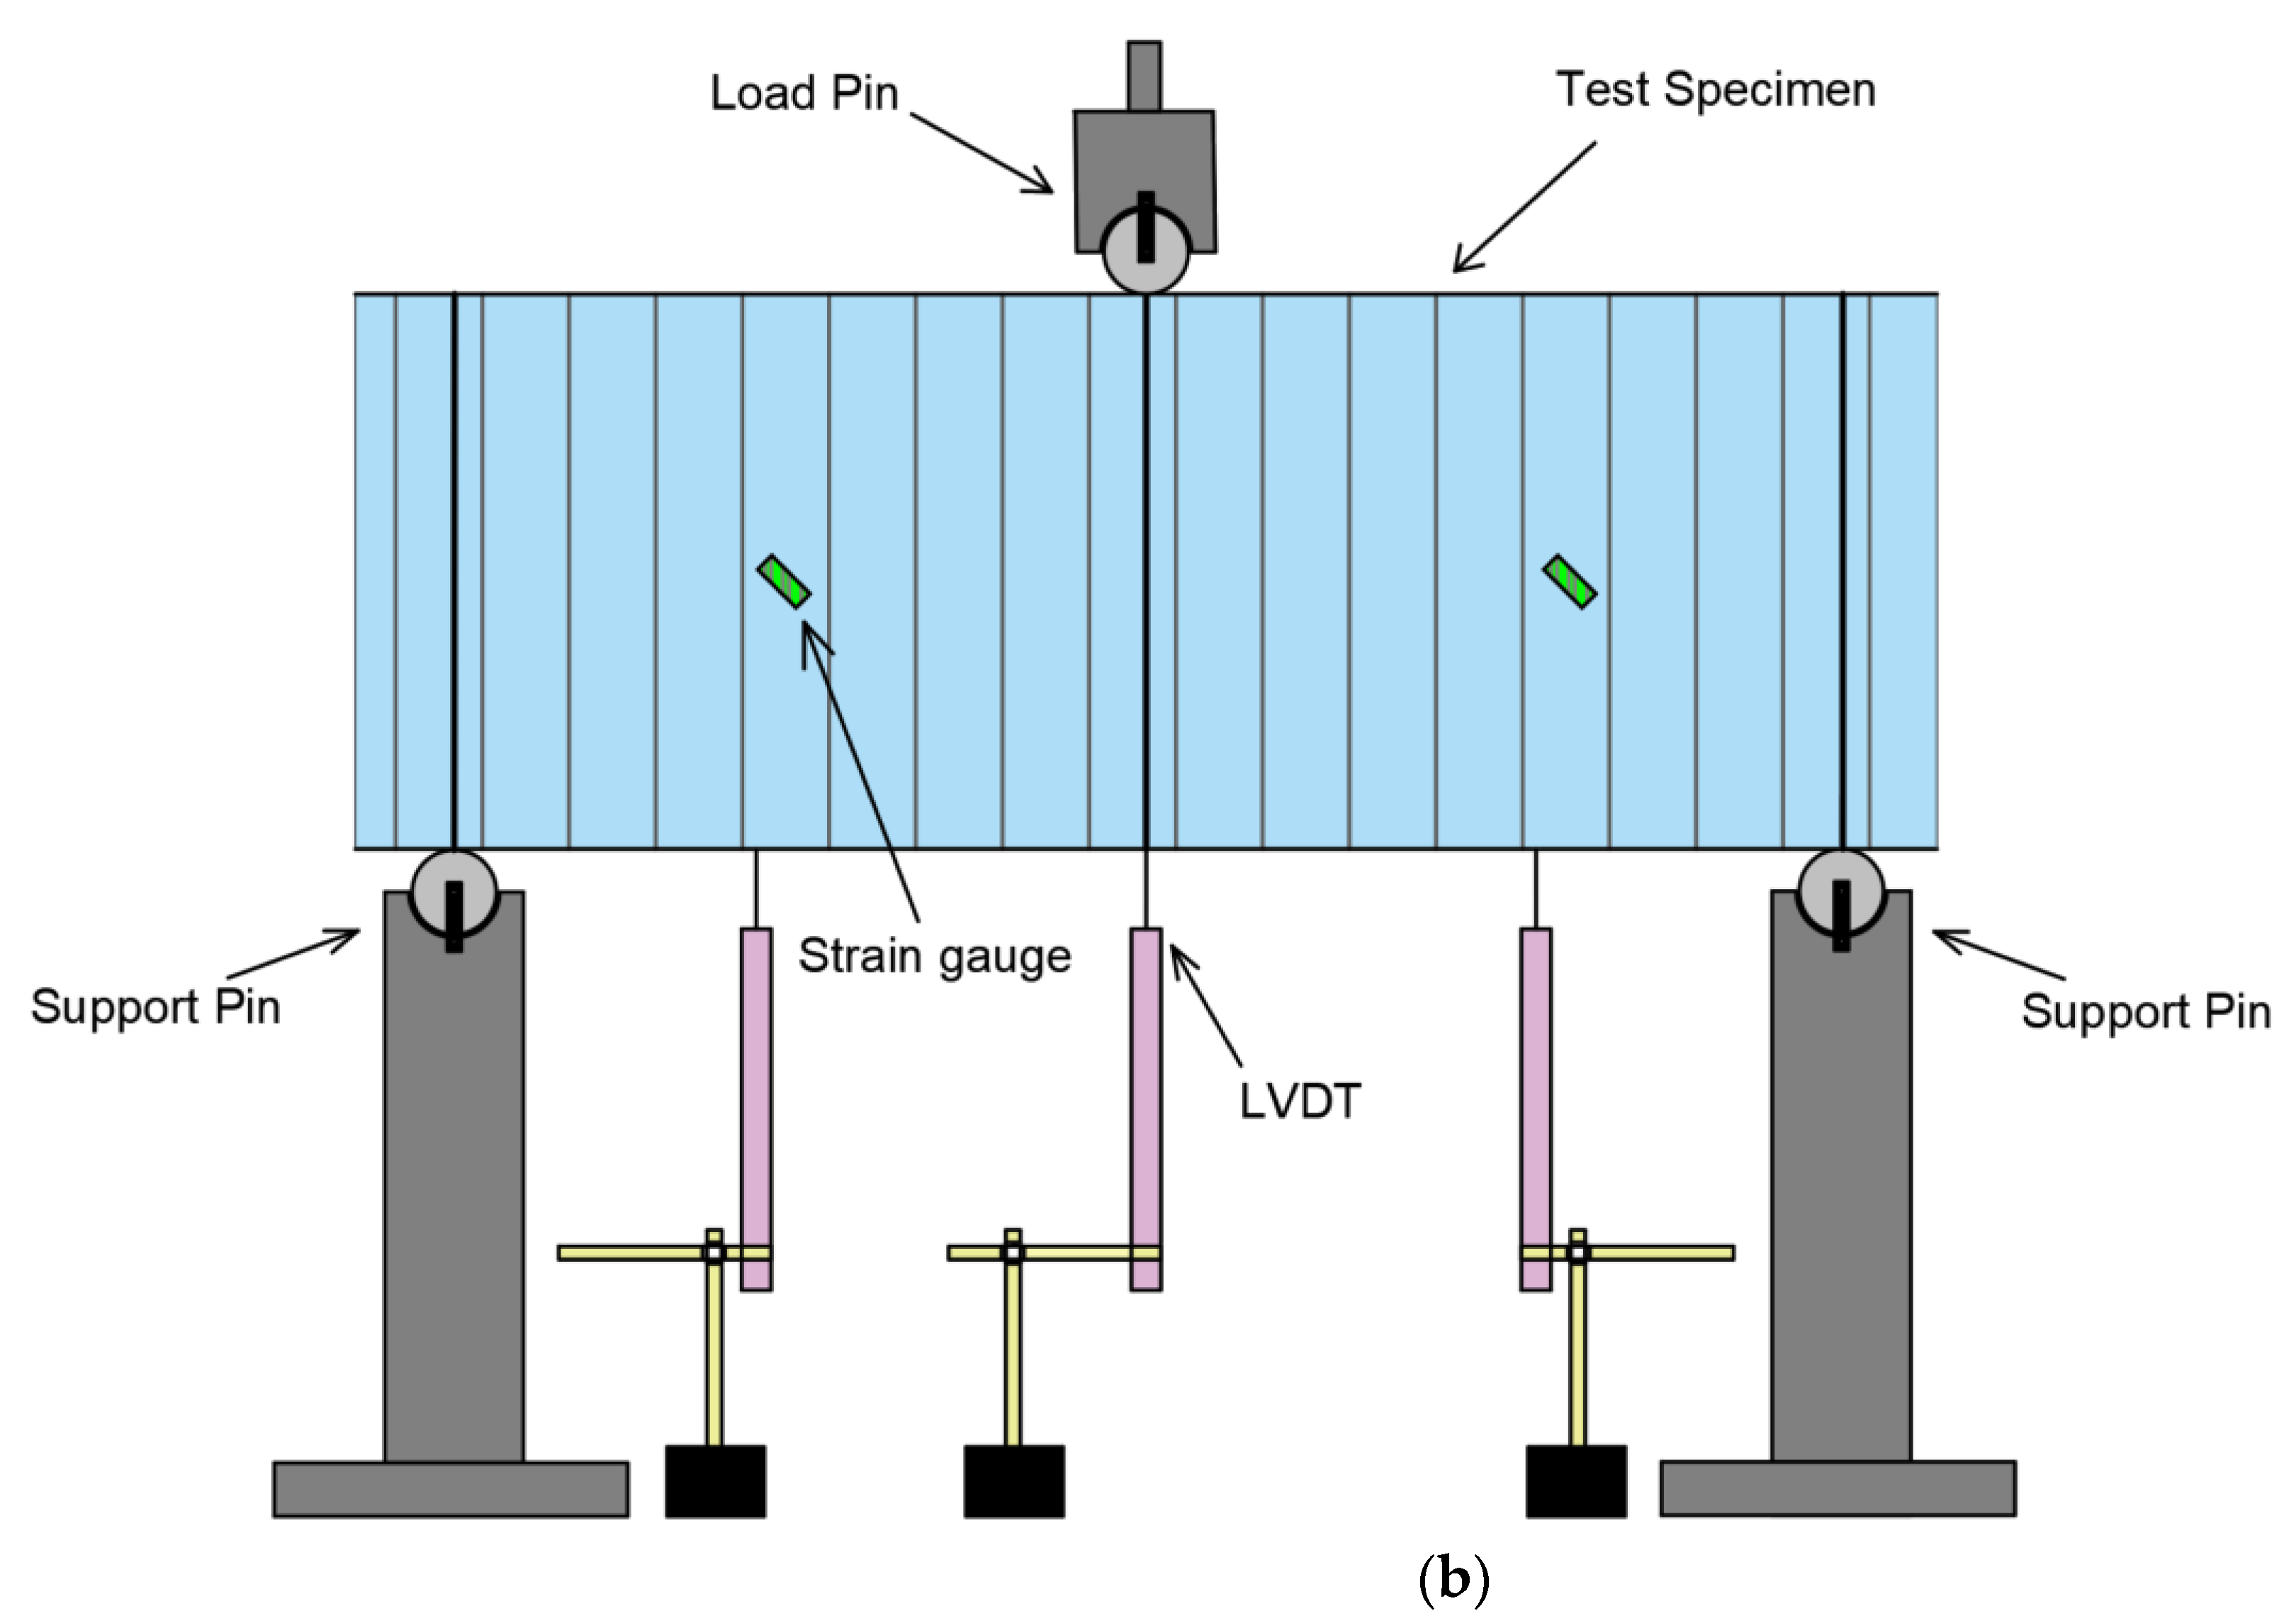
All beam specimens were tested under three-point loading in a simply supported condition. A 70 mm overhang over each beam end was ensured at the supports to prevent the beams from slipping off during the test.
Figure 3 shows the experimental setup with an actual specimen to be tested. Three linear variable displacement transducers (LVDTs) were deployed under the beam during tests. The beams were loaded using a hydraulic actuator in displacement-controlled mode at a 0.02 mm/second rate to ensure a quasi-static test setup.
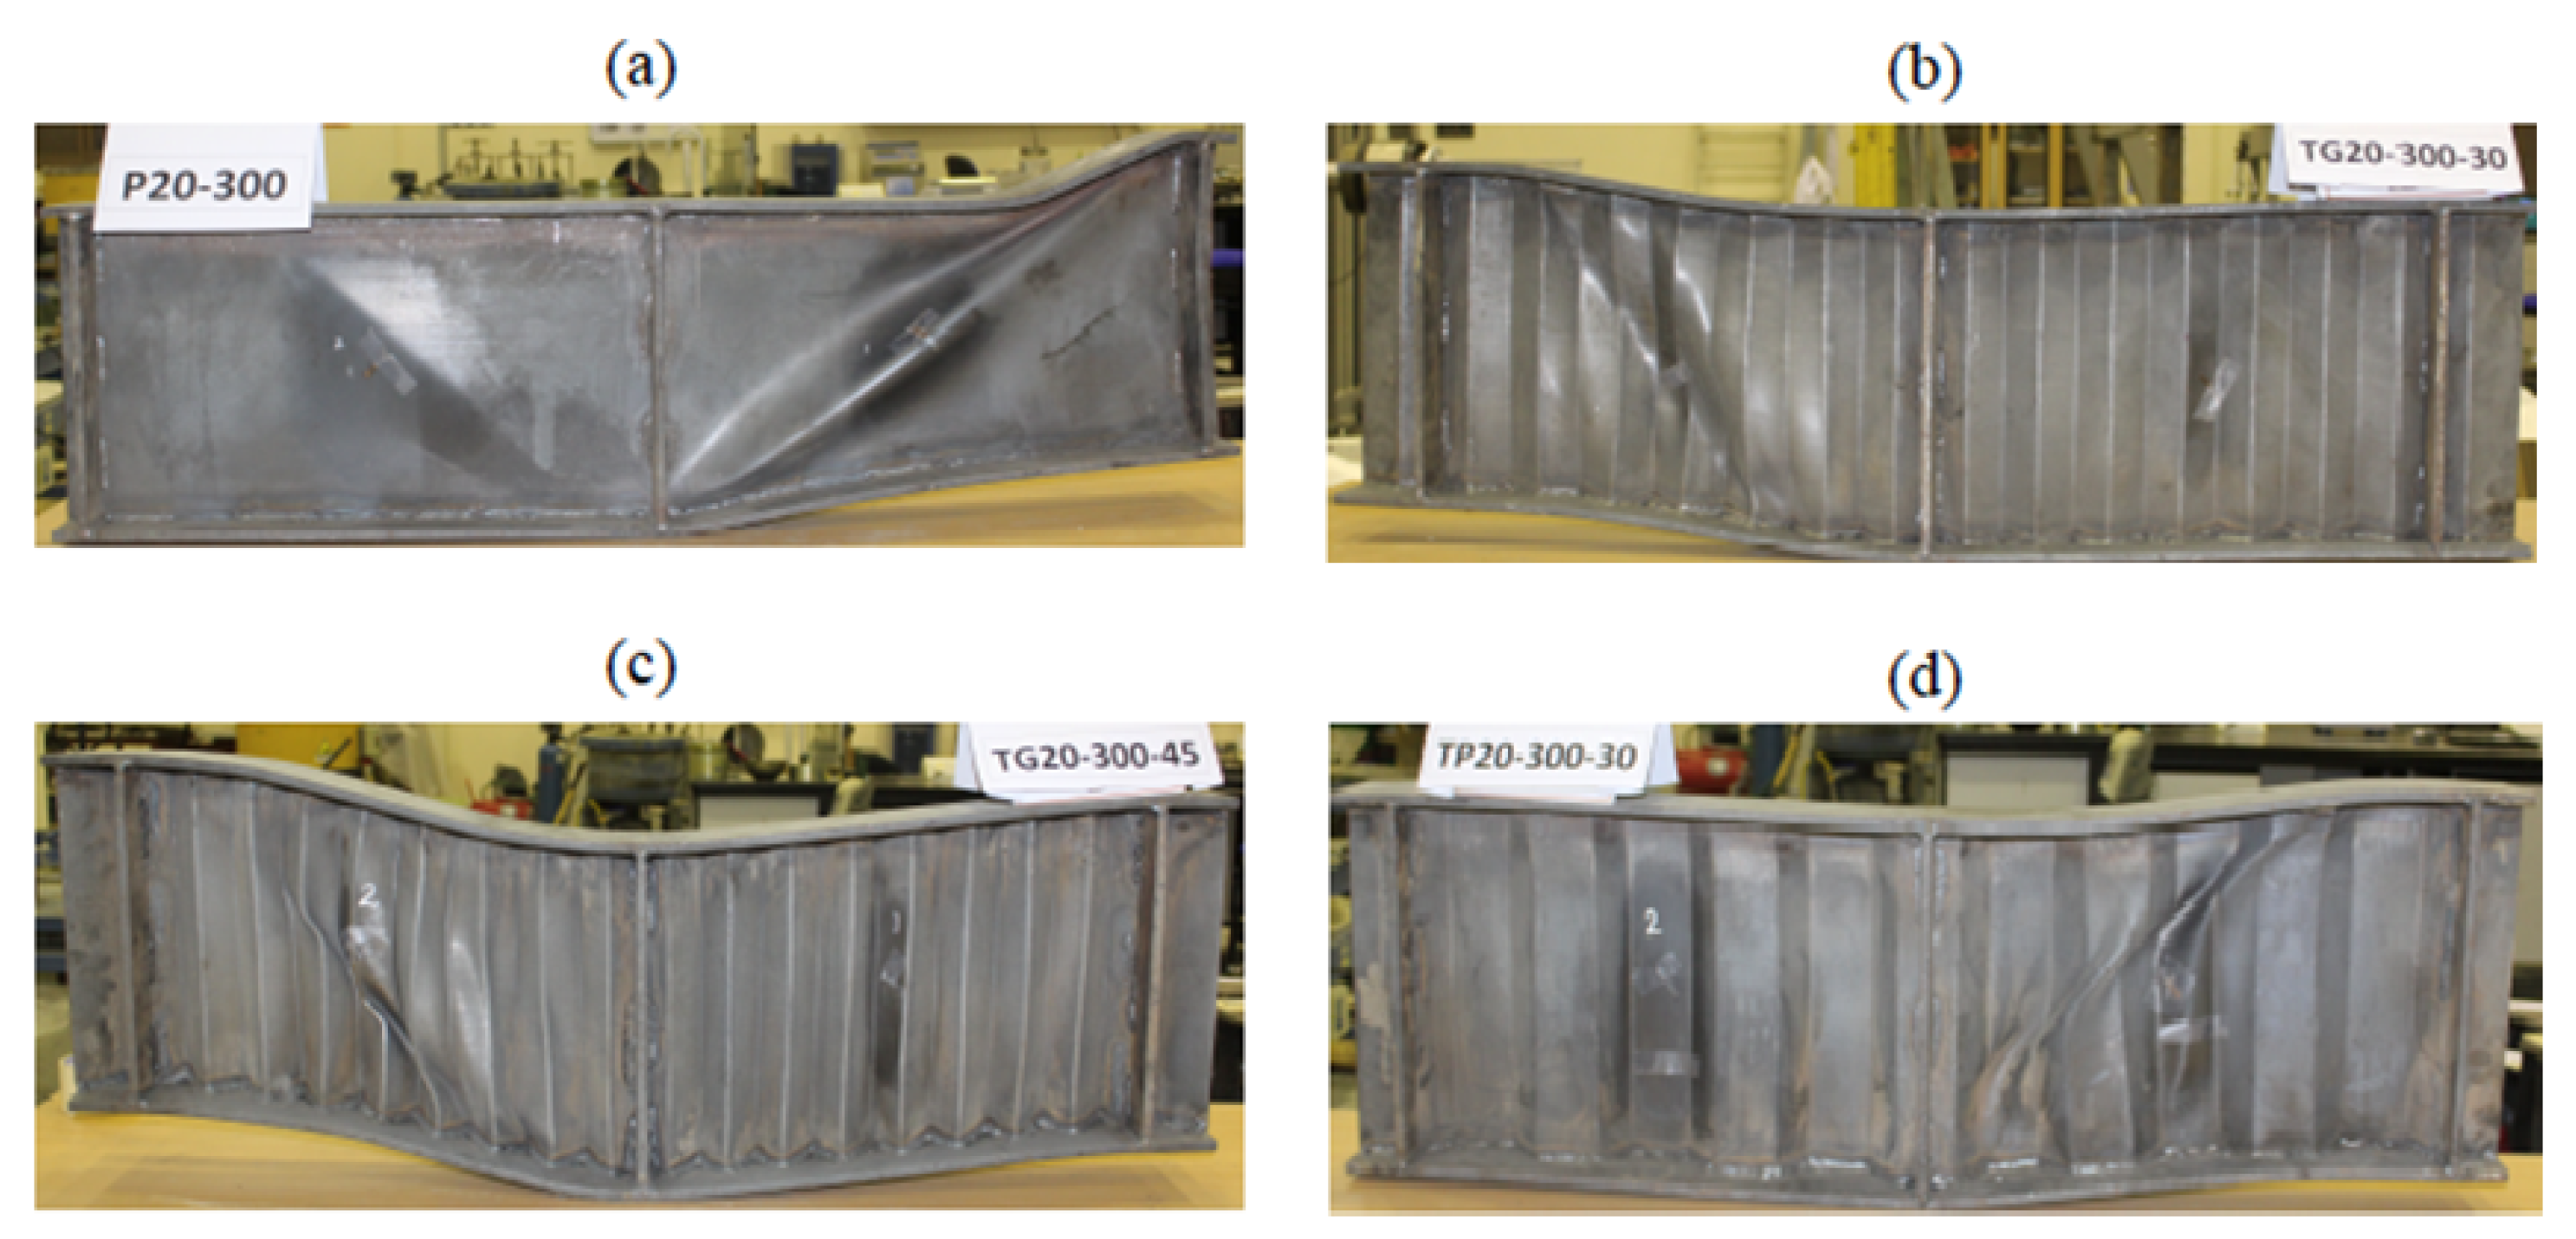
4. Results and Observations
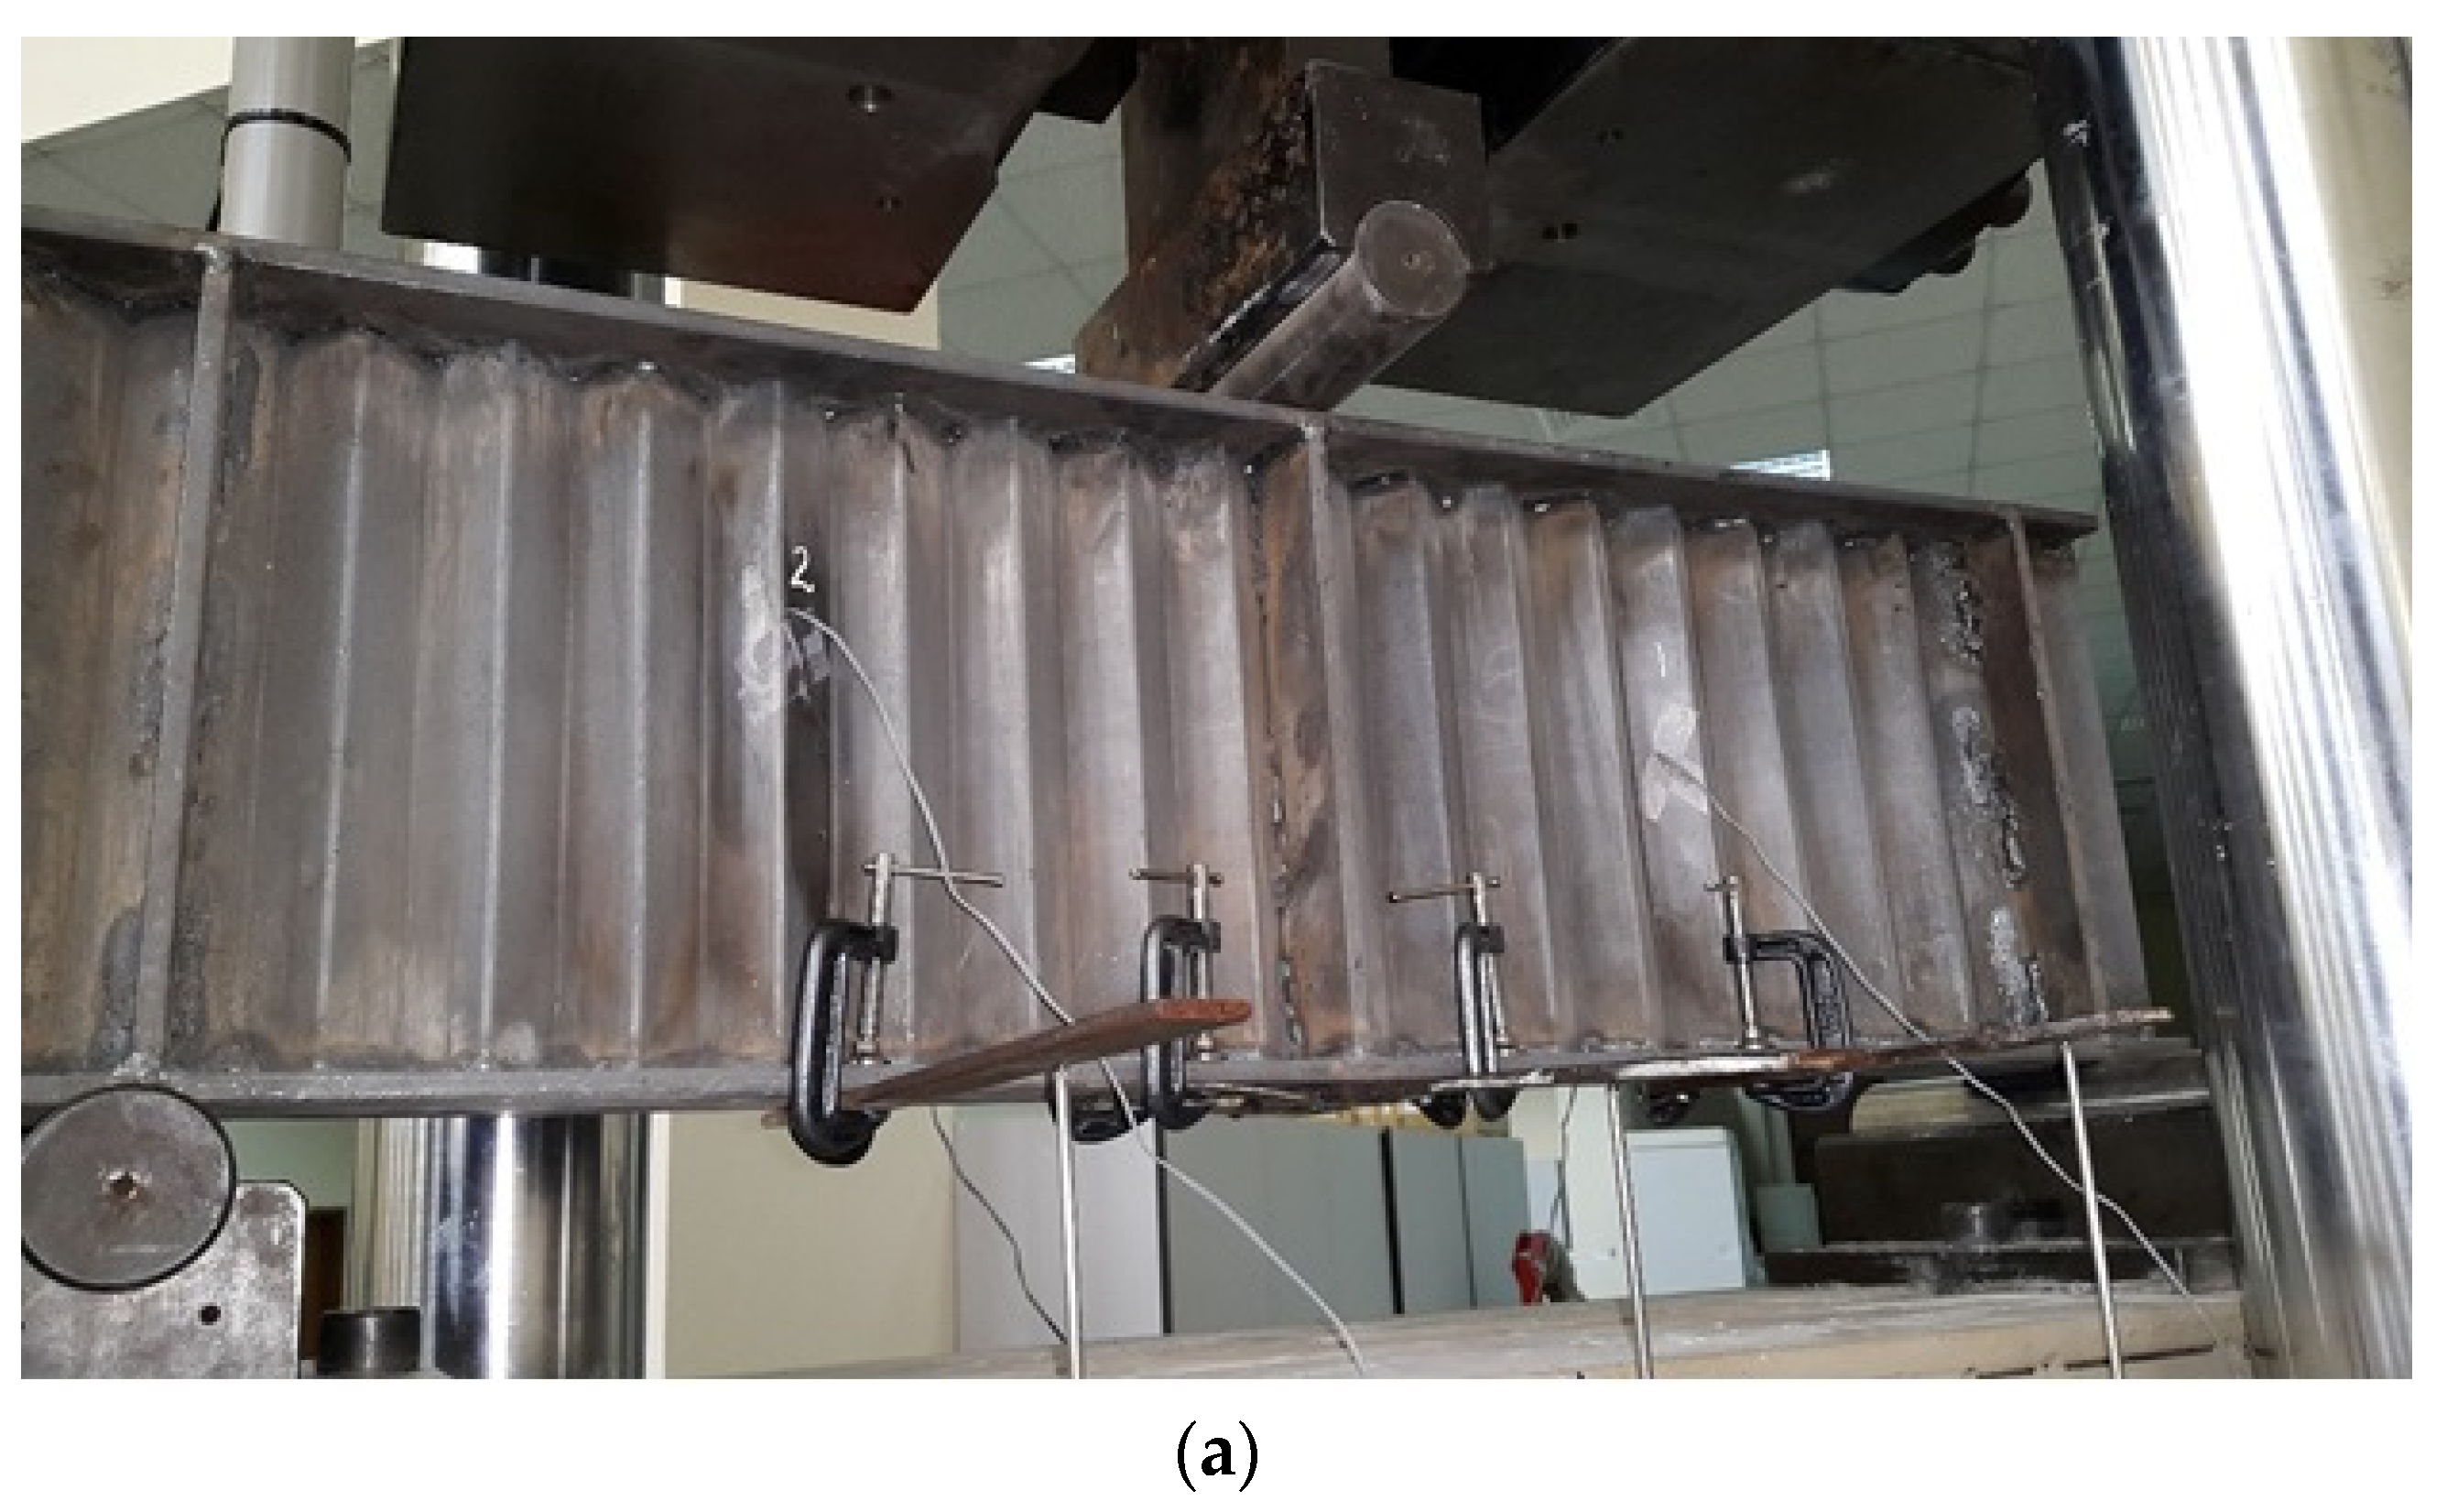
Figure 4 shows the tested specimens that failed in various failure modes. The images illustrate a visible global failure after which the test was terminated. A summary of the test results is presented in
Table 2, showing the buckling shear load,
, the buckling shear stress,
, calculated as
, and the normalized shear strength
.
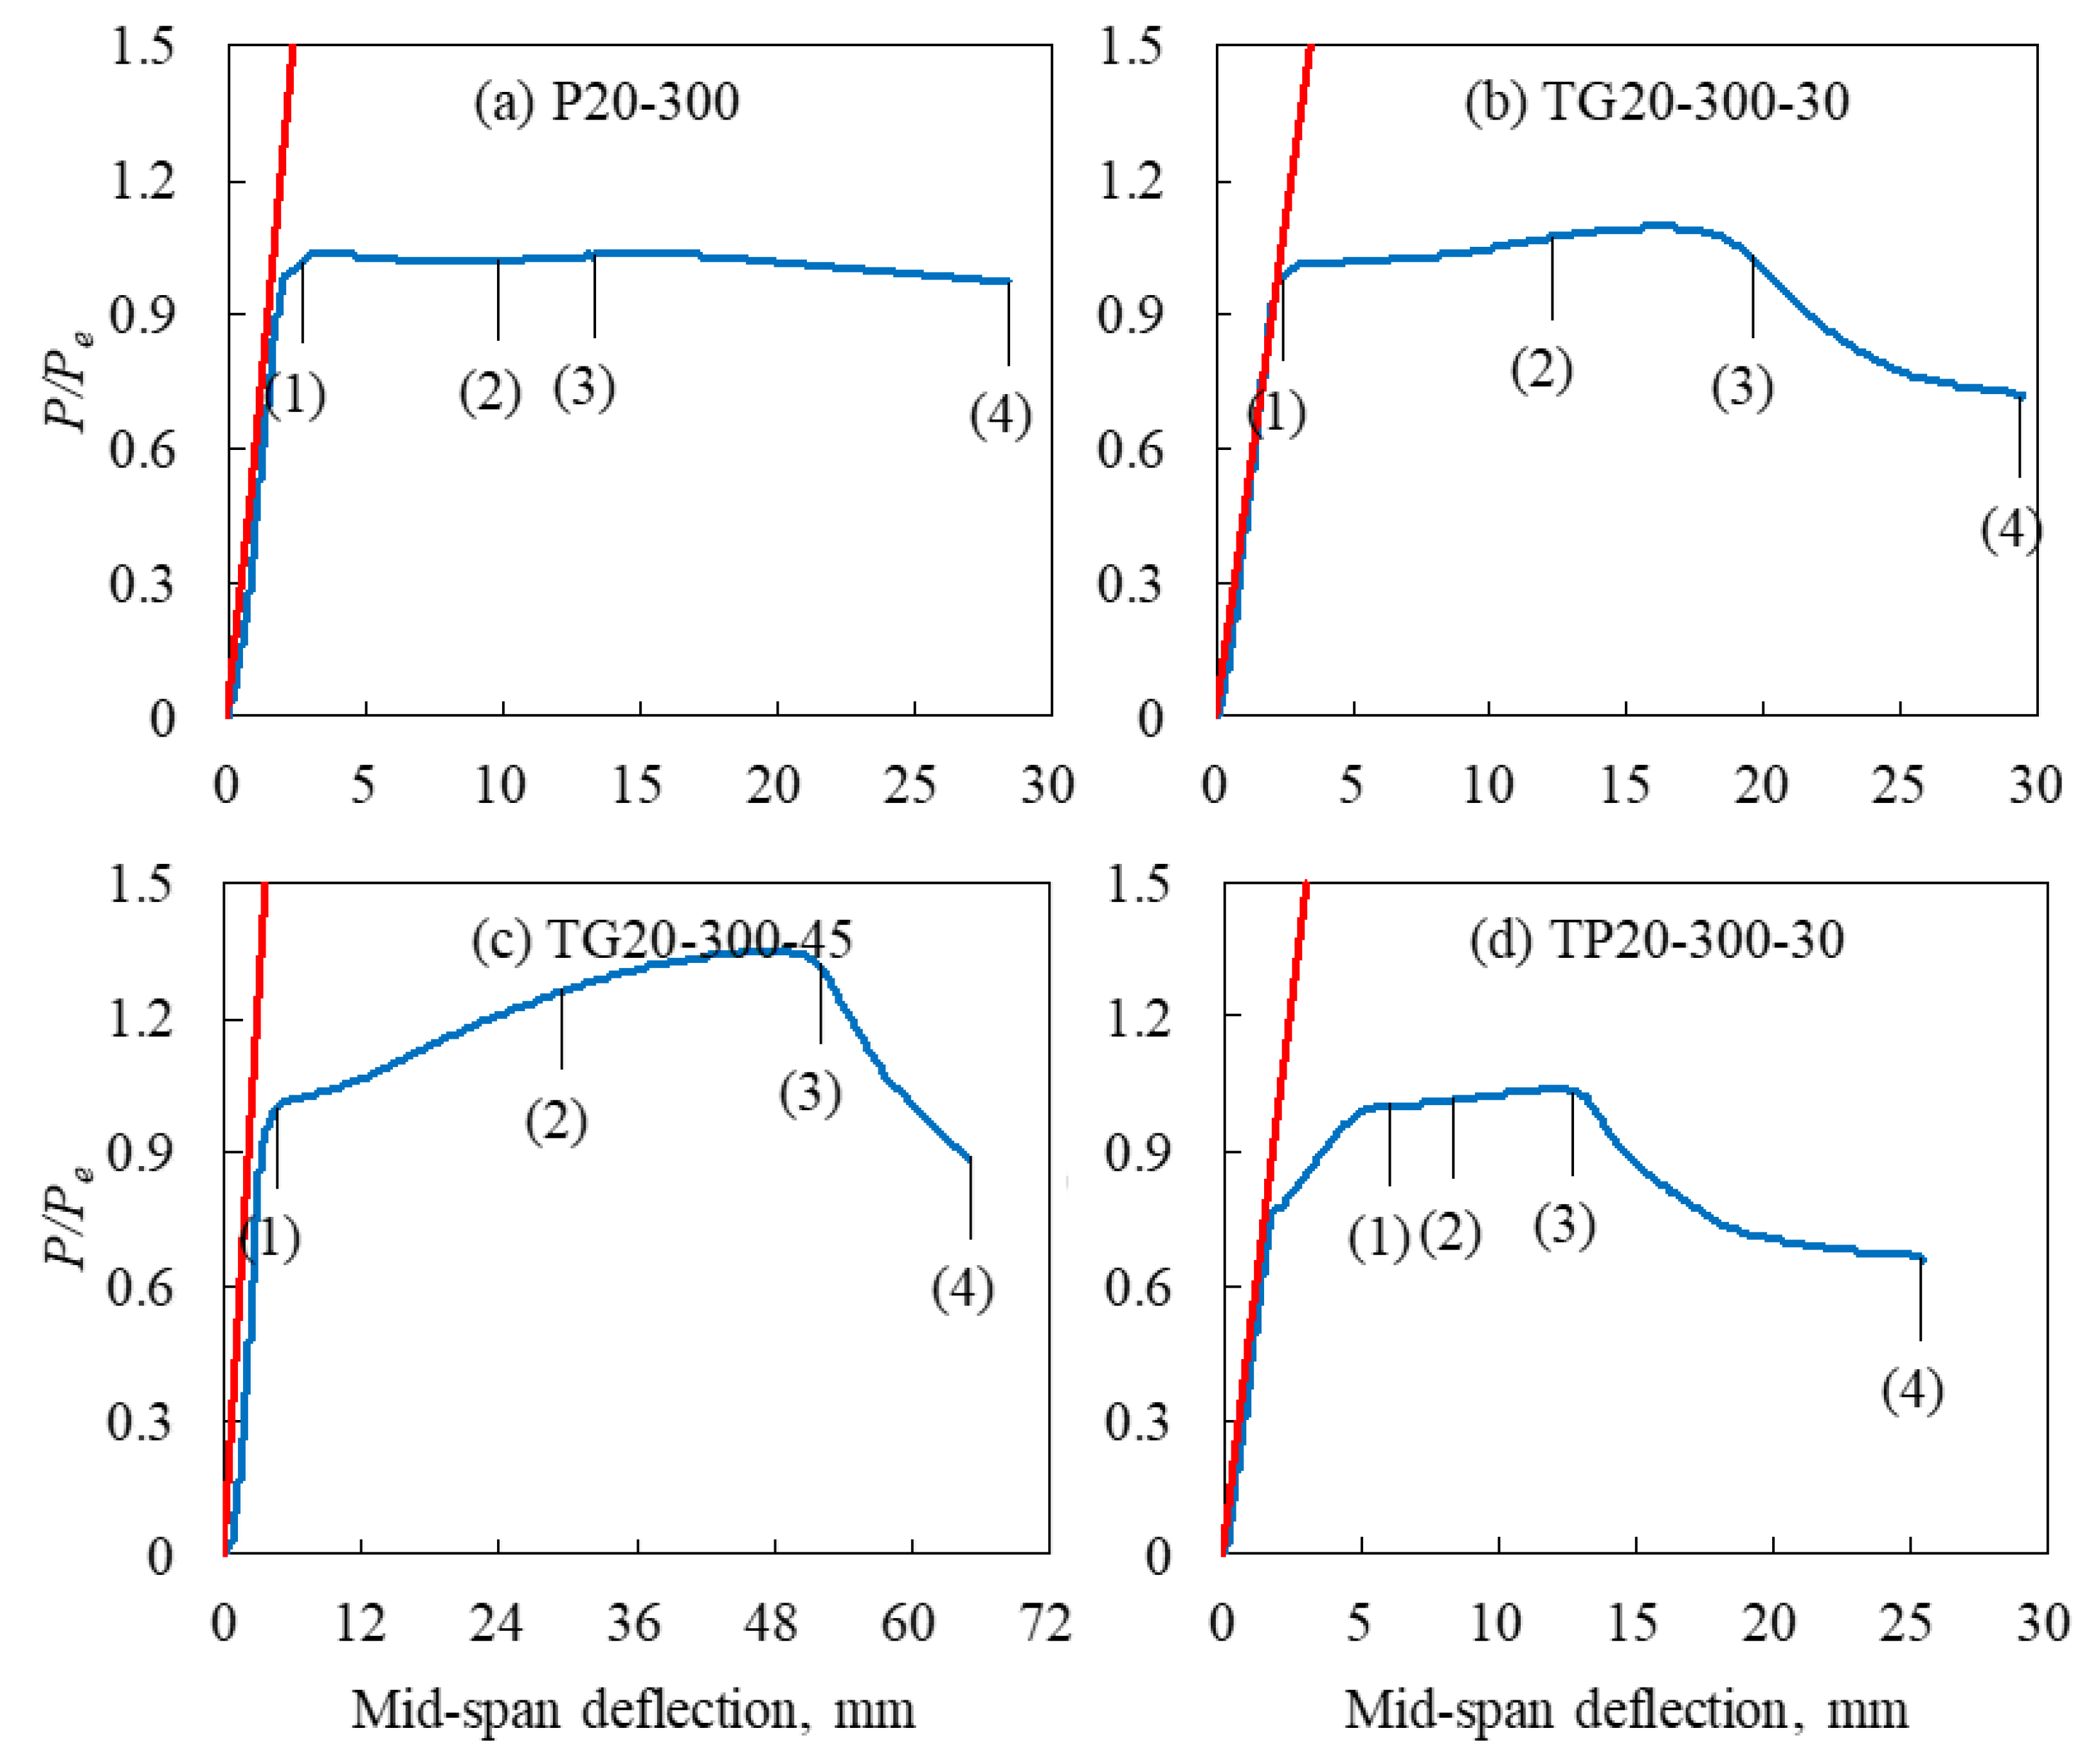
Figure 5 presents the load after normalization (normalized with respect to the critical buckling load,
) versus the deflection curves at the mid-span.
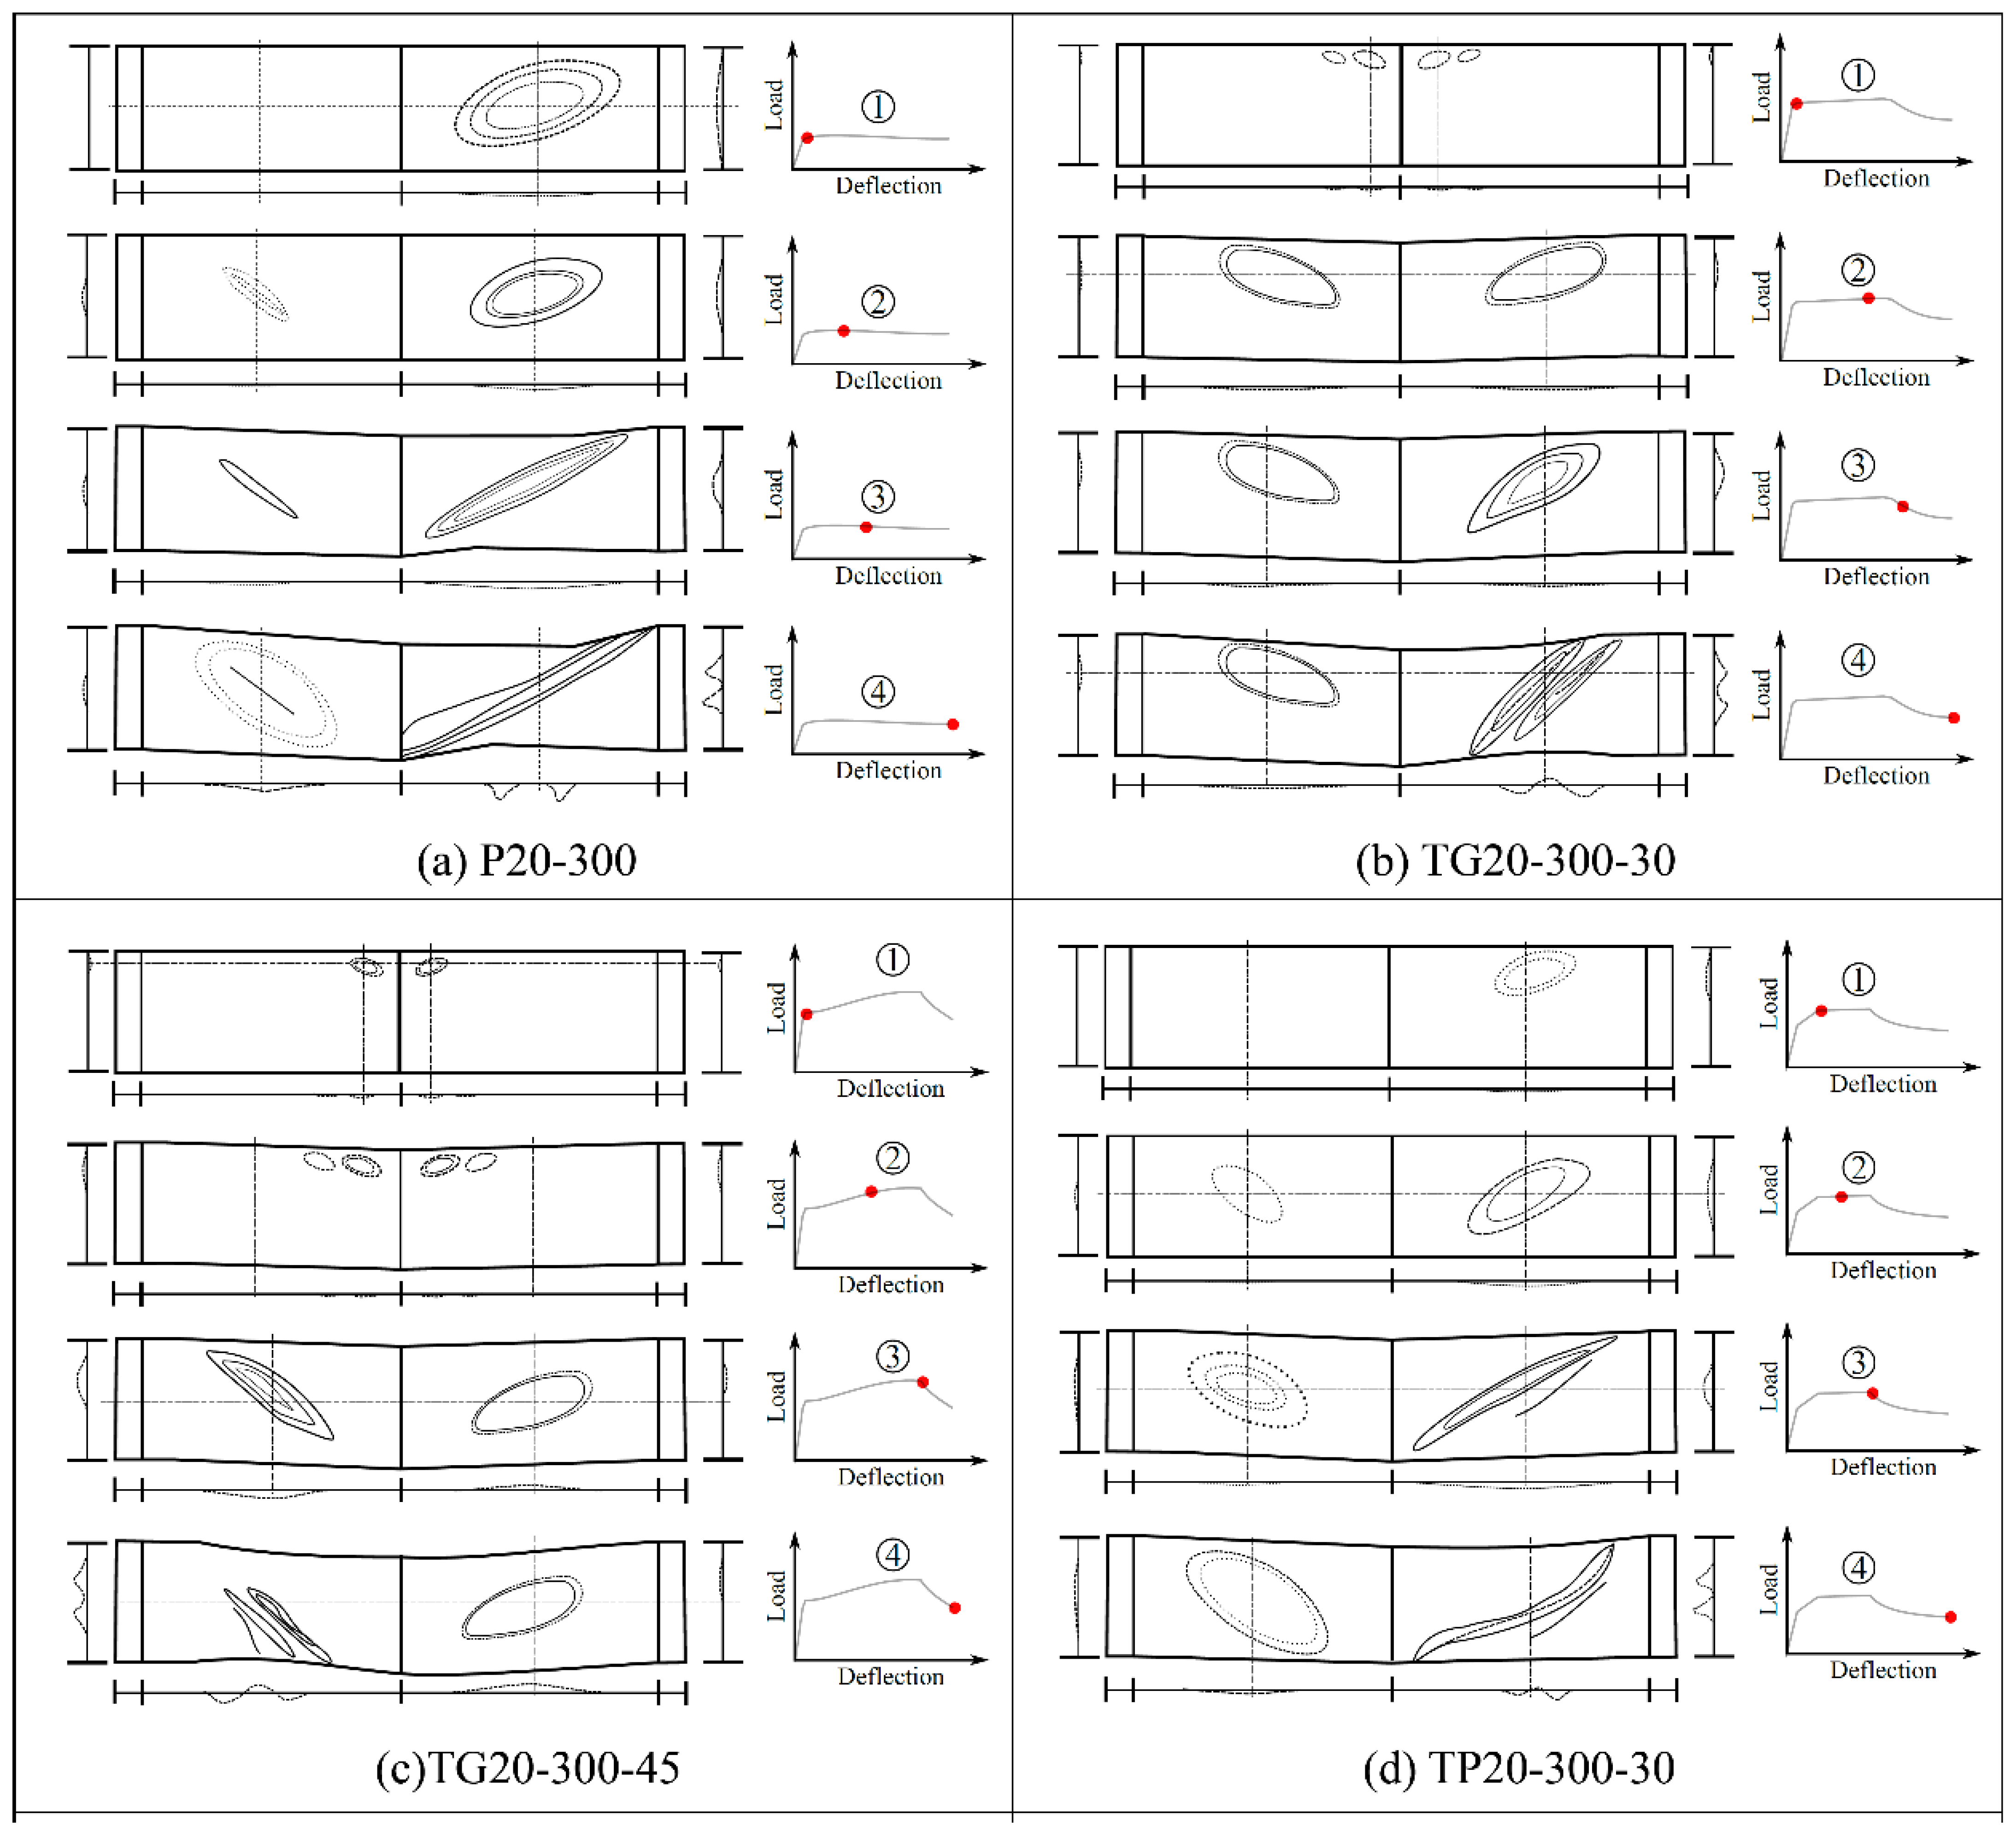
Figure 6 illustrates the specimen status at different loading stages (from stage ➀ to stage ➃). The loading stages are marked on the load-deflection curves at mid-span, shown in
Figure 5. In the figure, the shear strength refers to the maximum capacity of the section at the end of the elastic behavior (at the onset of buckling), whereas the highest point denotes the ultimate load on the load–deformation relationship. Moreover,
Table 2 reports the shear force ratios,
and
, in which
is the ultimate shear force, and
is the yield shear force estimated as
. As shown in
Table 2, the ultimate shear force to the yield shear force follows the same trend as the normalized shear strength for all specimens. With the exception of TG-20-300-45 and B20-505-45N, all specimens failed past the yielding point without hardening (i.e.,
). The beams with triangular corrugations and specimen 12 had an ultimate shear capacity that was higher than the buckling shear load. In all other specimens, the shear capacity remained the same after buckling.
Each of the four beams that were tested failed due to shear buckling. Shear buckling is a type of failure that occurs when excessive loads are applied to a beam, causing it to deform in a way that leads to its collapse. In each case, the failure occurred differently, depending on the beam’s web shape and corrugation angle. For example, beam P20-300, with a straight web plate, failed when the applied load reached 109 kN, causing a half wave to form on the right web panel. The load then increased until a full wave formed on the right web panel and caused the beam to fail. Beam TG20-300-30 with a triangular corrugated web plate failed at a much higher load of 178.54 kN when two large, symmetrical bulges formed on both sides of the beam. Finally, beam TP20-300-30, with a trapezoidal corrugation web, failed at a load of 169.43 kN when a half wave forming closest to the location of SG1 developed into a full deep wave. Overall, all the beams failed due to shear buckling when the load increased. The shape of the web and the corrugation angle were two factors that contributed to how each beam failed.
5. Parametric Analysis
This section investigates the effect of material strength and different web configurations on the shear response of the tested beams. The different web configurations include the corrugation type (straight, triangular, and trapezoidal corrugated web), the corrugation angle, and the web panel depth. The response quantities considered to represent the shear behavior of the tested beams are the shear buckling load, , initial stiffness, , and ultimate load, , defined here as the maximum load attained by the beam before the breakdown of the material (i.e., in the post-buckling stage). After normalization, these response quantities are represented by those corresponding to the straight web beam (i.e., P20-300).
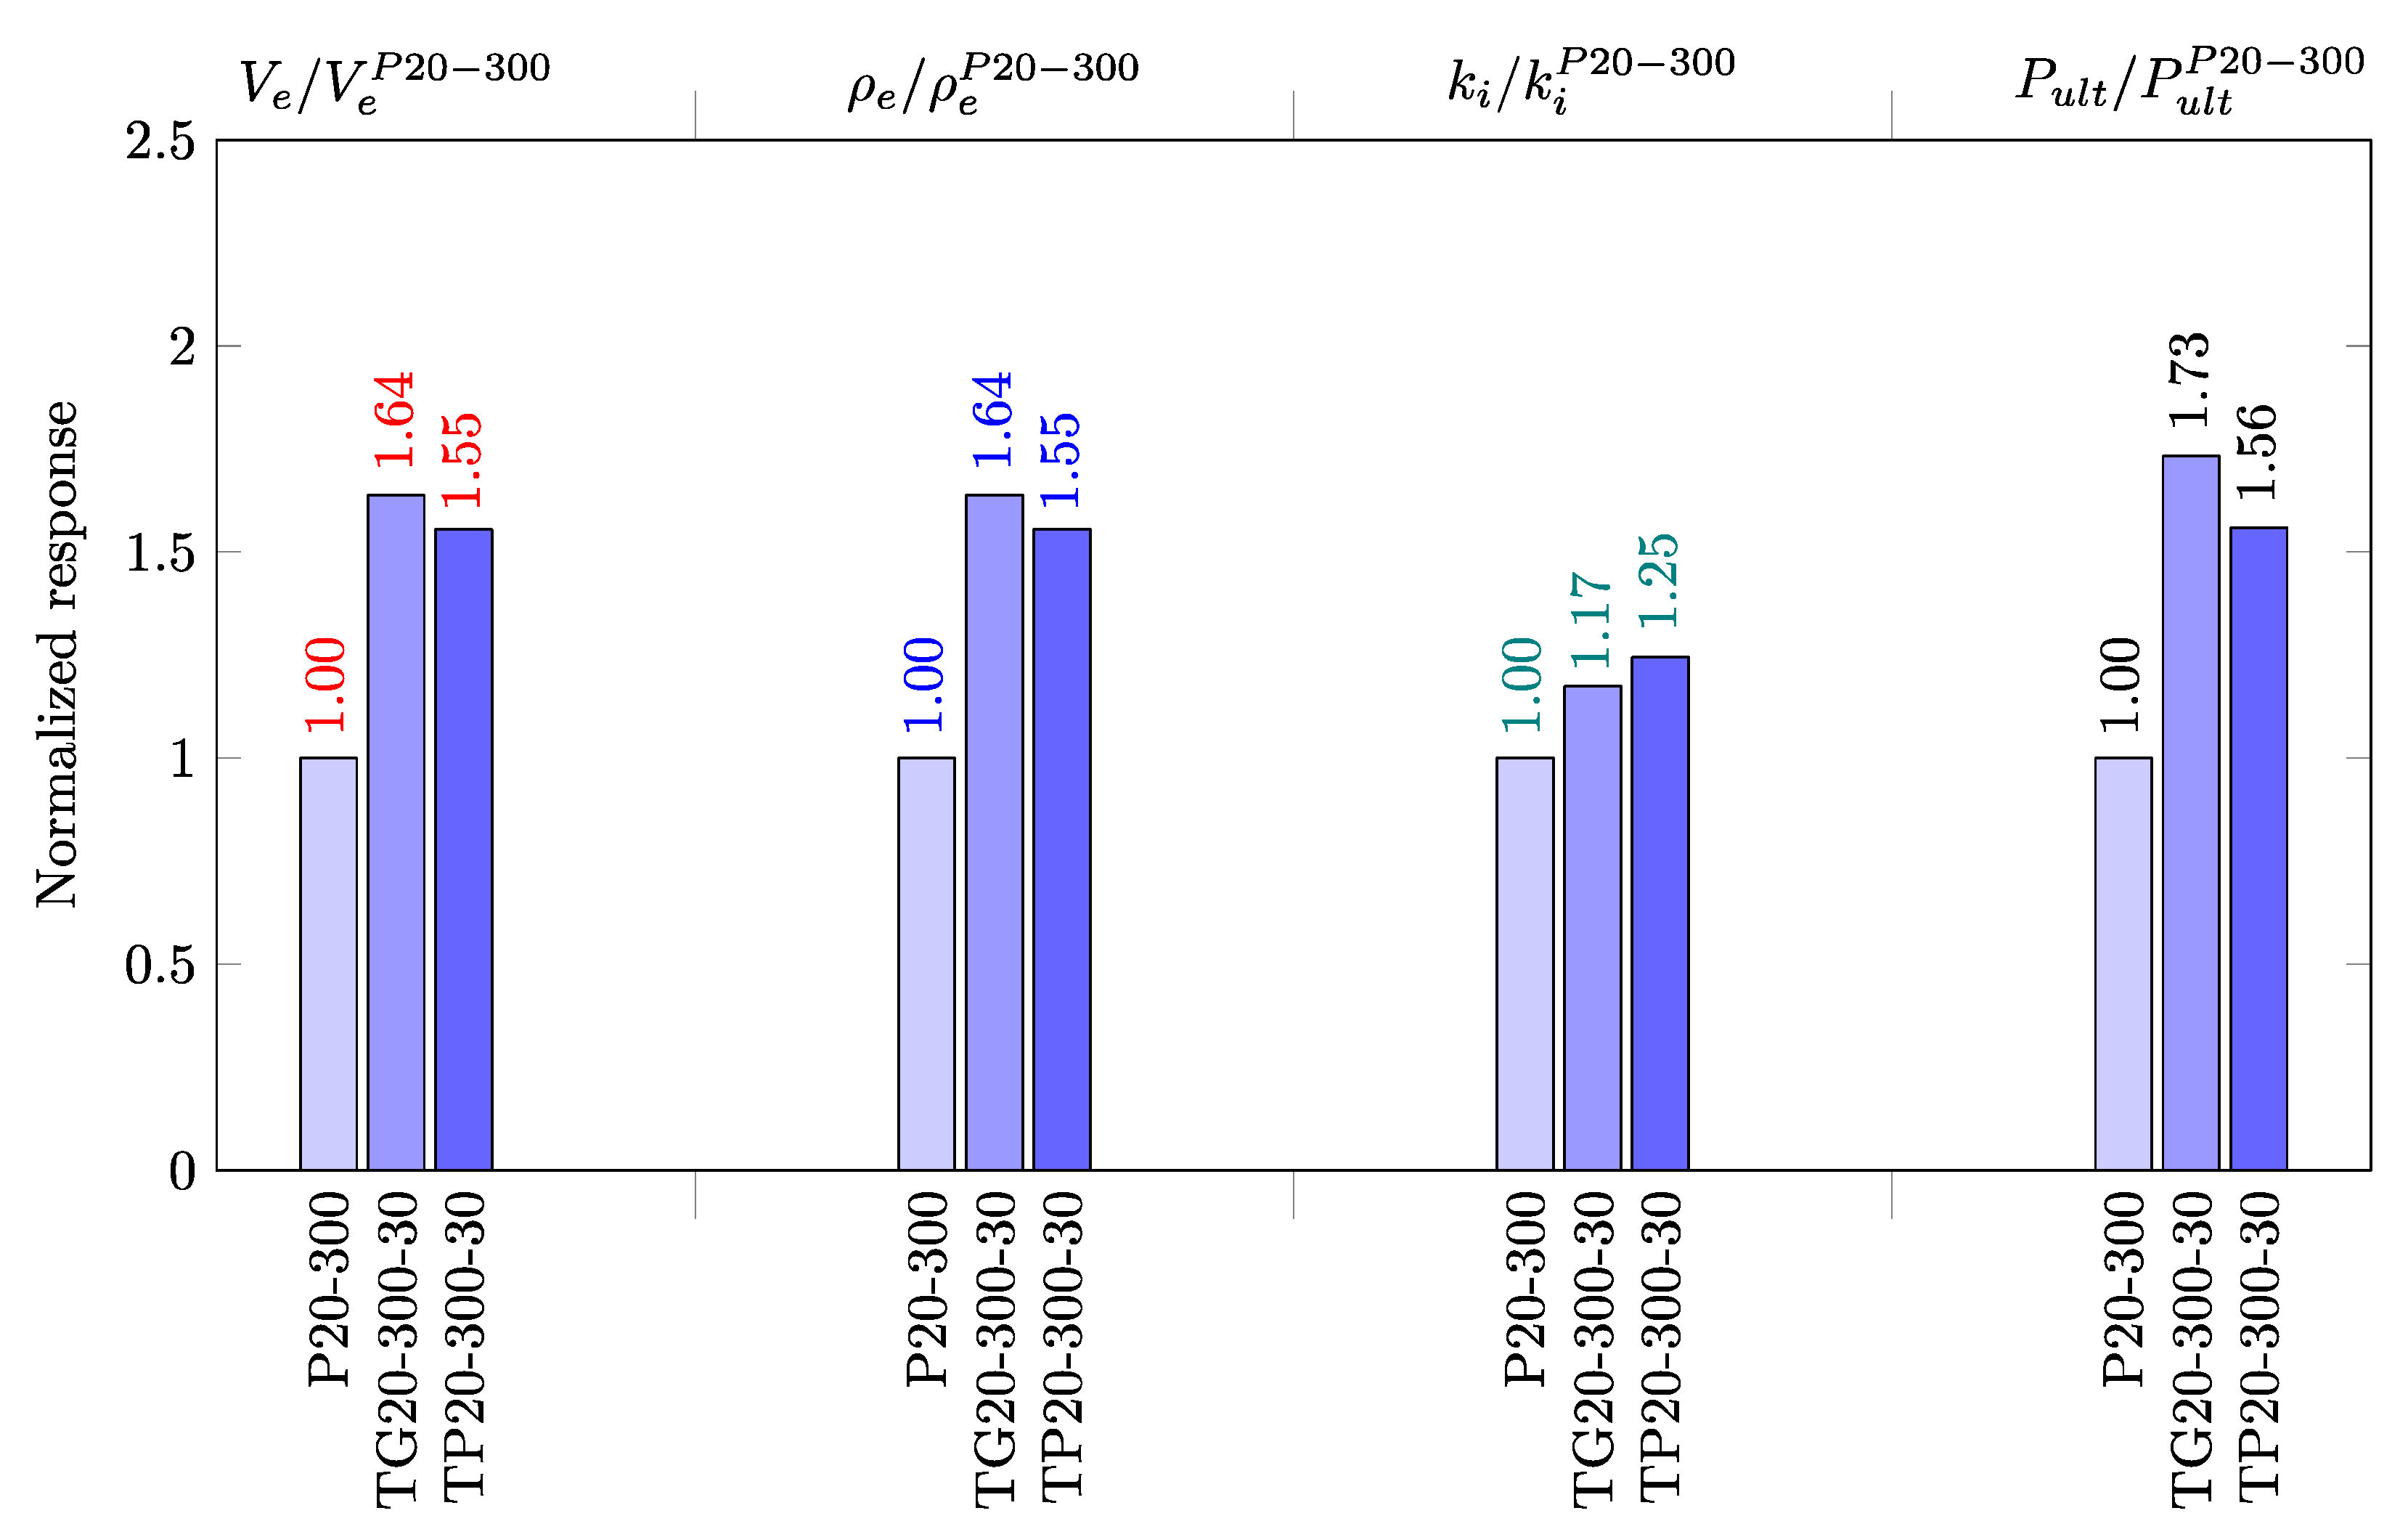
5.1. Effects of Corrugation Type
Figure 7 shows the effects of the corrugation type (i.e., straight, triangular, and trapezoidal) on three tested beams’ shear responses. The geometry of the selected beam specimens is the same, except in the corrugation type. As expected, the shear strength of the beams with corrugated webs is higher than that of the straight web beam; the shear strength of the triangular corrugated web is 64% higher than that of the straight web, whereas the shear strength of the trapezoidal corrugated web is 5% weaker than that of the triangular web. A similar trend is seen in the variation in the normalized shear strength (i.e.,
) and ultimate load carrying capacity. The initial stiffness of corrugated web beams is 17–25% higher than that of straight web beams, as shown by the red lines in
Figure 5.
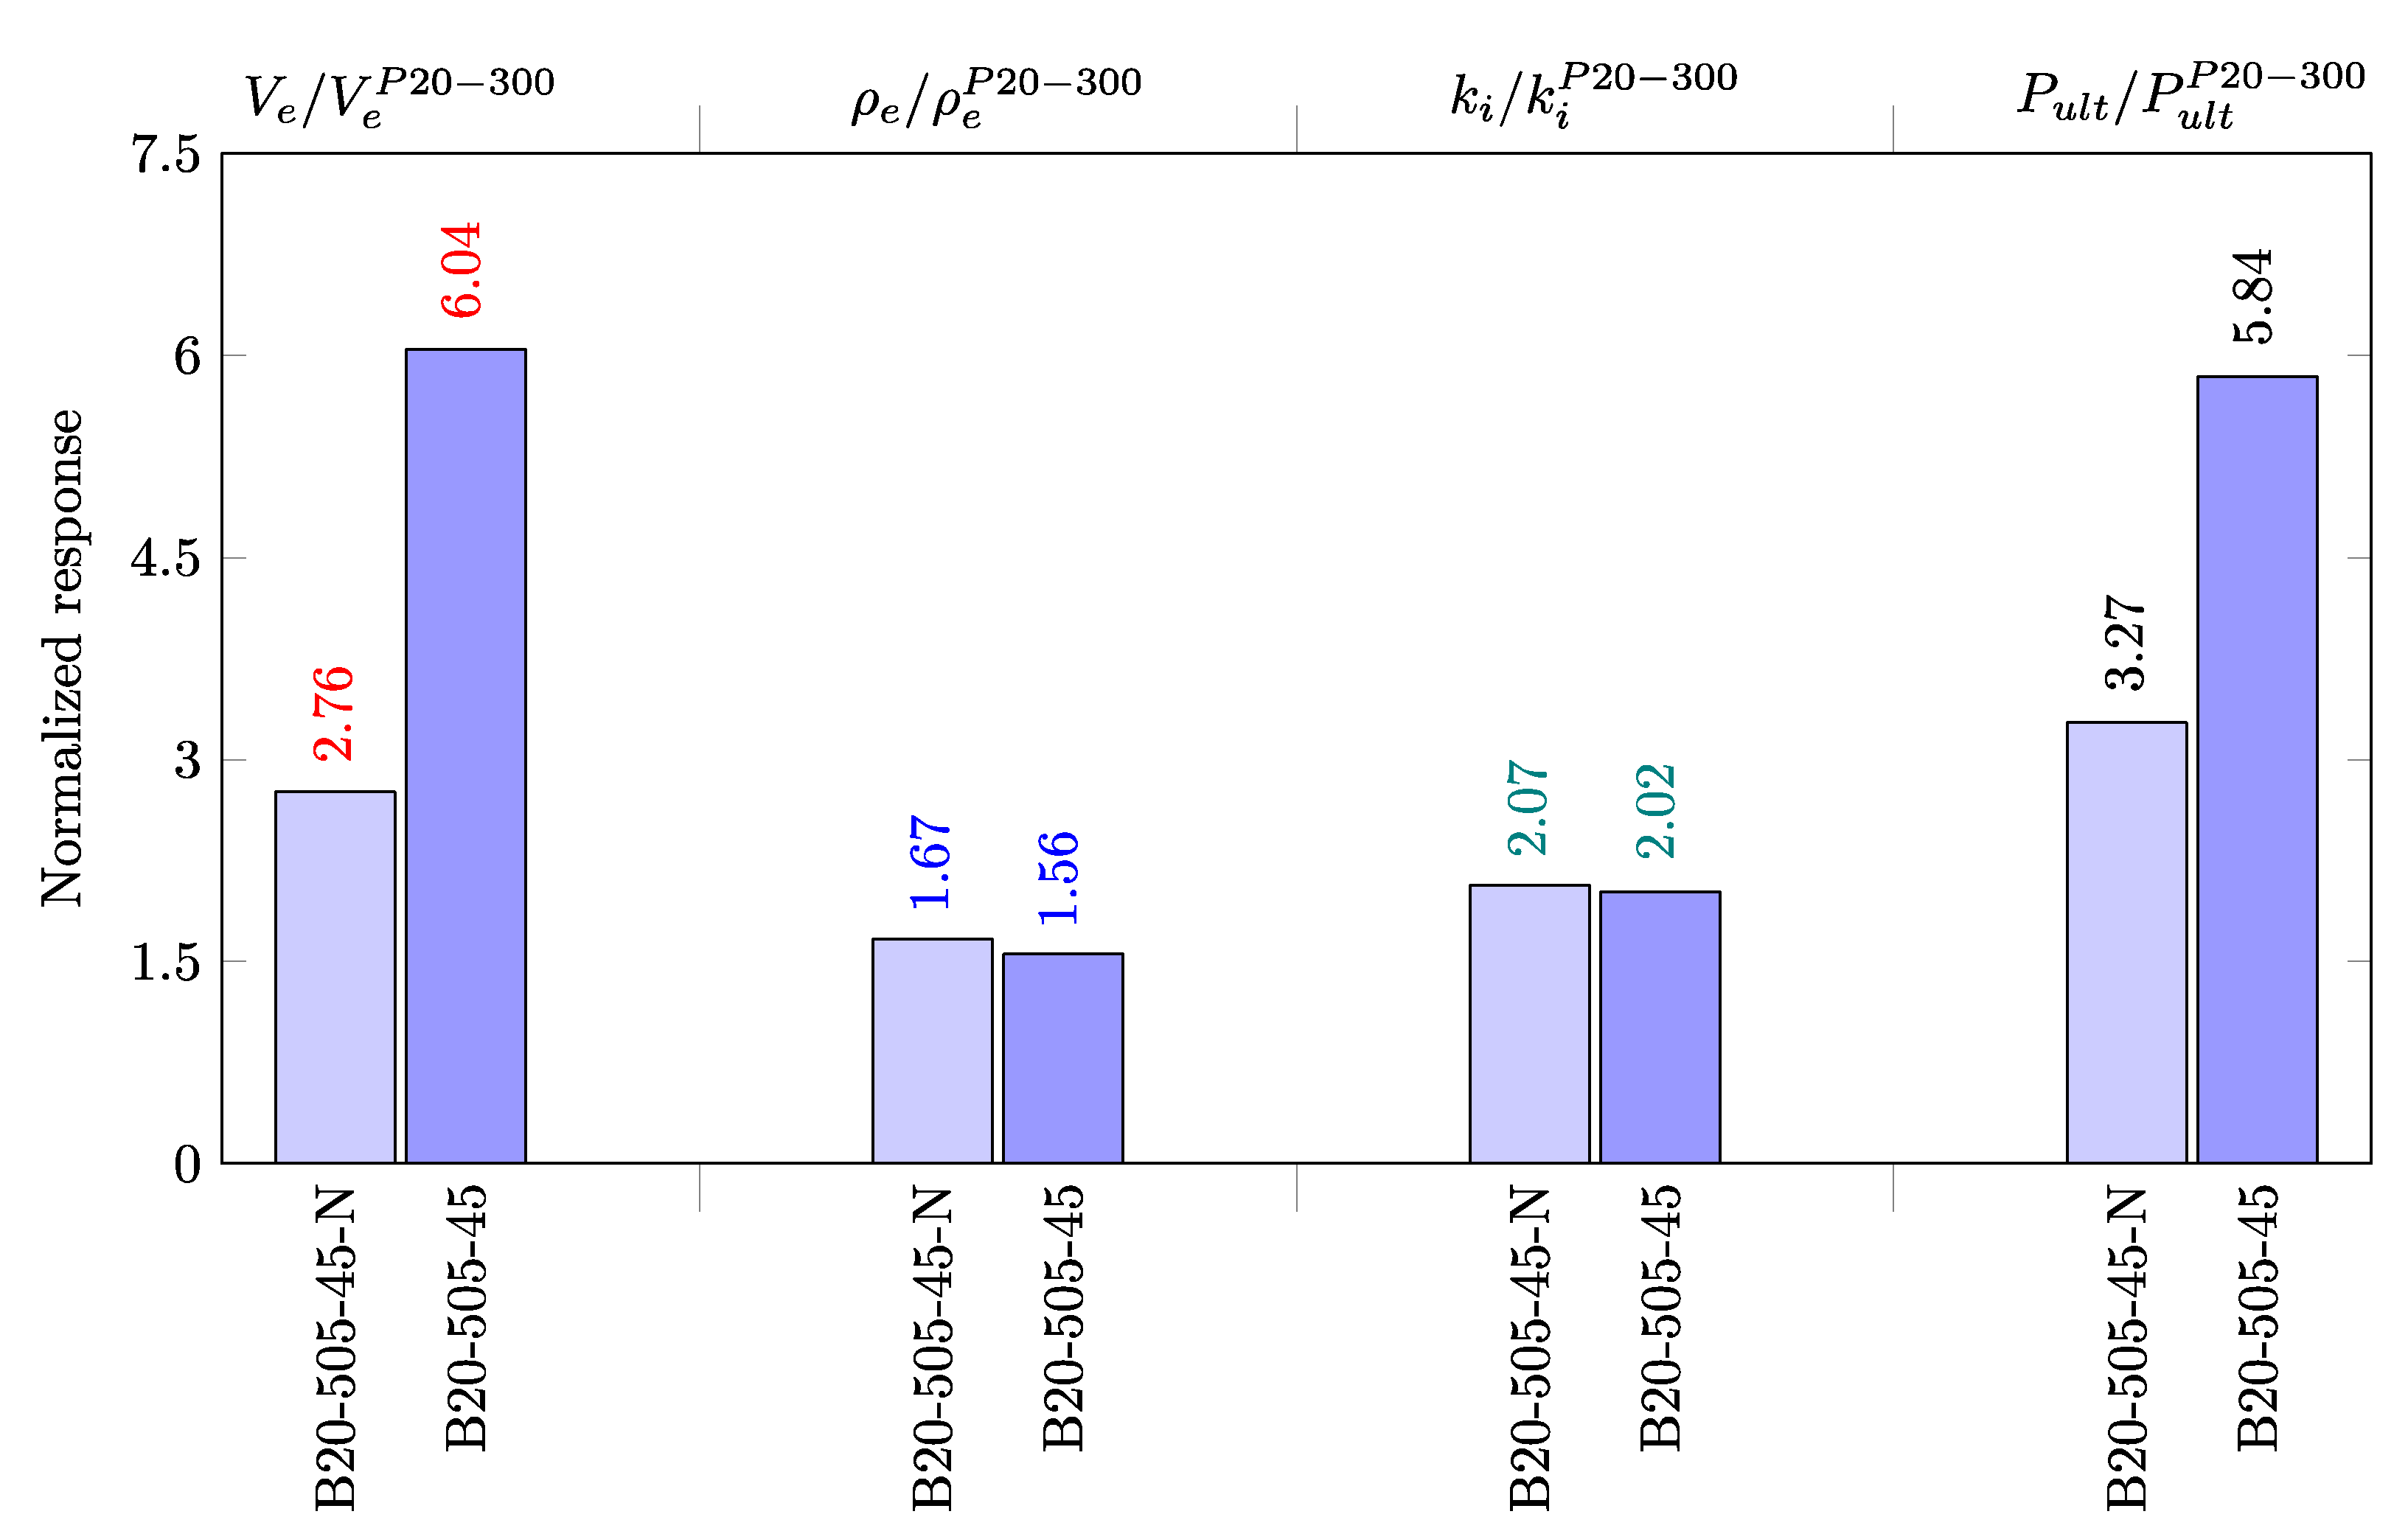
5.2. Effect of Material Yield Strength
The effect of the web’s material yield strength on the shear response of specimens #11 and #12 (i.e., B20-505-45 and B20-505-45-N) is shown in
Figure 8. The specimens differ only in the material yield strength with a ratio of
; thus, the shear strength of the 680 MPa web (B20-505-45) is more than twice the shear strength of the 290 MPa web (i.e., B20-505-45-N), and the ultimate load is 1.8 times higher. Furthermore, the yield strength does not influence the normalized shear strength or the initial stiffness.
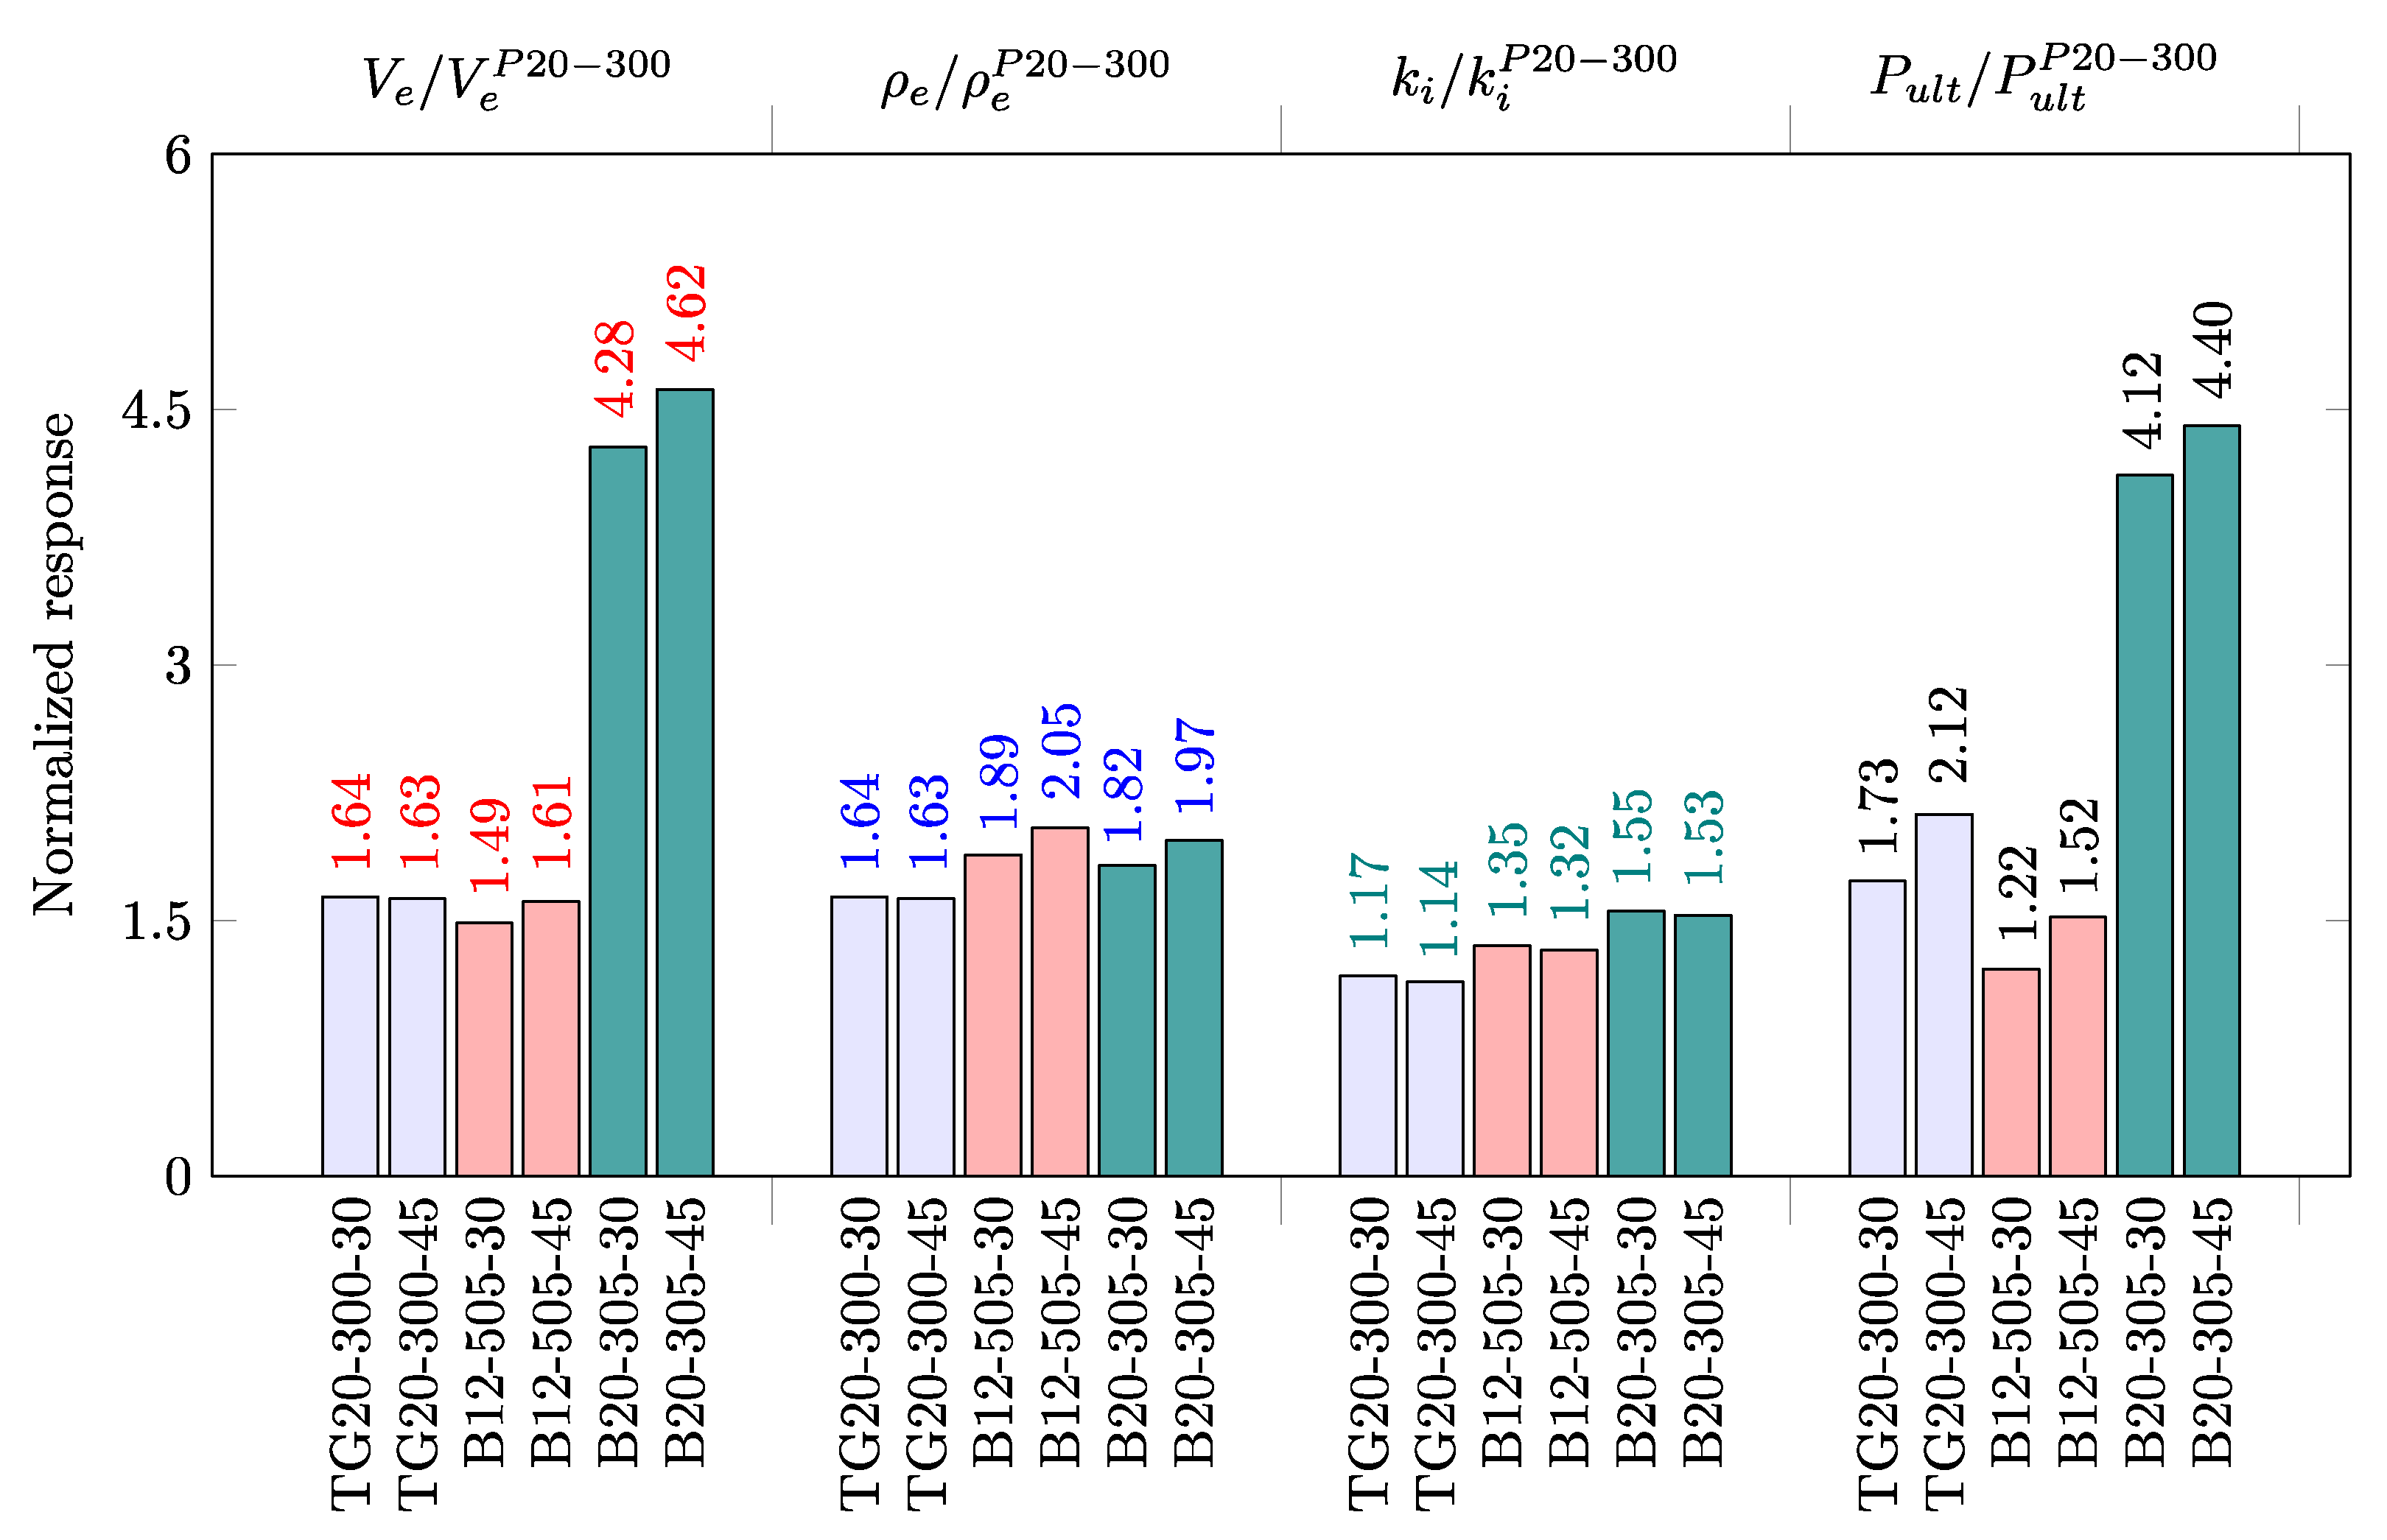
5.3. Effects of the Corrugation Angle
Figure 9 shows the effects of the corrugation angle,
, on the shear response of six tested beams. The same geometry is shared by every pair of beams, except the corrugation angle (30° and 45°), even though the two triangular webs (i.e., TG20-300-30 and TG20-300-45) with different corrugation angles reached similar shear strengths, which may be explained by the fact that both beams initially started to buckle locally in shear. The shear response of the trapezoidal web beams closely followed the trend in the triangular web beams, with the slight difference attributed to the corrugation angle.
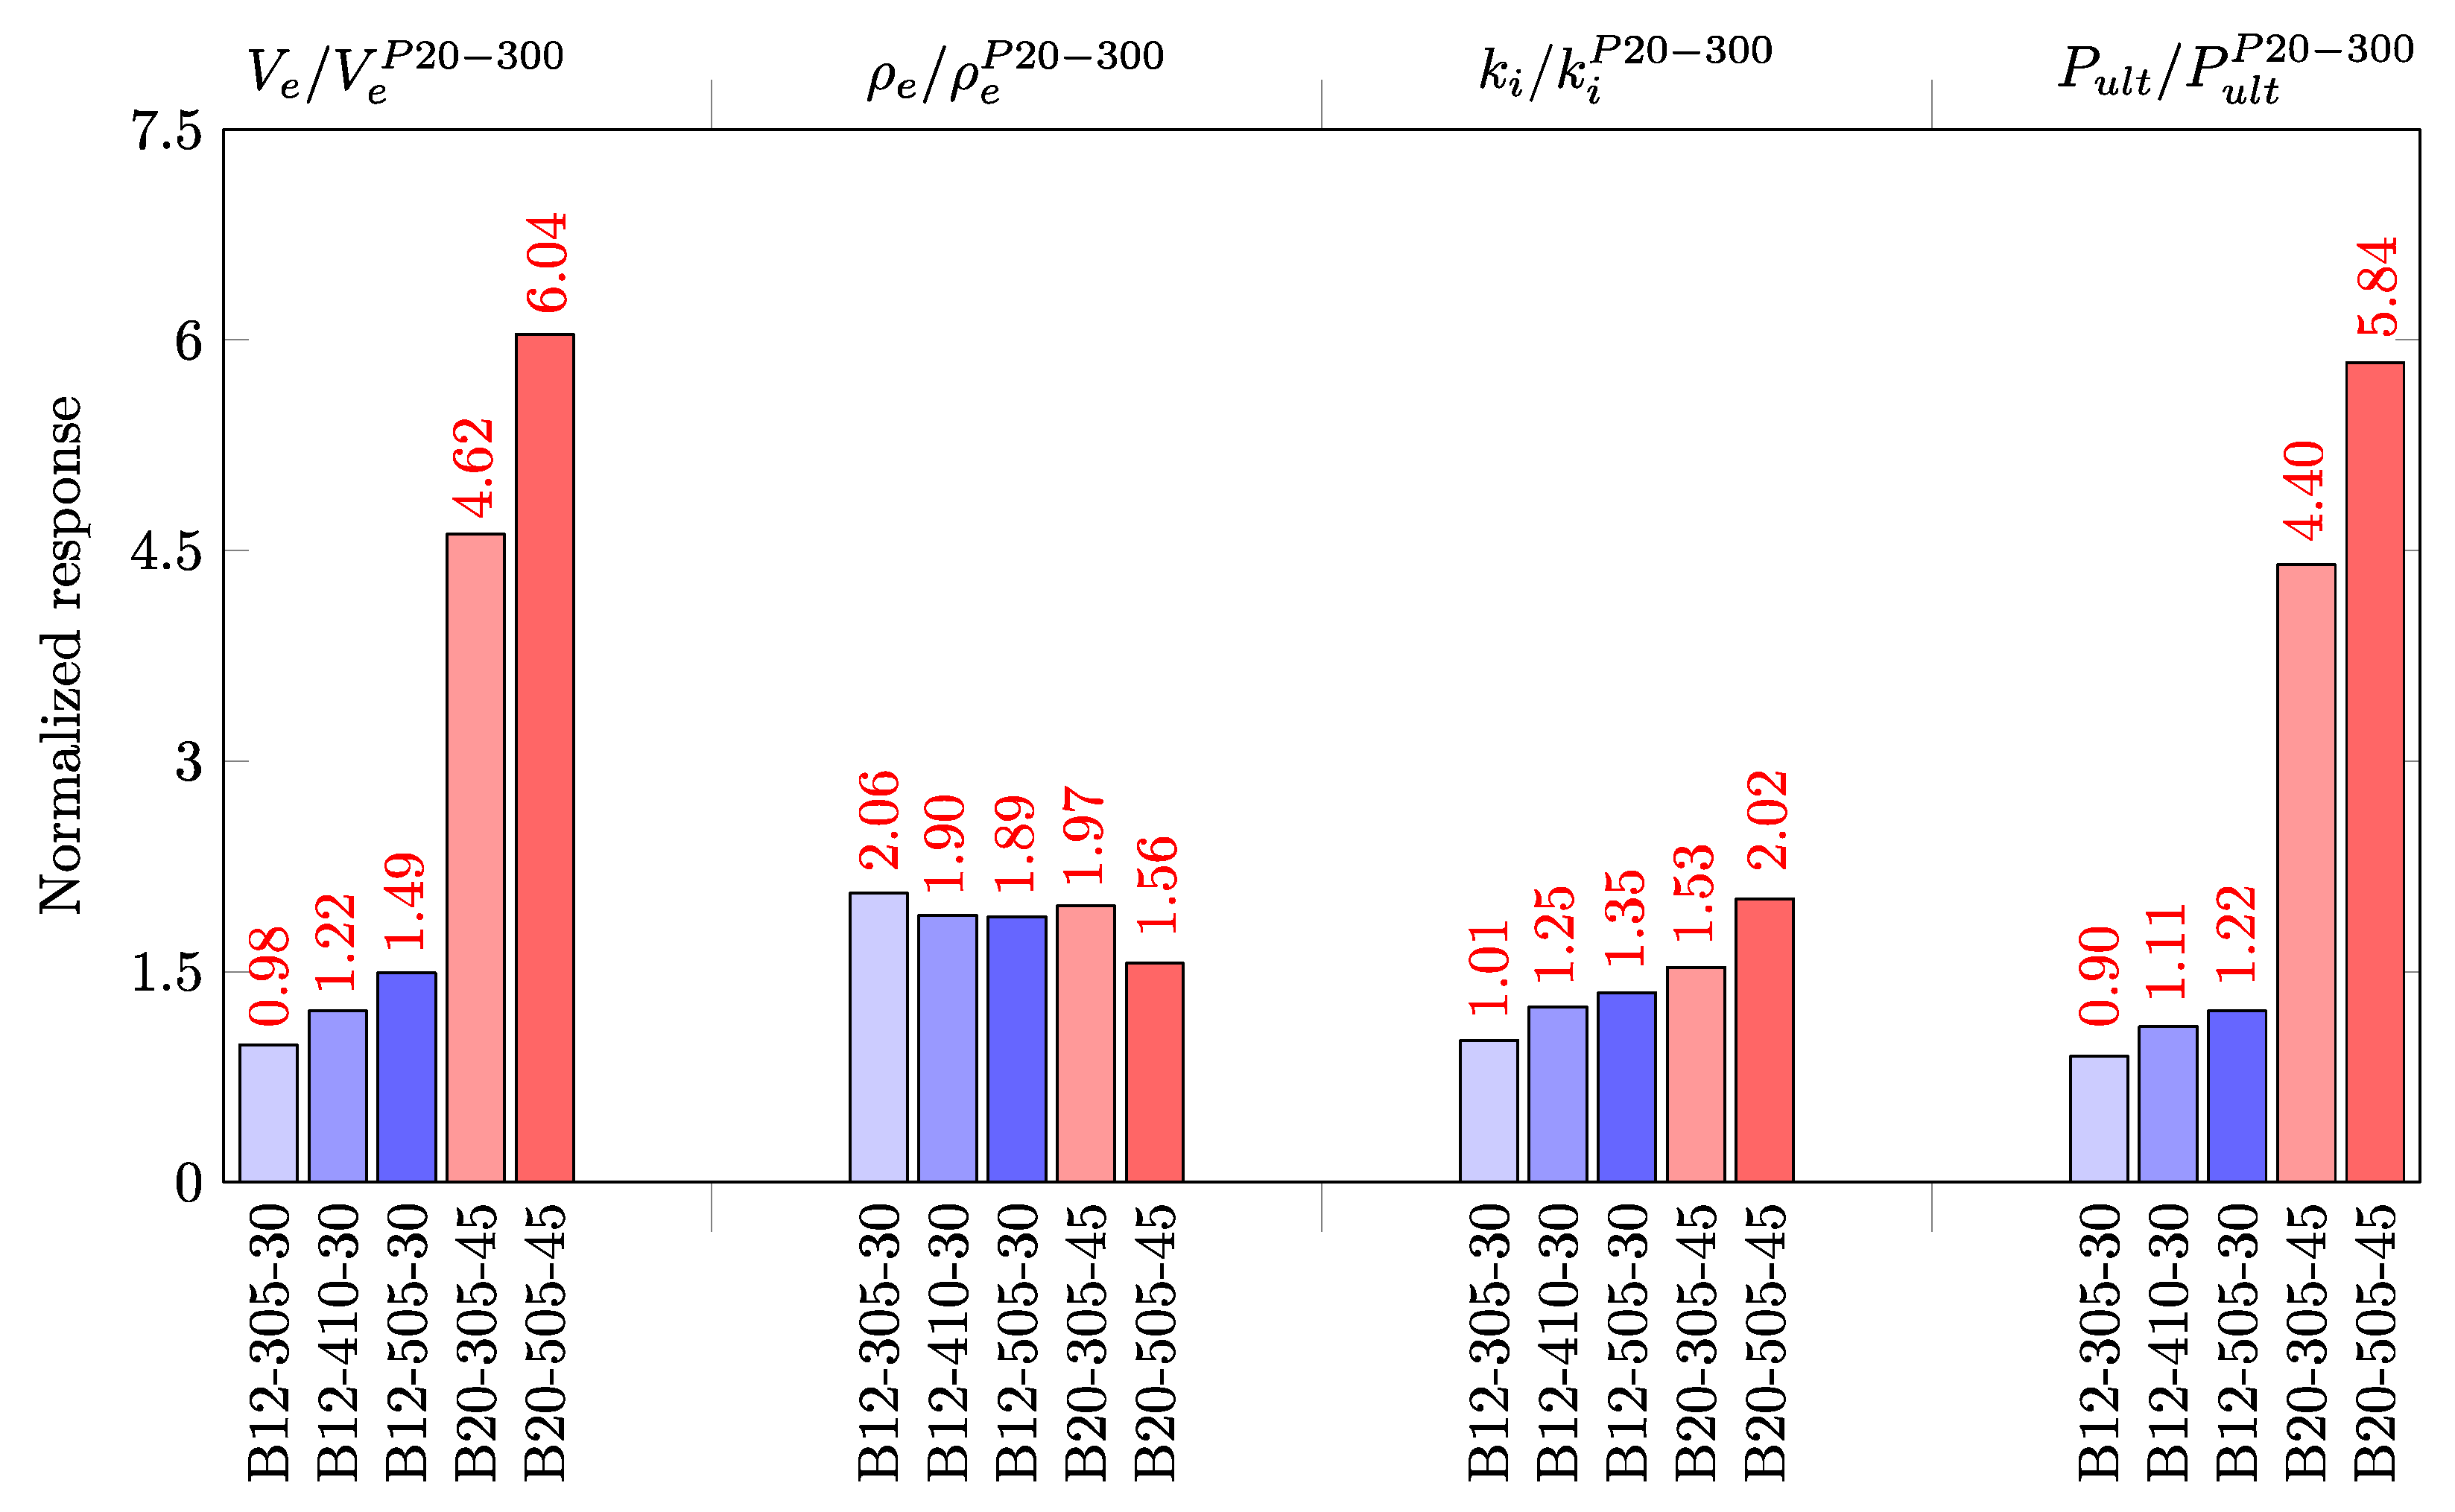
5.4. Effects of Web Panel Depth
Figure 10 shows the effects of the web depth,
, on the shear response of five trapezoidal corrugated web specimens, namely, the 1.2 mm-thick web triplet (B12-305-30, B12-410-30, and B12-505-30) and the 2 mm-thick pair (B20-305-45 and B20-505-45). Again, and as expected, the shear strength, initial stiffness, and ultimate load increase with web panel depth. However, the normalized shear strength does not follow this trend; as the 1.2 mm-thick web depth increases,
decreases by 8%, and a 21% decrease was noticed for the webs with 2 mm thickness. For instance, in the webs having 1.2 mm thickness, the ratio
(i.e., 8% decrease) and
(i.e., 8% decrease) and in the 2 mm-thick web
(i.e., 21% decrease). The variation in the ultimate load with the web panel depth was similar to the variation in the shear buckling strength. The initial stiffness increased almost linearly with the web panel depth, as shown in
Figure 5.
6. Probabilistic Analysis of Structures
The most efficient way to account for uncertainties when designing a civil engineering structure is to use probabilistic methods. In these methods, the engineer assigns a probability to each uncertainty and then calculates the expected value of the response of the structure.
6.1. Structural Reliability
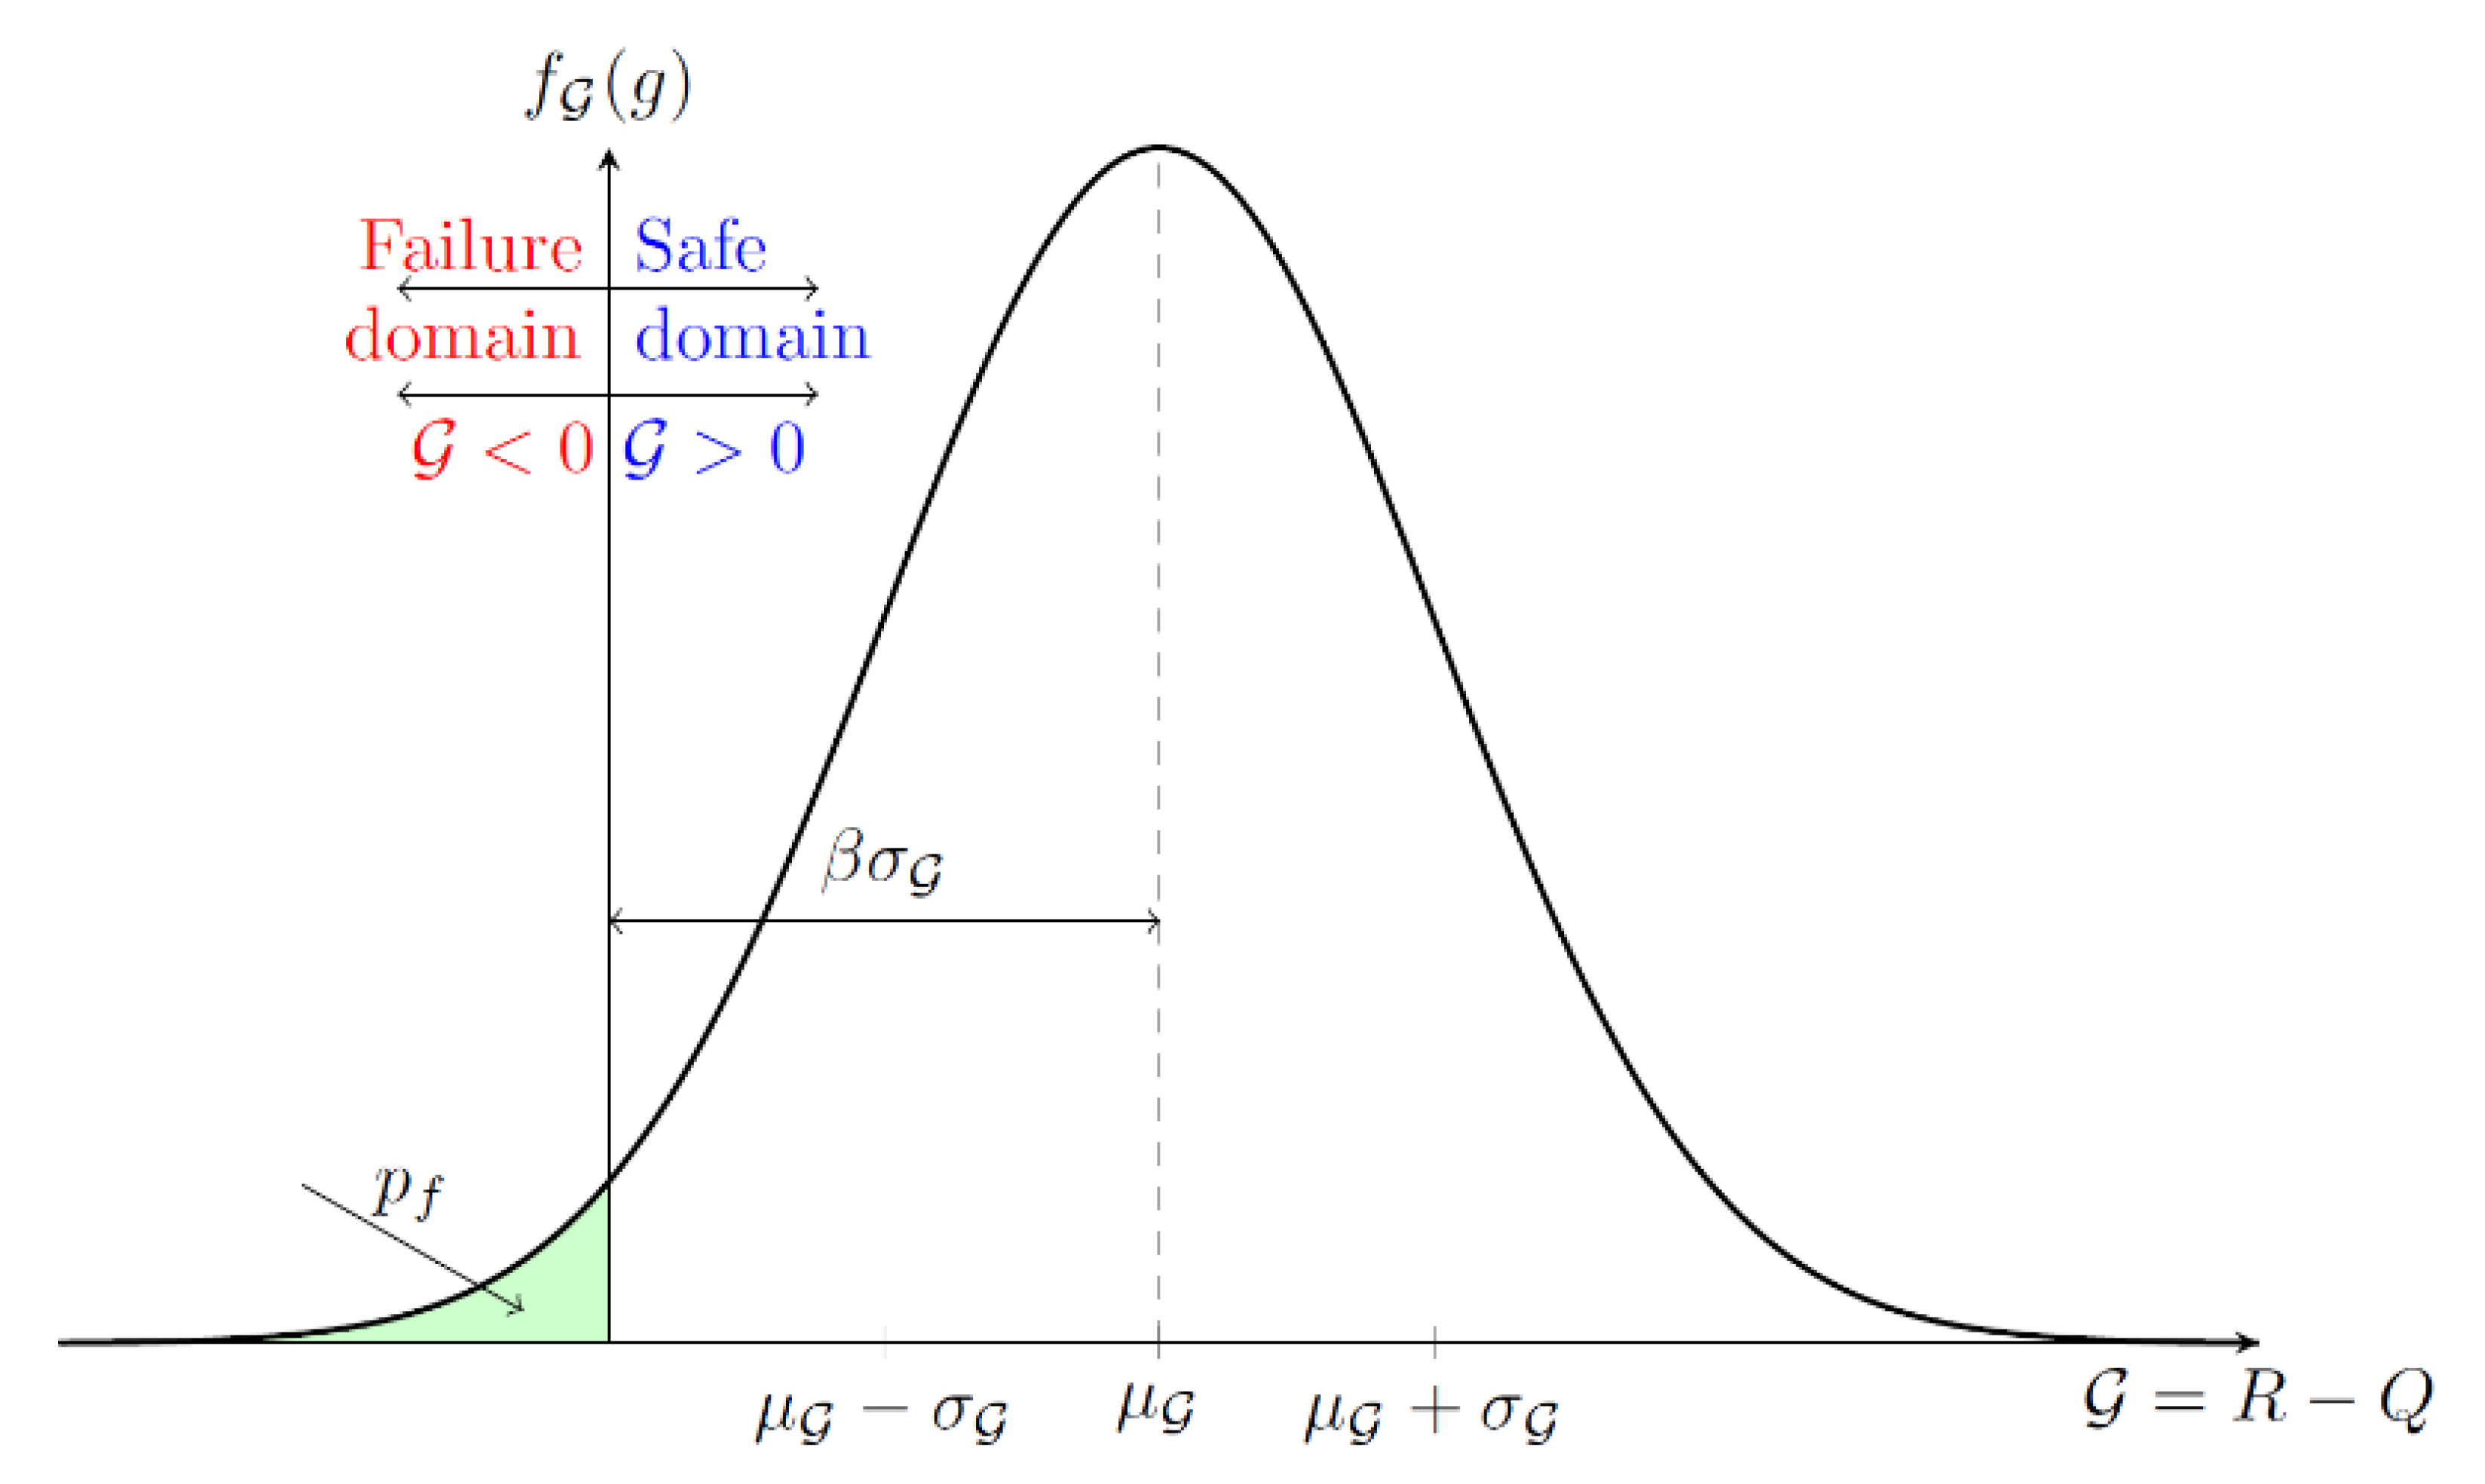
Structural reliability is the probability that a structural system will remain in a safe condition for a specific time period. It can be determined by analyzing a structure’s failure mode and estimating the probability of that failure mode occurring. The factors that affect reliability include the type of material used, the design of the structure, the environment, and the loads. The significant steps to perform structural reliability analysis are: (1) Identify the load cases and corresponding loads that need to be considered. (2) Identify the structural members that are affected by the loads. (3) Determine the failure modes of the members under the loads. (4) Calculate the probabilities of failure for the members under the loads. If the member is part of a system, (5) use an approach to obtain the overall probability of failure for the structure. In the context of structural reliability, step (3) requires a limit state function, G, which is a mathematical function that defines the limit state of a structural component or a system and is used to calculate the reliability of a structural system.
The limit state function is defined as the safety margin within a structure (
Figure 11), that is:
where
R represents the resistance and
Q represents the load effect. Accordingly, the probability of failure for a structural member can be evaluated using the integral form:
in which
is the probability density function of the vector of random variables,
X. The probability of failure,
, is computed over the entire domain of failure
.
Worldwide, structural design codes adopted load and resistance factor design (LRFD). In this design paradigm, load effects,
, are increased by load factors,
, and the strength is decreased by a strength factor,
; in other words:
is the nominal resistance or strength, defined in the next section. The strength reduction factor,
, is necessary to account for having the actual strength less than the calculated strength, which could be due to inherent uncertainty in the design equations, material properties, and fabrication. For CWSB in shear, the resistance factor was calibrated for AISC to be
[
30], while for steel girders for AASHTO, it was
[
31].
6.2. Resistance Model for CWSGs
The resistance model for CWSB,
R, for which the resistance factors were obtained in the previous section, considers uncertainties in material properties,
, fabrications,
, and differences between the computed and actual strength,
:
Table 3 reports the statistical parameters of the geometric and material variables. Leblouba and Tabsh [
29] used these data to compute the statistical properties of the resistance model for corrugated web steel beams and girders. The resistance model was lognormally distributed with a bias factor of 1.268 and a coefficient of variation of 0.139.
6.3. Load Models and Load Combinations
In addition to a resistance model, reliability analysis requires load models. For building structures, the essential loads include dead load, live load, wind, and snow. Other loads, such as seismic, can also be considered where applicable. It is common to base the statistics of maximum loads on a 50-year lifespan. Statistical parameters of these data are reported in
Table 4 for building structures. In the case of dead, live, wind, and snow loads applied along the same direction, ASCE 7 defines the following five load combinations:
AASHTO LRFD defines another load set for bridge structures, including dead, live, impact, and environmental loads. The dead load is comprised of the own weight of the structural and nonstructural members and the wearing surface (
) weight. The own weight of the structural members can be further divided into the own weight of the cast-in-place concrete members (
) and the prefabricated members (
). The effect of moving vehicles passing over the bridge is included in the two components: live (
) (static loads effect) and impact (
) (dynamic loads effects). When assuming the Strength I limit state, which often governs the design of elements within the superstructure, a 75-year live load is considered. The current live load data are based on HL-93 truck lane loading. AASHTO LRFD specifications [
34] present the design equation for bridges as follows:
To fully define all load models, it is necessary to have their statistical properties, including the probability distribution, the bias factor, and the coefficient of variation. These data are reported in
Table 4 and
Table 5 for building structures and bridge structures, respectively.
6.4. Determination of the Probability of Failure through Sampling Techniques
Due to the difficulty in evaluating the integral of Equation (8), we resort to approximate methods to estimate the probability of failure. The direct simulation-based MCS technique is computationally intensive. Adding to the large number of iterations required to find the optimum design that satisfies any other additional objectives, it becomes prohibitively expensive. To reduce the computational burden while maintaining the same level of accuracy, the importance sampling (IS) algorithm can be a good alternative. The benefit of IS is that it is quick because it mainly considers the region with the highest contribution to the probability of failure. Importance sampling is a two-step algorithm. The first order reliability method (FORM) is run first to initially estimate the reliability index and design point in the standard normal space. In the second step, a Monte Carlo simulation (MCS) is run by positioning the simulations around this point. Implementing the algorithm requires using
biasing density, . This alternative density function facilitates the frequent concentration of the simulations with
. The probability of failure determined using the IS algorithm is given as follows:
where
is the expectation, and the corresponding variance is given by:
Selecting a suitable biasing density is the next step to be resolved. One option is to opt for a standard multivariate normal probability density function based on the design point,
, estimated using FORM, that is:
in which
is the
-dimensional standard multivariate normal probability density function.
7. Component Reliability-Based Design Optimization
7.1. Definition and Problem Formulation
Reliability-based design optimization is presented in this section. The RBDO problem for a steel member or a steel structure made up of several members is formulated as follows: minimize the weight of steel used to build the girder/structure while satisfying the target reliability requirement on the girder/structure shear strength. The reliability requirement is specified by the maximum acceptable probability of failure of the girder/structure. Formally, it is formulated as follows:
where
is the objective function representing the weight of the material;
is the vector of deterministic variables bounded between
and
; and
X is the vector of random variables. The objective here is to minimize the weight of the steel used to fabricate the component while satisfying the safety requirement represented by
: the probability of failure of the component should be less than the target probability of failure. The probability of failure represents that the probability of the limit state function,
, is less than or equal to zero.
and
are the resistance and load effect random variables, respectively.
In the formulation above, the safety requirement can also be expressed in terms of the reliability index, , such that , where is the target reliability index, the preferred alternative by the authors, especially when designing following a particular design code. For instance, according to AASHTO LRFD specifications, when designing steel girders for a bridge, the target reliability index is appropriately set at = 3.5 to ensure a safe and reliable performance at ultimate. AISC 360 adopted a target reliability index of 3.0.
The adopted RBDO formulation is then:
The reliability index is computed based on the probability of failure:
where
is the standard normal cumulative density function.
7.2. Global and Local Optimization Algorithms
In most engineering problems, finding the global optimum may be infeasible. We can use the particle swarm optimization method (PSO) with a fitness function to find the best solution from a local optimum. The fitness function measures how close the particle swarm solution is to the global optimum. The fitness function will return a real number value to indicate how “good” or “bad.” Therefore, the fitness function should be designed to measure whether the candidate solution is good or bad.
In the particle swarm optimization method, given a set of particles, called a swarm, and an initial population, repeat the following steps until convergence or a maximum number of iterations is reached:
Evaluate the fitness values of the swarm members.
Select the particle that has the best fitness value.
Replace that particle with a new particle.
Evaluate the fitness values of the new swarm members on the current particle position.
Go to step 1.
The algorithm’s key is finding the best particle to replace and the one to replace it. This can be done using a fitness function based on the particle’s position. The fitness function makes it possible to determine the best particle location and, hence, the best particle to be replaced and the particle that will replace it. The new particle will have the best fitness value, but the fitness value is based on the current position. It is possible that a particle with a lower fitness value could have a better fitness value for the new location. The particle swarms will exchange information about their locations, and the information about the best location will be propagated through the swarm.
MATLAB [
35] was used to execute structural optimization in the present study. The built-in function ‘particleswarm’ was used as a global optimizer. The ‘interior-point’ algorithm was then employed as a default local optimizer to obtain a better solution. The interior-point algorithm is an iterative algorithm that computes the solution of a linear programming problem. It belongs to a class of algorithms known as conjugate gradient methods. It is a particular case of the more general methods, known as generalized minimal residual methods or GMRES methods. The conjugate gradient algorithm is implemented in MATLAB using the conjugate gradient function, which is a part of the MATLAB optimization toolbox.
8. Applications
Reliability-based design optimization is utilized in this section to minimize the weight of corrugated web steel beams and girders while satisfying the target reliability requirement. The employed optimization algorithm combines particle swarm optimization (PSO) as a global optimizer and the interior-point local search optimizer.
In the considered examples, the corrugated web is designed for shear buckling. Therefore, the design variables include the web panel depth and thickness, the flat-to-inclined fold width ratio, and the corrugation angle. The optimal design variables are obtained by minimizing the objective function (i.e., the volume of steel) with respect to the design variables. The optimal design variables are obtained for a target reliability index of 3.0 per AISC 360 for building structures and 3.5 for steel bridge girders per AASHTO LRFD specification. To ensure a near-optimal design of the corrugated web, the reader is referred to a design flowchart in reference [
29], which can be considered a starting design point.
8.1. Application 1: Steel Girder (AISC Design Examples, Ed.13, Example G.8a)
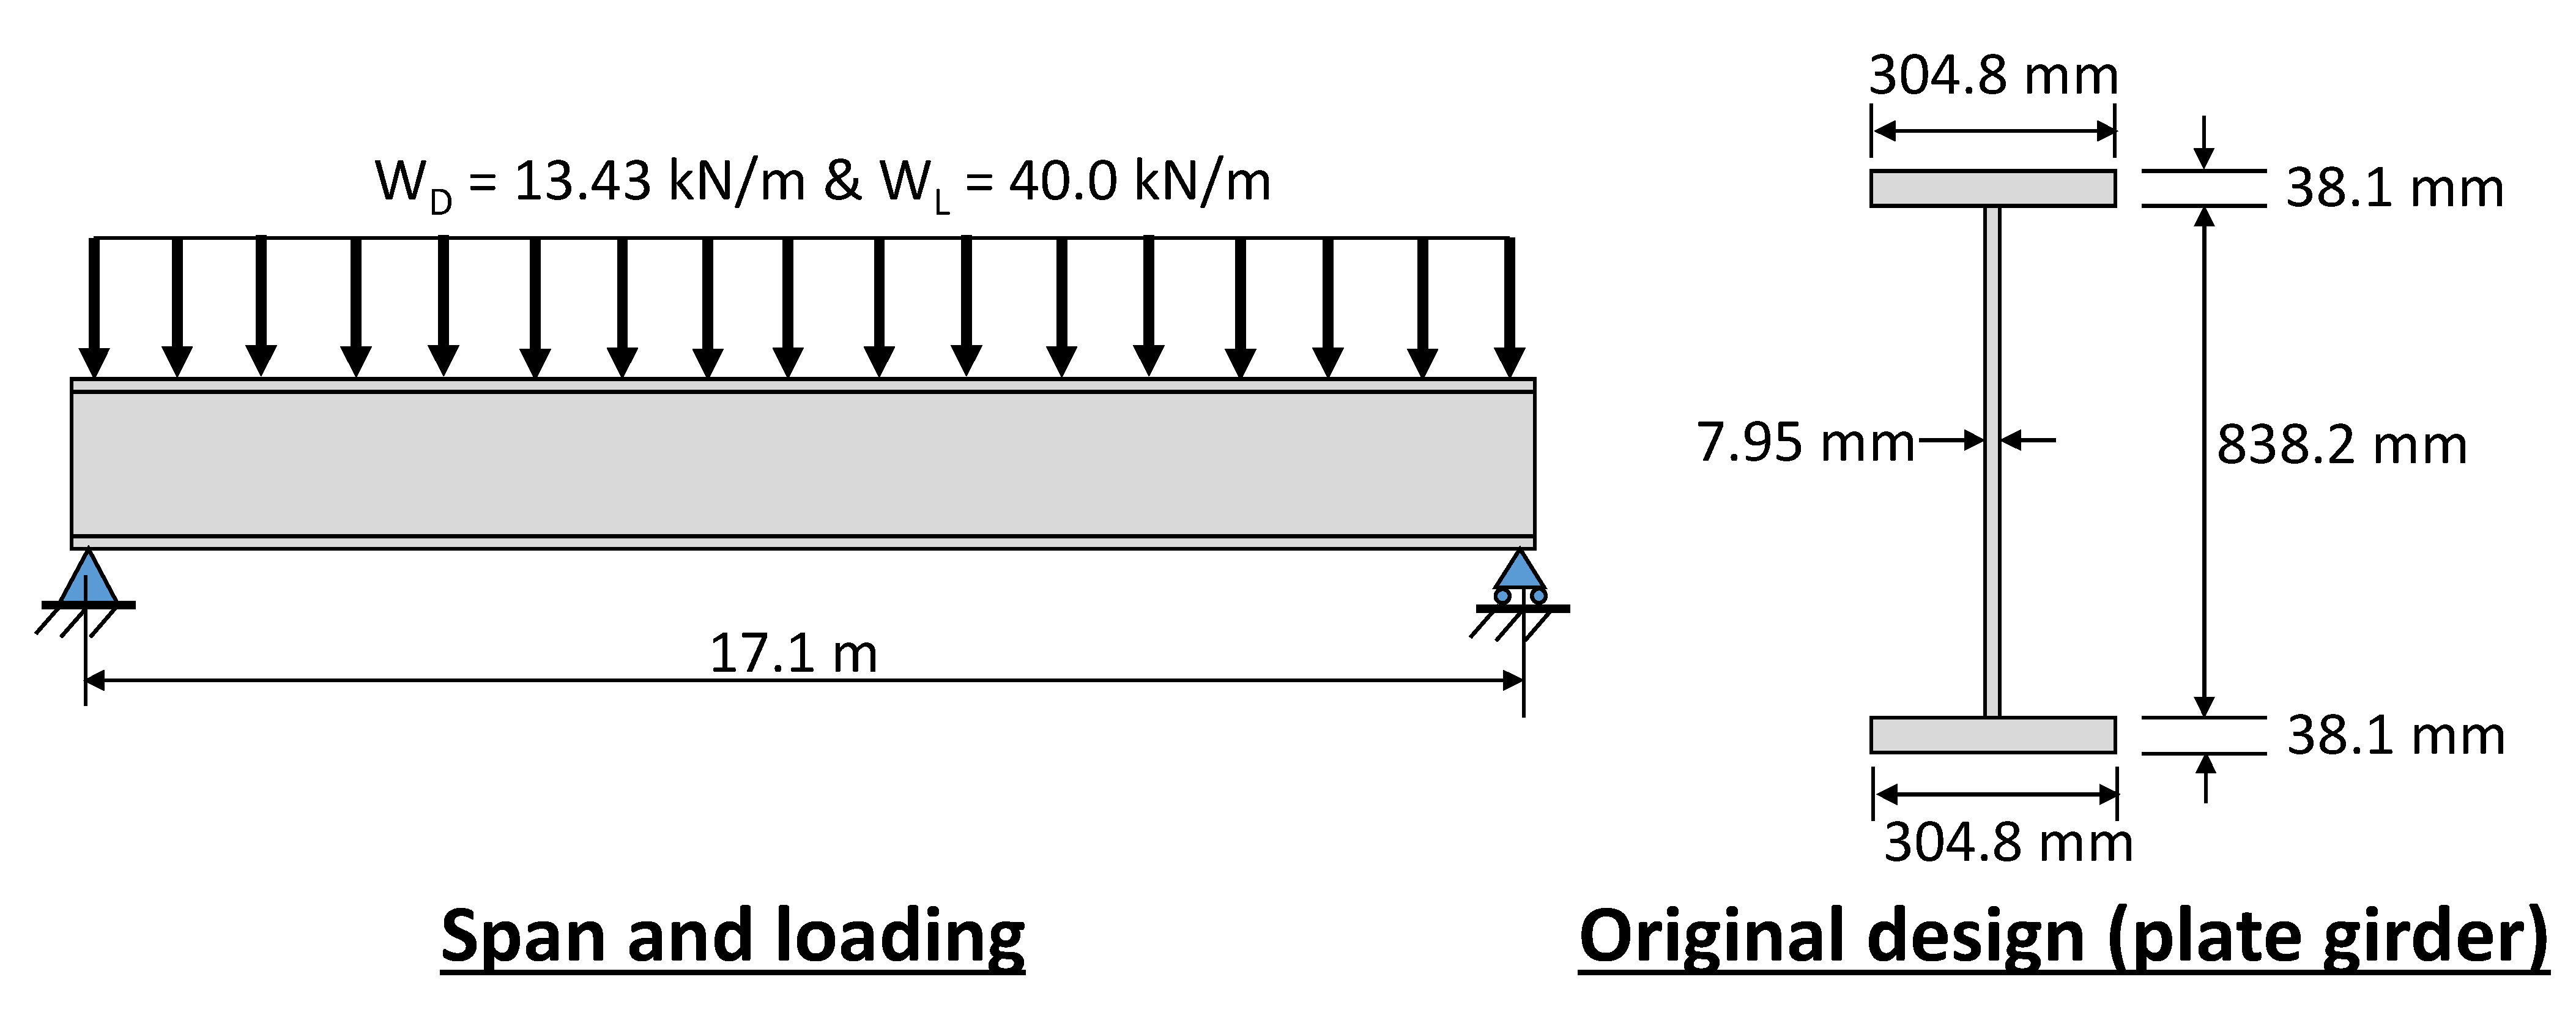
The first application here is the redesign of a built-up continuously braced girder using a trapezoidal corrugated steel web. The original design is a built-up ASTM A36 I-shaped welded plate girder. It is subjected to a uniformly distributed dead load of 13.43 kN/m and a live load of 40 kN/m (
Figure 12).
We first present the design of the girder using an I-shaped plate with flanges, as reported in Example G.8a of the AISC companion of design examples [
28].
The properties of the initially designed girder are:
Material: ASTM A36 low carbon steel with a yield strength = 248.21 MPa and modulus of elasticity E = 200,000 MPa
Geometry:—web: = 838.2 mm, = 7.95 mm
- -
flanges: = 304.8 mm, = 38.1 mm
- -
total girder depth: = 36 in (914.4 mm).
As per ASCE 7-22, which is adopted by AISC 360 [
27], the controlling load combination yields the factored shear load demand at the support:
In the preliminary design with an I-shaped plated girder, the factored nominal shear strength without stiffeners is calculated as per the AISC specification as follows:
where
mm
3 is the web area calculated using the girder’s overall depth. For a web without stiffeners,
. Next, since
, we use AISC specification equation G2-4 to calculate
as:
With the above parameters defined, the nominal shear strength can be calculated, kN.
kN, which is less than the ultimate shear load,
= 685 kN, without stiffeners. Consequently, stiffeners are required for the end panel to meet the shear demand. The required stress on the web is first determined as
MPa. At this stress level, using
Table 3-16a of the AISC
Steel Construction Manual, stiffeners are required at
59 in (1498.6 mm) spacing for the end panel. Therefore, the required shear strength at 1508.8 mm can be calculated to be
= 565 kN, which is lower than the shear capacity of the web
= 645.4 kN. Therefore, no additional stiffeners are required in the second panel.
Excluding the top and bottom flanges, the volume of steel used to construct the web and stiffeners along the entire girder length is approximately 1.332 × 108 mm3.
The RBDO is now applied to redesign the same girder with trapezoidal corrugated webs and no stiffeners. We shall keep the material properties and the girder length deterministic and constant throughout the optimization process.
As per ASCE 7-22, the load combination that controls the shear design of the girder is
. With a resistance factor
= 0.85 [
32], the girder will be designed to resist an ultimate shear load of
= 805.9 kN.
The optimization algorithm is applied to the girder. The objective of the proposed reliability-based design optimization algorithm is to minimize the volume of the steel of the corrugated web while satisfying the required level of safety. As per AISC 360 [
27], the target reliability index is
= 3.0, which will be the required level of safety. In addition, for constructability purposes, the number of folds,
, was constrained to be an integer. A serviceability constraint was also added to limit the deflection of the girder. The maximum deflection at the mid-span is
2.24 in (57 mm), where
is the girder length. In addition, the web depth to web thickness ratio was constrained to be less than 260, as per AISC specifications, for plated girders without stiffeners. An additional constraint was also imposed on the web depth to control the slenderness of the girder:
.
The vector of design variables is
. The optimization process was run first using the default ‘interior-point’ algorithm. Then we switched to the sequential quadratic programming (‘sqp’) algorithm [
36], which is sometimes faster or more accurate than the default ‘interior-point’ algorithm [
34]. Indeed, after 24 iterations, the RBDO code reached the solution
with
= 58 folds, while satisfying all constraints (see
Figure 13), including the reliability index of the new design, which is
, mid-span deflection
= 15 mm <
57 mm. The obtained minimum volume of steel was computed to be 1.056 × 10
8 mm
3. Compared to the original design (with stiffeners), the savings in the volume of steel of the web were 21%, and even when excluding the stiffeners from the original design, the savings in steel were more than 7%.
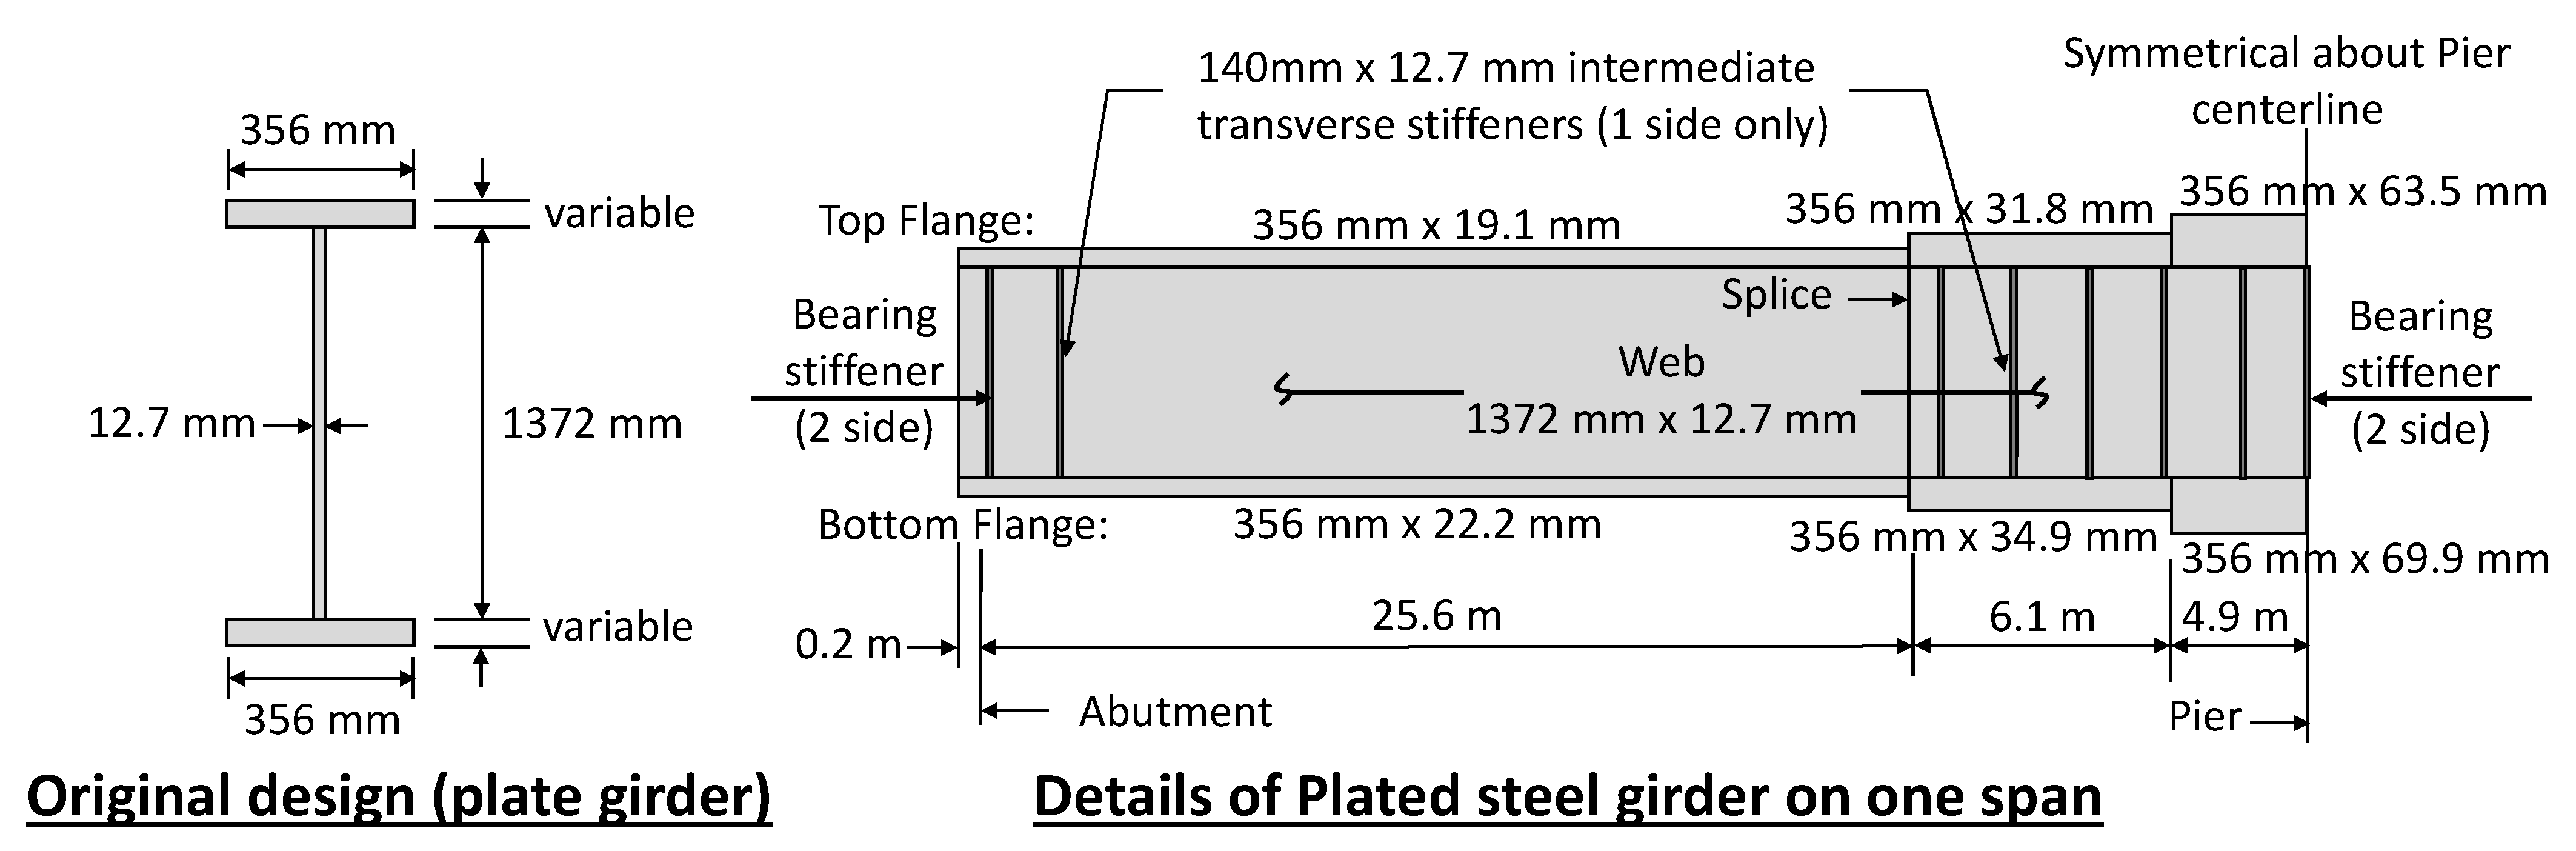
8.2. Application 2: Steel Bridge Girder
This application is taken from the bridge design manual of the Wisconsin Department of Transportation [
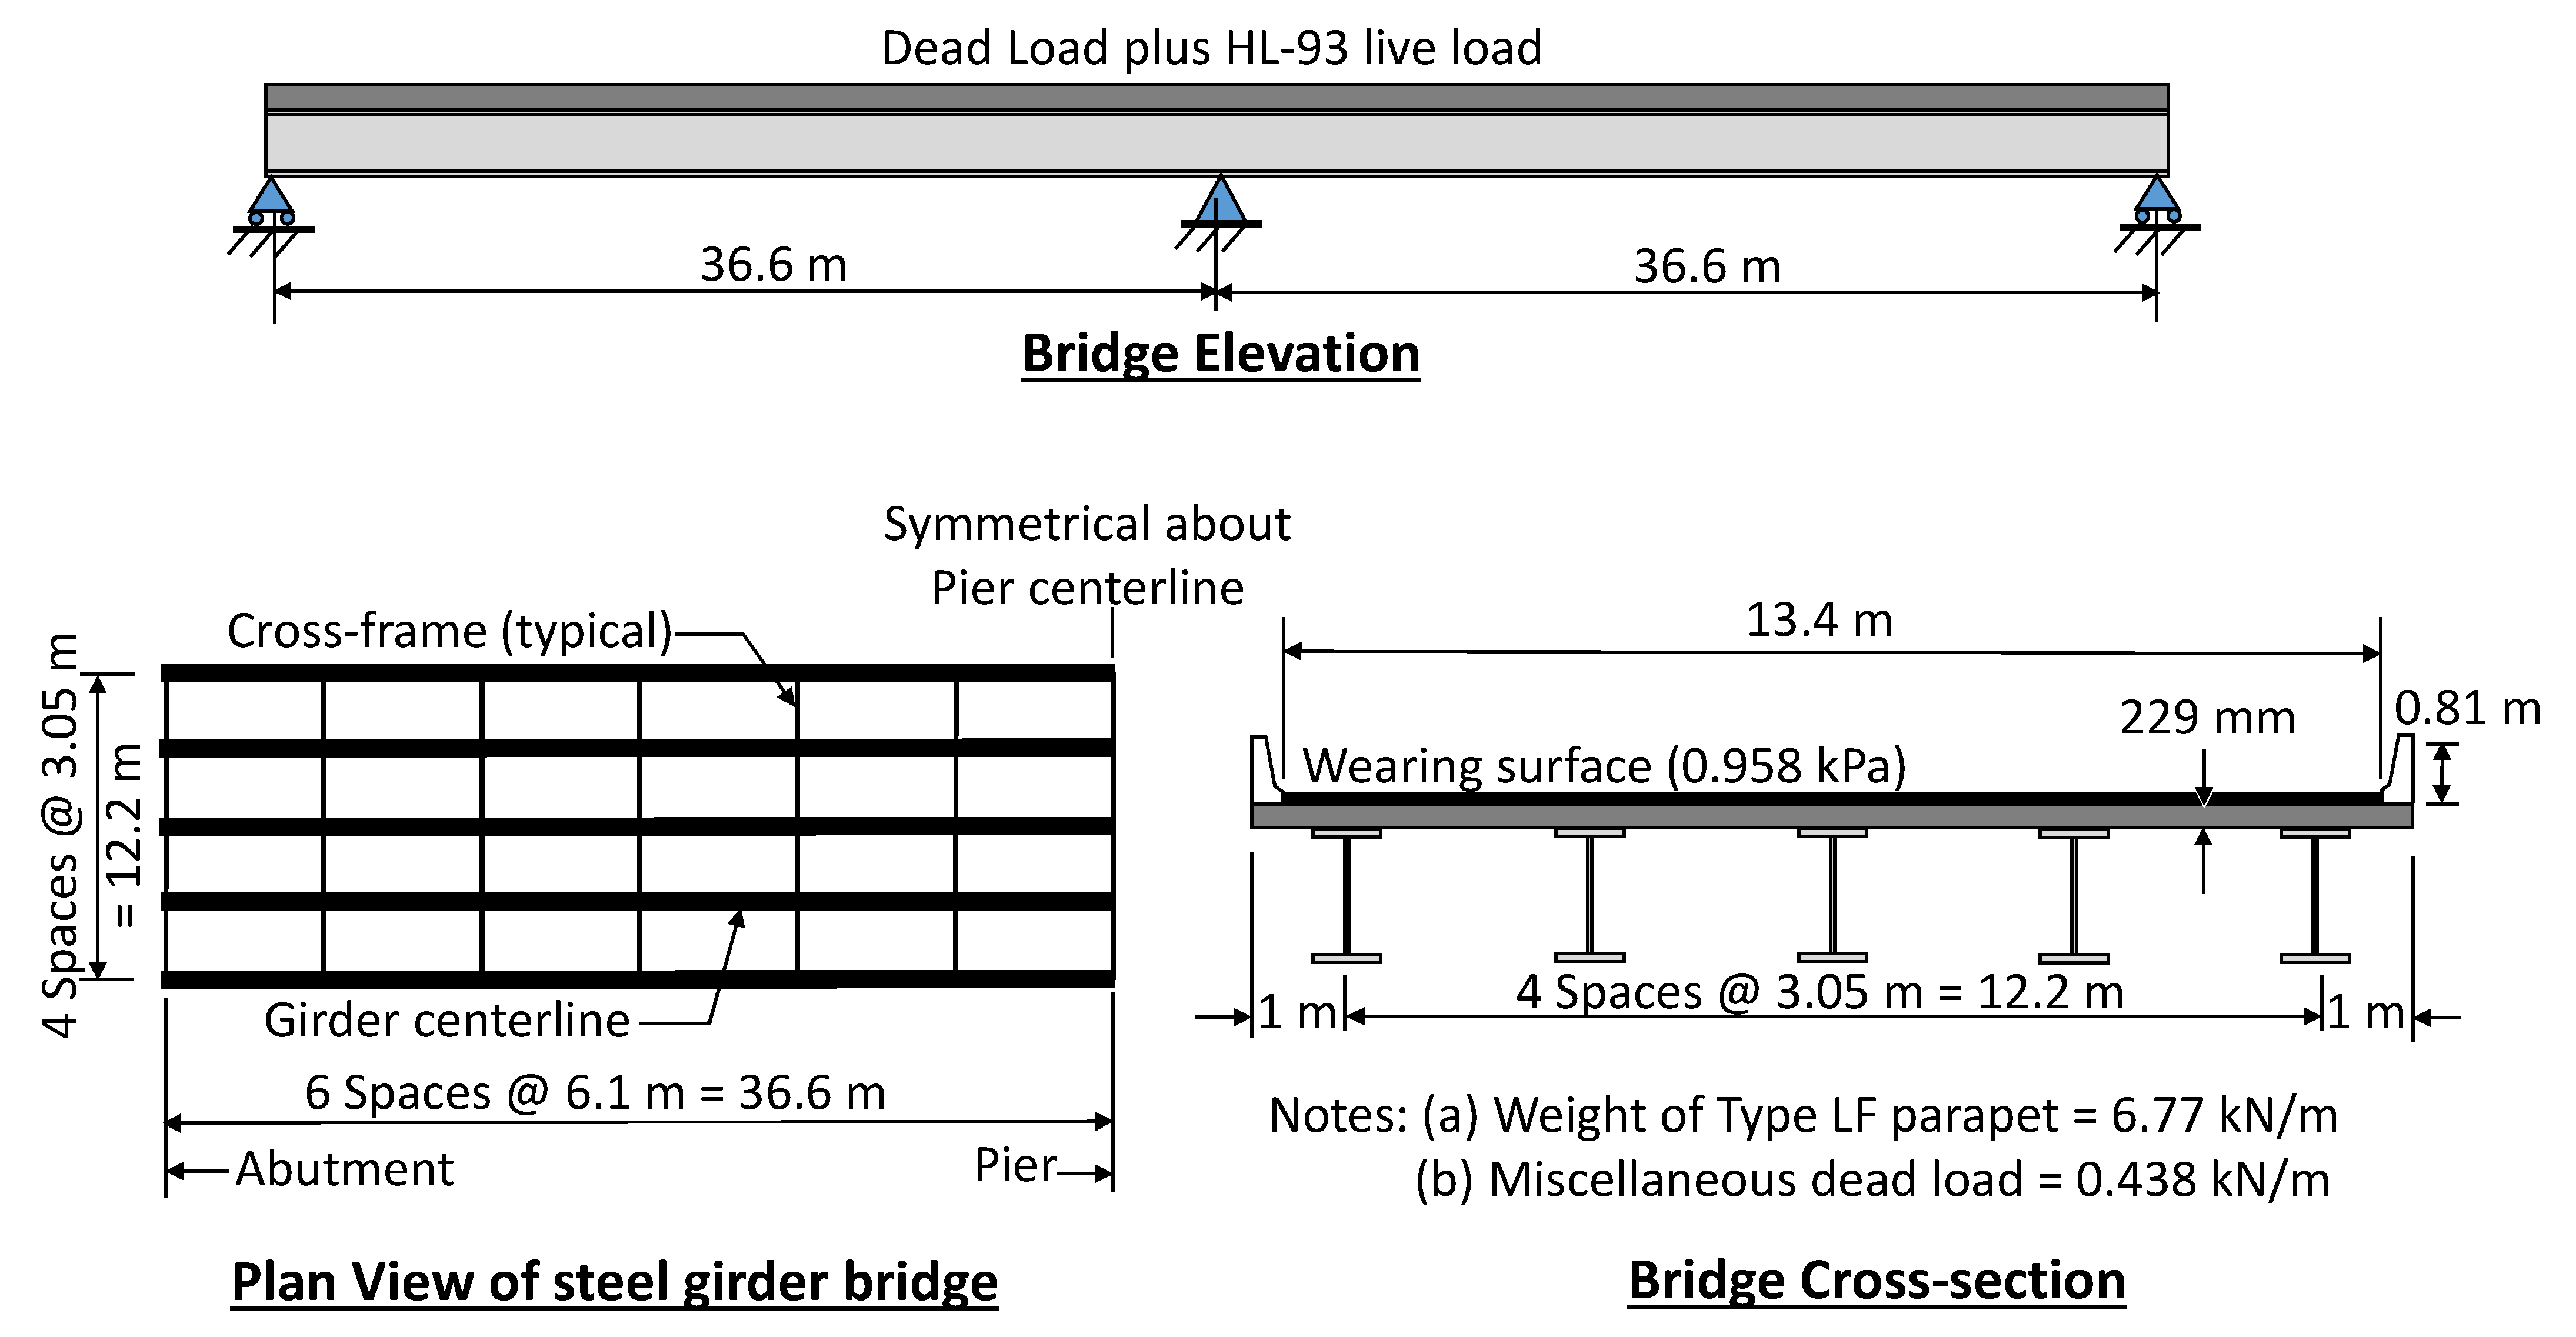
37]. It concerns the design of a girder in a continuous steel bridge that rests on two abutments at the ends and an intermediate pier at the middle. The bridge’s total length is 73.2 m, divided into two spans with 36.6 m in length for each and a total bridge width of 14.2 m. The girders are spaced at 3.05 m and are connected compositely to a 229 mm concrete deck by shear connectors. Additionally, cross frames are added in the transverse direction of the bridge, spaced at 1.83 m intervals along the bridge length. The detailed dimensions of the bridge are shown in
Figure 14, representing the bridge’s elevation, plan view, and cross-section.
The yield strength for the reinforcement and the steel sections are 413.7 MPa and 344.7 MPa, respectively, and the concrete has a compressive strength of 27.6 MPa. The loads applied to the structure include an additional miscellaneous dead load of 0.4378 kN/m, each parapet weight of 6.77 kN/m, and a wearing surface load of 0.958 kPa in addition to the self-weight of the structural members. The HL-93 standard live load in AASHTO will be applied to compute the effect of the live load on the structure.
The load combinations and factors are applied according to
AASHTO LRFD Bridge Design Specifications requirements [
37]. The unfactored loads include the non-composite dead load, parapet dead load, future wearing surface dead load, and live load. The factored shear load is computed from the Strength I limit state load combination:
, where the load components were defined earlier. Using the previous equation, the critical factored shear force on the girder is 1827.2 kN. Since the resistance factor for plated steel girders in shear is
, the design ultimate shear force is the same as the factored force.
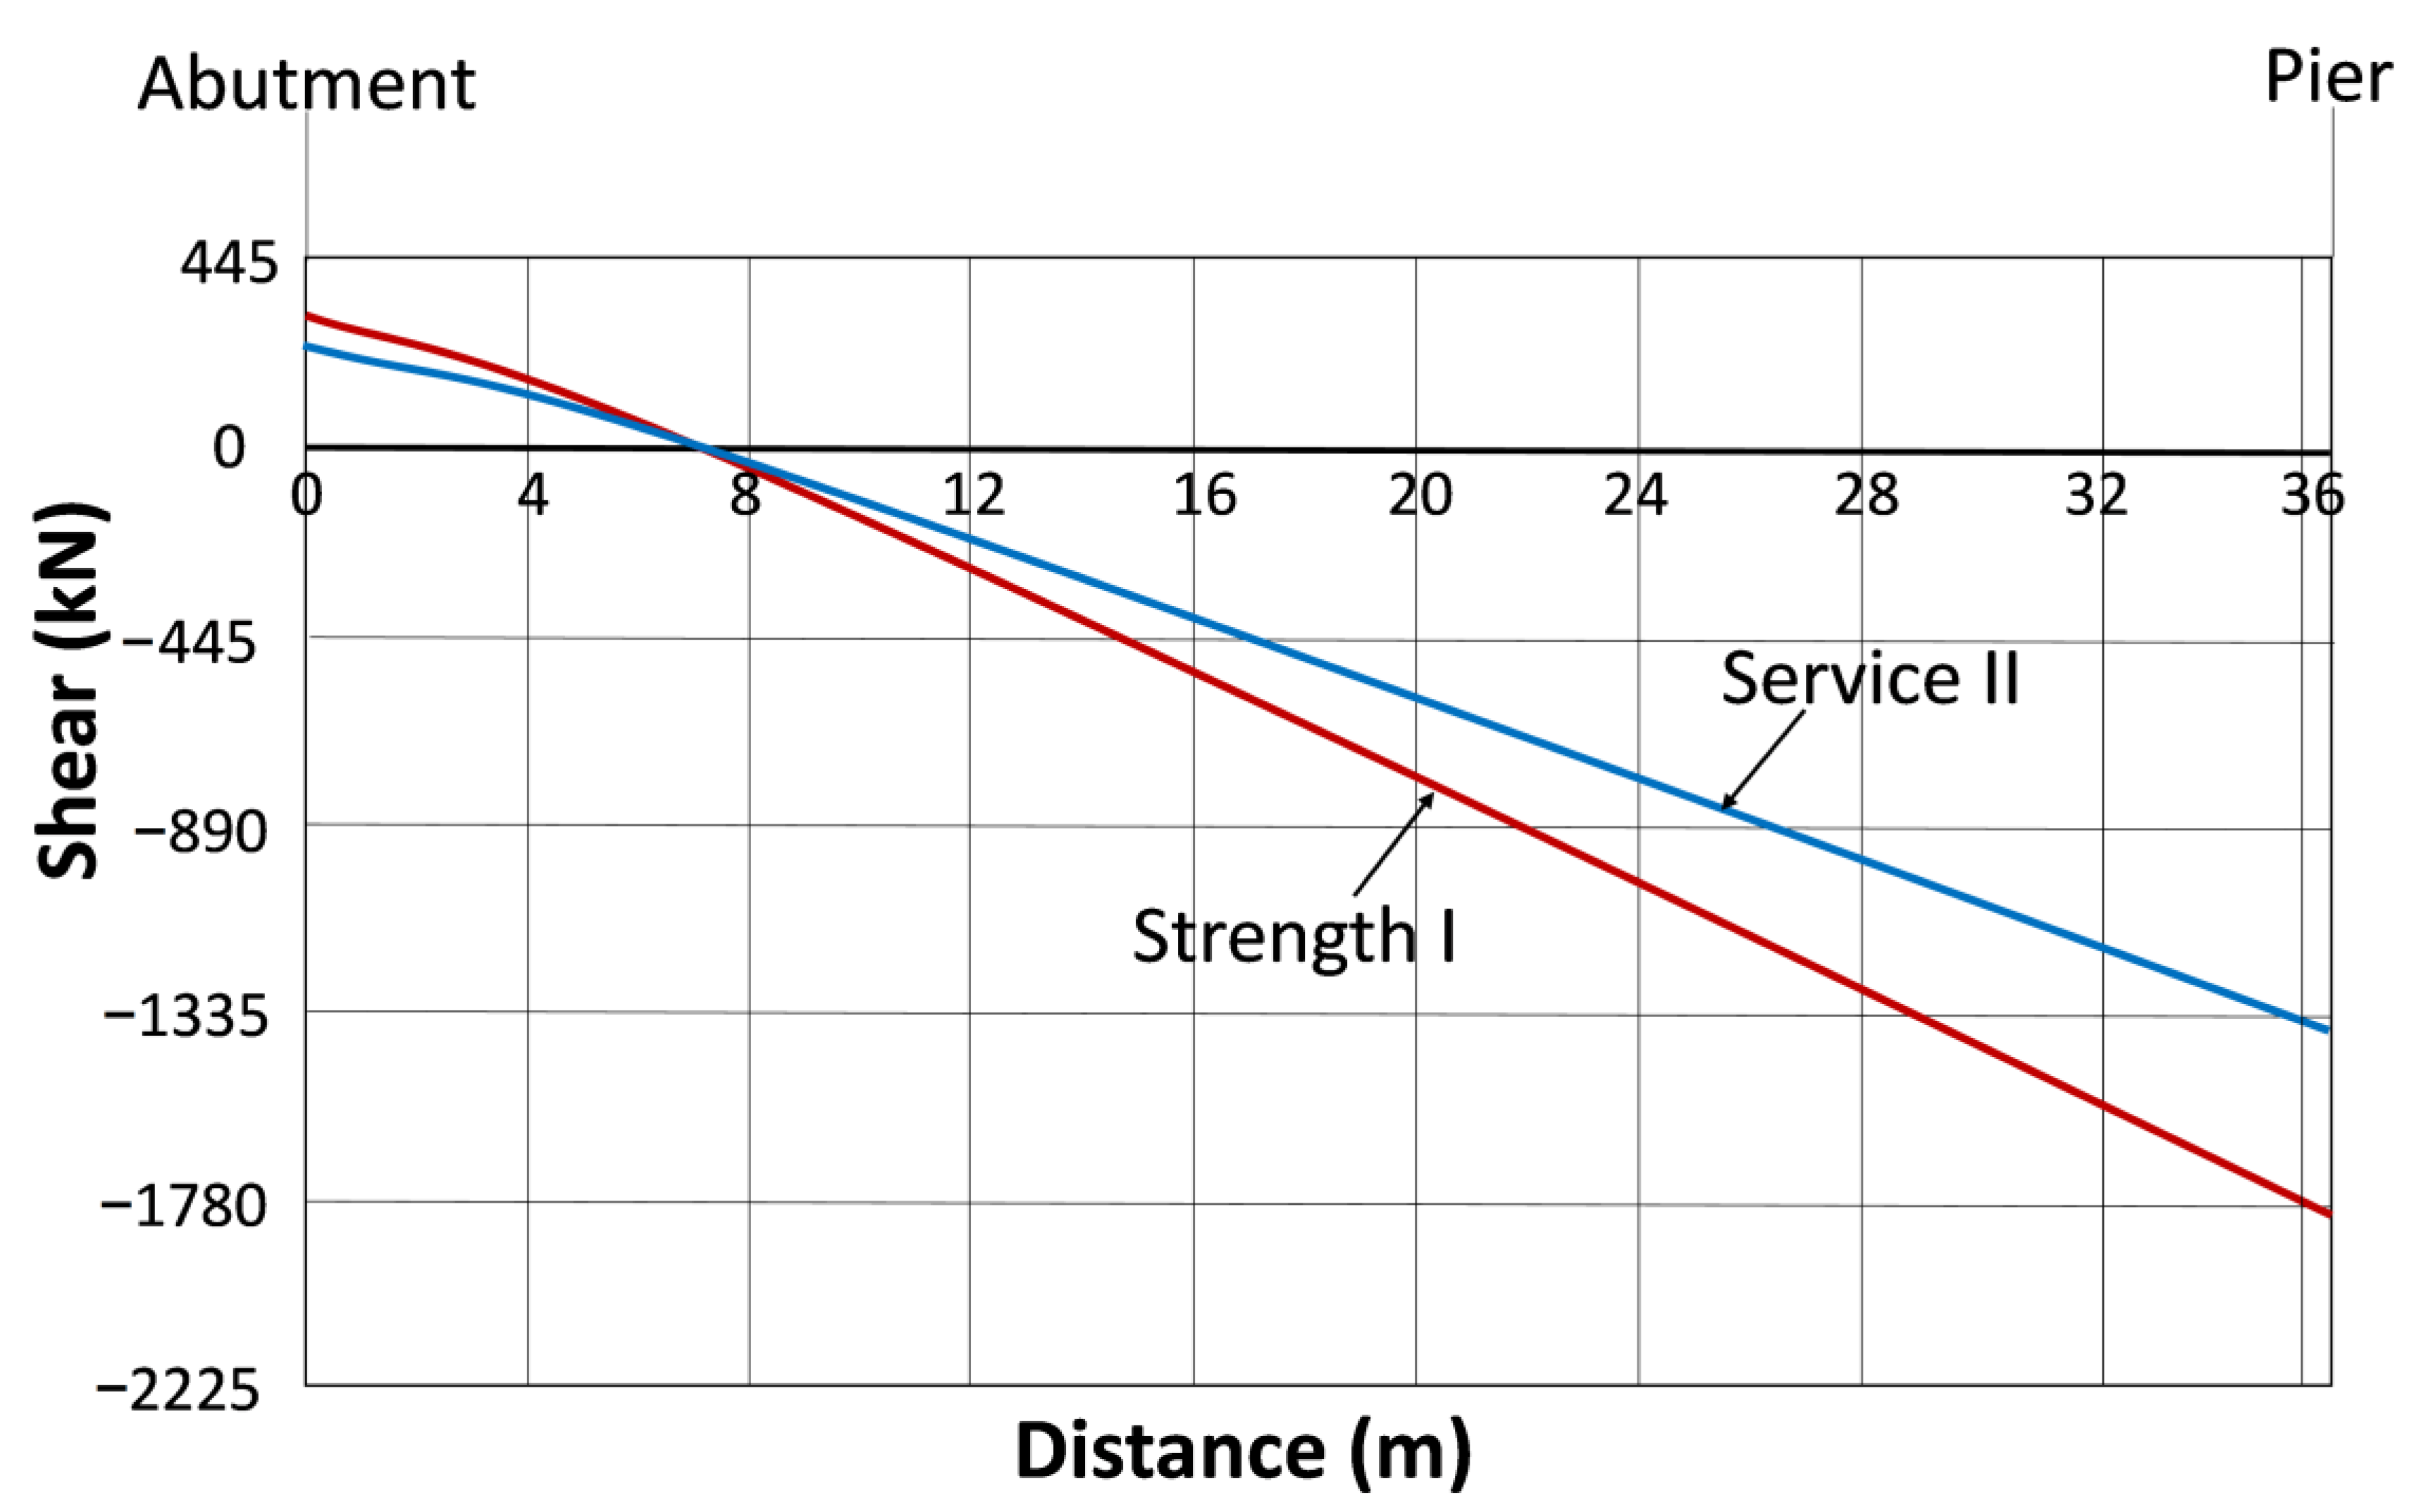
The moment and shear demand on the structural elements is obtained based on a computer-based analysis.
Figure 15 illustrates the envelope shear and moment demand on one of the spans. From the results of the envelope moment, it can be noted that the maximum positive moment is located at 0.4 of the span total length, and the maximum negative moment is located at the pier. Therefore, the shear is minimal at the maximum positive moment and the largest at the location of the piers.
Based on the demand results, welded plate I-girders are designed based on
AASHTO LRFD Bridge Design Specifications, considering all the limits and relevant design considerations. First, a trial section is chosen and checked using code design requirements checks. Some critical checks include the section proportion limit, service deflection limit state, fatigue, and constructability check. Considering all the previously mentioned checks and the demand for the structure, a final design of the girders is produced, as shown in
Figure 16. It can be noted that stiffeners are provided at one side of the web within the regions of high shear since the shear resistance of the unstiffened web is less than the actual design shear. Additionally, it can be noted that the flange thicknesses are enlarged at the region of the maximum moment and maximum shear (pier location) to satisfy the section proportion limit and critical factored negative moment (neglecting concrete in the slab) at this location.
For the example where a composite bridge is considered, shear connectors are provided throughout the length of the bridge in the negative flexure region. In this region, the longitudinal reinforcement is part of the composite section, and AASHTO LRFD states that shear connectors must be provided in this case. The total volume of the steel of the web and the one-sided transverse stiffeners along the entire length of the bridge girder (i.e., 73.152 m) was calculated to be 1.278 × 109 mm3.
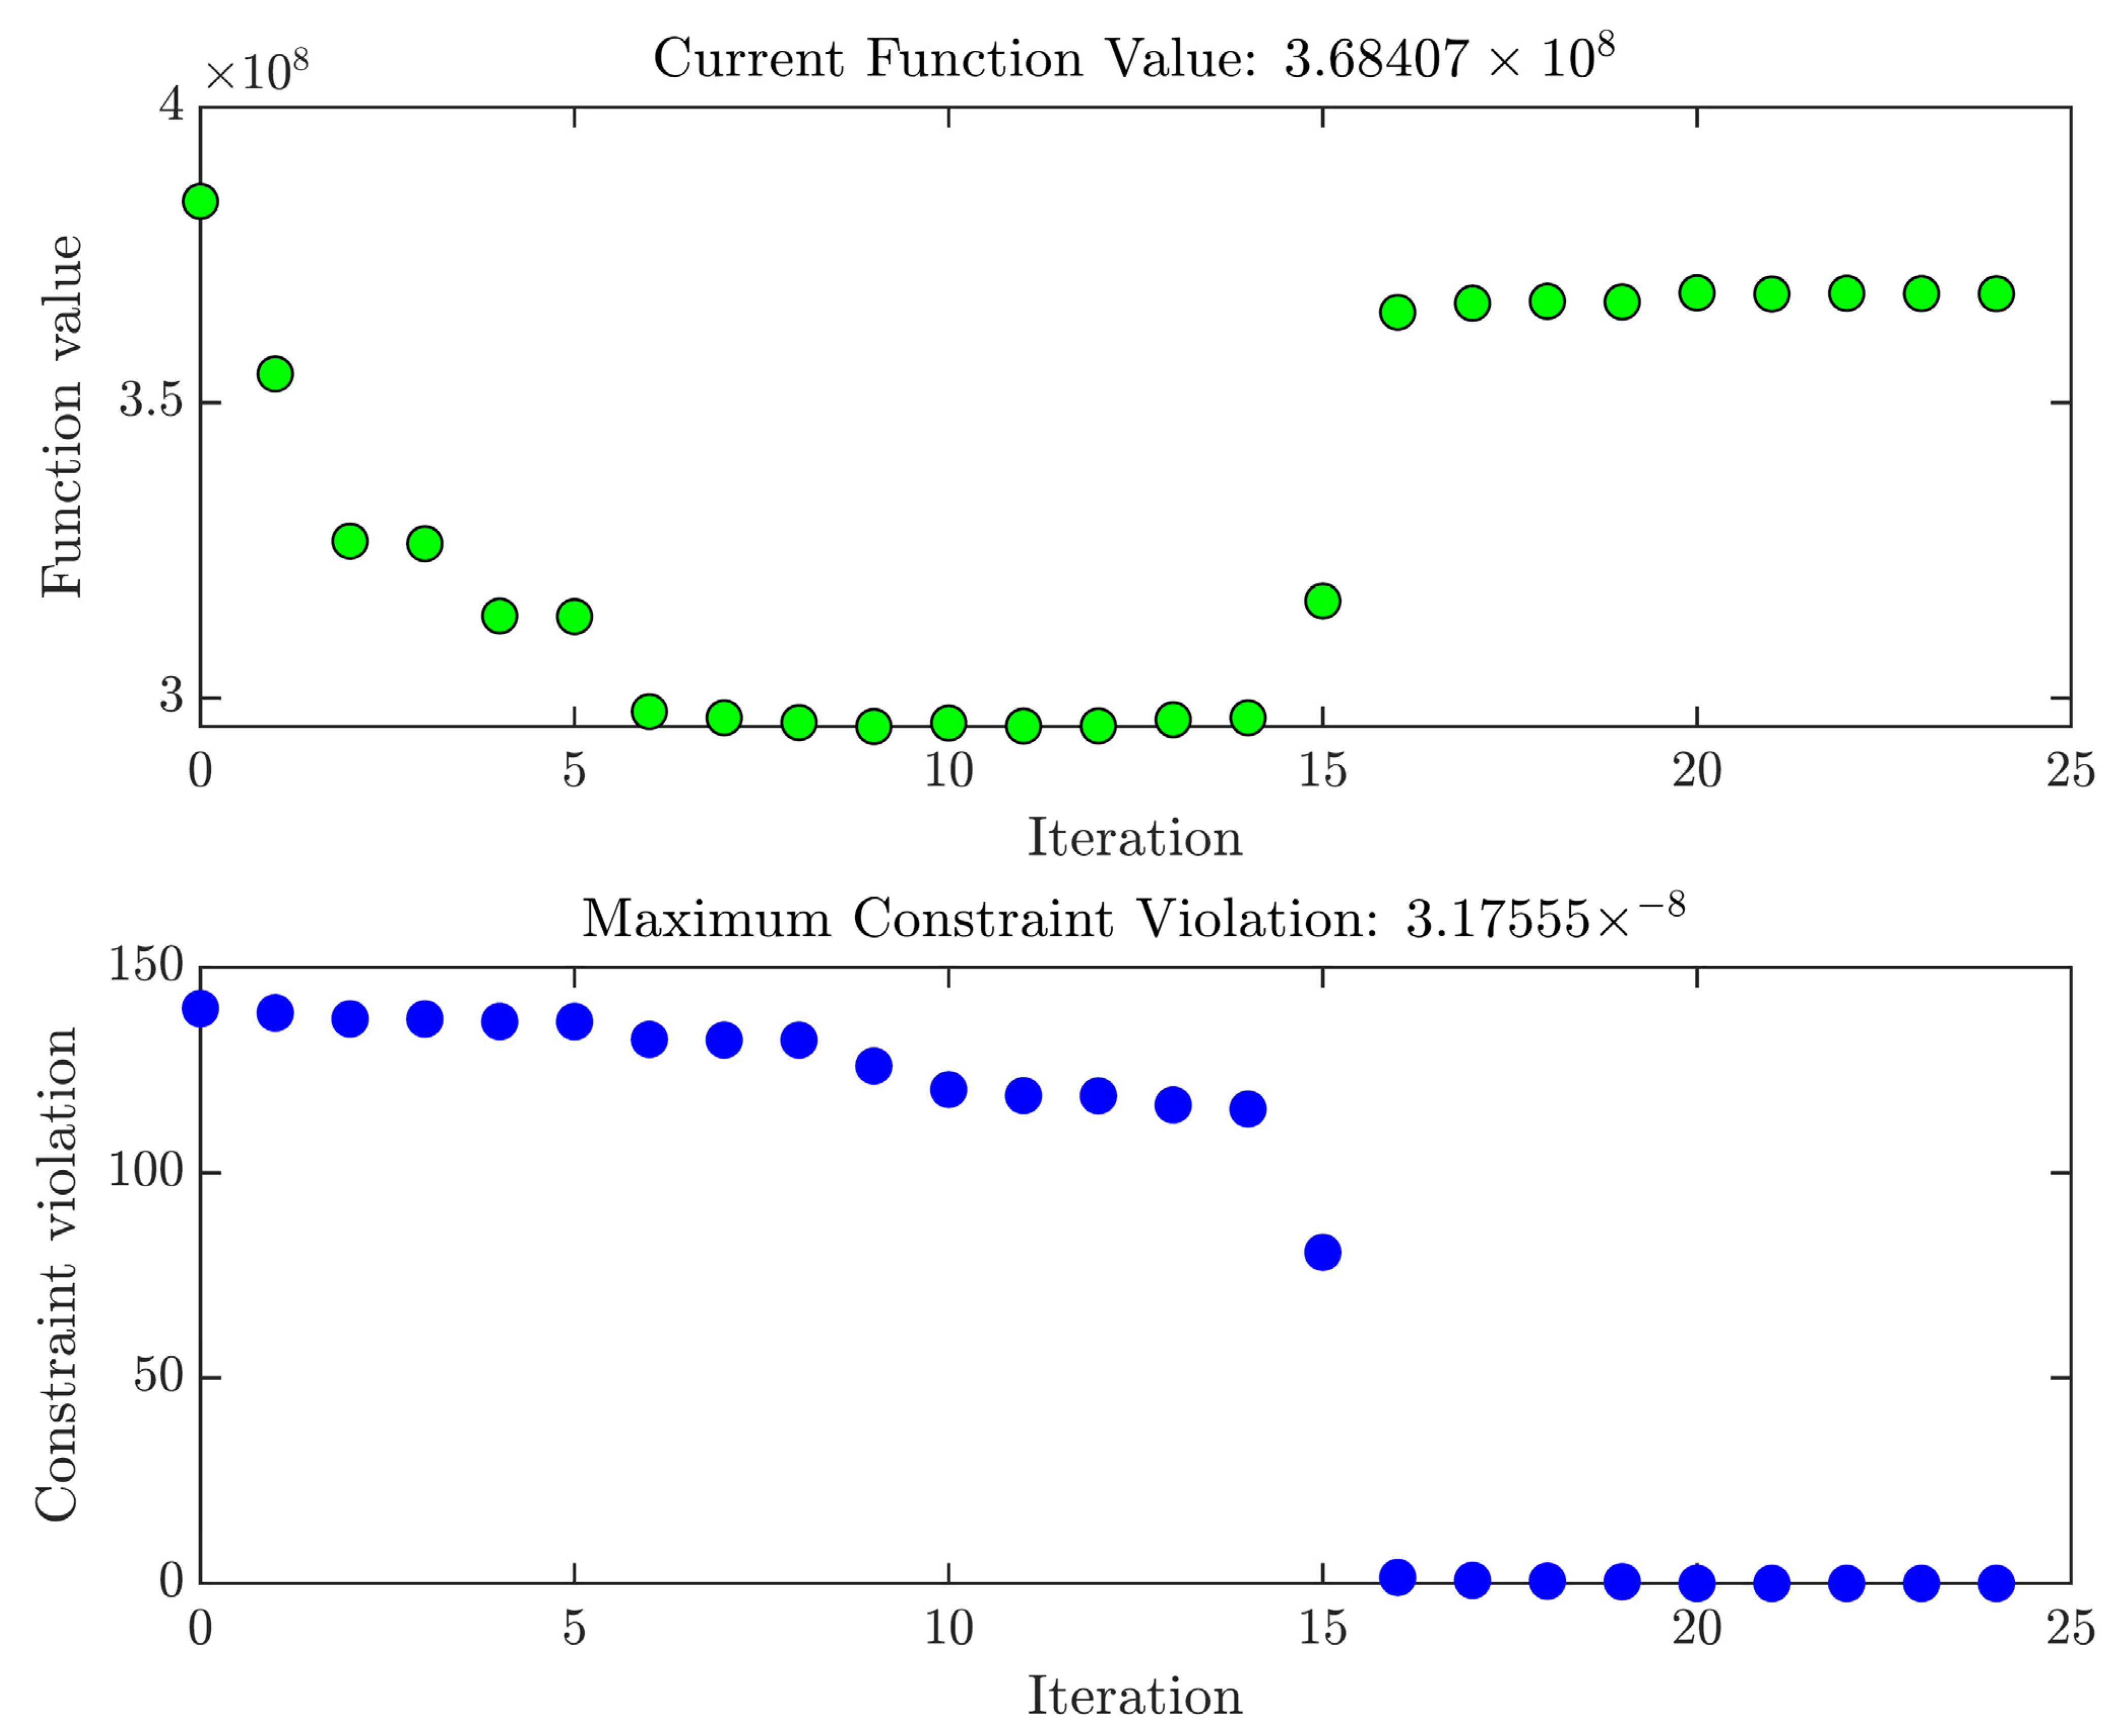
Now, steel girders are constructed using corrugated steel webs. Reliability-based design optimization is applied to minimize the amount of steel while still satisfying the target reliability index,
. The optimum resistance factor for corrugated web steel girders is
[
33]. Hence, the design shear load will be
1923.4 kN.
When applied to one girder, the RBDO code reached the optimum solution after 24 iterations, yielding a design of a corrugated steel web with the following properties:
The optimized corrugated web steel girder has
= 106 folds, and the maximum deflection near the mid-span of the girder is
= 40.5 mm, which is lower than the limit,
. With these section properties, the reliability index was computed to be precisely equal to the target reliability index,
, with all contraints satisfied (see
Figure 17).
Excluding the flanges and bearing stiffeners at the supports, the web’s steel volume was minimized to 7.3681 × 108 mm3. This figure represents approximately 60% of the volume of the steel web of the plated girder.
9. Summary and Conclusions
In the current study, four shear-deficient straight and corrugated web beam specimens were constructed and loaded until failure occurred. The shear response of the test specimens was monitored with proper instrumentation by deploying three LVDTs and installing four strain gauges. The test specimens had different material properties and web geometry configurations, such as the web type, thickness, depth, and corrugation angle. The test results of this study were supplemented by the results of eight beams previously tested by the authors. A parametric study was conducted to extract the effect of each parameter on the shear response, including the shear strength, initial stiffness, and ultimate load at failure. The parametric study led to identifying the effects of critical parameters influencing the shear response of CWSGs, thus leading to a proper formulation of the component reliability-based design optimization (RBDO). The reliability-based shear design optimization was then formulated using the volume of steel as the objective function to be minimized subject to constraints related to the target reliability index, maximum deflection, web depth to thickness, and minimum web depth (to control slenderness). In addition, the number of corrugations was constrained to an integer, which significantly increased the number of optimization iterations.
With regard to the experimental test results:
All the specimens exhibited a shear buckling failure, some due to local buckling, some due to global buckling, and some failed due to interactive shear buckling.
At failure, all test specimens with corrugated webs dropped approximately 35% of their load-carrying capacity. This confirms earlier studies concerning corrugated web girders’ high shear residual strength compared to plated girders.
Failure due to the formation of the frame mechanism was more pronounced in the beam specimens with straight and triangular webs, as well as in the beam with a trapezoidal web that has .
With regard to the parametric study, the following conclusions are drawn:
The shear buckling strength of corrugated webs is higher than that of the straight web; the shear strength of corrugated webs was approximately 1.6 times that of the straight web with similar dimensions. A similar trend was observed immediately before the ultimate failure in the ultimate load-bearing capacity.
The initial stiffness of corrugated web beams is 40-55% higher than that of straight web beams; however, the trapezoidal corrugated web with has an initial stiffness of 25% higher.
The corrugation angle has little effect on the shear response of corrugated webs.
Increasing the trapezoidal web thickness from 1.2 mm to 2 mm resulted in an increase of four times both the shear strength and the ultimate load and an increase in the initial stiffness by 54%.
Increasing the trapezoidal web depth from 305 mm to 505 mm (i.e., by 66%) resulted in an increase in the shear strength by 50%, an increase in the initial stiffness by 35%, and an increase in the ultimate load by approximately 36%.
With regard to the RBDO, the formulated optimization problem and its implementation demonstrated that it is possible and practical to design girders with corrugated webs based on structural reliability approaches to achieve economic designs. The algorithm was applied to two problems from the literature, one related to buildings and another to highway bridges. The results show that the proposed optimization scheme could yield greater material savings while maintaining the specifications’ safety requirements. For instance, in the first application of the building girder, the savings in terms of the volume of steel were approximately 20%. In the second application involving the bridge girder, the savings were about 40%.
It should be noted that the current formulation of our RBDO does not take into consideration the cost associated with fabrication and labor involved in building plated and corrugated girders.


