
Estimating the Bond Strength of FRP Bars Using a Hybrid Machine Learning Model

Abstract
:1. Introduction
2. Methodology
2.1. Extreme Learning Machine Network
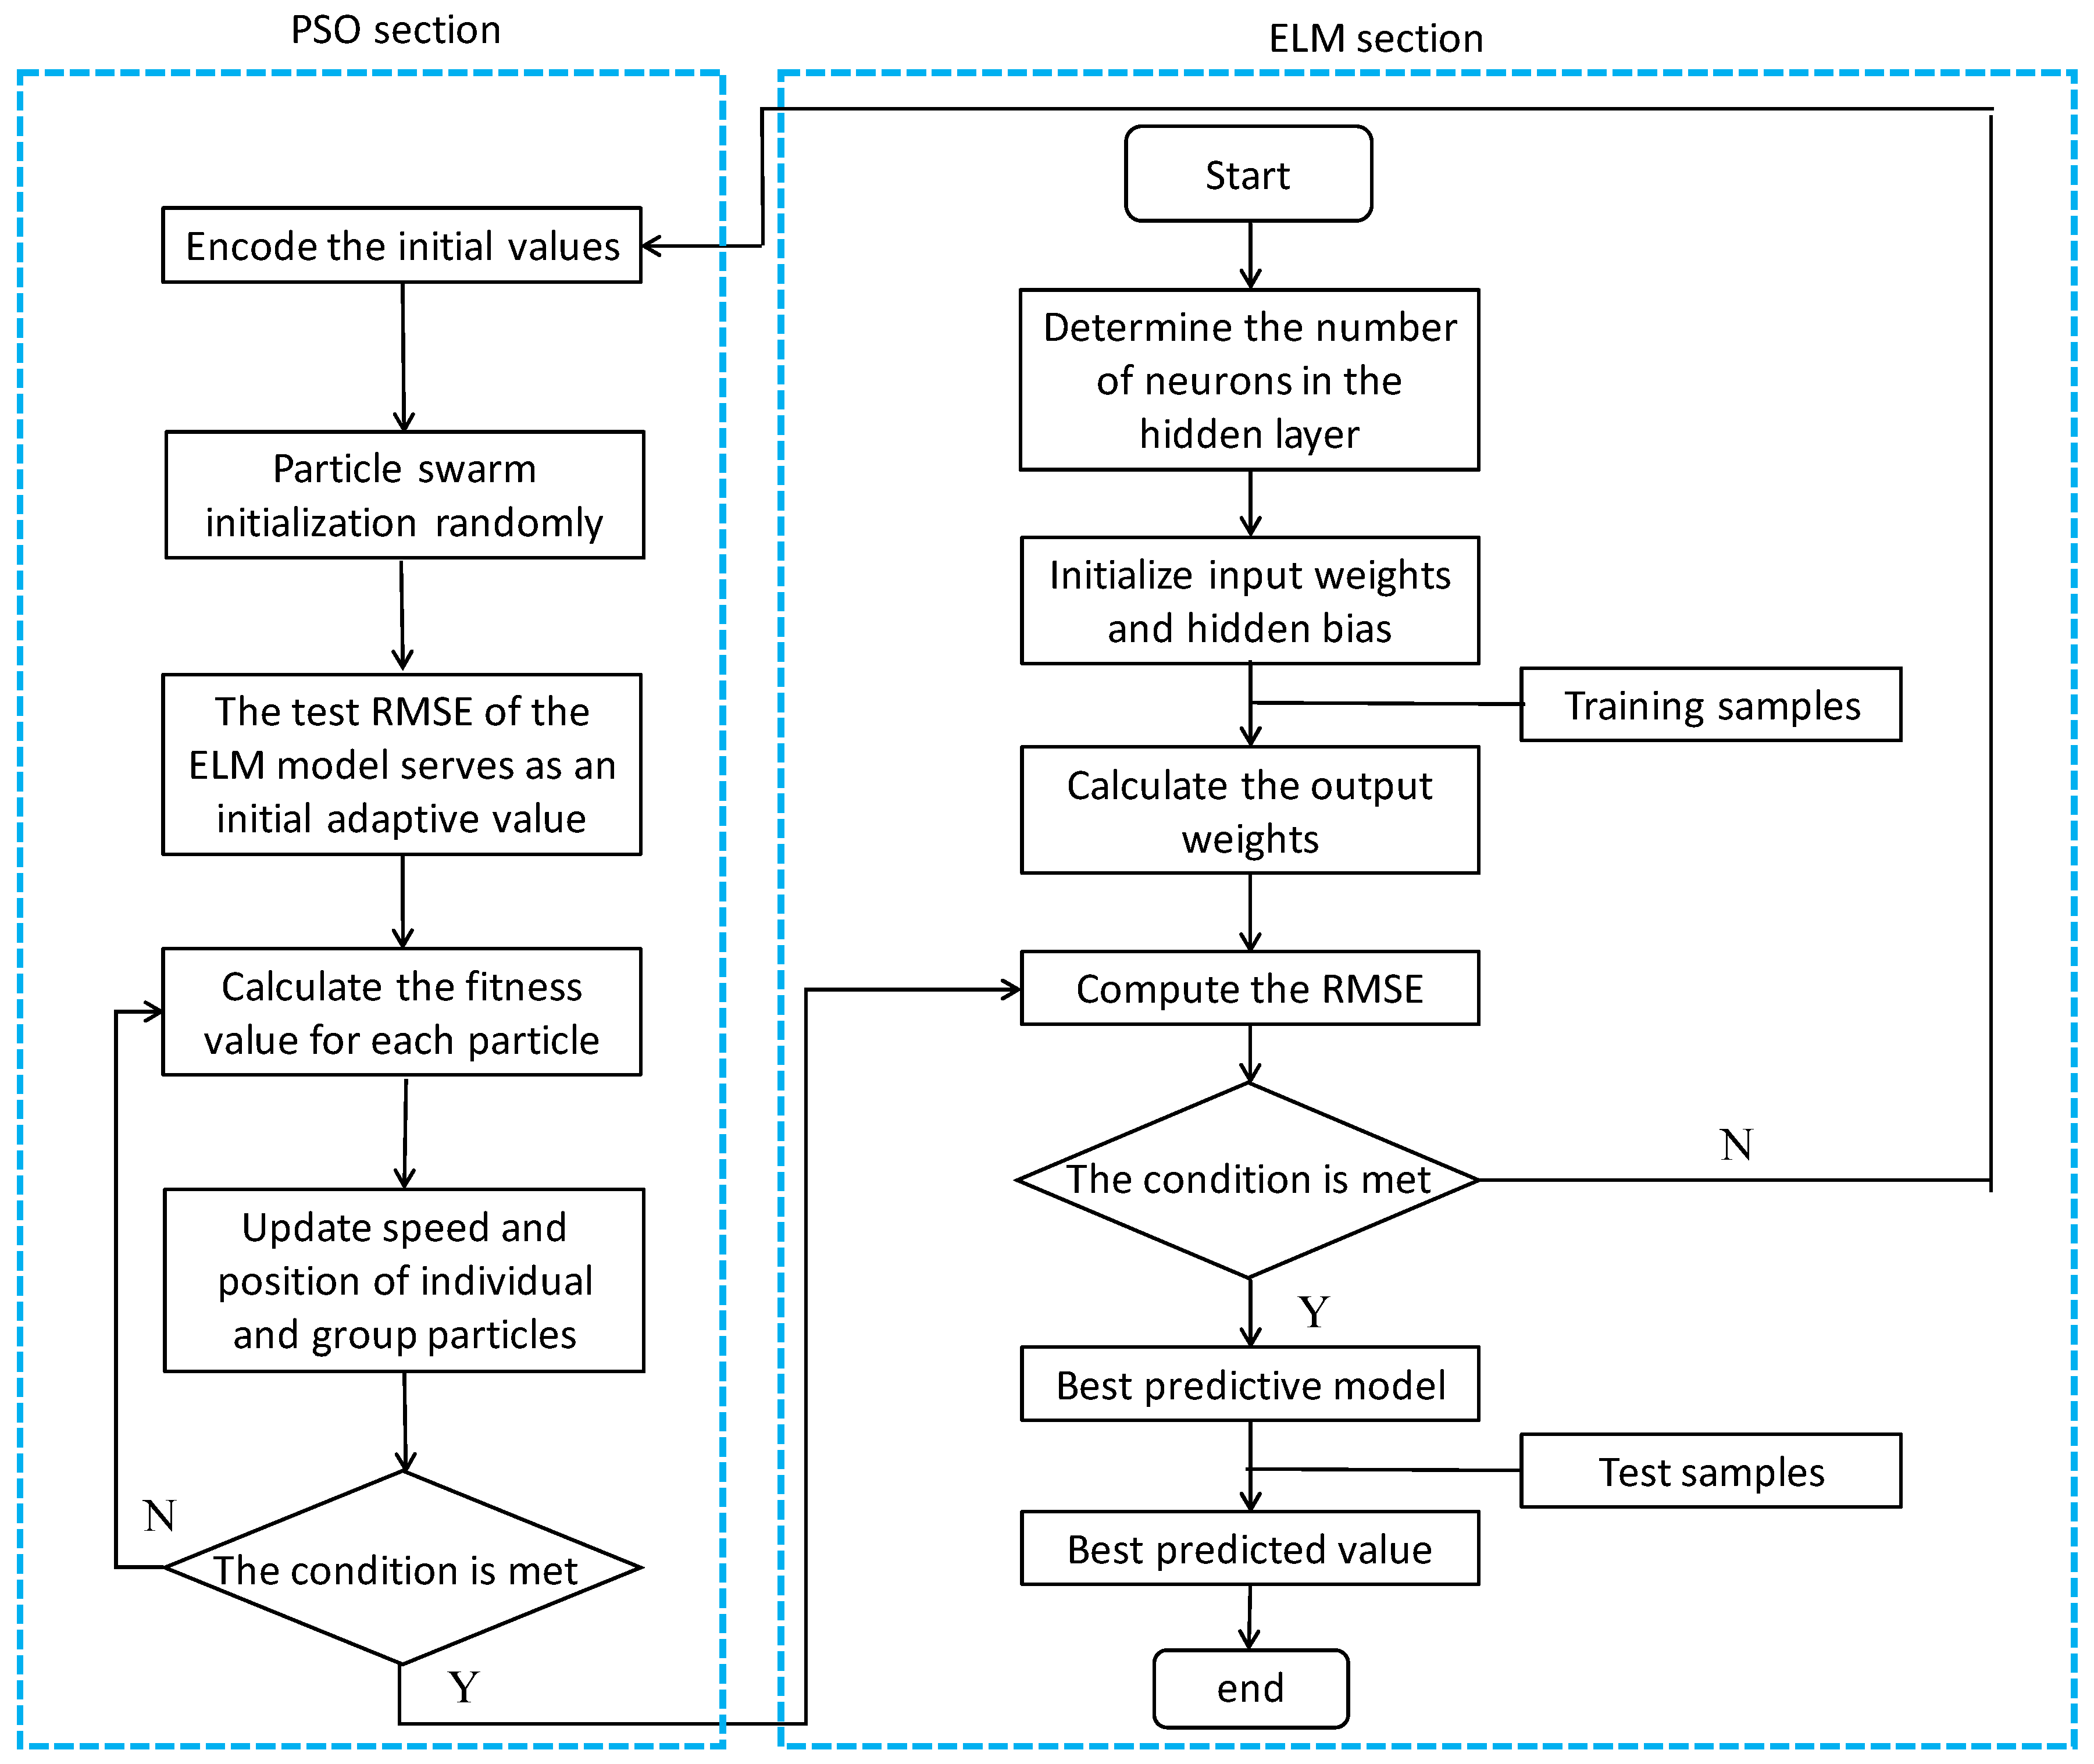
2.2. PSO-ELM Prediction Model
- (1)
- ELM randomly generates the weights w and threshold b of the input layer and determines the implied layer weights β from this set of weights and thresholds.
- (2)
- The particle population randomly generates n particles, and each particle in this population represents a vector of dimension D. The dimension of this particle is determined by the input parameters of the ELM model, and the initial value of the acceleration factor and the maximum number of iterations is set, and the end condition of the experiment is to meet the accuracy requirement or to reach the maximum number of iterations [38].
- (3)
- Selection of inertia weights: In order to make the algorithm achieve better global search and local search capabilities, linear decreasing inertia weights are used.where k is the current iteration generation, Tmax is the maximum iteration generation, wstart is the initial inertia weight, and wend is the inertia weight at the maximum number of iterations.
- (4)
- Determine the fitness function: In this paper, the fitness function is defined as the root mean square error, and its formula is:where Yi is the true value of the bond strength, is the predicted value of the bond strength, N is the number of training samples, and F is the fitness value as a function of value. Then, the velocity and position of the particles are updated [39]:where Vi is the particle motion velocity, Vmax is the maximum particle velocity, Vmin is the minimum particle velocity, Xi is the particle position, Xmax is the maximum particle position, and Xmin is the minimum particle position.
- (5)
- Solve the global fitness f(xi): Continue contrasting each particle’s current fitness f(xi) with its previous optimal fitness f(Pbest) and use the end condition to calculate its magnitude.
- (6)
- Substitute the optimal solutions w and b into the ELM model.
- (7)
- Train the PSO-ELM model with the training data. Then, retest whether the mean square error meets the accuracy requirement with the test sample; if it meets the requirement, end the training—if not, return to step (2).
3. Dataset Collection and Model Building
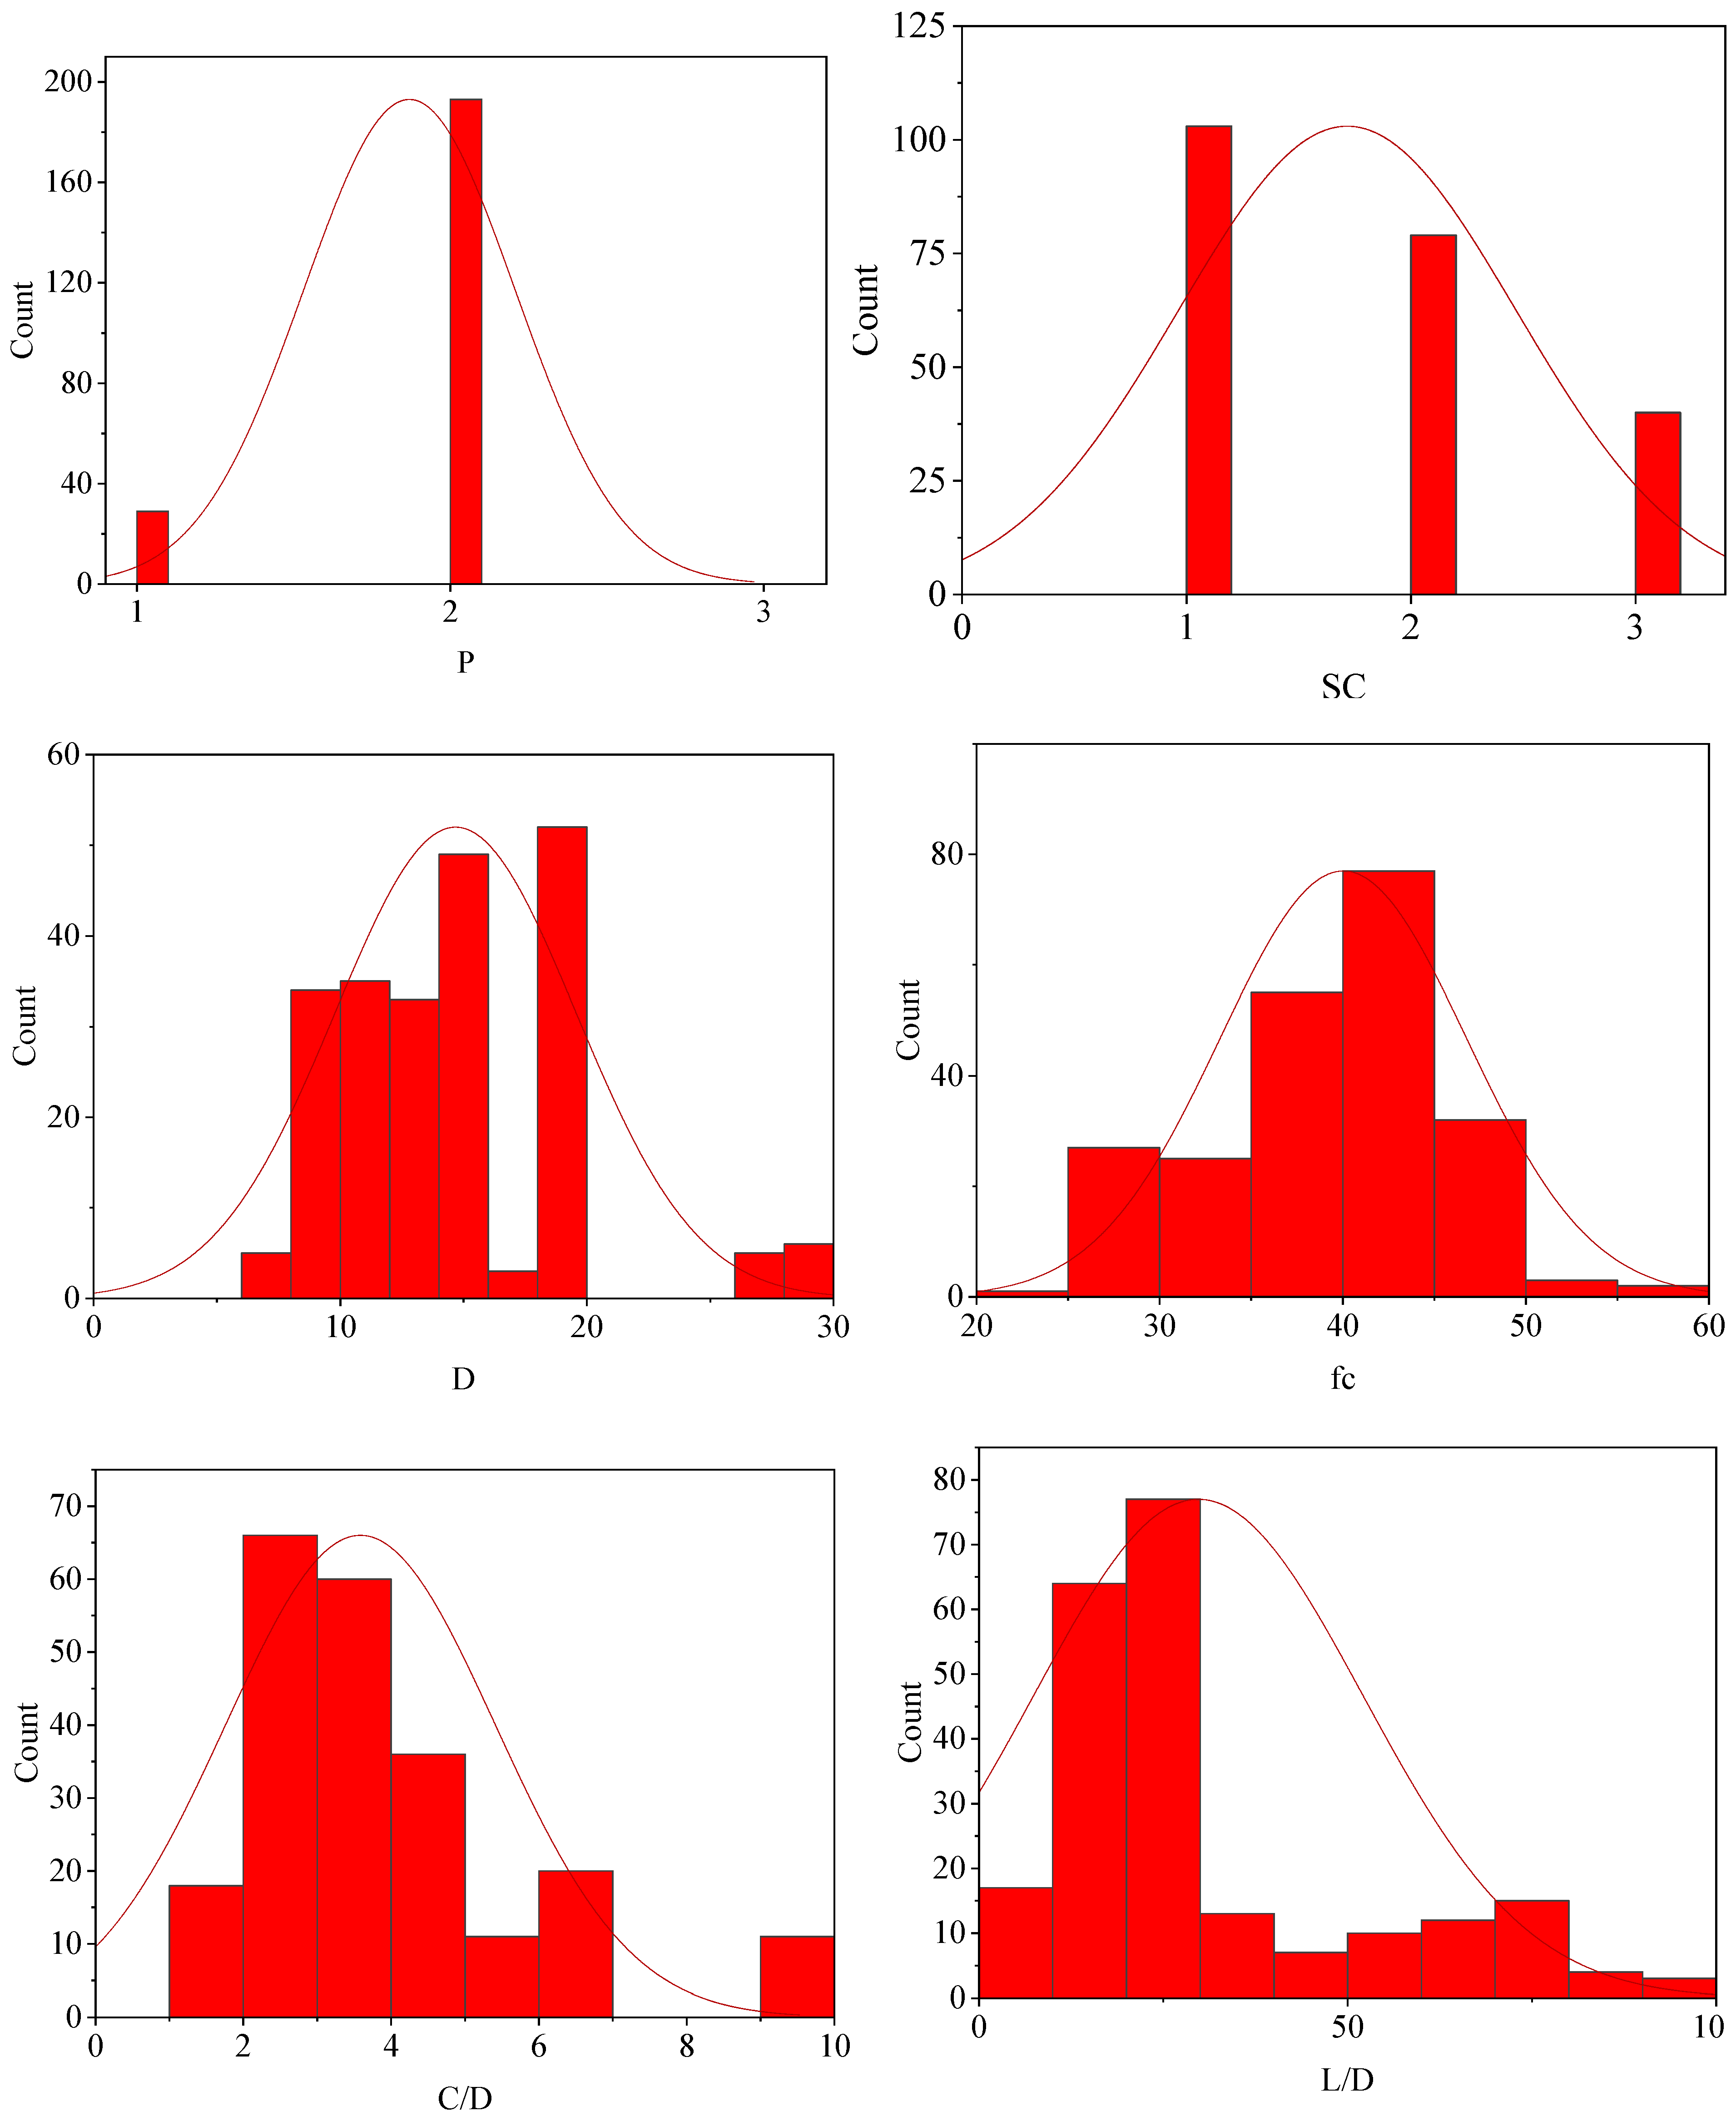
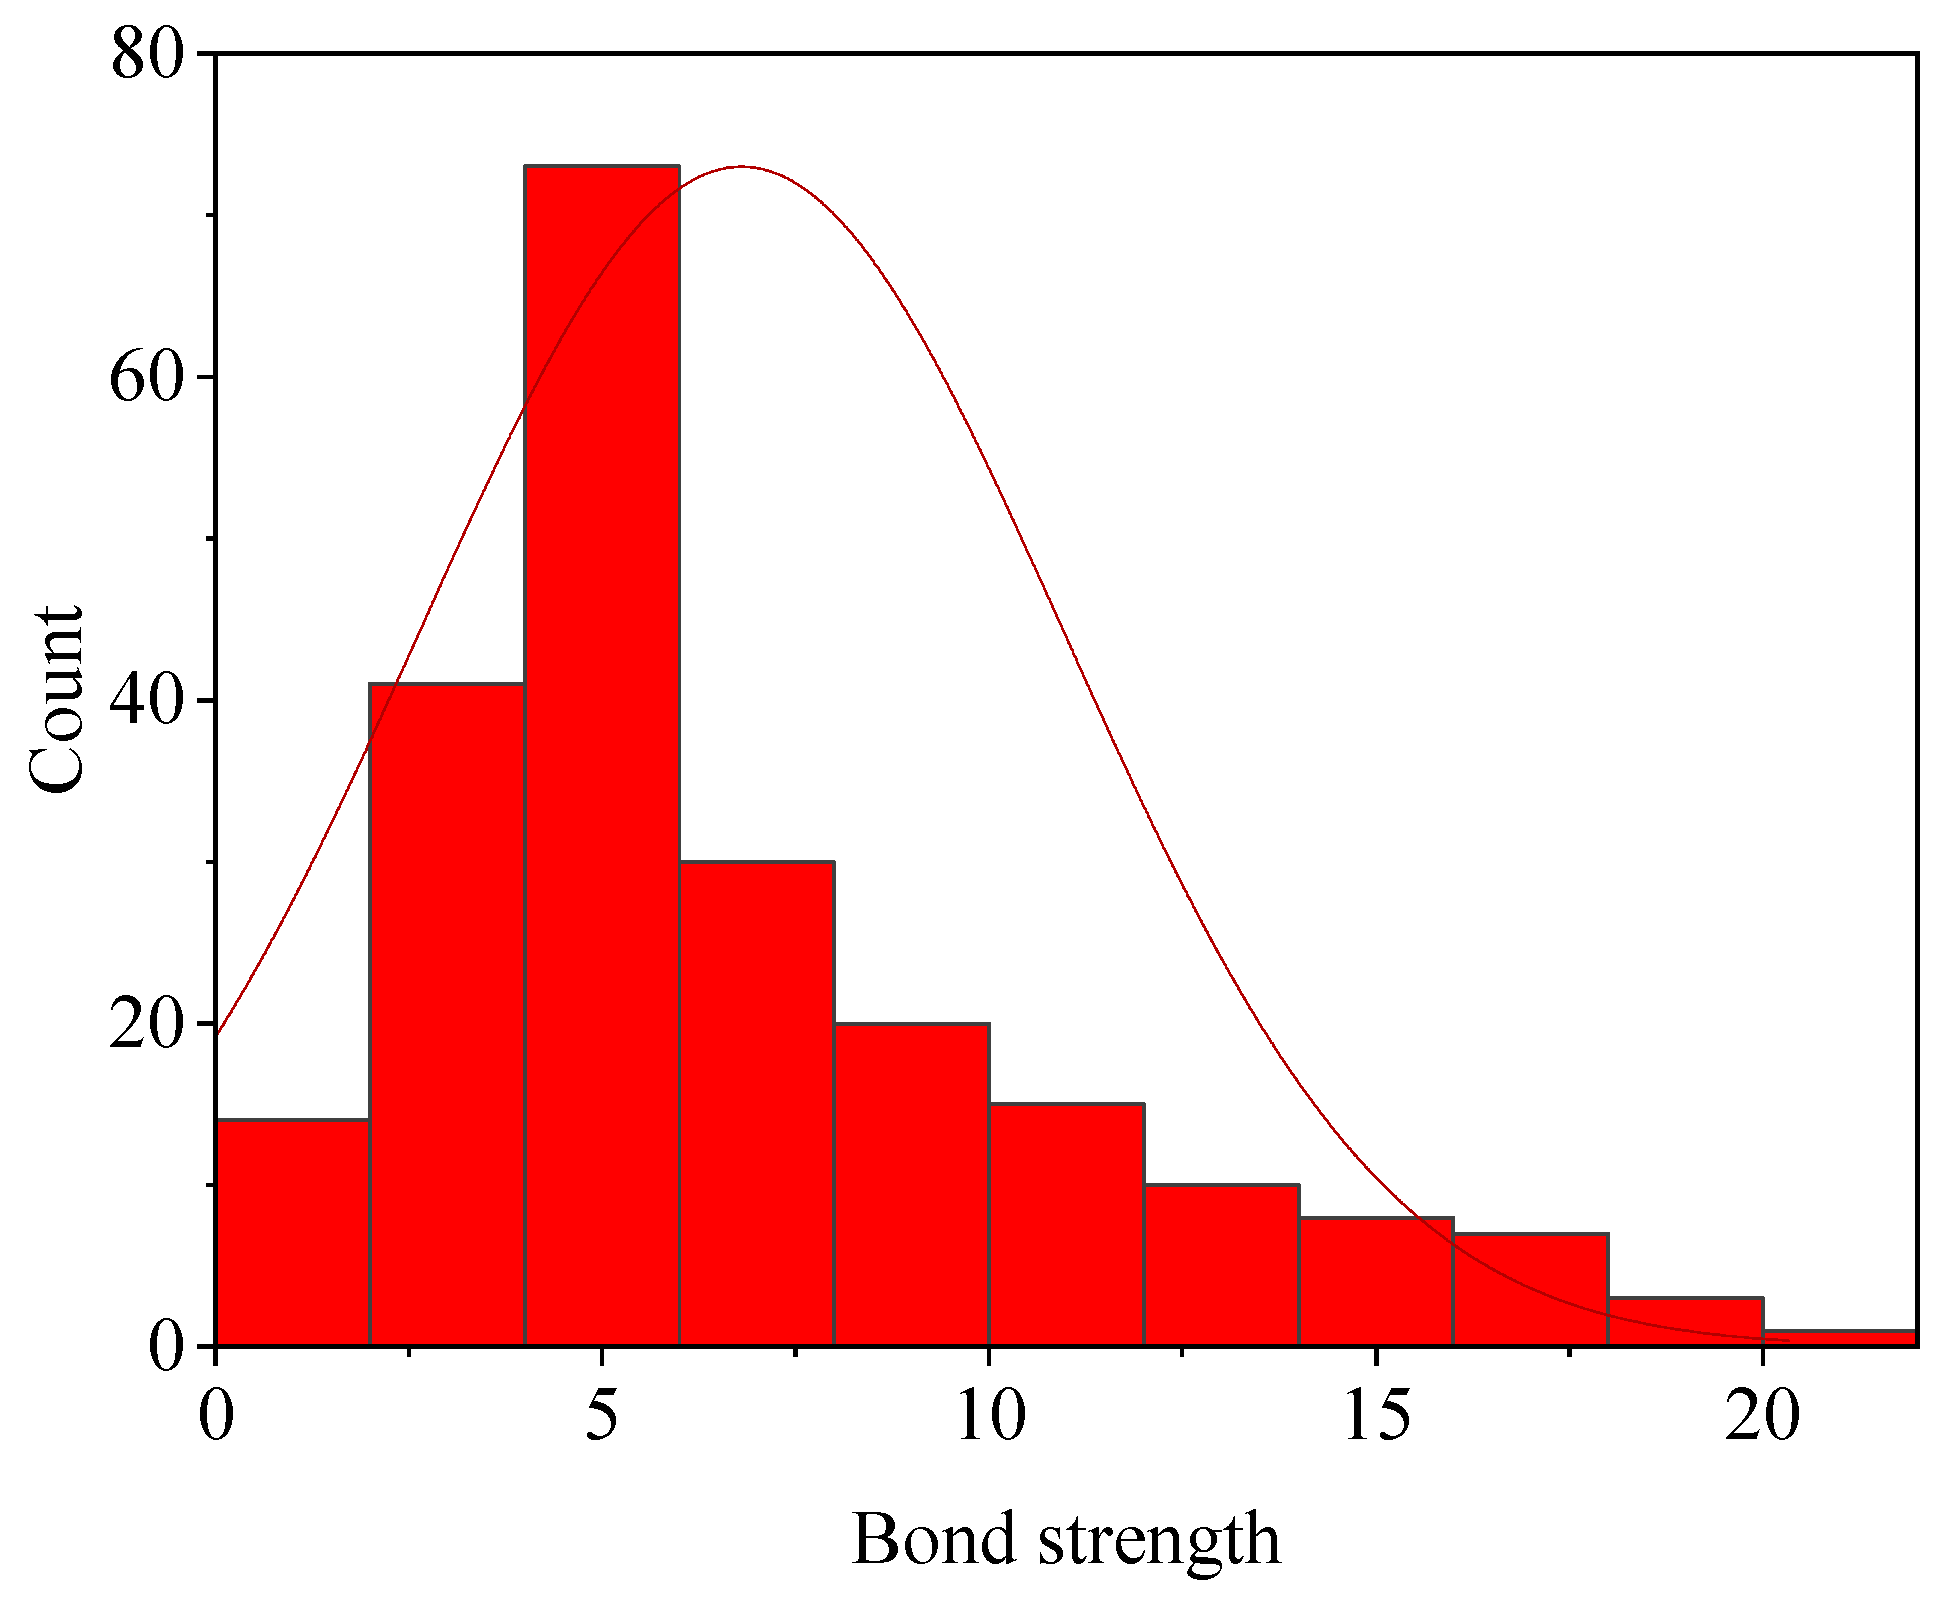
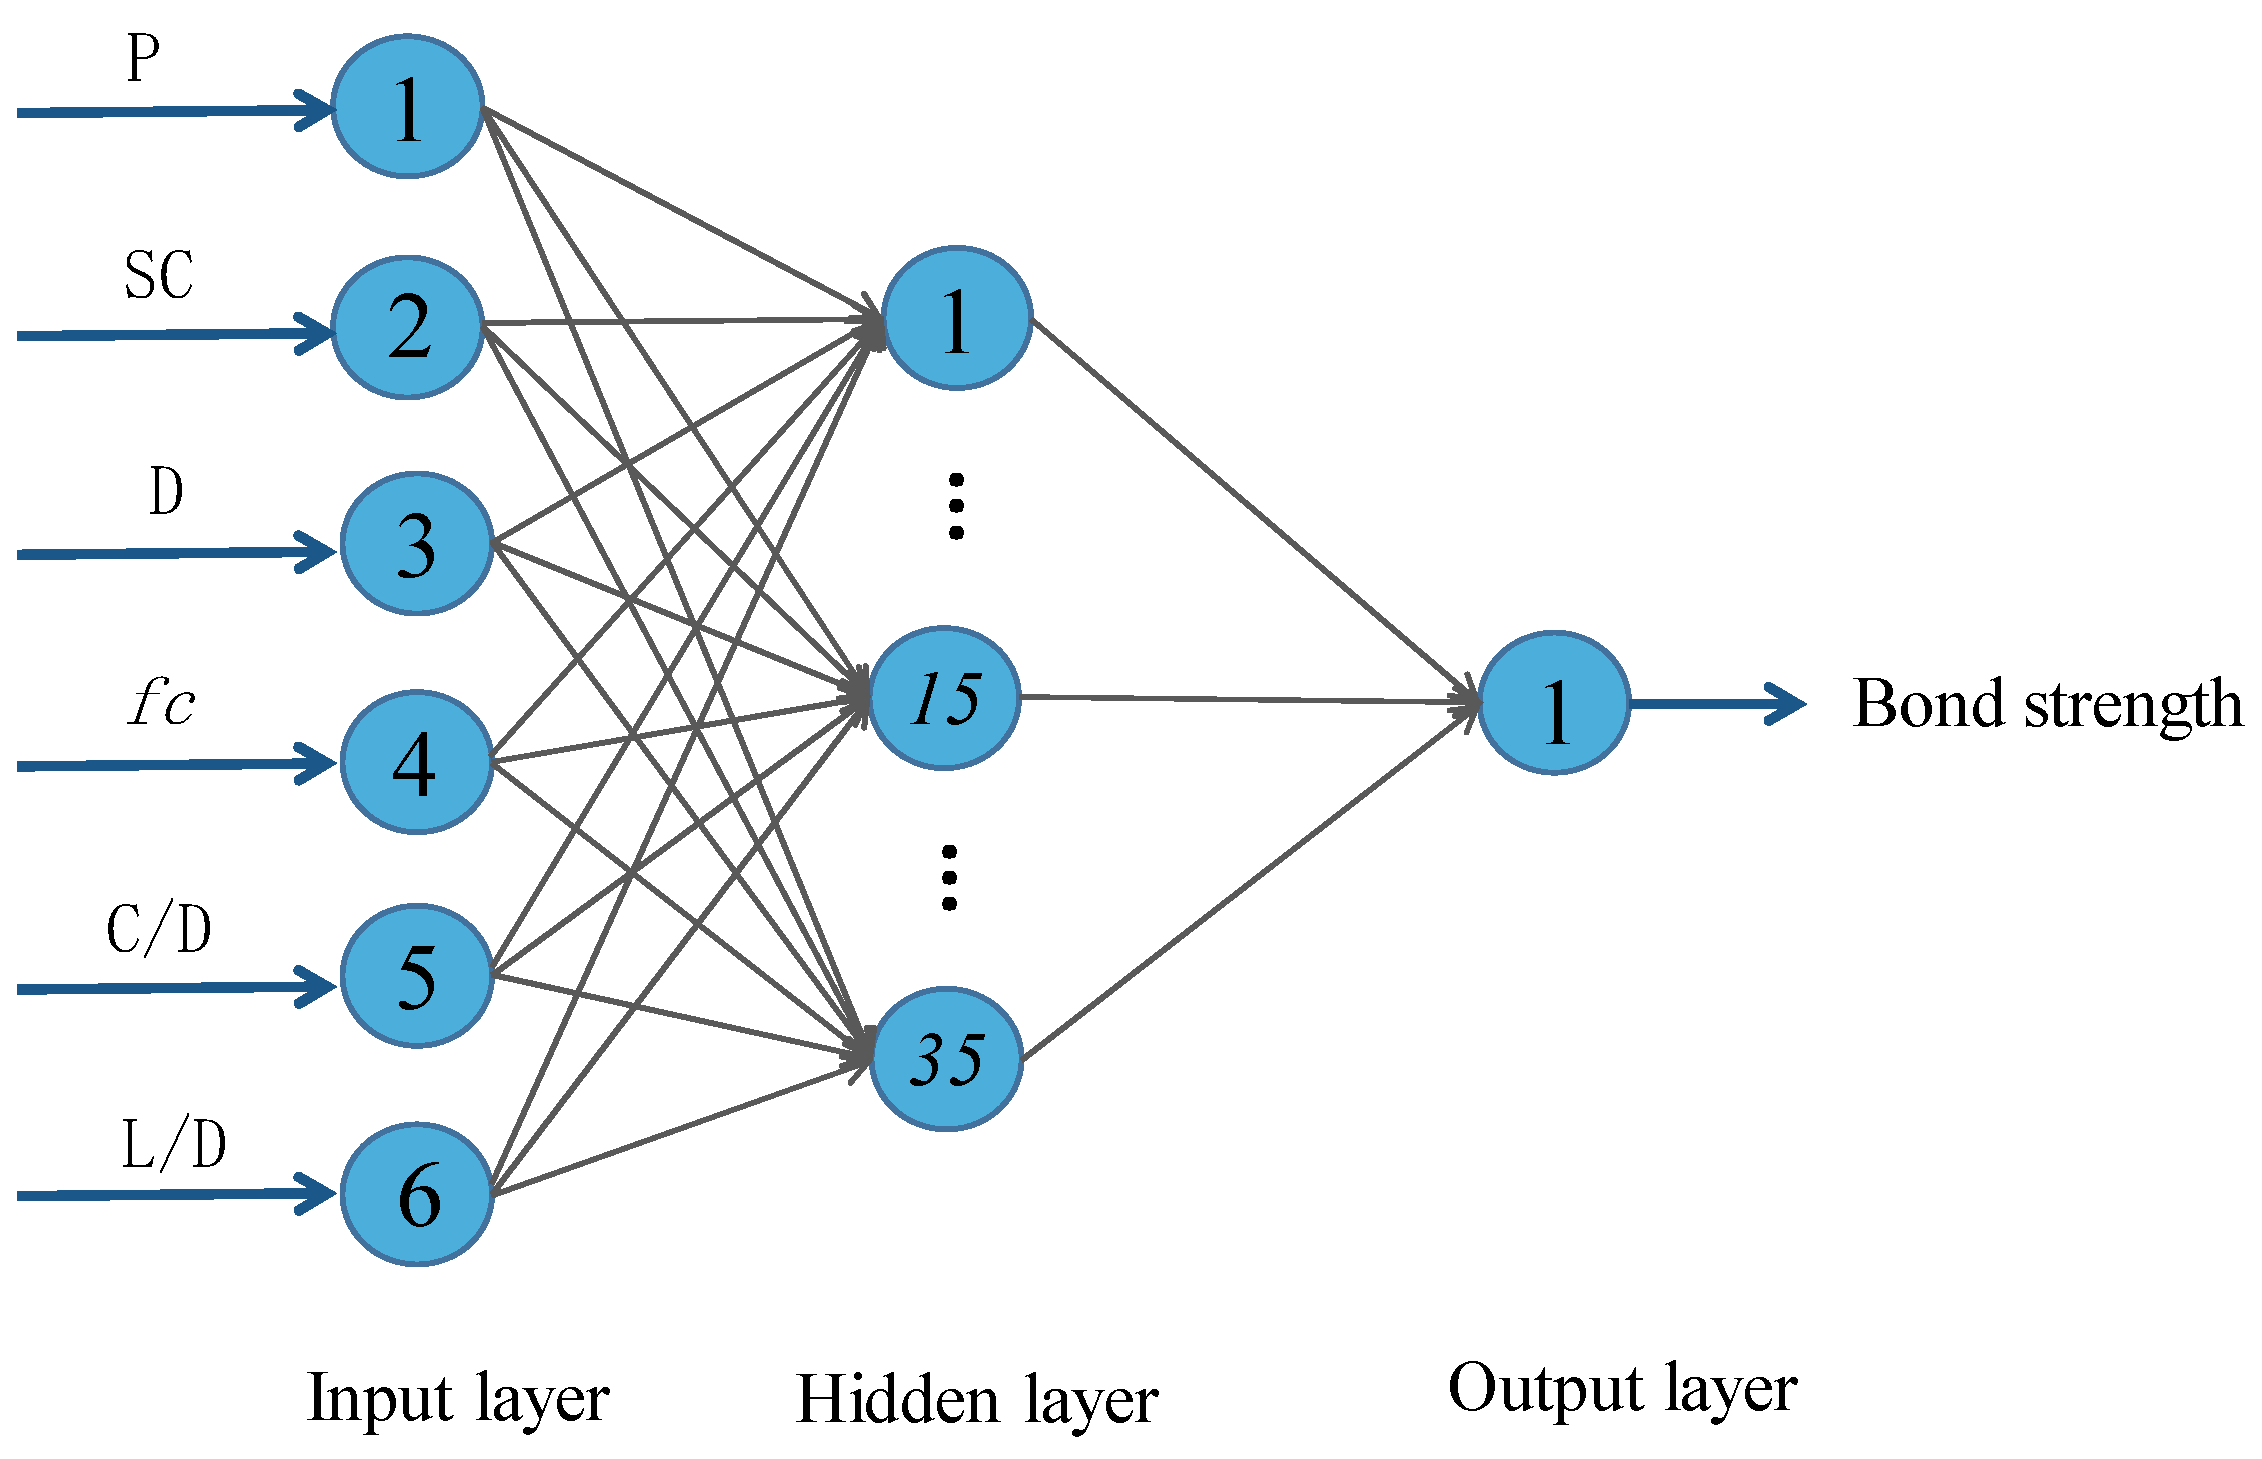
3.1. Input and Output Variables
3.2. Evaluation Metrics
3.3. Model Building
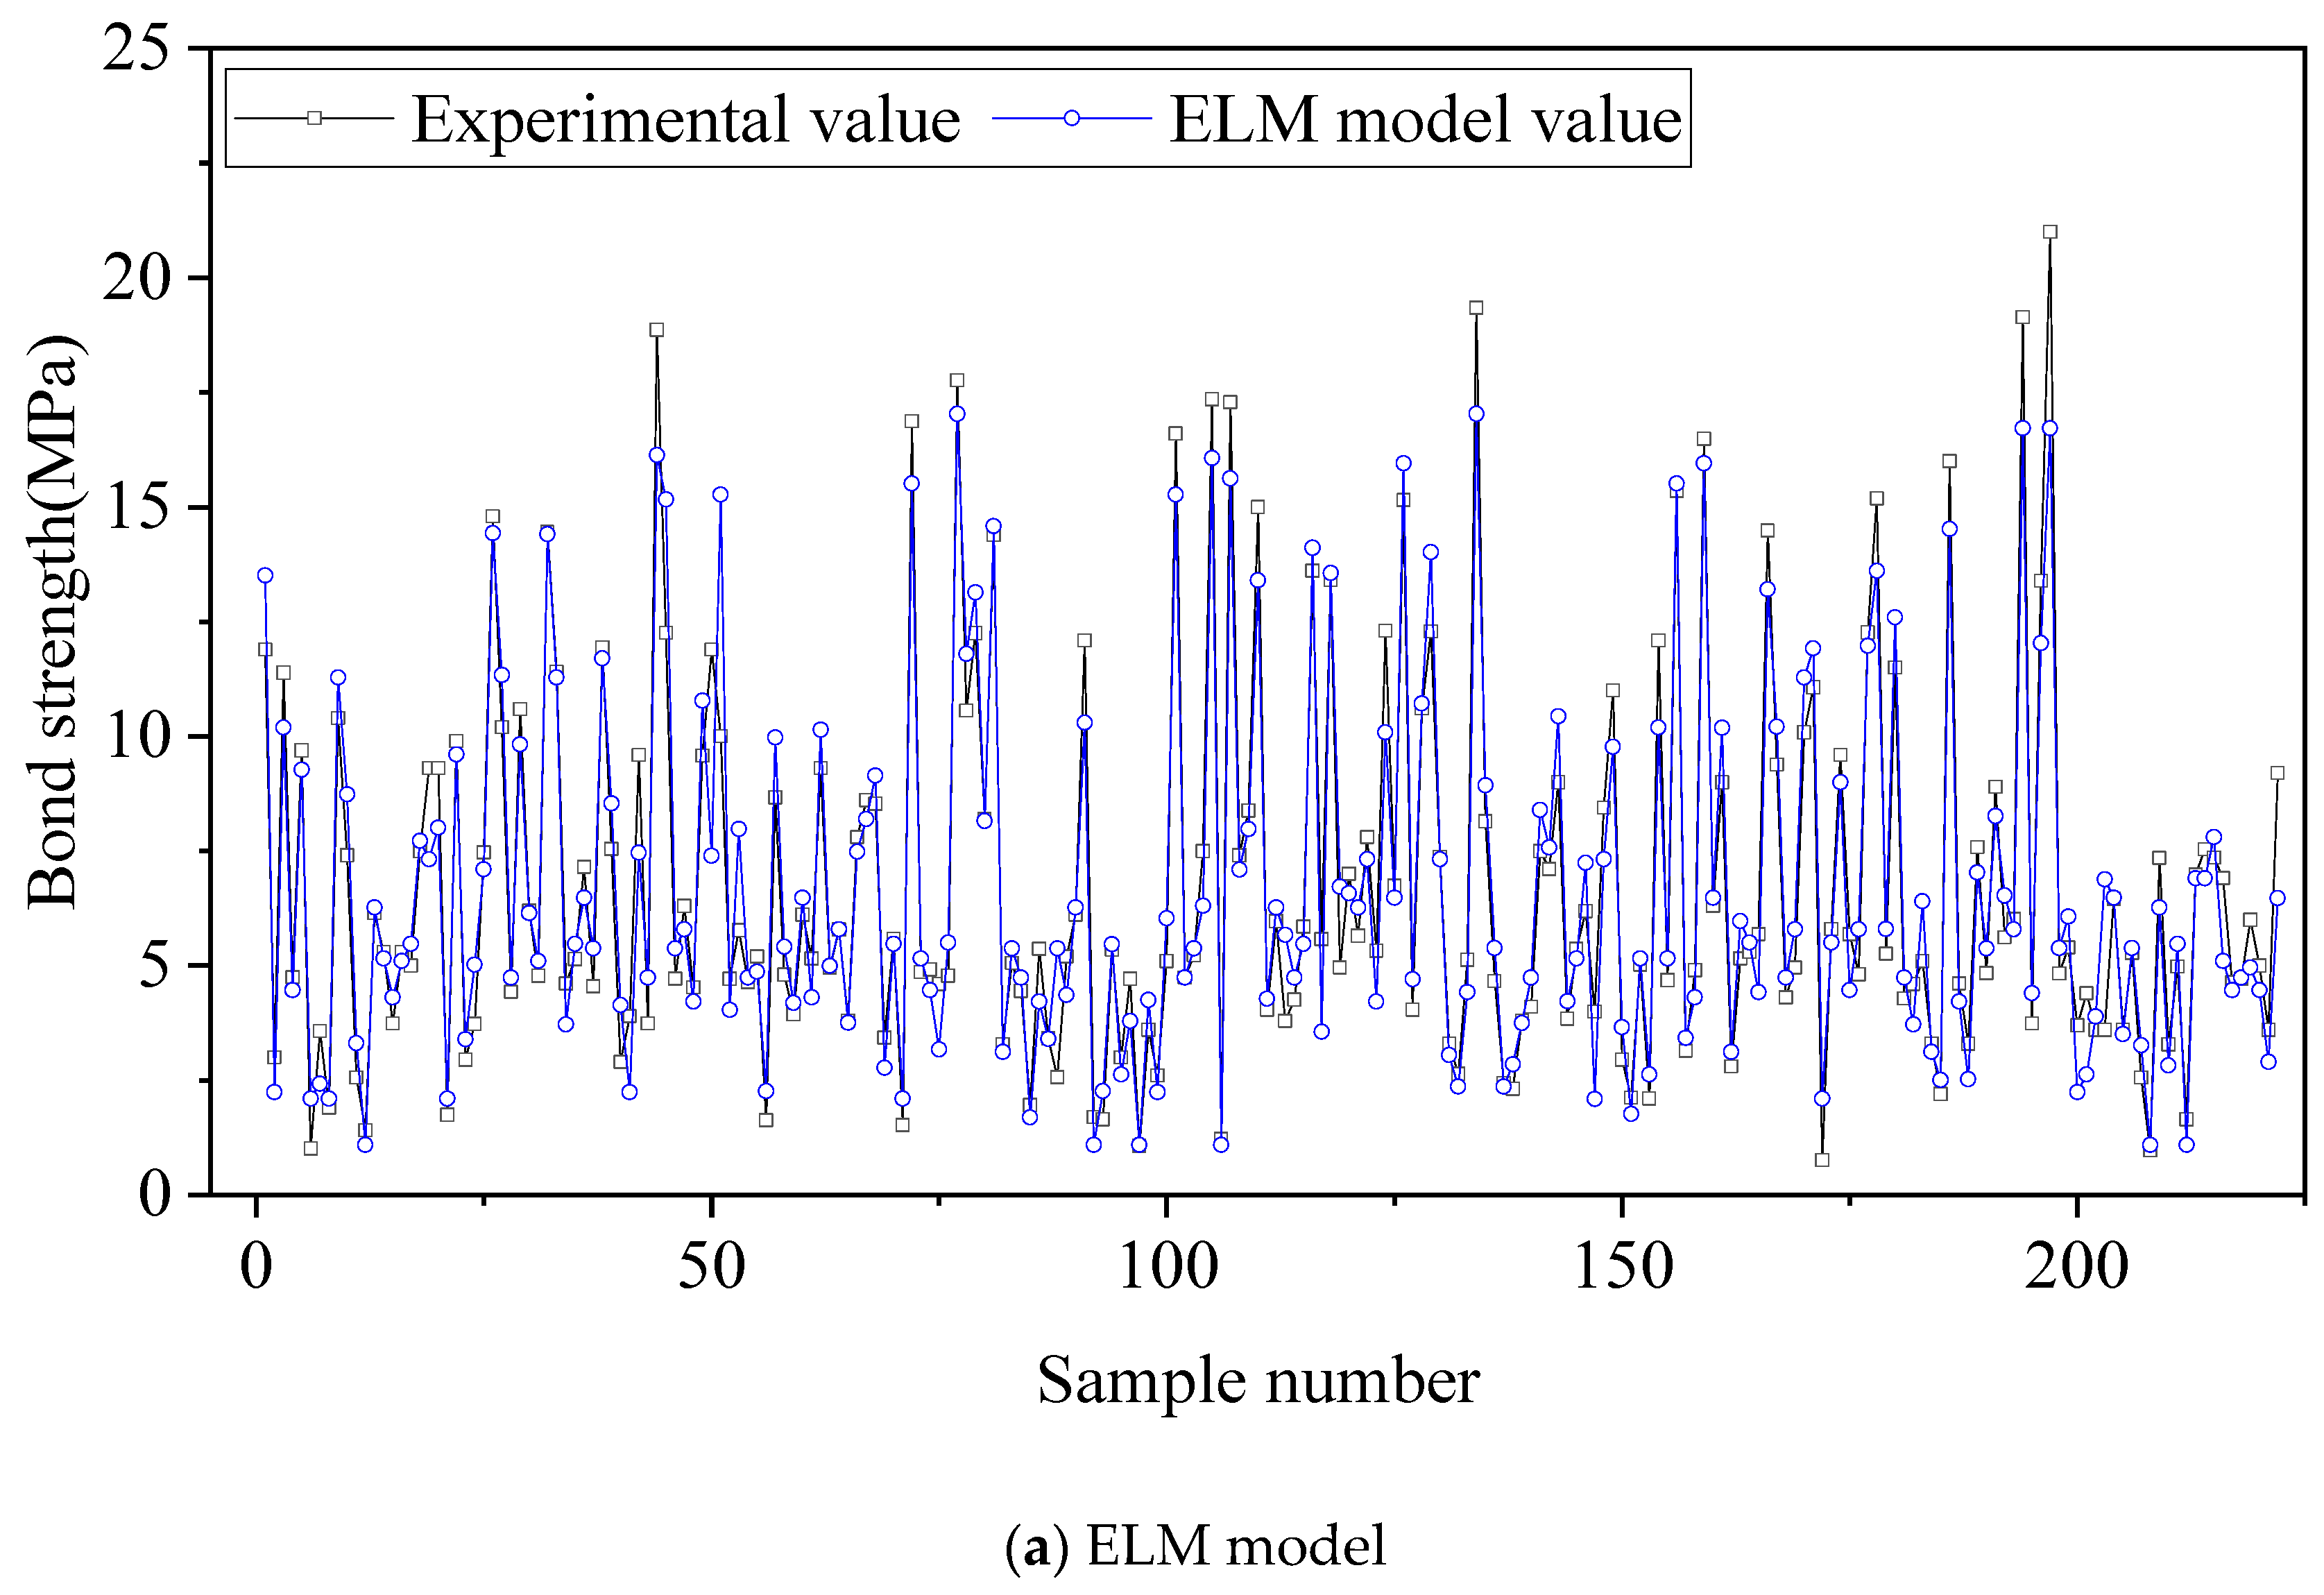
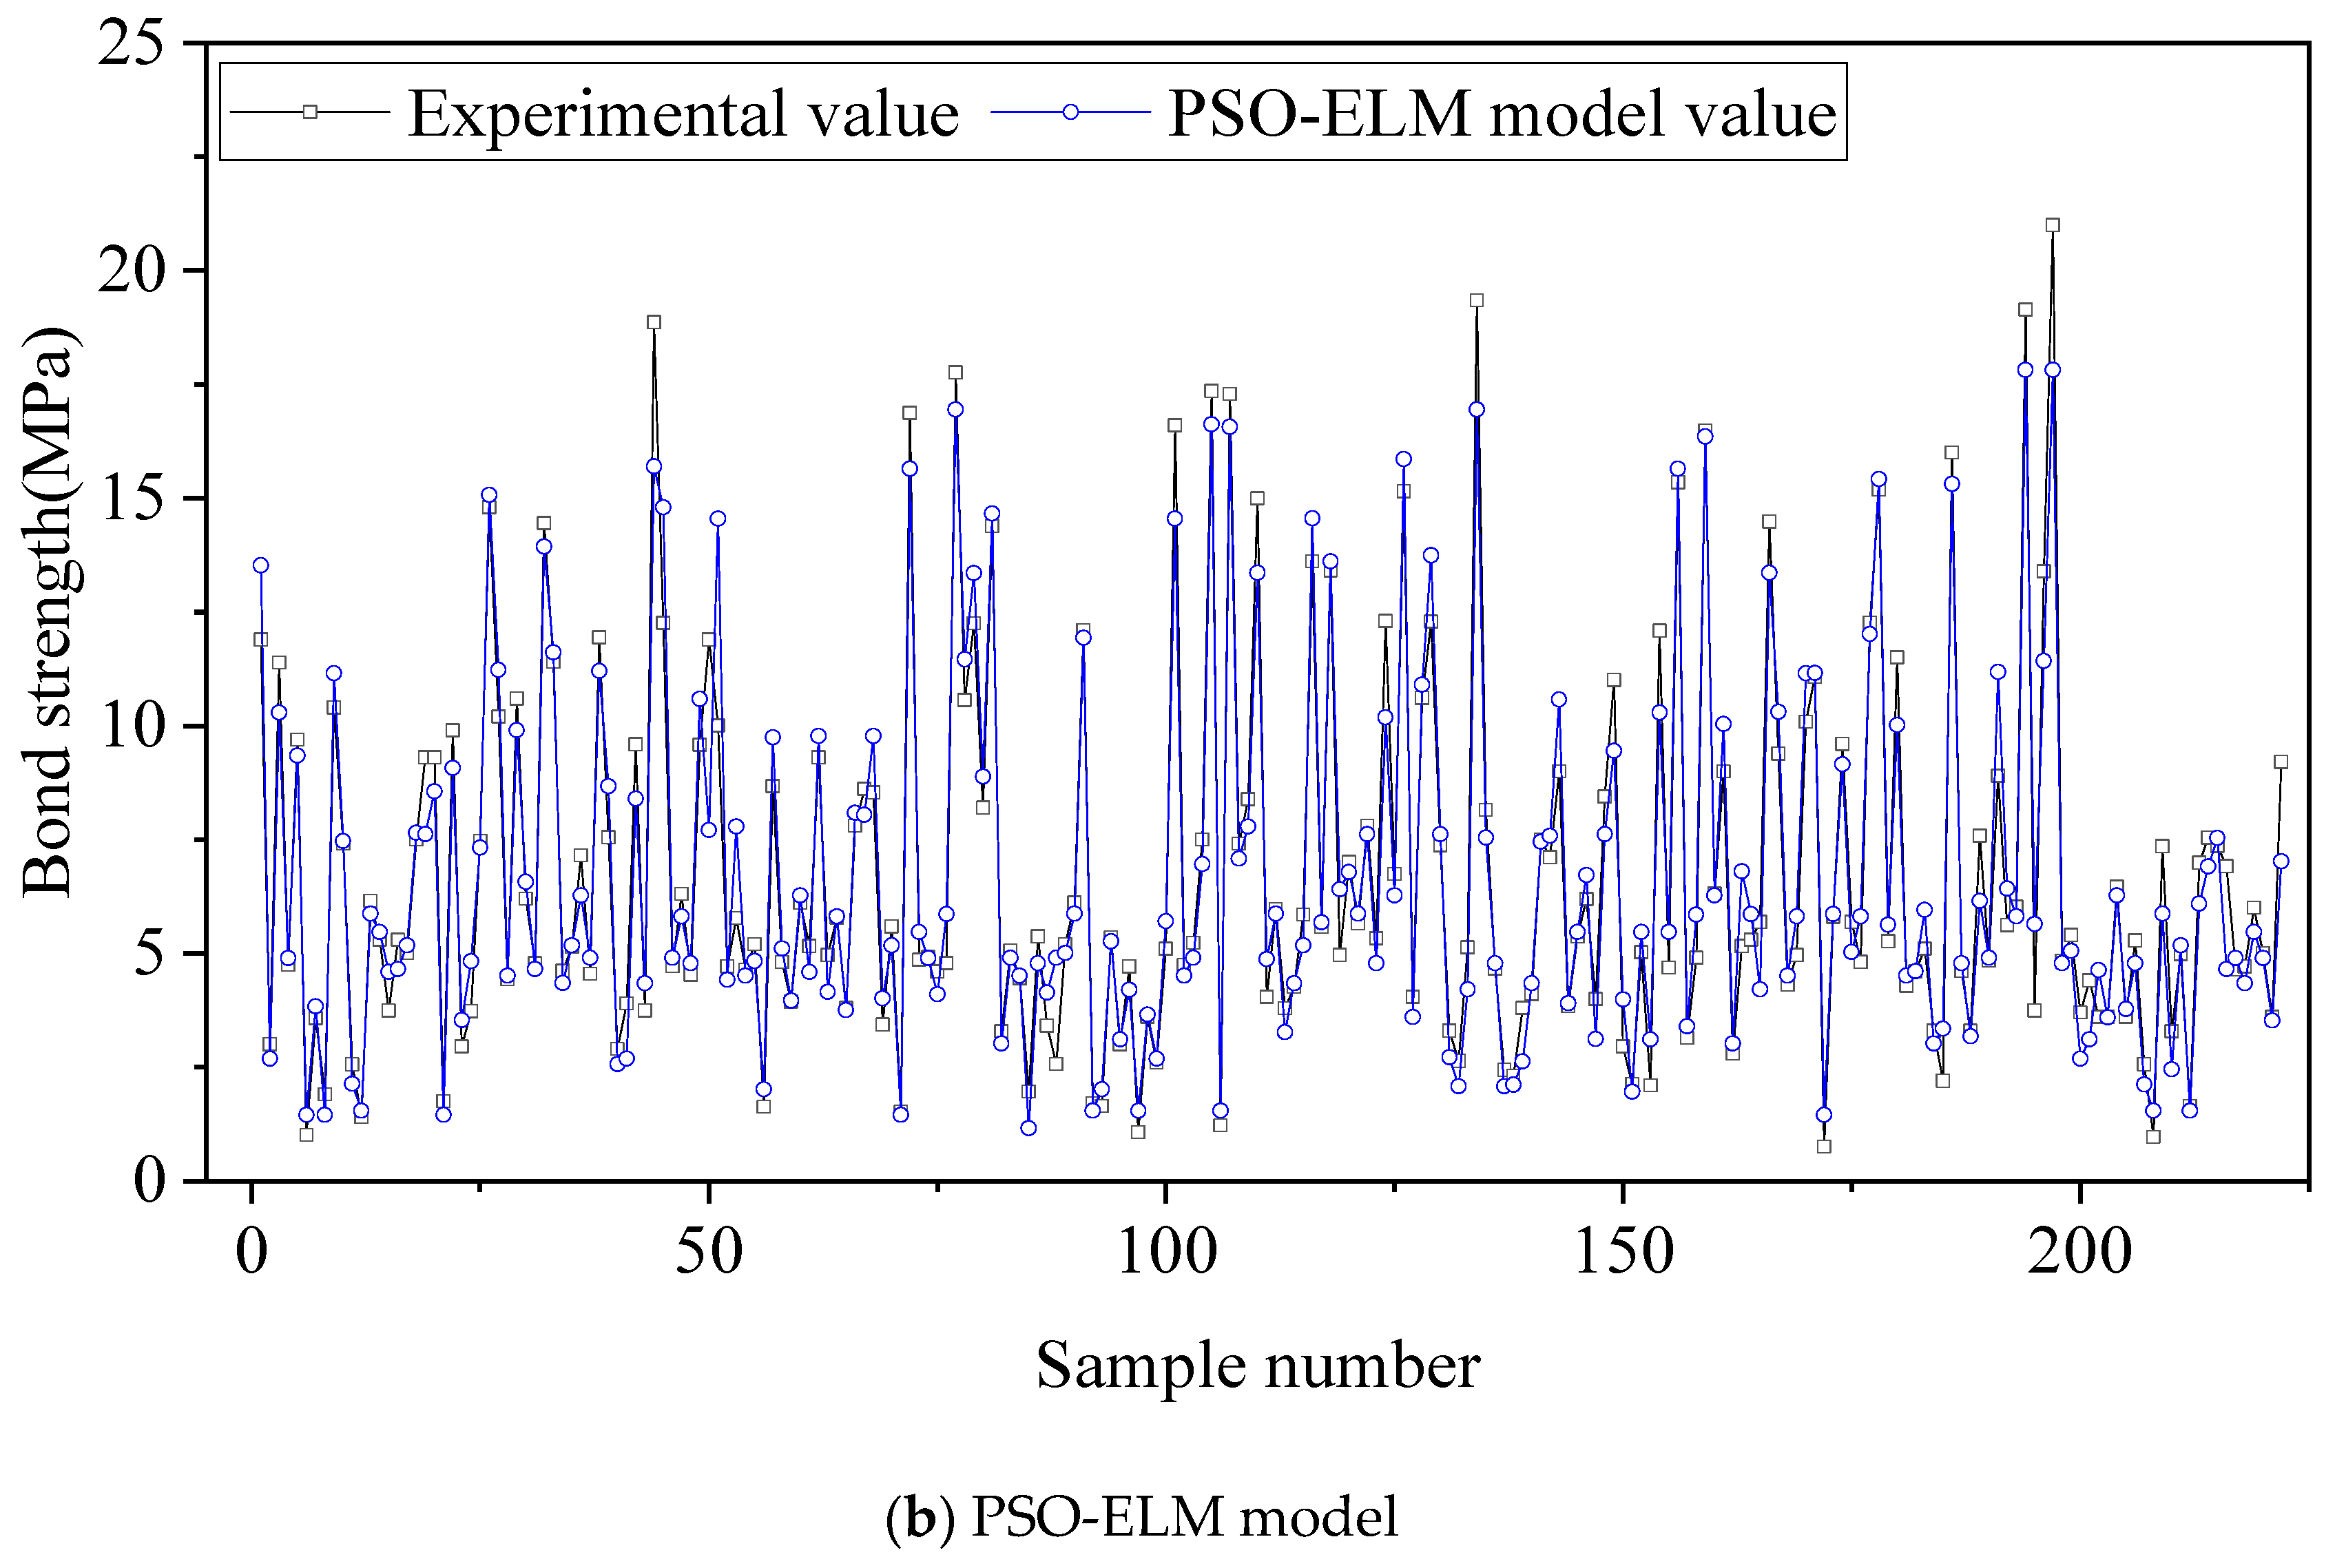
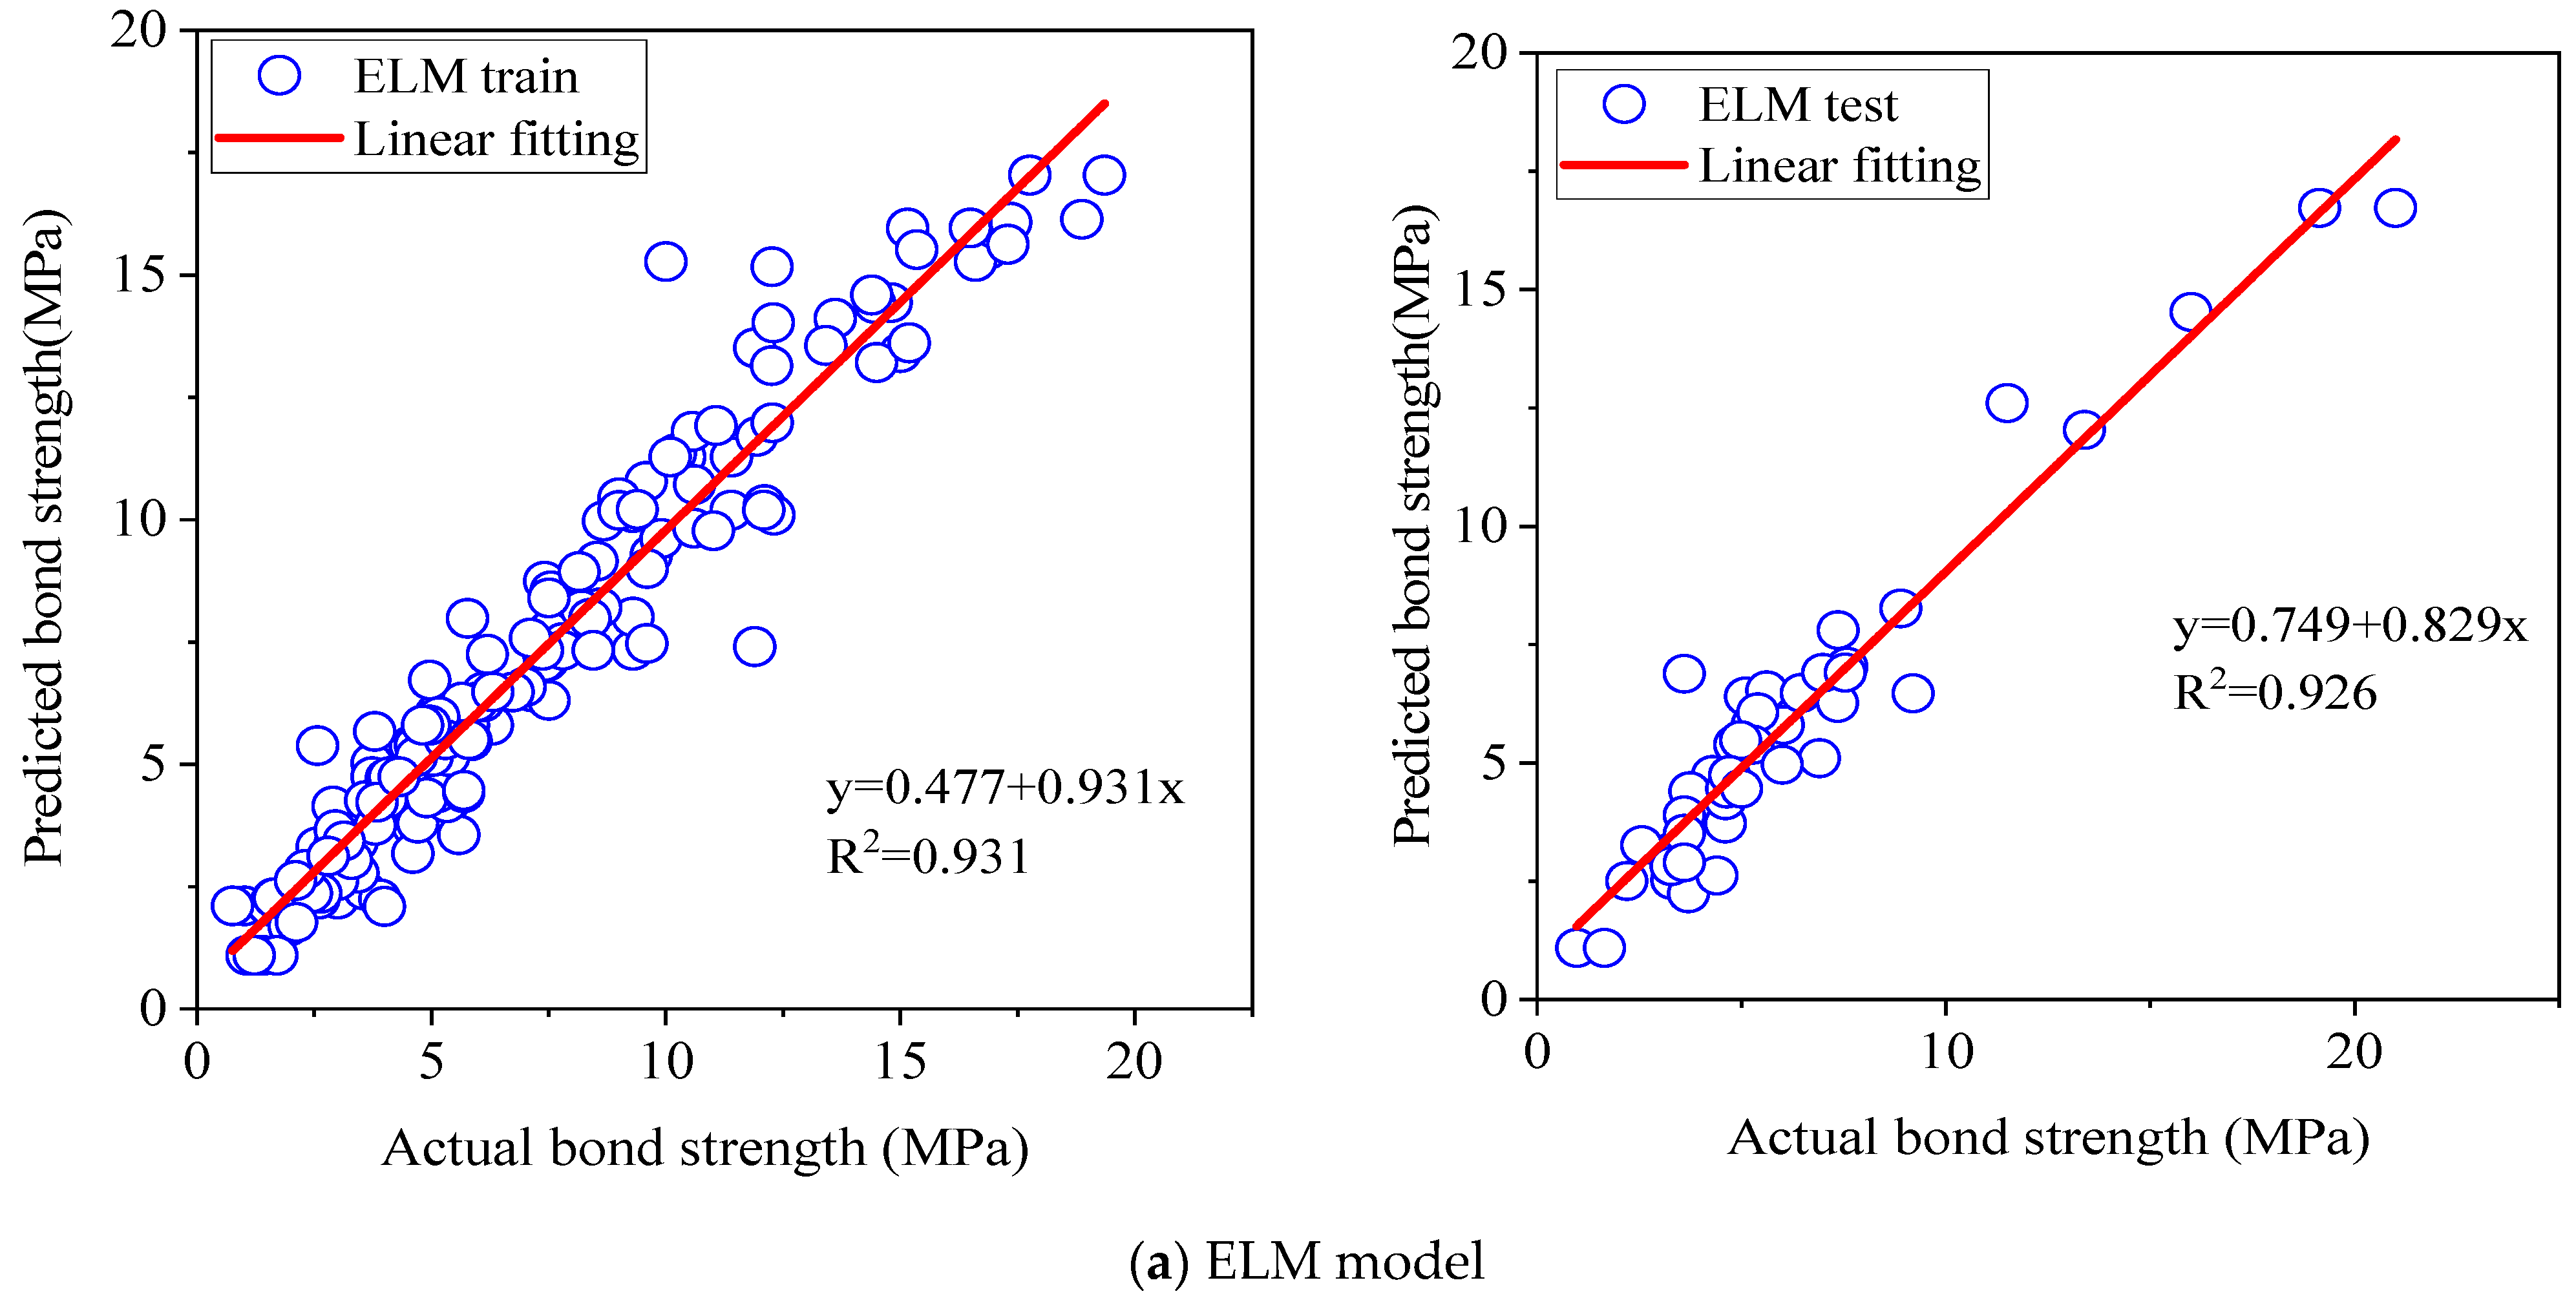
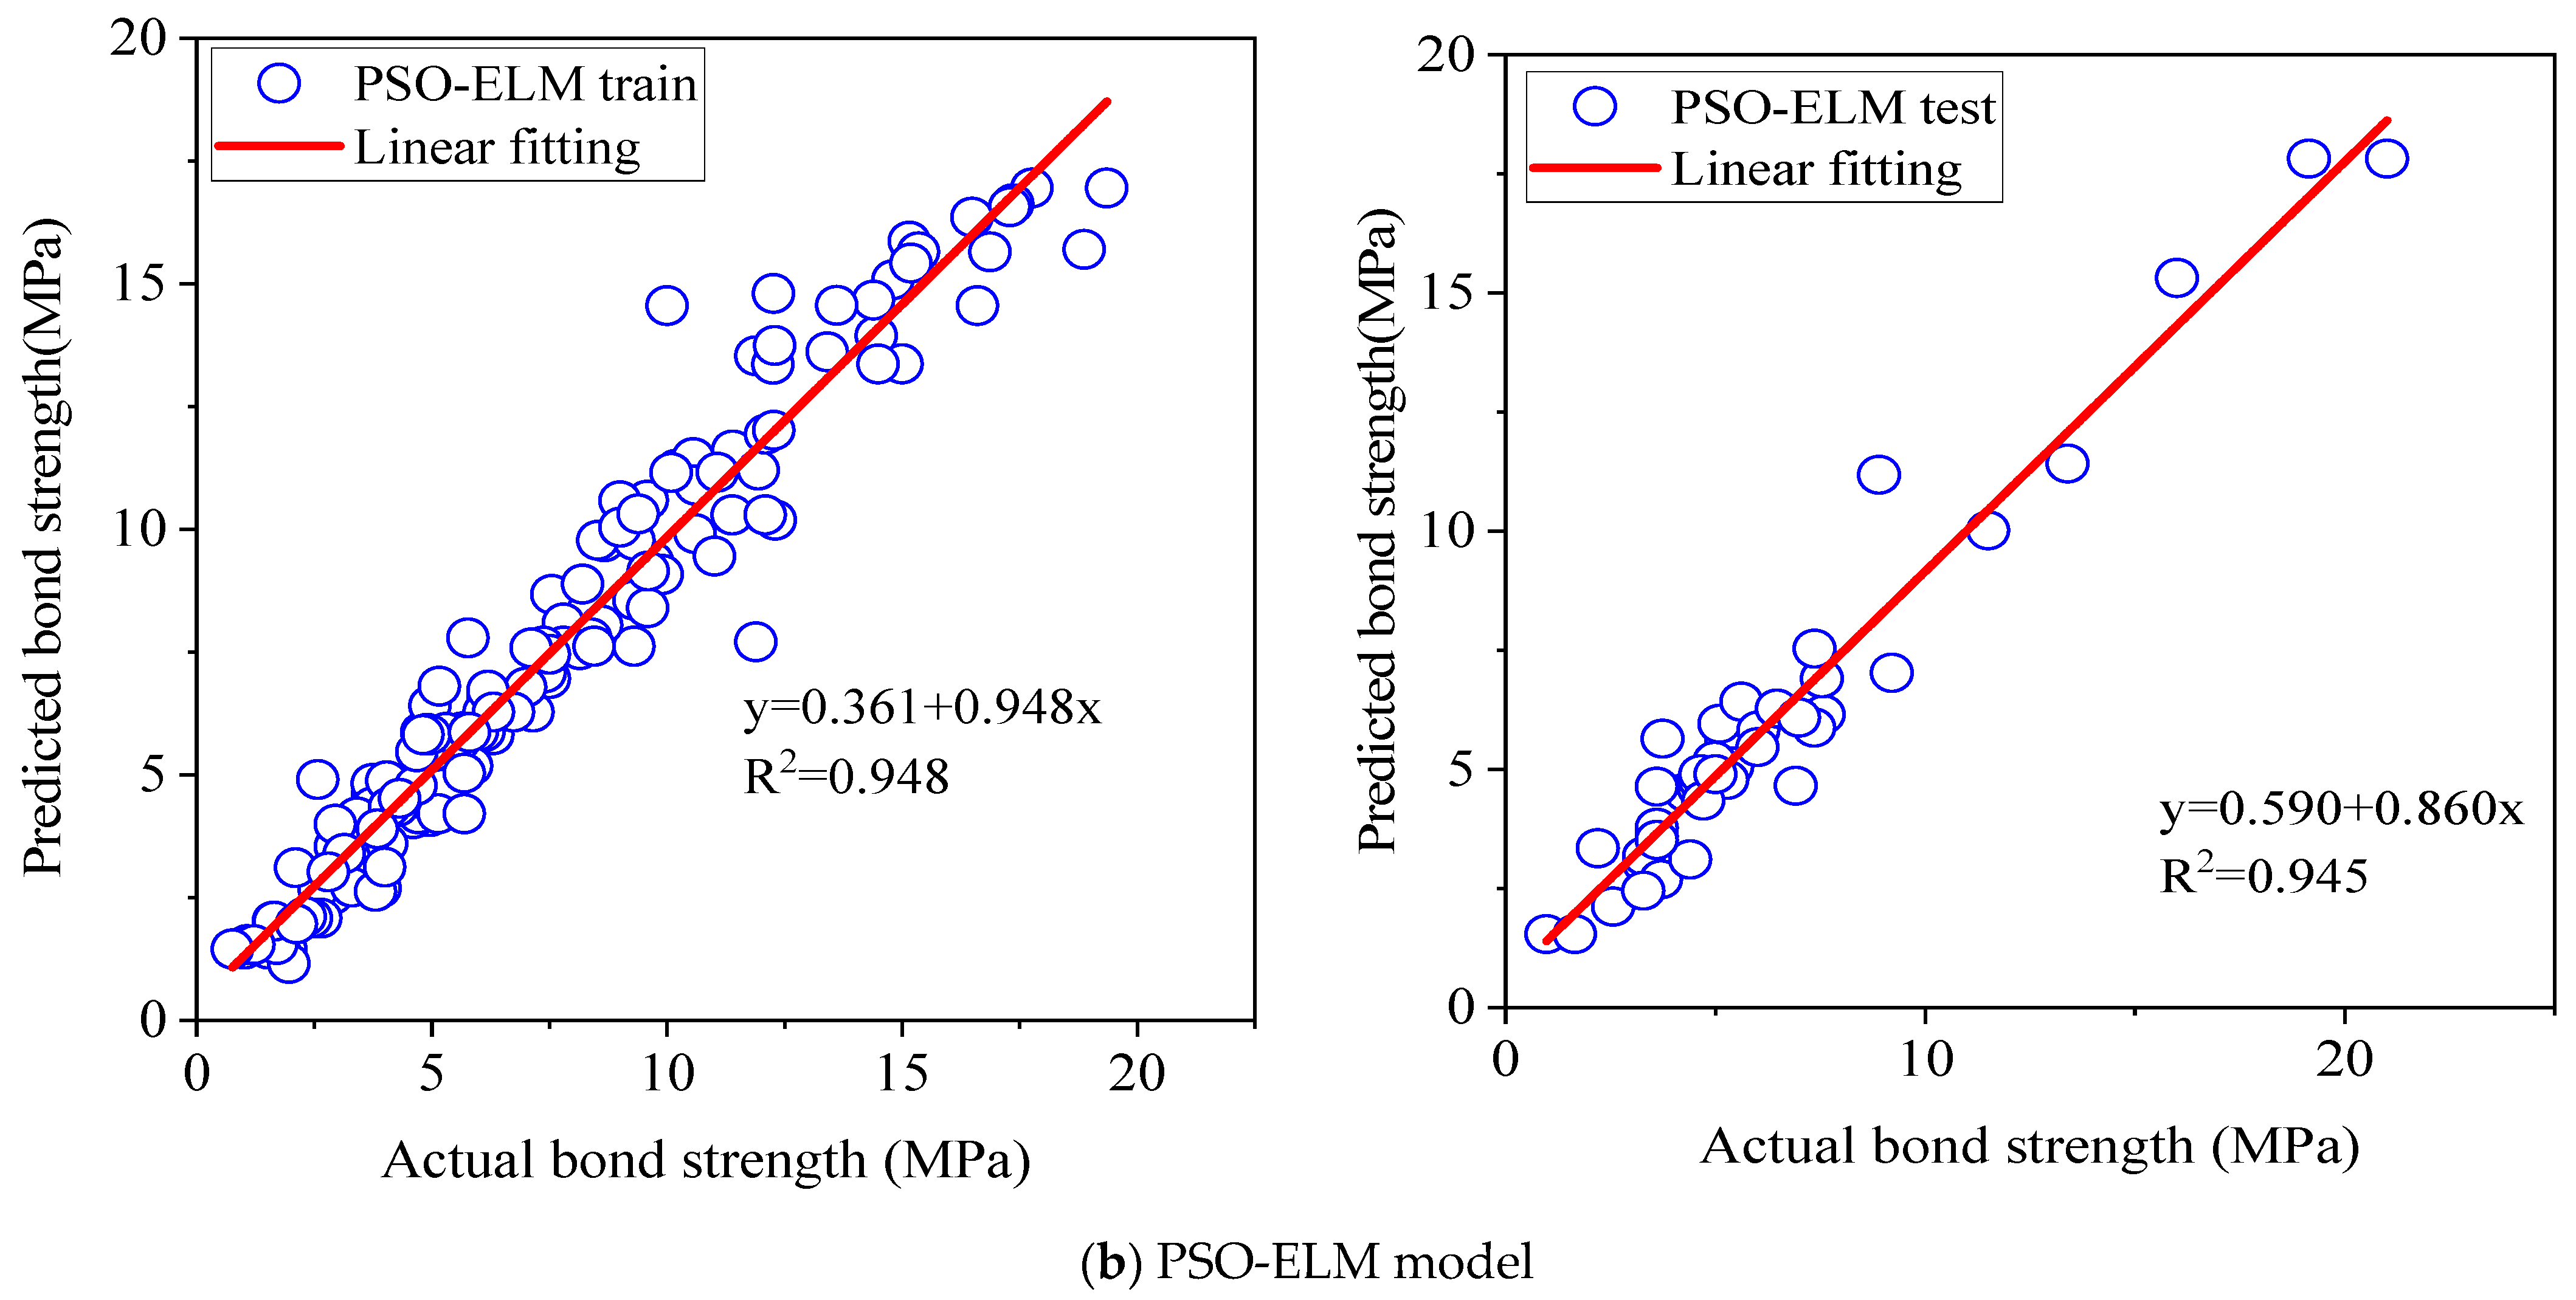
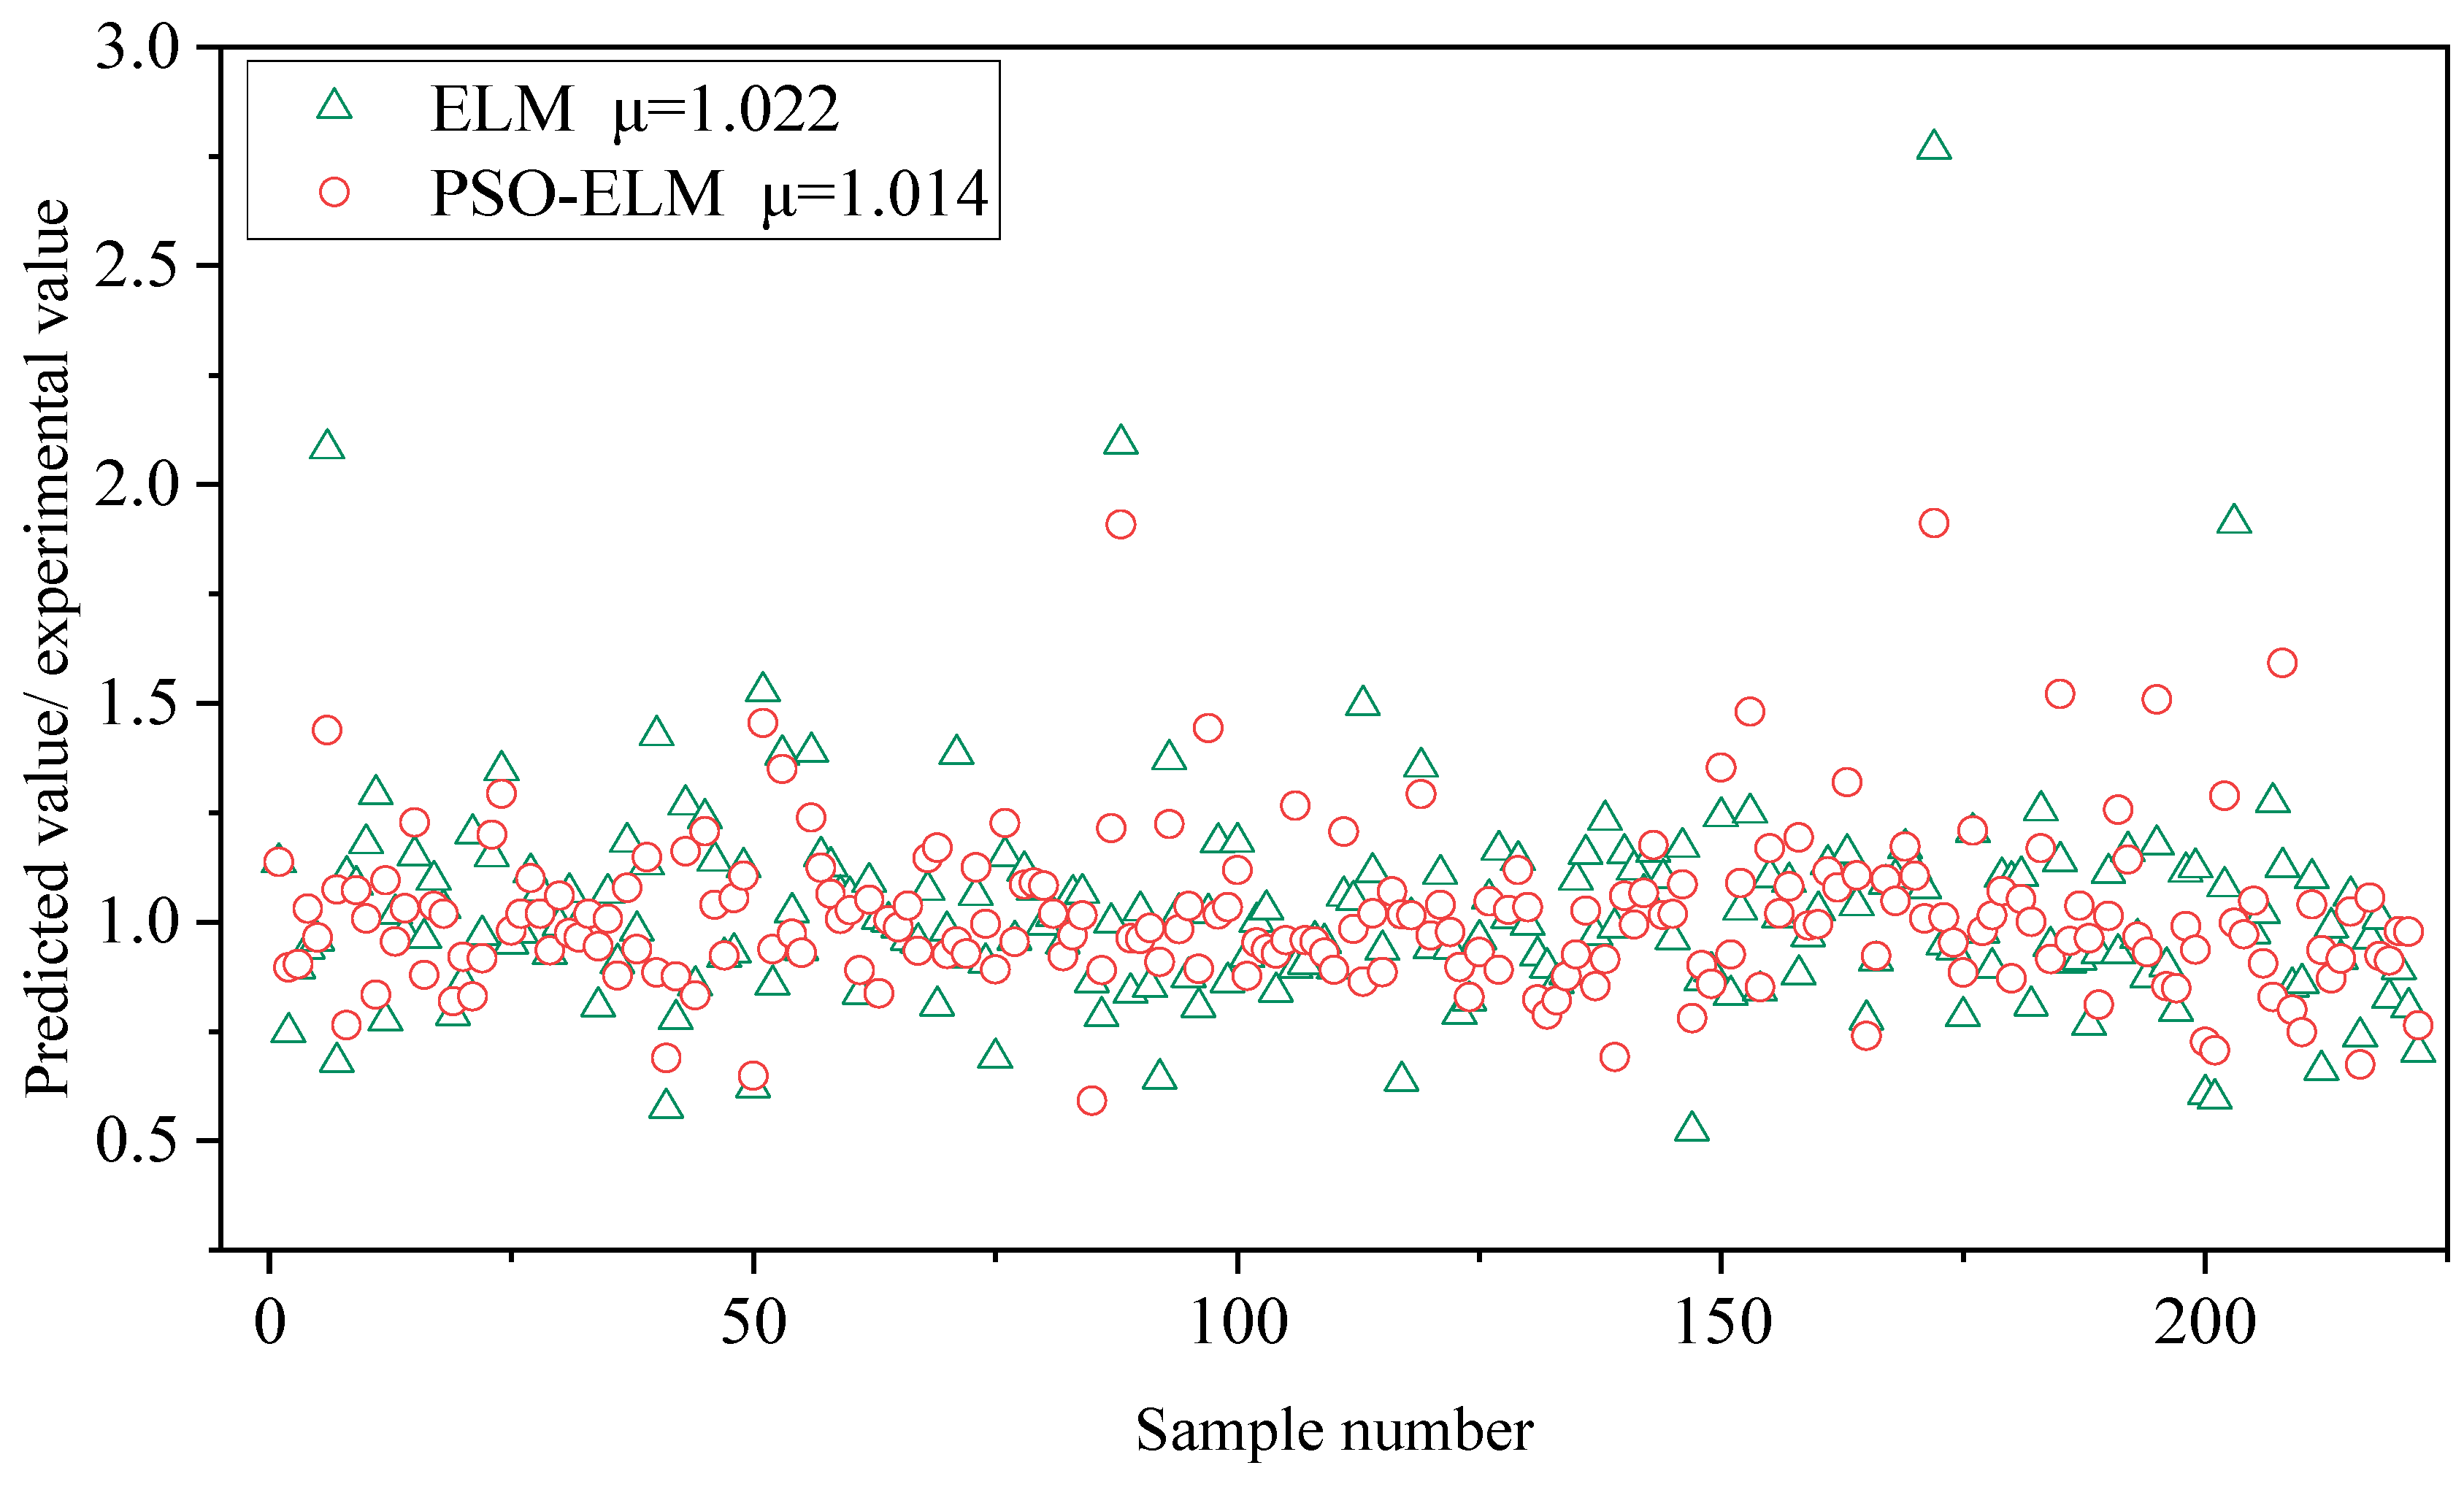
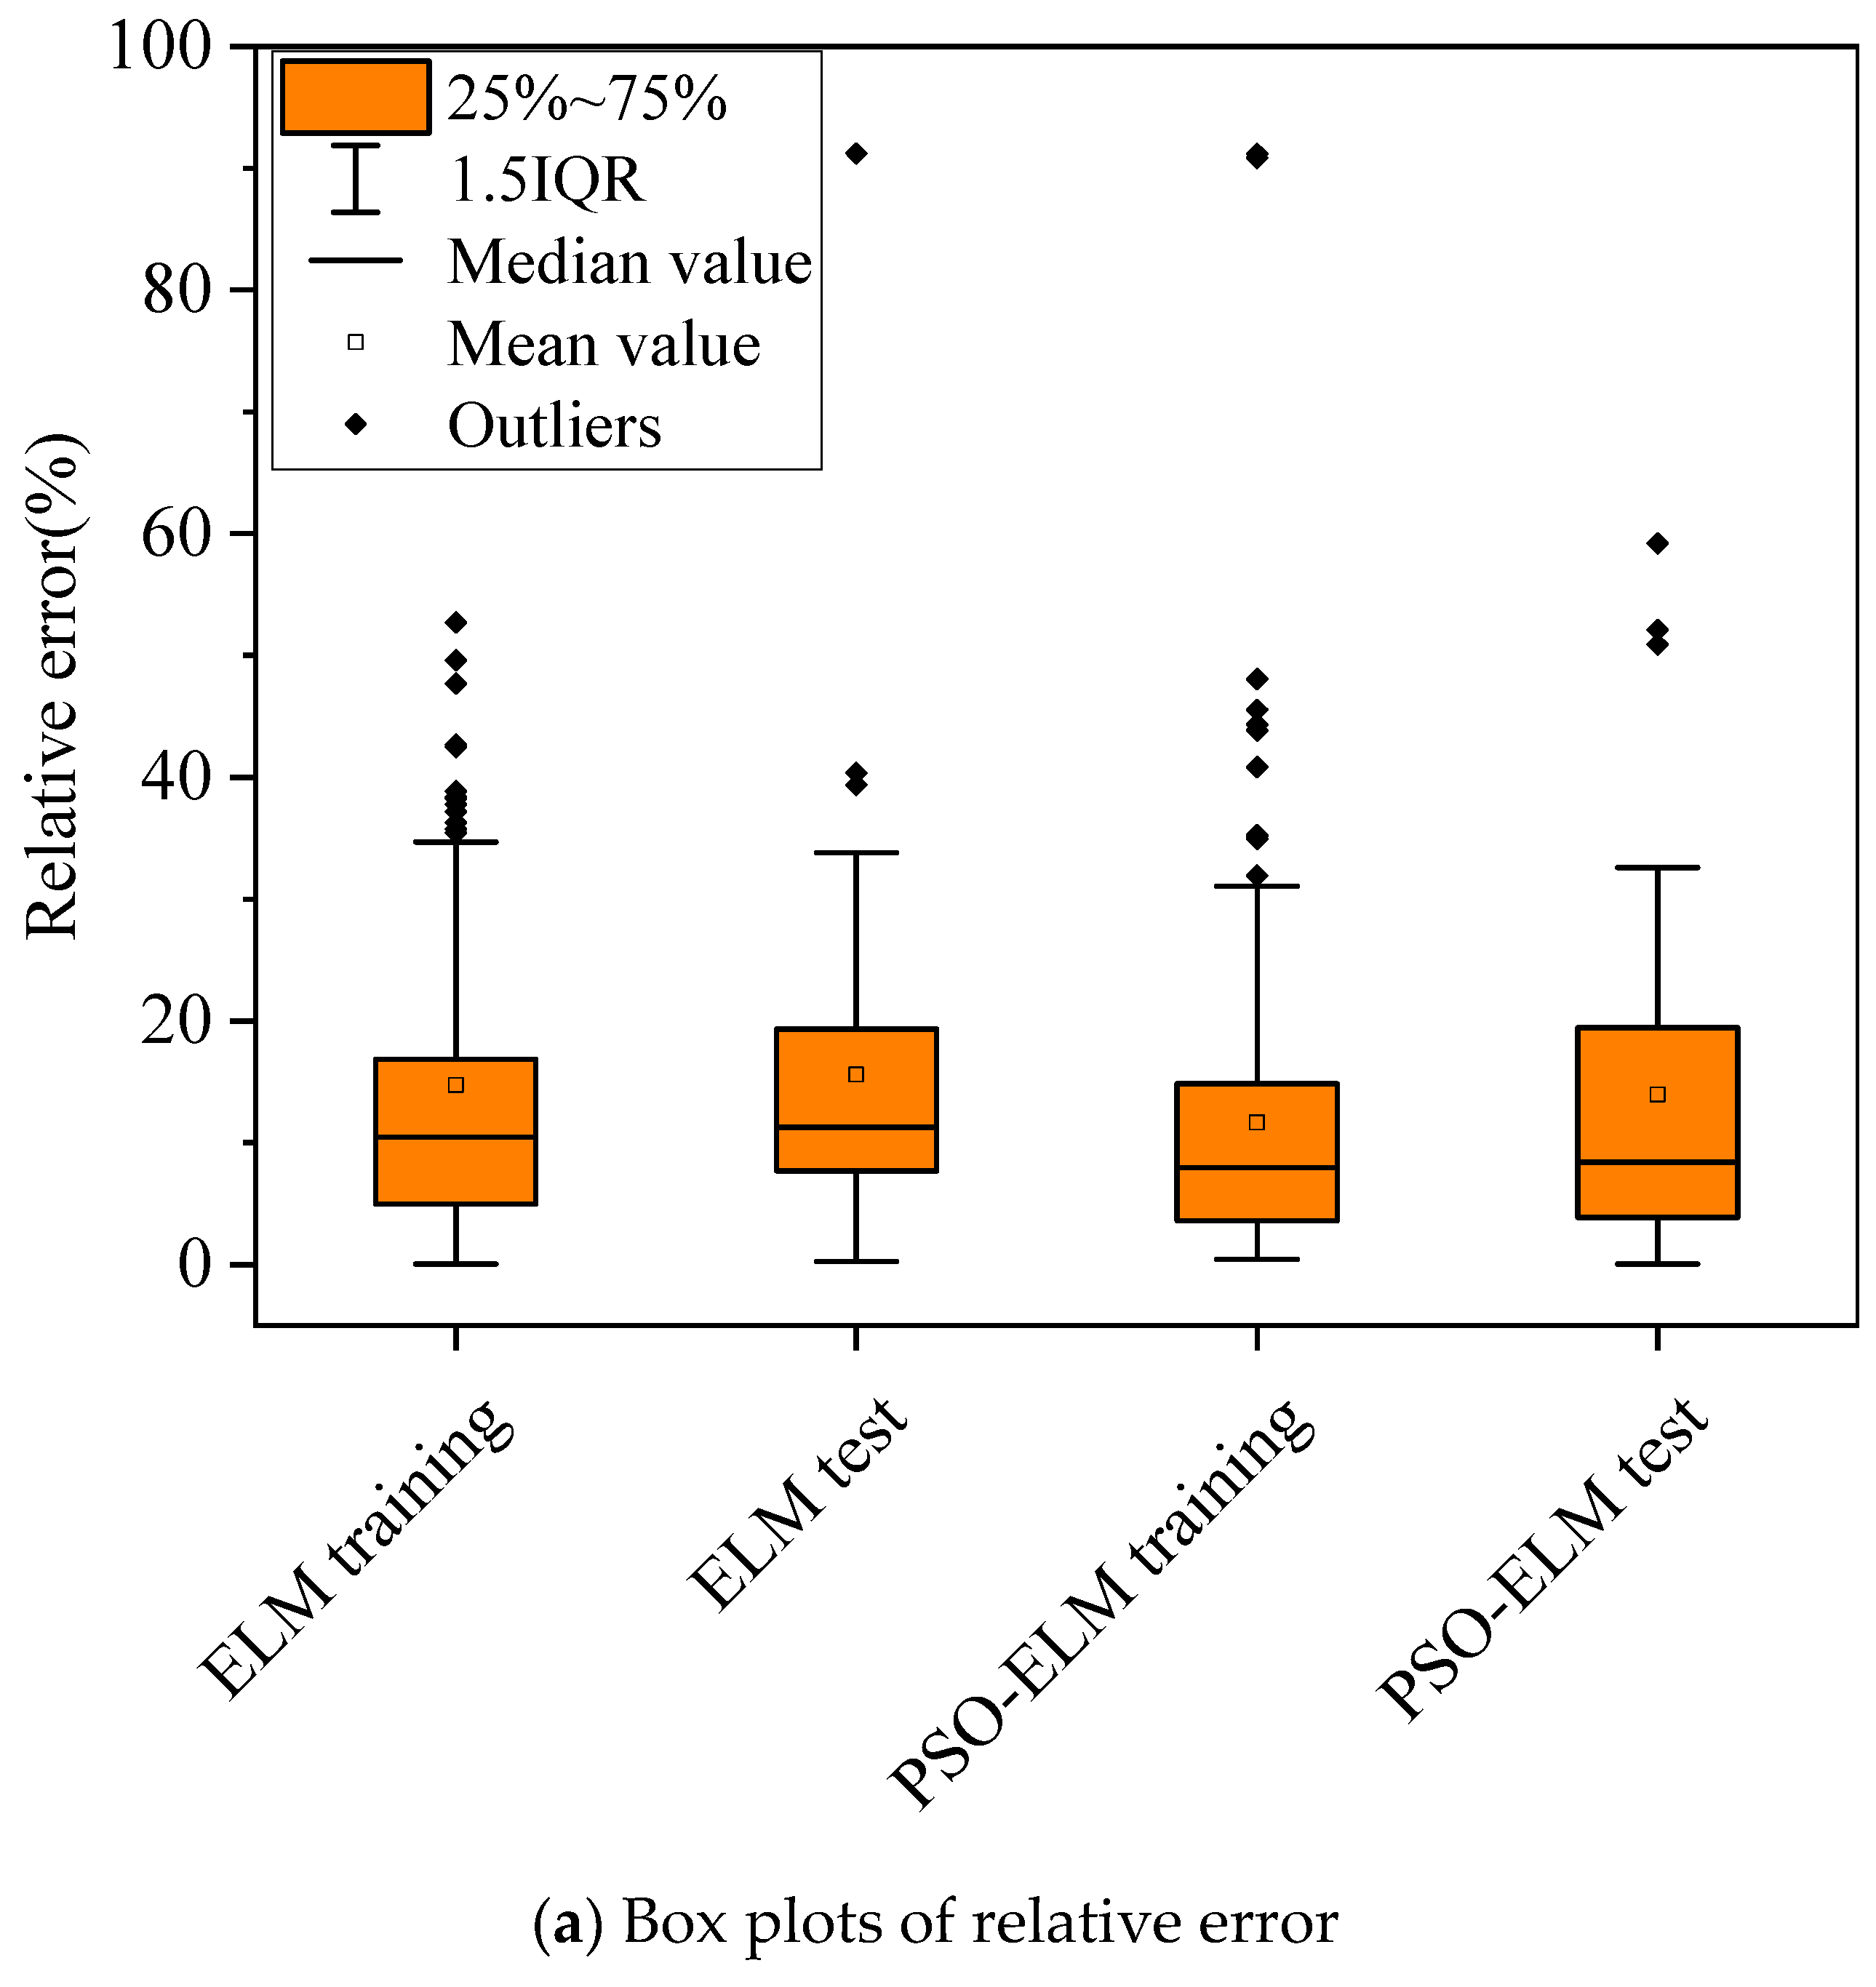
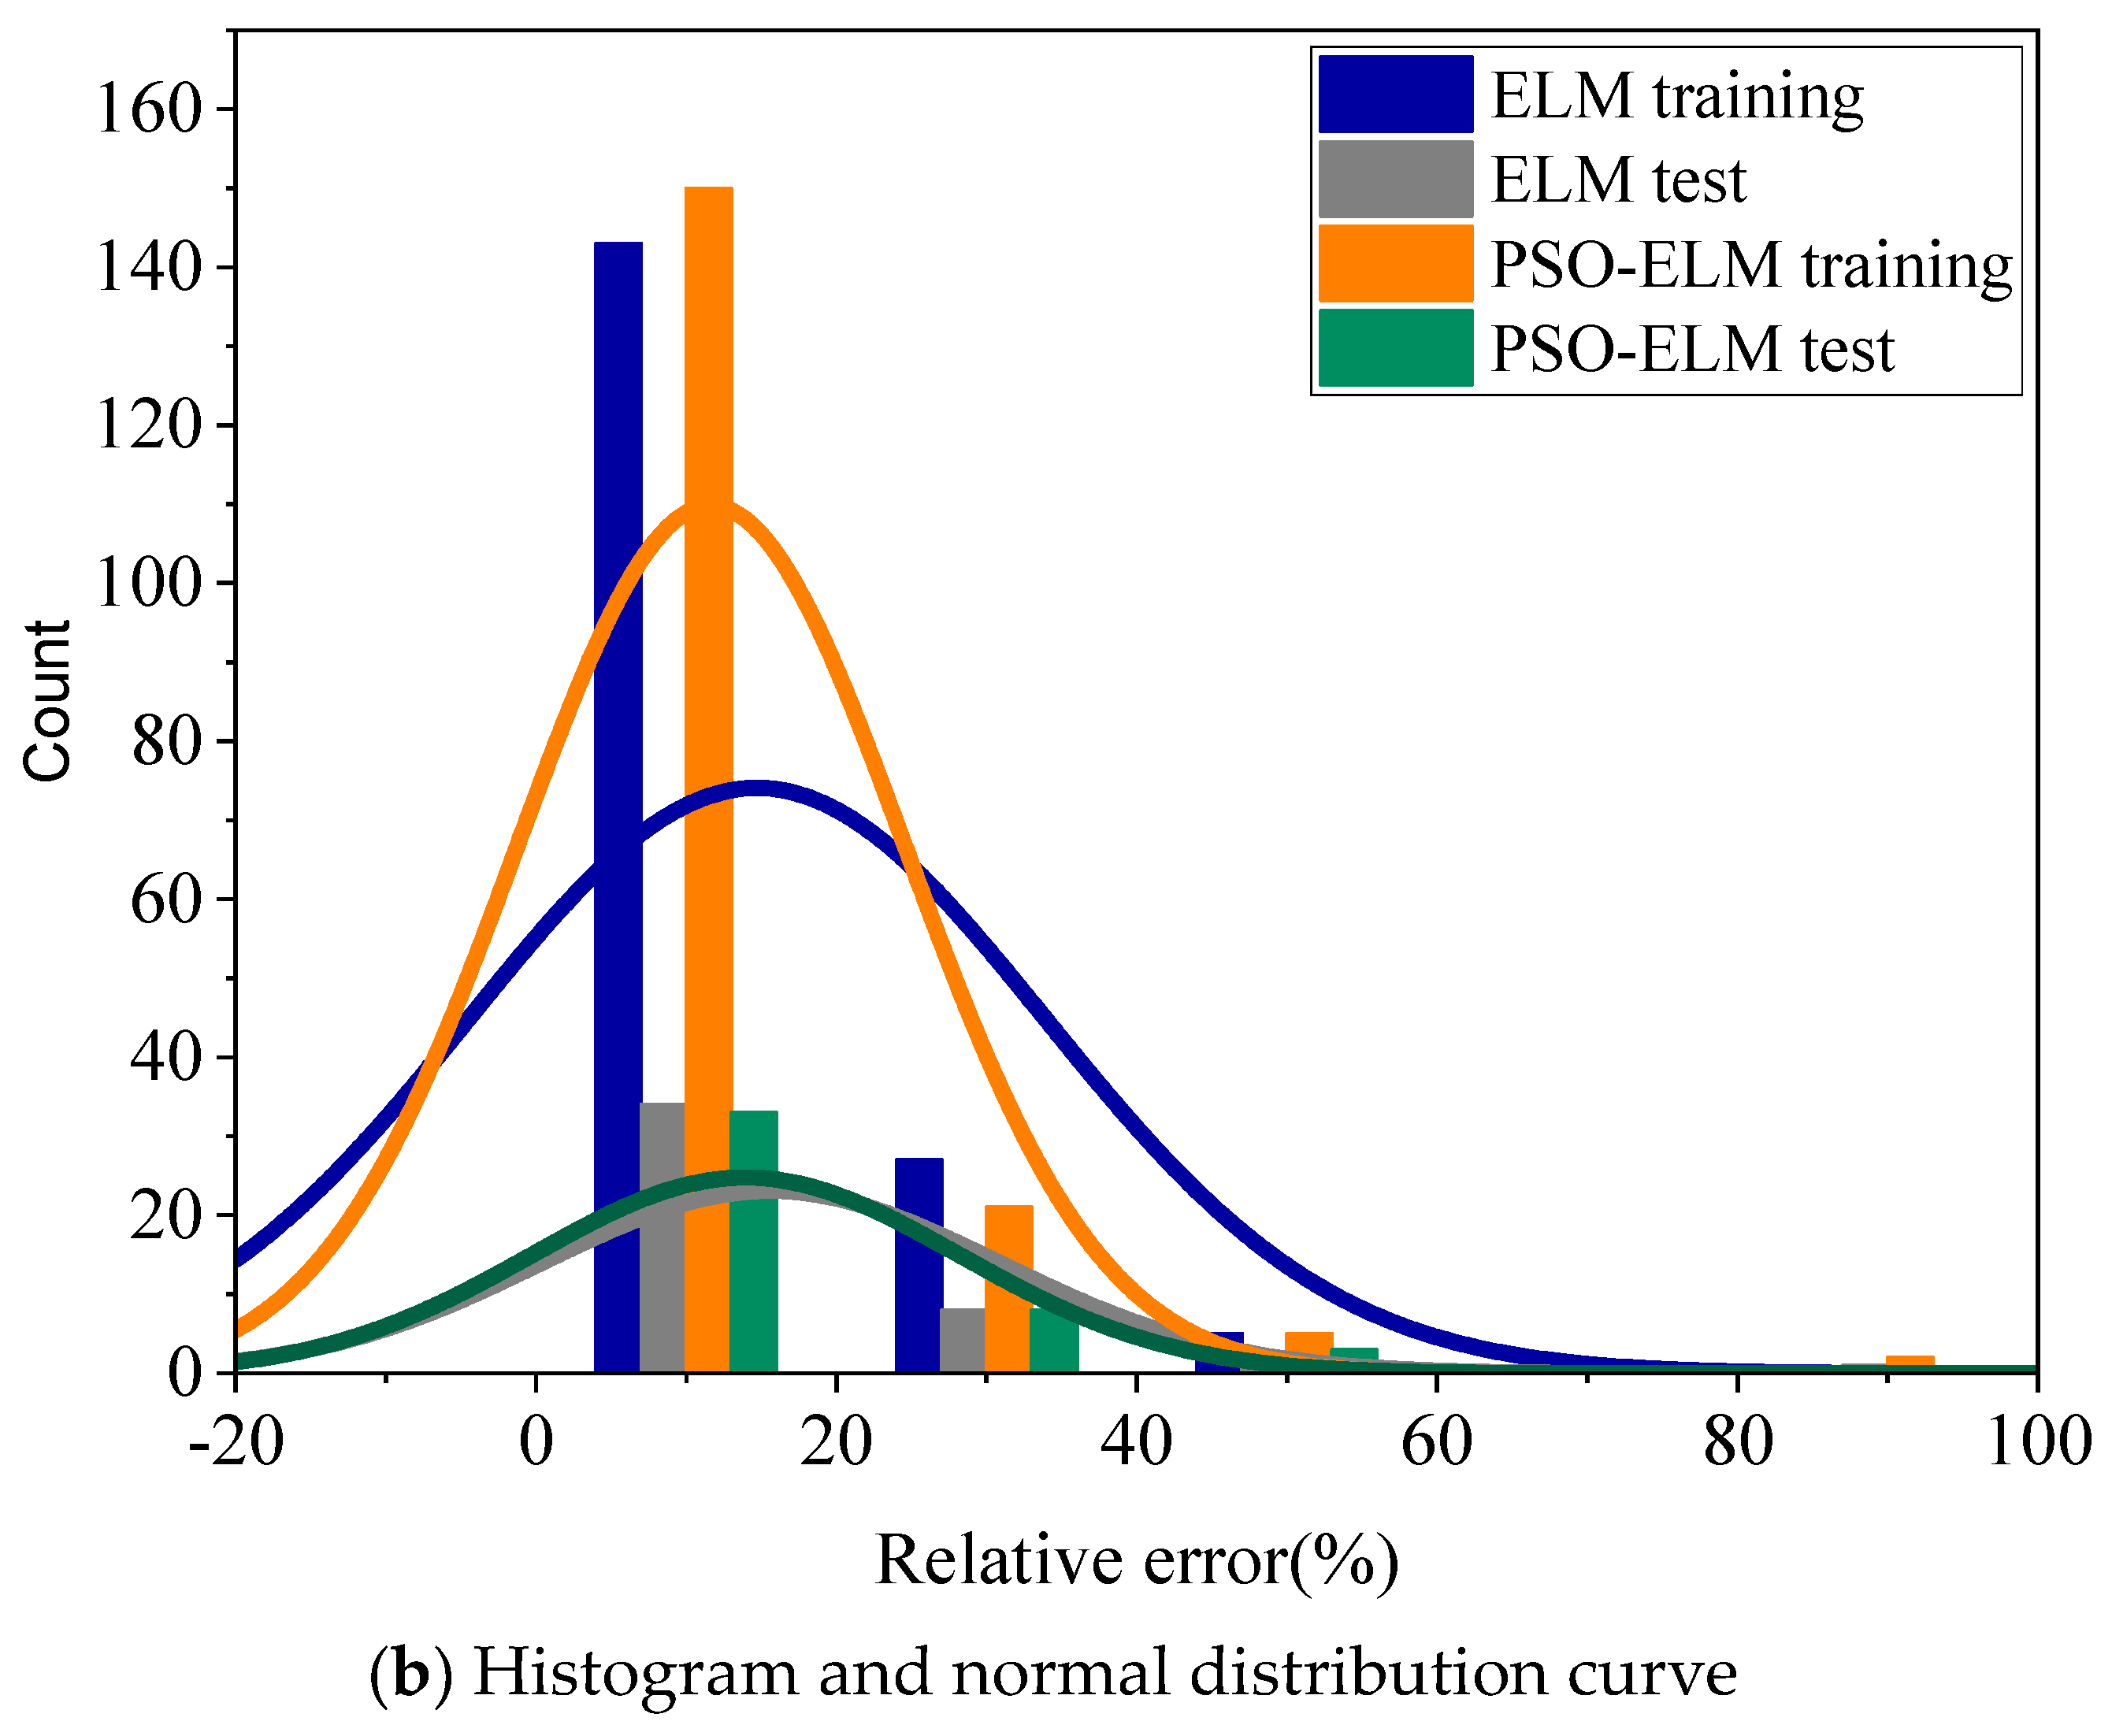
3.4. Comparison of Model Results
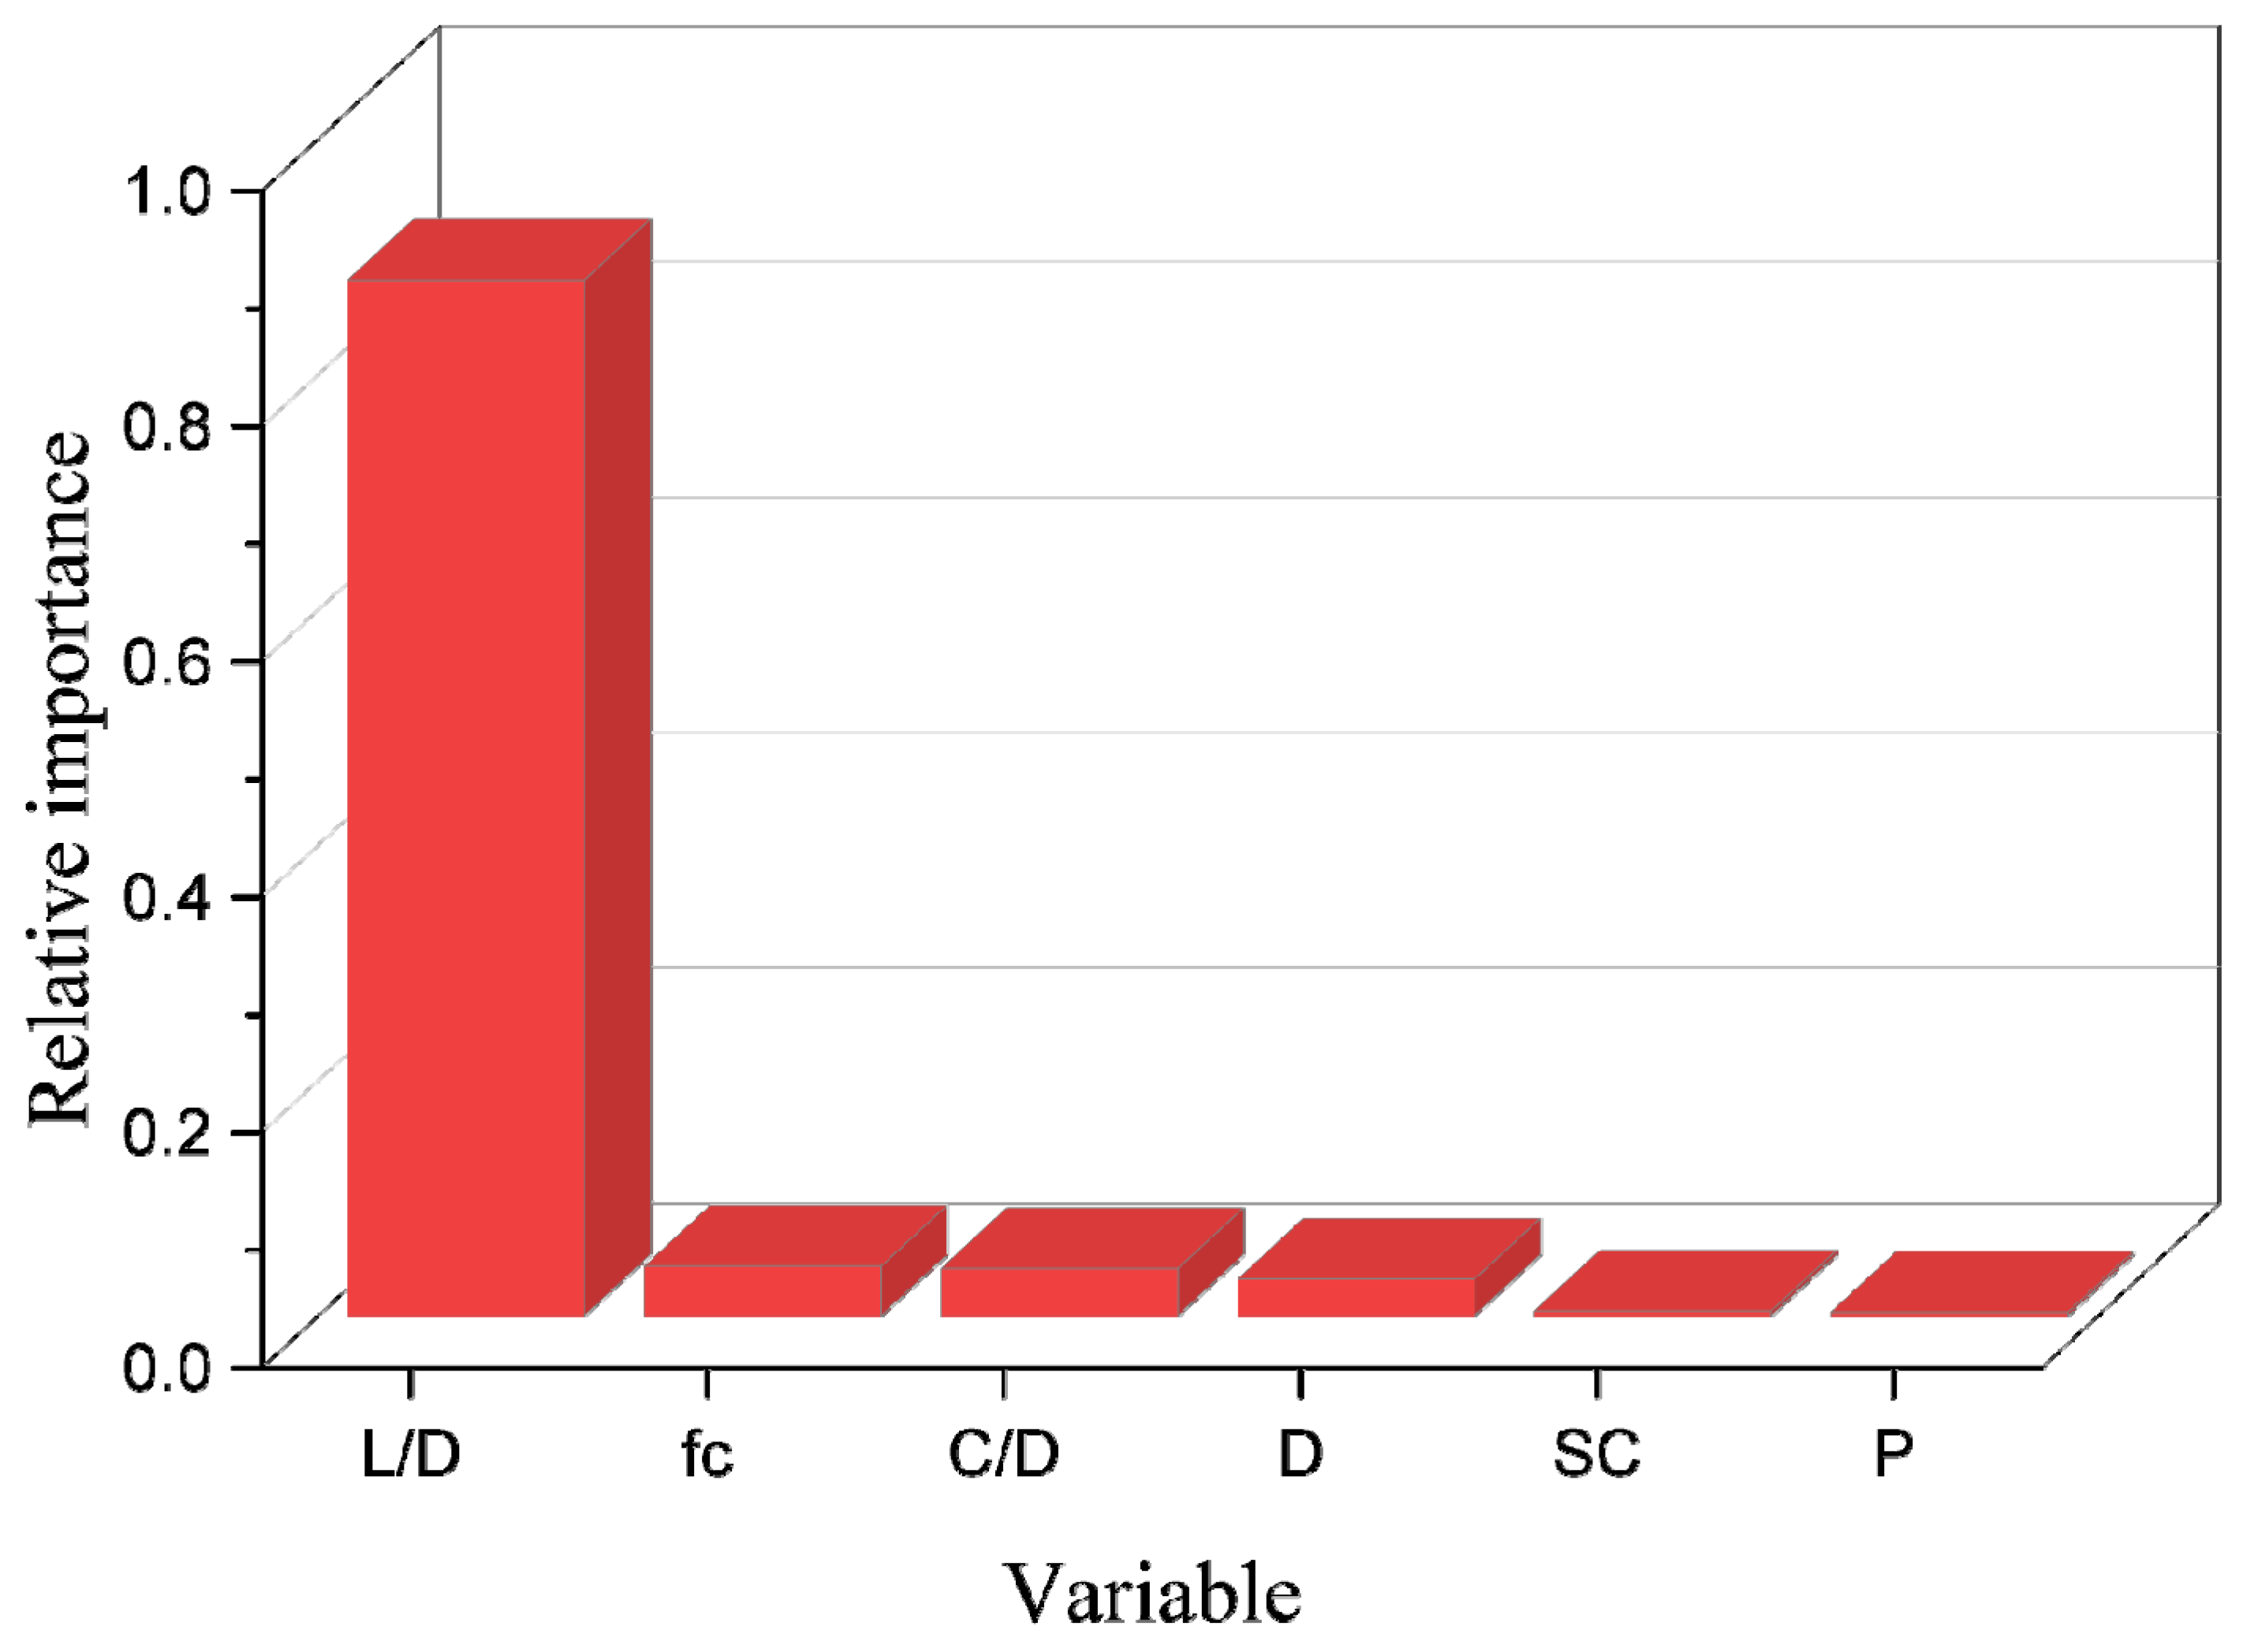
4. Sensitivity Analysis of Input Variables
5. Conclusions
- (1)
- With a stronger correlation coefficient and reduced prediction error, the proposed optimization model PSO-ELM can accurately capture the nonlinear relationship between the numerous input factors and the output bond strength.
- (2)
- Regarding the criteria for model evaluation, the PSO-ELM achieved a better prediction performance with a smaller MSE, RMSE, and MAE of 1.170, 1.082, and 0.777 compared to the MSE, RMSE, and MAE of 1.549, 1.244, and 0.883 for the pre-optimization ELM model. The mean value of the relative prediction error was reduced from 15.590% in the original ELM model to 13.953% in the PSO-ELM model.
- (3)
- Among the six input parameters mentioned in this paper, the parameter bar-embedment length to the bar-diameter ratio (L/D) was the dominant influencing factor, with a relative importance of 88% to the output results; this variable was negative for the bond strength of the FRP bar.
Author Contributions
Funding
Data Availability Statement
Conflicts of Interest
References
- James, A.; Bazarchi, E.; Chiniforush, A.A.; Panjebashi Aghdam, P.; Hosseini, M.R.; Akbarnezhad, A.; Martek, I.; Ghodoosi, F. Rebar corrosion detection, protection, and rehabilitation of reinforced concrete structures in coastal environments: A review. Constr. Build. Mater. 2019, 224, 1026–1039. [Google Scholar] [CrossRef]
- Zhang, J.; Zhang, M.; Dong, B.; Ma, H. Quantitative evaluation of steel corrosion induced deterioration in rubber concrete by integrating ultrasonic testing, machine learning and mesoscale simulation. Cem. Concr. Compos. 2022, 128, 104426. [Google Scholar] [CrossRef]
- Moghaddas, A.; Mostofinejad, D. Empirical FRP-Concrete Bond Strength Model for Externally Bonded Reinforcement on Grooves. J. Compos. Constr. 2019, 23, 04018080. [Google Scholar] [CrossRef]
- Chen, S.-Z.; Zhang, S.-Y.; Han, W.-S.; Wu, G. Ensemble learning based approach for FRP-concrete bond strength prediction. Constr. Build. Mater. 2021, 302, 124230. [Google Scholar] [CrossRef]
- Li, C.; Xian, G. Novel wedge-shaped bond anchorage system for pultruded CFRP plates. Mater. Struct. 2018, 51, 162. [Google Scholar] [CrossRef]
- Toumpanaki, E.; Lees Janet, M.; Terrasi Giovanni, P. Bond Durability of Carbon Fiber–Reinforced Polymer Tendons Embedded in High-Strength Concrete. J. Compos. Constr. 2018, 22, 04018032. [Google Scholar] [CrossRef] [Green Version]
- Özkal, F.M.; Polat, M.; Yağan, M.; Öztürk, M.O. Mechanical properties and bond strength degradation of GFRP and steel rebars at elevated temperatures. Constr. Build. Mater. 2018, 184, 45–57. [Google Scholar] [CrossRef]
- Amin, M.N.; Iqbal, M.; Salami, B.A.; Jamal, A.; Khan, K.; Abu-Arab, A.M.; Al-Ahmad, Q.M.; Imran, M. Predicting Bond Strength between FRP Rebars and Concrete by Deploying Gene Expression Programming Model. Polymers 2022, 14, 2145. [Google Scholar] [CrossRef]
- Yan, F.; Lin, Z.; Zhang, D.; Gao, Z.; Li, M. Experimental study on bond durability of glass fiber reinforced polymer bars in concrete exposed to harsh environmental agents: Freeze-thaw cycles and alkaline-saline solution. Compos. Part B Eng. 2017, 116, 406–421. [Google Scholar] [CrossRef]
- Yan, F.; Lin, Z. Bond durability assessment and long-term degradation prediction for GFRP bars to fiber-reinforced concrete under saline solutions. Compos. Struct. 2017, 161, 393–406. [Google Scholar] [CrossRef]
- Mazaheripour, H.; Barros, J.A.O.; Sena-Cruz, J.M.; Pepe, M.; Martinelli, E. Experimental study on bond performance of GFRP bars in self-compacting steel fiber reinforced concrete. Compos. Struct. 2013, 95, 202–212. [Google Scholar] [CrossRef] [Green Version]
- Alves, J.; El-Ragaby, A.; El-Salakawy, E. Durability of GFRP Bars’ Bond to Concrete under Different Loading and Environmental Conditions. J. Compos. Constr. 2011, 15, 249–262. [Google Scholar] [CrossRef]
- Thakur, M.S.; Pandhiani, S.M.; Kashyap, V.; Upadhya, A.; Sihag, P. Predicting Bond Strength of FRP Bars in Concrete Using Soft Computing Techniques. Arab. J. Sci. Eng. 2021, 46, 4951–4969. [Google Scholar] [CrossRef]
- Institute, A.C. ACI Committee 440.1R-06: Guide for the Design and Construction of Structural Concrete Reinforced with FRP Bars; American Concrete Institute: Farmington Hills, MI, USA, 2006. [Google Scholar]
- Pan, J.; Wu, Y.-F. Analytical modeling of bond behavior between FRP plate and concrete. Compos. Part B Eng. 2014, 61, 17–25. [Google Scholar] [CrossRef]
- Jung, K.; Hong, K.; Han, S.; Park, J.; Kim, J. Prediction of Flexural Capacity of RC Beams Strengthened in Flexure with FRP Fabric and Cementitious Matrix. Int. J. Polym. Sci. 2015, 2015, 868541. [Google Scholar] [CrossRef] [Green Version]
- Hamze-Ziabari, S.M.; Yasavoli, A. Predicting Bond Strength between FRP Plates and Concrete Sub-strate: Applications of GMDH and MNLR Approaches. J. Adv. Concr. Technol. 2017, 15, 644–661. [Google Scholar] [CrossRef] [Green Version]
- Basaran, B.; Kalkan, I.; Bergil, E.; Erdal, E. Estimation of the FRP-concrete bond strength with code formulations and machine learning algorithms. Compos. Struct. 2021, 268, 113972. [Google Scholar] [CrossRef]
- Golafshani, E.M.; Rahai, A.; Sebt, M.H. Artificial neural network and genetic programming for predicting the bond strength of GFRP bars in concrete. Materials 2015, 48, 1581–1602. [Google Scholar] [CrossRef]
- Chuang, Y.-J.; Tsai, H.-C. Using genetic programming to model the bond strength of GFRP bars in concrete under the effects of design guidelines. Eng. Comput. 2021, 38, 2274–2292. [Google Scholar] [CrossRef]
- Su, M.; Zhong, Q.; Peng, H.; Li, S. Selected machine learning approaches for predicting the interfacial bond strength between FRPs and concrete. Constr. Build. Mater. 2021, 270, 121456. [Google Scholar] [CrossRef]
- Köroğlu, M.A. Artificial neural network for predicting the flexural bond strength of FRP bars in concrete. Sci. Eng. Compos. Mater. 2019, 26, 12–29. [Google Scholar] [CrossRef]
- Bolandi, H.; Banzhaf, W.; Lajnef, N.; Barri, K.; Alavi, A.H. An Intelligent Model for the Prediction of Bond Strength of FRP Bars in Concrete: A Soft Computing Approach. Technologies 2019, 7, 42. [Google Scholar] [CrossRef] [Green Version]
- Rahman, S.K.; Al-Ameri, R. Experimental Investigation and Artificial Neural Network Based Prediction of Bond Strength in Self-Compacting Geopolymer Concrete Reinforced with Basalt FRP Bars. Appl. Sci. 2021, 11, 4889. [Google Scholar] [CrossRef]
- Barkhordari, M.S.; Armaghani, D.J.; Sabri, M.M.S.; Ulrikh, D.V.; Ahmad, M. The Efficiency of Hybrid Intelligent Models in Predicting Fiber-Reinforced Polymer Concrete Interfacial-Bond Strength. Mater. Struct. 2022, 15, 3019. [Google Scholar] [CrossRef] [PubMed]
- Amin, M.N.; Iqbal, M.; Althoey, F.; Khan, K.; Faraz, M.I.; Qadir, M.G.; Alabdullah, A.A.; Ajwad, A. Investigating the Bond Strength of FRP Rebars in Concrete under High Temperature Using Gene-Expression Programming Model. Polymers 2022, 14, 2992. [Google Scholar] [CrossRef]
- Zhou, Y.; Zheng, S.; Huang, Z.; Sui, L.; Chen, Y. Explicit neural network model for predicting FRP-concrete interfacial bond strength based on a large database. Compos. Struct. 2020, 240, 111998. [Google Scholar] [CrossRef]
- Chen, H.; Li, X.; Wu, Y.; Zuo, L.; Lu, M.; Zhou, Y. Compressive Strength Prediction of High-Strength Concrete Using Long Short-Term Memory and Machine Learning Algorithms. Buildings 2022, 12, 302. [Google Scholar] [CrossRef]
- Munir, M.J.; Kazmi, S.M.S.; Wu, Y.-F.; Lin, X.; Ahmad, M.R. Development of novel design strength model for sustainable concrete columns: A new machine learning-based approach. J. Clean. Prod. 2022, 357, 131988. [Google Scholar] [CrossRef]
- Quan Tran, V.; Quoc Dang, V.; Si Ho, L. Evaluating compressive strength of concrete made with recycled concrete aggregates using machine learning approach. Constr. Build. Mater. 2022, 323, 126578. [Google Scholar] [CrossRef]
- Bashir, R.; Ashour, A. Neural network modelling for shear strength of concrete members reinforced with FRP bars. Compos. Part B Eng. 2012, 43, 3198–3207. [Google Scholar] [CrossRef]
- Coelho, M.R.F.; Sena-Cruz, J.M.; Neves, L.A.C.; Pereira, M.; Cortez, P.; Miranda, T. Using data mining algorithms to predict the bond strength of NSM FRP systems in concrete. Constr. Build. Mater. 2016, 126, 484–495. [Google Scholar] [CrossRef]
- Al-Shamiri, A.K.; Kim, J.H.; Yuan, T.-F.; Yoon, Y.S. Modeling the compressive strength of high-strength concrete: An extreme learning approach. Constr. Build. Mater. 2019, 208, 204–219. [Google Scholar] [CrossRef]
- Huang, G.B.; Zhou, H.; Ding, X.; Zhang, R. Extreme Learning Machine for Regression and Multiclass Classification. IEEE Trans. Syst. Man Cybern. Part B 2012, 42, 513–529. [Google Scholar] [CrossRef] [PubMed] [Green Version]
- Han, B.; Wu, Y.; Liu, L. Prediction and uncertainty quantification of compressive strength of high-strength concrete using optimized machine learning algorithms. Struct. Concr. 2022. [Google Scholar] [CrossRef]
- Wu, Y.; Li, S. Damage degree evaluation of masonry using optimized SVM-based acoustic emission monitoring and rate process theory. Measurement 2022, 190, 110729. [Google Scholar] [CrossRef]
- Wang, X.; Liu, Y.; Xin, H. Bond strength prediction of concrete-encased steel structures using hybrid machine learning method. Structures 2021, 32, 2279–2292. [Google Scholar] [CrossRef]
- Wu, Y.; Zhou, Y. Prediction and feature analysis of punching shear strength of two-way reinforced concrete slabs using optimized machine learning algorithm and Shapley additive explanations. Mech. Adv. Mater. Struct. 2022, 1–11. [Google Scholar] [CrossRef]
- Biswas, R.; Li, E.; Zhang, N.; Kumar, S.; Rai, B.; Zhou, J. Development of hybrid models using metaheuristic optimization techniques to predict the carbonation depth of fly ash concrete. Constr. Build. Mater. 2022, 346, 128483. [Google Scholar] [CrossRef]
- Wu, Y.; Zhou, Y. Splitting tensile strength prediction of sustainable high-performance concrete using machine learning techniques. Environ. Sci. Pollut. Res. 2022. [Google Scholar] [CrossRef]
- Yang, Z.; Wu, Y.; Zhou, Y.; Tang, H.; Fu, S. Assessment of Machine Learning Models for the Prediction of Rate-Dependent Compressive Strength of Rocks. Minerals 2022, 12, 731. [Google Scholar] [CrossRef]
- Taffese, W.Z.; Espinosa-Leal, L. A machine learning method for predicting the chloride migration coefficient of concrete. Constr. Build. Mater. 2022, 348, 128566. [Google Scholar] [CrossRef]
- Nguyen, T.-D.; Tran, T.-H.; Hoang, N.-D. Prediction of interface yield stress and plastic viscosity of fresh concrete using a hybrid machine learning approach. Adv. Eng. Inform. 2020, 44, 101057. [Google Scholar] [CrossRef]
- Wu, Y.; Zhou, Y. Hybrid machine learning model and Shapley additive explanations for compressive strength of sustainable concrete. Constr. Build. Mater. 2022, 330, 127298. [Google Scholar] [CrossRef]
- Nguyen, M.S.T.; Kim, S.-E. A hybrid machine learning approach in prediction and uncertainty quantification of ultimate compressive strength of RCFST columns. Constr. Build. Mater. 2021, 302, 124208. [Google Scholar] [CrossRef]


| Parameter | P | SC | D | fc | C/D | L/D | Strength |
|---|---|---|---|---|---|---|---|
| Unit | - | - | mm | MPa | - | - | MPa |
| Count | 222 | 222 | 222 | 222 | 222 | 222 | 222 |
| Type | Input | Input | Input | Input | Input | Input | Output |
| Max | 2 | 3 | 28.58 | 55.06 | 9.34 | 97.24 | 21 |
| Min | 1 | 1 | 6.35 | 23.43 | 1.68 | 3.56 | 0.76 |
| Median | 2 | 2 | 15.75 | 40.2 | 3 | 20.16 | 5.3 |
| Mean | 1.87 | 1.72 | 14.68 | 40.03 | 3.59 | 29.75 | 6.80 |
| Standard deviation | 0.34 | 0.75 | 4.87 | 6.72 | 1.82 | 22.28 | 4.15 |
| Correlation coefficient | 0.03 | −0.04 | −0.21 | −0.54 | 0.36 | −0.65 | 1 |
| Test Set | Experimental Value | ELM Model | Relative Error (%) | PSO-ELM Model | Relative Error (%) |
|---|---|---|---|---|---|
| 1 | 5.26 | 5.80 | 10.32 | 5.63 | 7.02 |
| 2 | 11.5 | 12.60 | 9.56 | 10.02 | 12.90 |
| 3 | 4.29 | 4.74 | 10.53 | 4.52 | 5.27 |
| 4 | 4.6 | 3.72 | 19.15 | 4.60 | 0.06 |
| 5 | 5.1 | 6.40 | 25.48 | 5.96 | 16.81 |
| 6 | 3.3 | 3.12 | 5.50 | 3.02 | 8.42 |
| 7 | 2.2 | 2.51 | 13.86 | 3.35 | 52.11 |
| 8 | 16 | 14.53 | 9.21 | 15.31 | 4.29 |
| 9 | 4.61 | 4.21 | 8.61 | 4.78 | 3.68 |
| 10 | 3.3 | 2.52 | 23.52 | 3.18 | 3.71 |
| 11 | 7.58 | 7.03 | 7.22 | 6.15 | 18.85 |
| 12 | 4.84 | 5.38 | 11.14 | 4.90 | 1.34 |
| 13 | 8.9 | 8.26 | 7.17 | 11.19 | 25.68 |
| 14 | 5.62 | 6.53 | 16.21 | 6.42 | 14.26 |
| 15 | 6.02 | 5.80 | 3.71 | 5.82 | 3.39 |
| 16 | 19.14 | 16.72 | 12.64 | 17.82 | 6.88 |
| 17 | 3.74 | 4.40 | 17.67 | 5.64 | 50.90 |
| 18 | 13.39 | 12.03 | 10.13 | 11.42 | 14.70 |
| 19 | 21 | 16.72 | 20.38 | 17.82 | 15.13 |
| 20 | 4.83 | 5.38 | 11.45 | 4.78 | 1.00 |
| 21 | 5.4 | 6.07 | 12.42 | 5.06 | 6.32 |
| 22 | 3.7 | 2.24 | 39.36 | 2.69 | 27.35 |
| 23 | 4.4 | 2.62 | 40.38 | 3.11 | 29.33 |
| 24 | 3.6 | 3.89 | 8.15 | 4.64 | 28.80 |
| 25 | 3.6 | 6.88 | 91.19 | 3.59 | 0.17 |
| 26 | 6.46 | 6.48 | 0.26 | 6.28 | 2.85 |
| 27 | 3.6 | 3.51 | 2.59 | 3.77 | 4.86 |
| 28 | 5.28 | 5.38 | 1.95 | 4.78 | 9.43 |
| 29 | 2.56 | 3.26 | 27.39 | 2.12 | 17.18 |
| 30 | 0.97 | 1.09 | 12.58 | 1.54 | 59.21 |
| 31 | 7.35 | 6.27 | 14.72 | 5.87 | 20.08 |
| 32 | 3.28 | 2.82 | 13.99 | 2.45 | 25.19 |
| 33 | 4.98 | 5.48 | 10.02 | 5.18 | 4.00 |
| 34 | 1.65 | 1.09 | 33.82 | 1.54 | 6.40 |
| 35 | 6.99 | 6.90 | 1.23 | 6.09 | 12.87 |
| 36 | 7.54 | 6.91 | 8.42 | 6.91 | 8.37 |
| 37 | 7.36 | 7.81 | 6.06 | 7.54 | 2.40 |
| 38 | 6.91 | 5.10 | 26.16 | 4.66 | 32.59 |
| 39 | 4.64 | 4.46 | 3.87 | 4.90 | 5.55 |
| 40 | 4.71 | 4.74 | 0.70 | 4.34 | 7.77 |
| 41 | 6 | 4.96 | 17.31 | 5.47 | 8.88 |
| 42 | 5 | 4.46 | 10.79 | 4.90 | 2.05 |
| 43 | 3.6 | 2.90 | 19.51 | 3.52 | 2.23 |
| 44 | 9.2 | 6.47 | 29.66 | 7.03 | 23.62 |
| Model | Phase | R2 | MSE | RMSE | MAE | MAPE (%) |
|---|---|---|---|---|---|---|
| ELM | Training | 0.931 | 1.176 | 1.084 | 0.788 | 14.714 |
| Test | 0.926 | 1.549 | 1.244 | 0.883 | 15.590 | |
| PSO-ELM | Training | 0.948 | 0.890 | 0.943 | 0.658 | 11.655 |
| Test | 0.945 | 1.170 | 1.082 | 0.777 | 13.953 |
Publisher’s Note: MDPI stays neutral with regard to jurisdictional claims in published maps and institutional affiliations. |
© 2022 by the authors. Licensee MDPI, Basel, Switzerland. This article is an open access article distributed under the terms and conditions of the Creative Commons Attribution (CC BY) license (https://creativecommons.org/licenses/by/4.0/).
Share and Cite
Li, R.; Liu, L.; Cheng, M. Estimating the Bond Strength of FRP Bars Using a Hybrid Machine Learning Model. Buildings 2022, 12, 1654. https://doi.org/10.3390/buildings12101654
Li R, Liu L, Cheng M. Estimating the Bond Strength of FRP Bars Using a Hybrid Machine Learning Model. Buildings. 2022; 12(10):1654. https://doi.org/10.3390/buildings12101654
Chicago/Turabian StyleLi, Ran, Lulu Liu, and Ming Cheng. 2022. "Estimating the Bond Strength of FRP Bars Using a Hybrid Machine Learning Model" Buildings 12, no. 10: 1654. https://doi.org/10.3390/buildings12101654