1. Introduction
There is clear evidence of anthropogenic climate change, as was stated in the 5th Assessment Report (AR5) by the Intergovernmental Panel on Climate Change (IPCC) [
1]. Besides the impact on temperature, other changes have been observed since pre-industrial times, e.g., changes in snow and ice amounts, spatial patterns of precipitation, sea level, etc. Further, extreme events such as heat waves, droughts and extreme precipitation have become more intense and frequent.
Changes in the climate system and particularly the increasing severity of certain weather events pose challenges to the preservation of heritage buildings [
2,
3,
4,
5]. The United Nations Educational, Scientific and Cultural Organization (UNESCO) made a list of the principle climate change risks and their impact on cultural heritage [
2]. Items on that list are freeze-thaw damage, thermal stress, biological activity, moisture infiltration, corrosion of metals, crystallisation and dissolution of salts, among others.
The studies that assess the climate change impact on the durability of historical building envelopes can be divided into two categories: studies using only climate data and studies based on the results of hygrothermal simulations. As part of the first category, Viles studied the impact of climate change on stone degradation [
6]. Some of the so-called direct effects of climate change she identified are not only changing patterns of the freeze-thaw risk, chemical weathering, salt weathering and biophysical and biochemical attacks but also changes in bioprotection. Brimblecombe et al. suggested that frost-related damages to porous stone will decrease over Europe, fungal growth on wood will become more important and salt weathering of stone materials will probably increase as well [
7]. Grossi et al. found that freeze-thaw damages in historical buildings will not decrease over the entire domain of Europe [
8]. Rather, the spatial patterns of the freeze-thaw risk across Europe are changing. Furthermore, the NOAH’S ARK project published an atlas of the climate change impact on cultural heritage over the European domain [
9]. Maps present the spatial patters in the change of climate variables and the resulting damage risks. European maps with damage risks based on climate parameters were also developed within the Climate for Culture project [
10].
Studies in the second category are based on results from hygrothermal simulations. Van Aarle et al. studied internally insulated calcium silicate bricks in the Netherlands, both horizontally and vertically positioned [
11]. They concluded that the freeze-thaw risk is projected to decrease by 70% based on scenario A1B of the REMO climate model. Vandemeulebroucke et al. analysed the freeze-thaw risk in solid masonry across Europe [
12,
13] and in Ottawa, Canada [
14]. Wind-driven rain (WDR) load was found important when assessing the change in the freeze-thaw risk. A changing WDR load or distribution over the year can significantly alter the freeze-thaw behaviour. In addition, the freeze-thaw risk can decrease for one orientation but increase for another orientation. Further, Zhou et al. investigated interior retrofitted historical masonry in Zurich and Davos, Switzerland [
15]. Increasing winter temperatures do not necessarily result in a decreasing freeze-thaw risk. This can also lead to more fluctuations around the freezing point and an increased freeze-thaw risk. This is especially the case when precipitation loads are also projected to increase. Further, Hao et al. studied mould growth, interstitial condensation and freeze-thaw damage in interior insulated historical Alpine buildings [
16]. Sahyoun et al. assessed the freeze-thaw risk in interior insulated historical masonry walls in Ottawa, Canada [
17]. Hedayatnia et al. worked on material damages in heritage buildings in Iran [
18]. Flyen et al. discussed fungal decay in historical structures in Svalbard, Norway [
19]. Lacasse et al. included historical buildings in their study on the service life prediction and maintainability of buildings [
20]. There is also the study of Leissner et al. within the Climate for Culture project [
21,
22]. Full-scale multizone dynamic hygrothermal whole-building simulations were performed to assess the future indoor climate conditions. The durability of historical building envelopes, however, was not discussed in this study.
In addition to the uncertainties induced by climate models, within the hygrothermal simulations, there also are many uncertainties. For uninsulated walls based on historical climate conditions, Calle found that wall orientation, rain exposure coefficient, brick type and wall thickness influence the damage risks as freeze-thaw action, mould growth and wood decay in masonry walls [
23]. However, it is unknown how sensitive the climate change impact is to the variations in these parameters. Previous studies generally did not include a sensitivity analysis on the climate change impact.
This paper presents a factorial study of the impact of climate change on solid masonry walls in Brussels, Belgium, with and without interior insulation. The sensitivity analysis covers a variation of the representative concentration pathway (RCP) scenario, orientation, masonry thickness, brick type, insulation thickness and rain exposure coefficient. Three damage mechanisms are studied, i.e., freeze-thaw damage at a 5 mm depth from the exterior surface, mould growth at the interior wall surface and wood decay 100 mm from the interior masonry surface.
The following questions will be answered in this manuscript: What is the critical orientation, and does it change over time? What is the projected freeze-thaw risk in solid masonry walls in Brussels? How sensitive is the impact of climate change to variations in the building parameters? Is it good practice to apply internal insulation in the future?
2. Materials and Methods
A sensitivity analysis is performed to study the impact of climate change on three damage risks in solid masonry in Brussels, Belgium, i.e., freeze-thaw damage of the masonry, mould growth at the interior wall surface and wood decay of embedded beam heads. The study is based on 1D hygrothermal simulations in Delphin 6.1. The total sample size of this study is 8.192 simulations (full factorial). The variations are listed in
Table 1.
2.1. Climate Data
The climate data consist of two 30-year periods by the ALARO-0 Regional Climate Model (RCM) [
24]. The periods 1976–2005 (historical period) (H) and 2070–2099 (projections) are considered. Within each period, no climate change is considered since a 30-year period is required to define the climate according to the World Meteorological Organization [
25]. Climate change is considered relatively between the historical period and the projections.
The projection data are forced by representative concentration pathways (RCPs) 2.6, 4.5 and 8.5, which can be considered as a strong mitigation, moderate mitigation and a very high emission greenhouse gas scenario. The values of 2.6, 4.5 and 8.5 represent the radiative forcing in W/m2 at the end of the 21st century, which is the change in energy flux at the top of the atmosphere. Scenario RCP 6.0 is not considered since this scenario is not available for the studied climate model.
Hourly data are available for the grid point of Brussels, Belgium (50.8° N; 4.3° E), which originates from the high-resolution experiment at 4 km resolution within the CORDEX.be project [
26]. Note that the RCM data are not bias-corrected, which is found valid since this is a sensitivity study and no absolute risks are considered.
The considered parameters in the hygrothermal simulations are near-surface air temperature and relative humidity, wind velocity and direction, precipitation, direct and diffuse shortwave radiation and longwave downward radiation.
2.2. Boundary Conditions
Concerning the outdoor conditions, the heat and water vapour transfer coefficients at the exterior surface depend on the wind velocity based on EN ISO 6946 [
27]:
with the heat exchange coefficient
(W/(m
2K)), vapour diffusion exchange coefficient
(s/m) and wind velocity
(m/s). Further, the shortwave absorption coefficient of the building surface equals 0.6, and the albedo of the ground surface is 0.2. The longwave emission coefficient of the building and ground surface is 0.9. The rain exposure coefficient is varied, as listed in
Table 1. The hourly WDR intensity is computed in Delphin 6.1 using the hourly precipitation amount
, wind velocity
and direction
, and wall orientation
based on EN ISO 15927-3 [
28]:
The indoor climate conditions are computed based on the outdoor air temperature, as prescribed in EN 15026 [
29]. The indoor temperature ranges between 20 and 25 °C, whereas the relative humidity goes from 35% to 65%. This corresponds to the WTA 6.2 indoor climate model for increased moisture load (plus 5%) [
30]. The indoor heat and water vapour transfer coefficients are, respectively, 8 W/m
2 and 3 × 10
−8 s/m.
The first 4 years of the considered periods are used as conditioning years: either 1976–1979 for the historical period or 2070–2074 for the climate projections. These 4 years are simulated twice, followed by the remaining 26 years of climate data. The results of the conditioning years are excluded prior to the evaluation.
2.3. Wall Composition and Orientation
A historical solid masonry wall is studied, before and after the application of interior insulation. The masonry thickness is varied in this study, as well as the insulation thickness of the insulated cases. In the uninsulated case, the wall is finished at the interior side with 12 mm of gypsum plaster, whereas the interior finish of the retrofitted case consists of mineral wool insulation, a vapour barrier (sd = 2.3 m) and gypsum board (12 mm).
The studied bricks are the generic cluster materials of historical brick by Zhao [
31], i.e., clusters 1 to 4. The clusters are composed of bricks with similar characteristics: cluster 1 represents modern bricks produced with contemporary technologies; cluster 2 contains historical classic clay and loam bricks; cluster 3 includes bricks made of clay, loam and an additional sand component; and the bricks in cluster 4 have a higher density and lower liquid water transport than the other clusters. The material properties are given in
Table 2.
Further, the brickwork is considered homogeneous, neglecting the mortar joints, since 1D simulations are performed in this study. This simplification was found valid by Vereecken and Roels [
32].
Since wall orientation has an important impact on the wetting and drying load of building envelopes, it highly impacts the damage risk. In this study, 8 orientations are considered at a 45° interval (clockwise), starting at 0° (north).
2.4. Damage Criteria
Three damage mechanisms are studied in this paper: freeze-thaw damage 5 mm from the exterior wall surface, mould growth at the interior wall surface and wood decay 100 mm from the interior masonry surface. Note that the considered damage criteria do not quantify absolute damage risks but can merely be used to perform comparative studies to assess relative differences.
2.4.1. Freeze-Thaw Damage
The freeze-thaw action in the masonry is quantified by the number of critical freeze-thaw cycles (FTC
crit) at a 5 mm depth from the exterior. This depth is considered critical for freeze-thaw action in masonry [
12]. FTC
crit are counted each time the ice mass density exceeds 25% of the open porosity. The choice of a 25% threshold is based on Mensinga et al. [
33] and should be considered as a worst-case scenario used for comparative analysis here.
To compute the relative change in the annual average FTCcrit, a correction is made to avoid very large relative changes for small absolute changes. Relative changes for which the yearly average FTCcrit during the historical period is smaller than 1.5 are considered 0%. Note that this is an arbitrary selected value. In addition, an increase in FTCcrit only occurs for a few cycles but leads to large relative changes. Therefore, these relative changes are also excluded.
2.4.2. Mould Growth
The mould growth on the interior wall surface is the second studied damage mechanism in this paper, computed using the VTT model [
34,
35]. The mould index (M) quantifies the mould coverage on a surface ranging between 0 and 6. When M is 0, it means that the spores are not activated, whereas M = 6 indicates a mould coverage of 100%. An often-used threshold value is M = 3, reporting a visual mould coverage between 10% and 30%. The model is based on temperature and relative humidity at the considered location. A sensitivity and decay class are assigned to account for the sensitivity of the surface as well as the rate of decay when conditions for mould growth are unfavourable [
36]. In this study, the classes
sensitive and
almost no decline are used.
As for the relative change in FTCcrit, a correction is made for the annual average M. The relative change is set equal to 0% if the historical annual average M is smaller than 0.1. Again, this is an arbitrary selected value.
2.4.3. Wood Decay
Apart from masonry, mortar joints and finishing materials, wooden beams are embedded in historical solid masonry walls, e.g., to support floors. The beam end is approximately 100 mm embedded in the masonry. Depending on the conditions in the wall, the beam head may be at risk for degradation by wood-decaying fungi [
37]. The wood decay is characterised by mass loss of the beam head, which in time may result in structural failure of the beam.
The wood decay (WD) at the beam head is calculated using the model by Brischke and Rapp [
38,
39], who proposed a dose–response relationship between the conditions in the wood and the fungal decay. The total daily dose
is a function of the temperature induced daily dose
and moisture content induced daily dose
. The equations are the following:
with the weighting factor of the temperature induced daily dose component
equal to 3.2, daily average temperature
, daily moisture content
and daily minimum and maximum temperature
and
. In this study, the annual sum of daily total doses 100 mm from the interior masonry surface is the considered damage mechanism.
Since this study considers 1D hygrothermal simulations, the influence of the wooden beam on the heat and moisture behaviour is not accounted for. The annual total dose of the WD is calculated using the conditions in the masonry at the location of the beam head as if the wood were present. The value for is equal to the ratio between the moisture content in the masonry in kg/m³ and the average density of Scots pine wood (465 kg/m³) multiplied by 100. The results can therefore not be considered as absolute values for wood decay. They are merely used to assess the change in conditions at the location of the beam head.
For the WD, a correction is made as well. The relative change is set equal to 0% if the historical annual average WD is smaller than 5.
3. Results
3.1. Climate Analysis
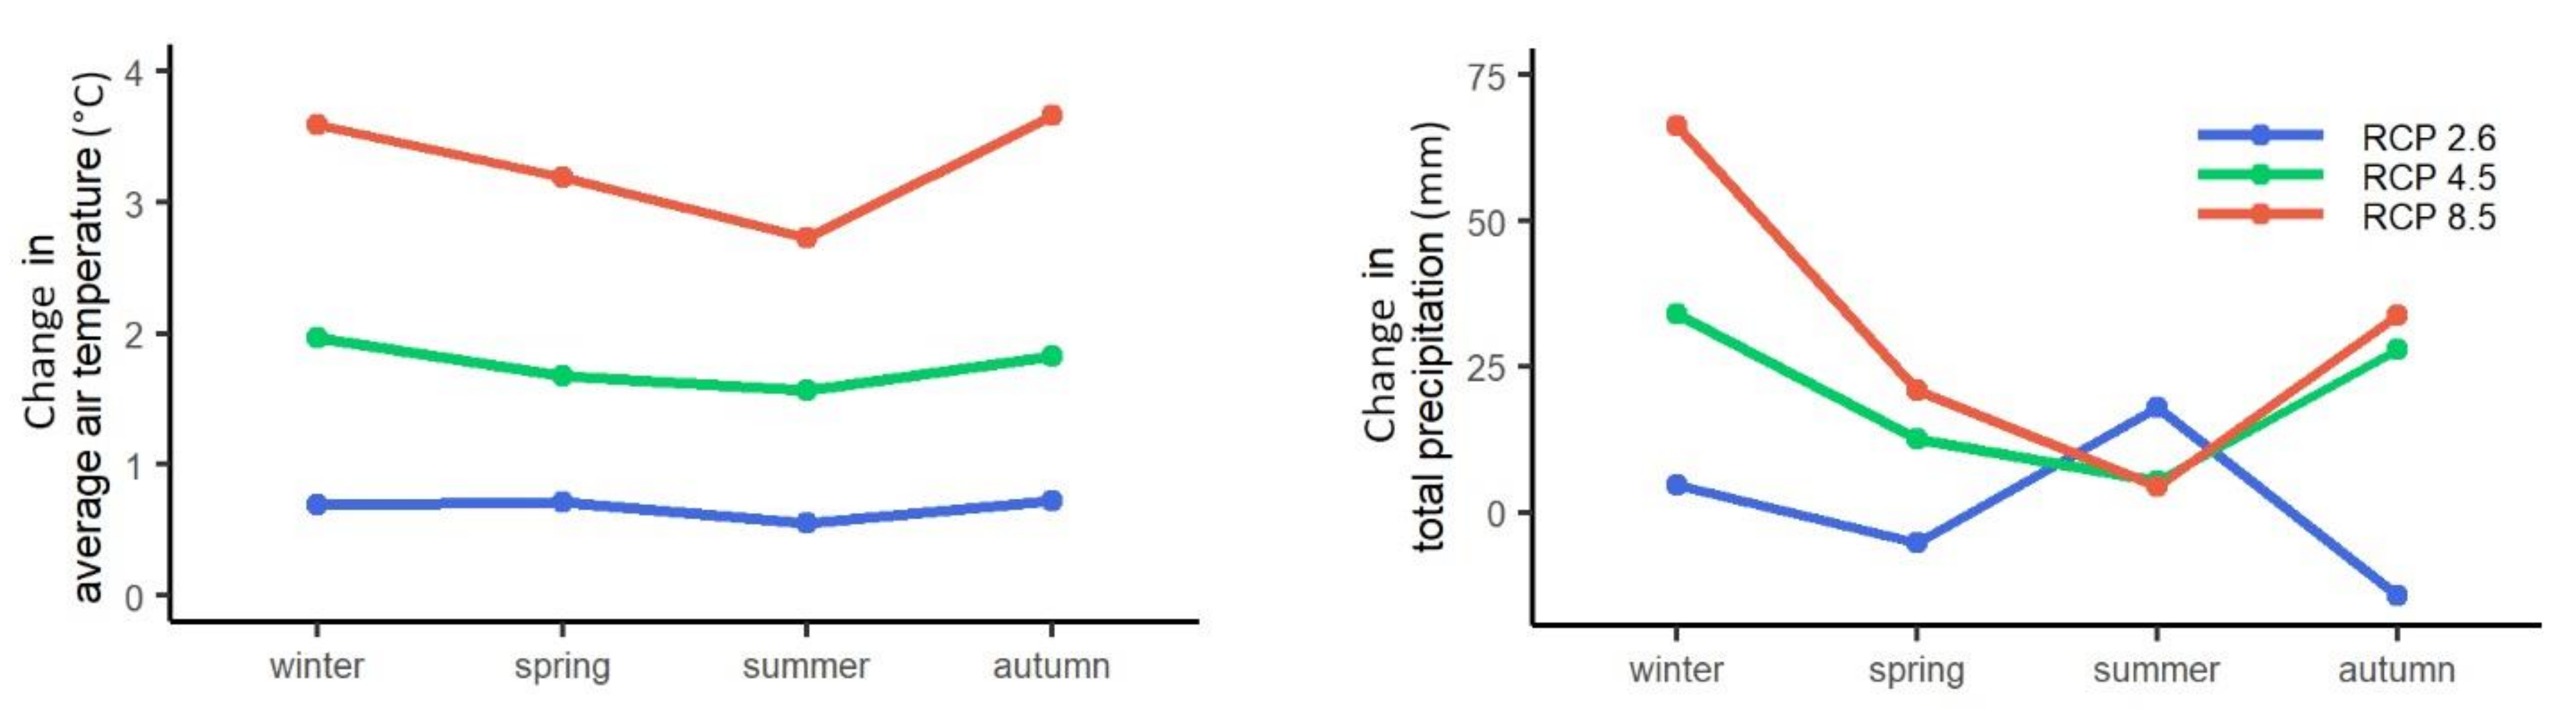
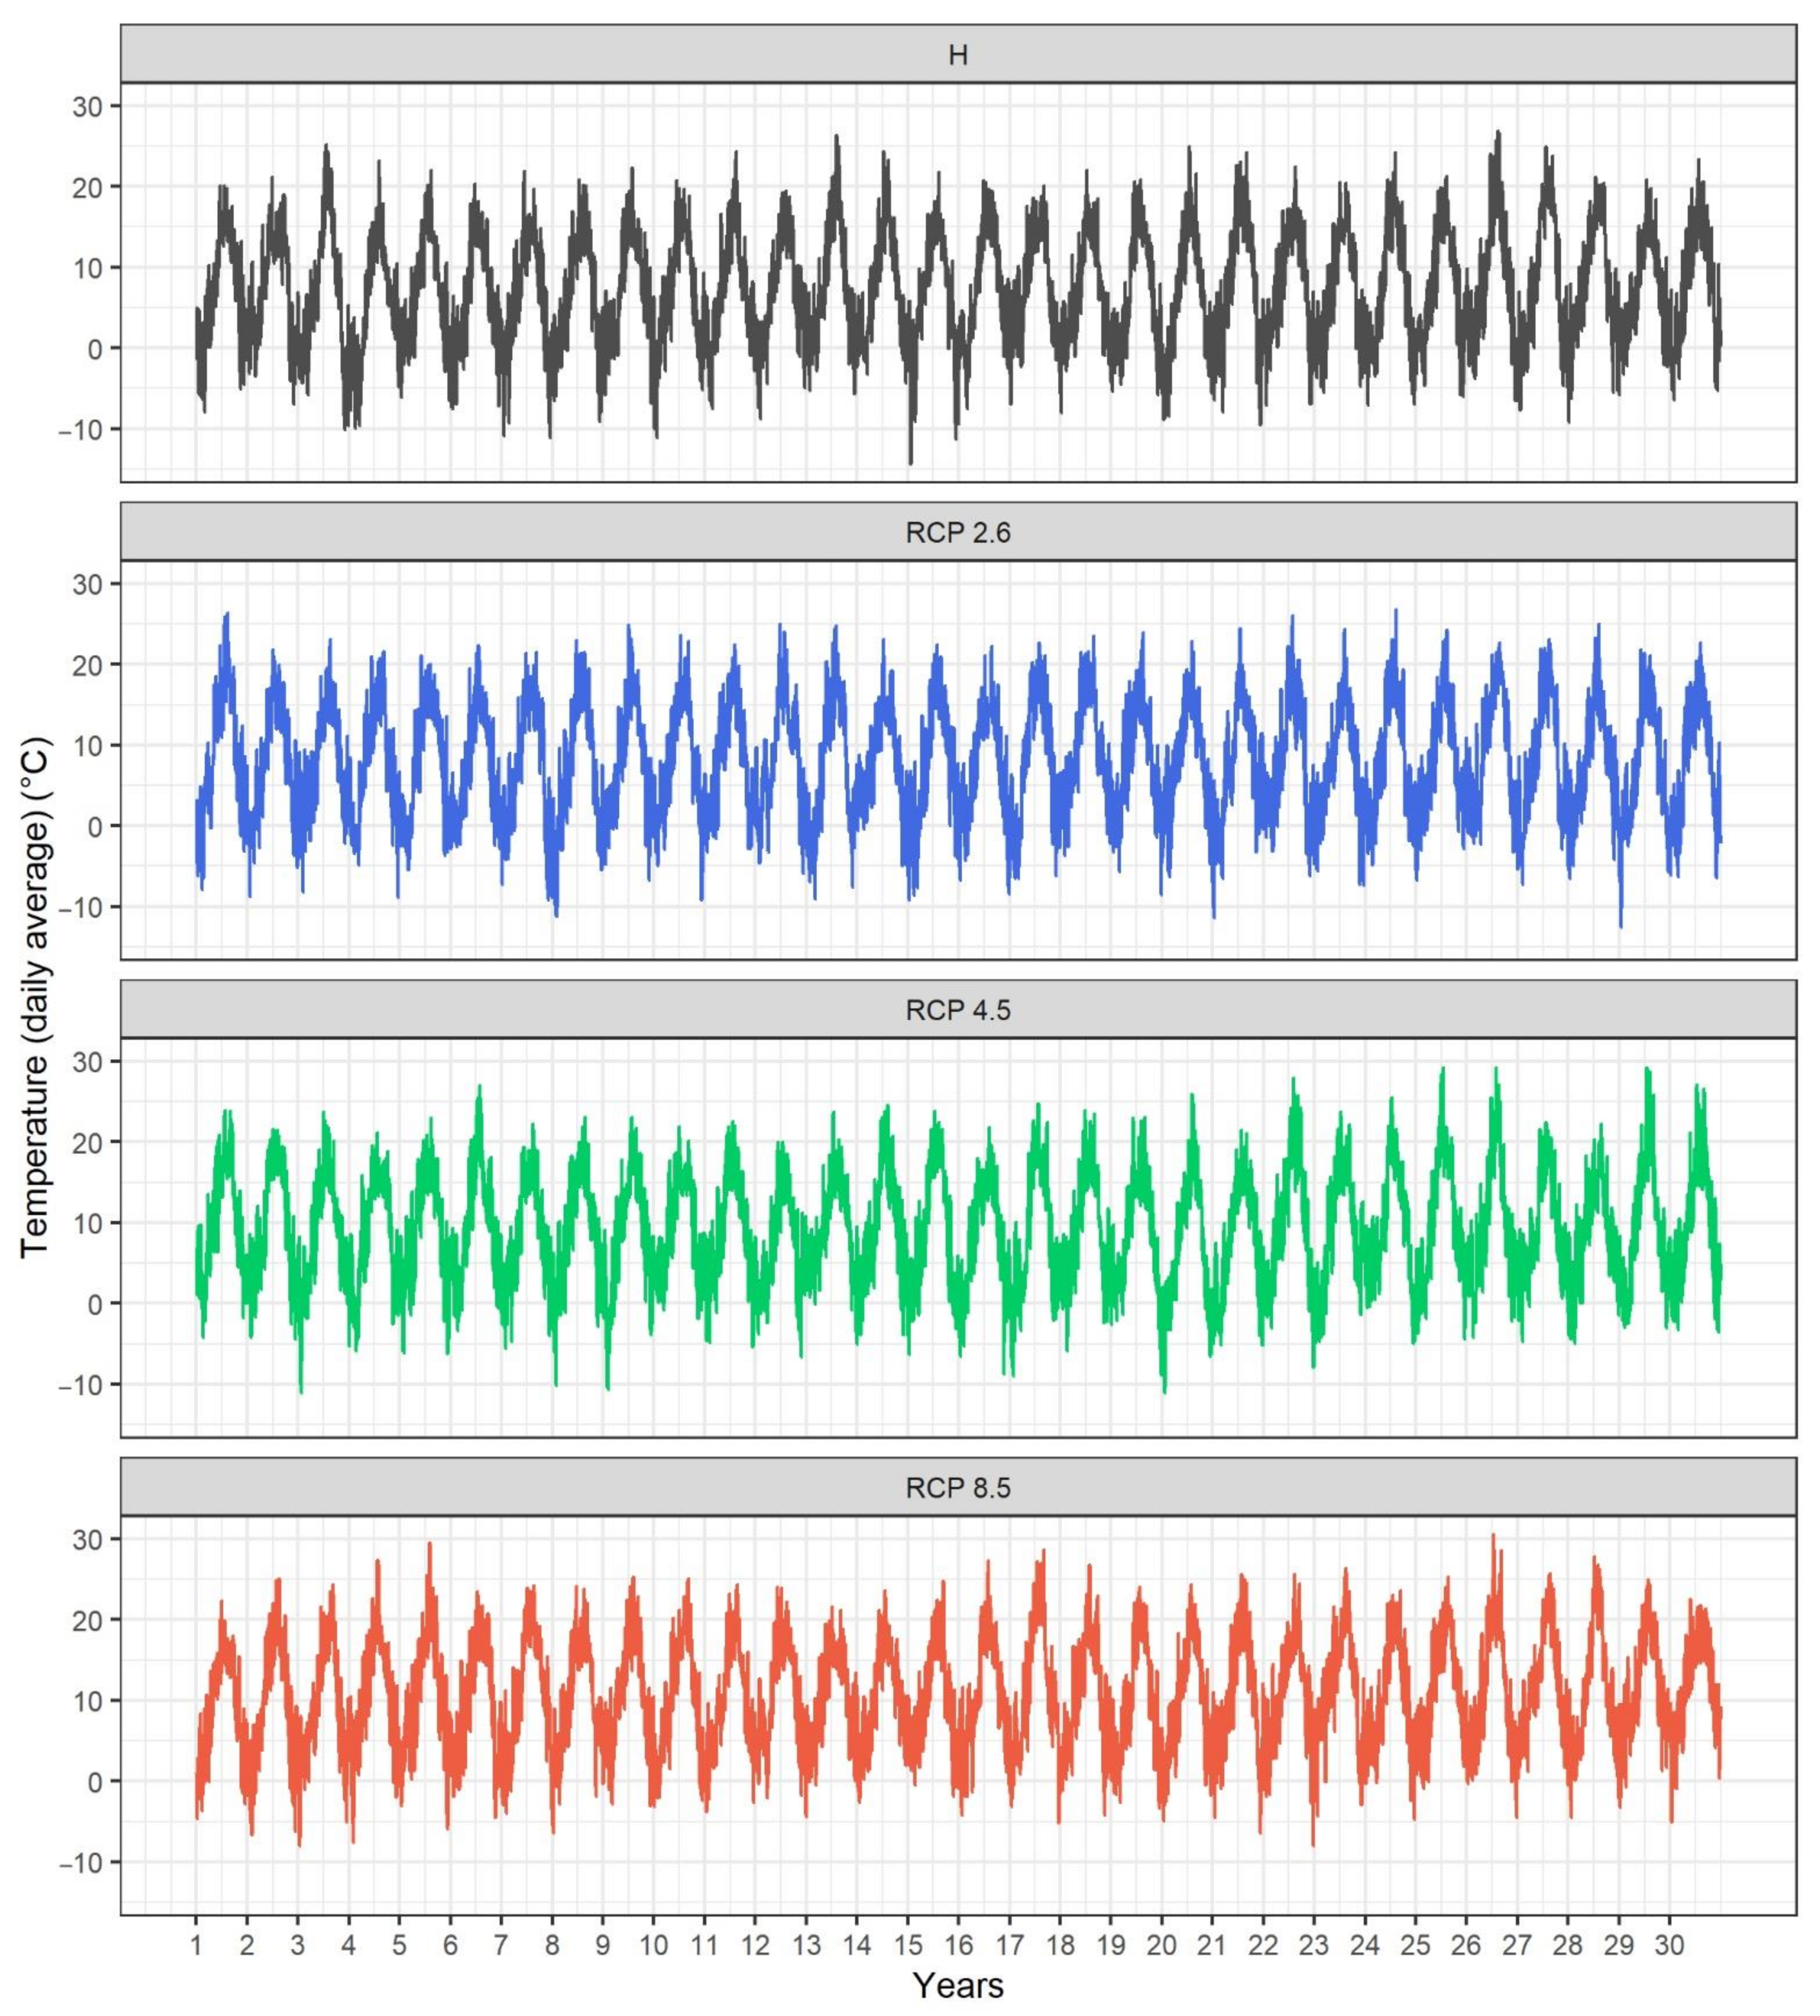
The climate change signal of temperature and precipitation in Brussels is not constant over the year, as illustrated in
Figure 1. Air temperature is projected to increase towards the end of the 21st century, especially for RCP 4.5 and 8.5. The largest increases are found for winter and autumn, i.e., approximately +2.0 °C (RCP 4.5) and +3.5 °C (RCP 8.5). According to Grossi et al. [
4], an increase in mean winter temperatures, in case they are higher than 0 °C during both the historical and the future period, suggest a decrease in the freeze-thaw risk in heritage buildings.
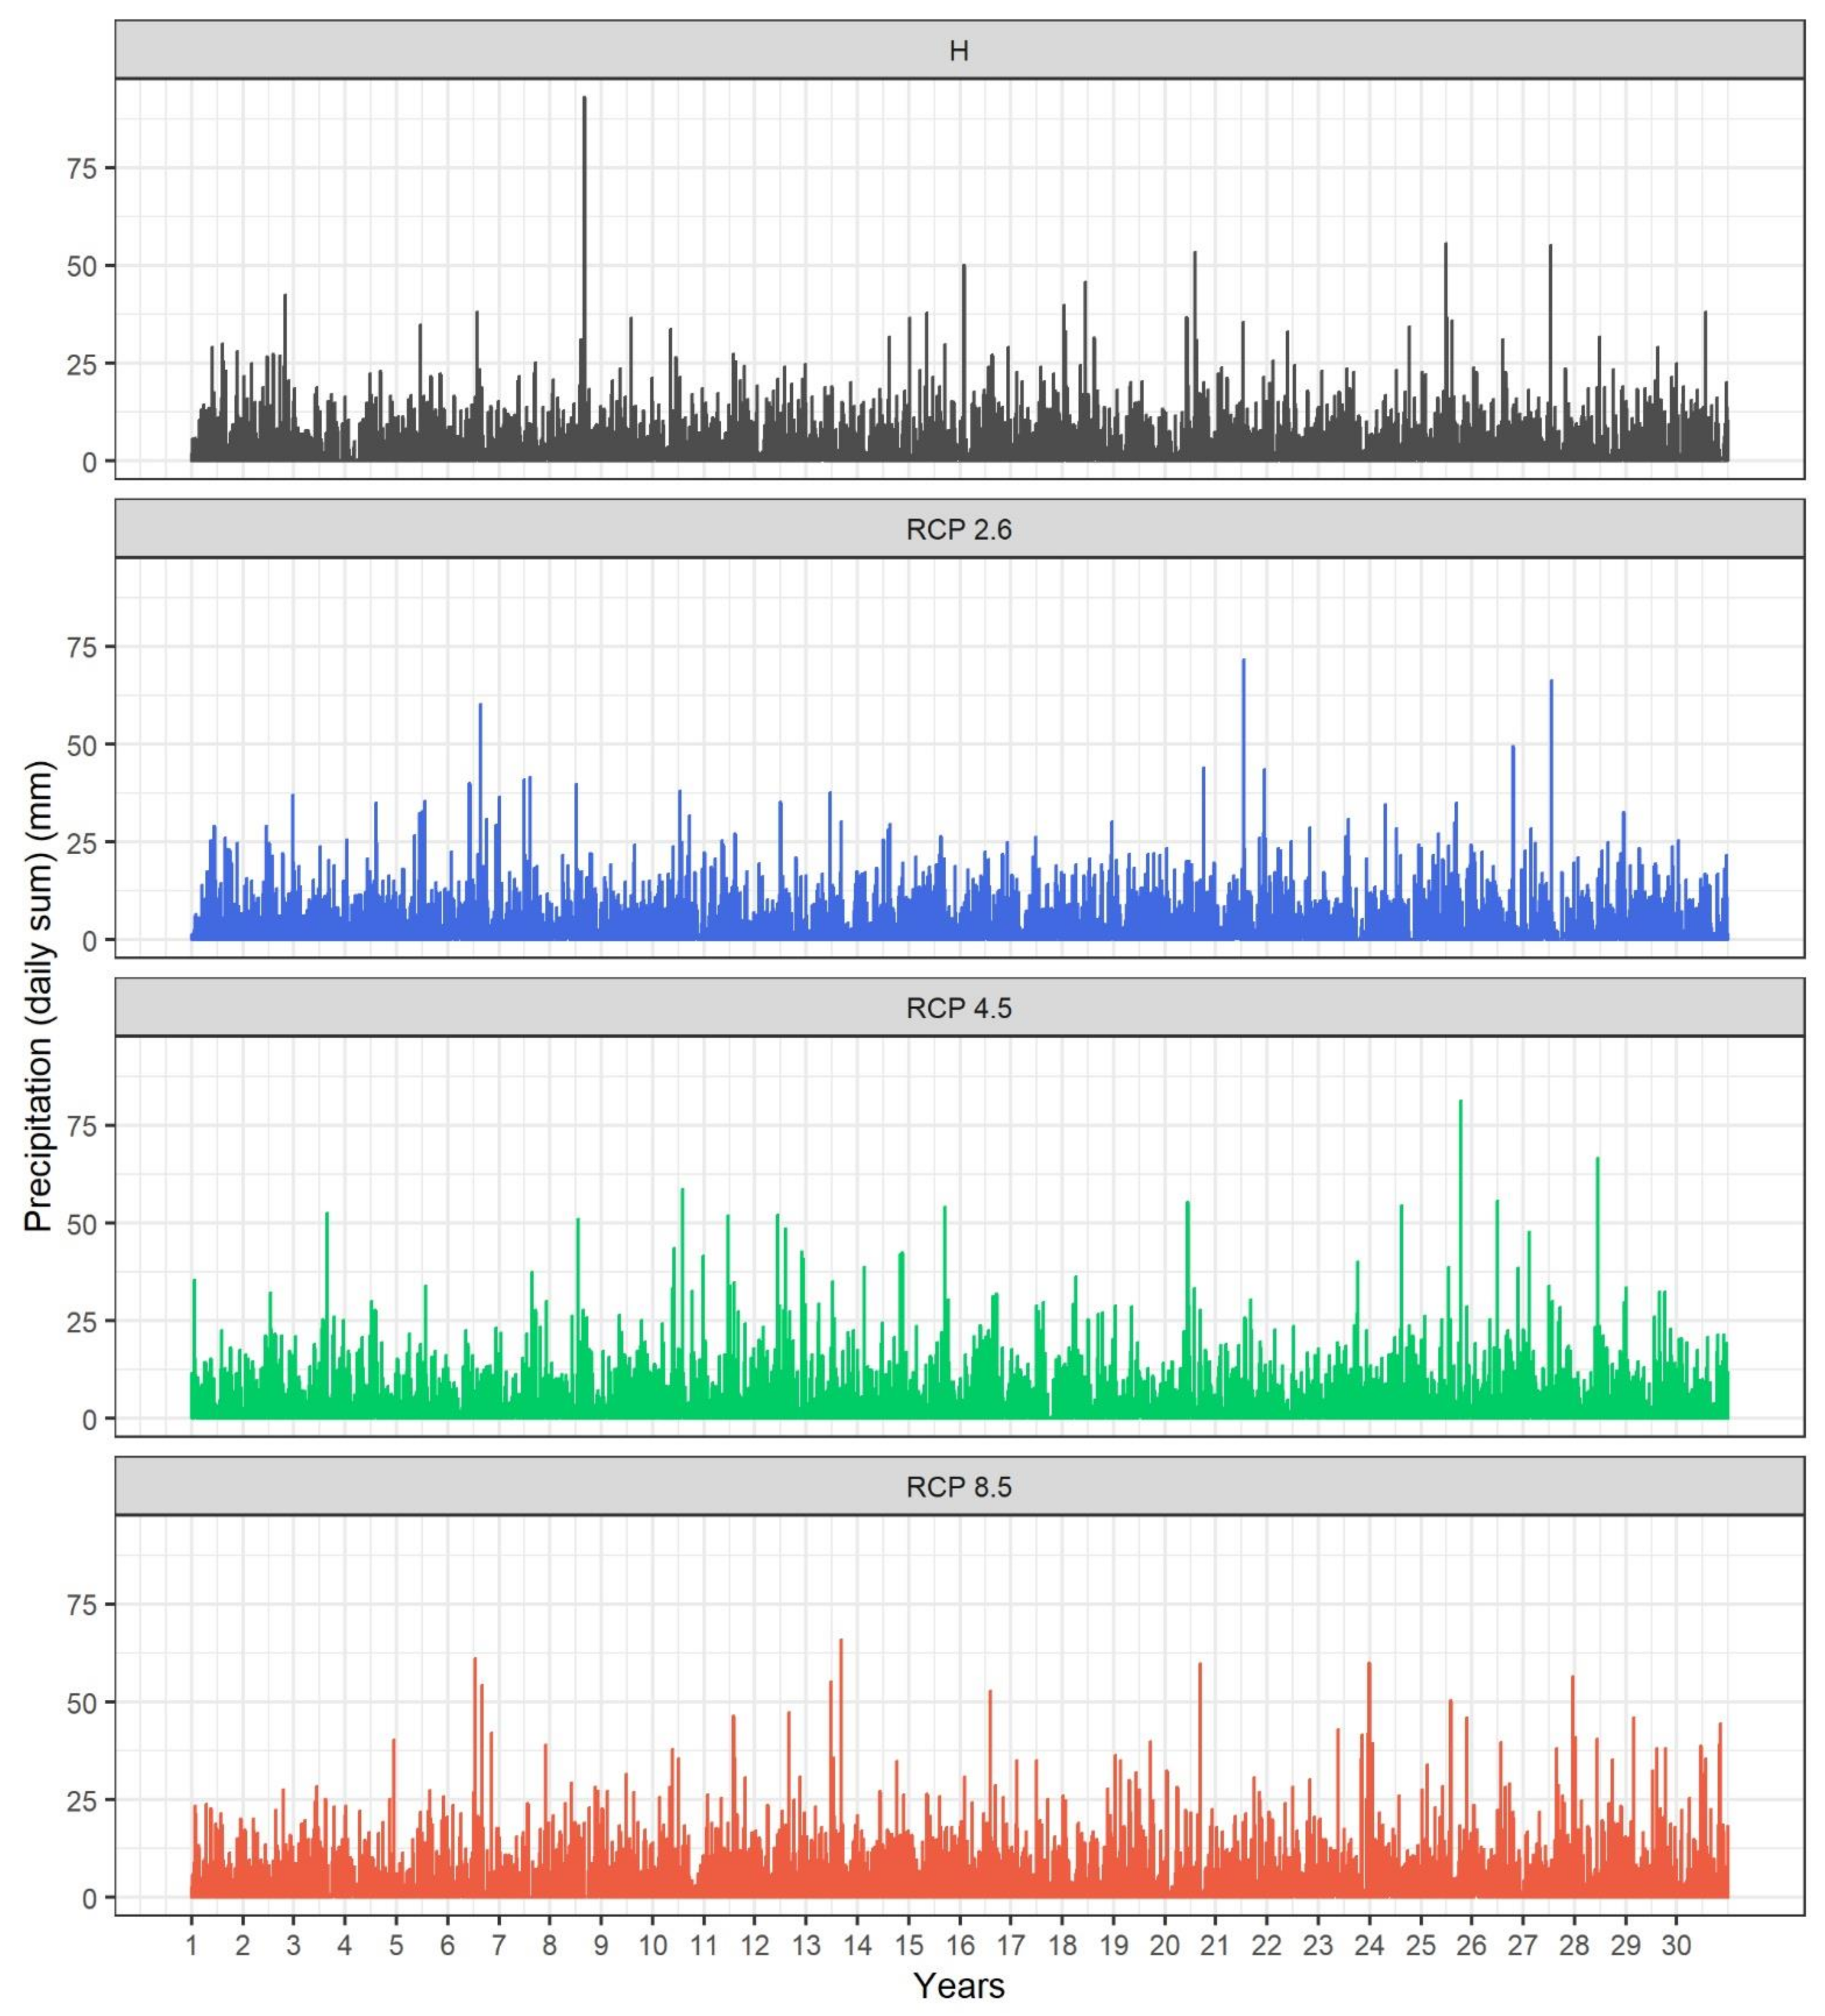
In addition, there is an increase in projected precipitation loads for all seasons of RCPs 4.5 and 8.5. This, however, could induce an increase in the damage risk [
6,
8,
9]. In winter, the precipitation load increases the most for RCP 8.5 (+27%), followed by autumn. For RCP 4.5, the winter and autumn anomalies are similar (+14%). RCP 2.6, on the other hand, illustrates an increase in winter (+2%) and summer, whereas the spring and autumn precipitation decreases. The annual and seasonal average temperature and precipitation loads are listed in
Table 3. Further, the daily average temperature (
Figure A1) and daily total precipitation amount (
Figure A2) are included in
Appendix A.
Alongside temperature and precipitation, the WDR load is an important parameter in the hygrothermal analysis of wall assemblies [
6,
8]. The critical orientation for moisture-related damages is often considered to be the orientation receiving the highest cumulative WDR load.
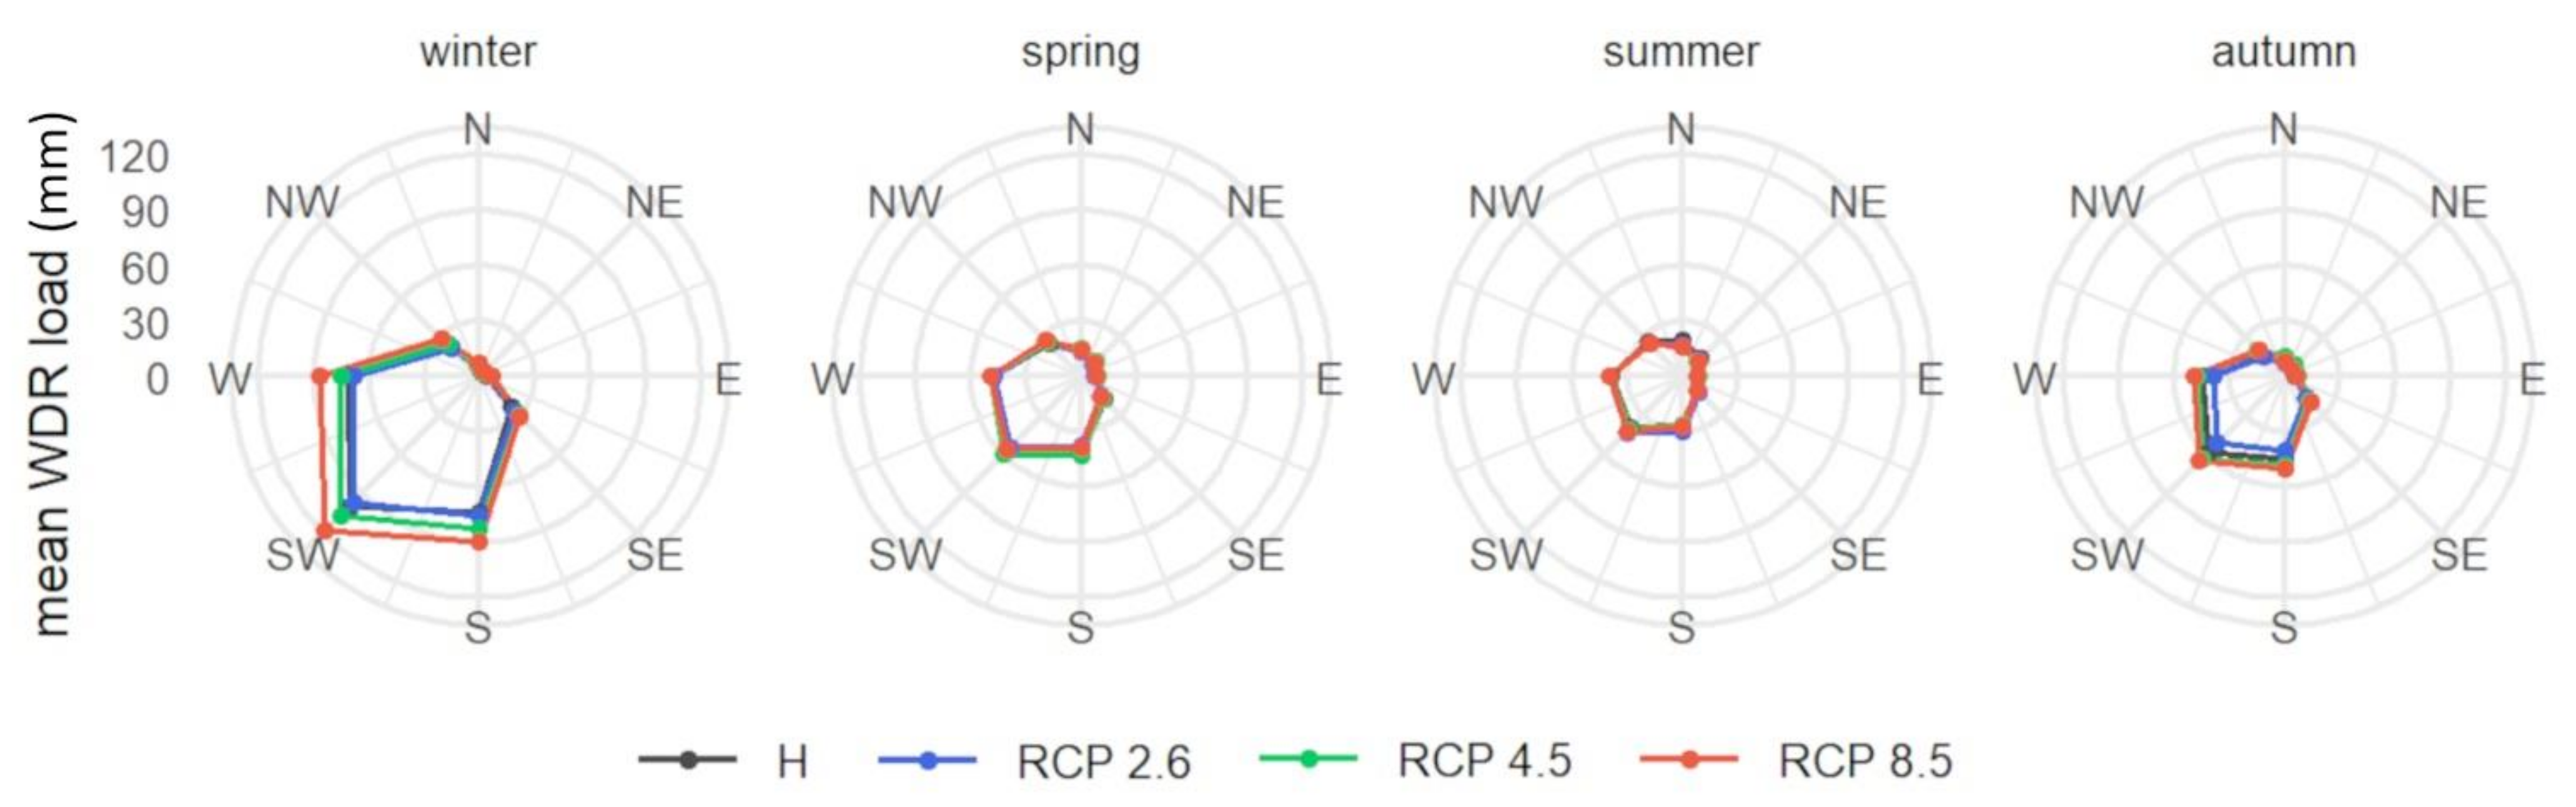
For Brussels, the critical WDR orientation is the south-west (SW) as this is the dominant wind direction, but also for air masses bringing precipitation (
Figure 2). The south (S) and west (W) receive a considerable WDR load as well, whereas the WDR load from the north (N) to the east (E) is limited. Further, the WDR load follows a different trend than the precipitation load for different seasons. Whereas the precipitation load is the highest during summer in the historical period, the WDR load is the highest in winter. Given that the WDR load is a function of precipitation intensity and wind velocity, this is explained by the higher wind velocities during winter.
The change in the WDR load is the highest during winter, as is the case for the precipitation load (
Figure 1 and
Figure 2). Note that the average wind velocity is not projected to change considerably. The largest absolute increase in the WDR load is projected for the SW of RCP 8.5, i.e., +19 mm (+20%). For RCP 4.5, the highest increase of +8 mm (+11%) is projected for S, and for RCP 2.6, the WDR load remains quasi-constant in winter.
3.2. Critical Orientation
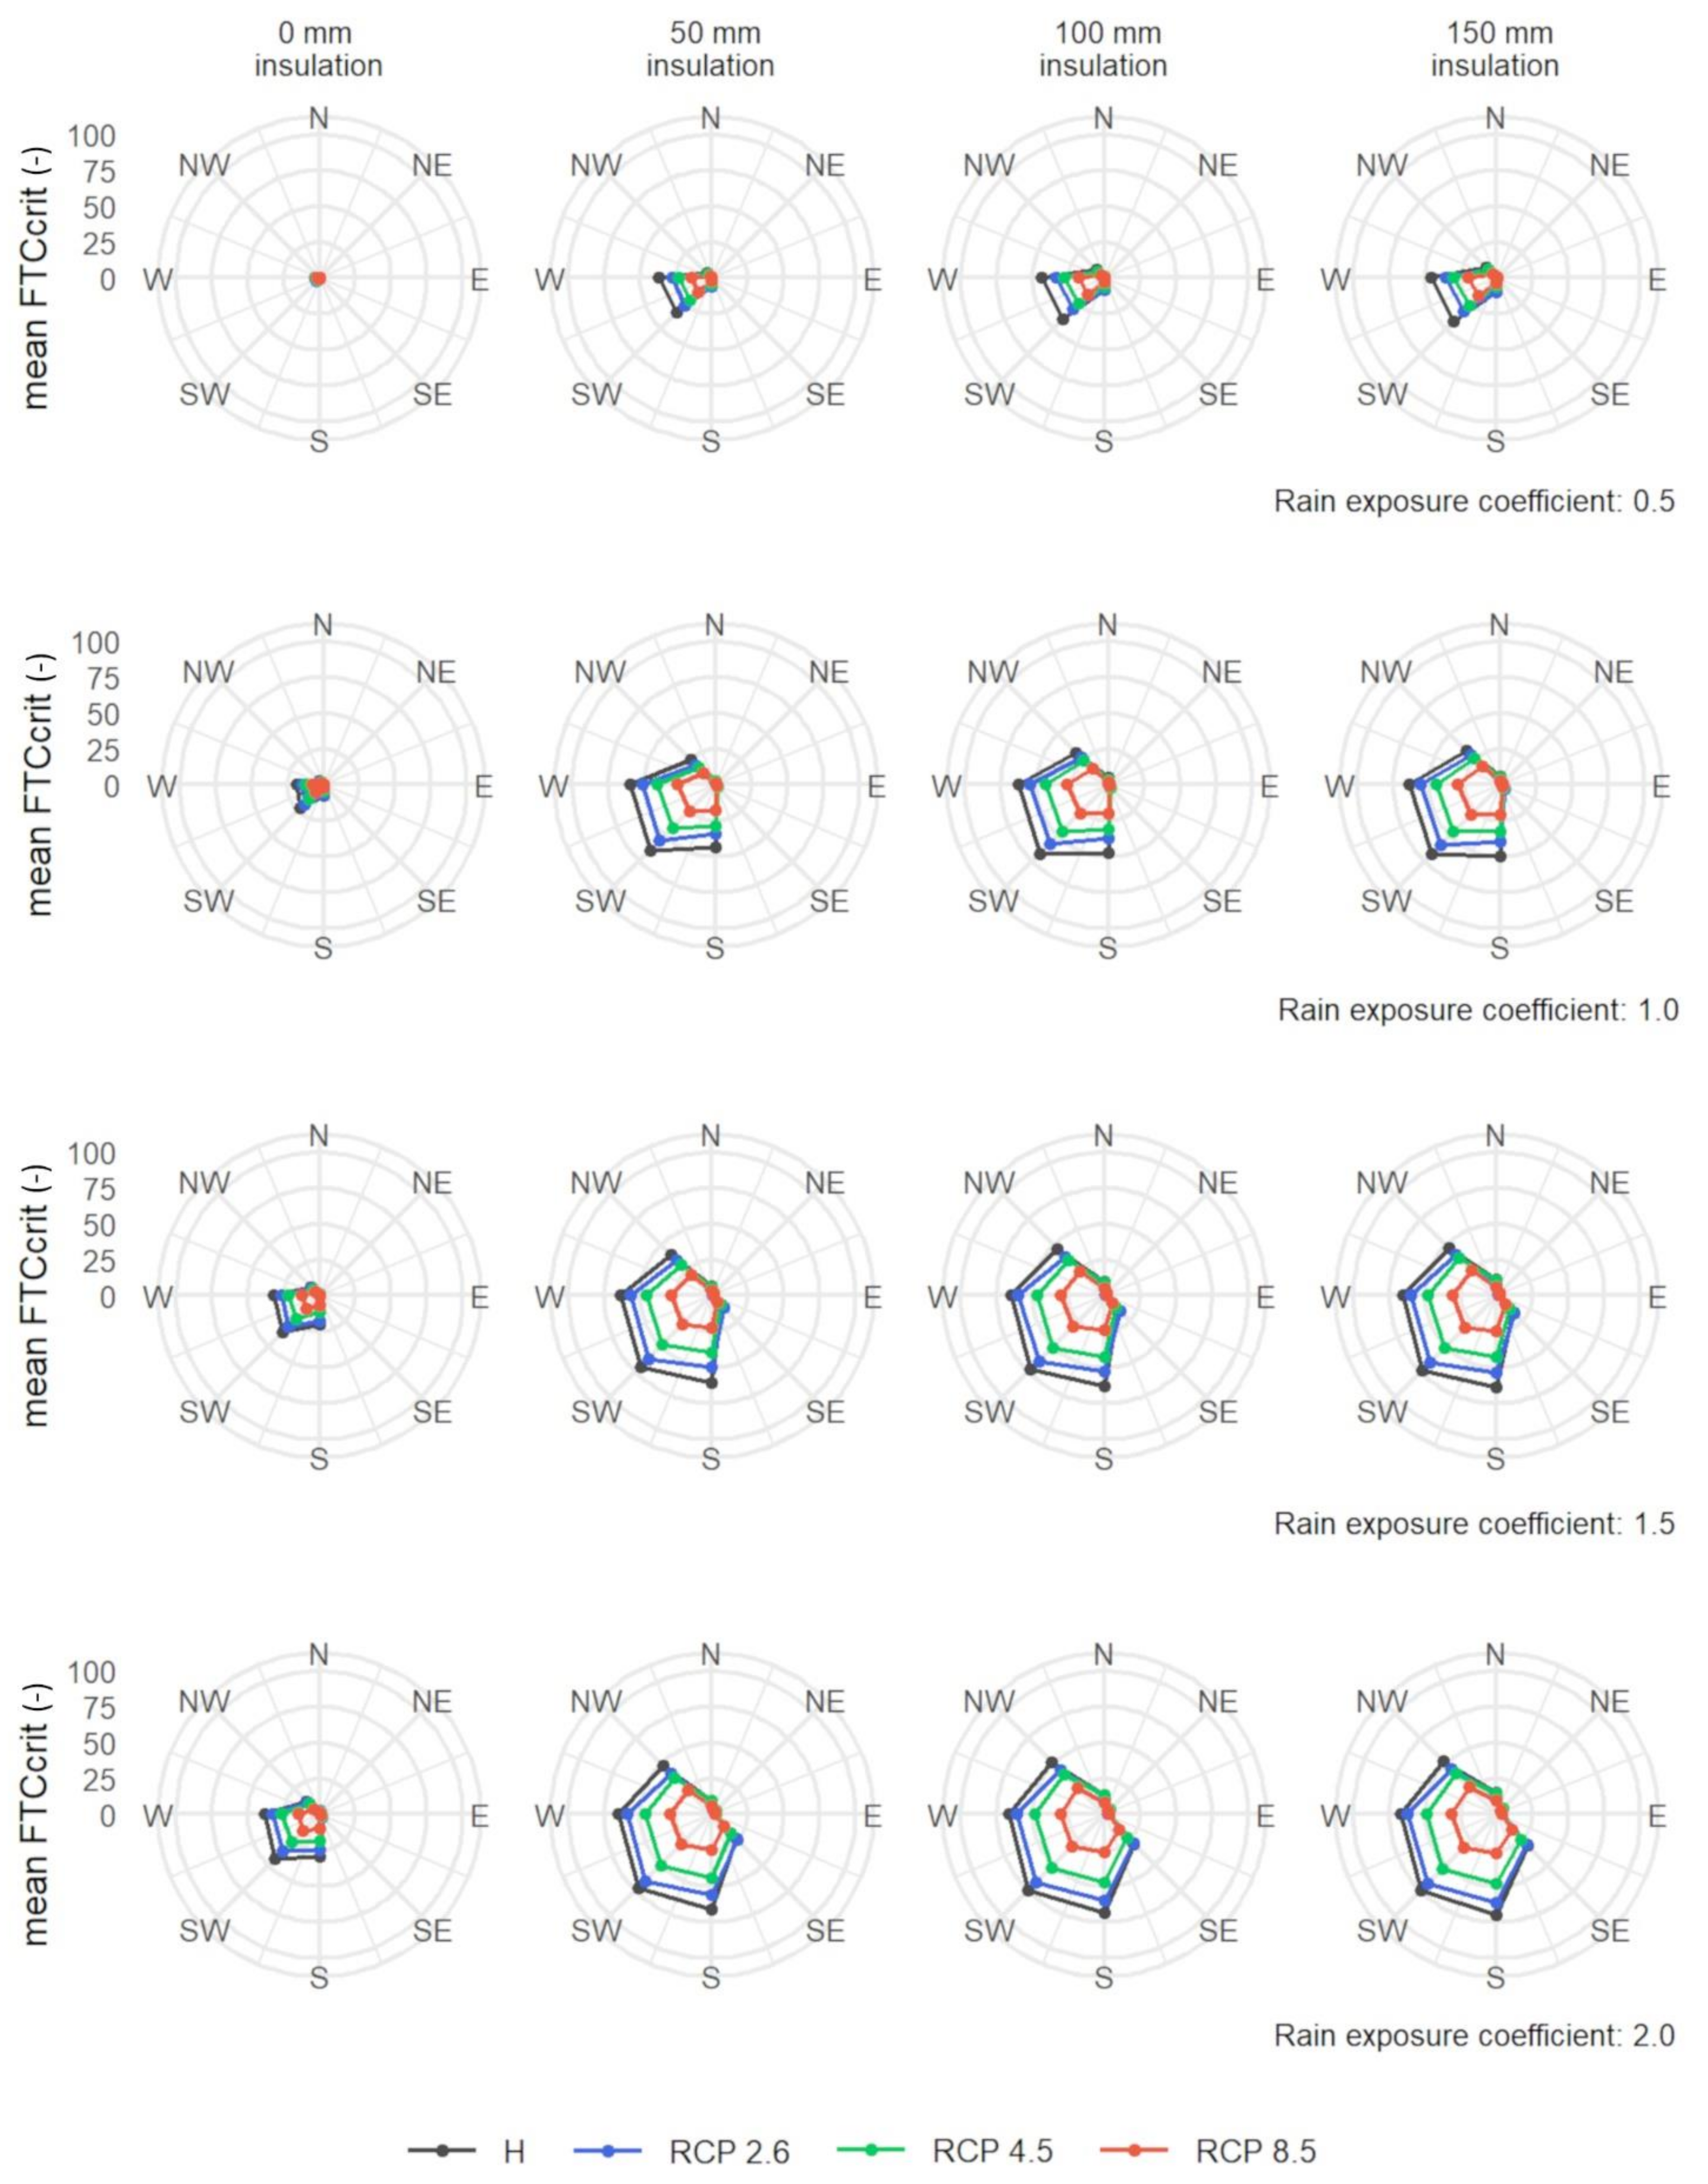
In most cases, the SW is the critical orientation for moisture-related damages in solid masonry walls, as illustrated by
Figure 3 and
Figure 4. This orientation receives the highest annual WDR load. Next to that, SW-orientated walls also receive a considerable direct shortwave radiation flux. For the freeze-thaw damage, this means that the ice mass density at 5 mm in the masonry often fluctuates between day and night due to shortwave radiation, given that the air temperature remains close to 0 °C. In some cases, the critical orientation is the W, but the values are close to the ones for the SW. For the orientations between N and SE, the WDR load is low, which results in low risks on moisture-related damages. As the SW is the critical orientation, this orientation is analysed in the following sections of this paper.
Further, more orientations sustain a considerable damage risk for an increasing rain exposure coefficient. This is illustrated for the number of FTC
crit in
Figure 3 but is also observed for the other damage mechanisms (
Figure 4). For some orientations, the critical saturation degree for freeze-thaw damage is not reached during winter when the rain exposure is low. For an increasing rain exposure coefficient, more orientations reach the critical saturation degree upon freezing, leading to a higher number of yearly mean FTC
crit.
Finally, the relative damage risk between the orientations remains constant between the historical period and future projections. This means that the critical orientation is not projected to change over the course of the 21st century.
3.3. Projected Damage Risks in Solid Masonry
3.3.1. Freeze-Thaw Damage
The freeze-thaw risk in solid masonry is generally decreasing for the SW orientation, as illustrated in
Table 4. The negative change is the largest for RCP 8.5, i.e., on average −20 FTC
crit per year (−58%) over the entire sample, followed by RCP 4.5 and RCP 2.6, with on average −10 (−28%) and −5 (−13%) cycles per year, respectively. Only occasionally, an increase of maximum 3 FTC
crit per year is observed.
For solid masonry walls that do not show signs of freeze-thaw damages, it is likely that they will not sustain considerable freeze-thaw damage in the future. However, freeze-thaw damage, as most moisture-related damages, has a cumulative nature. Micro-cracks that are already present in the masonry due to critical freeze-thaw action over the course of the masonry’s life span may become visible later on. Additional freeze-thaw cycles, even at a lower rate, may still induce some freeze-thaw damage.
The order of the increasing impact of climate change on the freeze-thaw risk, i.e., RCPs 2.6, 4.5 and 8.5, is the same as for the increasing projected greenhouse gas emission. For Brussels, it is found that the increase in temperature induces a decrease in freeze-thaw action. The increase in the WDR load during winter does not increase the projected freeze-thaw risk but probably acts as a mitigating factor in the climate change impact on the number of FTCcrit in the solid masonry.
Furthermore, the range of absolute climate change impact considering all simulated cases per projection is wide. For RCP 8.5, the range goes from −43 to 0 FTCcrit per year based on the 5th and 95th percentiles. This means that the number of yearly mean FTCcrit is projected to decrease considerably in some cases, whereas no change is projected in other cases. The range of yearly mean FTCcrit is smaller for RCP 4.5 and the smallest for RCP 2.6.
3.3.2. Mould Growth
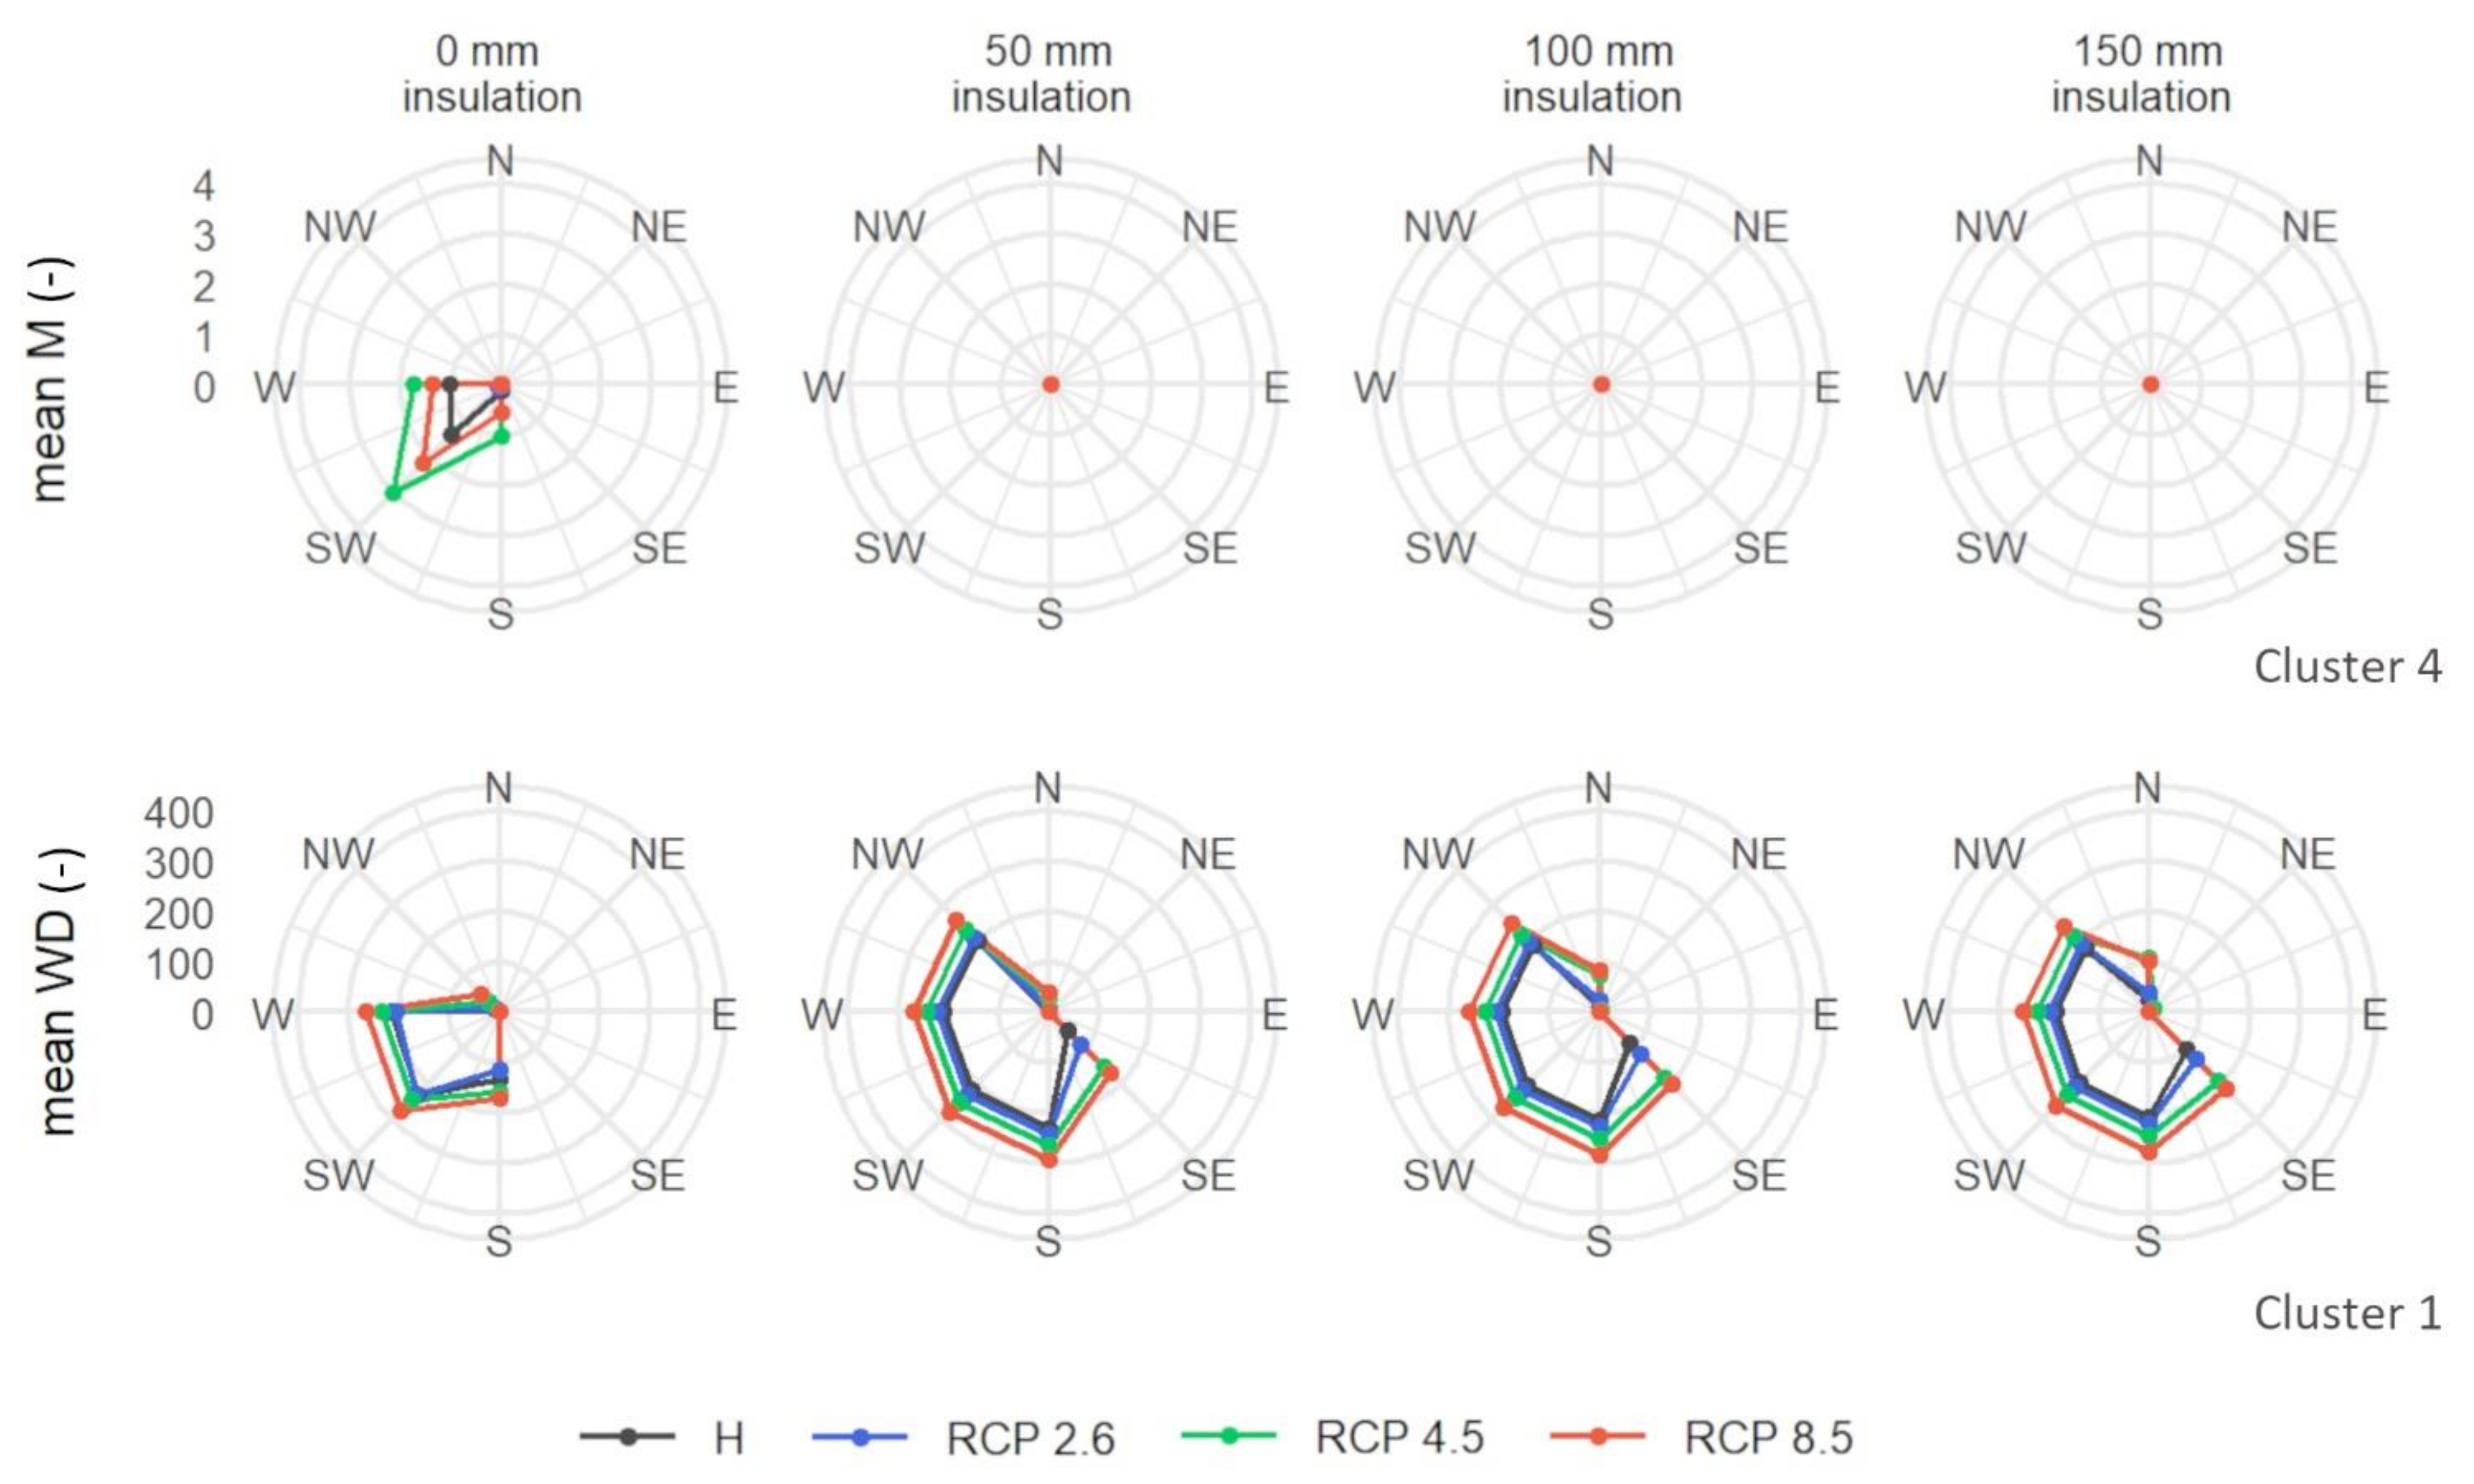
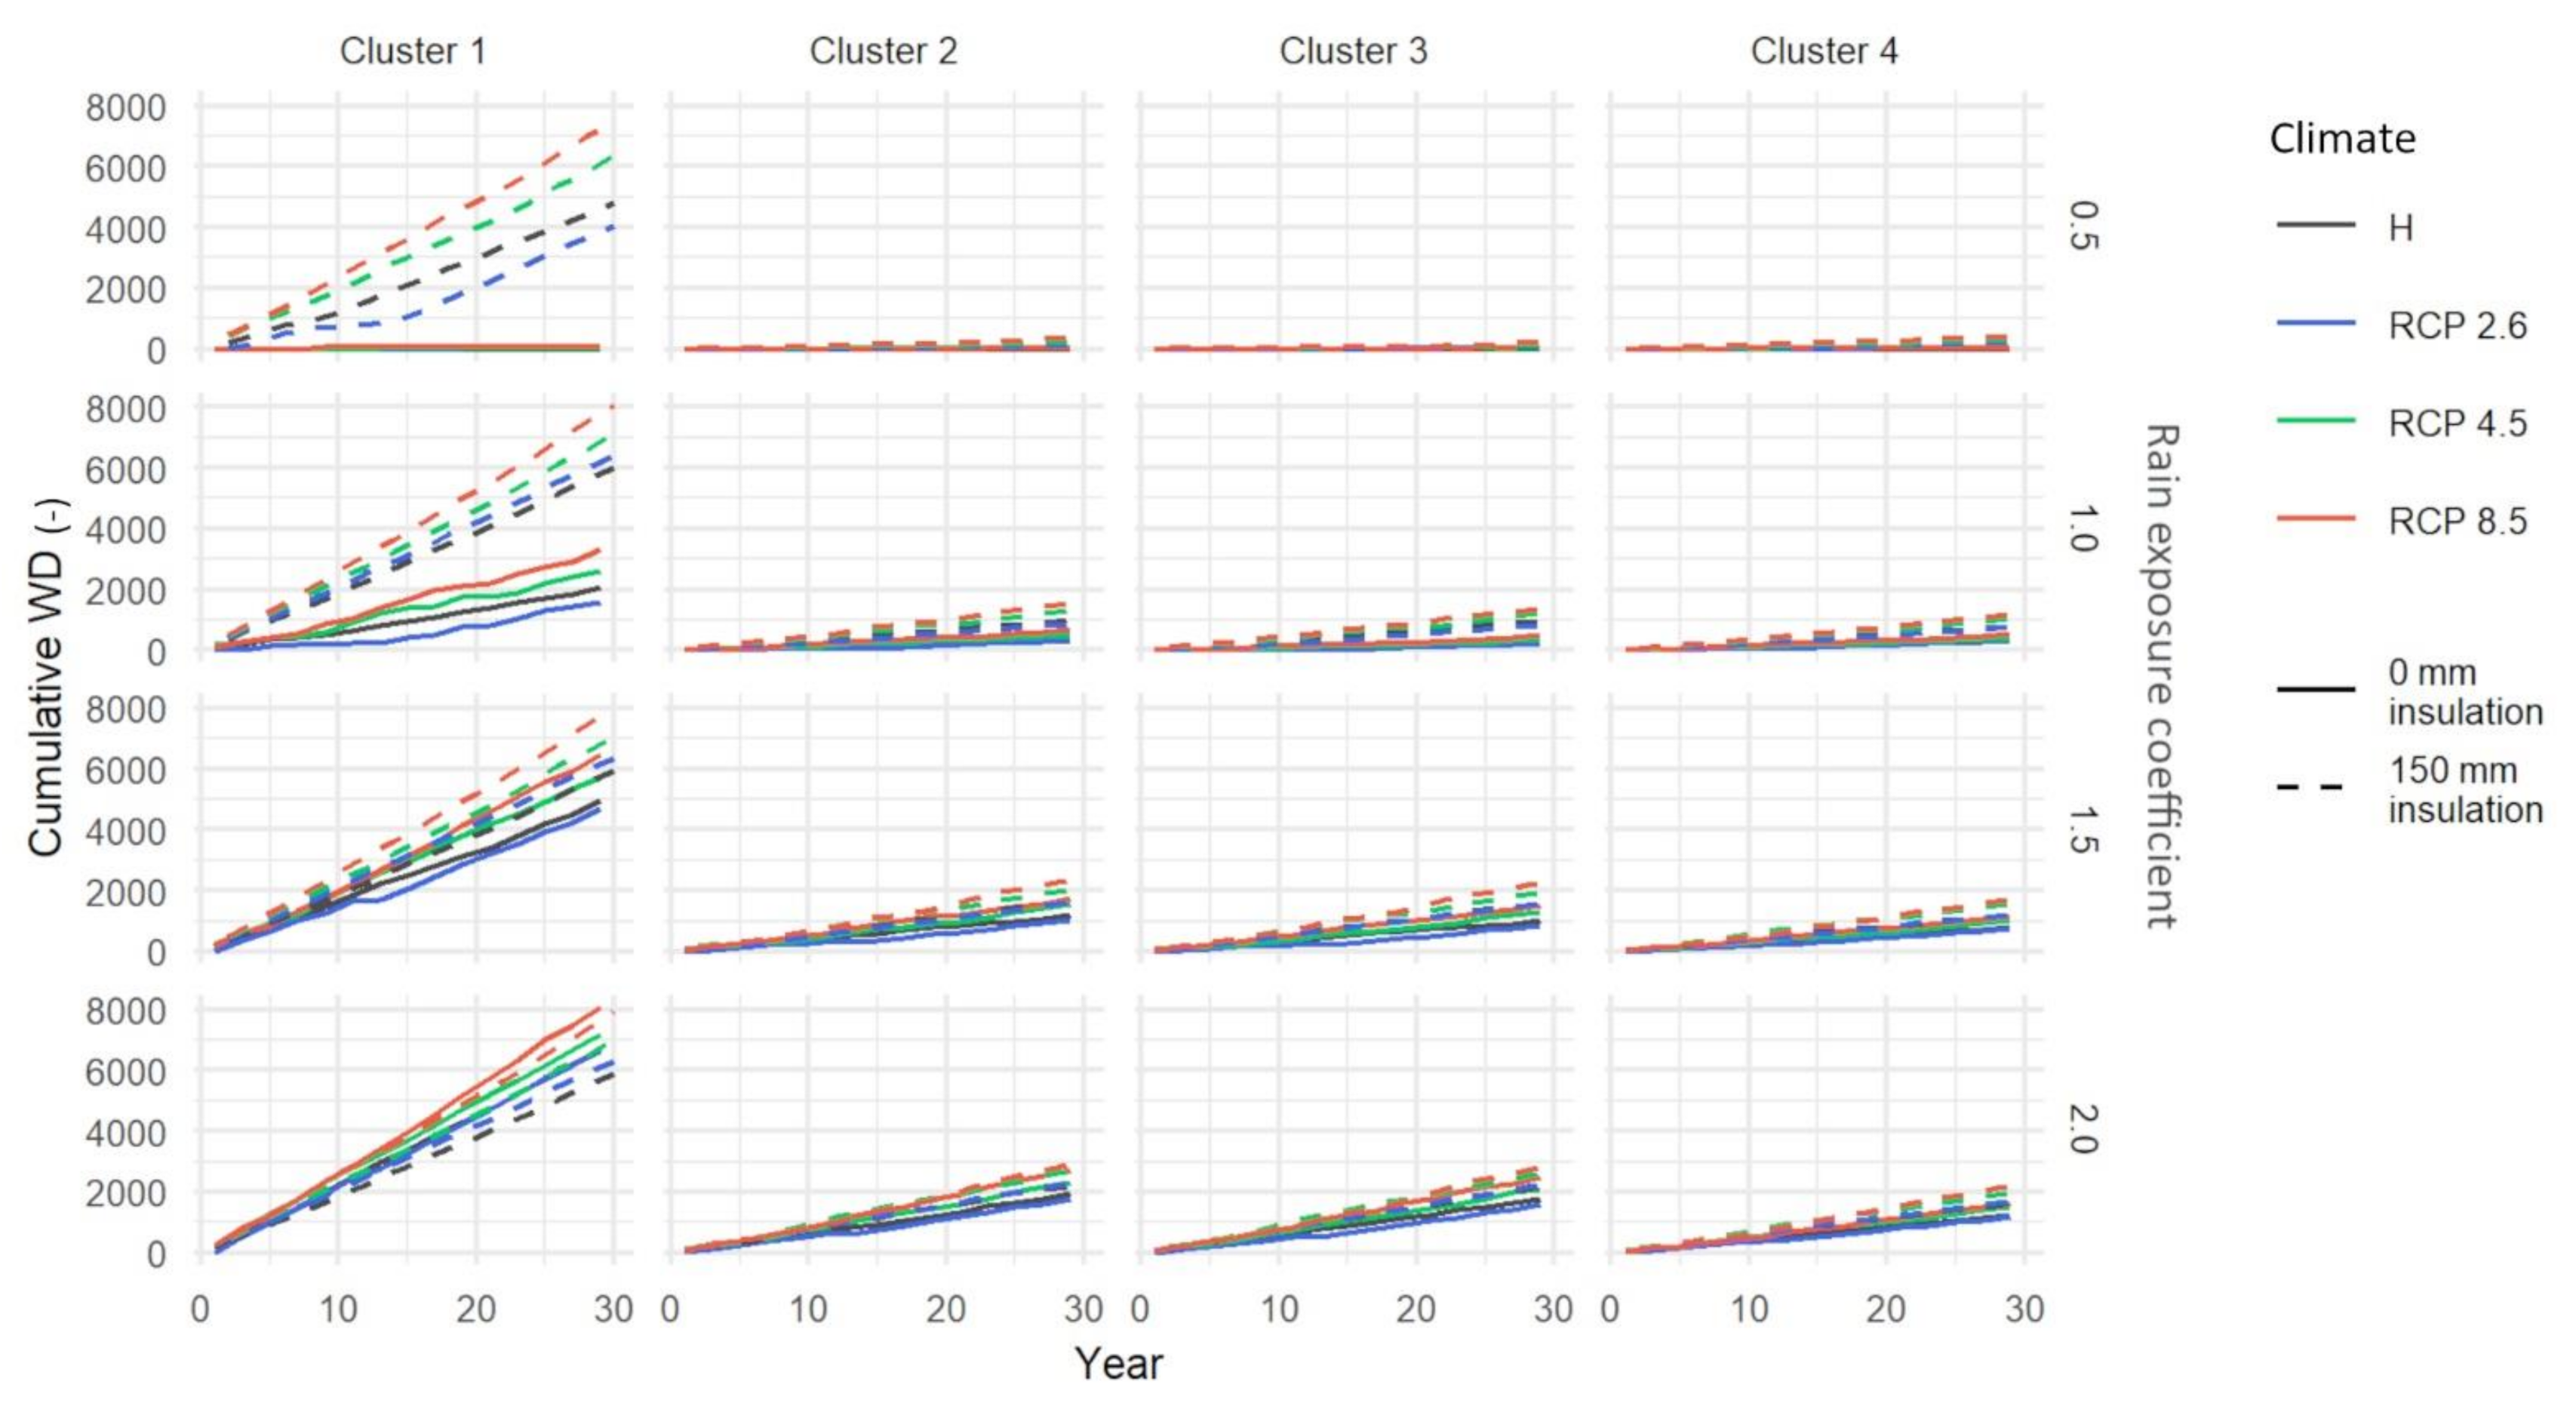
Mould growth on the interior wall surface is only an issue for uninsulated walls. This is illustrated for a 300 mm masonry wall of brick cluster 4 and rain exposure coefficient 2.0 (
Figure 4) but is also observed for the other simulated cases. In the insulated cases, the temperature and relative humidity at the interior wall surface remain below the threshold values due to the presence of insulation and a vapour barrier. When mould growth is further discussed in this study, only the uninsulated masonry wall is considered.
There is an increase in the yearly average M for RCPs 4.5 and 8.5, whereas there is a decrease for RCP 2.6 (
Table 5). M increases more for RCP 4.5 than for RCP 8.5 when considering the mean and 95th percentile. It is found that the future risk on mould growth depends on the RCP scenario. Since the evolution of future greenhouse gas emissions and concentrations is unknown, the worst-case scenario is to assume that there is an increase in M at the interior wall surface.
3.3.3. Wood Decay
The absolute and relative change in wood decay 100 mm from the interior masonry surface has the same signal for RCPs 4.5 and 8.5, i.e., an average and 95th percentile increase of 22% and 53% (RCP 4.5) and 37% and 97% (RCP 8.5), respectively (
Table 6). For RCP 2.6, on the other hand, the wood decay is decreasing by 3% and 18%, respectively. As for mould growth, the change in risk on wood decay highly depends on the RCP scenario. However, in this case, the increase is the largest for RCP 8.5.
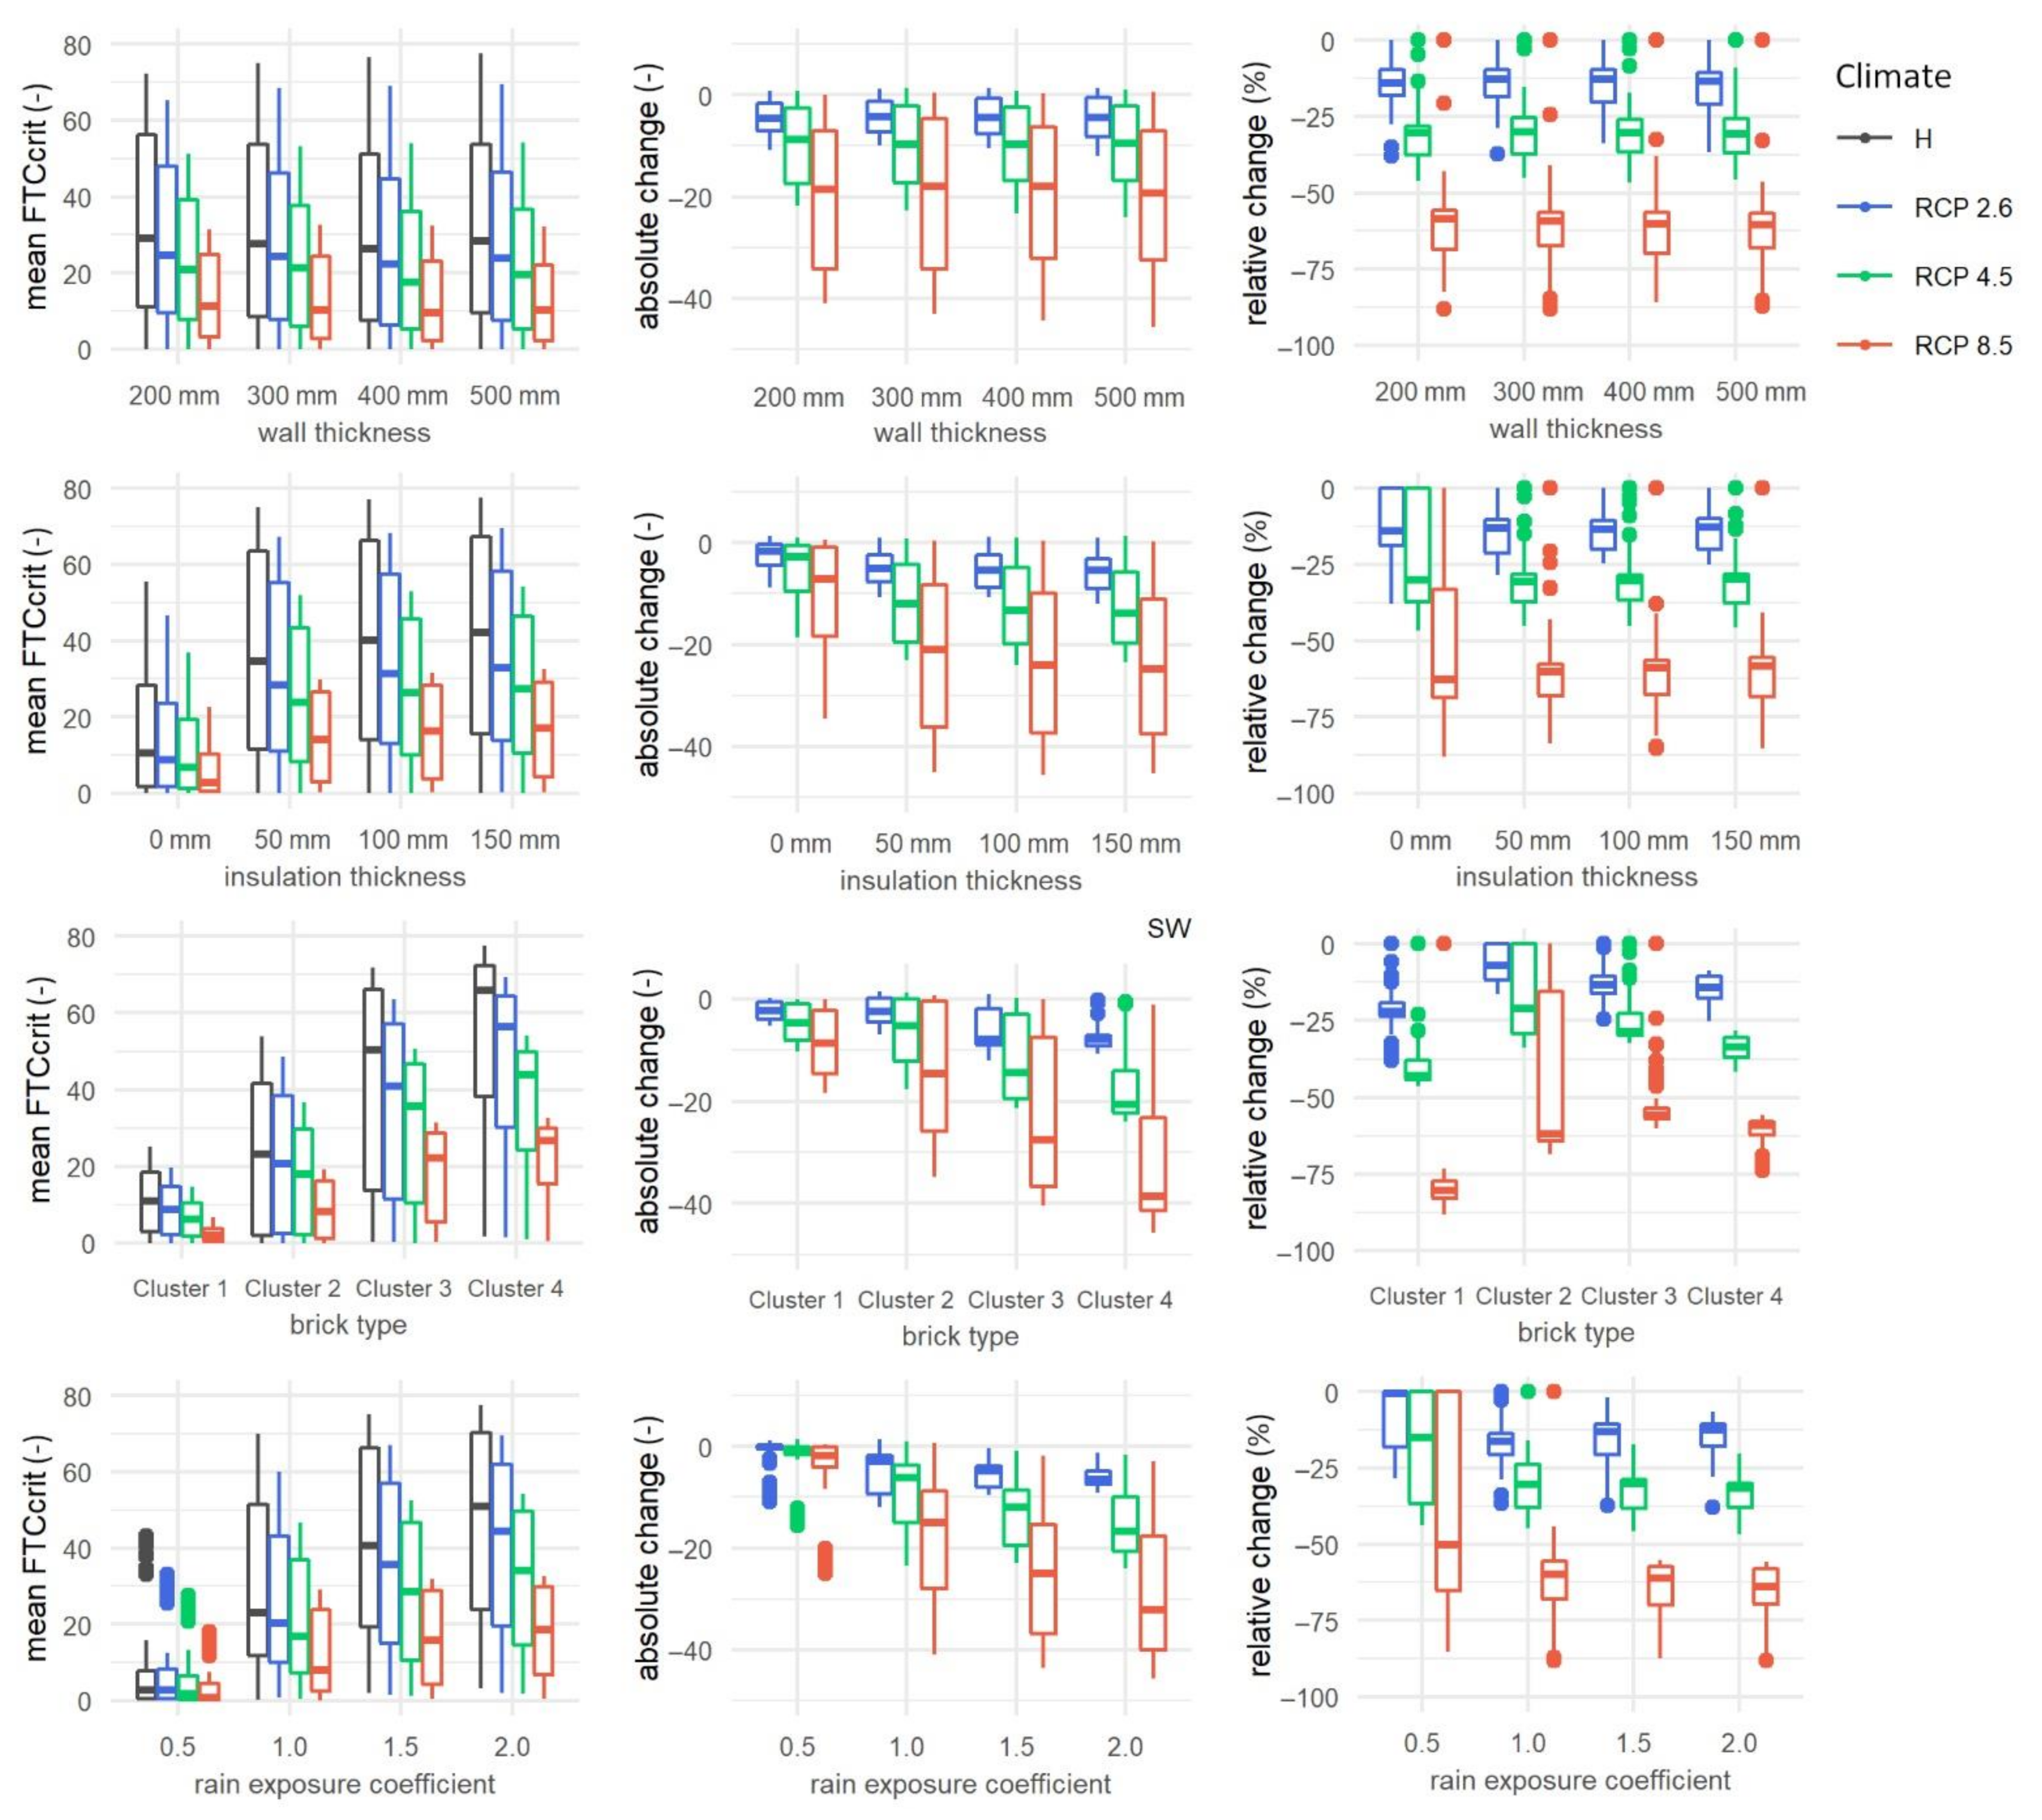
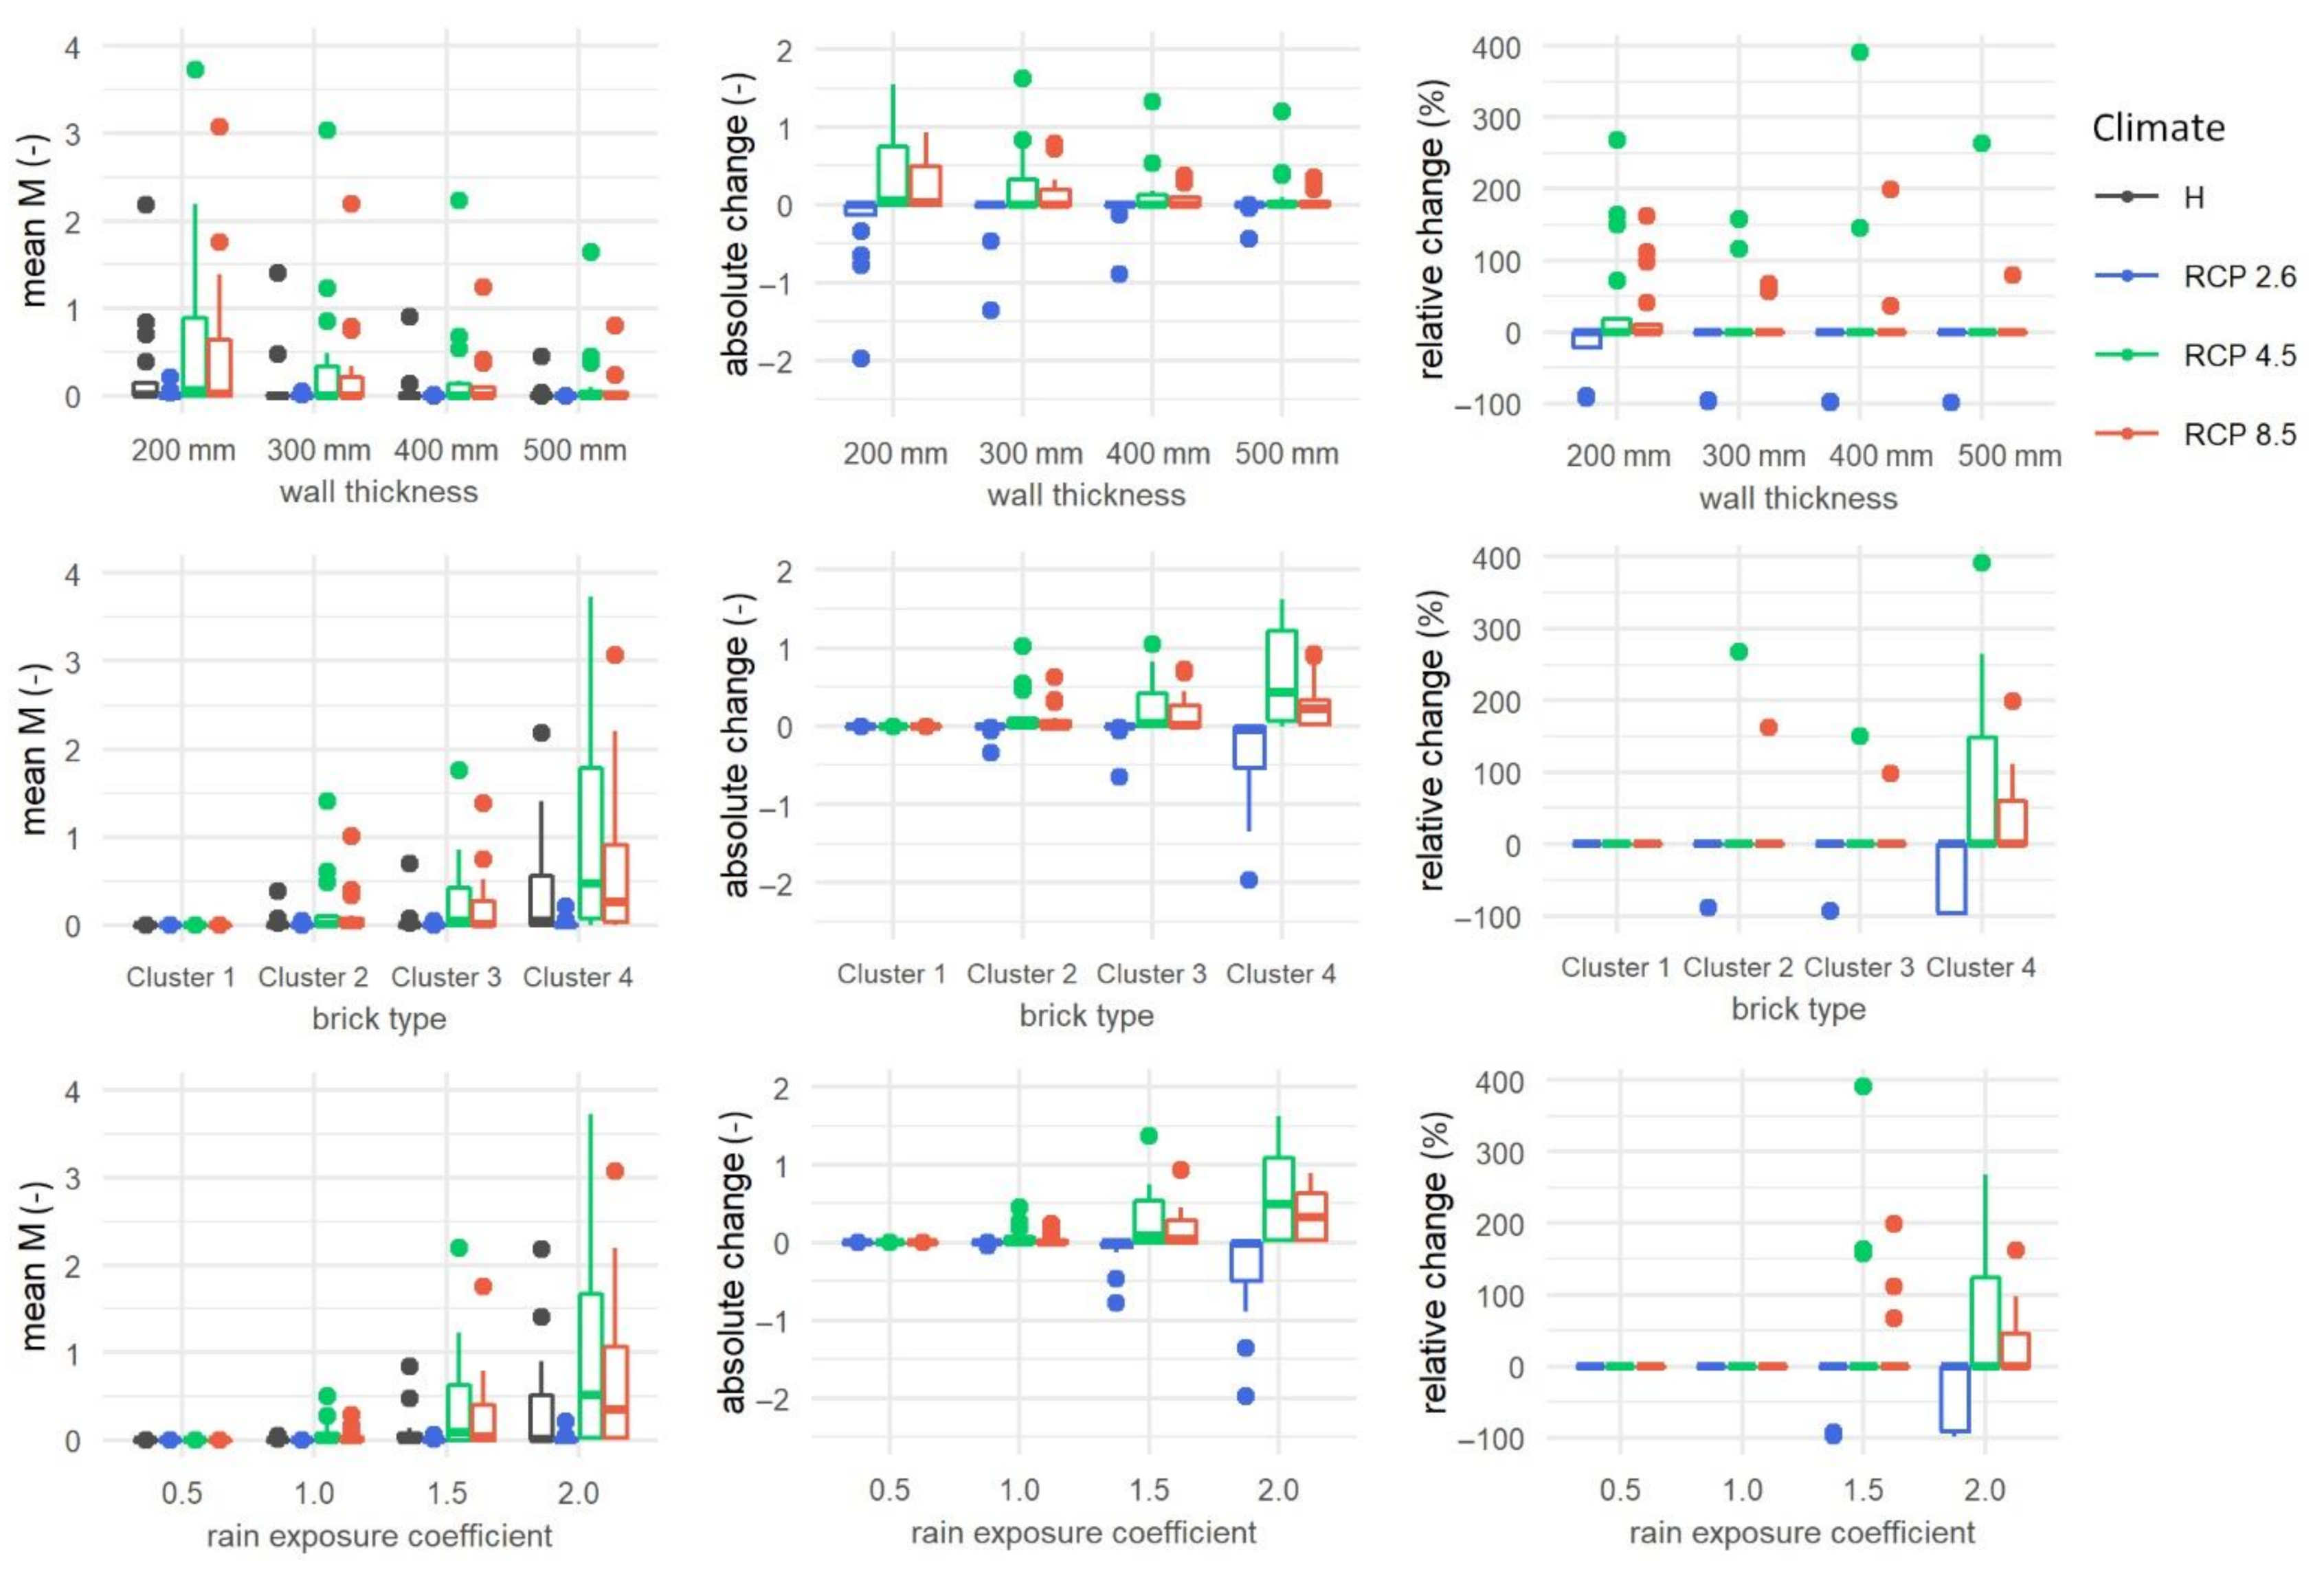
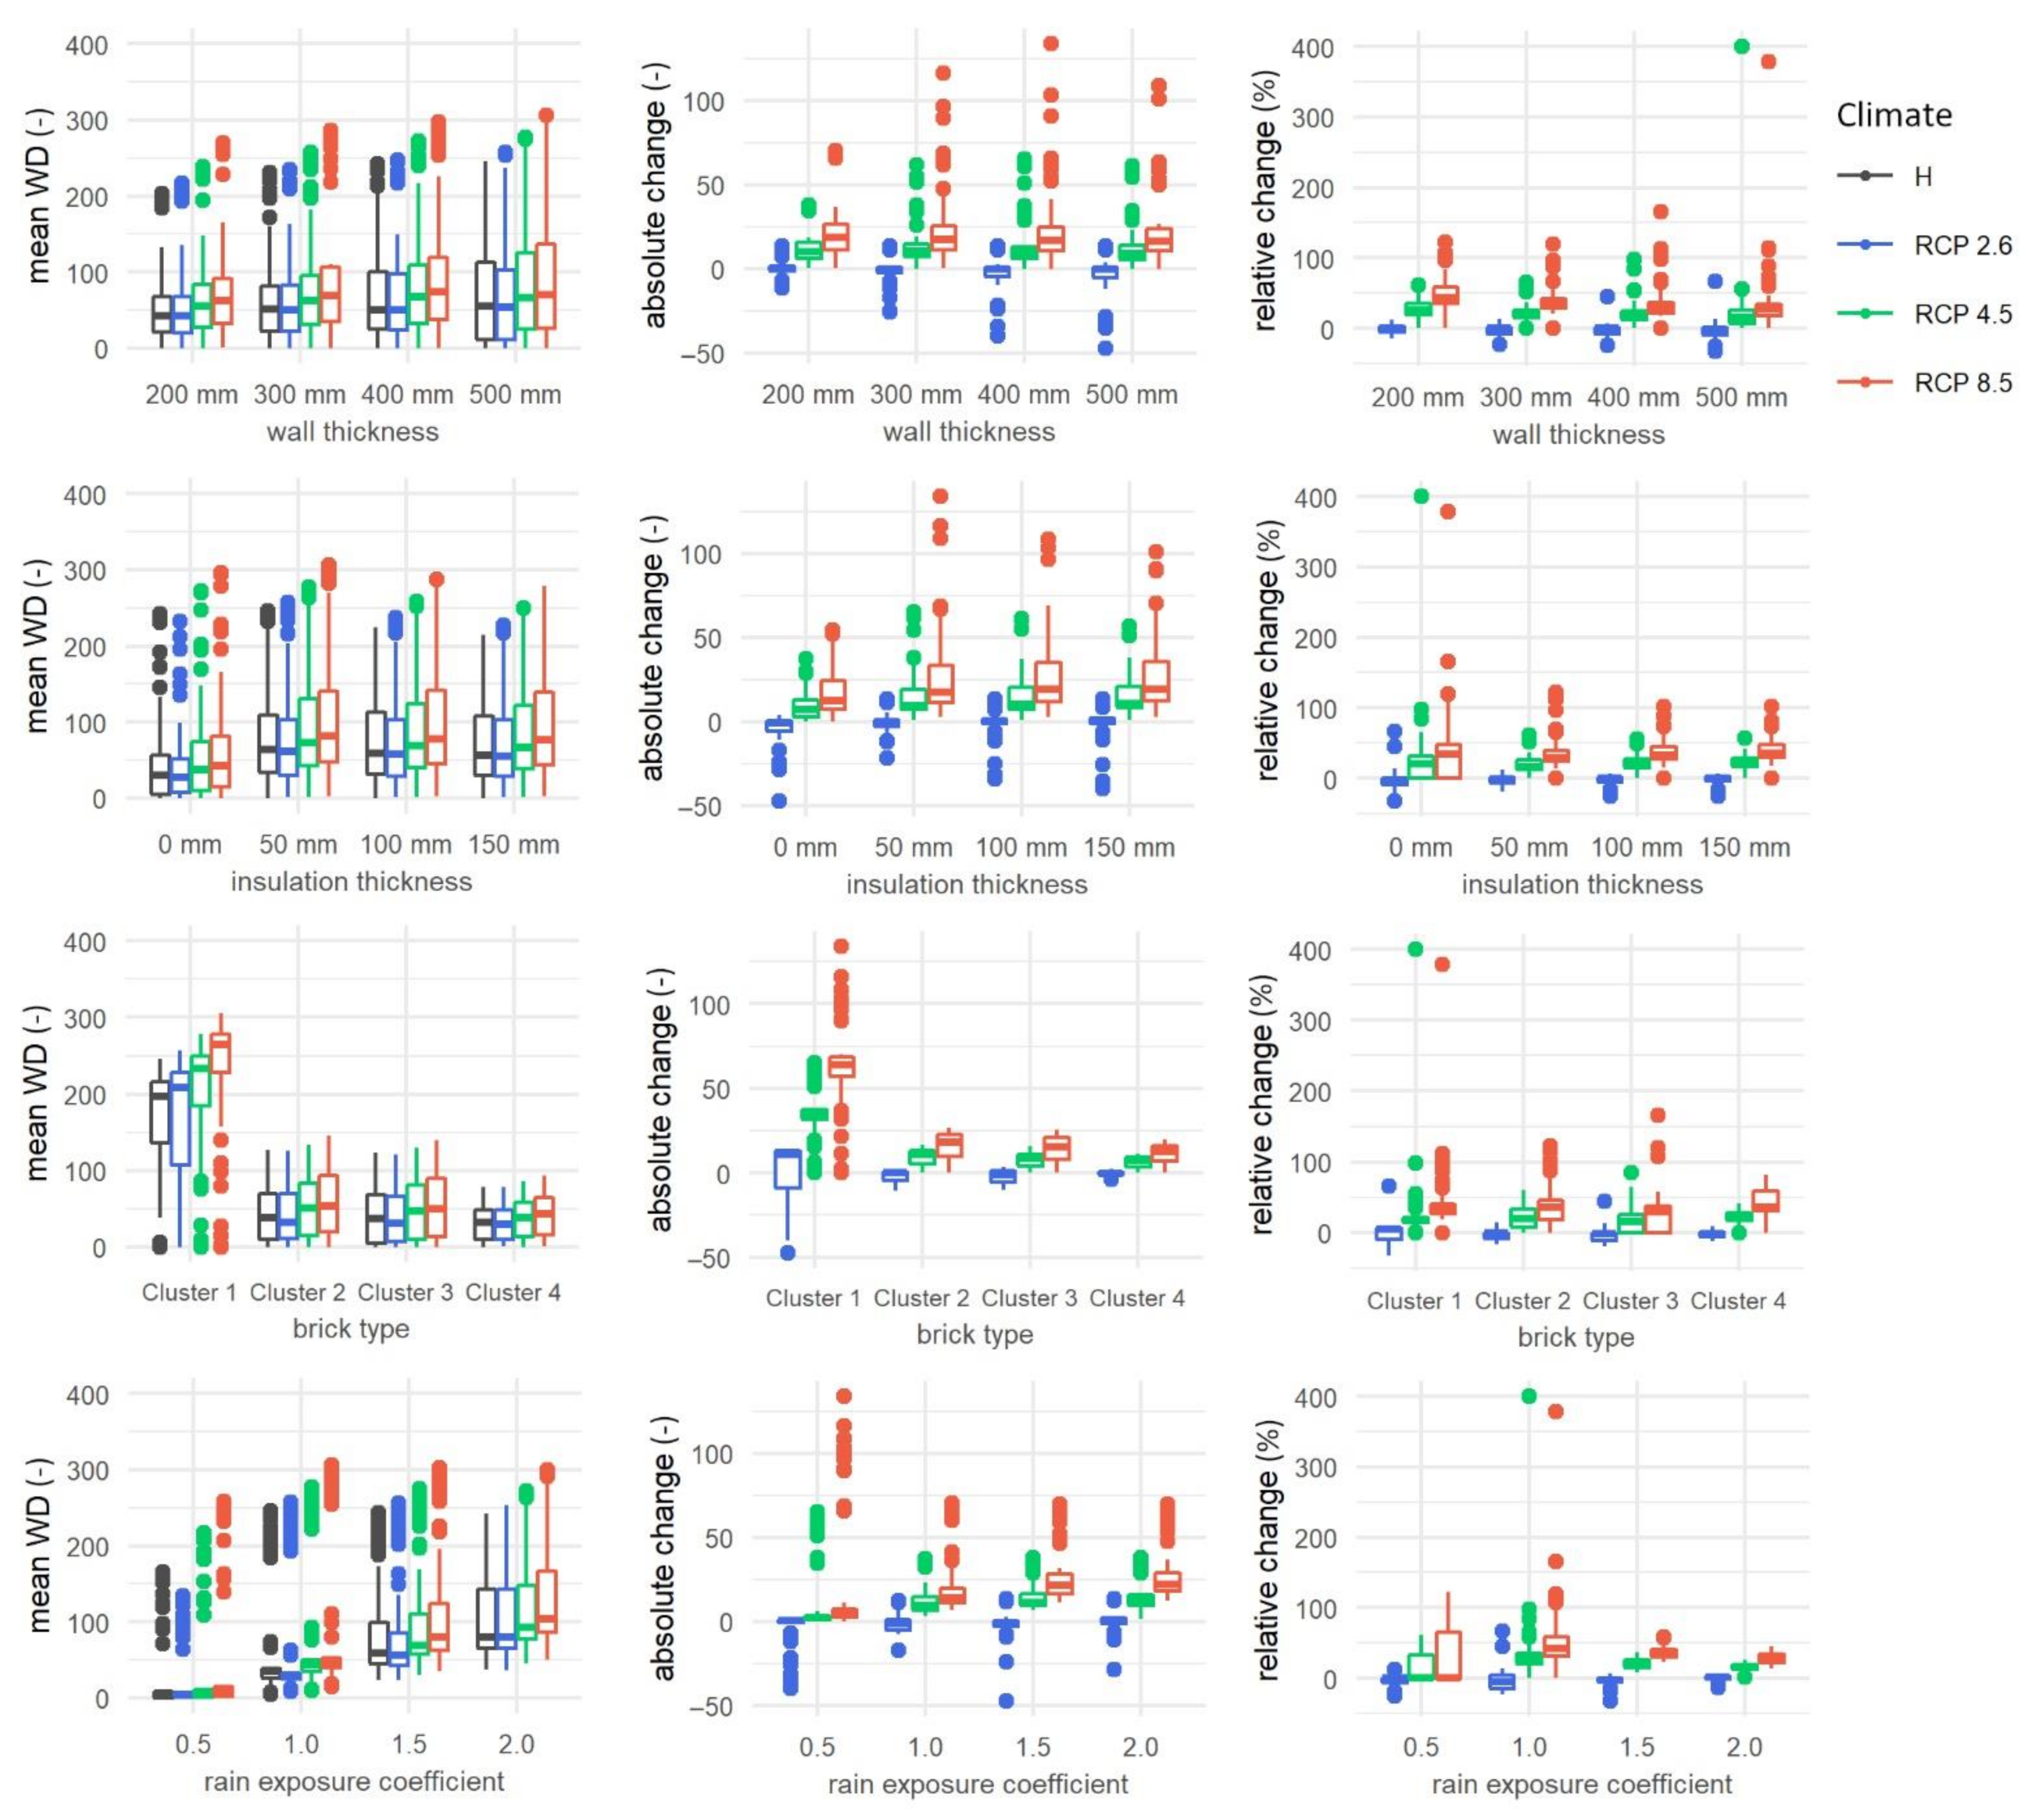
3.4. Sensitivity of the Impact of Climate Change to Parameter Variations
When performing studies on the impact of climate change on the durability of solid masonry walls, it is often not feasible to perform a full factorial study due to computational constraints. Therefore, we analysed how sensitive the climate change impact is to the variation in different parameters. This allows one to determine which parameters should be varied more in detail and which can just be represented by one or two values. The variation in wall orientation (discussed in
Section 3.2, Critical Orientation), masonry thickness, brick type, insulation thickness and rain exposure coefficient are considered for the historical period and 3 projections, as listed in
Table 1. The distributions of the yearly mean FTC
crit, mean M and mean WD are reported in
Figure 5,
Figure 6 and
Figure 7.
3.4.1. Freeze-Thaw Damage
The distribution in yearly mean FTCcrit is similar for the different wall thicknesses, as are the absolute and relative climate change impacts, i.e., on average −58% for RCP 8.5. The same is observed for the insulation thickness, excluding the uninsulated case. The average change for the three insulated walls is −60%, whereas the uninsulated wall results in a decrease of −51% (RCP 8.5). However, the median decrease is larger for the uninsulated wall. In addition, the range of the uninsulated wall, i.e., approximately from −0% up to −90%, is considerably larger than the insulated walls, excluding the outliers, which goes from about −40% to −80%.
The difference in distribution between the brick types is considerable. In decreasing order, the freeze-thaw risk and absolute change are the highest for brick clusters 4, 3, 2 and 1. This means that cluster 4 has a high freeze-thaw risk but also results in a high absolute decrease in yearly mean FTCcrit. The relative changes are on average −74%, −46%, −50% and −61% (RCP 8.5) for clusters 1 to 4, respectively. Note that the range of relative climate change impact is narrow for the different brick types, except for brick cluster 2 and for some outliers. The brick type is the dominant parameter for the relative change in FTCcrit.
Furthermore, the rain exposure coefficient illustrates considerable differences in the distribution of the freeze-thaw risk. The yearly mean FTCcrit becomes higher for larger values of the rain exposure coefficient, as does the absolute change in the freeze-thaw risk. The relative changes in the yearly mean FTCcrit are on average −41%, −61%, −65% and −65% for RCP 8.5, for a rain exposure coefficient of 0.5 to 2.0. For higher rain exposure coefficients, the relative change differs less since the critical saturation degree is exceeded more often. However, this is related to the selected freeze-thaw criterion and may differ if another criterion would have been selected.
It is found that simulating only one wall thickness for the uninsulated masonry wall and one insulated case is sufficient to represent the distribution of the impact of climate change on solid masonry. On the other hand, it is important to determine the brick type, as well as rain exposure coefficient. Given that this is not always feasible, a sensitivity analysis should be performed to assess the range of climate change impact.
3.4.2. Mould Growth
The distribution of the annual average M at the interior wall surface of uninsulated walls as well as the change towards the end of the 21st century depend on the wall thickness, brick type and rain exposure coefficient. Between the different wall thicknesses, M is the largest for the 200 mm wall, as is the change for the different projections. This is expected since moisture from WDR events has a higher chance of reaching the interior surface for thinner walls. Of the four brick types, cluster 4 is most at risk. Further, M increases with an increasing rain exposure coefficient, as higher rain exposure coefficients lead to deeper moisture diffusion in the wall. Except for some outliers, the absolute and relative change in the yearly average M is low for masonry walls thicker than 300 mm, for brick type clusters 1 and 2 and for rain exposure coefficients smaller than or equal to 1.0.
3.4.3. Wood Decay
The distribution in the annual average WD increases with increasing wall thickness. The distribution of relative change, on the other hand, decreases with increasing thickness, except for the outliers.
Considering the insulation thickness, there is a distinction between the uninsulated cases and interior insulated cases as for the annual average FTCcrit. The distribution of the annual average WD, absolute change and relative change is similar for insulated walls with different insulation thicknesses.
The distribution of the cluster materials is different than for the annual average FTCcrit and M. However, as for the other two damage mechanisms, it is important to know the brick type when performing climate change studies on masonry walls. The highest risk is found for cluster 1, followed by clusters 2 and 3, whereas the yearly average WD for cluster 4 is the lowest.
Finally, the distribution of yearly average WD increases with an increasing rain exposure coefficient, as for the annual average FTCcrit and M. Again, this is also the case for the absolute change except for the outliers, but not for the relative change. The largest relative changes are found for rain exposure coefficients of 1.0.
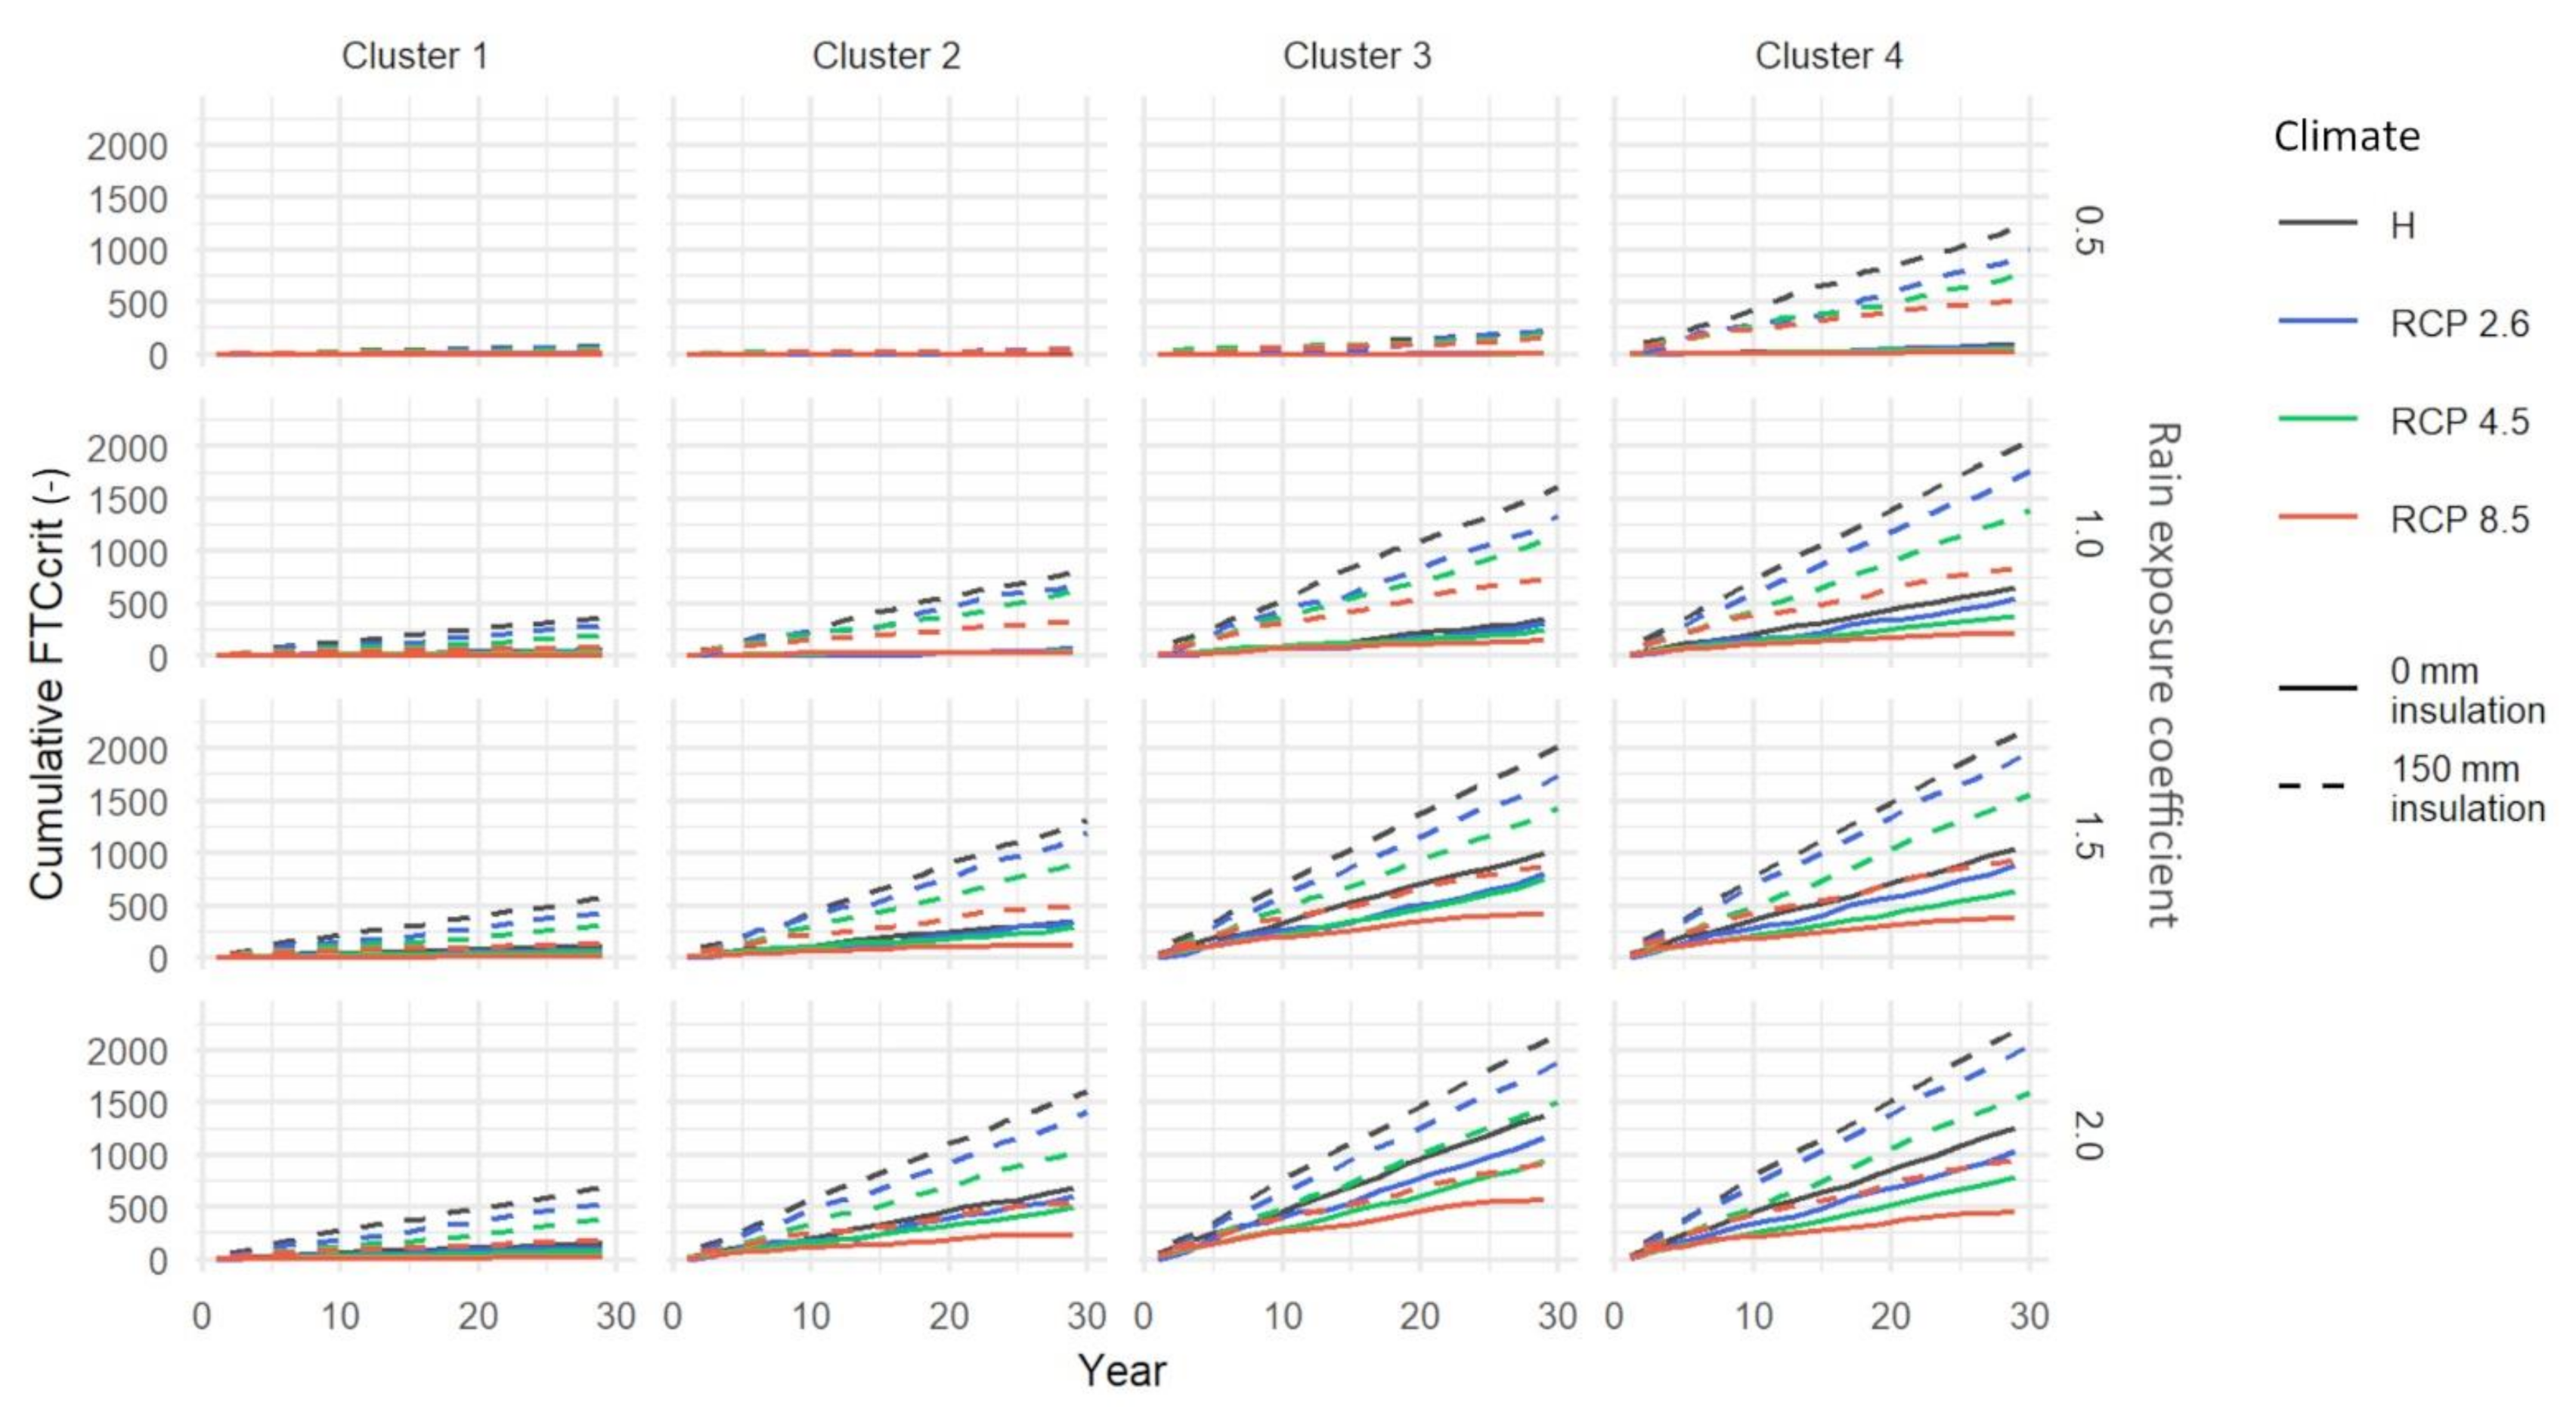
3.5. Interior Retrofitting of Solid Masonry
The question arises under which circumstances it is safe to apply internal insulation to solid masonry walls, when taking into account the projected climate change. The historical uninsulated 300 mm walls are compared to the insulated projected scenarios in
Figure 8 and
Figure 9. Since there is no mould growth on the interior wall surface of the interior insulated walls, only freeze-thaw damage and wood decay are considered here.
It is observed that in some cases, the damage risk is negligible for both the uninsulated and internally retrofitted masonry walls during the historical and future periods. In those cases, it is considered safe to apply interior insulation. This is the case if the rain exposure coefficient is low, i.e., equal to 0.5. However, it does not apply for all brick types in the case of freeze-thaw damage. Especially for cluster 4, the number of FTCcrit increases considerably after the application of internal insulation. For wood decay, on the other hand, the results report a negligible risk for cluster 4 at all rain exposure coefficients.
Further, in some cases, the number of FTCcrit for the uninsulated wall during the historical period is equal to or higher than the number of FTCcrit for the internally retrofitted wall during the future period. This means that the increase in the freeze-thaw risk due to the application of internal insulation is compensated by changing climate conditions and thus the changing hygrothermal behaviour of the masonry. This is the case for RCP 8.5 when the rain exposure coefficient is 2.0. For some brick types, i.e., clusters 3 and 4, it already occurs at a rain exposure coefficient of 1.5 (RCP 8.5). In one case, the projected number of FTCcrit of the retrofitted wall for RCP 4.5 is equal to the historical freeze-thaw risk of the uninsulated wall.
Whether the historical uninsulated wall exhibits a larger freeze-thaw risk than the projected insulated case is highly related to the RCP scenario, brick type and rain exposure coefficient. Therefore, it is concluded that the risk of freeze-thaw damage after the application of internal insulation is generally not compensated by climate change.
Furthermore, in none of the combinations between brick type and rain exposure, the increase in the WD due to interior insulation is compensated by climate change. This is also the case for walls having a different masonry or insulation thickness.
4. Discussion
The impact of climate change on the risk of damages to solid masonry walls in Brussels, Belgium, is assessed. The analysis is based on the ALARO-0 Regional Climate Model for RCPs 2.6, 4.5 and 8.5. A factorial study of 8192 simulations is performed for the variation in the following parameters: climate, wall orientation, wall thickness, brick type, insulation thickness (including the uninsulated case) and rain exposure coefficient. The damage mechanisms are freeze-thaw damage 5 mm from the exterior wall surface, mould growth at the interior wall surface and wood decay 100 mm from the interior masonry surface. Although the results in this study are based on theoretical cases, they provide information that can be used in other contexts.
Vandemeulebroucke et al. stated that the critical orientation is not always equal to the critical WDR orientation and that the critical orientation may change in the future [
14]. This may occur when there is a shift in distribution of the WDR load between orientations or between seasons. For example, the increase in the WDR load on northern facades during winter may increase the freeze-thaw risk, whereas the freeze-thaw risk decreases for other orientations. In Brussels, however, the distribution of the WDR load between orientations and seasons does not change considerably. The critical orientation is equal to the critical WDR orientation and does not change between the historical period and future projections. When this is the case, a proper solution for conservation or retrofitting of solid masonry facades only needs to be developed for the critical orientation. This solution is suitable for the other orientations as well.
Secondly, the freeze-thaw risk in the solid masonry is generally decreasing for Brussels, but zero change is observed as well. The impact of climate change on mould growth and wood decay, on the other hand, highly depends on the RCP scenario, i.e., an increase for RCPs 4.5 and 8.5 and a decrease for RCP 2.6. Since future greenhouse gas emissions and concentrations are unknown, the worst-case scenario is to assume that the freeze-thaw risk is constant and that mould growth and wood decay will increase towards the end of the 21st century. In practice, there are more parameters influencing the hygrothermal behaviour of the building envelope than the ones varied in this study. Therefore, it is recommended to perform hygrothermal simulations for the specific case at hand. However, the results in this study can already provide an indication of the change in performance of solid masonry walls in a similar climate to that of Brussels.
Further, it is studied whether interior insulation is a good practice in the future. It is found that the increase in damage risk resulting from the application of internal insulation is generally not compensated by the effects of climate change. However, the cases not sustaining damages after interior insulation during the historical period are considered safe in the future as well.
It is known that performing hygrothermal simulations involves uncertainties. The uncertainties in the results can be diminished by reducing the uncertainties in the input parameters. For freeze-thaw damage and wood decay, it is found that the brick type and rain exposure coefficient are the most important parameters. In the ideal case, a full characterisation of the material is made. Although this is not feasible in practice, determining some of the material properties already improves the results considerably. For example, the absorption coefficient can be determined by laboratory experiments based on EN ISO 15148 [
40] or by situ tests such as the Rilem pipe [
41,
42]. Note that the in situ tests only provide an indication of the material property and cannot be used to actually characterise the material. Determining the rain exposure coefficient, on the other hand, is not straightforward. It can be measured using WDR gauges, but this is not common practice. To assess the uncertainty in the results due to the rain exposure coefficient, a sensitivity analysis has to be performed. Further, the wall thickness is important when assessing the climate change impact on mould growth on the interior wall surface of uninsulated walls. Thinner masonry walls are more at risk for mould growth.
Alongside the uncertainties related to hygrothermal simulations, the climate model induces uncertainties as well. Therefore, a future study will be performed using an ensemble of climate models, i.e., the collection of different climate models, to assess the model uncertainty. In addition, a future study will focus on more locations across the European domain. Which parameters are dominant for other locations will be evaluated, and the geographical spread of damage risks in solid masonry walls is projected to change towards the end of the 21st century based on different RCP scenarios.
In this study, the solid brick masonry is assumed to have no cracks, deficiencies, infiltrations, etc. In practice, the performance of masonry has been found to vary considerably [
43]. Poor craftsmanship, the combination of incompatible materials or defects can have a major impact on the durability of wall assemblies. For uninsulated masonry, Calle found that water infiltrations increase the risk of wood decay and mould growth [
23]. Further, the hydrophobic treatment of the facade plays an important role in the hygrothermal behaviour of a solid masonry wall. The overall damage risk is diminished by the hydrophobic layer since it limits moisture uptake. However, local infiltrations may increase the risk of damages considerably. These occur, e.g., at cracks in the brick masonry or at the interface between brick and mortar. Note that to improve the link between hygrothermal simulations and actual buildings, and to enable accounting for cracks, deficiencies, infiltrations, etc., more experimental work is needed. Such work has been done in the HeLLo research project by developing a Hot Box for the in situ hygrothermal measurement on dynamical conditions in historical masonry buildings [
44,
45].


