Article

Assessing the Moisture Load in a Vinyl-Clad Wall Assembly through Watertightness Tests

1
National Research Council Canada, Institute for Research in Construction, Ottawa, ON K1A 0R6, Canada
2
Civil Engineering Department, University of Ottawa, Ottawa, ON K1N 6N5, Canada
*
Author to whom correspondence should be addressed.
Buildings 2021, 11(3), 117; https://doi.org/10.3390/buildings11030117
Submission received: 28 February 2021 / Revised: 10 March 2021 / Accepted: 11 March 2021 / Published: 16 March 2021
(This article belongs to the Special Issue Climate Resilient Buildings)

Abstract

:
The moisture load in wall assemblies is typically considered as 1% of the Wind Driving Rain (WDR) load that is deposited on the surface of wall assemblies as specified in the ASHRAE-160 standard whereas this ratio has been shown to be inaccurate as compared to results derived from several watertightness tests. Accurate assessment of moisture loads arising from WDR can be obtained through the watertightness test during which different levels of WDR intensities and Driving Rain Wind Pressures (DRWPs) are applied to a test specimen and water that penetrates wall assembly can thus be quantified. Although many previous studies have included watertightness tests, only a few of these have attempted to correlate the moisture loads to WDR conditions as may occur in specific locations within a country. To improve the assessment of moisture loads for a vinyl-clad wall assembly, a wall test specimen was tested following a test protocol based on local climate data using National Research Council of Canada’s Dynamic Wind and Wall Testing Facility (DWTF). The use of this test protocol permitted quantifying the moisture load in the vinyl wall assembly when subjected to several different simulated WDR conditions. The moisture load was formulated as a function of the WDR intensity and DRWP which thereafter allowed evaluating the moisture load based on a given climate’s hourly rainfall intensity and wind velocity. Such work is particularly relevant considering that the intensity, duration and frequency of WDR events across Canada will in some regions increase due to the effects of climate change.

1. Introduction

The long-term moisture performance and hence, durability of building façades are adversely affected by the moisture load, in particular those arising from the wind-driven rain (WDR) [1,2,3]. This is particularly relevant considering that the intensity, duration, and frequency of WDR events across Canada will in some regions increase due to the effects of climate change. Hygrothermal simulation models are often used as a means to assess the long-term performance of building facades and facade components. The simulation models do however require inputs of the moisture load which can be obtained from either of two typical approaches. The first is to simply consider the moisture load as 1% of the WDR load that is deposited on the exterior surface of the wall assembly as specified in the ASHRAE-160 Standard [4]; and, the other approach is to directly measure the amount of water that has penetrated into a wall assembly during watertightness testing of a test specimen. Rainwater that is deposited on building surfaces can be absorbed and accumulated by porous materials or can run off from the facade surface. In respect to the moisture load in porous materials, it may lead to frost damage [5], salt migration [6] or discoloration [7] of the material. In respect to run off, water can penetrate the exterior surface of the building facade when deficiencies are present and result in mold growth at the interior surface of the cladding [8] or decay of wood-based materials [9].
A watertightness test simulating WDR is commonly used to investigate the performance of standard size wall assemblies [10,11,12,13], to their resistance to water entry, and perhaps as well, quantify the rate of water entry across wall cladding into the wall assembly [14,15,16]. Additionally, such tests can be performed at different pressure and water spray rates, thereby replicating a range of WDR conditions that may exist, and to which the exterior surface of a wall assembly may be subjected during a rain event. Facilities to implement such types of tests impose a pressure difference across the test specimen by aid of a pressure chamber [17], aero engines [18], or both. These devices are used to replicate the static and dynamic wind effects to which a building facade would be subjected from the action of wind on the building in an exposed environment. At the same time, the WDR can be replicated by a water spray system integrated to the experimental facility. The simultaneous actions of both systems in a test set-up are considered as the WDR load acting on the wall assembly. It is usual for a WDR laboratory test to comply with a test protocol, as following this protocol would have an impact on the water entry results [19]. It would permit experimental conditions in the test facility to be repeatable as test conditions would be clearly defined and generated by calibrated devices employed in the laboratory. As such, different types of specimens can be tested using the predefined set of WDR conditions and test results obtained can then be readily compared. A watertightness test protocol ought, however, to be developed on the basis of climate loads, where the water deposition to the wall surface can be obtained from existing semiempirical equations relating water deposition to the WDR load to the wall [4,20,21].
According to the results obtained from previously conducted watertightness tests [14,15,22], the water entry rates for different types of wall assemblies and having different configurations varied significantly. It was evident that the water entry rates as measured were greatly affected by water spray rates and pressures applied to the exterior surface of the wall assembly. Several studies [14,23,24,25] have established mathematical expressions to describe the relation between the water entry rate and simulated WDR intensities and DRWPs. Sahal and Lacasse [14] established a systematic approach to derive the water entry equation based on the results of a watertightness test for a hardboard siding-clad wall assembly. The water entry load Q (L/min) into the stud cavity of the test specimen was defined as the product of water entry potential mp and the spray rate Rp, as shown in Equation (1).
Q = m p × R p
The water entry potential, mp, was an empirical function using the static pressure differences across the wall assembly as the variable and the constant factors which were derived from fitting a cubic polynomial to the results of the watertightness test. Equation (2) shows the water entry potential for the tested hardboard siding-clad wall assembly in which ∆P (Pa) is the static pressure difference across the assembly.
m p = 3 × 10 11 ( Δ P ) 3 8 × 10 7 ( Δ P ) 2     + 5 × 10 5 ( Δ P )     + 0.0123
The water entry rates were accurately captured using this approach where rates of water entry were determined for different rates of water spray and for given pressure differences across the wall assembly. However, the constant factor in the water entry potential function (i.e., water spray rate) only corresponded to one specific spray rate at any one time whereas, WDR intensities in fact vary considerably due to the constant moving of air in the atmosphere during a rain event. Therefore, to be able to cover a broad range of WDR conditions, and using this approach, several water entry potential equations would need to be generated and as well, the number of these equations would be limited by the number of spray rates implemented in the watertightness test.
Moore et al. [22] proposed another equation for the water entry potential function given in Equation (3) using a power function and given as:
W E = W D R × W E %
where: WE is the water entry (L/h-m2), WDR is the WDR intensity (L/h-m2), and WE% is the percentage of water entry for each cladding type as shown in Equation (4).
W E % = a × P b
where: a and b are fitting factors derived from results of watertightness tests, and P is the wind induced pressure (Pa) calculated using Bernoulli’s Equation. The fitting factors a and b were generated from fitting the percentage of water entry in Equation (4) to water entry results for all spray rates. Thus, this equation covers a continuous range of WDR intensities and DRWPs. Despite that, both water entry equations (Equations (1) and (3)) have a mutual weakness: the effect of the WDR intensity is not considered when calculating the water entry ratio (%) which is the ratio of the water entry rate to that of the water spray rate.
To improve the assessment of moisture load using the water entry equation, a revised two-step approach is proposed in this study to permit more accurately determining the relation between the WDR intensity, the DRWP and the water entry rate. As compared to existing water entry equations, the impact of WDR intensity on the water entry rate is considered.
To validate this two-step approach for determining the relation between WDR load and degree of water entry to a wall, a vinyl-clad wall assembly installed with frequently-used wall components (i.e., electrical outlet, ventilation duct and window) was tested in the Dynamic Wind and Wall Testing Facility (DWTF) at the National Research Council Canada (NRC). In addition, the test followed a preliminary established test protocol on the basis of climate data collected in Canada [26]. Using this procedure, the air-leakage rate and pressure equalization of the tested wall assembly was also investigated

2. Methods

The overall procedure of this study included constructing a National Building Code of Canada (NBCC) [27] compliant vinyl-clad wall assembly, conducting the test with appropriate testing devices, and correlating the water entry results to the experimental input and other measurements from the test.

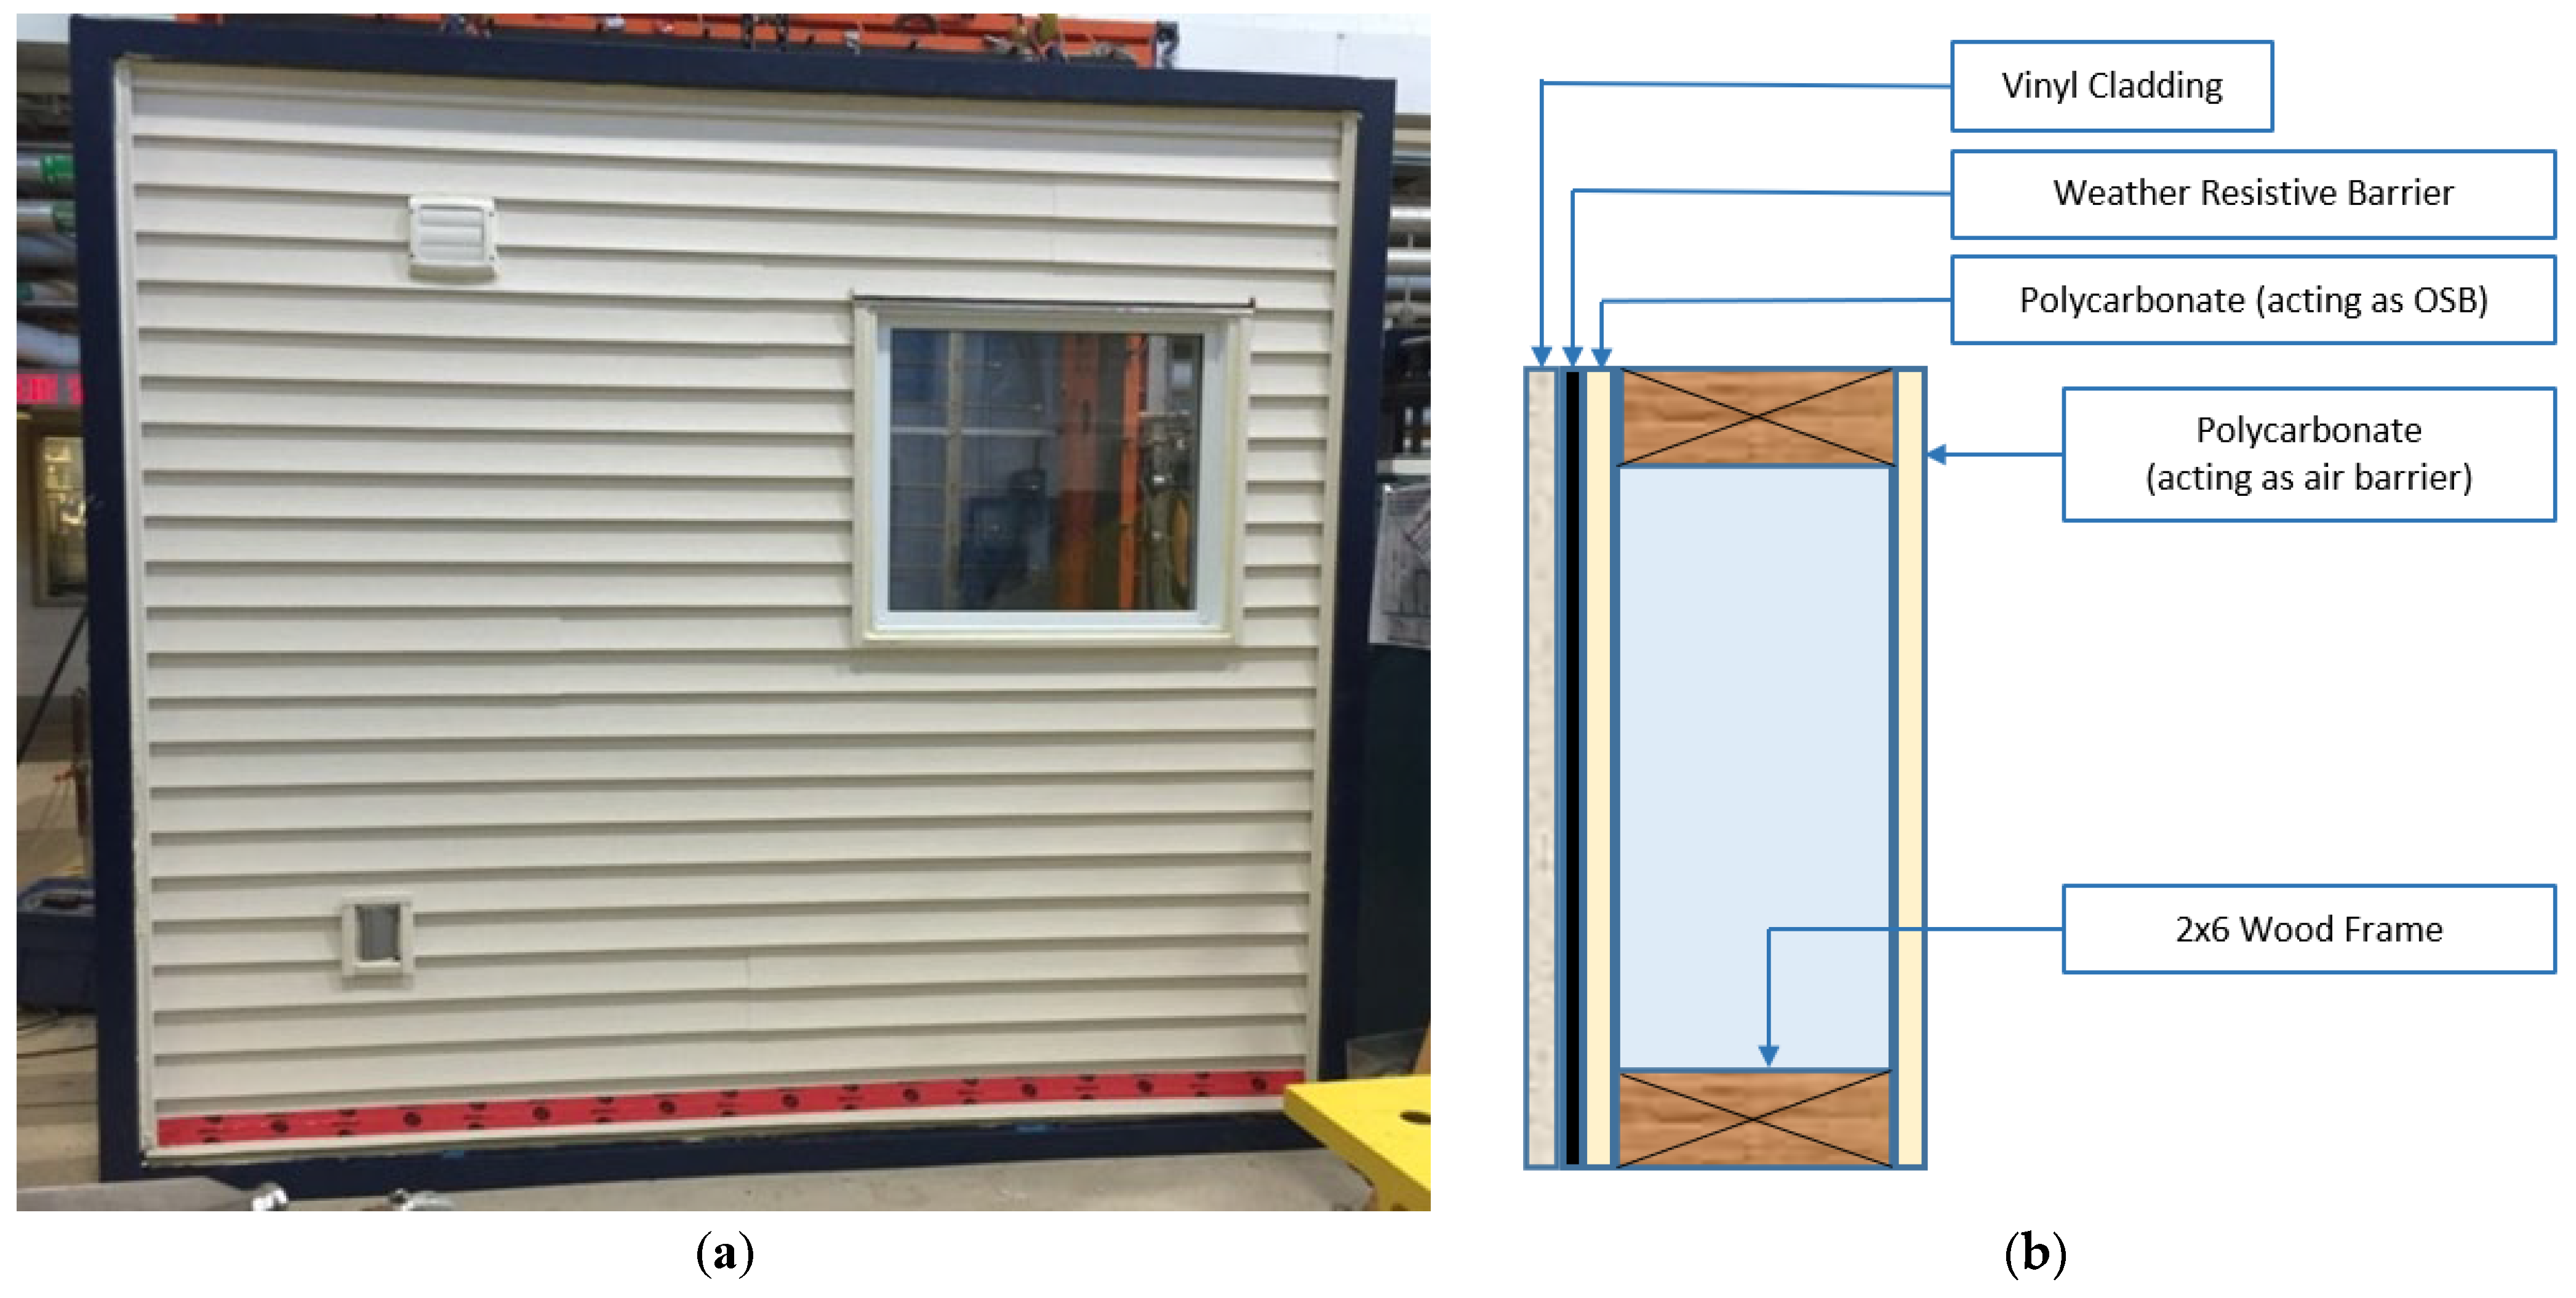
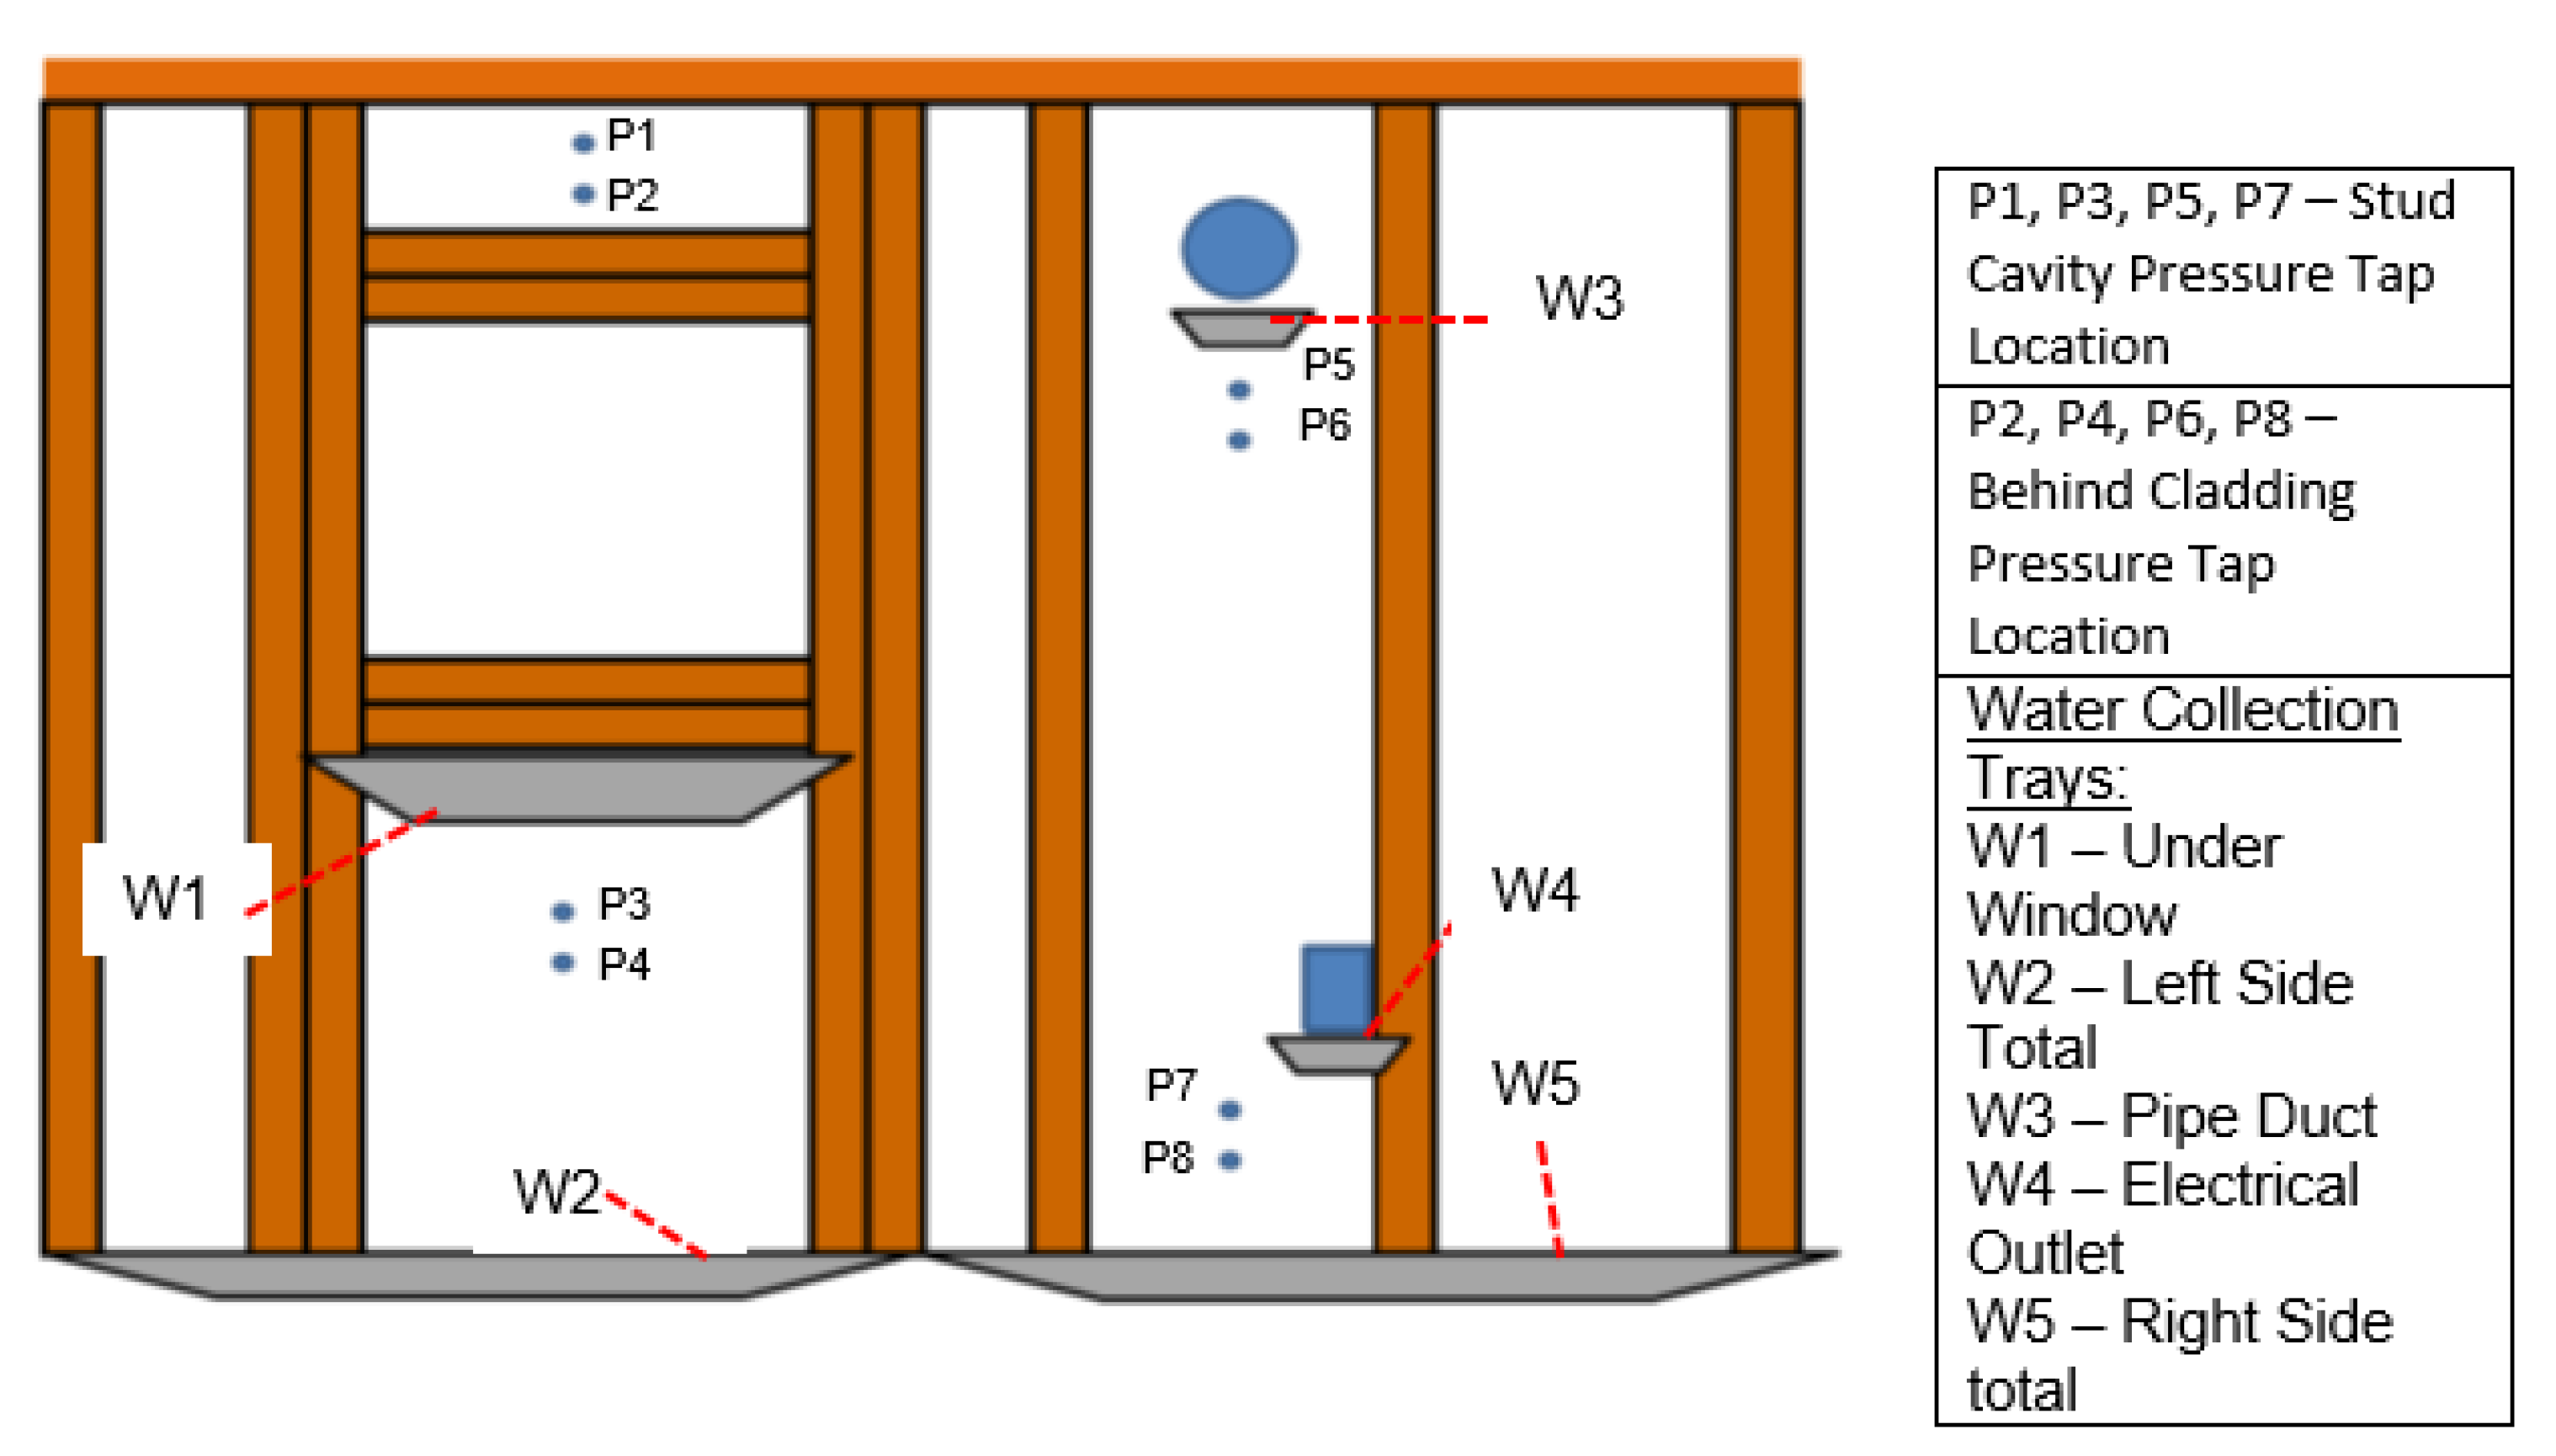
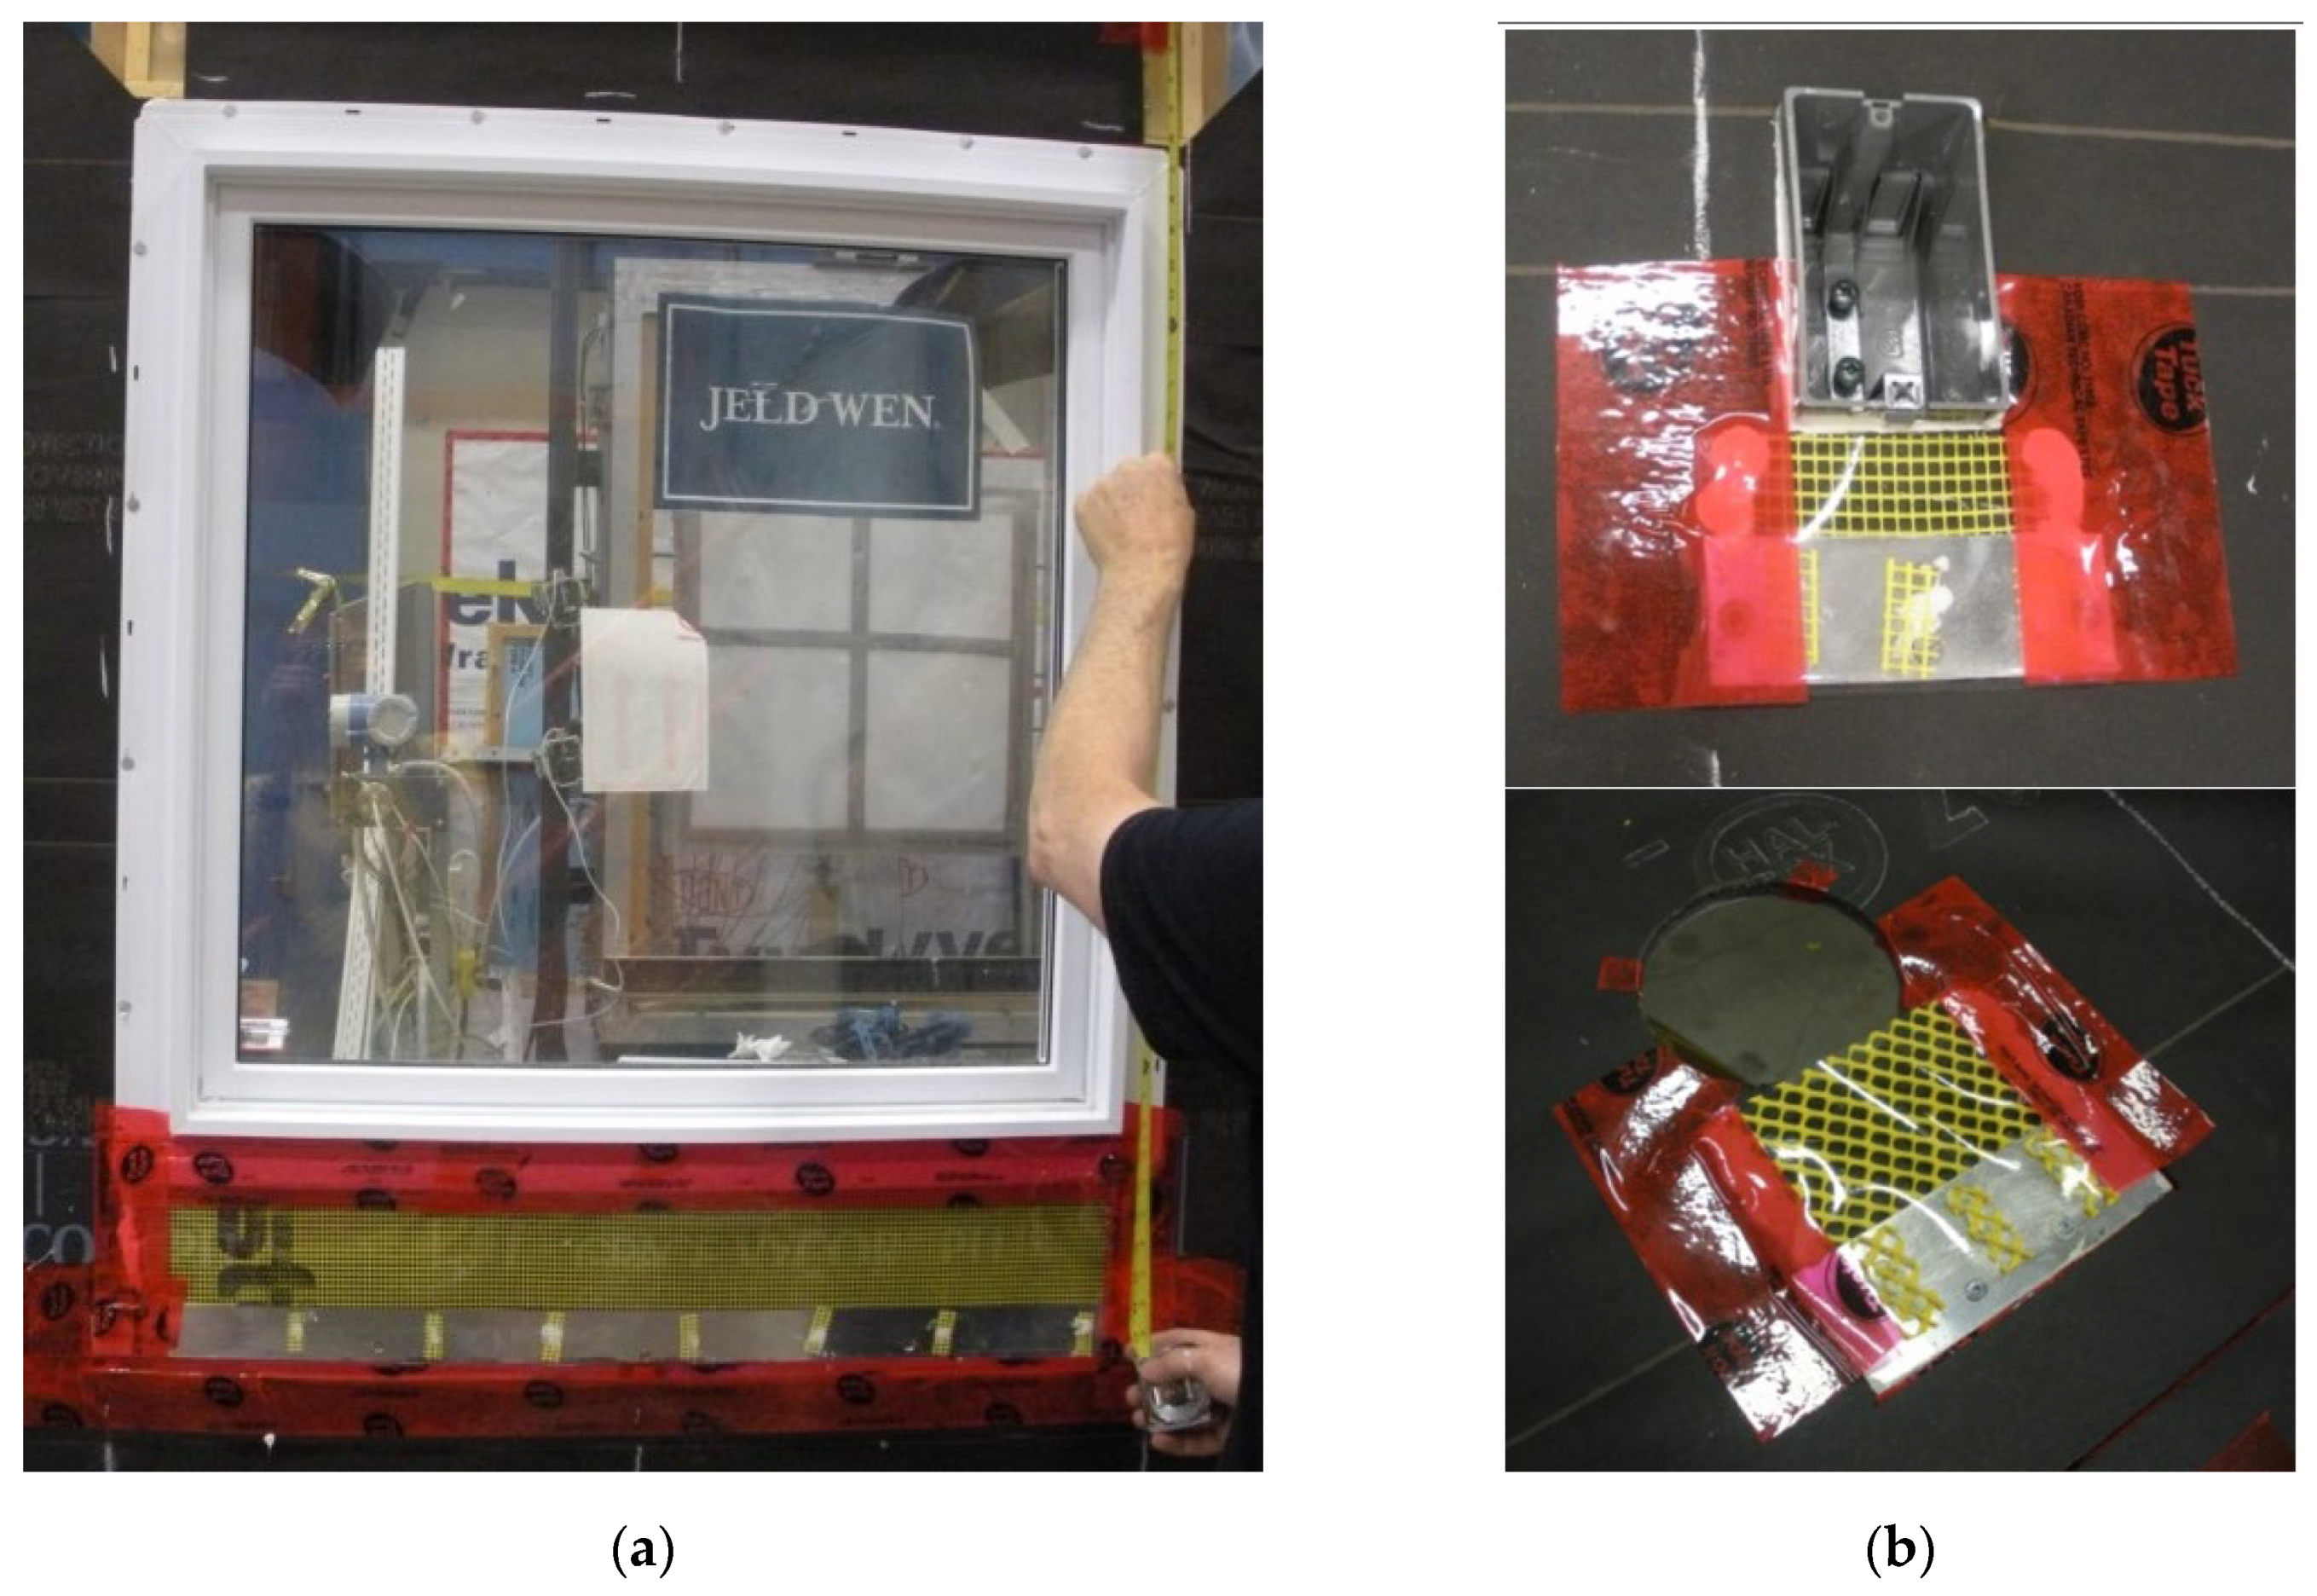
2.1. Configuration of Wall Specimen

The wall assembly test specimen (Figure 1) measures 2.44 × 2.44 m2 (8-ft. by 8-ft.) and incorporates a 600 × 600 mm2 window, 100-mm diameter circular pipe, and a standard exterior electrical outlet box. Other than the cladding layer, the specimen also included a 30-min asphalt impregnated membrane, 3/8-in transparent polycarbonate sheathing, 51 × 152 mm2 (2″ × 6″ wood) (SPF) studs spaced at 600 mm (24″) on center, and a 9.5 mm (3/8″) clear polycarbonate air and vapor barrier having an air leakage rate of 0.2 L/s-m2. No insulation material was installed in the tested specimen.
Pressure differences were measured by pressure transducer and infiltrated water was collected at several locations of the test specimen as shown in Figure 2. Specifically, in this test, pressure differences between the stud cavity and chamber were measured at locations shown in Figure 2 as P3, P5 and P7, and that between chamber and behind the cladding layer were measured at locations P2, P4, P6. These pressure differences could then be used to estimate the potential for water to be driven though the cladding and onto the weather resistant barrier.
Three, 3-mm diameter, holes were bored at the top center of the caulking around the pipe, the bottom left of the caulking near the electrical outlet, and at the bottom corner of the window frame to simulate failures at these locations. Water collection troughs were installed below the window, ventilation pipe and electrical outlet box, at the bottom of the left-side and right-side of the wall represented by W1, W3, W4, W2, and W5, respectively. Details of collection trays for the window, pipe and electrical outlet box are shown in Figure 3. Yellow plastic mesh was installed to direct water that has penetrated the cladding into the aluminum collection trough. Water in the trough was then drained to a water reservoir that could be weighed before and after each test; this permitted quantifying the water that had penetrated the cladding and reached the sheathing membrane. The portion of water that had entered the wall assembly but was not collected in the water troughs, could be observed through transparent polycarbonate panels, these panels replacing the sheathing and gypsum boards as is typically used in real wall assemblies.

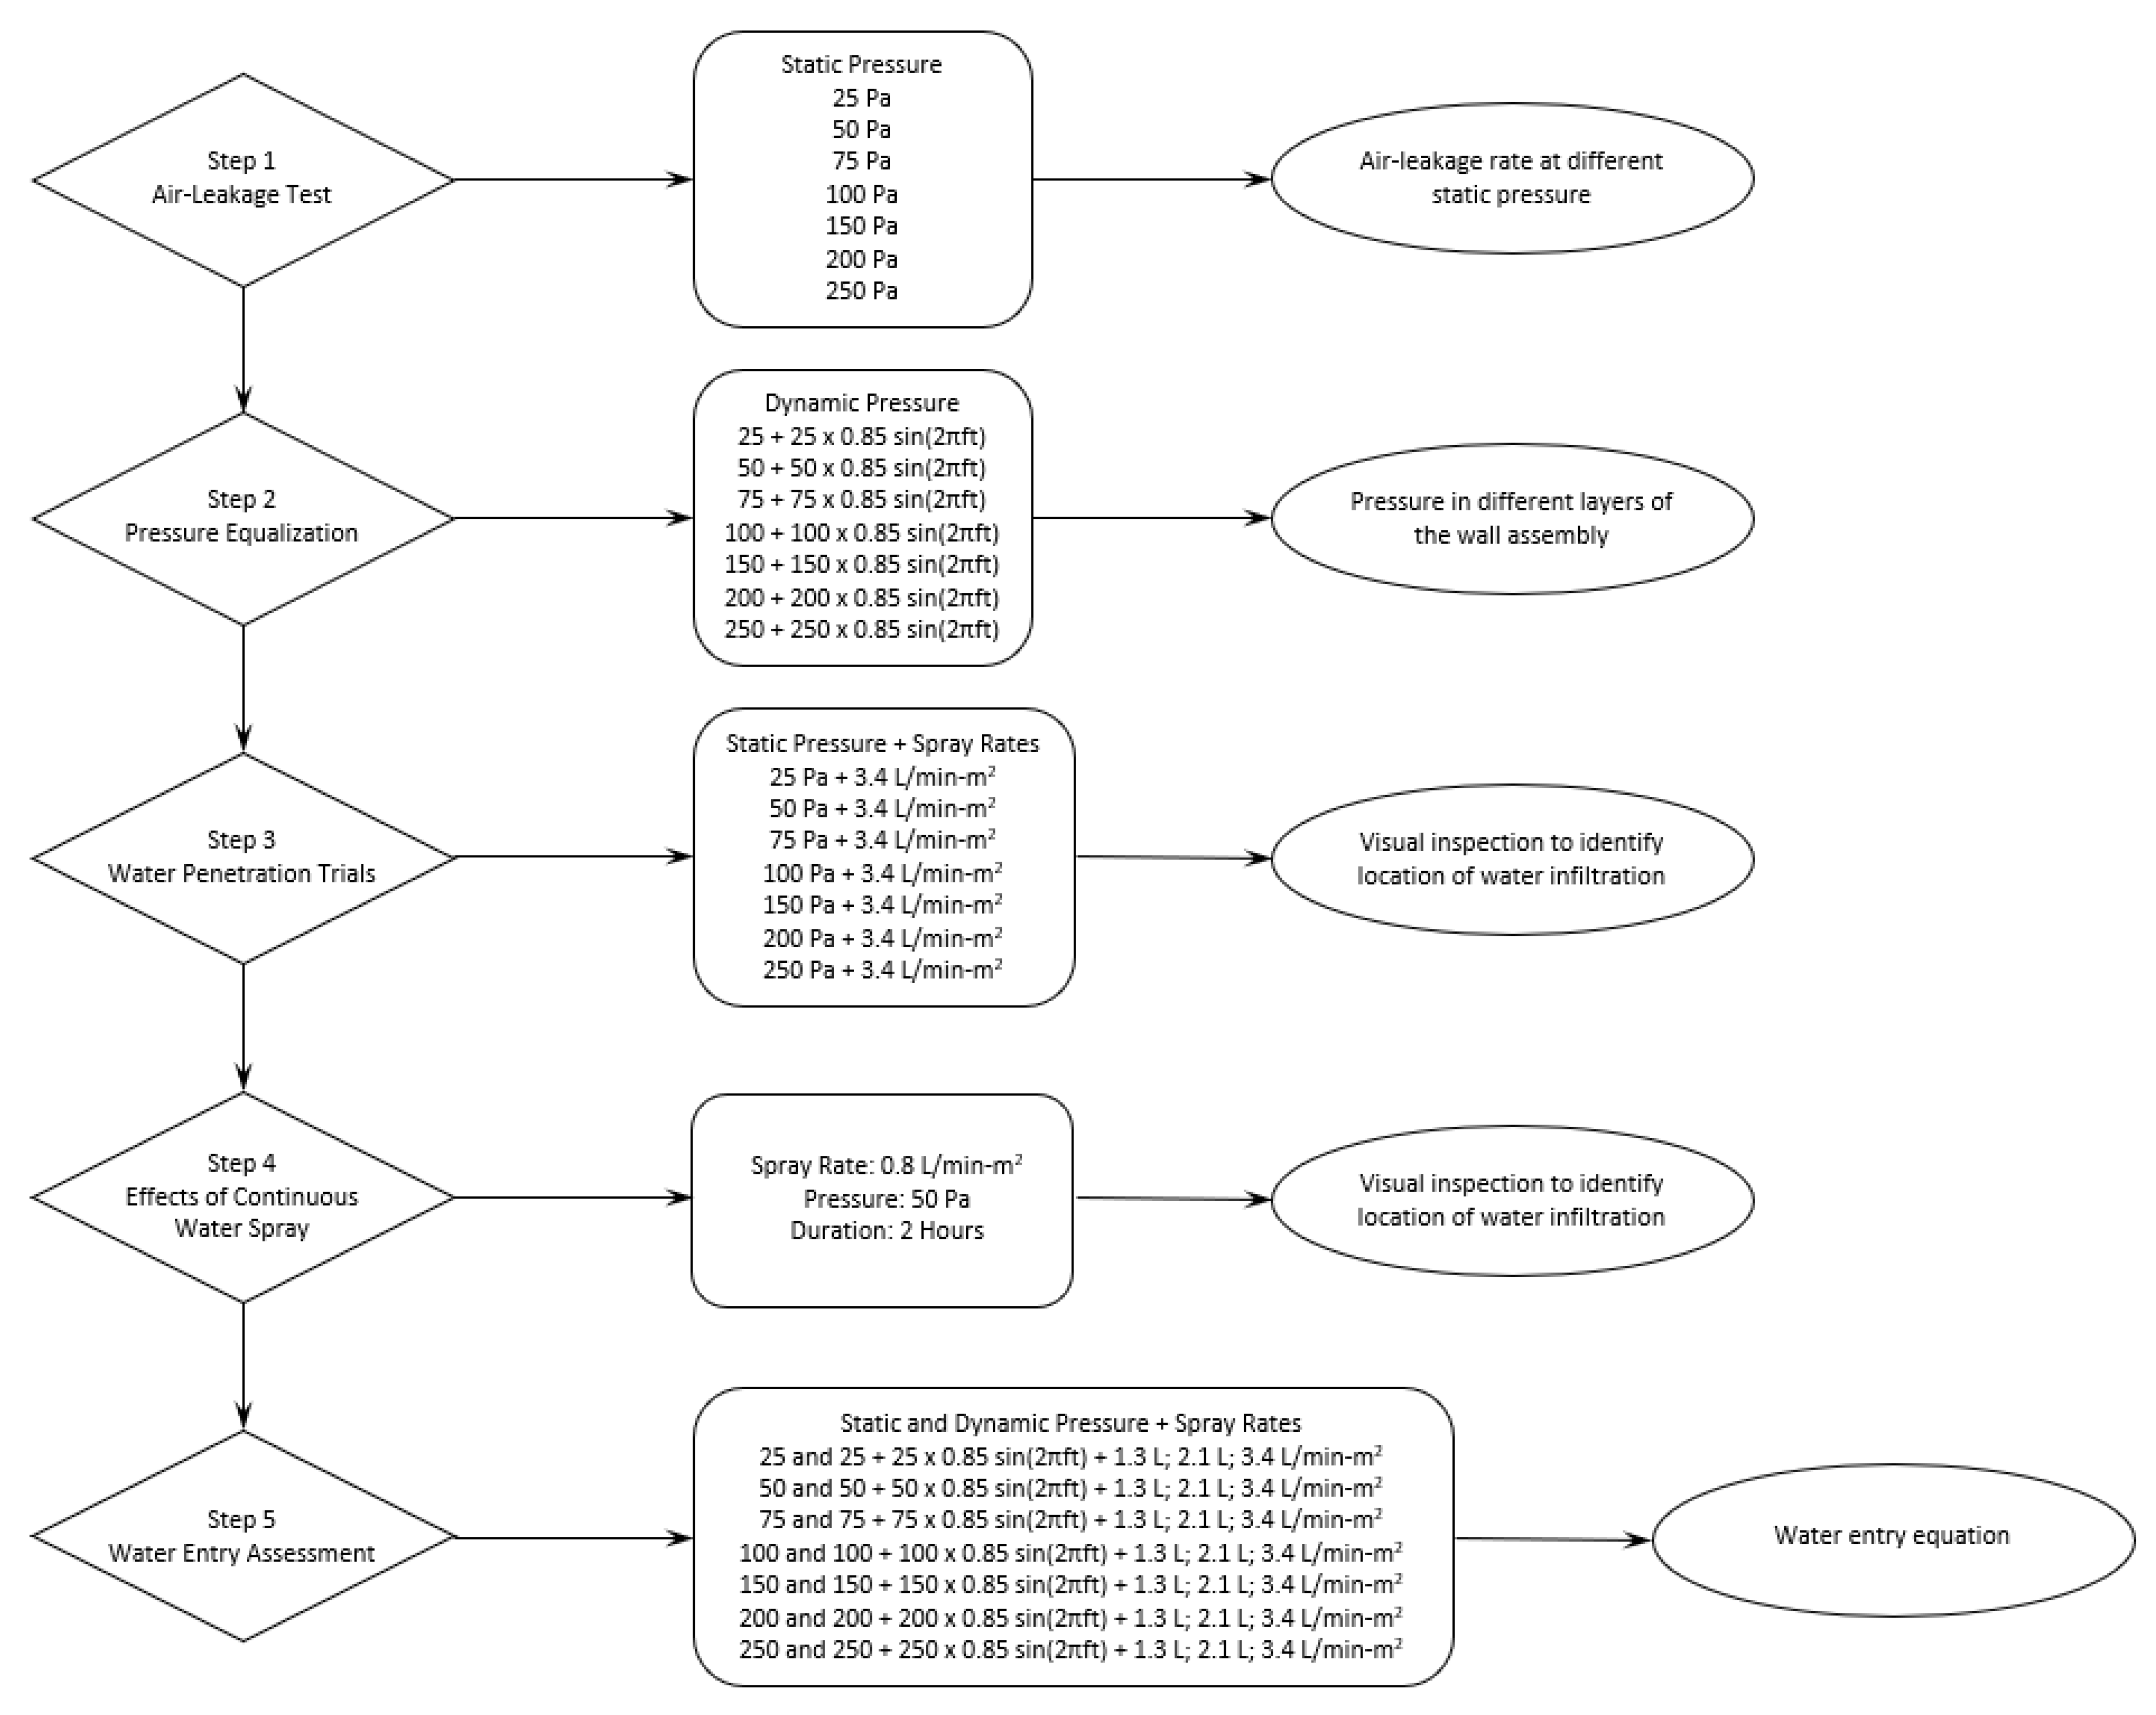
2.2. Watertightness Test Protocol

A preliminary test protocol was established based on climate data collected in Ottawa, Canada for watertightness tests which would be carried out by using the DWTF. The experimental inputs in the protocol ensured that the specimen was subjected to all possible WDR conditions that could occur at the location of interest in the test. The results of testing using this protocol were expected to provide comprehensive information regarding the moisture load in the tested wall assembly.
The entire protocol included five steps. The first step, Air-Leakage Test, was intended to measure the air-leakage in wall assemblies which occurs primarily through cracks, gaps, poorly designed or constructed joints, junctions at perimeters of window and door frames, or pass directly through porous materials under pressure differential. The air-leakage test was added to the protocol given an appreciation of its effects on water entry, as well as the requirement for a maximum air-leakage rate (i.e., 0.2 L/s-m2 at 75 Pa static pressure), as specified in NBCC [27] to help ensure reduced consumption in building heating loads. Other than satisfying this requirement, additional static pressure levels up to 250 Pa were also added to the test protocol. Thus air-leakage rates of the wall assembly were measured from those pressure levels and thereafter correlated with the water entry rates.
The primary force that drives water inward of wall assemblies are induced by the pressure differential across different layers of wall [28]. Ideally, a perfectly pressure equalized wall assembly can mitigate part of these driving forces. However, due to the inevitable presence of air flow paths in the wall assembly, in real wall applications the pressure differential more likely is altered from the ideal case and thus ought to be characterized. Thus, the pressure equalization of the wall assembly, and that could potentially affect the degree of water entry, was characterized at the second step of the test protocol. The pressure equalization step was conducted by simultaneously measuring pressure at different layers, and several locations, of the wall assembly test specimen when different levels of pressure were applied to the wall specimen. Pressure applied to the facade surface, in the drainage cavity and in the stud cavity were measured under a succession of dynamic pressure fluctuations; they are presented as sine functions at several locations of the wall assembly. Discrepancies between measured pressures were not the only concern; shifts between sine functions which were plotted from the pressure data at different layers were also of interest. The dynamic pressure cycles applied to the test specimen in later steps of this protocol were in accordance with those implemented at this step. The base pressure for dynamic pressure cycles was the same as the static pressure steps. The amplitude of the dynamic pressure was calculated by multiplying the base pressure with the 0.85 which was derived from the maximum pressure coefficient on wall assemblies specified by the National Building Code [13]. The frequencies of dynamic pressure cycles were tentatively suggested as 0.1 Hz considering the wind velocity spectrum near the ground (<10 m) [29]. Profound discussions were made at the section for watertightness results.
Third and fourth steps of the protocol include the Water Penetration Trials and the Effects of Continuous Water Spray. The Water Penetration Trials were used to determine the ability of the wall assembly to resist water penetration when exposed to static and dynamic pressures, at a nominal spray rate of 3.4 L/min-m2. Occurrence of any form of water penetration was recorded after visual inspection of the wall assembly. At the fourth step, the test specimen would be subjected to long-lasting water spray to simulate exposure of real wall assemblies to up to 24-h consecutive WDR events in Ottawa [26]. Observations in regard to water penetration was conducted and recorded every 10 min.
The final step of the protocol is the Water Entry Assessment. At this step, several levels of spray rates and multiple steps of static and dynamic pressure derived from Ottawa observed historical climate data were applied to the test specimen to investigate the relation between the applied conditions and the water entry results. Water collected by reservoirs was weighed and recorded after each step. Pressure readings in different layers of the wall assembly were also monitored during wet test conditions. The duration for each step was 10 min. The applied spray rate of 3.4 L/min-m2 is equivalent to the maximum 1-min WDR intensity for the Ottawa region [26] calculated from a WDR intensity of 35 mm/h. Spray rates of 1.3 and 2.1 L/min-m2 were also implemented to investigate effect of water spray rate to the water entry results. An overview of the test protocol is given in Figure 4.

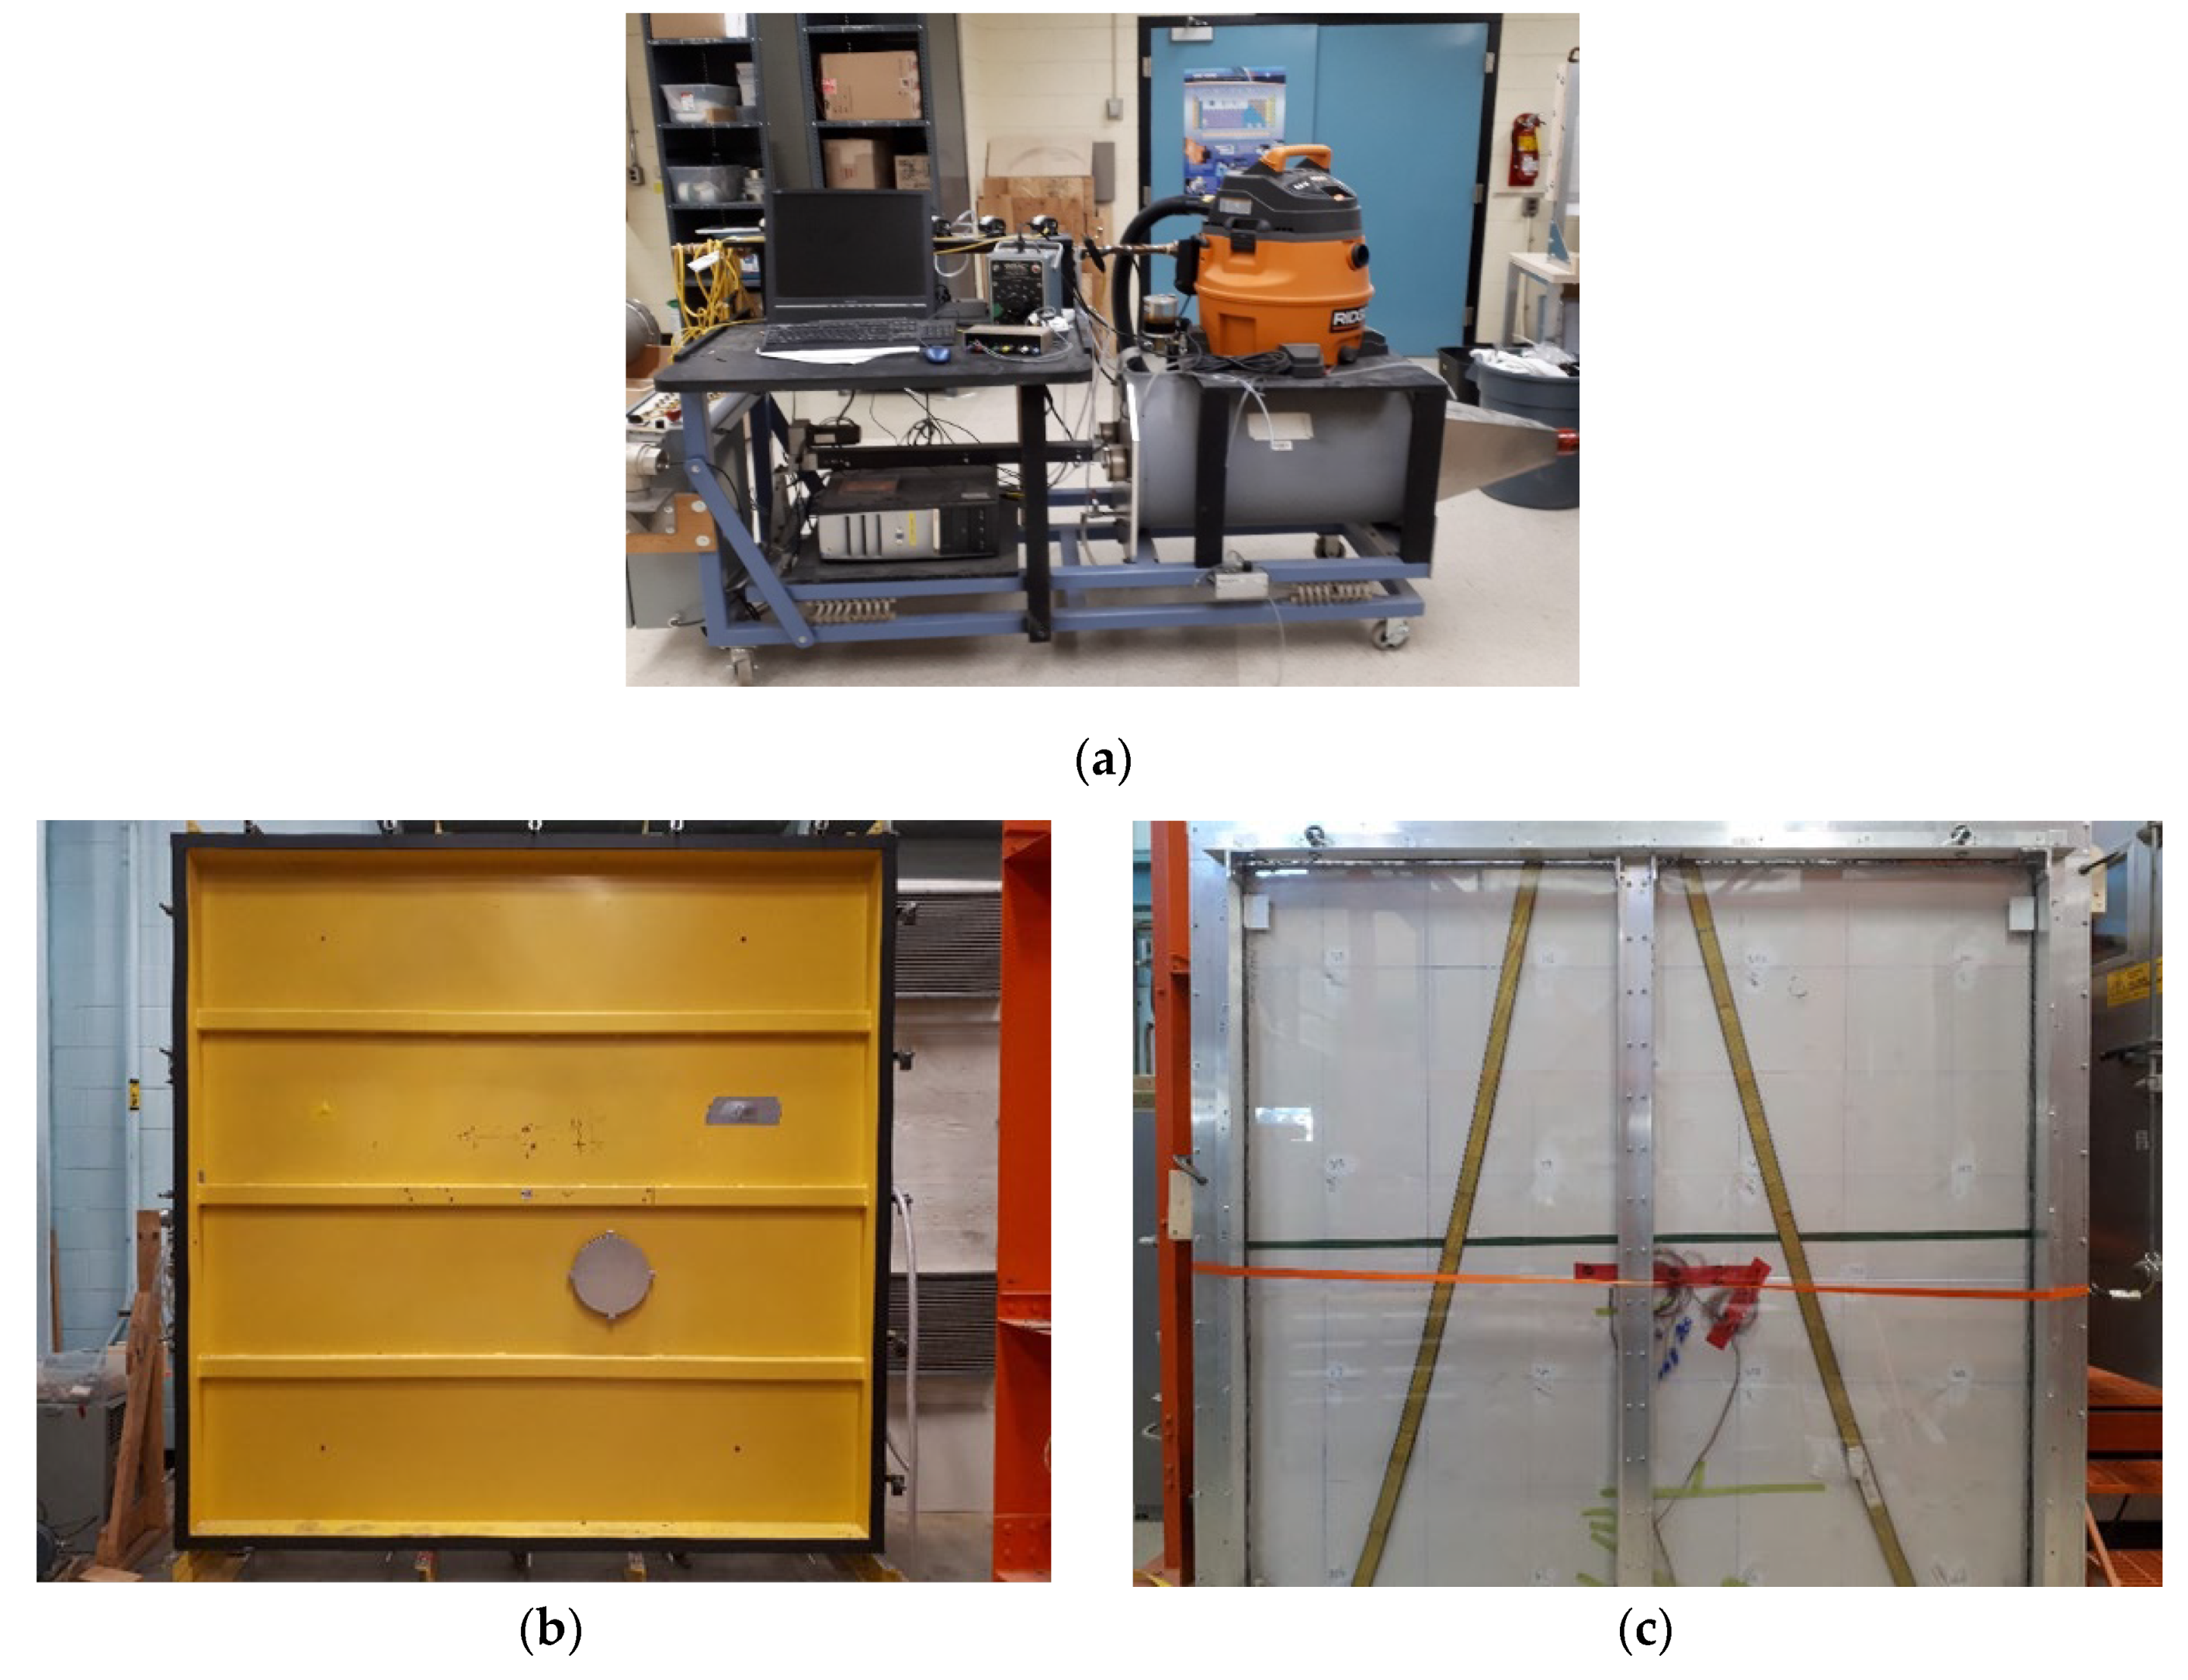
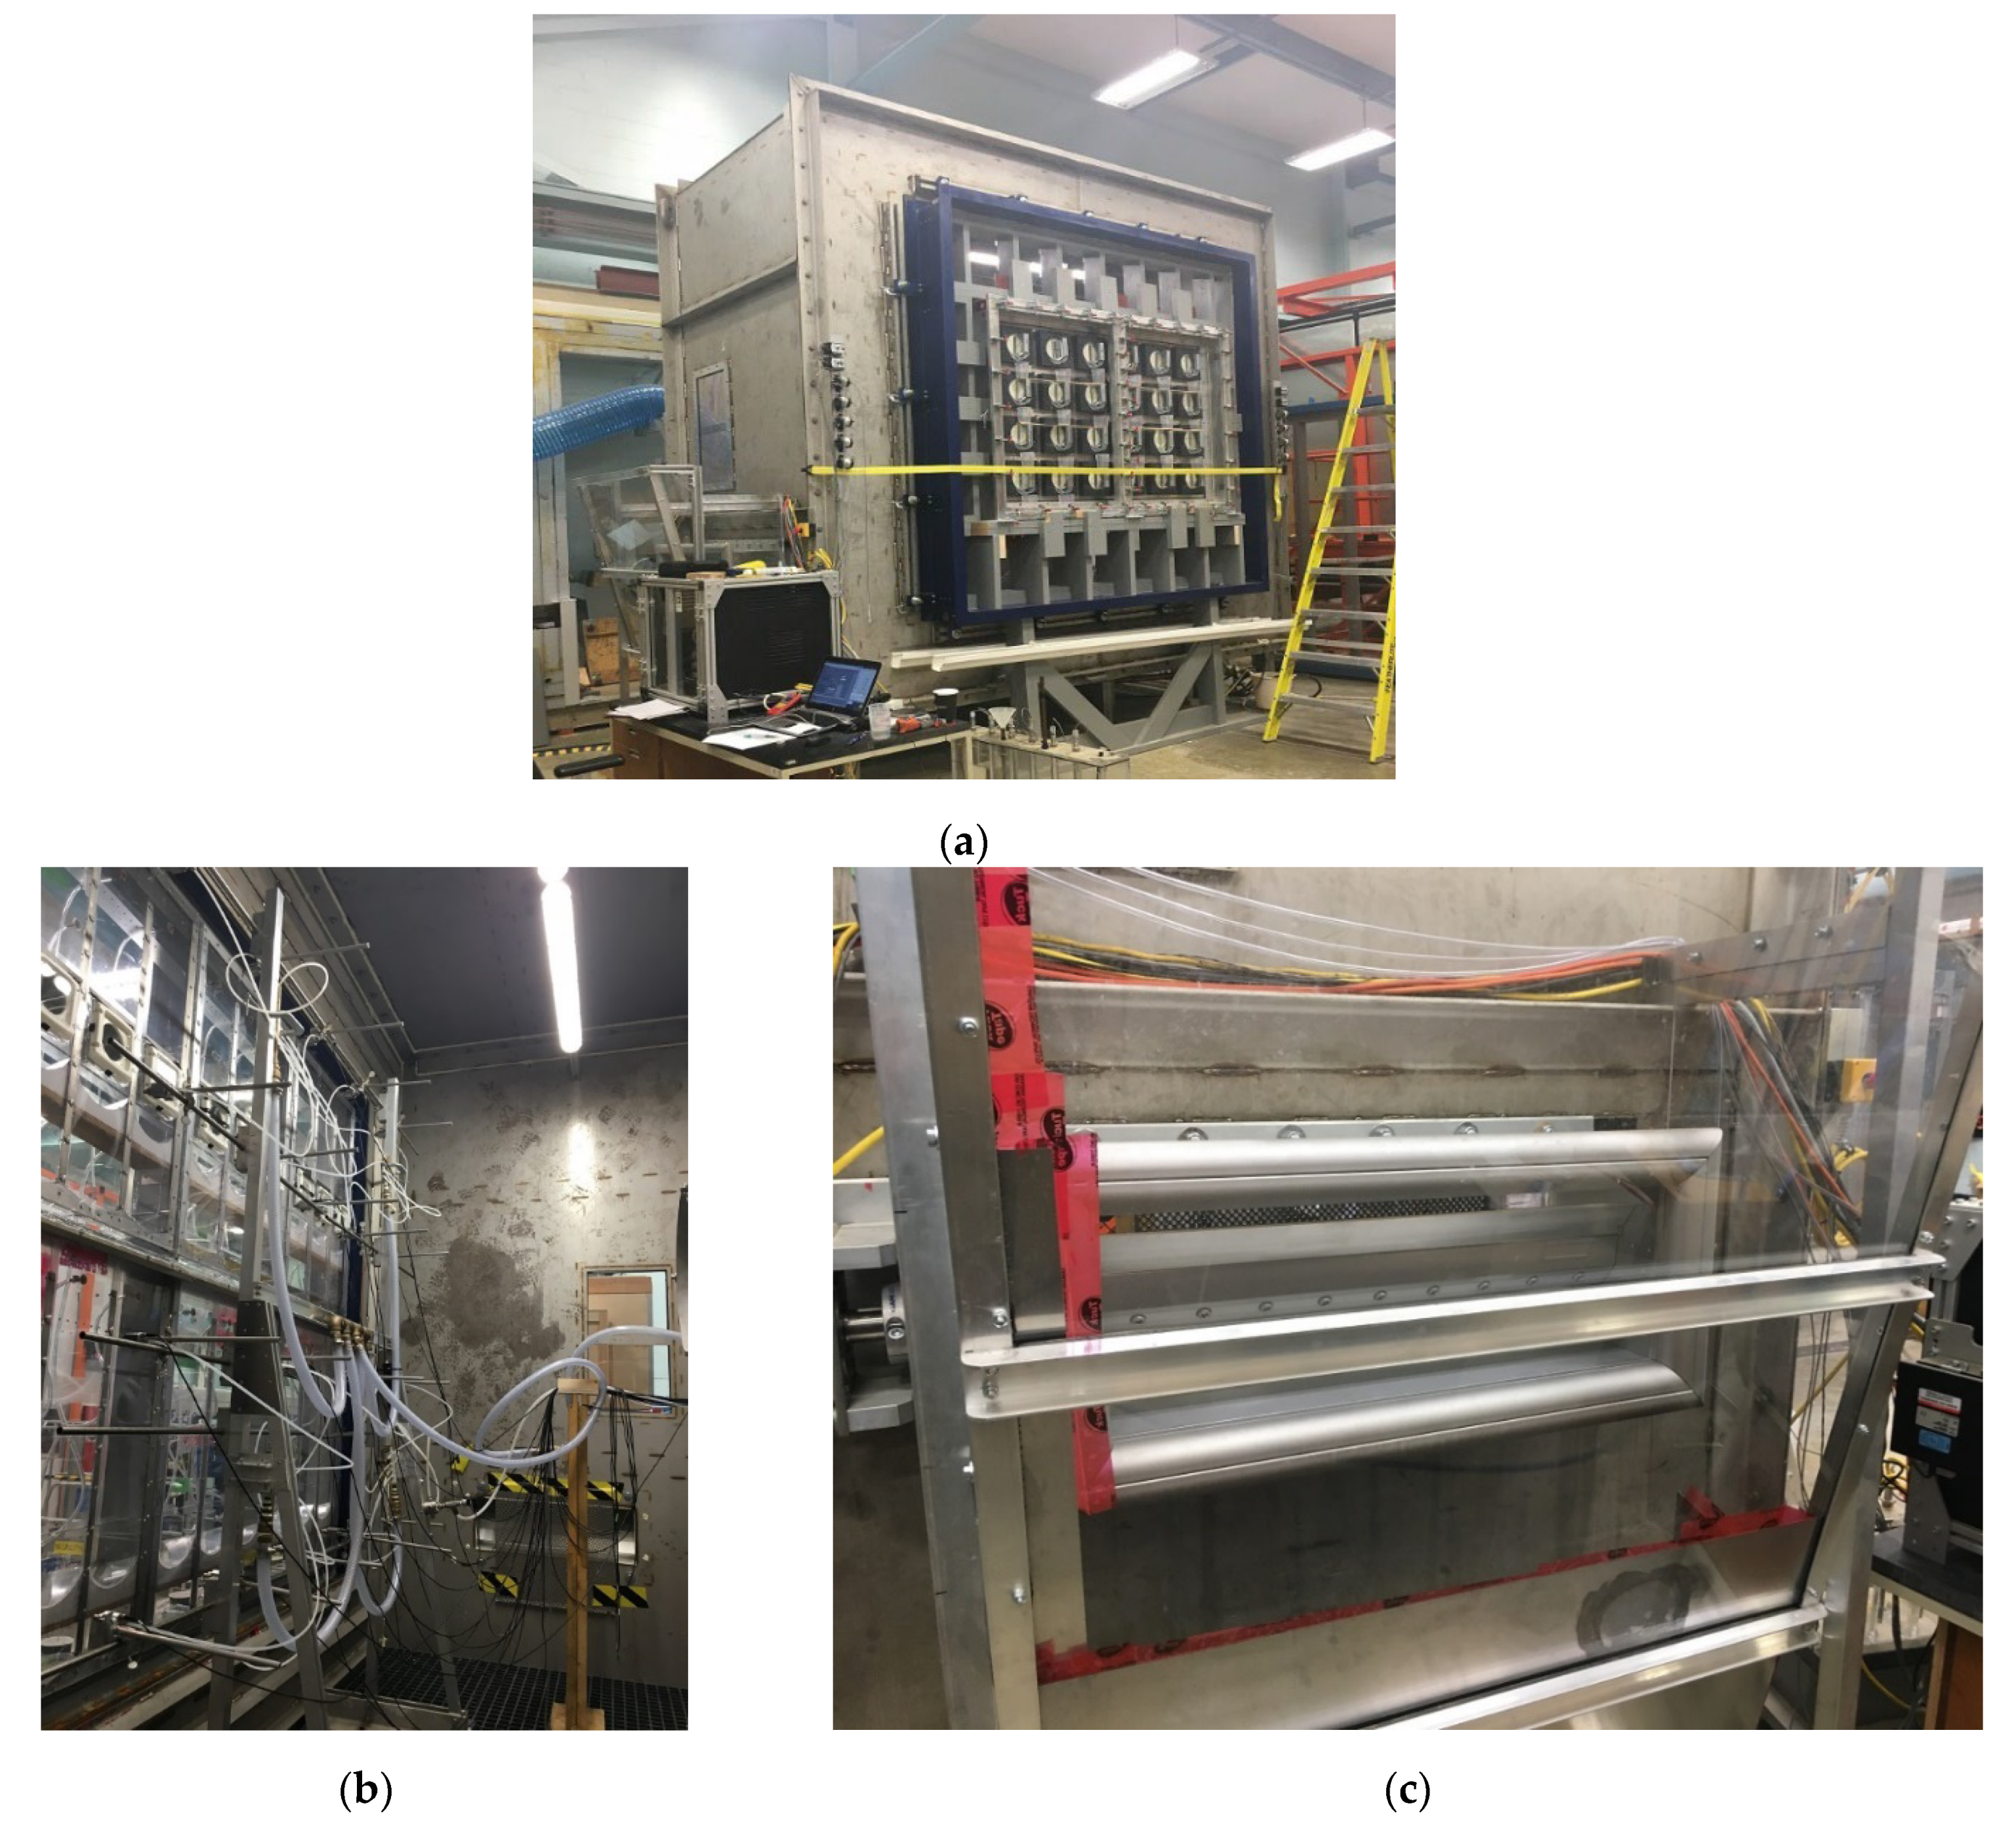
2.3. Experimental Facilities

Air leakage testing on the wall assembly was performed in accordance with ASTM E2357 to characterize wall performance with respect to air leakage at static pressure differentials of 25, 50, 75, 100, 150, 200, and 250 Pa. Testing was also performed to ensure that the wall assembly had an air leakage rate less than or equal to 0.20 L/(s-m2) at a pressure differential of 75 Pa to meet airtightness requirements of a continuous air barrier system as stated in the NBCC [27]. The actuator unit shown in Figure 5a, was used to measure the pressure differential within the air leakage testing assembly as well as record pressure data and the air flow rate. The air leakage testing assembly consisted of a steel frame as shown in Figure 5b and a 9.5 mm (3/8″) polycarbonate sheet as shown in Figure 5c. With the wall assembly secured to the steel frame, the polycarbonate was attached and sealed to the lab side of the wall to measure the base air leakage which is the air leakage occurring through the perimeter seals of the specimen and steel frame. Once the base air leakage was obtained, the polycarbonate sheet would be removed to measure the total air leakage. The air leakage rate of a wall assembly can be calculated by subtracting the base air leakage rate from the total air leakage rate.
The DWTF is an integrated watertightness and water entry test chamber that is composed of a Rain Effects System (RES), a Wind Effects System (WES) and a Data Acquisition System (DAS) as shown in Figure 6. The RES is mounted within the test chamber and allows a regulated amount of water to be deployed by spraying on the test specimen. The setup and calibration of the RES comply with the ASTM E331 standard [14]. The WES applies pressure to the exterior surface of the wall assembly by using an air blower. Dynamic pressure fluctuations are achieved by controlling an Exhaust Flap System (EFS). All the systems can be controlled and operated from a single computer. The DWTF test chamber, made of stainless steel, is 3.7 m high, 3.7 m wide and 1.22 m deep and has a 2.44 × 2.44 m2 opening at the front face for installing and securing a test specimen. A 1 × 2 m2 water and airtight door located on one side of the test chamber provides entrance to the inside of the DWTF chamber. On the opposite side of the chamber, a motorized flap system is installed for exhausting air supplied by a blower that is connected to the inlet at the rear of the DWTF though a conduit and controls the pressure that is applied to the test specimen. Additional openings located at the rear of the test chamber provide access for electrical power and water supply to the RES. The open mesh flooring inside the chamber allows water to be drained during or after a test. The WES is designed to produce pressures up to 2400 Pa and the RES is calibrated to provide up to 3.4 L/min-m2 water deposition in the form of a conical spray.

3. Experimental Results and Discussion

The output of the experiment included the air-leakage rate for different levels of static pressure across the wall assembly, pressure equalization of the wall assembly under dynamic pressure, water penetration observed at different locations of the wall assembly, and water entry rate for different spray rates and applied pressure. The correlations between the air-leakage rate and the water entry rate under static pressure are discussed, and as well, those between the pressure equalization and the water entry rate under dynamic pressure. As well, a two-step approach was developed to establish the water entry equation.

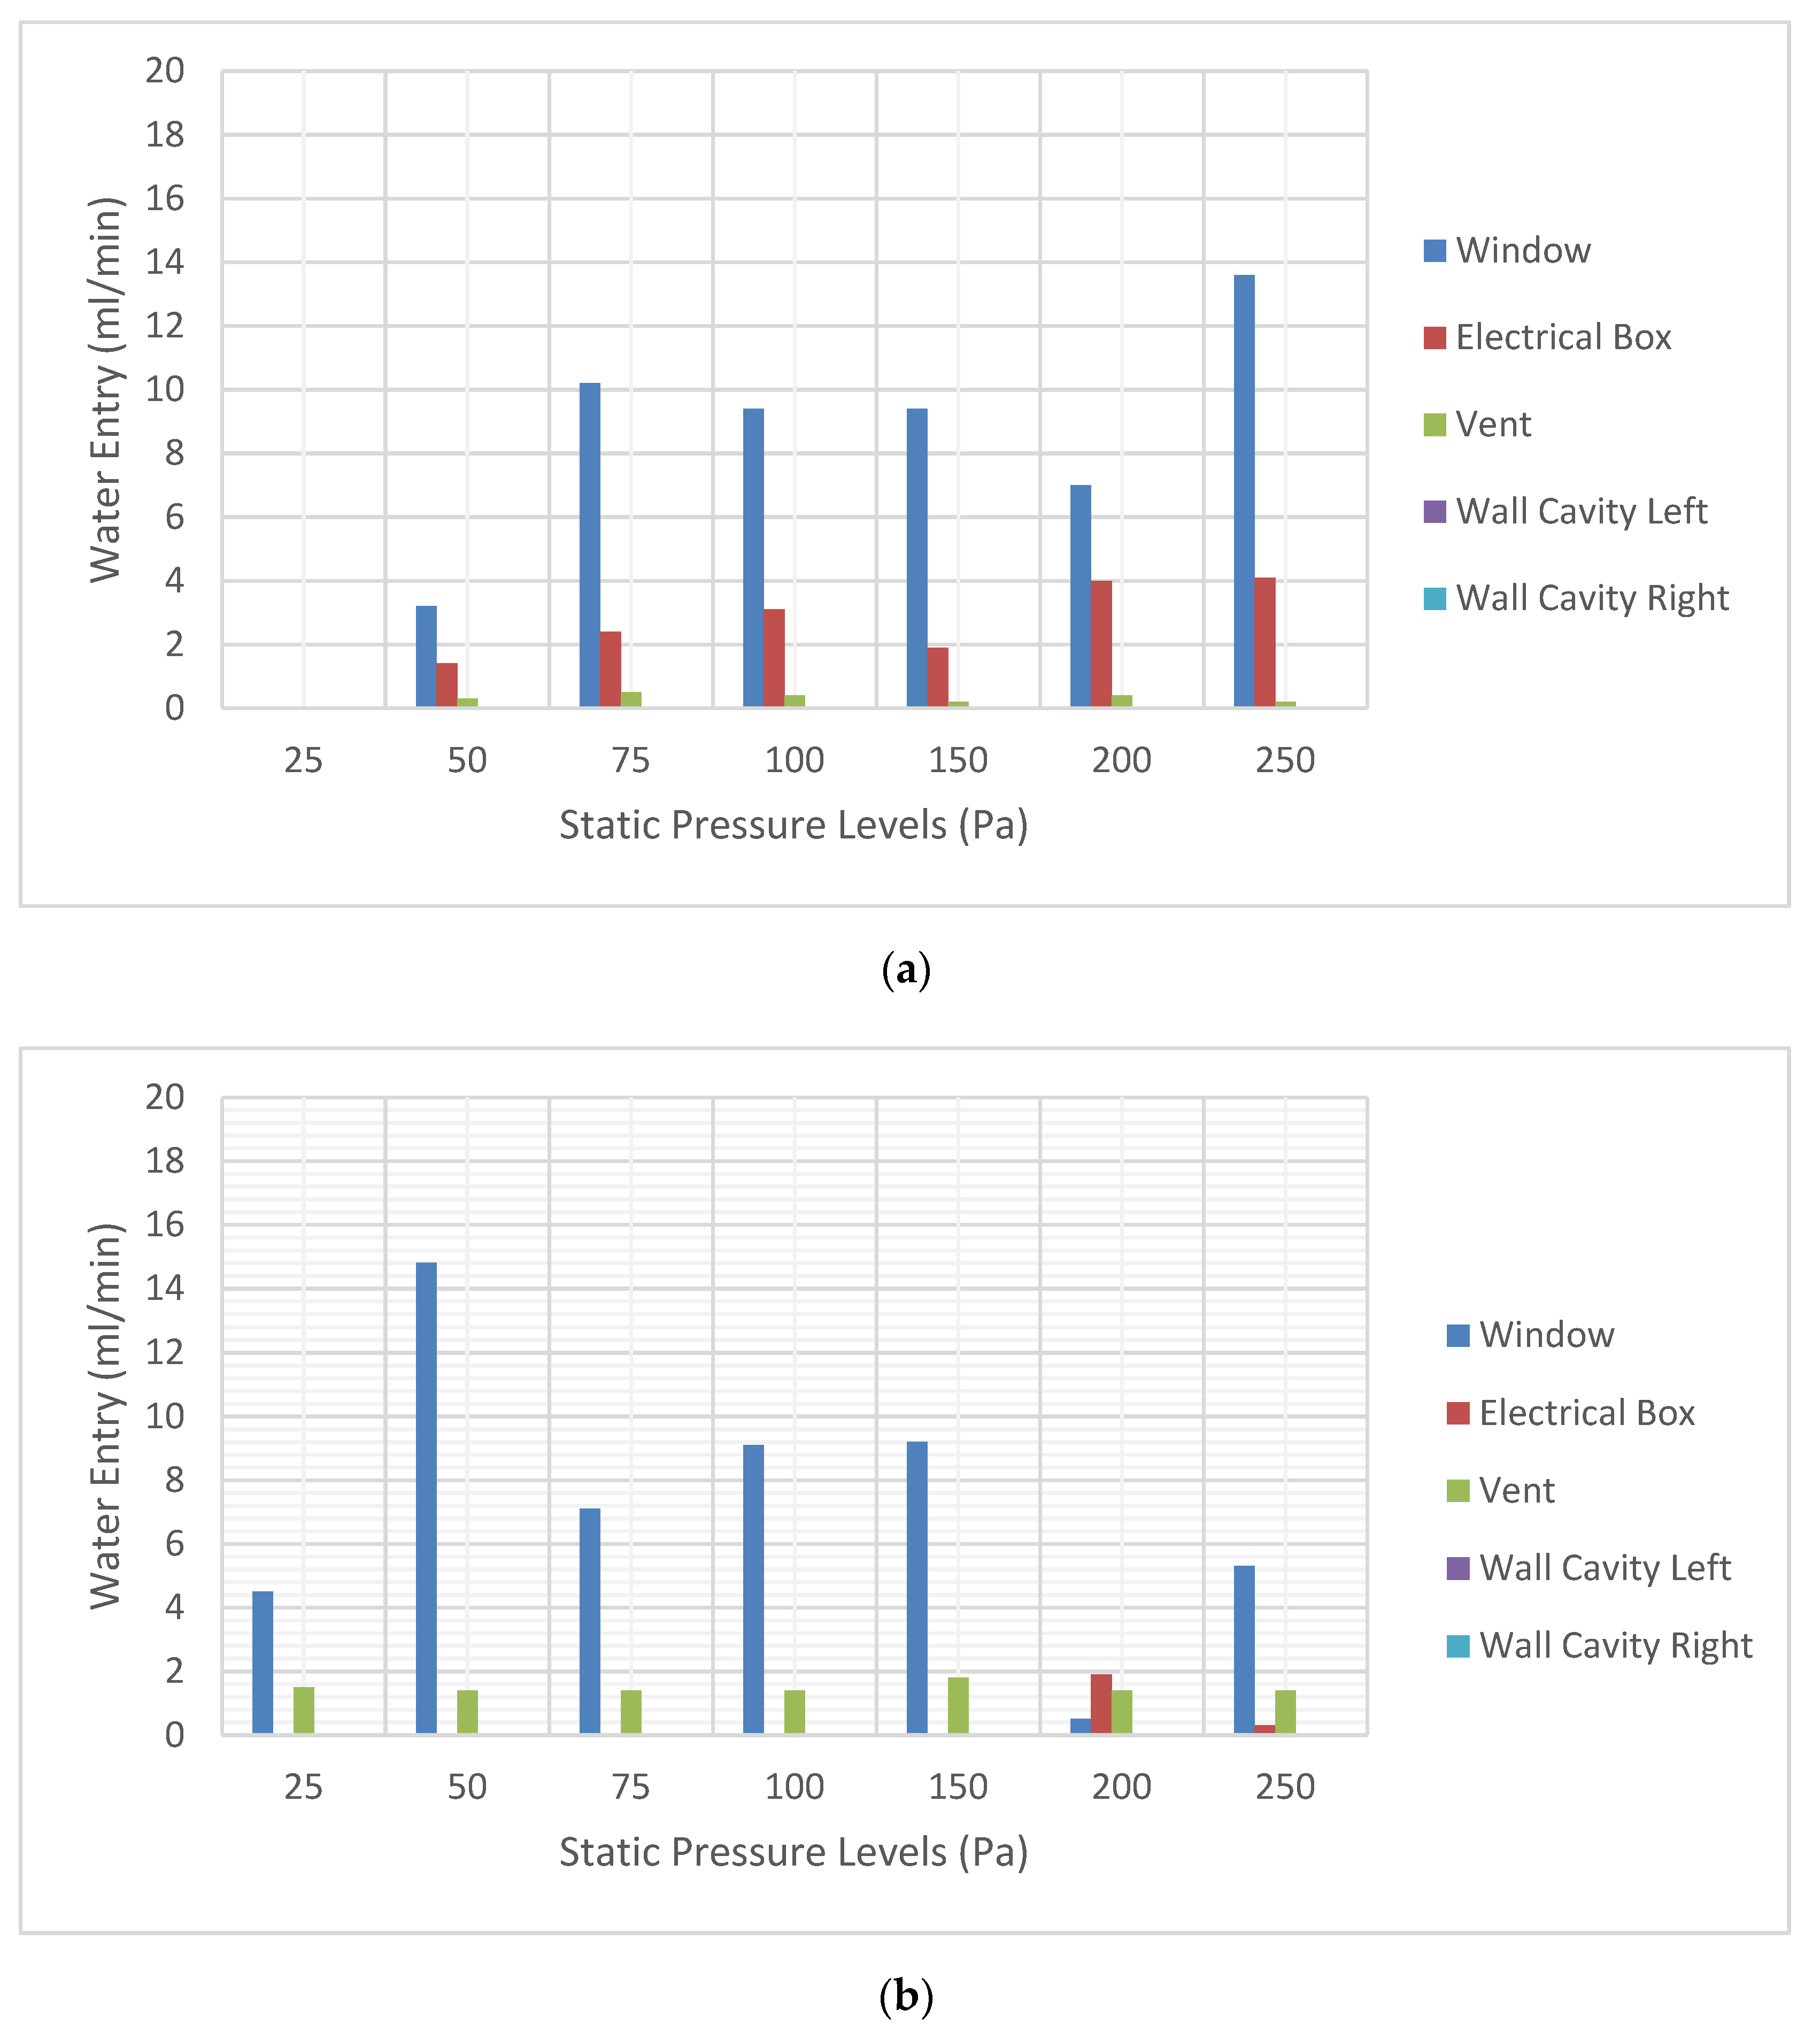
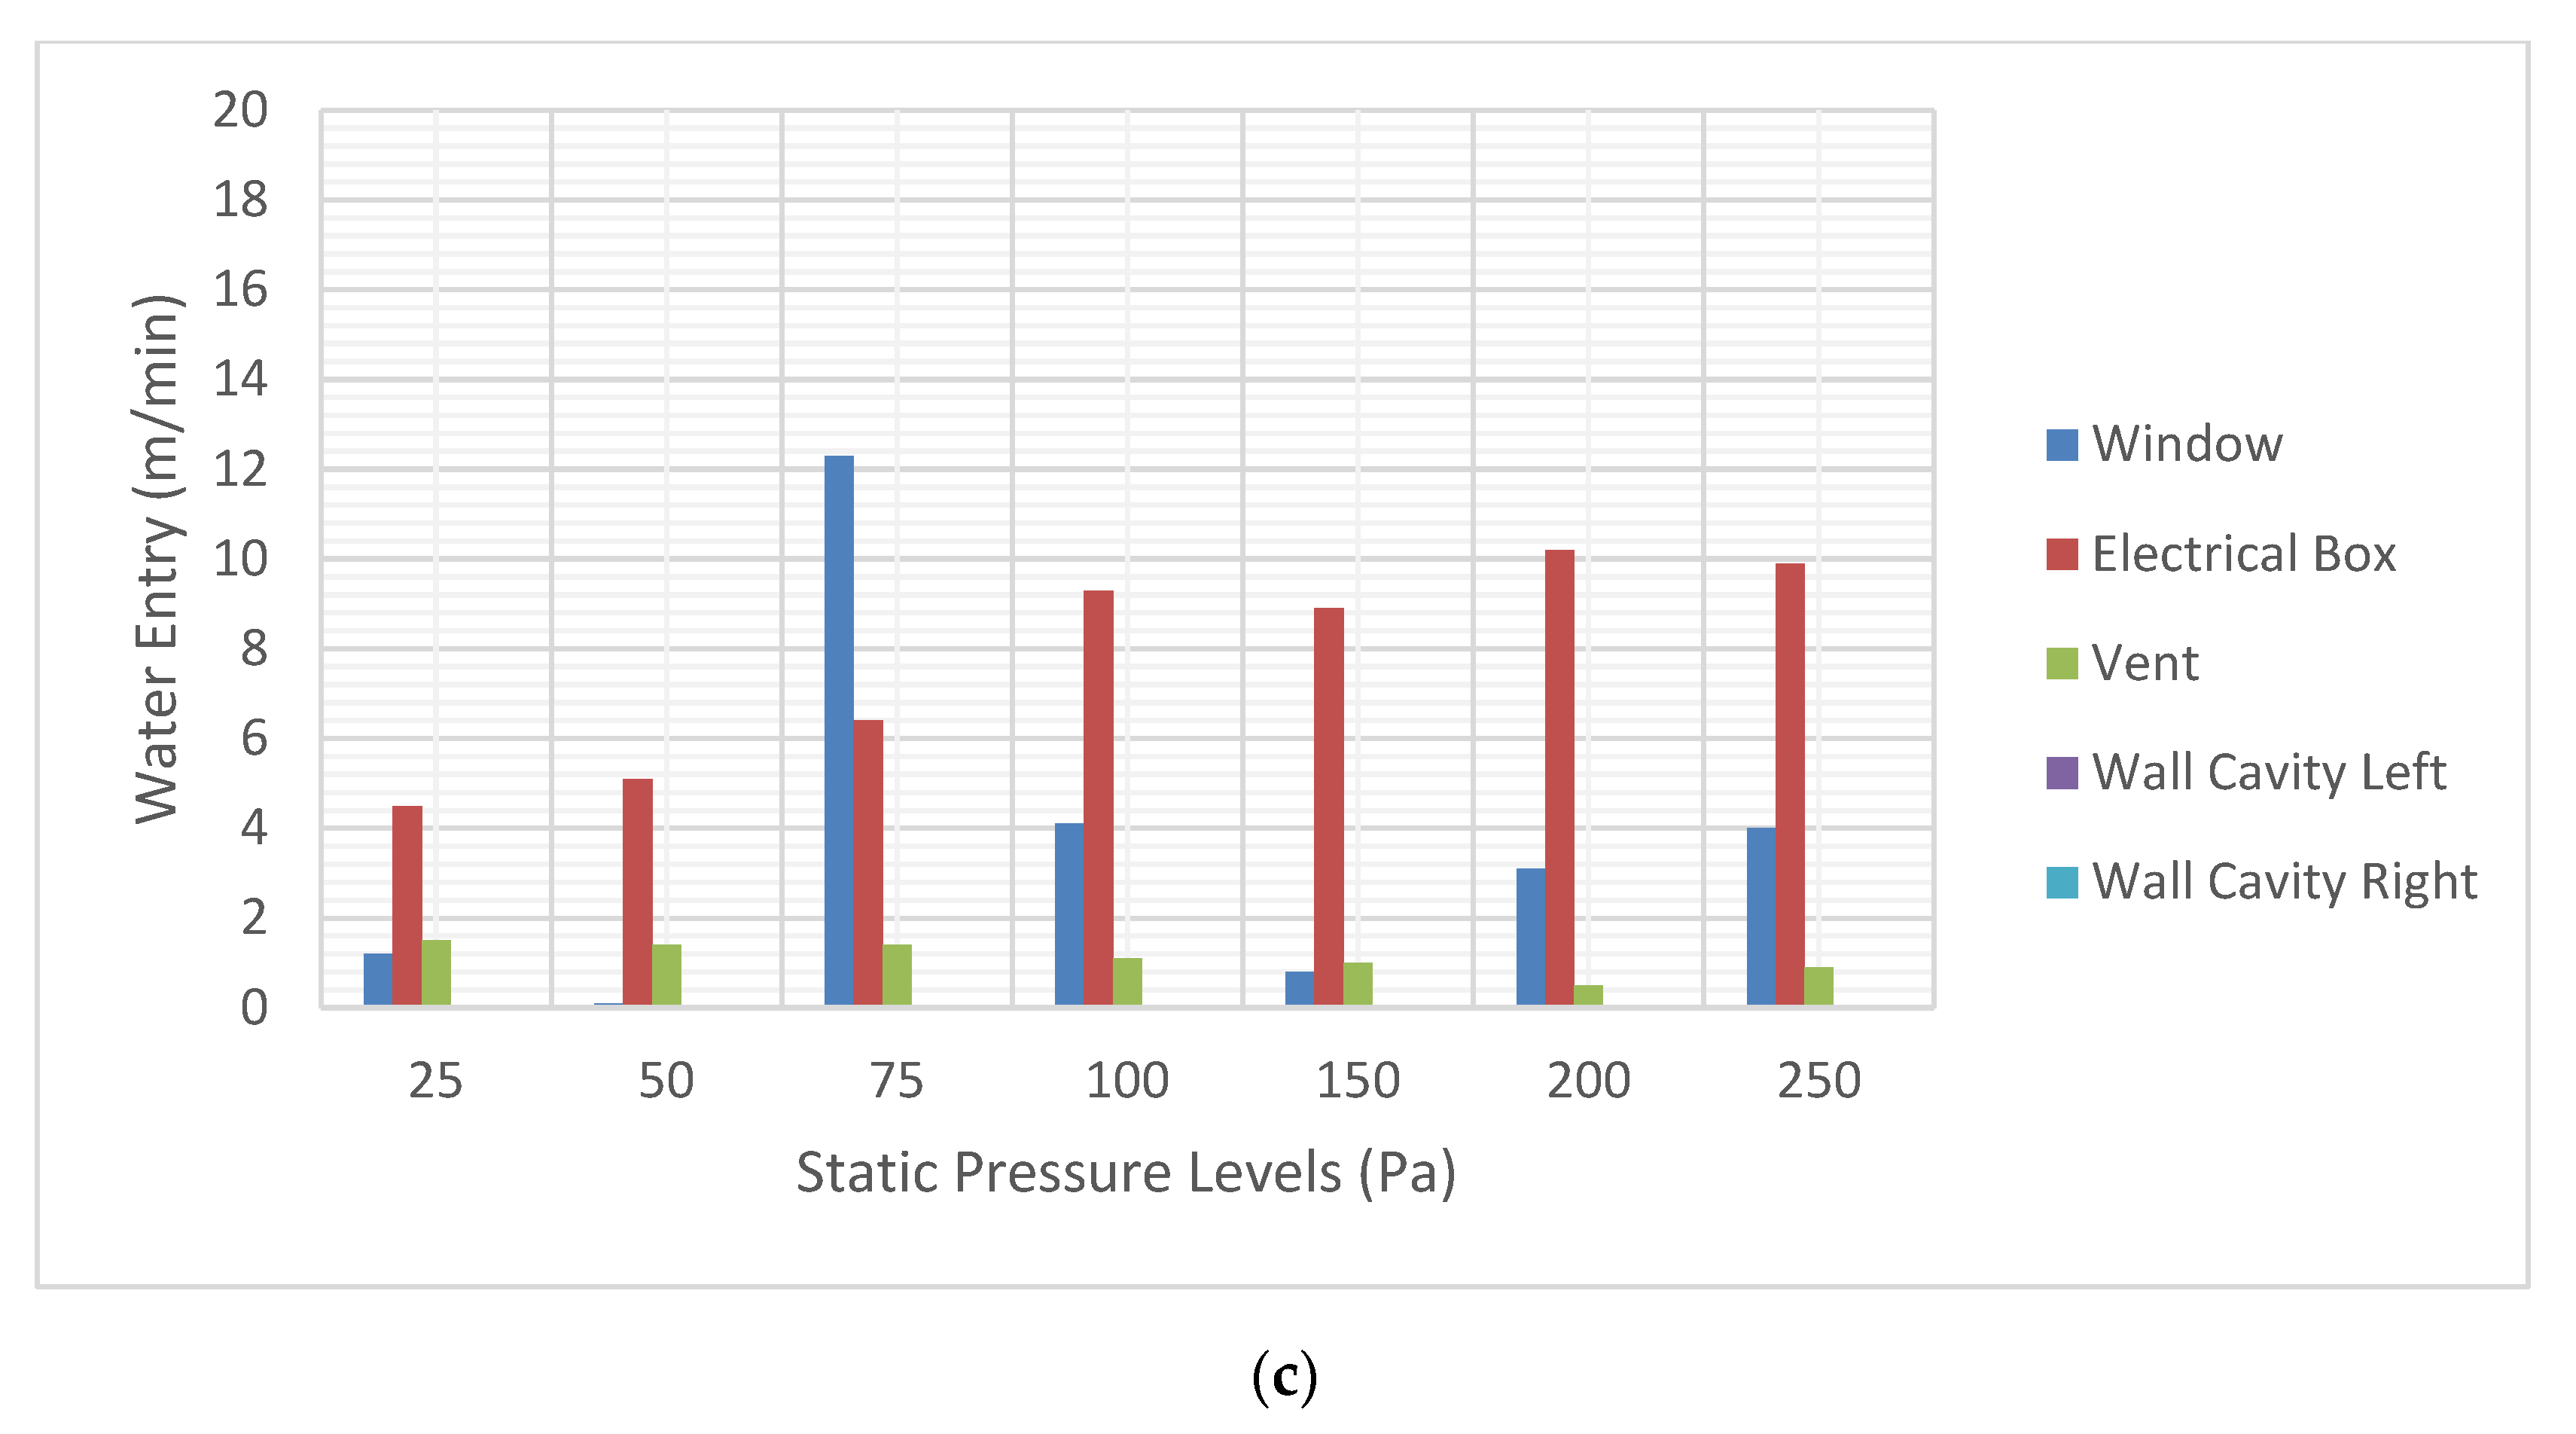
3.1. Water Entry Results and Water Entry Equations

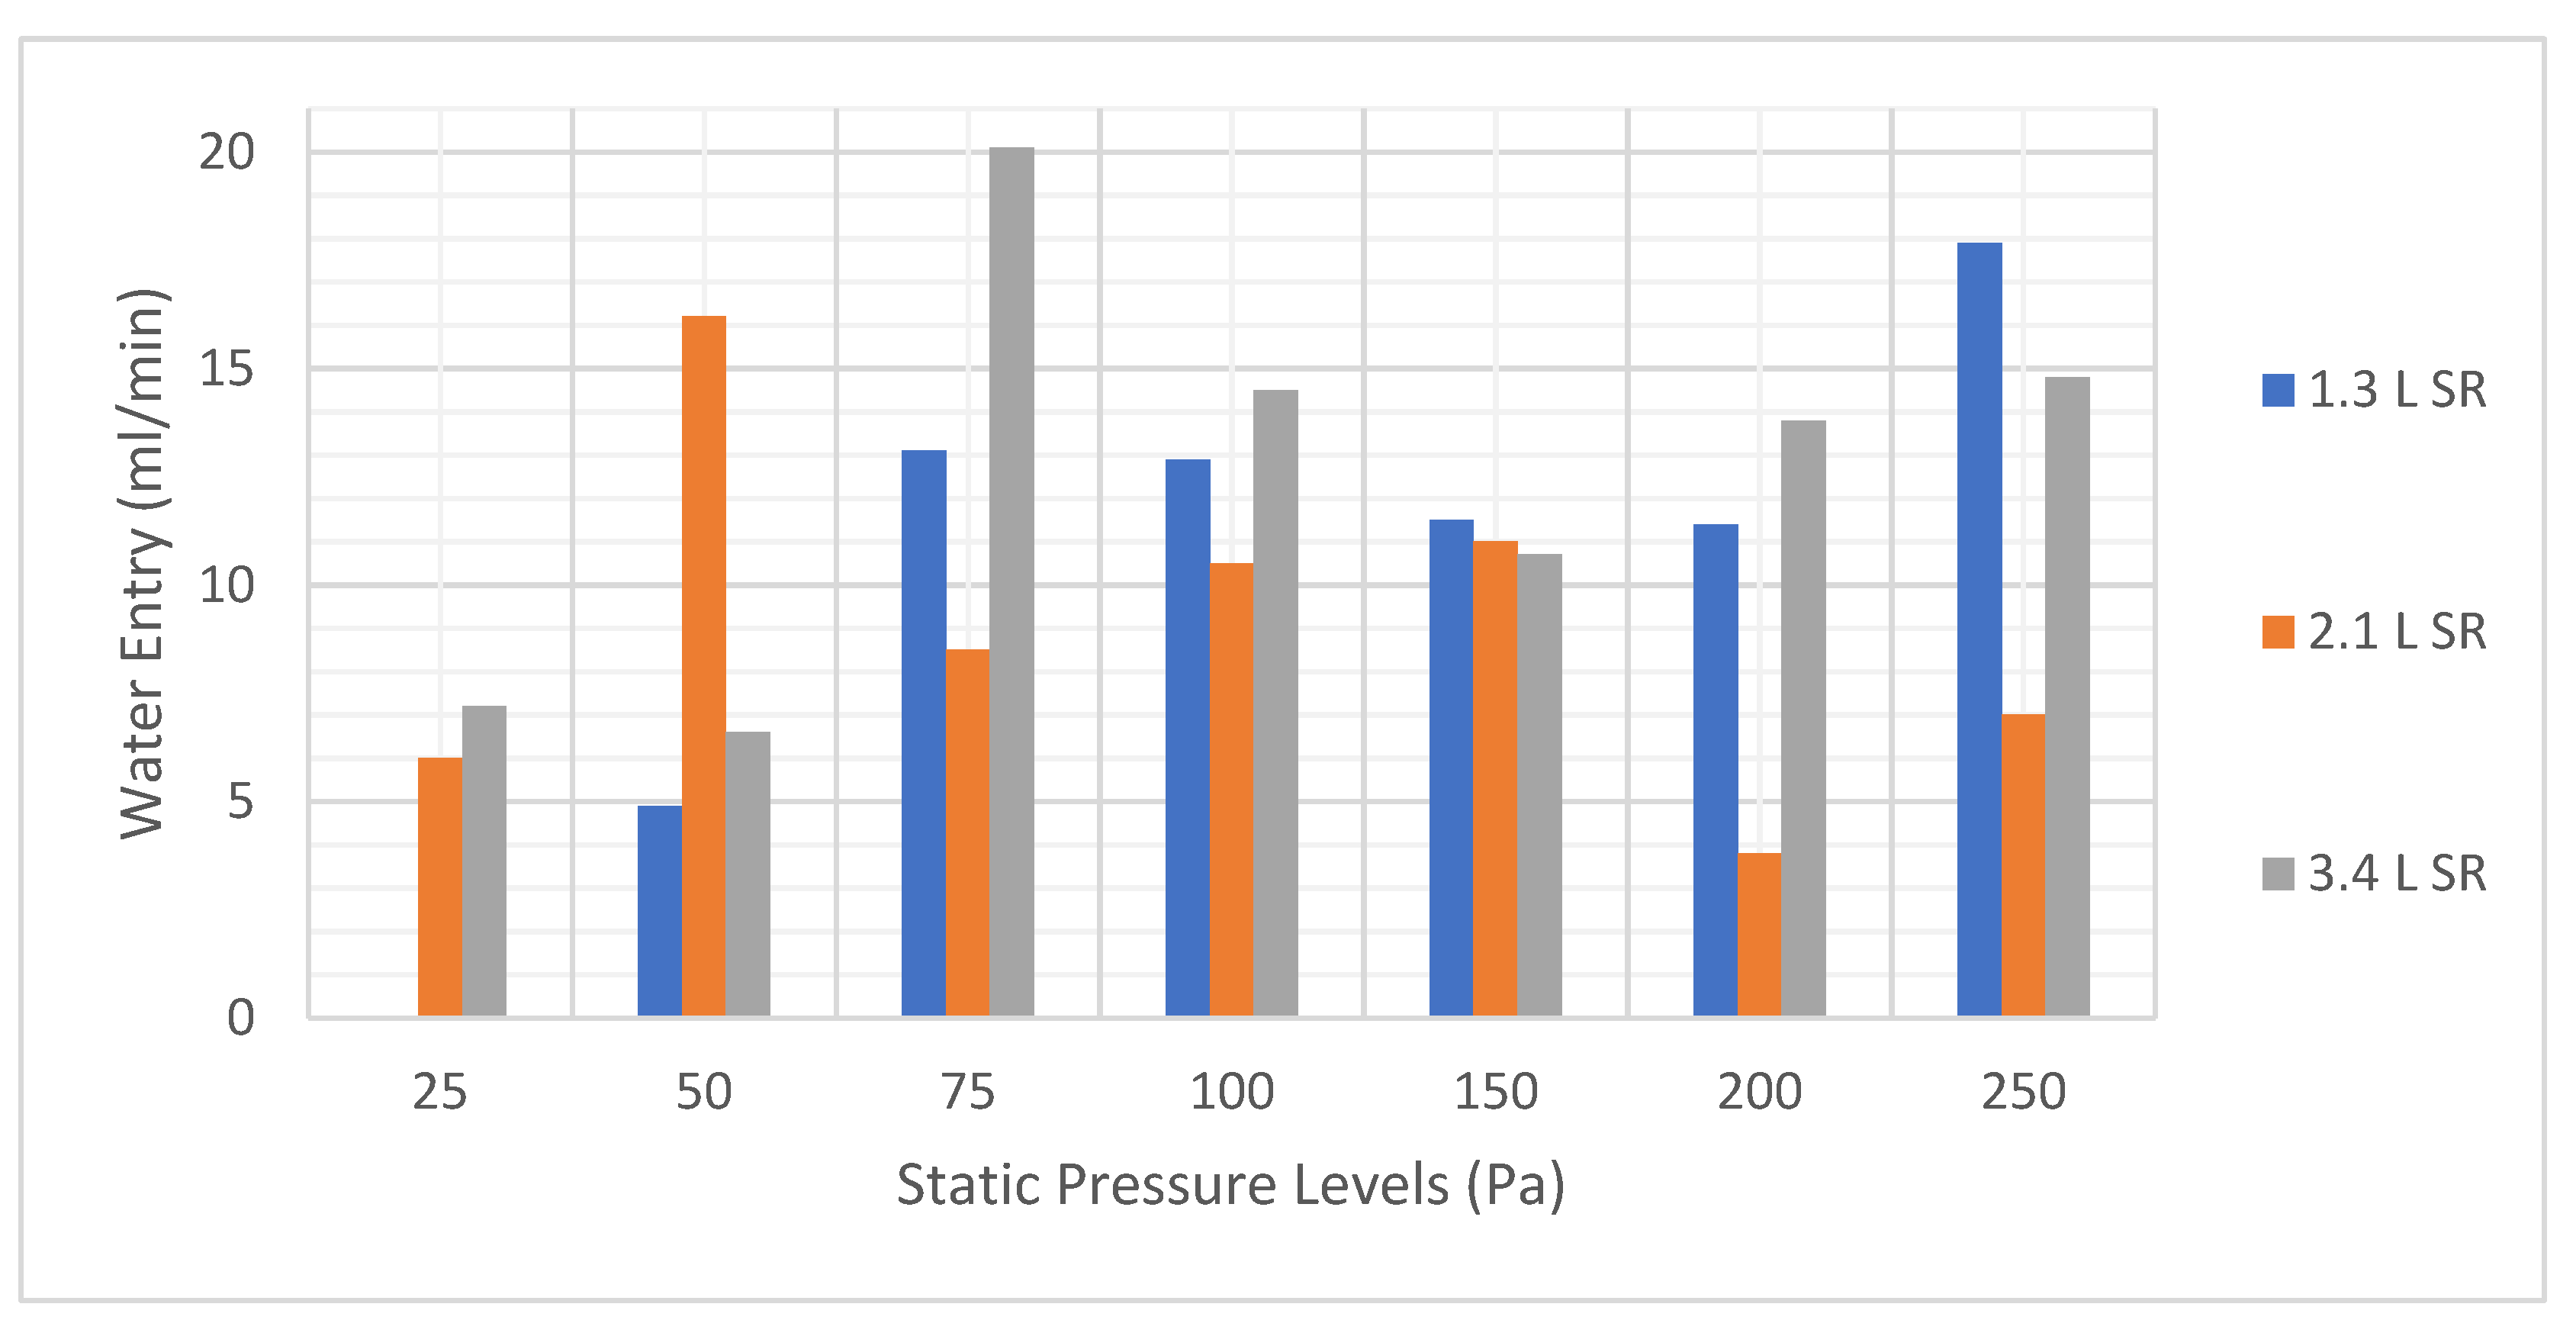
3.1.1. Static Results

Water entry results obtained from tests under static pressure for different spray rates are shown in Figure 7. The trough below the window collected water for most of cases tested at spray rates of 1.3 and 2.1 L/min-m2. More water penetrated through the deficiency at the window than the other two types of components under most of the static pressure steps. No clear correlation was observed between the static pressure and the water entry rate, and between the spray rate and the water entry rate at the window. As to the electrical outlet box, the greatest amount of water was collected at 3.4 L/min-m2 spray rate whereas almost no water was collected at a spray rate 2.1 L/min-m2. For deficiency at this location, a positive relation was found between the pressure level and water entry rate for 1.3 and 3.4 L/min-m2 spray rates. The amount of water that penetrated through the ventilation duct was not sensitive to the test pressure level. Compared with the other two types of appliances, a relatively low amount of water was collected by the trough at the ventilation duct. In addition, no water was collected at the bottom of the wall assembly in the drainage cavity for the entire static pressure test period, as well as by all water reservoirs at a water spray rate of 1.3 L/min-m2 under pressure level of 25 Pa.
The sum of infiltrated water from all deficiencies for each spray rate under static pressure is depicted in Figure 8. Neither the spray rate nor the pressure level determined any level of monotonous tendency for the water entry amount.

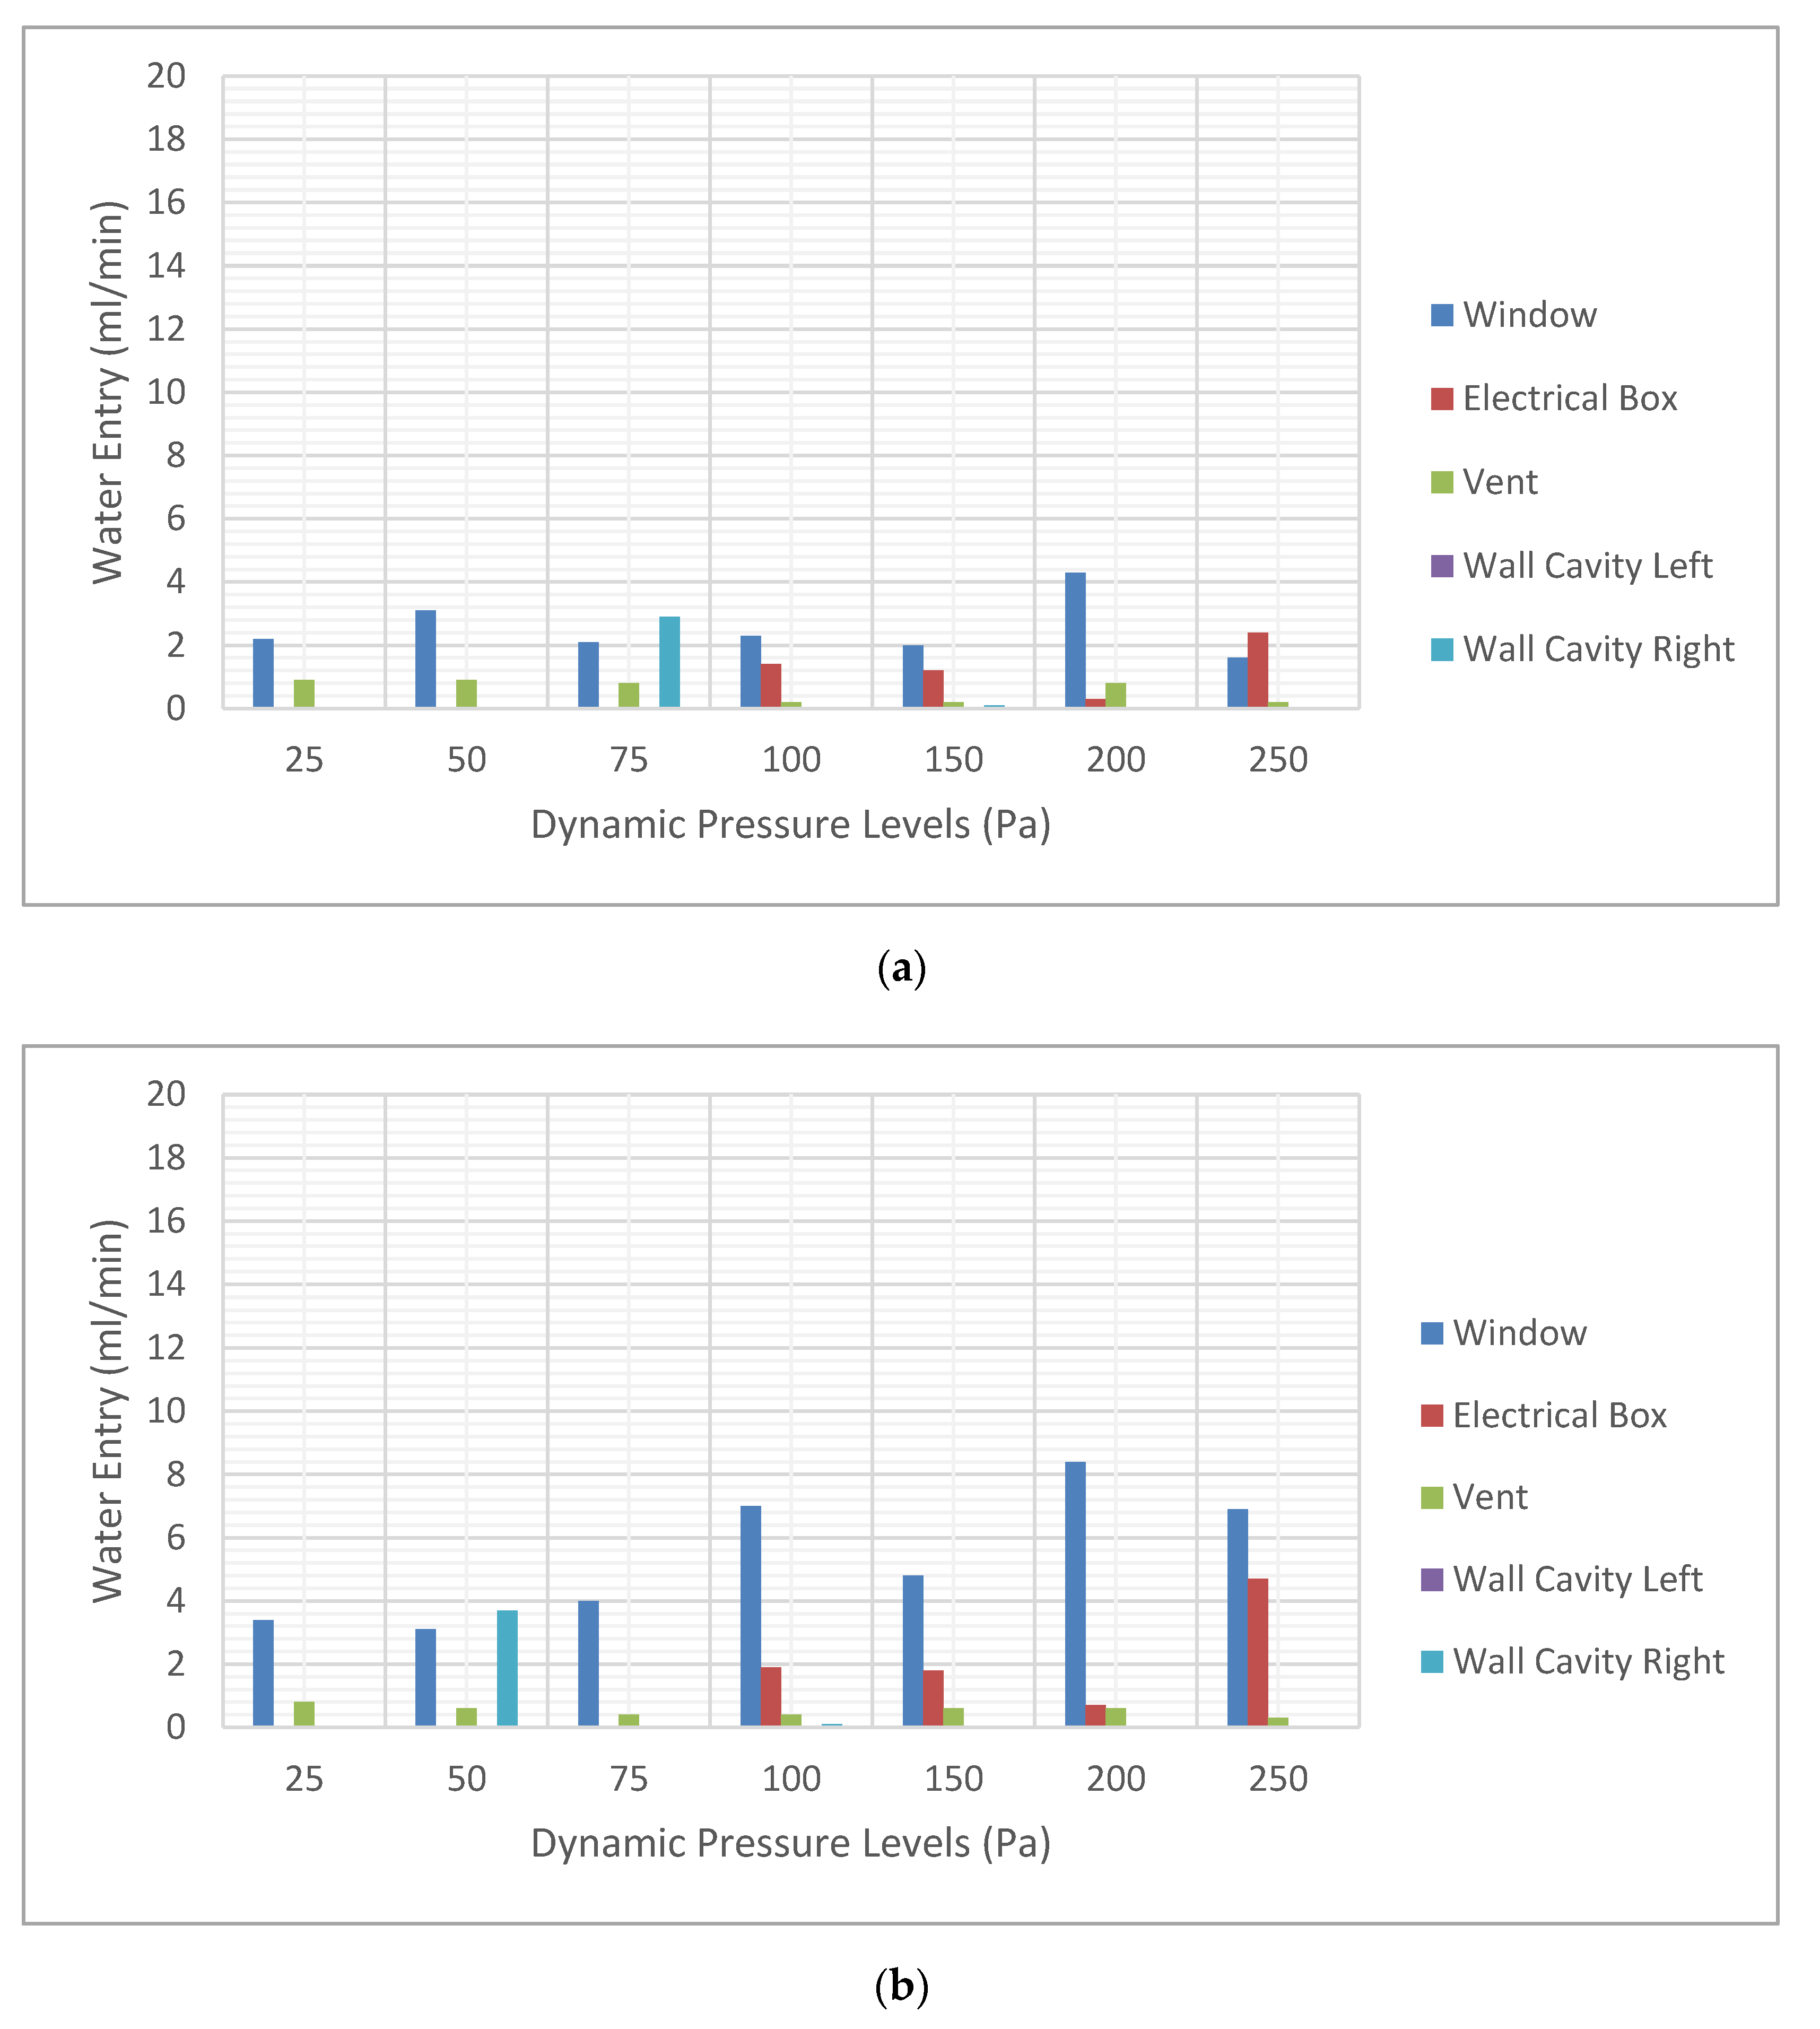
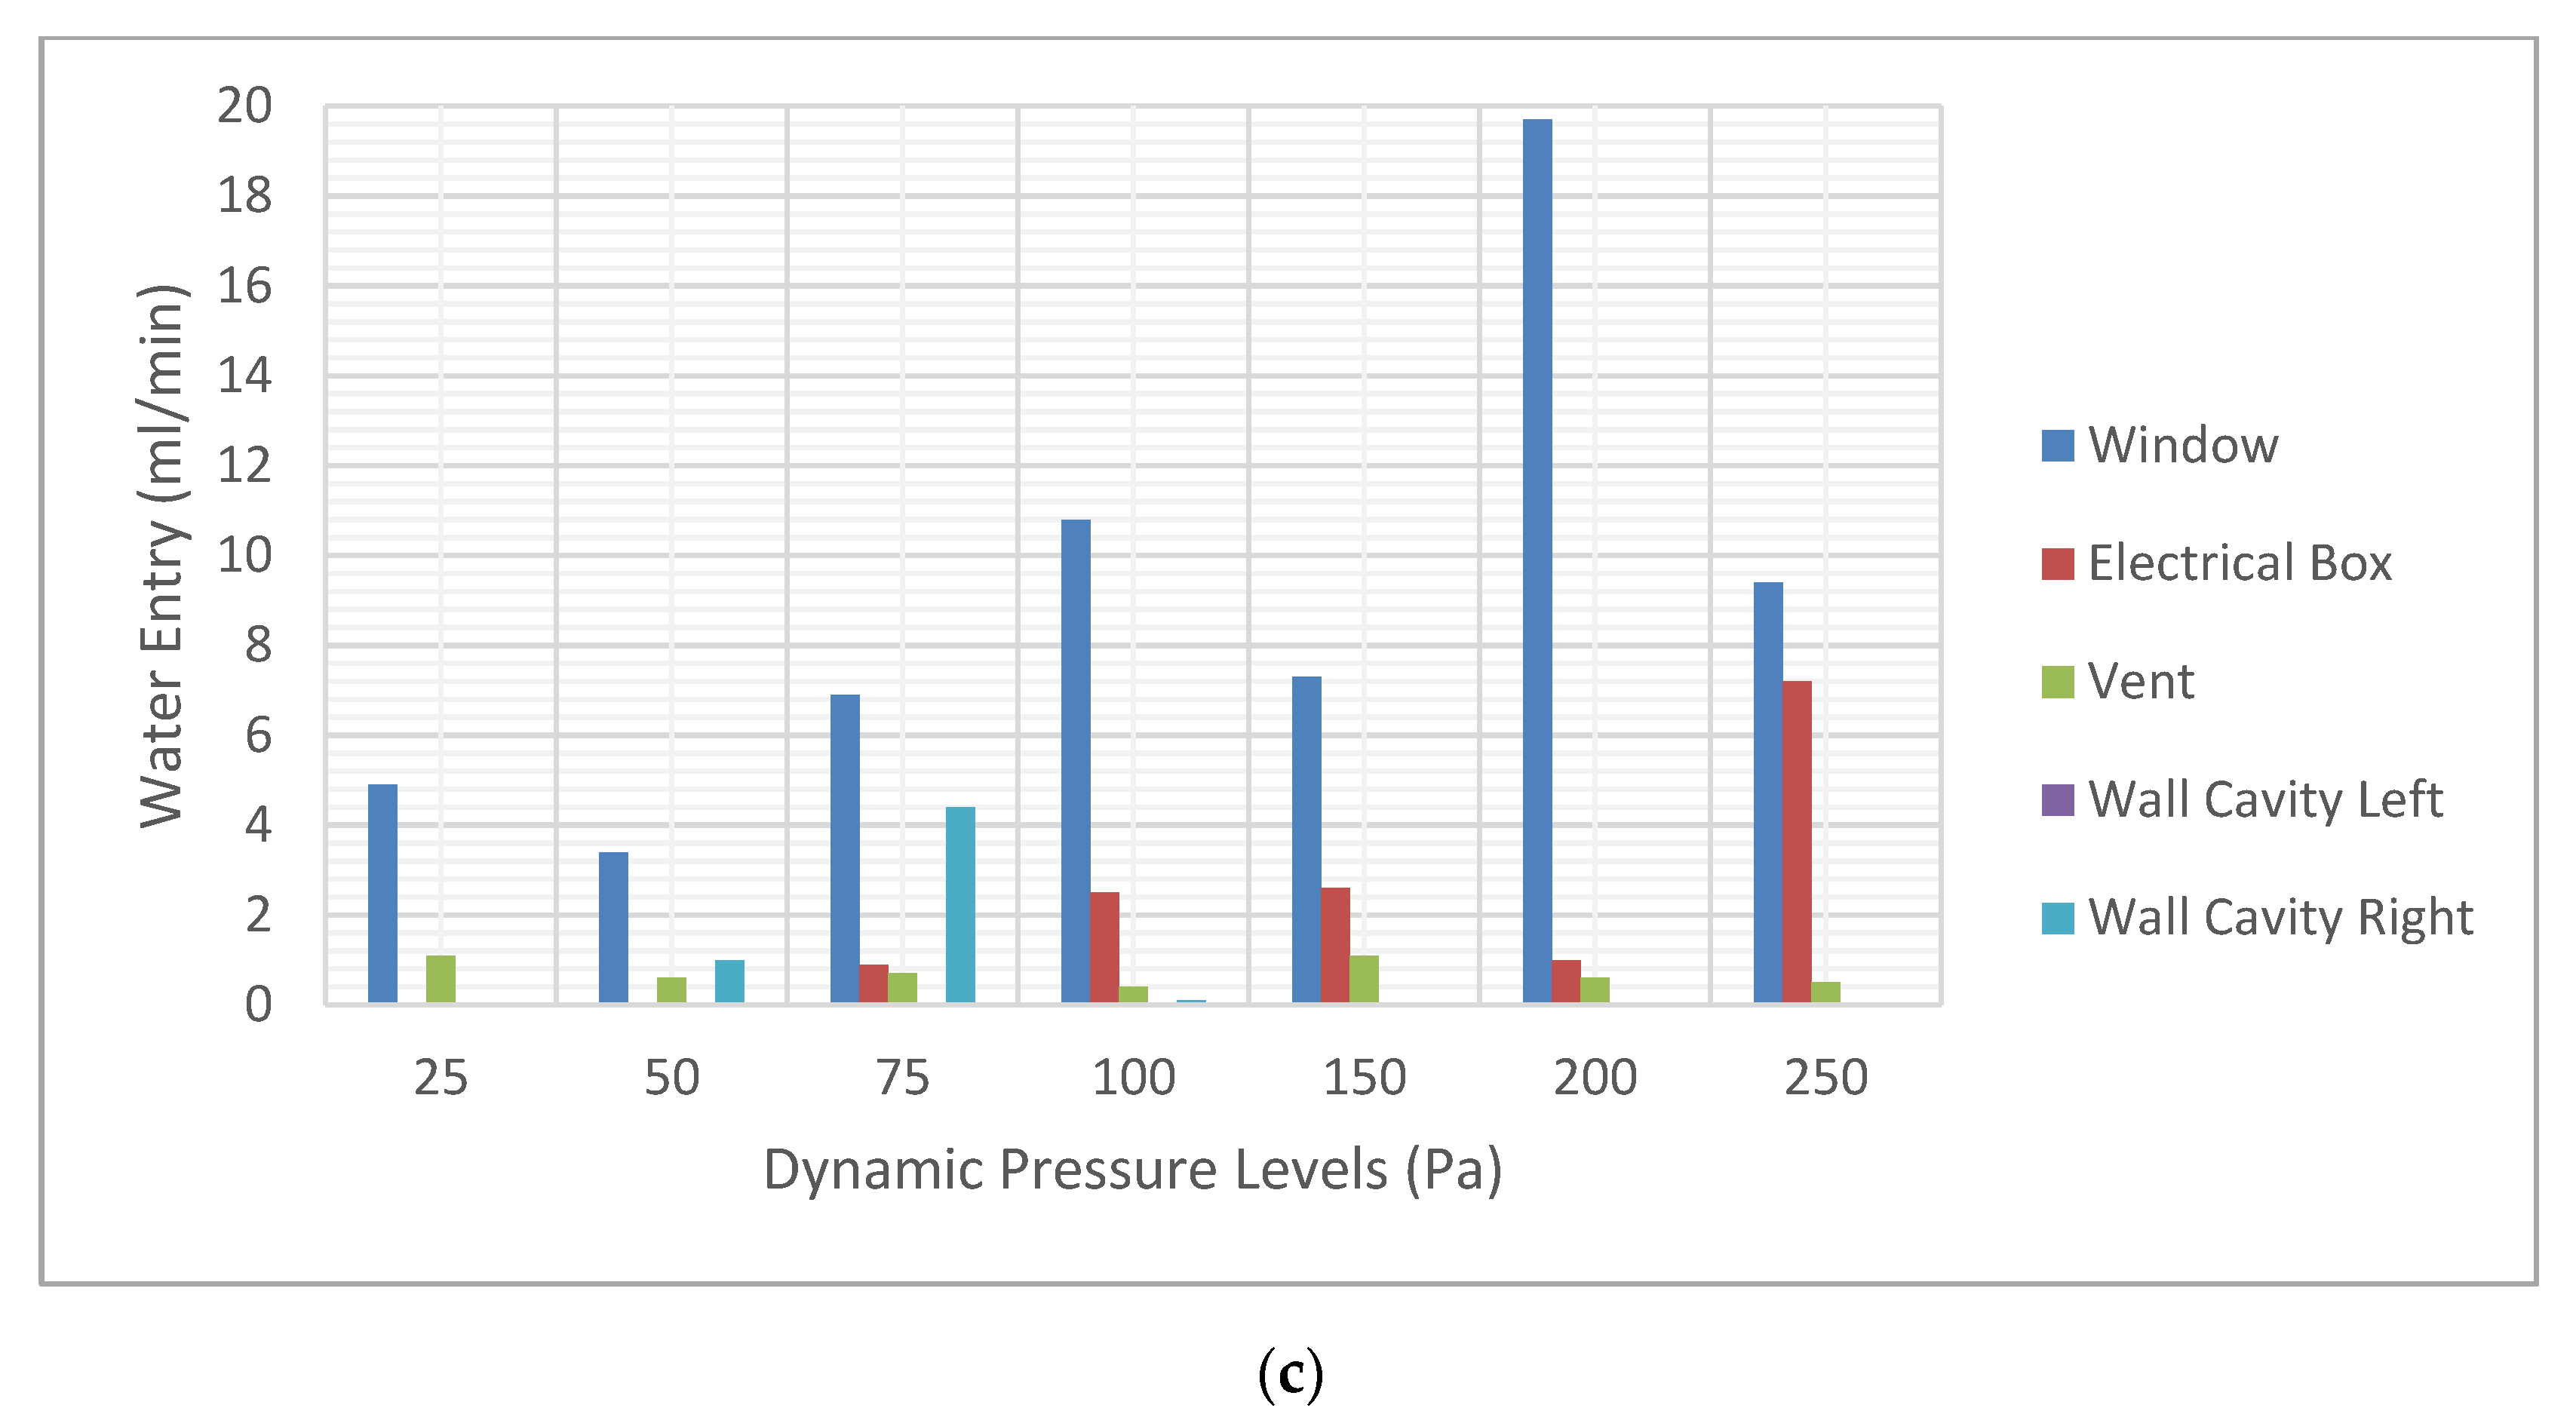
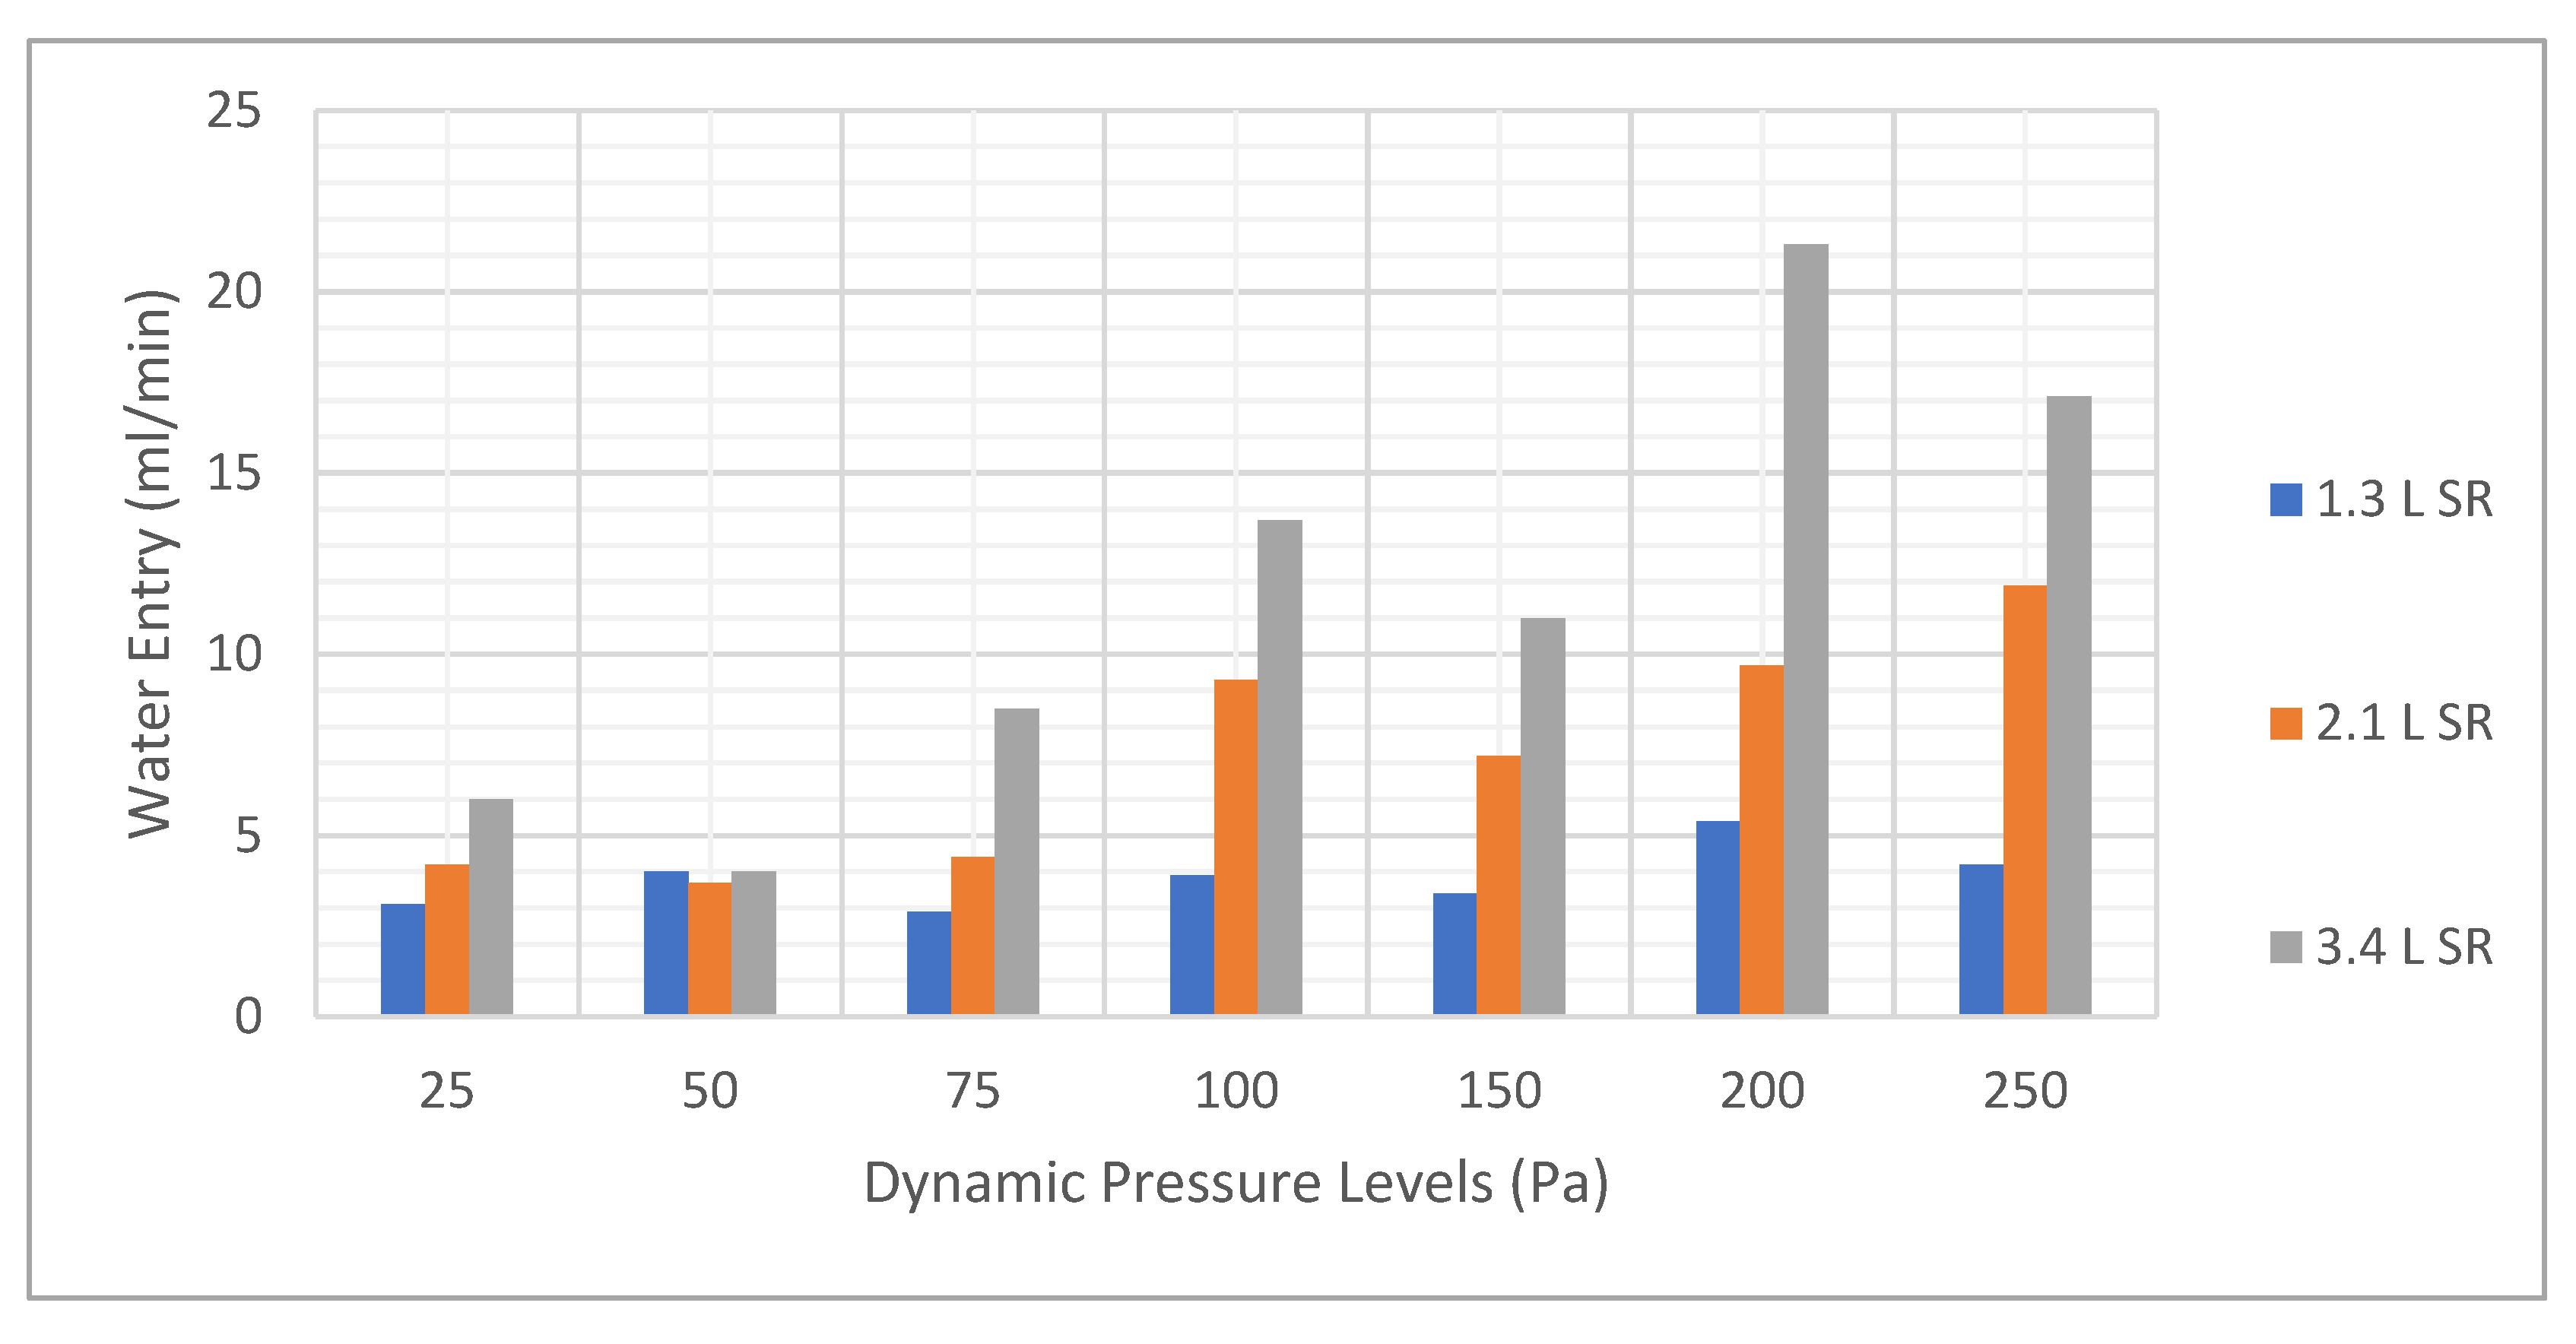
3.1.2. Dynamic Pressure Results

The watertightness test results under the dynamic pressure for each spray rate are shown in Figure 9. The trough under the window collected more water than all troughs at other locations for most cases. Moreover, water collected under the window from the 200 Pa dynamic pressure level was more than that collected from all other pressure levels for all spray rates. As well, more water was collected at the 2.1 L/min-m2 spray rate than the other two spray rates. As for the electrical box, no water was collected at pressure levels under 100 Pa with spray rates of 1.3 and 2.1 L/min-m2, and under 75 Pa with a spray rate of 3.4 L/min-m2. At the same time, and for all spray rates, most water collected at the electrical box was at the 250 Pa dynamic pressure level. The amount of water that penetrated the ventilation duct was less than 1 mL/min for all cases and the highest water entry rate occurred at the 25 Pa pressure level for all spray rate levels. In some cases, a portion of water reached the bottom of the wall assembly. All of which would be drained away in real applications.
The total water collected by all three components at each water spray rate tested under dynamic pressure fluctuations is shown in Figure 10. Clear tendencies in respect to the water entry amount, dynamic pressure levels and spray rates were revealed. In general, both the level of dynamic pressure and the spray rate were positively correlated with the amount of water entry. Some results were inconsistent with the expected response of the test specimen in relation to applied WDR loads in this test; for example, the water collected at the 200 Pa dynamic pressure level and with a water spray rate of 3.4 L/min-m2 is more than that at the 250 Pa dynamic pressure level with the same spray rate; such results could be mitigated by increasing the number of repeated tests.

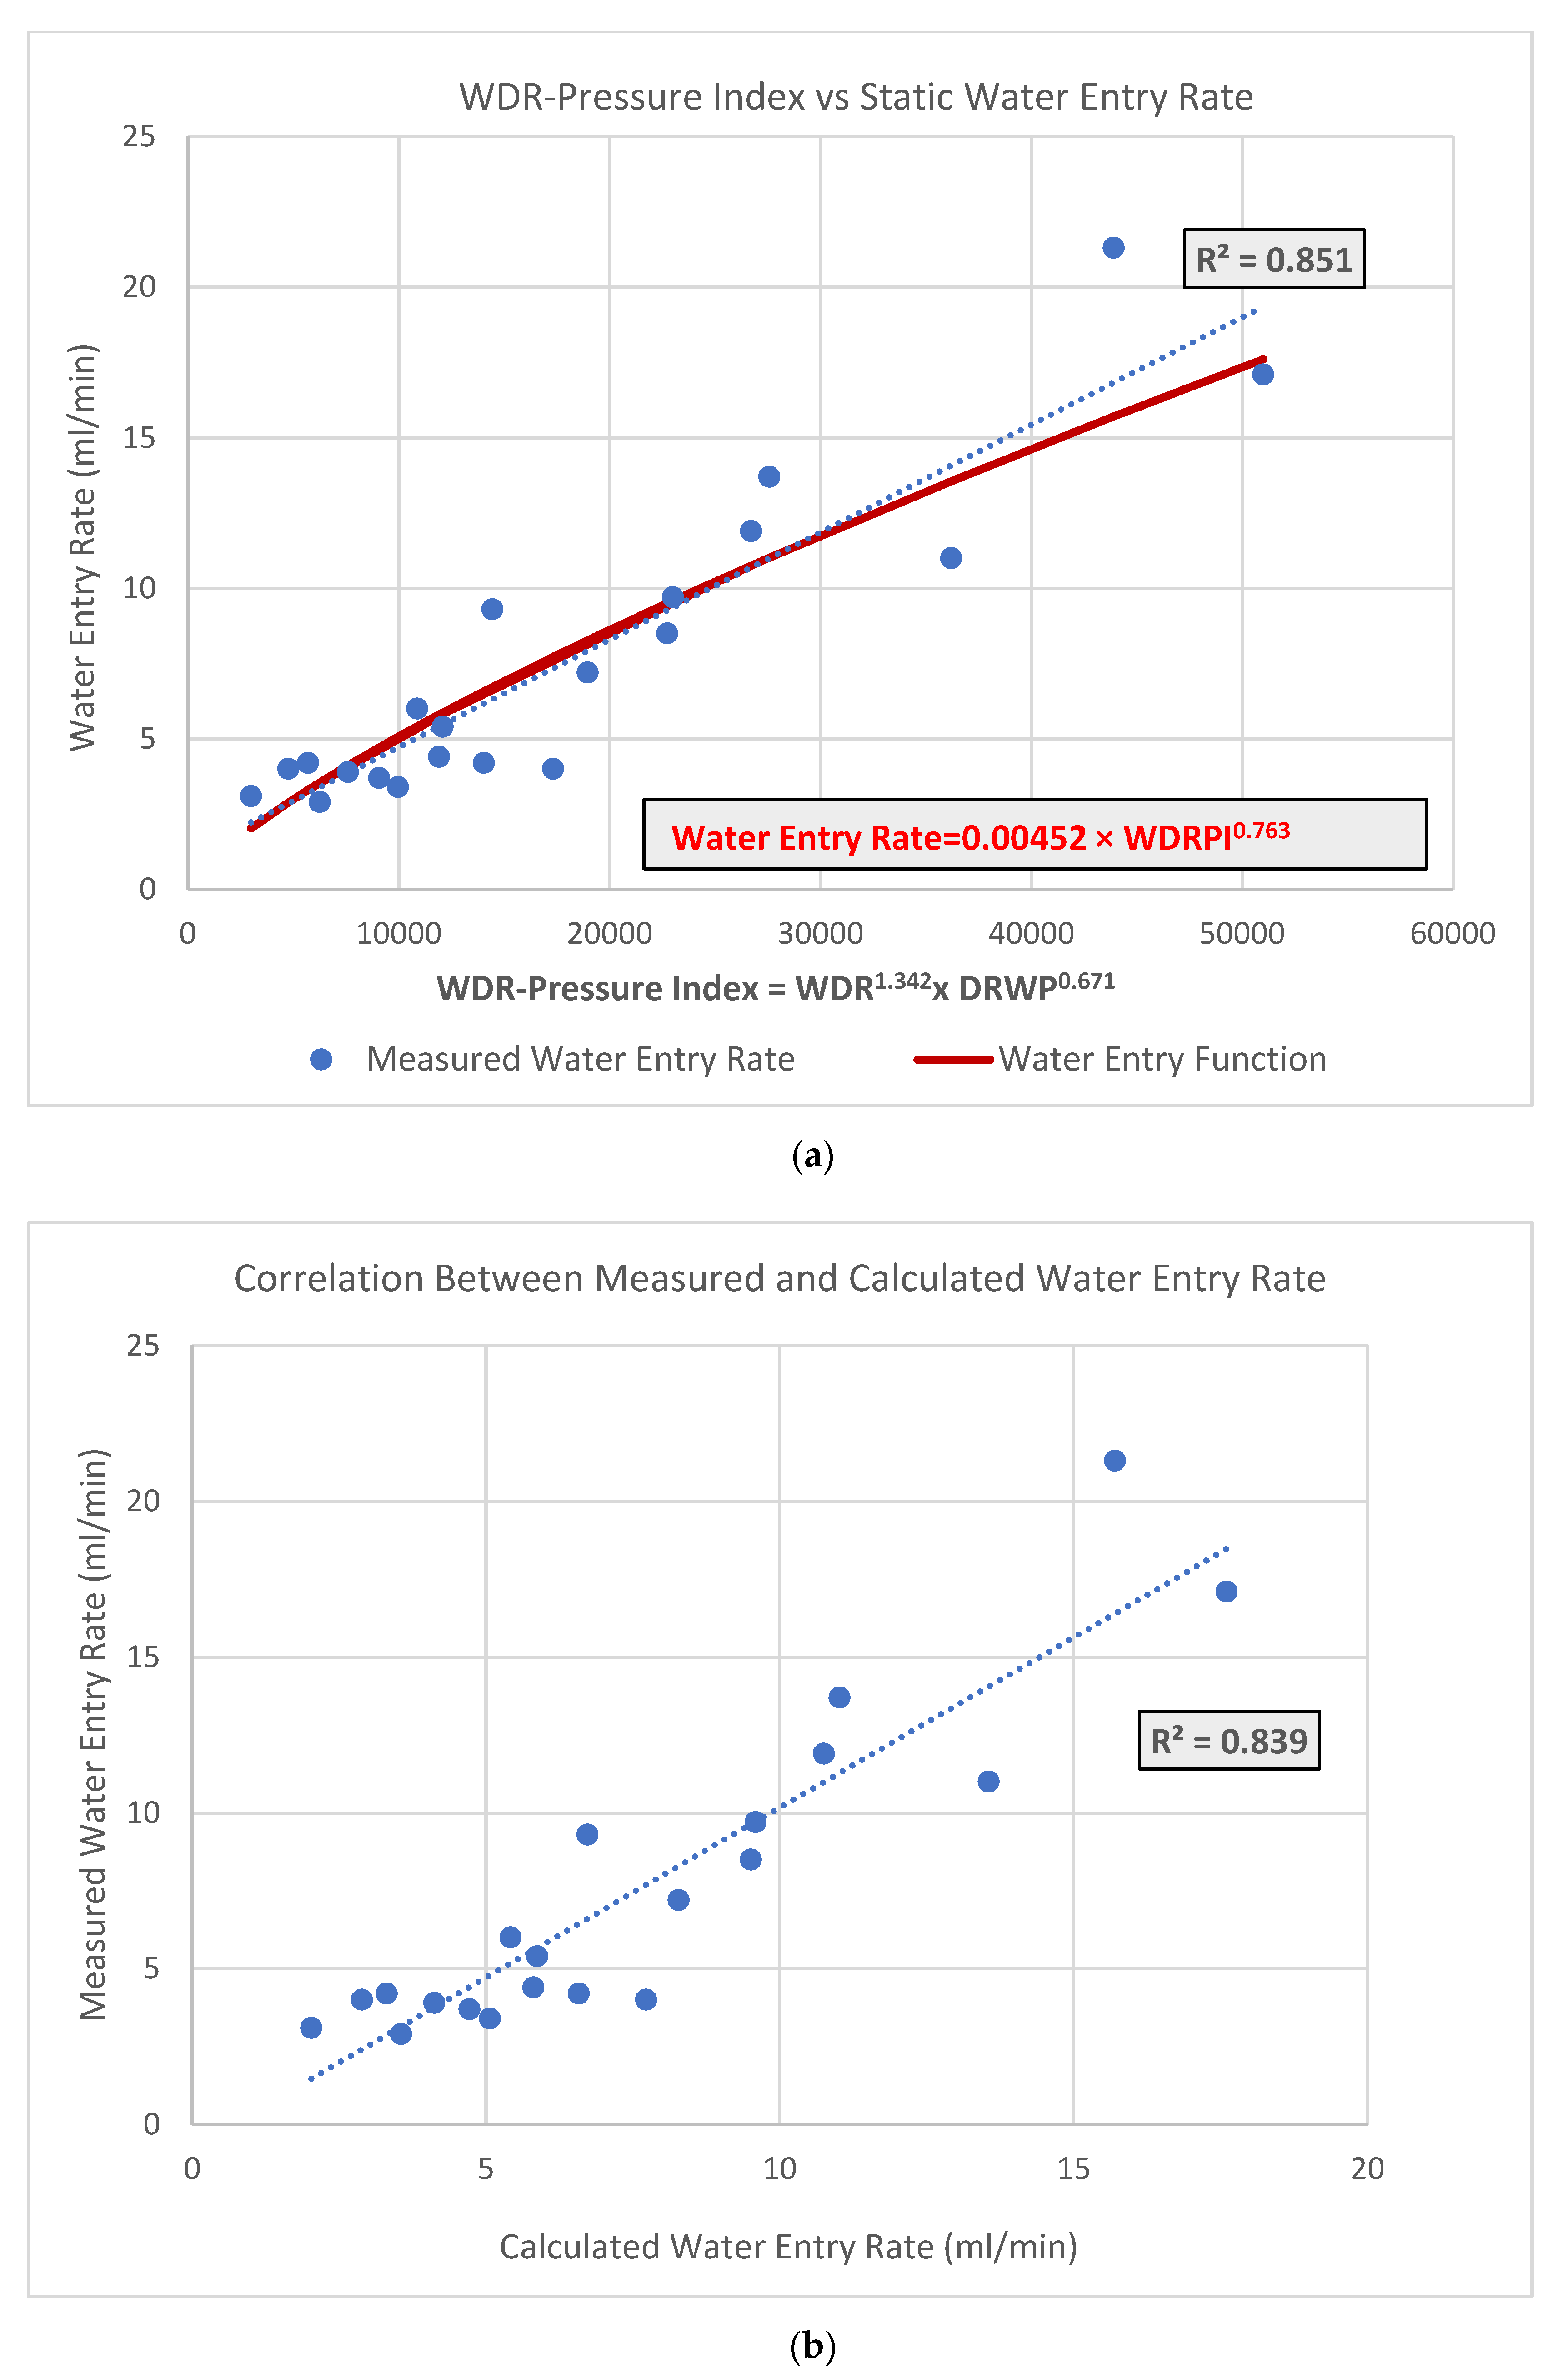
3.1.3. Water Entry Function

The first step to obtain the water entry function that can most accurately estimate the water entry rate to a wall assembly is to determine the adjustment coefficients for the WDRP Index [30]. The WDRP Index (WDRPI), as shown in Equation (5), has been proposed to determine the joint effects of WDR intensity (mm/h) and co-occurring DRWP (Pa) to the water entry rate of a wall assembly. The spray rates used in the watertightness test have a unit of L/min-m2 and it is equivalent to 1/60 of value of the WDR intensity (mm/h). The exponential adjustment coefficients α and β represent the relative impact of these two parameters on the water entry rate. As an example, larger values of α than β means that the water entry rate of the wall assembly is more sensitive to the WDR intensity than the DRWP applied to the surface of the wall assembly.
W D R P   I n d e x = W D R α × D R W P β
The values of these two coefficients were obtained from correlating the WDRPI to the measured water entry rates under different levels of spray rates and applied pressures which, respectively, represent WDR intensity and DRWP. In this study, the water entry rate for all deficiencies under the dynamic pressure was used to fit with the WDRP Index and generate values for the coefficients. The values for α and β were determined as 1.342 and 0.671, respectively, as obtained from the fitting process where the function given in Equation (5) had an R-Squared value of 0.851.
An exponential function (Equation (6)) using the WDRPI as the variable was thereafter fitted to the measured water entry rate. Its coefficients, a and b, were determined by the least-square method and their respective values for the vinyl-clad wall assembly, as tested, were 0.00452 and 0.763.
W a t e r   E n t r y   R a t e = a × W D R P I b
The fitting process and the correlation between the measured and calculated water entry rate are shown in Figure 11. Additionally, results from a T-test determined that there was no significant difference between the measured water entry rate and the calculated water entry rate. A summary for determining the water entry function of the tested vinyl-clad wall assembly is given in Table 1. By using this approach, the moisture load for the test specimen could be determined based on hourly WDR intensity and hourly DRWP which are available for most locations in Canada over a long period of time.

3.2. Air-Leakage Rate and Water Entry Rate

The flow rates, the volume of air that inflated the air-leakage test apparatus, for different static pressures applied to the surface of wall assembly are shown in Table 2. The total leakage was calculated by dividing the flow rate by the area of the wall assembly and 60 s/min. The inherent leakage of the steel frame and wall assembly perimeter seals were denoted as the base leakage. The air-leakage rate of the wall assembly, wall leakage, was then calculated by subtracting the base leakage from the total leakage. The wall leakage for the tested vinyl-clad wall assembly was 0.119 L/s-m2 which was lower than the 0.2 L/s-m2 requirement in the National Building Code [27]. The wall leakage rates increased at each increment of static pressure.
Correlations between the wall leakage rate and the water entry rate for different deficiencies and different spray rates are given in Table 3. Relatively strong correlations between these two parameters were observed for deficiency at the window with a 1.3 L/min-m2 spray rate, at the electrical box with spray rates of 1.3 and 3.4 L/min-m2, at ventilation duct with 3.4 L/min-m2, as well as the total water entry rate from all deficiencies at a spray rate of 1.3 L/min-m2. No meaningful correlation could be established for the remaining cases. These observations also indicate that the response of water entry rates to the applied pressure varied when subjected to different spray rates.

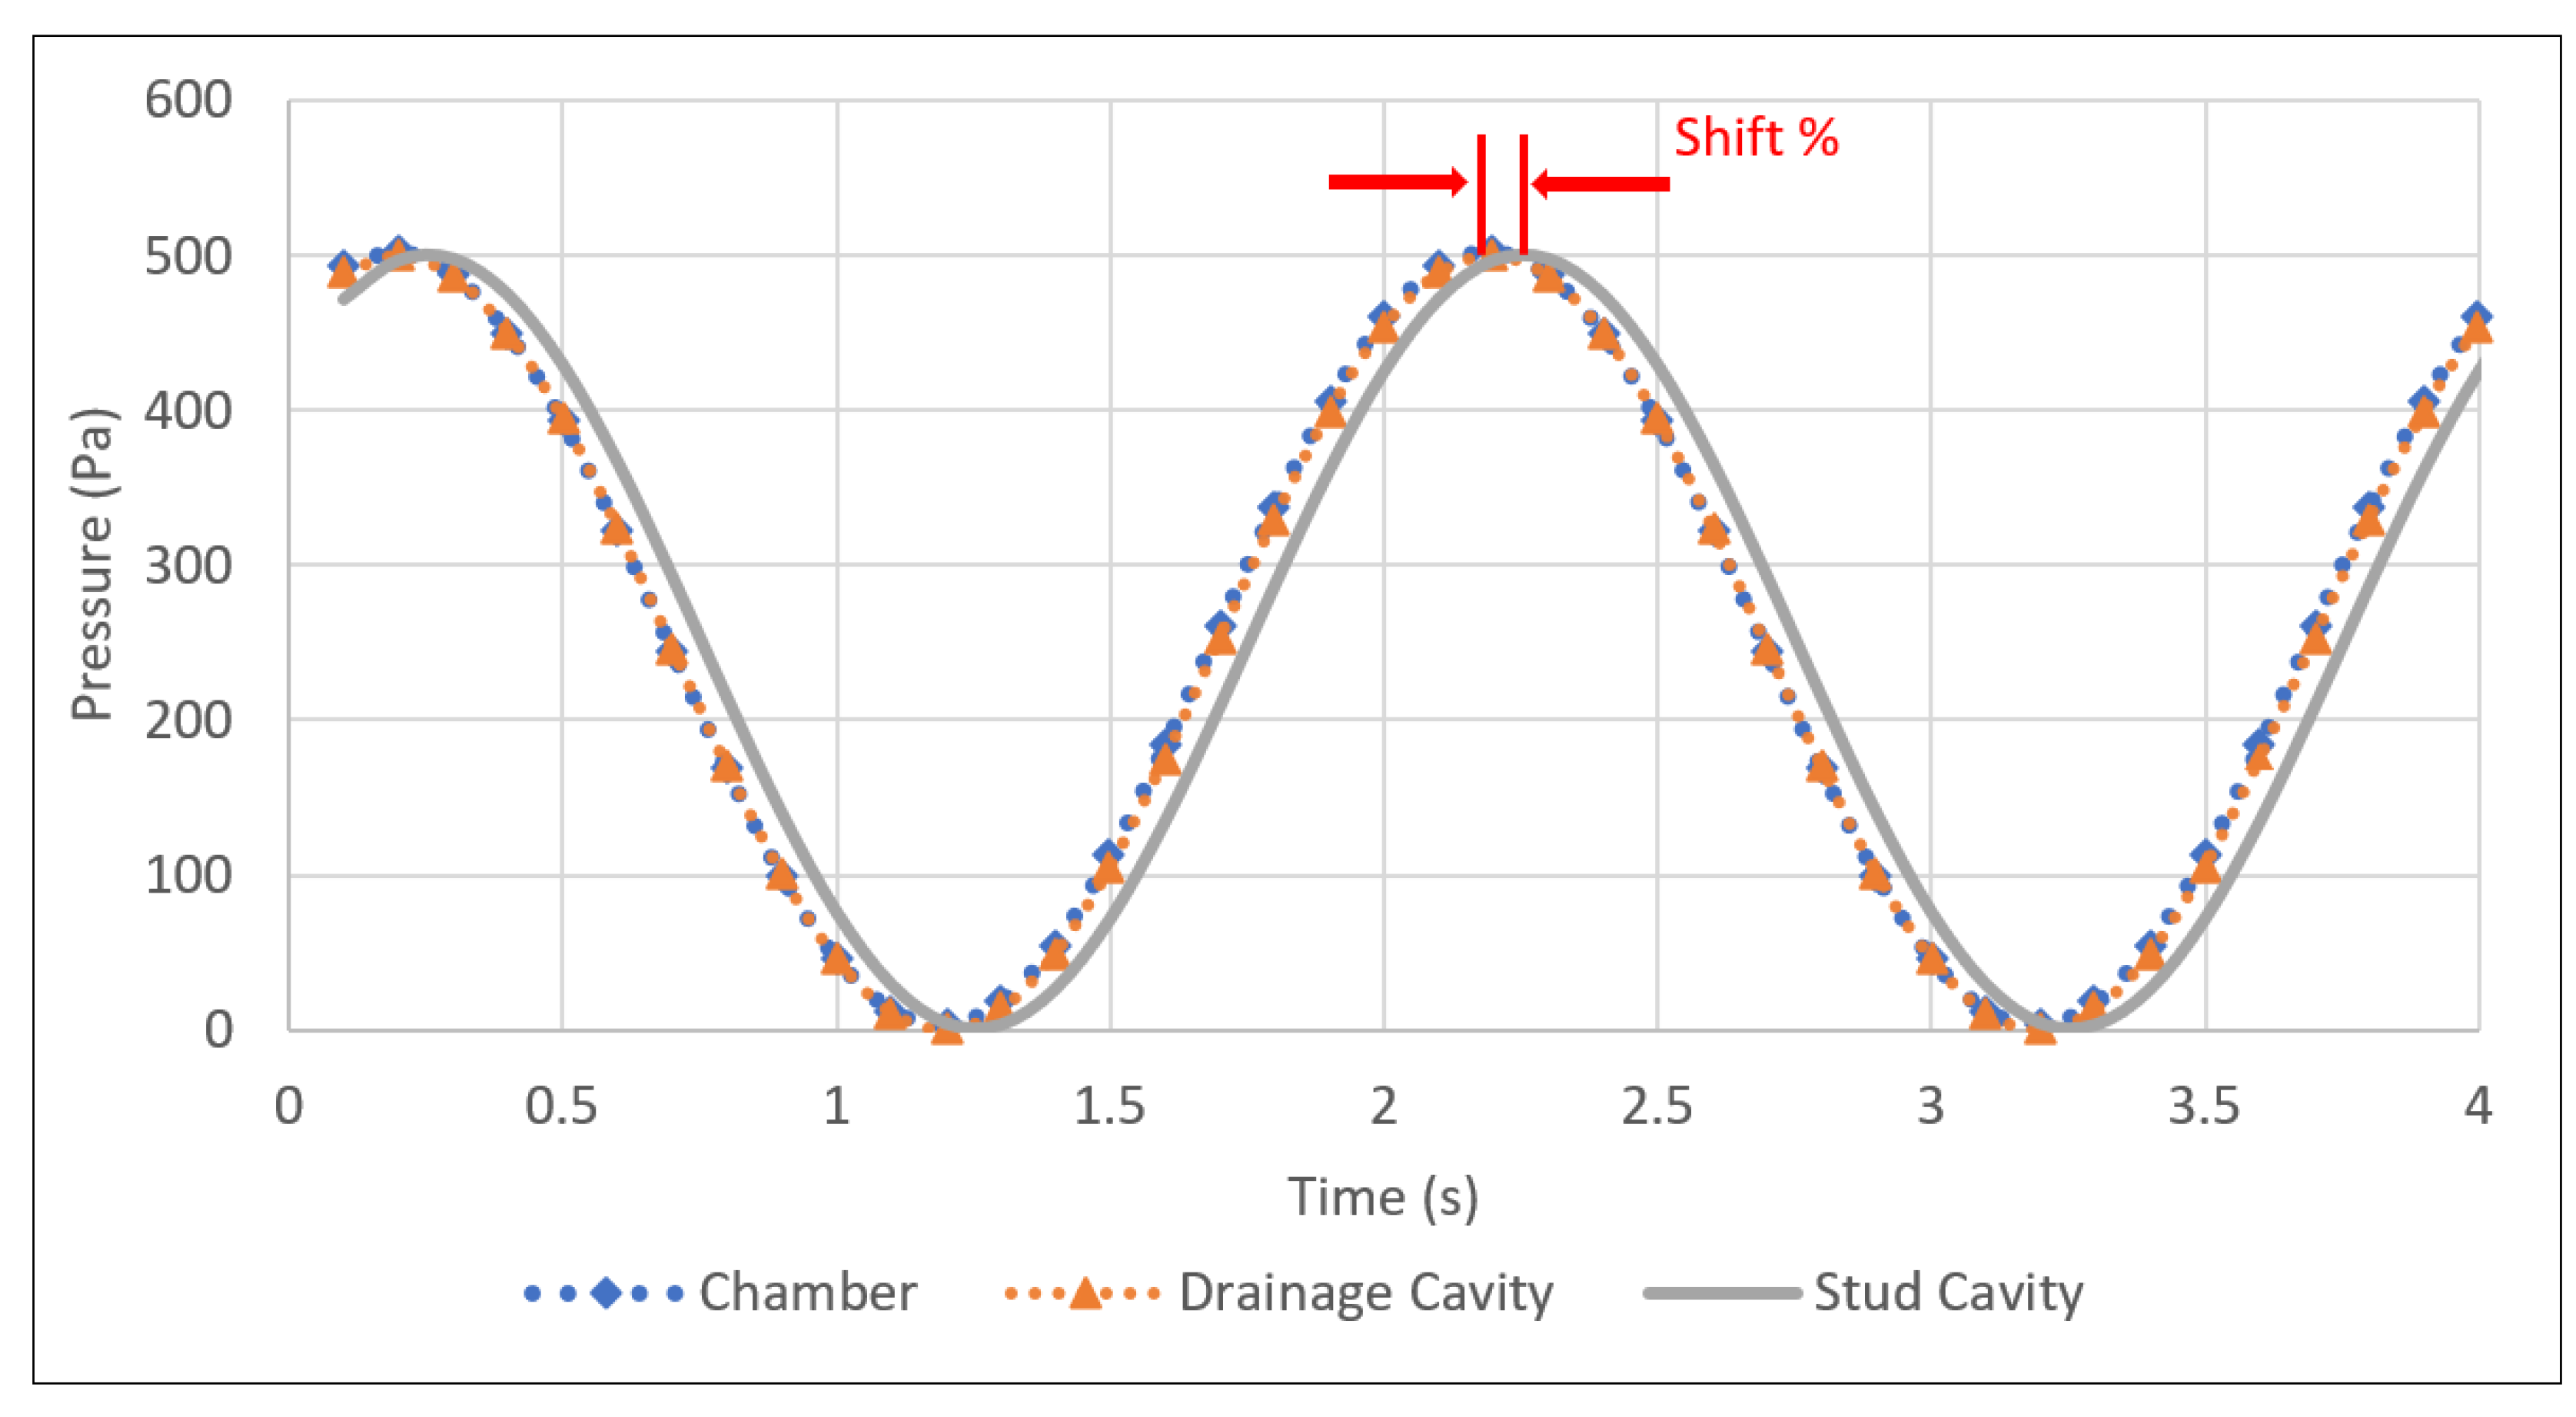
3.3. Pressure Equalization of the Wall Assembly

The pressure measurements for each experimental condition at different deficiencies across the wall assembly were concluded as three pairs of comparisons as shown in Table 4. One pair was the differences between the pressure on the exterior surface of the cladding, which is also the pressure in the DWTF chamber, and the pressure in the drainage cavity of the tested wall assembly. The second comparison was made between the pressure in the DWTF chamber and the pressure in the stud cavity of the tested wall assembly. In addition, the phase shift between sine waves, which were plotted by the pressure measured in the drainage cavity and in the stud cavity under dynamic pressure conditions, were also determined. An example of shifts between plotted sine waves is depicted in Figure 12. The root-mean-square values of each set of pressure data were used for comparison and the two sets of compared data were measured from the same location but different layers of the wall assembly.
The results shown in Table 4 indicate that pressure differences between the exterior surface of the cladding and the drainage cavity of the wall assembly were almost negligible for all locations and under all applied pressure levels. As well, pressure differences between the exterior surface of the cladding and the stud cavity were larger than that between the exterior surface of the cladding and the drainage cavity. At the same dynamic pressure step, the pressure in the stud cavity around the window seems slightly lower than the pressure around the electrical outlet box and ventilation duct. The ratio between the pressures on the exterior surface and in the stud cavity of the wall assembly were all very close to the averaged ratio regardless of the magnitude of pressure applied to the test specimen. This also meant that the absolute value of the pressure differences steadily increased with changes in applied dynamic pressure to the test specimen. The phase shift between the sine waves plotted by the pressure readings in drainage cavity and stud cavity was positively correlated with the magnitude of the pressure. Shifts that occurred around the window were larger than that which occurred at the other two locations. The pressure differences obtained from this step were determined by the airtightness of the wall assembly. The shift between each cyclic pressure wave is affected by the airtightness of the wall assembly as well as the flexibility of materials that compose the test specimen.

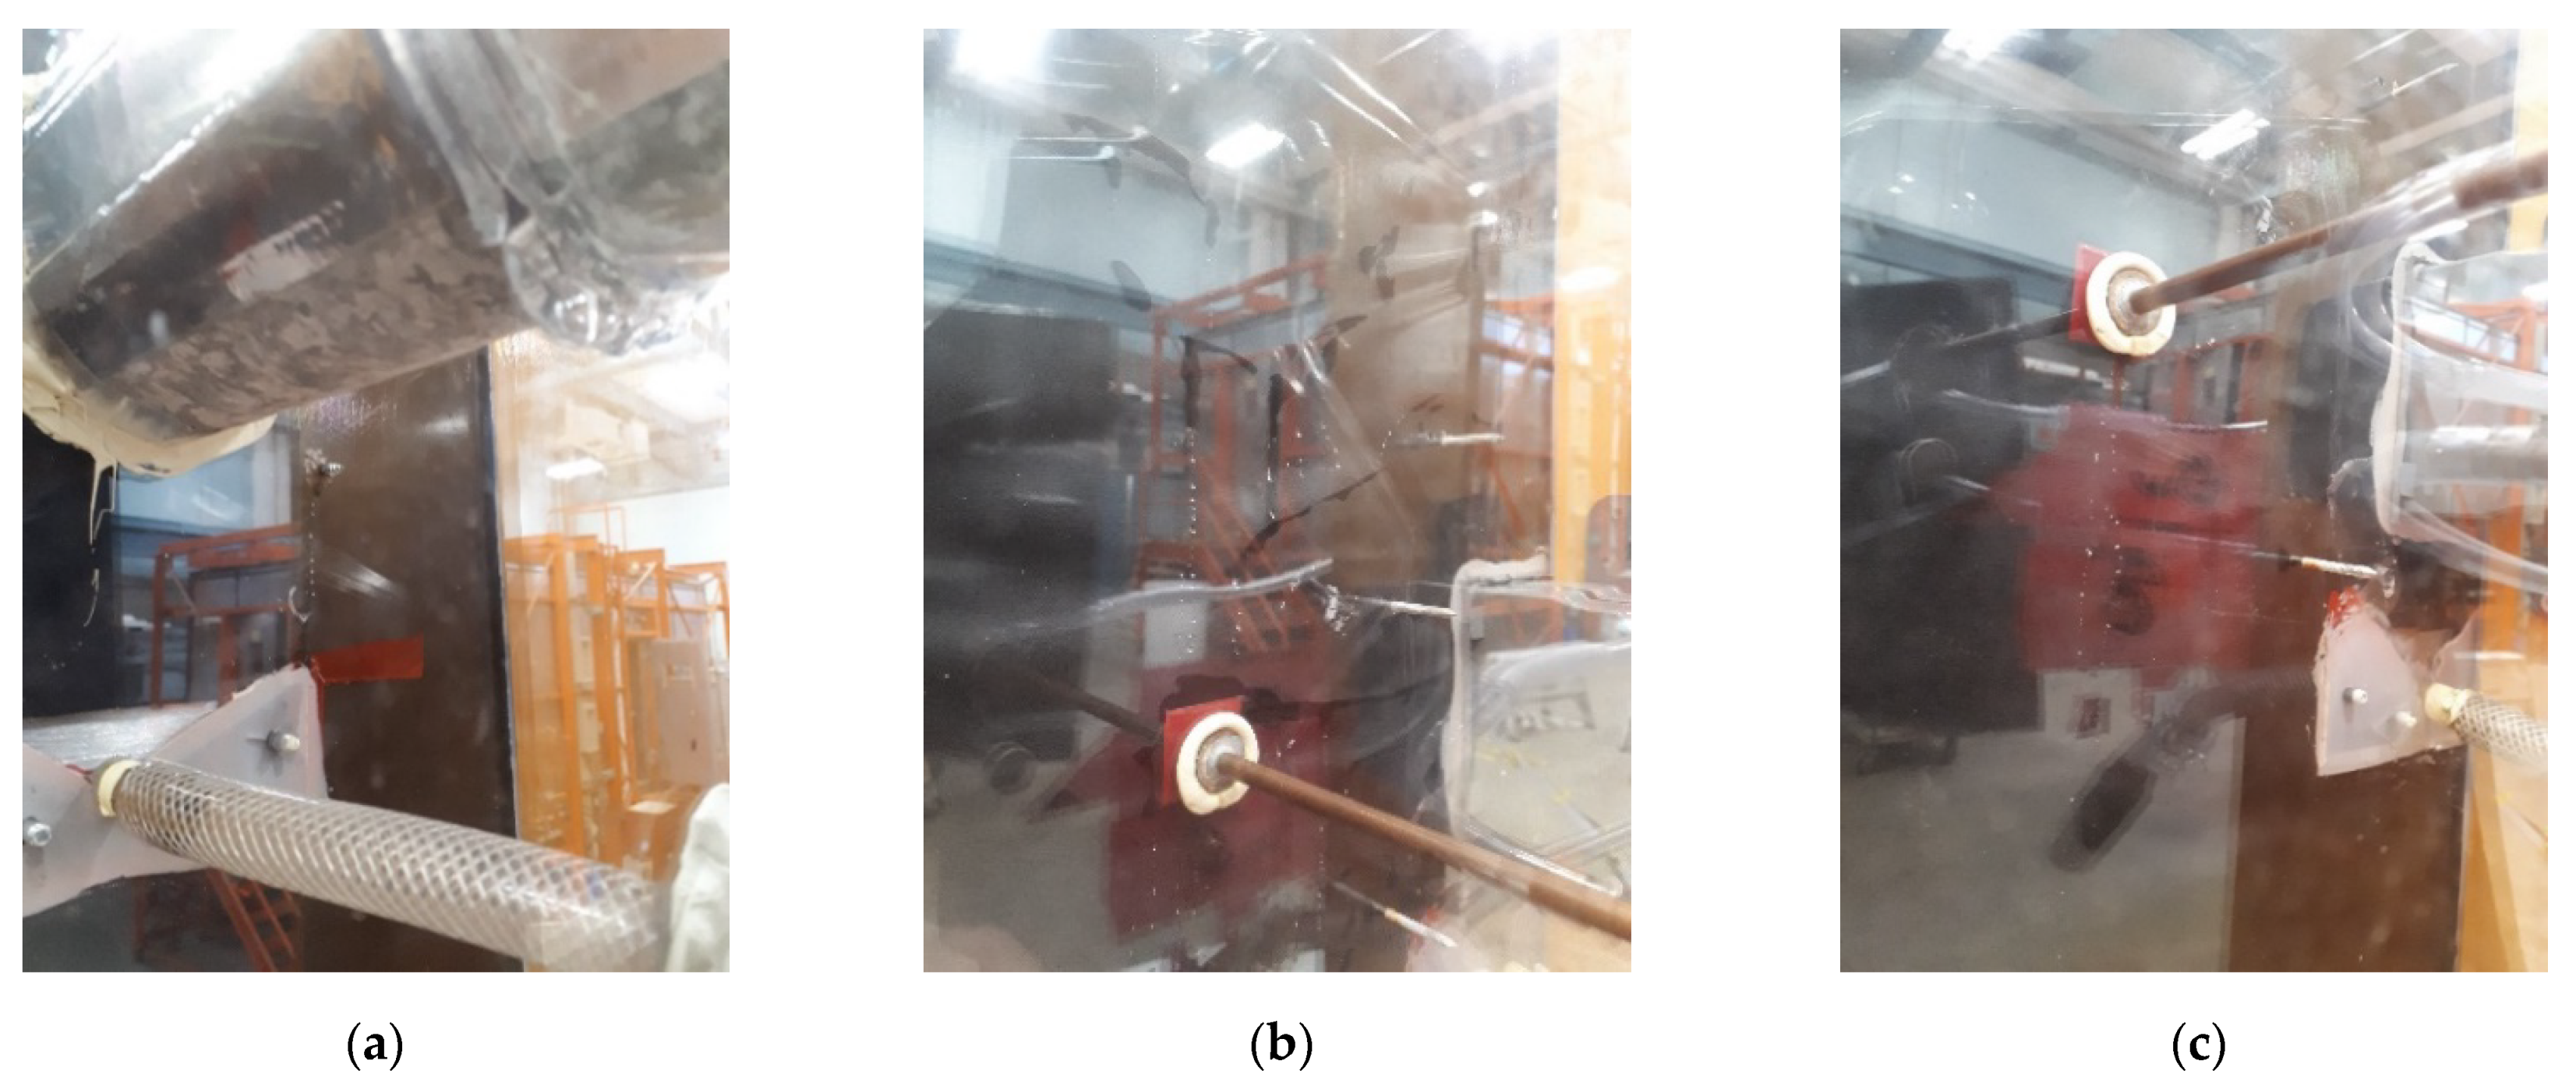
3.4. Observed Water Penetration

During the Water Penetration Trials test, water penetration was observed penetrating into the stud cavity via fasteners used to secure either the vent duct or electrical box as shown in Figure 13a. The observations for the Continuous Water Spray test are shown in Figure 13b,c. Similar to the prior observations, water penetrated into the stud cavity through fasteners located near the electrical box and the pressure tube for pressure readings near the ventilation duct. To reduce the risk of exposure to moisture loads, in real wall assembly applications, these types of through-wall components should be properly sealed with appropriate products and installation methods.

4. Conclusions

By testing the wall assemblies following the protocol and using the approach to establish the water entry function based on the test results, the relation between the simulated WDR conditions and the moisture load in wall assembly with designated deficiencies were established. The water entry rates derived from the water entry function were in a good agreement with those measured. The moisture load as calculated from this function could readily be implemented in a hygrothermal simulation to more accurately assess the performance and durability of wall assemblies. For this wall assembly, the moisture load function was found in Table 5.
The moisture load in the tested vinyl-clad wall assembly can be estimated based on hourly WDR loads and DRWPs from a given location. Naturally, this function can also be used to calculate the moisture load and assess the durability of wall assemblies subjected to the anticipated future projected WDR loads and DRWPs arising from climate change and that are generated from climate models [31]. In the subsequent studies other types of wall assemblies will be tested through the same procedure thereby permitting a broader application of the water entry function. This future work will also include investigation of aged wall assemblies as the configurations of deficiencies have an effect on the water entry results.
The air-leakage rate of the wall assembly was positively correlated with the static pressure acting on its surface and complied with requirements in the building code. The correlations between the water entry rate and the air-leakage rate varied with the spray rates and types of deficiencies. Differences of pressure on exterior surface and in the drainage cavity of the wall assembly were almost the same for the tested vinyl-clad wall assembly under dynamic pressure steps. The pressure in the stud cavity was, on average, 97.2% of that on the exterior surface regardless of the magnitude of the pressure. The phase shift ratio of the sine wave plotted by the pressure reading in the stud cavity and on the exterior surface of the wall assembly tended to increase with the pressure magnitude. Other than the water collected at designed deficiencies, water infiltration was also observed at through-wall components, such as fastener and pressure tubes locations, during both the Water Penetration Trails test and Continued Water Spray test.

Author Contributions

Z.X.: Conceptualization, methodology, experiment, formal analysis, investigation, data curation, writing—original draft preparation. M.A.L.: Supervision, writing—reviewing and editing, funding acquisition. M.D.: Supervision, writing—reviewing and editing. E.D.: Supervision, writing—reviewing and editing. All authors have read and agreed to the published version of the manuscript.

Funding

This work is a part of the Climate-Resilient Buildings and Core Public Infrastructure (CRBCPI) project supported by the National Research Council of Canada’s Construction Research Centre (CRC) and Infrastructure Canada.

Institutional Review Board Statement

Not applicable.

Informed Consent Statement

Not applicable.

Data Availability Statement

The data presented in this study are available on request from the corresponding author.

Conflicts of Interest

The authors declare that they have no known competing financial interests or personal relationships that could have appeared to influence the work reported in this paper.

References

  1. Lacasse, M.A.; Vanier, D.J. (Eds.) Durability of Building Materials and Components 8: Service Life and Asset Management, Service Life and Durability of Materials and Components; NRC Research Press: Ottawa, ON, Canada, 1999; Volume 1. [Google Scholar]
  2. Lacasse, M.A.; Vanier, D.J. (Eds.) Durability of Building Materials and Components 8: Service Life and Asset Management, Durability of Building Assemblies and Methods of Service Life Prediction; NRC Research Press: Ottawa, ON, Canada, 1999; Volume 2. [Google Scholar]
  3. Kumaran, M.K.; Mukhopadhyaya, P.; Cornick, S.M.; Lacasse, M.A.; Rousseau, M.Z.; Maref, W.; Nofal, M.; Quirt, J.D.; Dalgliesh, W.A. An Integrated Methodology to Develop Moisture Management Strategies for Exterior Wall Systems. In Proceedings of the 9th Canadian Conference on Building Science and Technology, Vancouver, BC, USA, 27–28 February 2003. [Google Scholar]
  4. TenWolde, A. ASHRAE Standard 160P-Criteria for Moisture Control Design Analysis in Buildings; ASHRAE Transactions: Atlanta, GA, USA, 2008; Volume 114, pp. 167–169. [Google Scholar]
  5. Van Balen, K. Expert System for Evaluation of Deterioration of Ancient Brick Masonry Structures. Sci. Total Environ. 1996. [Google Scholar] [CrossRef]
  6. Charola, A.E.; Lazzarini, L. Deterioration of Brick Masonry Caused by Acid Rain. ACS Symp. Ser. 1986. [Google Scholar] [CrossRef]
  7. Franke, L.; Schumann, I.; van Hees, R.; van der Klugt, L.; Naldini, S.; Binda, L.; van Balen, K.; Baronio, G.; Mateus, J. Damage Atlas: Classification and Analyses of Damage Patterns Found in Brick Masonry; Fraunhofer IRB Verlag: Stuttgart, Germany, 1998. [Google Scholar]
  8. Abuku, M.; Janssen, H.; Roels, S. Impact of Wind-Driven Rain on Historic Brick Wall Buildings in a Moderately Cold and Humid Climate: Numerical Analyses of Mould Growth Risk, Indoor Climate and Energy Consumption. Energy Build. 2009, 41, 101–110. [Google Scholar] [CrossRef] [Green Version]
  9. Chouinard, K.L.; Lawton, M.D. Rotting Wood Framed Apartments-Not Just a Vancouver Problem. In Proceedings of the 8th Canadian Conference on Building Science and Technology, Toronto, ON, Canada, 5–8 March 2001; pp. 304–318. [Google Scholar]
  10. AS 2047. Windows in Buildings—Selection and Installation; Standards Australia International: Sydney, Australia, 1999.
  11. CSA 440-08. North American Fenestration Standard/Specification for Windows, Doors, and Skylights; Canadian Standards Association: Mississauga, ON, Canada, 2008.
  12. BS 6375. Performance of Windows and Doors; British Standards Institution: London, UK, 2009.
  13. NBN B 25-002-1. External Window Work; BIN: Brussels, Belgium, 2009.
  14. Sahal, N.; Lacasse, M.A. Water Entry Function of a Hardboard Siding-Clad Wood Stud Wall. Build. Environ. 2005. [Google Scholar] [CrossRef]
  15. Lacasse, M.A.; O’Connor, T.; Nunes, S.C.; Beaulieu, P. Report from Task 6 of MEWS Project: Experimental Assessment of Water Penetration and Entry into Wood-Frame Wall Specimens—Final Report; Research Report no. RR-133; National Research Council of Canada. Institute for Research in Construction: Ottawa, ON, Canada, 2003. [Google Scholar] [CrossRef]
  16. Sahal, N.; Lacasse, M.A. Experimental Assessment of Water Penetration and Entry into Siding-Clad Wall Specimen; NRC Publications Archive: Ottawa, Canada, 2004. [Google Scholar] [CrossRef]
  17. Norwegian Standard. ROOF, ROFFINGS: Test Method for Watertightness under Pulsating Air Pressure; Nordtest—NT Build: Oslo, Norway, 1993; p. 116. [Google Scholar]
  18. Mayo, A. To Develop a European Standard Dynamic Water Tightness Test for Curtain Walling. Task 4: Compare the Conditions Produced by Existing Test Methods with the Standard Test Conditions; SN Norway: Oslo, Norway, 1998. [Google Scholar]
  19. Van Den Bossche, N. Watertightness of Building Components: Principles, Testing and Design Guidelines. Ph.D. Thesis, Ghent University, Ghent, Belgium, 2011. [Google Scholar]
  20. ISO. ISO 15927-3, Hygrothermal Performance of Buildings Calculation and Presentation of Climatic Data Part 3: Calculation of a Driving Rain Index for Vertical Surfaces from Hourly Wind and Rain Data; ISO: Geneva, Switzerland, 2009. [Google Scholar]
  21. Straube, J. Simplified Prediction of Driving Rain on Buildings: ASHRAE 160P and WUFI 4.0; Building Science Digests: Westford, MA, USA, 2010. [Google Scholar]
  22. Van Den Bossche, N.; Lacasse, M.; Moore, T.; Janssens, A. Water Infiltration through Openings in a Vertical Plane under Static Boundary Conditions. In Proceedings of the 5th International Building Physics Conference, Kyoto, Japan, 28–31 May 2012. [Google Scholar]
  23. St-Hilaire, A.; Derome, D.; Fazio, P. Approach for the Simulation of Wetting Due to Rain Infiltration for Building Envelope Testing. In Proceedings of the 9th Canadian Conference on Building Science and Technology, Vancouver, BC, Canada, 26 February–1 March 2003; pp. 459–474. [Google Scholar]
  24. Moore, T.V.; Lacasse, M.A.; Defo, M. Determining Moisture Source Due to Wind Driven Rain for Input to Hygrothermal Simulations Using Experimental Methods; ASHRAE: Atlanta, GE, USA, 2019. [Google Scholar]
  25. Brown, W.; Ullett, J.; Karagiozis, A.; Tonyan, T. Barrier EIFS Clad Walls: Results from a Moisture Engineering Study. J. Therm. Envel. Build. Sci. 1997. [Google Scholar] [CrossRef]
  26. Xiao, Z.; Lacasse, M.A.; Gaur, A.; Dragomirescu, E. Climate Data Analysis to Assess Resilience of Wall Assemblies to Moisture Loads Arising from the Effects of Wind-Driven Rain. E3S Web Conf. 2020, 172. [Google Scholar] [CrossRef]
  27. Canadian Commission on Building and Fire Codes. National Building Code of Canada; National Research Council Canada: Ottawa, ON, Canada, 2015. [Google Scholar]
  28. Rousseau, M.Z.; Poirier, G.F.; Brown, W.C. Pressure Equalization in Rainscreen Wall Systems; Construction Technology Updates No. 17; National Research Council Canada: Ottawa, ON, Canada, 1998. [Google Scholar]
  29. Teunissen, H.W. Characteristics of the Mean Wind and Turbulence in the Planetary Boundary Layer; Institute for Aerospace Studies, University of Toronto: Toronto, ON, Canada, 1971. [Google Scholar]
  30. Xiao, Z.; Lacasse, M.A.; Dragomirescu, E. An Analysis of Historical Wind-Driven Rain Loads for Selected Canadian Cities. J. Wind Eng. Ind. Aerodyn. under review.
  31. Scinocca, J.F.; Kharin, V.V.; Jiao, Y.; Qian, M.W.; Lazare, M.; Solheim, L.; Flato, G.M.; Biner, S.; Desgagne, M.; Dugas, B. Coordinated Global and Regional Climate Modeling. J. Clim. 2016. [Google Scholar] [CrossRef]
Figure 1. (a) The NBCC complied vinyl-clad wall assembly with a window, a ventilation duct, and an electrical outlet; (b) Cross-section of the test specimen.
Buildings 11 00117 g001
Figure 2. Locations of pressure taps and water collection troughs.
Buildings 11 00117 g002
Figure 3. (a) Water collection troughs below the window; (b) water collection troughs below the electrical outlet and ventilation duct.
Buildings 11 00117 g003
Figure 4. Overview of the watertightness test protocol.
Buildings 11 00117 g004
Figure 5. (a) Pressure actuator and data acquisition unit; (b) Steel frame on the exterior side of wall specimen; (c) A 3/8″ poly-carbonate sheet on the interior side of wall specimen.
Buildings 11 00117 g005
Figure 6. (a) Dynamic Wind and Wall Testing Facility (DWTF); (b) Rain Effect System (RES); (c) Exhaust Flap System (EFS).
Buildings 11 00117 g006
Figure 7. Water entry results under static pressure with (a) 1.3 L/min-m2 spray rate, (b) 2.1 L/min-m2 spray rate, and (c) 3.4 L/min-m2 spray rate.
Buildings 11 00117 g007aBuildings 11 00117 g007b
Figure 8. Water entry results under static pressure for all deficiencies (SR in the legend means spray rate).
Buildings 11 00117 g008
Figure 9. Water entry results under static pressure with (a) 1.3 L/min-m2 spray rate, (b) 2.1 L/min-m2 spray rate, and (c) 3.4 L/min-m2 spray rate.
Buildings 11 00117 g009aBuildings 11 00117 g009b
Figure 10. Water entry results under dynamic pressure for all deficiencies (SR in the legend means spray rate).
Buildings 11 00117 g010
Figure 11. (a) Correlations between the WDRPI and the water entry rate; (b) correlation between the measured water entry rate and the calculated water entry rate.
Buildings 11 00117 g011
Figure 12. Shift between the pressure readings in different layers of wall assembly.
Buildings 11 00117 g012
Figure 13. (a) Water entry and drip by electrical box; (b) Water entry through electrical box screw; (c) Water entry through vent screw.
Buildings 11 00117 g013
Table 1. Summary of steps to determine test specimen water entry function
Step 1 W D R P I = W D R α × D R W P β α = 1.342, β = 0.671, R2 = 0.851
Step 2 W a t e r   E n t r y   R a t e = a × W D R P I b a = 0.00452, b = 0.763, R2 = 0.839
T-testT stat = 0.098 < t-two tail = 2.09
Table 2. Air-leakage test results
PressureFlow Rate
(L/min)
Total Leakage
(L/s-m2)
Base Leakage
(L/s-m2)
Wall Leakage
(L/s-m2)
25 Pa22.90.0640.0090.054
50 Pa37.50.1050.0150.090
75 Pa49.20.1370.0180.119
100 Pa59.70.1670.0230.144
150 Pa77.30.2160.0320.184
200 Pa93.80.2620.0370.225
250 Pa1090.3050.0450.261
Table 3. Correlations between air-leakage rate and water entry rate for different deficiencies and spray rates.
R-SquaredWindow Electrical BoxVentilation DuctSum from All Deficiencies
1.3 L/min-m20.6050.7850.0430.688
2.1 L/min-m20.182N/A0.0010.144
3.4 L/min-m20.0020.8410.7610.185
Table 4. Pressure differences at each type of deficiency under different dynamic pressure steps.
DeficienciesDynamic PressureExt. Cladding and Drainage CavityExt. Cladding and Stud CavityShifts
Window25 + 25 × 0.85 sin (2πft *)99.9%98.6%0.08%
50 + 50 × 0.85 sin (2πft)99.9%98.5%0.43%
75 + 75 × 0.85 sin (2πft)99.9%98.9%0.46%
100 + 100 × 0.85 sin (2πft)99.6%98.1%0.56%
150 + 150 × 0.85 sin (2πft)99.6%97.5%0.53%
200 + 200 × 0.85 sin (2πft)99.8%97.7%0.64%
250 + 250 × 0.85 sin (2πft)99.9%97.9%0.57%
Electrical Outlet25 + 25 × 0.85 sin (2πft)99.9%95.7%0.37%
50 + 50 × 0.85 sin (2πft)99.5%95.8%0.05%
75 + 75 × 0.85 sin (2πft)99.9%97.2%0.25%
100 + 100 × 0.85 sin (2πft)99.7%96.5%0.40%
150 + 150 × 0.85 sin (2πft)99.9%96.8%0.37%
200 + 200 × 0.85 sin (2πft)99.9%97.2%0.46%
250 + 250 × 0.85 sin (2πft)99.9%97.7%0.37%
Ventilation Duct25 + 25 × 0.85 sin (2πft)99.9%97.1%0.35%
50 + 50 × 0.85 sin (2πft)99.9%95.9%0.38%
75 + 75 × 0.85 sin (2πft)99.9%96.7%0.38%
100 + 100 × 0.85 sin (2πft)99.8%95.9%0.43%
150 + 150 × 0.85 sin (2πft)99.8%96.3%0.49%
200 + 200 × 0.85 sin (2πft)99.9%97.7%0.37%
250 + 250 × 0.85 sin (2πft)99.5%97.0%0.53%
Averaged 99.8%97.2%0.41%
* f: frequency (Hz), and t: time.
Table 5. Values of coefficients for WDRPI and water entry equation
W D R P I = W D R α × D R W P β α = 1.342, β = 0.671, R2 = 0.851
W a t e r   E n t r y   R a t e = a × W D R P I b a = 0.00452, b = 0.763, R2 = 0.839
Publisher’s Note: MDPI stays neutral with regard to jurisdictional claims in published maps and institutional affiliations.

