Article

The Impact of Increased Density on Residential Property Values in Sydney, New South Wales

School of Built Environment, The University of New South Wales, Sydney, NSW 2052, Australia
*
Author to whom correspondence should be addressed.
Buildings 2021, 11(12), 650; https://doi.org/10.3390/buildings11120650
Submission received: 30 October 2021 / Revised: 5 December 2021 / Accepted: 6 December 2021 / Published: 14 December 2021
(This article belongs to the Collection Cities and Infrastructure)

Abstract

:
This paper investigates the impact of high-density development on low-density residential property values in Sydney, New South Wales (NSW). To do so, it conducts a literature review to ascertain the existing knowledge surrounding the study of property valuation and its economic and societal implications. Limitations within academia were identified and addressed as the objectives of this research. Subsequently, the key objective of this research is to “study the sociological factors dictating the attractiveness of low-density (LD) properties within proximity to high-density (HD) local characteristics.” In addressing this objective, research questions explore the interactions of an area’s local characteristics, its residents’ property types and the perceptions surrounding these interactions. This research studies property value through the lens of market perceptions, as the price of land is a basic indicator of the attractiveness, economic value and amenities accessible to a specific site. Through this seminal understanding, the research methodology was formed in which a questionnaire was completed by Sydney residents, providing data for analysis and discussion. The primary research question determines that “low-density residents perceive high-density local characteristics to be attractive”. Through this determination and its associated discussion, this study proposes that ‘if high-density local characteristics are able to be utilised by low-density properties, low-density residents will consider these properties to be more valuable’.

1. Introduction

Understanding property value is a complex area in real estate. As property value is dependent upon a multitude of factors, developing an accurate valuation of real estate is a critical area of concern in the industry. Calculating property value is dependent upon the valuer’s experience and knowledge. As such, the ability to isolate specific factors and their impact upon property values is dependent upon the valuer’s degree of specialization in the specific area. To achieve accurate valuations, it is essential for valuers to have access to up-to-date and specified research. All occupants and investors in both urban and rural properties are impacted by property value. As a result, this understanding holds severe economic and societal consequences and therefore the progression of knowledge in this field must be a concerted effort between industry and academia. The research conducted in academia and its conclusive findings can assist governing bodies, financial interests and societal participants in achieving the most desirable outcomes for each involved.
The value of property is impacted by factors in the social, technological, economic, legal, political, geographical and the environmental realm at a local and national level. The weight of each factor is dependent upon the characteristics of the property itself, and therefore academic research is required to allow for accurate generalised inferences to be made about the impact of these factors. This research aims to study the impact of high-density development on low-density residential property values in Sydney, NSW. In doing so, it conducts a literature review to ascertain the existing knowledge surrounding this area of study. The review presents varying findings and as such, limitations within academia are identified and addressed as the objectives of this research. Subsequently, the objective is to understand the relationship between the individual and their housing preferences.
In addressing this objective, specified research questions are formed. These questions aim to understand the interactions of local characteristics of an area and the property types occupied by its residents. The Primary Research Question seeks to understand the perceptions held by low-density residents of high-density local characteristics. This research studies property value through the lens of market perceptions, as the price of land is a basic indicator of the attractiveness, the economic value and the amenities accessible to a specific site [1]. Through this seminal understanding, the research methodology was formed in which a questionnaire was completed by 150 Sydney residents to provide data for analysis and discussion. This research adopts elements of both quantitative and qualitative analysis techniques to derive novel understanding from the data and achieve the objectives of the research.
The analysis facilitates discussion, which answers the primary research question and determines that high-density development has a positive impact on low-density residential values. This understanding is considered against the findings of the literature review, and the limitations of this research, as well as directions for future research, which are provided in the final chapter. In doing so, a conceptual understanding was formed and identified to allow industry participants to make more informed decisions, potentially resulting in better industry outcomes.
This paper considers the impact of the local characteristics upon residential values rather than commercial land. This is due to the understanding that commercial property values are more susceptible to factors impacting the industry in which the property’s occupants operate, rather than a direct relation between the property and the factors impacting the property market [2]. The price of land is a basic indicator of the attractiveness and the economic value of a specific site and of the amenities available at that location [1]. This statement by Kok et al. [1] is essential for the direction of this research. As such, the research will be focusing on perceptions and attractiveness rather than economic value, as economic value predominantly pertains to commercial sites and attractiveness to residential land.

2. Literature Review

The literature review considers the relevant literature in academia, that provide insight into the area of research of this paper. In doing so, it conducts a systematic review to gain an understanding of the concept of impact, which factors impact land value and what findings are concluded in existing literature.

2.1. Understanding Impact

This section of the literature review aims to identify the concept of impact, as it relates to this paper. In order to understand how certain factors may impact property value, this paper determines which factors it considers to constitute impact. It does so, by first presenting which factors form the value in land price and then by determining the relationship between land price and amenity.

2.2. Value in Land Price

Due to the improvement of construction technology, growing population and congestion of cities, the number of high-rise high-density developments has been steadily increasing across the world [3]. This is due to the idea that high-density compact urban form and mixed development are a more sustainable housing solution than urban sprawl [4]. Suen [4] suggests that mixed use high-density residences reduce driving, traffic energy consumption and air pollution, while increasing public transport utilization, promoting social equity and improving public health by encouraging physical activity opportunities. This idea is built upon in Location Theory which asserts that a highly accessible location provides efficient access to amenities as well as reducing travel time and cost savings, which translates into higher property values [5]. In order to capitalise upon the high accessibility location and actualise the higher property values, permissive zoning must be provided in rapid transit proximate locations [6]. This is because the attractiveness and price of land is dependent upon the amenities available to that location [1]. Permissive zoning is a by-product of land use regulation, which dictates the permitted uses of land and as such the amenities and characteristics of cities [1]. Subsequently it can be determined that accessibility, amenity levels and topography are the predominant drivers of land values.

2.3. Price and Amenity

As transport enhances land accessibility, it also increases the attractiveness of land use and results in higher land values [7]. This link is of particular interest to policy makers, transportation planners, urban designers, zoning authorities and real estate investors. These parties have actioned this understanding through an increased emphasis on Transit Oriented Development (TOD), which is high-density, mixed use, amenity rich and pedestrian friendly built environment around transit stations [8]. Literature further establishes that accessibility improvements, even in relatively cheaper forms such as bus rapid transit, lead to a positive response from urban real estate in the form of higher property values, zoning permissions and land use intensification [9]. This literature review aims to determine how the various elements in the TOD concept and other urban planning theories impact the quality of life outcomes desired by the parties involved [10].

2.4. Impacting Land Value

This section of the literature review conceptualises the identified factors, to understand how the impact upon land value occurs based on the attractiveness of a property and to what extent these factors can have an impact. In doing so, it considers the concepts of Land Use, Price Assumptions and the Positive Amenity Effect. It then assesses how these Land Value Factors are to be considered and what is the amenity of Amenities, Transit Oriented Development and Zoning. As such, the concept of Land Value Uplift is introduced and the question posed, as to how this concept impacts low-density land values.

2.5. Land Use, Price Assumptions and Positive Amenity Effect

Permissive zoning, accessibility and amenities available to a particular property, have an impact upon the quality of life of those residing upon it. The extent of each factor having a positive or negative impact is considered in literature. However, a resounding logical consensus can be formed that if the impact of these local characteristics is valued positively by local area residents, then this positive value should to a large extent be attributed to the associated property. As such, a rise in positive local characteristics should lead to a rise in local land values. Literature explores this idea under the concept of the Positive Amenity Effect [11]. If there are no substitutes for these amenities in the same metropolitan area, permissive land use regulation will increase land prices [1]. Duncan [6] explores this idea through an evaluation of station area premiums, establishing that whilst these premiums may exist, the extent of their impact is dependent upon local zoning regulations. Duncan [5] had initially endorsed this idea, stating that “property near rail stations sells at a modest premium, whereas good access to jobs, a bi-product of mixed use zoning regulation, is commonly associated with higher property values” [4]. As such, Duncan [6] expresses the notion that land use policy associated with the concept of TOD may generate the same development impact if such initiatives are implemented far from a rail station. Conversely, permissive zoning may also simply remove constraints, which were stifling an existing demand for station area development. Whilst Duncan [6] uses this dichotomy to explore the impact of zoning and accessibility upon residential development, the fundamental argument which forms in his paper can be accurately appropriated to form an understanding of this paper’s research.

2.6. Land Value Factors and the Amenity of Amenities/TOD/Zoning

Literature states “that development potential is the critical junction where zoning and station proximity come together and that station proximate land has greater underlying development potential” [6]. As such, it can be inferred that zoning and accessibility must work concertedly to achieve the ideal development outcome. Land value generally reflects its uses and development potential, which is influenced by its location and external factors like accessibility and surrounding land uses [4]. For the purposes of this review—through this definition of land value—we can marry the idea of (1) development potential, (2) accessibility and (3) local zoning regulation, under the umbrella of local characteristics, which impact the value of a property. As this paper is exploring the local characteristics in the context of high-density areas, local characteristics are reviewed through the lens of high-density. Through this understanding, a case can be made that TOD is dependent upon local characteristics and development incentives, a case which is corroborated by [8]. As TOD and its associated local characteristics are shown in this review to be favourable for urban growth, quality of life and land value, an argument can be formed to encourage development potential in the form of TOD to achieve the desired quality of life outcomes. This argument suggests that through TOD, favourable high-density local characteristics can be created.

2.7. Land Value Uplift (LVU)

How TOD and local characteristics impact the attractiveness of properties and land values has been adequately examined in literature. Zoning restricts the supply of land uses but can also increase demand and subsequent property values by removing the economic ambiguity around desirable land use in that area [12]. Through these controls, zoning shapes the local characteristics of an area. This can be in the form of TOD. As there is increased development, there will be an increase in development application fees, which can be spent towards improving infrastructure and accessibility, which in turn leads to more attractive land and subsequently higher land values [13]. As demonstrated in this review, while TOD can create high-density local characteristics which are demonstrably favourable upon high-density property values, this research aims to assess whether the same local characteristics are favourable for low-density land values.

2.8. Findings in Literature

This section of the review provides an understanding of the findings in literature, to determine how the identified concepts impact this papers area of research. It shows how literature relates the concepts to low-density housing, by conveying how housing is valued in academia leading into the interaction between housing and density.
This review has found concepts in literature which indicate that high-density local characteristics, such as accessibility, TOD, development fees and zoning and mixed land use controls can lead to higher land values. Additionally, empirical evidence within literature substantiates this understanding, and the consensus is concisely summarised in the review’s findings [4]. These are:
  • Accessibility has greater impacts than development patterns on land value.
  • Compact development and mixed land use influence land value differently, depending on the nature of existing land uses and land values.
  • Accessibility to jobs and retail stores always contribute to the increase of land value.
  • Accessibility to public transportation helps but it does not influence land value in a consistent fashion.

2.9. Valuing Housing

Song and Knaap [14] state that despite the interest and claims made by advocates of permissive mixed land use, there is little information about the effects of mixed uses on low-density housing prices. As such, the literature provides a seminal understanding of the impact mixed use land controls have upon housing prices. It finds that housing prices increase with proximity to—or with increasing amounts of—public parks or neighbourhood commercial land uses. Housing prices also increase if single family housing is the dominant form of land use in the community, or if there are more service jobs available in the neighbourhood [14]. However, it also finds that housing prices fall with proximity to multi-family residential units, which indicates a negative association with high-density itself, rather than its local characteristics.
This notion is corroborated by Koster and Rouwendal [10], who find that household density has a negative impact on house prices: one standard deviation increase in the number of households leads to a decrease in the house price of about 4.5%. Further finding that, households do not prefer to live in high-density neighbourhoods because higher densities are often associated with negative externalities, such as reduced privacy and higher crime rates. Similarly, literature associates this disamenity for low-density homes with TOD, a contradiction to the conceptual notion [8]. Finding that intense development around the station is likely associated with increasing noise, construction or building shadows, which could in turn be viewed negatively among single-detached home buyers [8]. Song and Knaap [14] also acknowledge this negative externality, indicating through research that the size and scale of the commercial development is important to consumers and the more intense the commercial development, the greater the negative effect on housing prices.
Koster and Rouwendal [10] build upon this idea, stating that a more diversified environment is positively correlated with house prices. They find that one standard deviation increase in diversity leads to an increase in house prices of 1.1–3.4%. Houses in a diversified area are valued up to 6% more than a house located in a monofunctional area, provided that density is not too high [10]. Indicating, that households value diversity, but dislike a high-density of households. The extent to which this diversity is valued can be considered as the public amenity utility exhaustion level. A concept in its infancy, which is largely absent from academia and requires further exploration/development before it can provide definitive insight.

2.10. Housing and Density

Conversely, Duncan [6] believes higher density is shown to lower house prices, except in areas immediately around stations as there seems to be a greater tolerance and/or demand for higher density housing. Duncan [6] states that based on several literature reviews one might assume that single-family properties near stations sell at a modest premium of up to 10%. However, he also states that multi-family and commercial property may gain more from station access than do single family properties. Similarly, he finds that low-density properties have higher estimate property values than high-density properties but the price gap narrows for properties near a station, indicating that restrictive (low) density has no statistical price advantage in the station’s immediate area. Furthermore, this literature brings to light the argument that in some residential neighbourhoods with highly restrictive zoning, rail investment might negatively influence property values. Yet, this does not mean an aggressive zoning policy could individually drive up property values.
Conversely, analysis of the literature suggests that permissive zoning is likely to have a negative impact when property is not near a station. Station areas seemingly provide an underlying development potential, which makes permissive zoning valuable. However, it must be understood that station area premiums for single family homes in high-density zones will likely see a LVU from redevelopment potential into high-density as well. If the single-family homes in their current state saw a LVU then station area premiums would be unconditional. However, Duncan [6] provides evidence to the contrary.
Through this literature review it is evident that while high-density local characteristics and a mixed use area are valued by low-density residents, the extent and degree to which this is valued remains largely unconfirmed. Duncan [6] concludes with the belief, that the synergistic research suggests that neither zoning nor station proximity has an independent impact on the property market. Song and Knaap [14] conclude with the belief that single family homes are adversely affected by high-density unit dwellings, but not by high population density. This could be from the societal understanding that amenities for the mass needs mass [9]. Koster and Rouwendal [10] conclude that singles, couples and those with higher incomes prefer diversified areas and high income and larger households size prefer low-density. Through this conclusion, the notion of resident preferences for housing density is brought to light. Preferences not viewed and evaluated through the lens of property values but through the characteristics of the individuals themselves. Contradictory arguments within literature can either be substantiated through further research into the extent and degree of the impact, or they can be substantiated through research aiming to understand the perceptions, preferences and psychological drivers behind the impact. This research will adopt the latter approach.

2.11. Limitations of Literature

To establish the limitations of their study, Higgins and Kanaroglou [8] suggest that different property types and their subsequent densities could yield different land value uplift results from TOD and its associated local characteristics. Their study considers the unobserved heterogeneity in individual preferences through the proxy of the selected property type by the individual. However, as results vary between different property types, the land value uplift of TOD and its associated local characteristics cannot be determined at an individual level through a sweeping inference made based upon the individual’s selected property type. As Higgins and Kanaroglou [8] also acknowledge, the preferences of an individual and the subsequent value which they place upon certain TOD or high-density characteristics must be assessed at an individual level, building up from the individual’s preferences, rather than working back from the changes in property values which they occupy. Although, “youthification” can be attributed to the rise of TOD, an analysis of transactions alone cannot reveal how the characteristics of people buying homes are affecting the LVU trends [8]. Higgins and Kanaroglou [8] conclude upon their methodology that the hedonic model can isolate the value of land at a certain location, what this land is used for and the preferences affecting the value of existing urban forms. Yet the question around the preferences of the residents, considered irrespective of the property values and property types available remains unanswered. This point is corroborated, with the understanding that the behaviour of customers when selecting appropriate property has been largely ignored and as such it is important to capture customers preferences, their selection process and most importantly their competitive behaviour [7]. This understanding is needed as it is difficult to separate the direct impact of the built environment from the pre-existing preferences of those who live in a given neighbourhood type, which have shaped an areas character and property values [5].
Literature makes assumptions around these preferences, with the common ones being:
  • TOD exists of people with an impediment to driving [5]
  • Cities with a car bias are less likely to find TOD attractive [6]
  • Only apartment occupiers are willing to pay for an increase in diversity, whereas other housing types are not [10]
  • High income households prefer low-density [10,15]
  • Household preference, and as such house values, are affected by local aesthetic attributes, pollution levels and accessibility [14]
Based on these unsubstantiated understandings of individuals’ preferences, literature states that future research should seek to analyse the relationship between the heterogeneous individual and household preferences, their spatial and household type sorting decisions and TOD [8]. As such, it is the objective of this research methodology to derive a vehicle to reach a conclusive understanding of the individual preferences held by low-density residents for certain local characteristics.

3. Methodology

3.1. Objectives of the Research Method

The objective of this research is to study the sociological factors dictating the attractiveness of low-density (LD) properties within proximity to high-density (HD) local characteristics. This chapter highlights the methodology needed for this research to provide a novel understanding of the perceptions, preferences and psychological drivers impacting low-density property values.

3.2. Research Questions

As the objective of this research is identified and justified, it imperative that this paper is directed by addressing certain research questions.
To understand the impact of high-density development on low-density residential property values in Sydney, NSW, it is imperative to begin by gaining an understanding of the value which low-density residents place upon high-density local characteristics. As such, the overarching research question must aim to provide an understanding of the perception of high-density local characteristics from a low-density perspective. This considers the interaction of density preference and associated local characteristics.
The following graph visually represents this thought pattern (Figure 1):
In assessing a person’s residential preferences, conclusions are typically drawn by considering the property and neighbourhood in which they live. Logic dictates that a person living in a LD property is at the Blue Star; implying that they have chosen to live in a LD property because they prefer the LD property type as well as the LD local characteristics. However, people are not as uniform and their preferences cannot always be accurately inferred from their selections. It needs to be determined if there are people at the Orange Star, are there some at the green star and are there some at the yellow star, who prefer LD properties but HD density local characteristics. This research aims to determine where on this map most Sydney residents are situated, through an assessment of their attitudes and behaviours, rather than the property and neighbourhood in which they have chosen to live.
As such the overarching research question (Concept) is formed:
If high-density local characteristics are able to be utilised by low-density properties, do low-density residents consider these properties to be more valuable?
In order to answer the overarching research question, the following sub-questions will need to be addressed:
  • What is the perception of high-density local characteristics by a low-density resident?
  • Does a person with a preference for low-density properties like high-density local characteristics? If so, which characteristics, do they like? Which characteristics do they not like?
  • If these high-density local characteristics were provided in a low-density context (i.e., removing the negative externalities), would those with a low-density preference find this attractive? If so, to what extent?
The primary research question was selected as it provides a simplified and clear direction for how the overarching research question will be addressed. This is because the overarching research question is to be considered as the broader conceptual understanding, which is sought by the interested parties in this area of study (Theory). To gain a novel understanding of the concept, the primary research question must be answered. The primary research question is formed through the gaps in knowledge identified by the literature review and the requirements expressed by the objectives. To answer the primary research question, the secondary research questions must be addressed. This is visually explained in the graph below (Figure 2):
The research hypothesis is considered to be evaluated in the following sections.
Low-density residents perceive high-density local characteristics to be attractive. The associated concept to this hypothesis is if high-density local characteristics are able to be utilised by low-density properties, low-density residents will consider these properties to be more valuable.
These hypotheses were derived from the general understanding provided by the literature review. The following methodological approach will highlight the steps this research will take in order to assess whether to accept or not accept the hypotheses.
This research adopts a positivist approach to test the hypotheses [16]. In doing so, a quantitative analysis will be conducted as it is considered to be appropriate in assessing the behavioural components of the built environment from large sample sizes [17]. A questionnaire was used as the measurement instrument used to collect data and it will be assessed using a variety of methods, selected based upon their applicability to each research question. Upon collecting and analysing the data, the reliability of the measurement instrument will be assessed using the test-retest method, in which the questionnaire will be readministered with an interval period of two months (minimum).

3.3. Specifying High-Density Local Characteristics

The meaning of high-density is a matter of perception; it is subjective and depends upon the society or individual’s judgement against specific norms [18]. For instance, the minimum number of dwellings per net hectare considered to be high-density in the United Kingdom is 60, in the United States is 110 and in Israel is 290 [18]. However, an analysis of density is not a uniform undertaking. For example, if building density were to rise to a greater degree than population density, then perceived density would actually fall as this is likely to result in greater gross floor area per person.
Whilst it is difficult to define high-density, this research is primarily considering high-density local characteristics. These can be categorised into four main categories as derived from [14,18]:
  • Topography
    High building density—to maximise the utilization of scarce urban land.
    Diverse land uses—to provide urban amenities across retail, entertainment, dining and commercial activity.
    Property types and physical housing attributes—mostly consisting of multi-storey apartment buildings.
  • Communal Facilities
    Reduction in personal space/facilities and increase in communal space/facilities. For example, parks rather than backyards.
    Improved public service levels.
  • Social and societal factors
    High population density.
    Promoting social interaction and facilitating neighbourhood relationships/community as lifestyles shift from personal to communal.
  • Accessibility
    Availability of mass public transport, walking and cycling infrastructure resulting from a reduction in travel distance and number of car trips. This is based on the premise that increased proximity reduces commuter congestion.
Although the four main categories present a rather favourable view of high-density local characteristics, the following negative externalities will also be considered in this research.
  • Loss of greenery through greater emphasis on the built environment.
  • Increased social contact—which may cause psychological stress in some individuals.
  • Reduced privacy outside of the personal domain—which may lead to feelings of loss of control and anxiety in some individuals.
  • Localised noise, light and air pollution due to increased activity in the locality.
Based on this understanding the following research structure is developed.

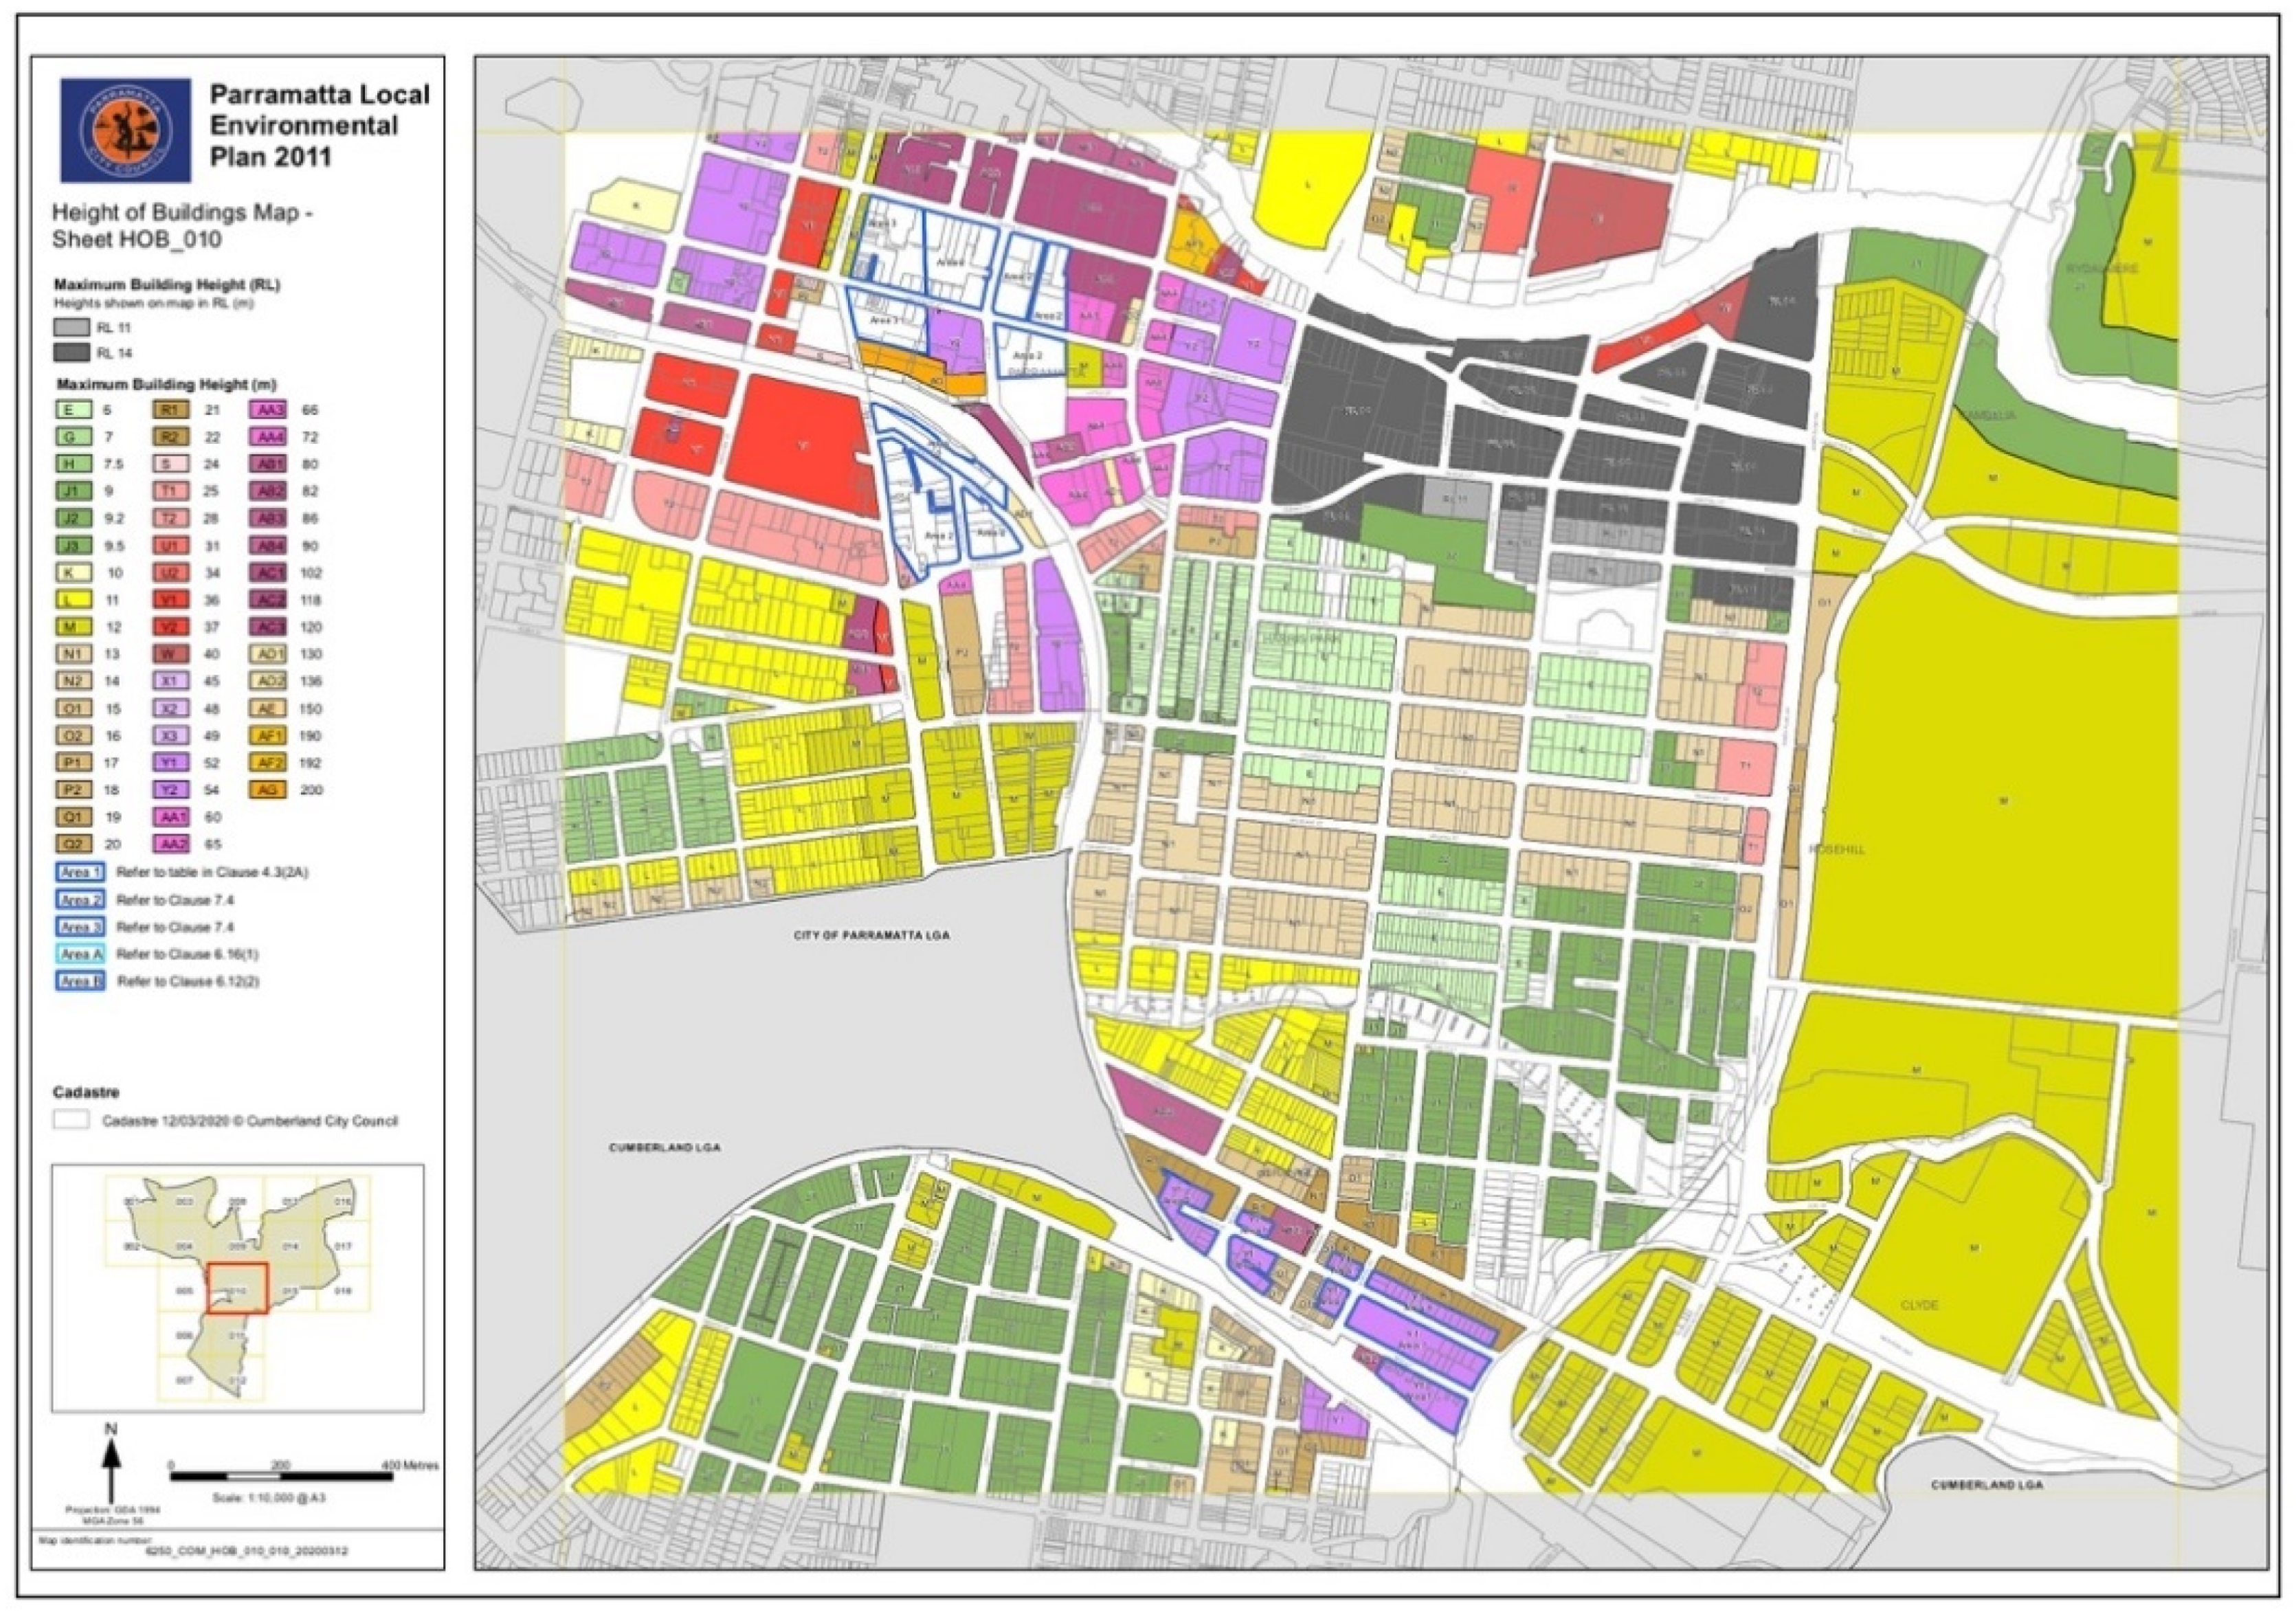
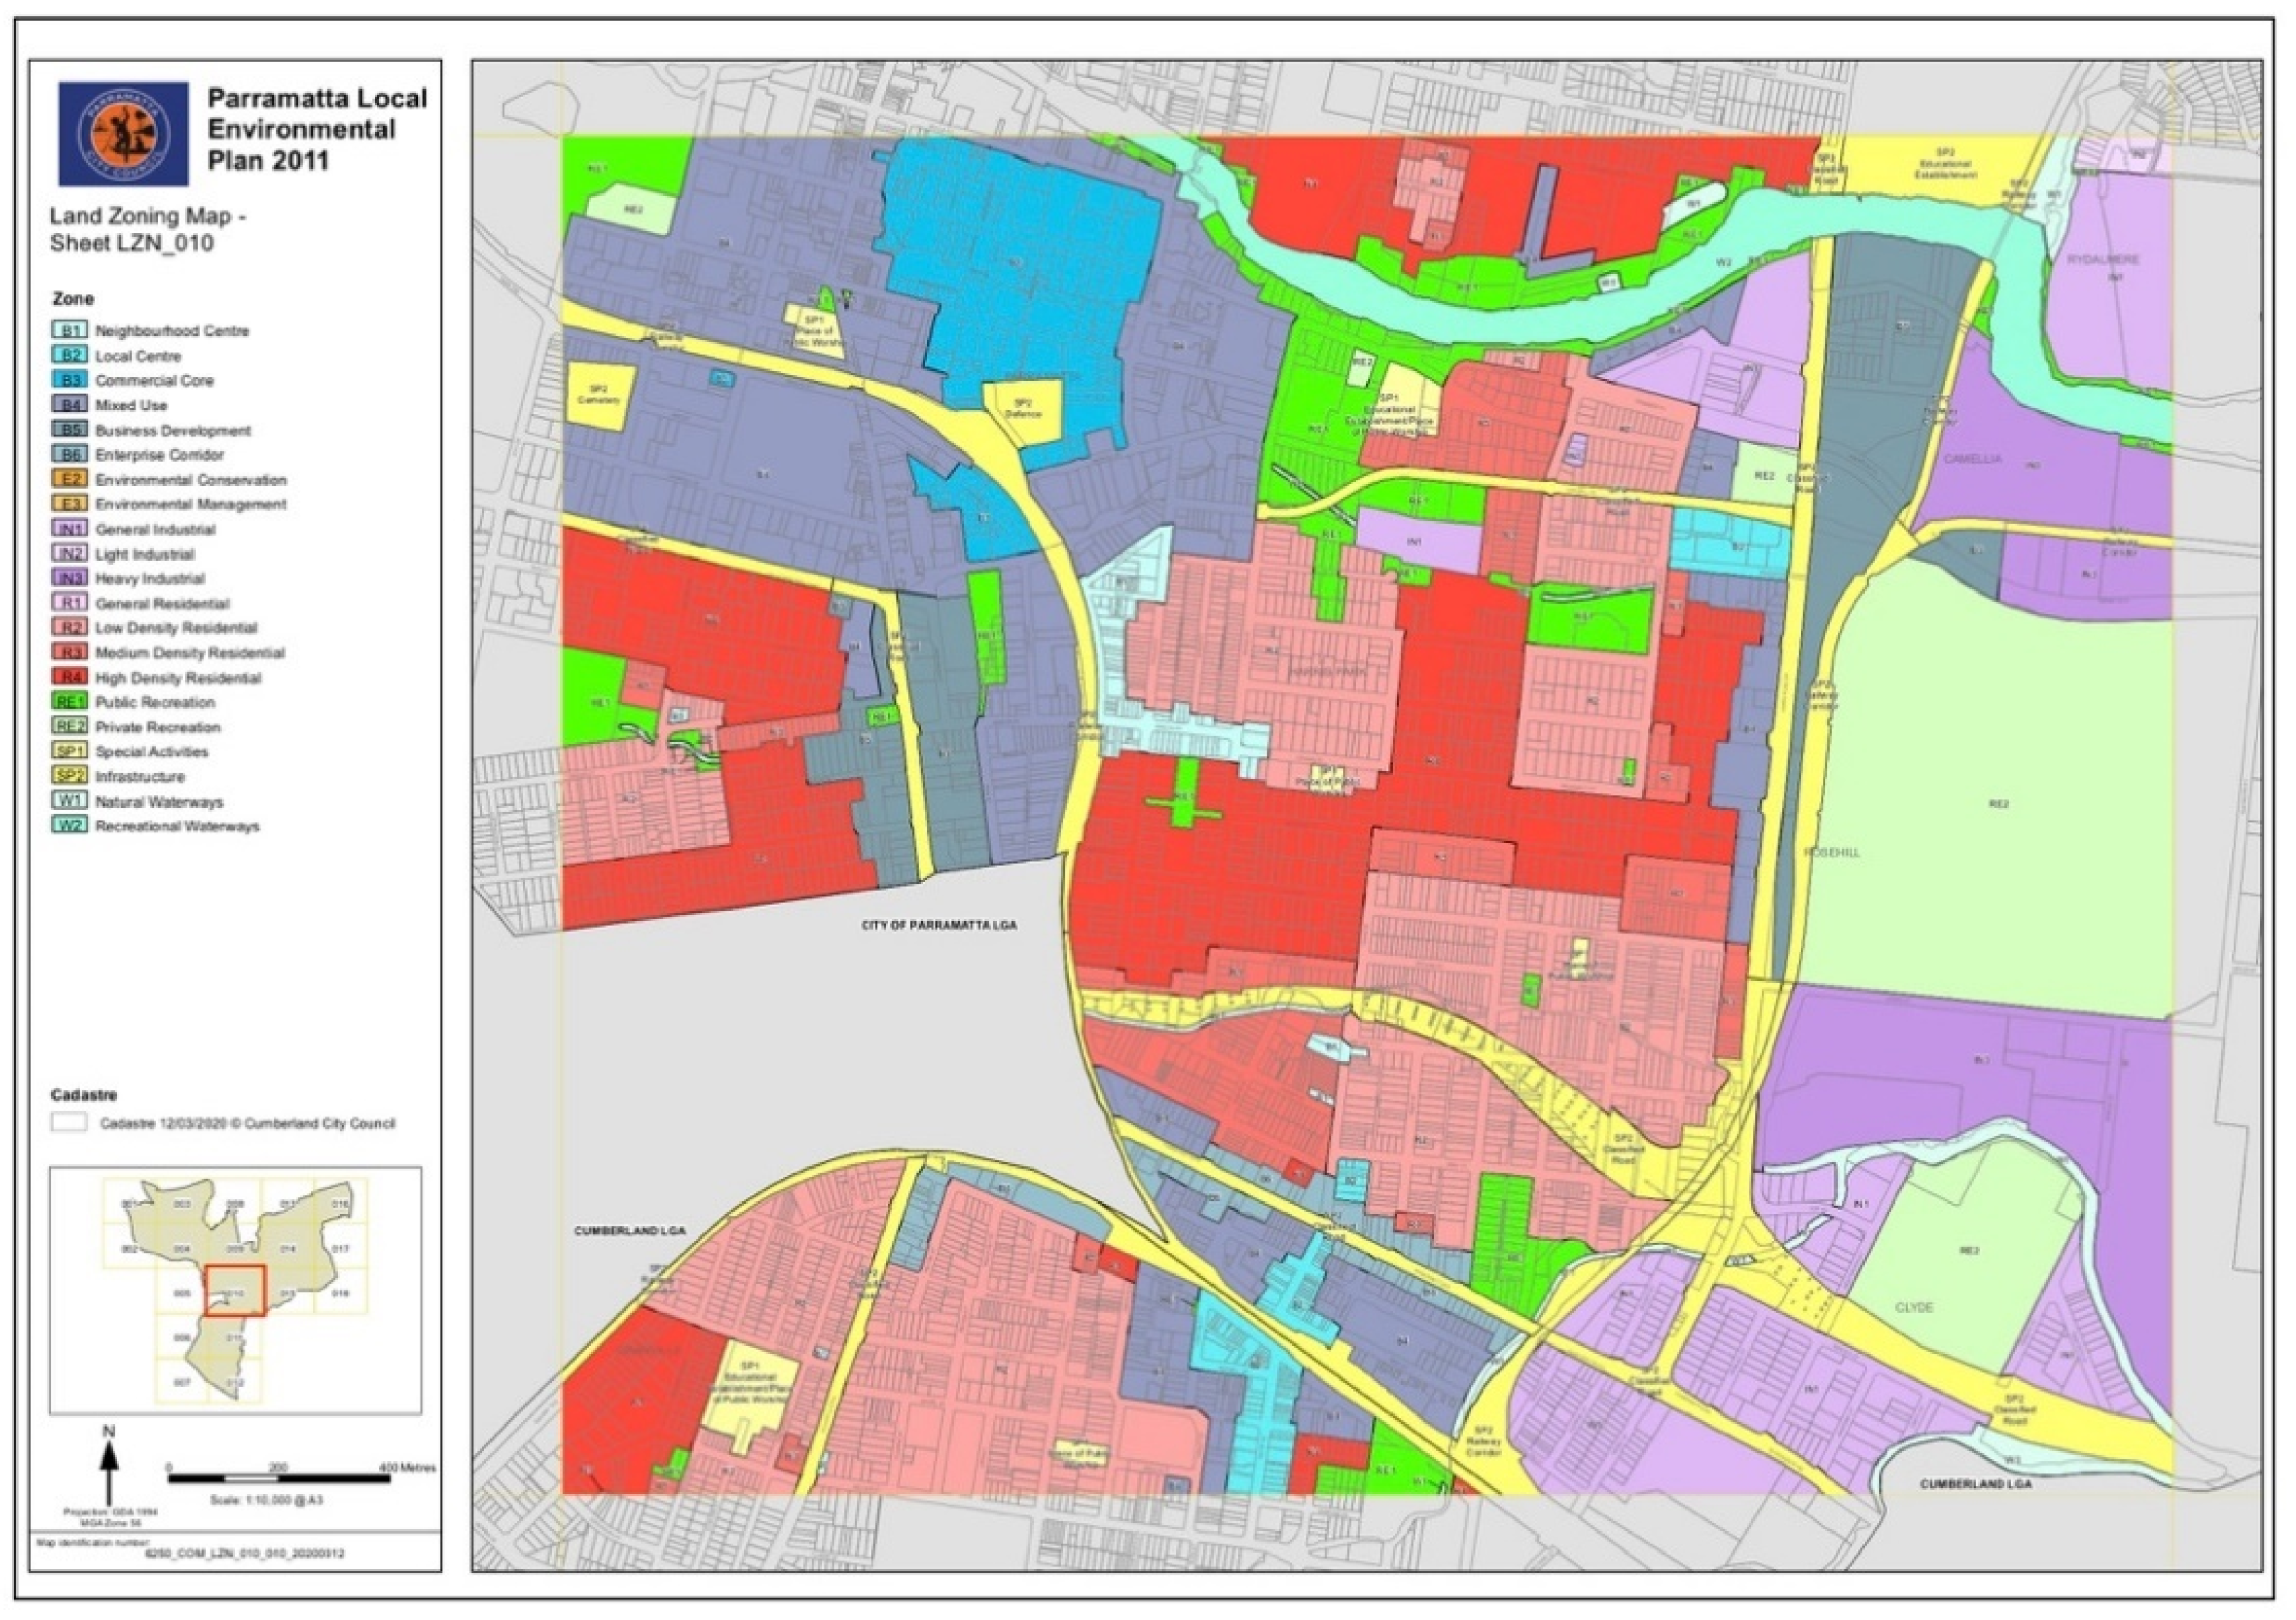
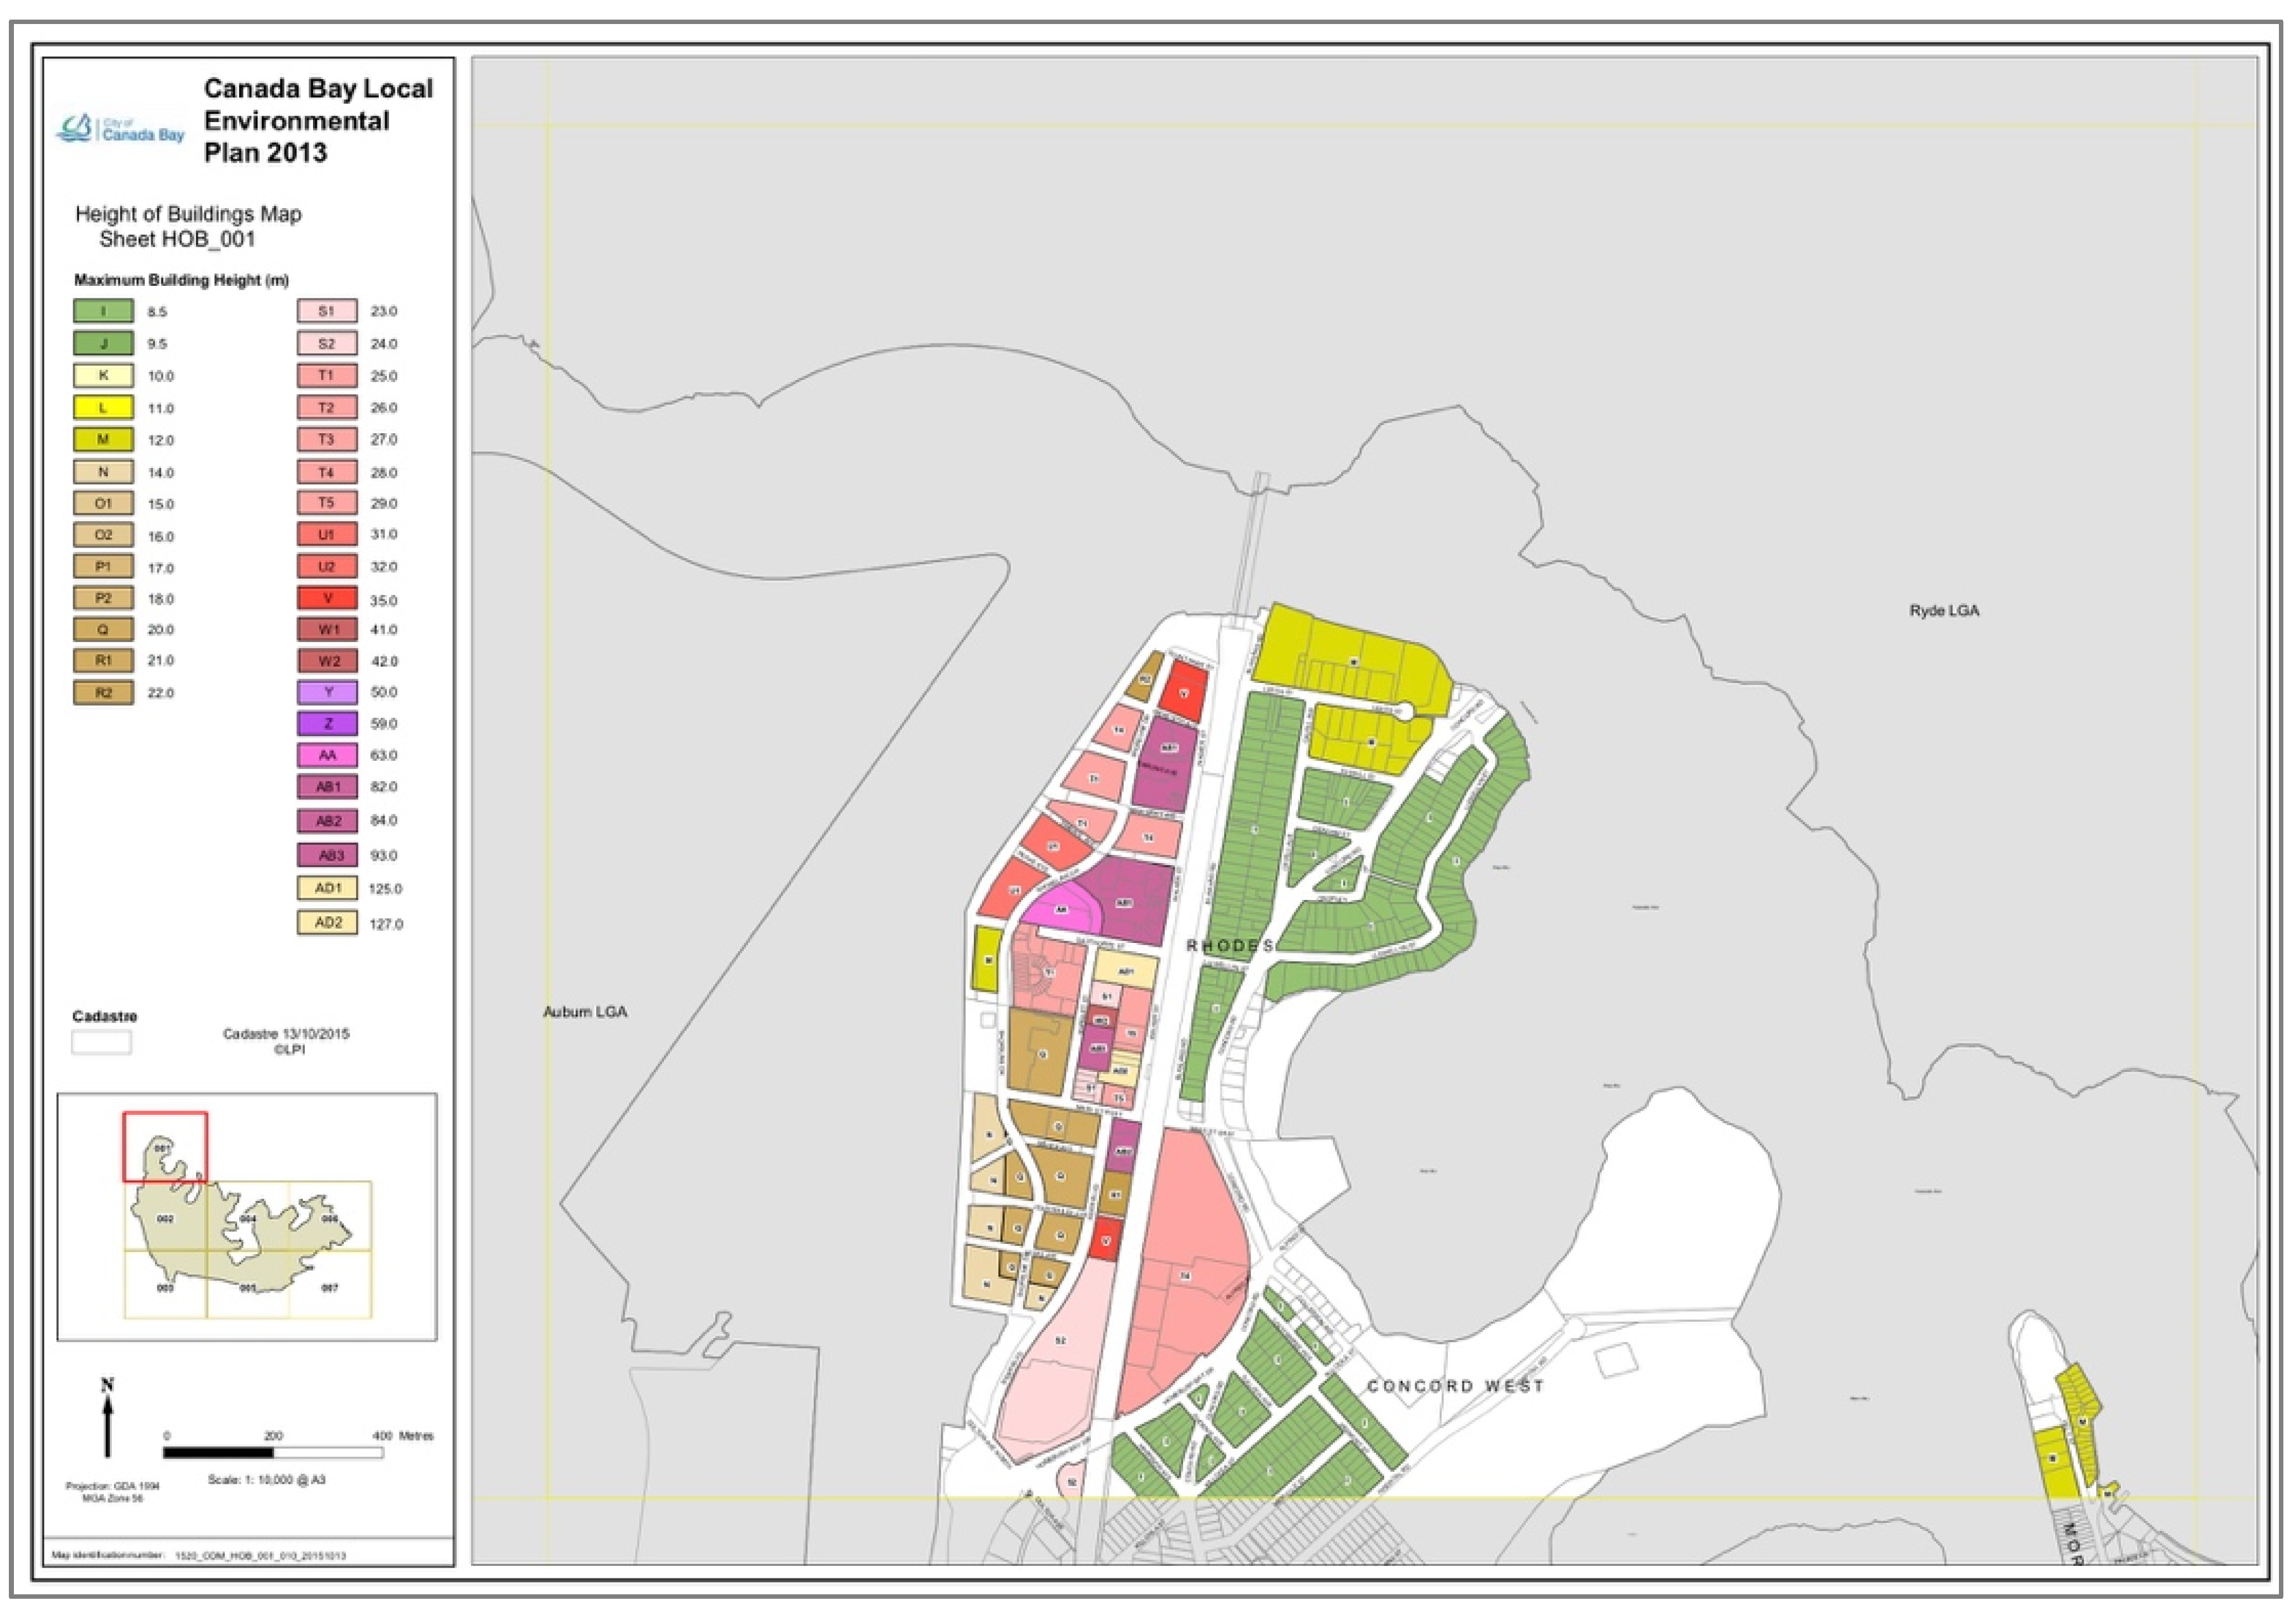
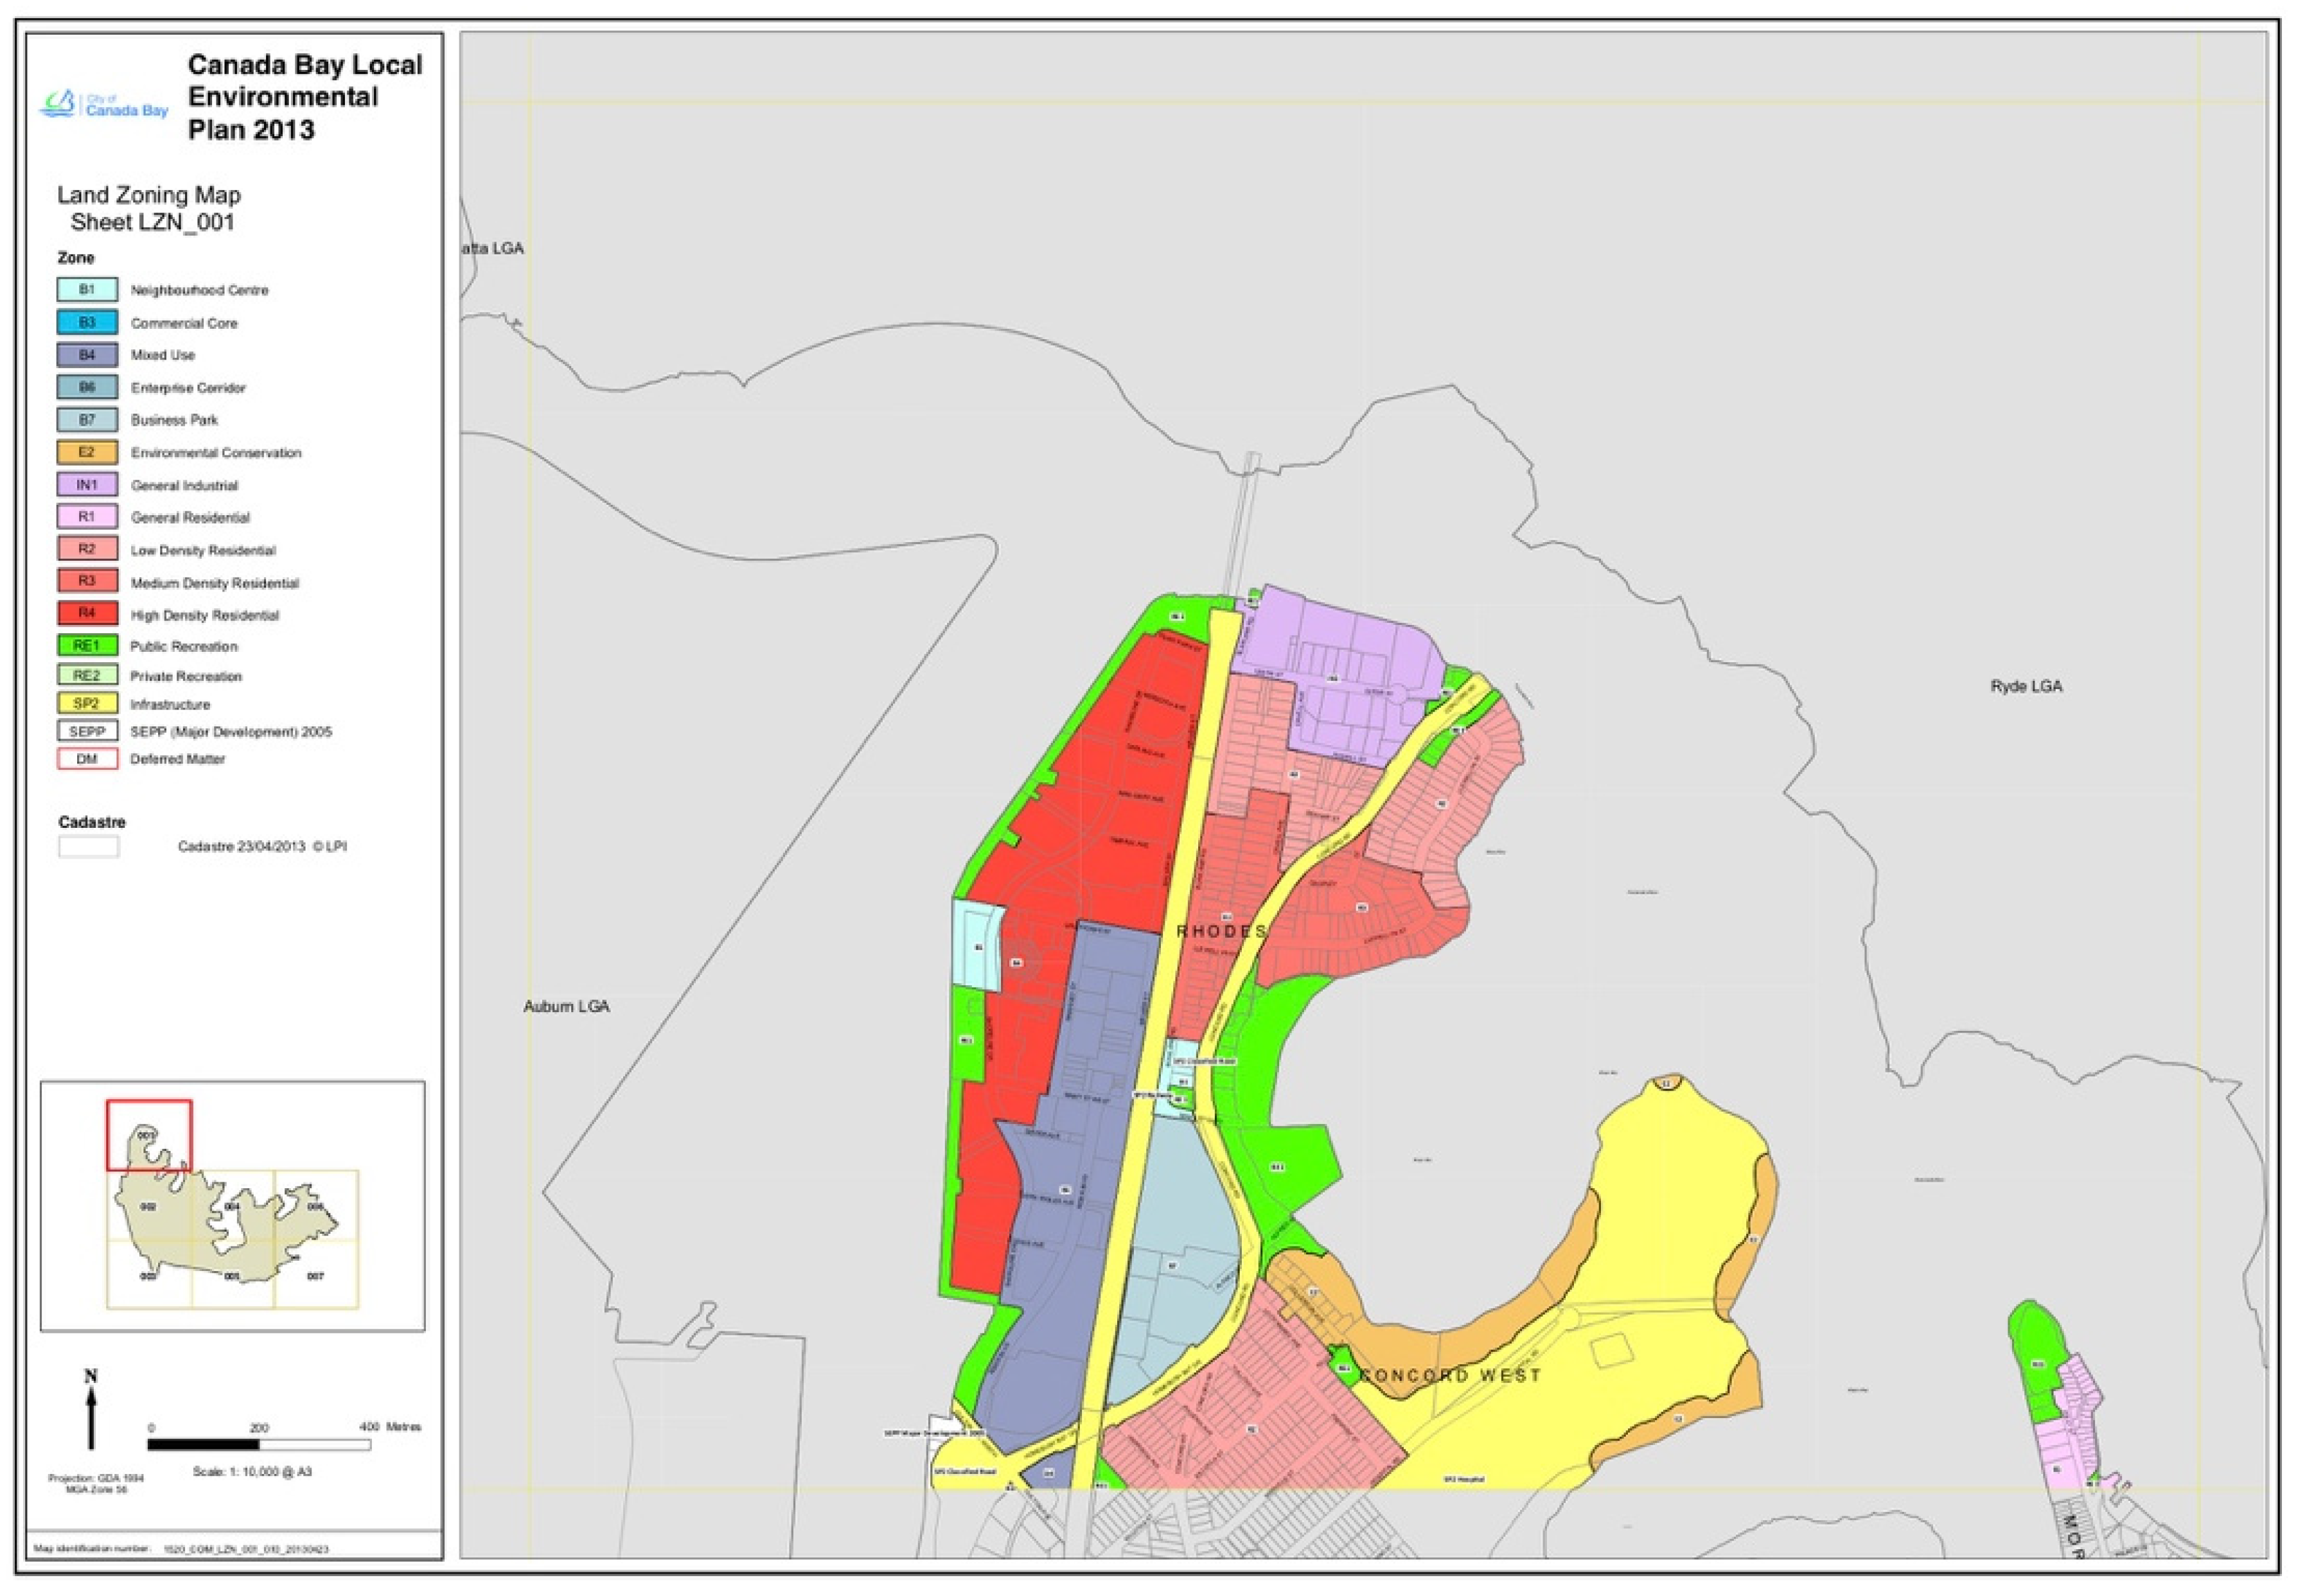
3.4. Study Extent and Data Collection

3.4.1. Selection Criteria

Data was collected in the form of a questionnaire including questions from identified suburb’s which comprise the sampling frame. The comprising suburbs were identified and selected through an assessment of the Local Environmental Planning (LEP) policies and shown in Appendix A. The sampling frame suburbs embody the high-density local characteristics identified and were selected based on the following requirements:
  • Located within greater Sydney.
  • Offer mass public transit in the form of a train station.
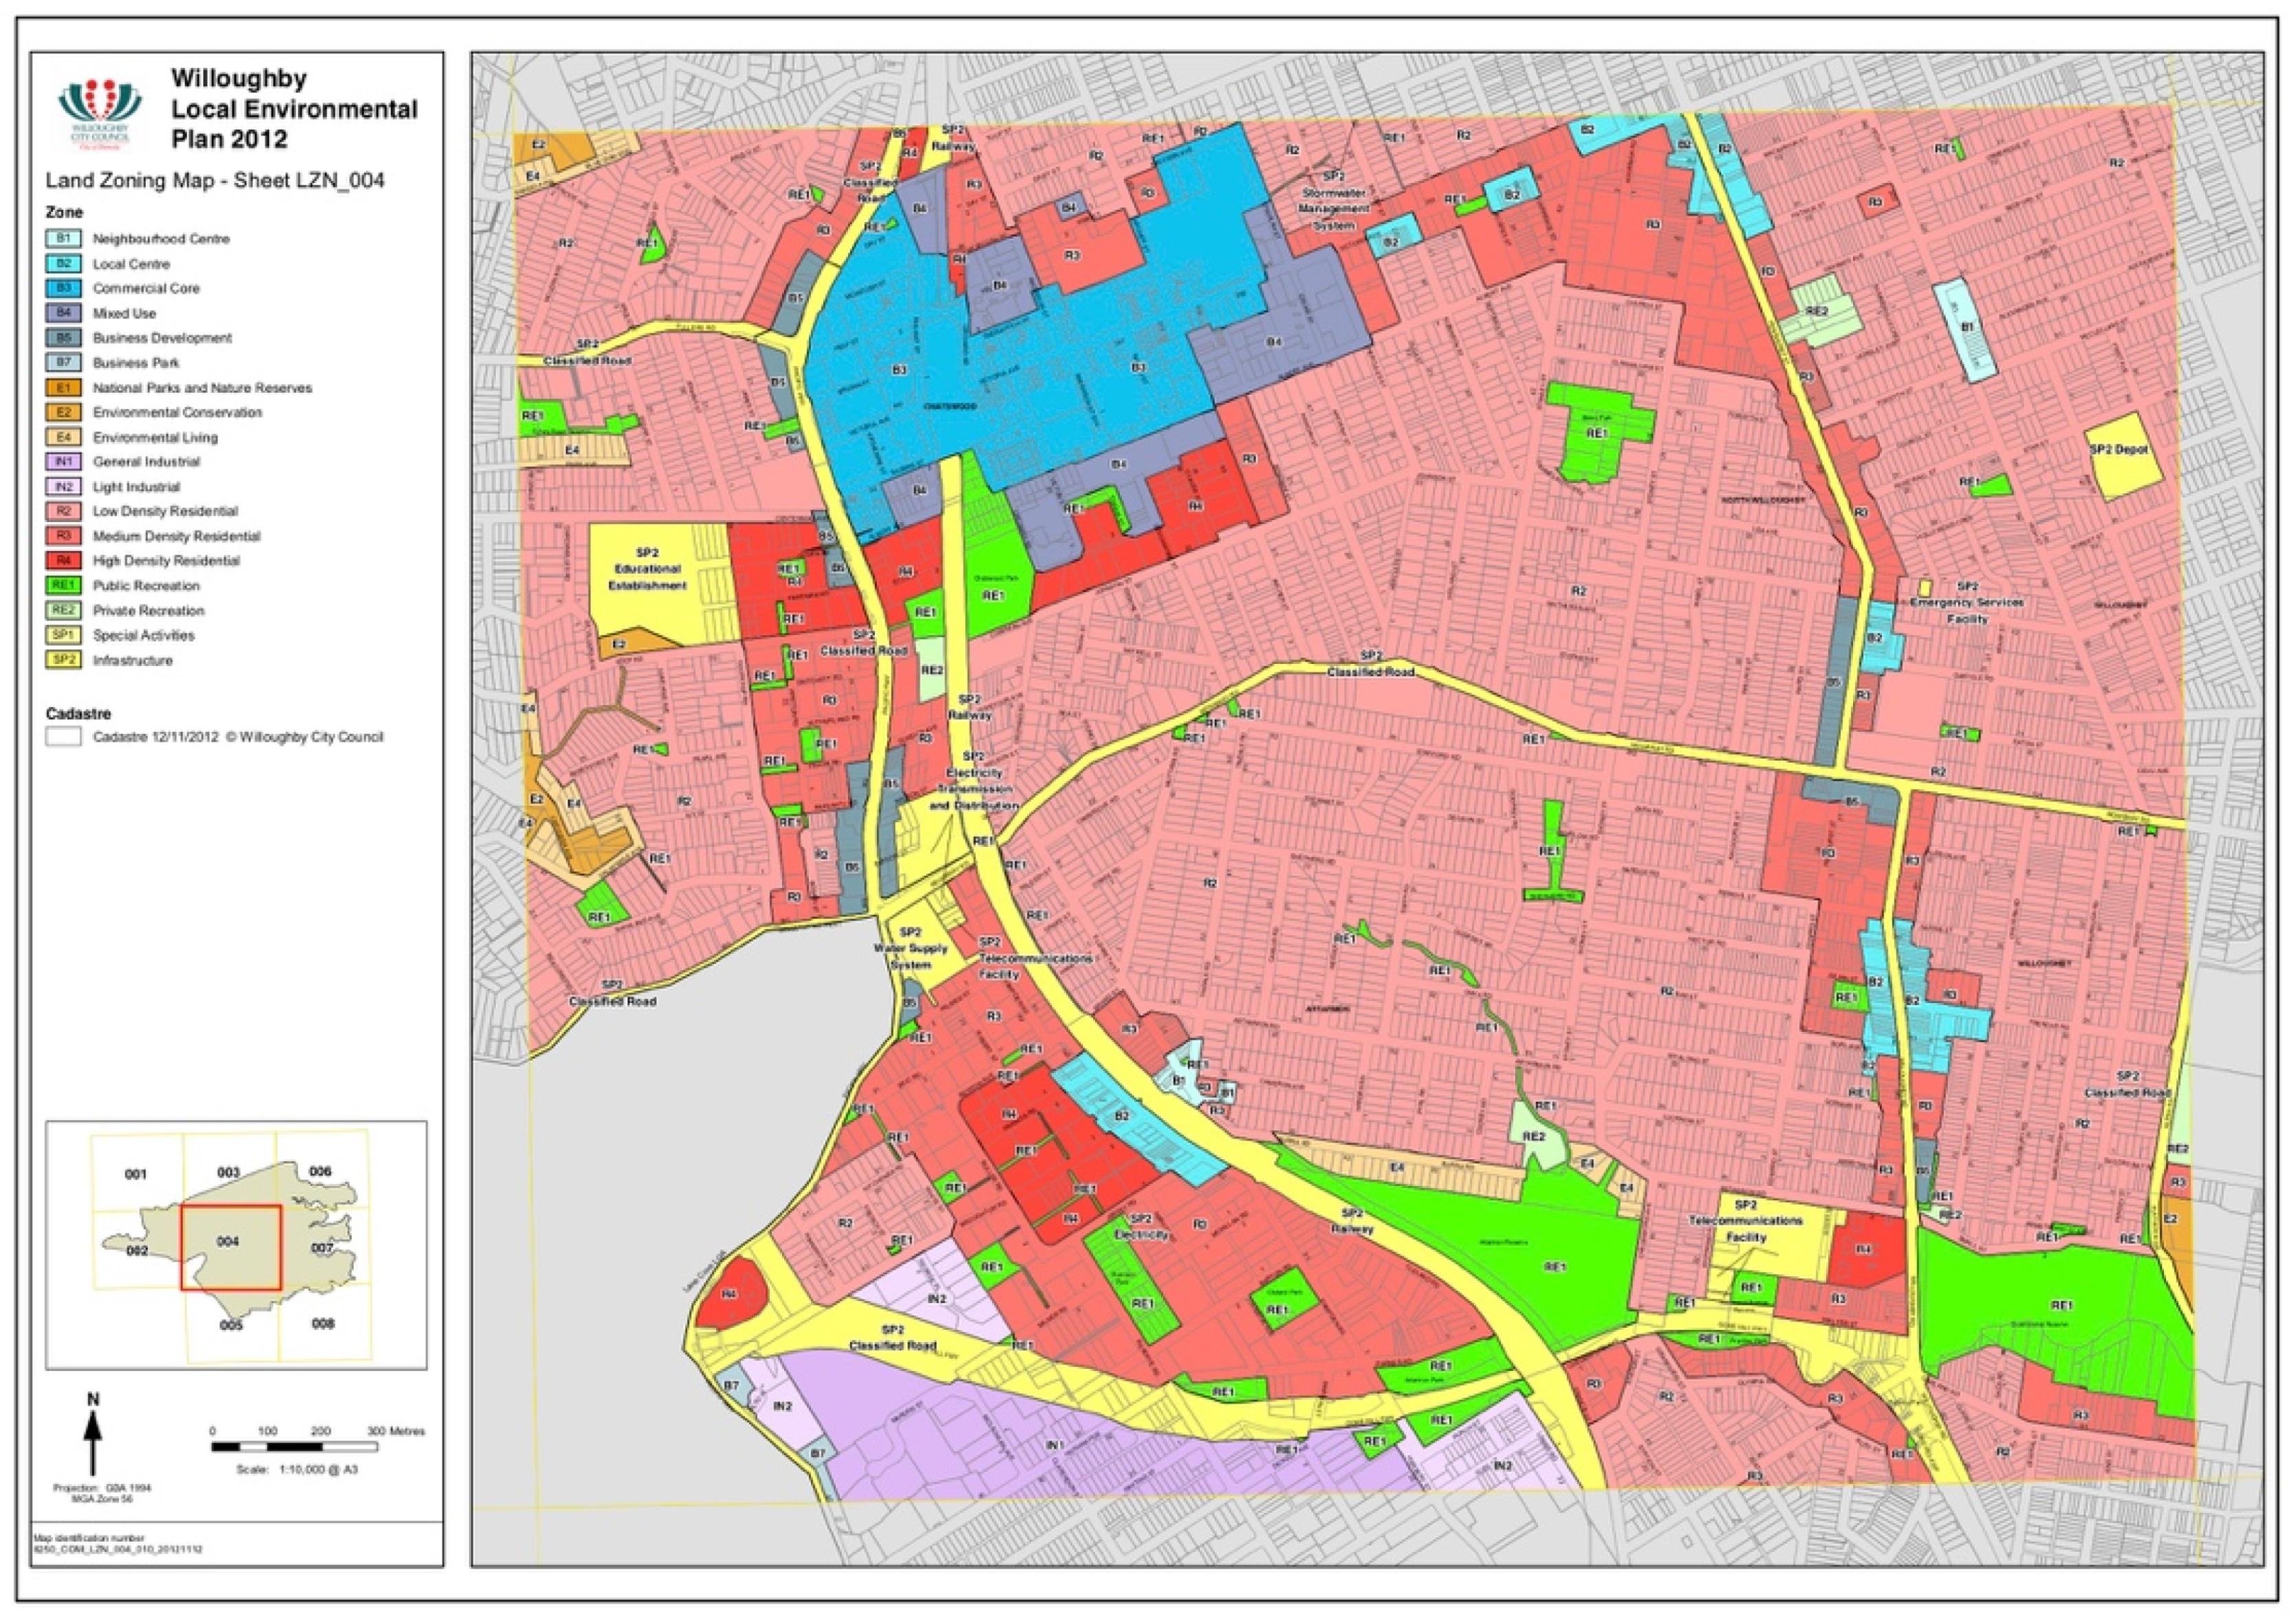
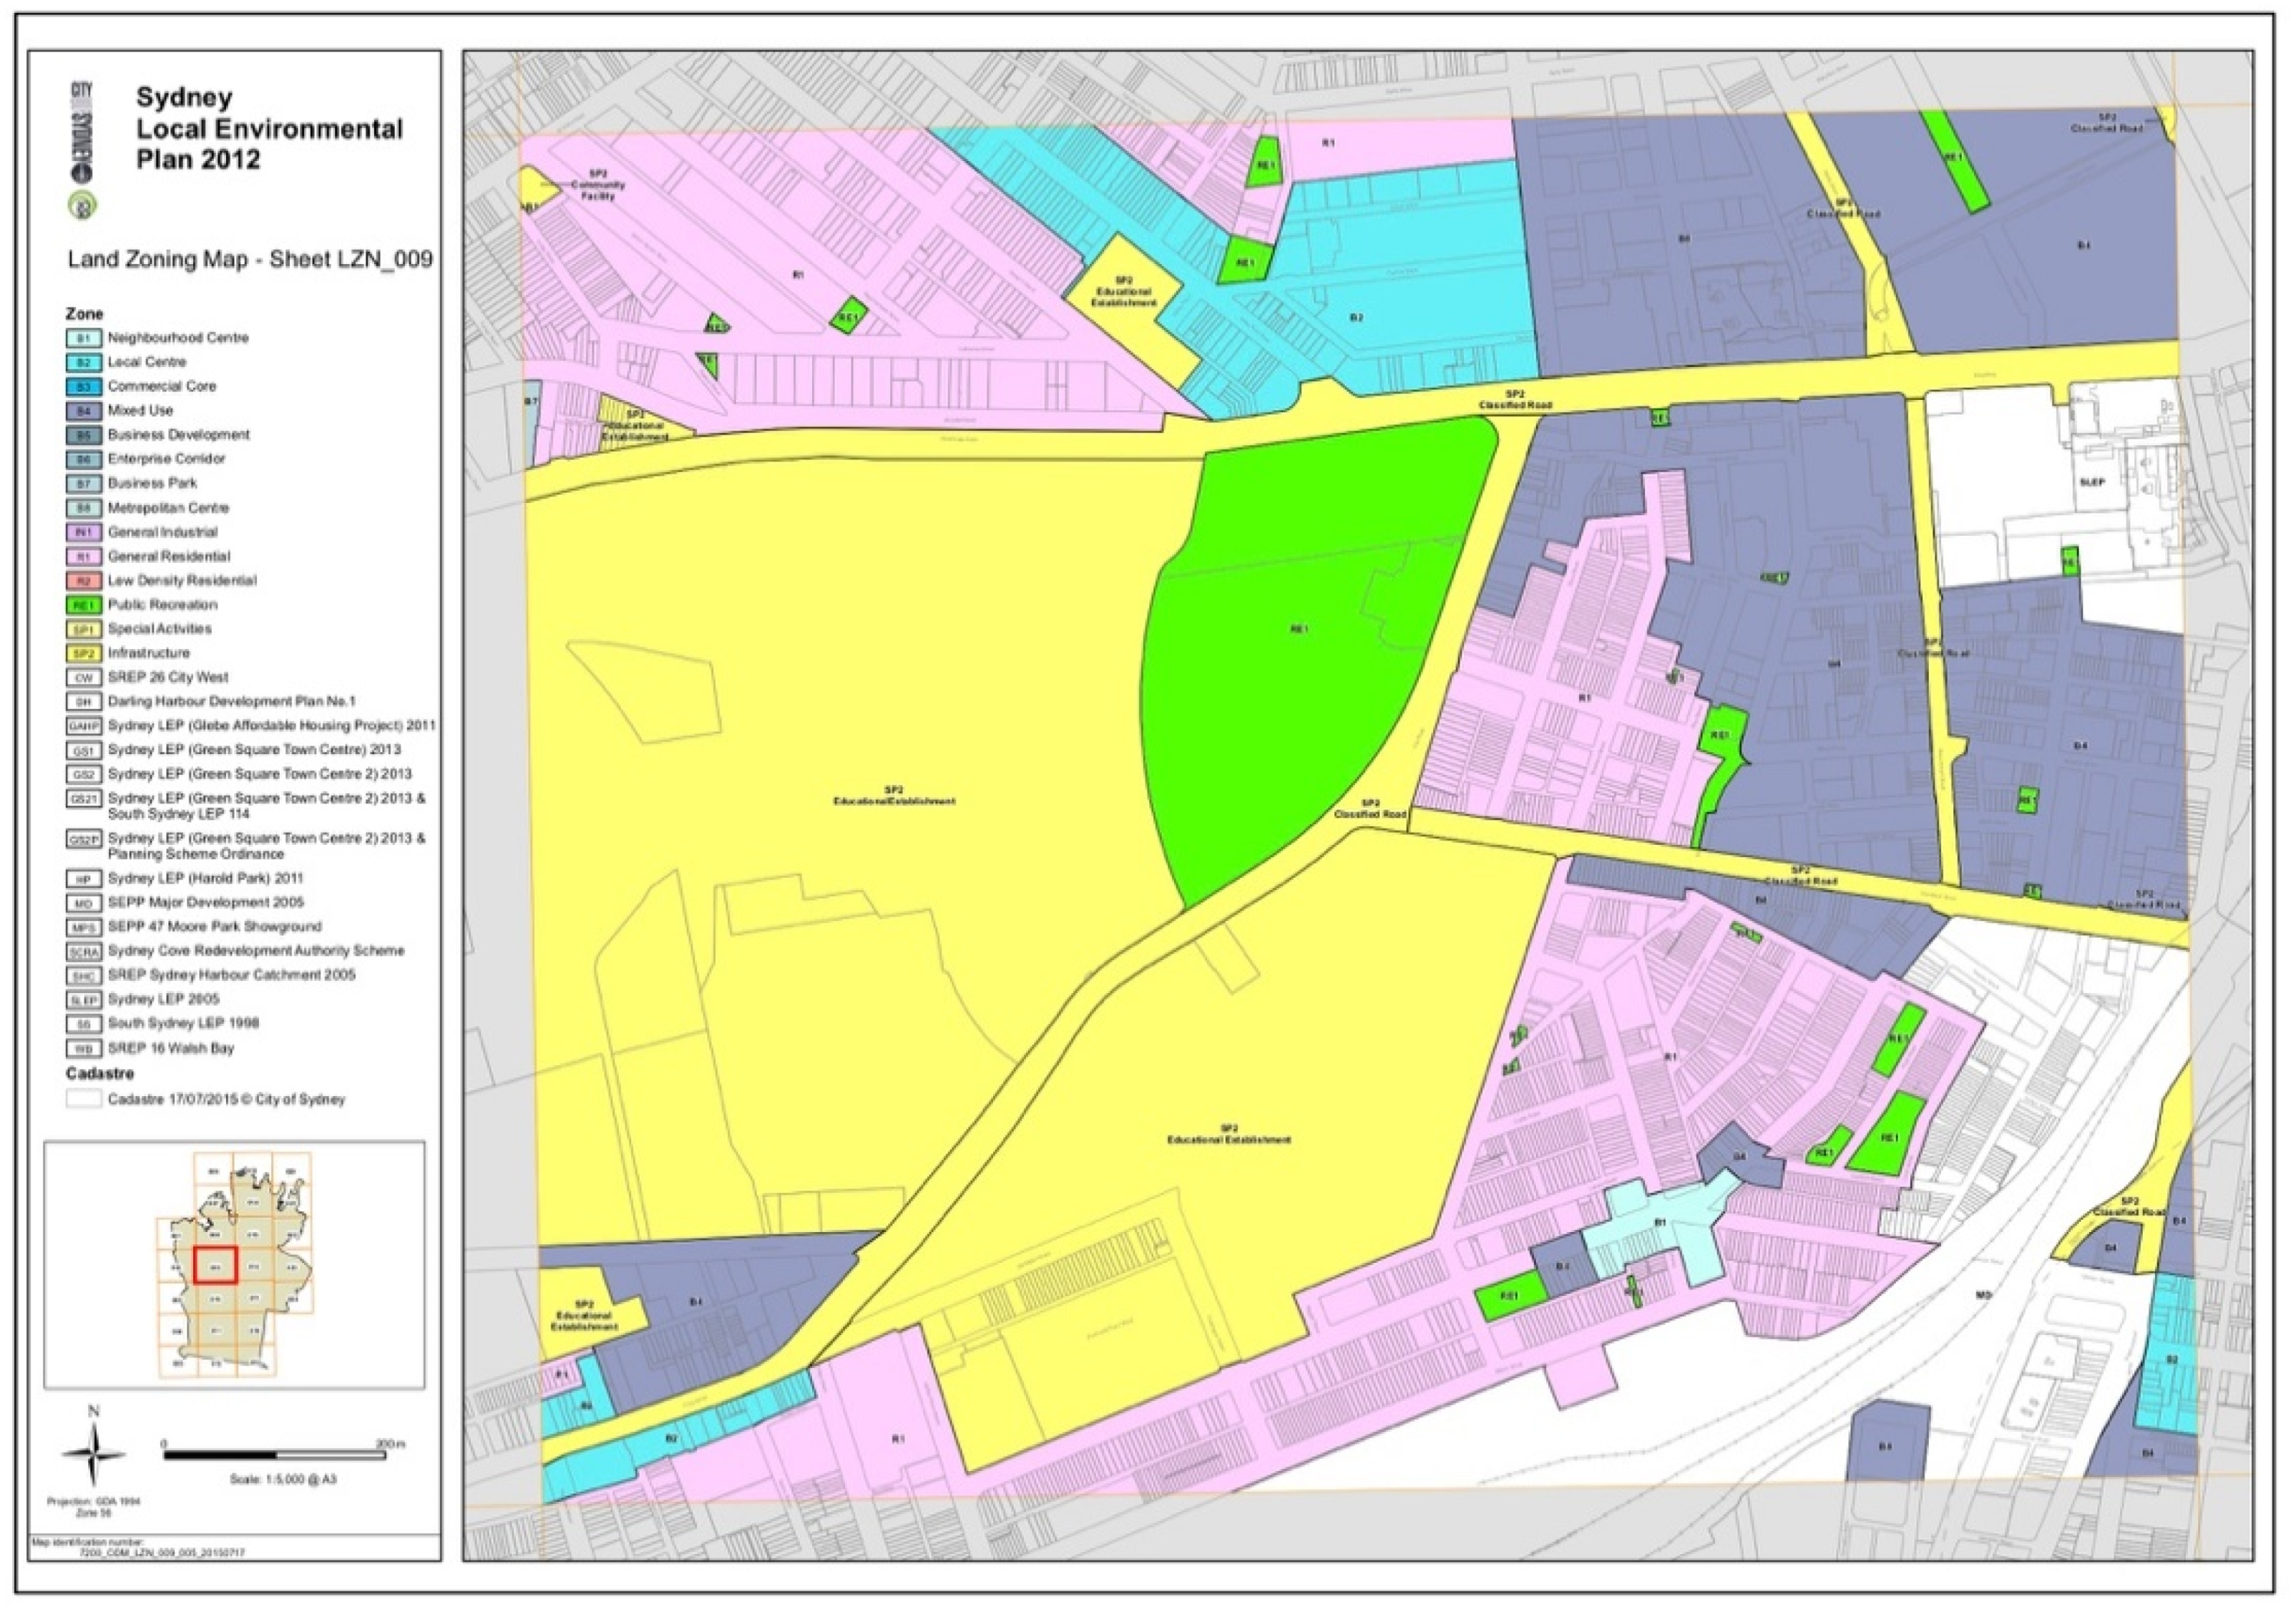
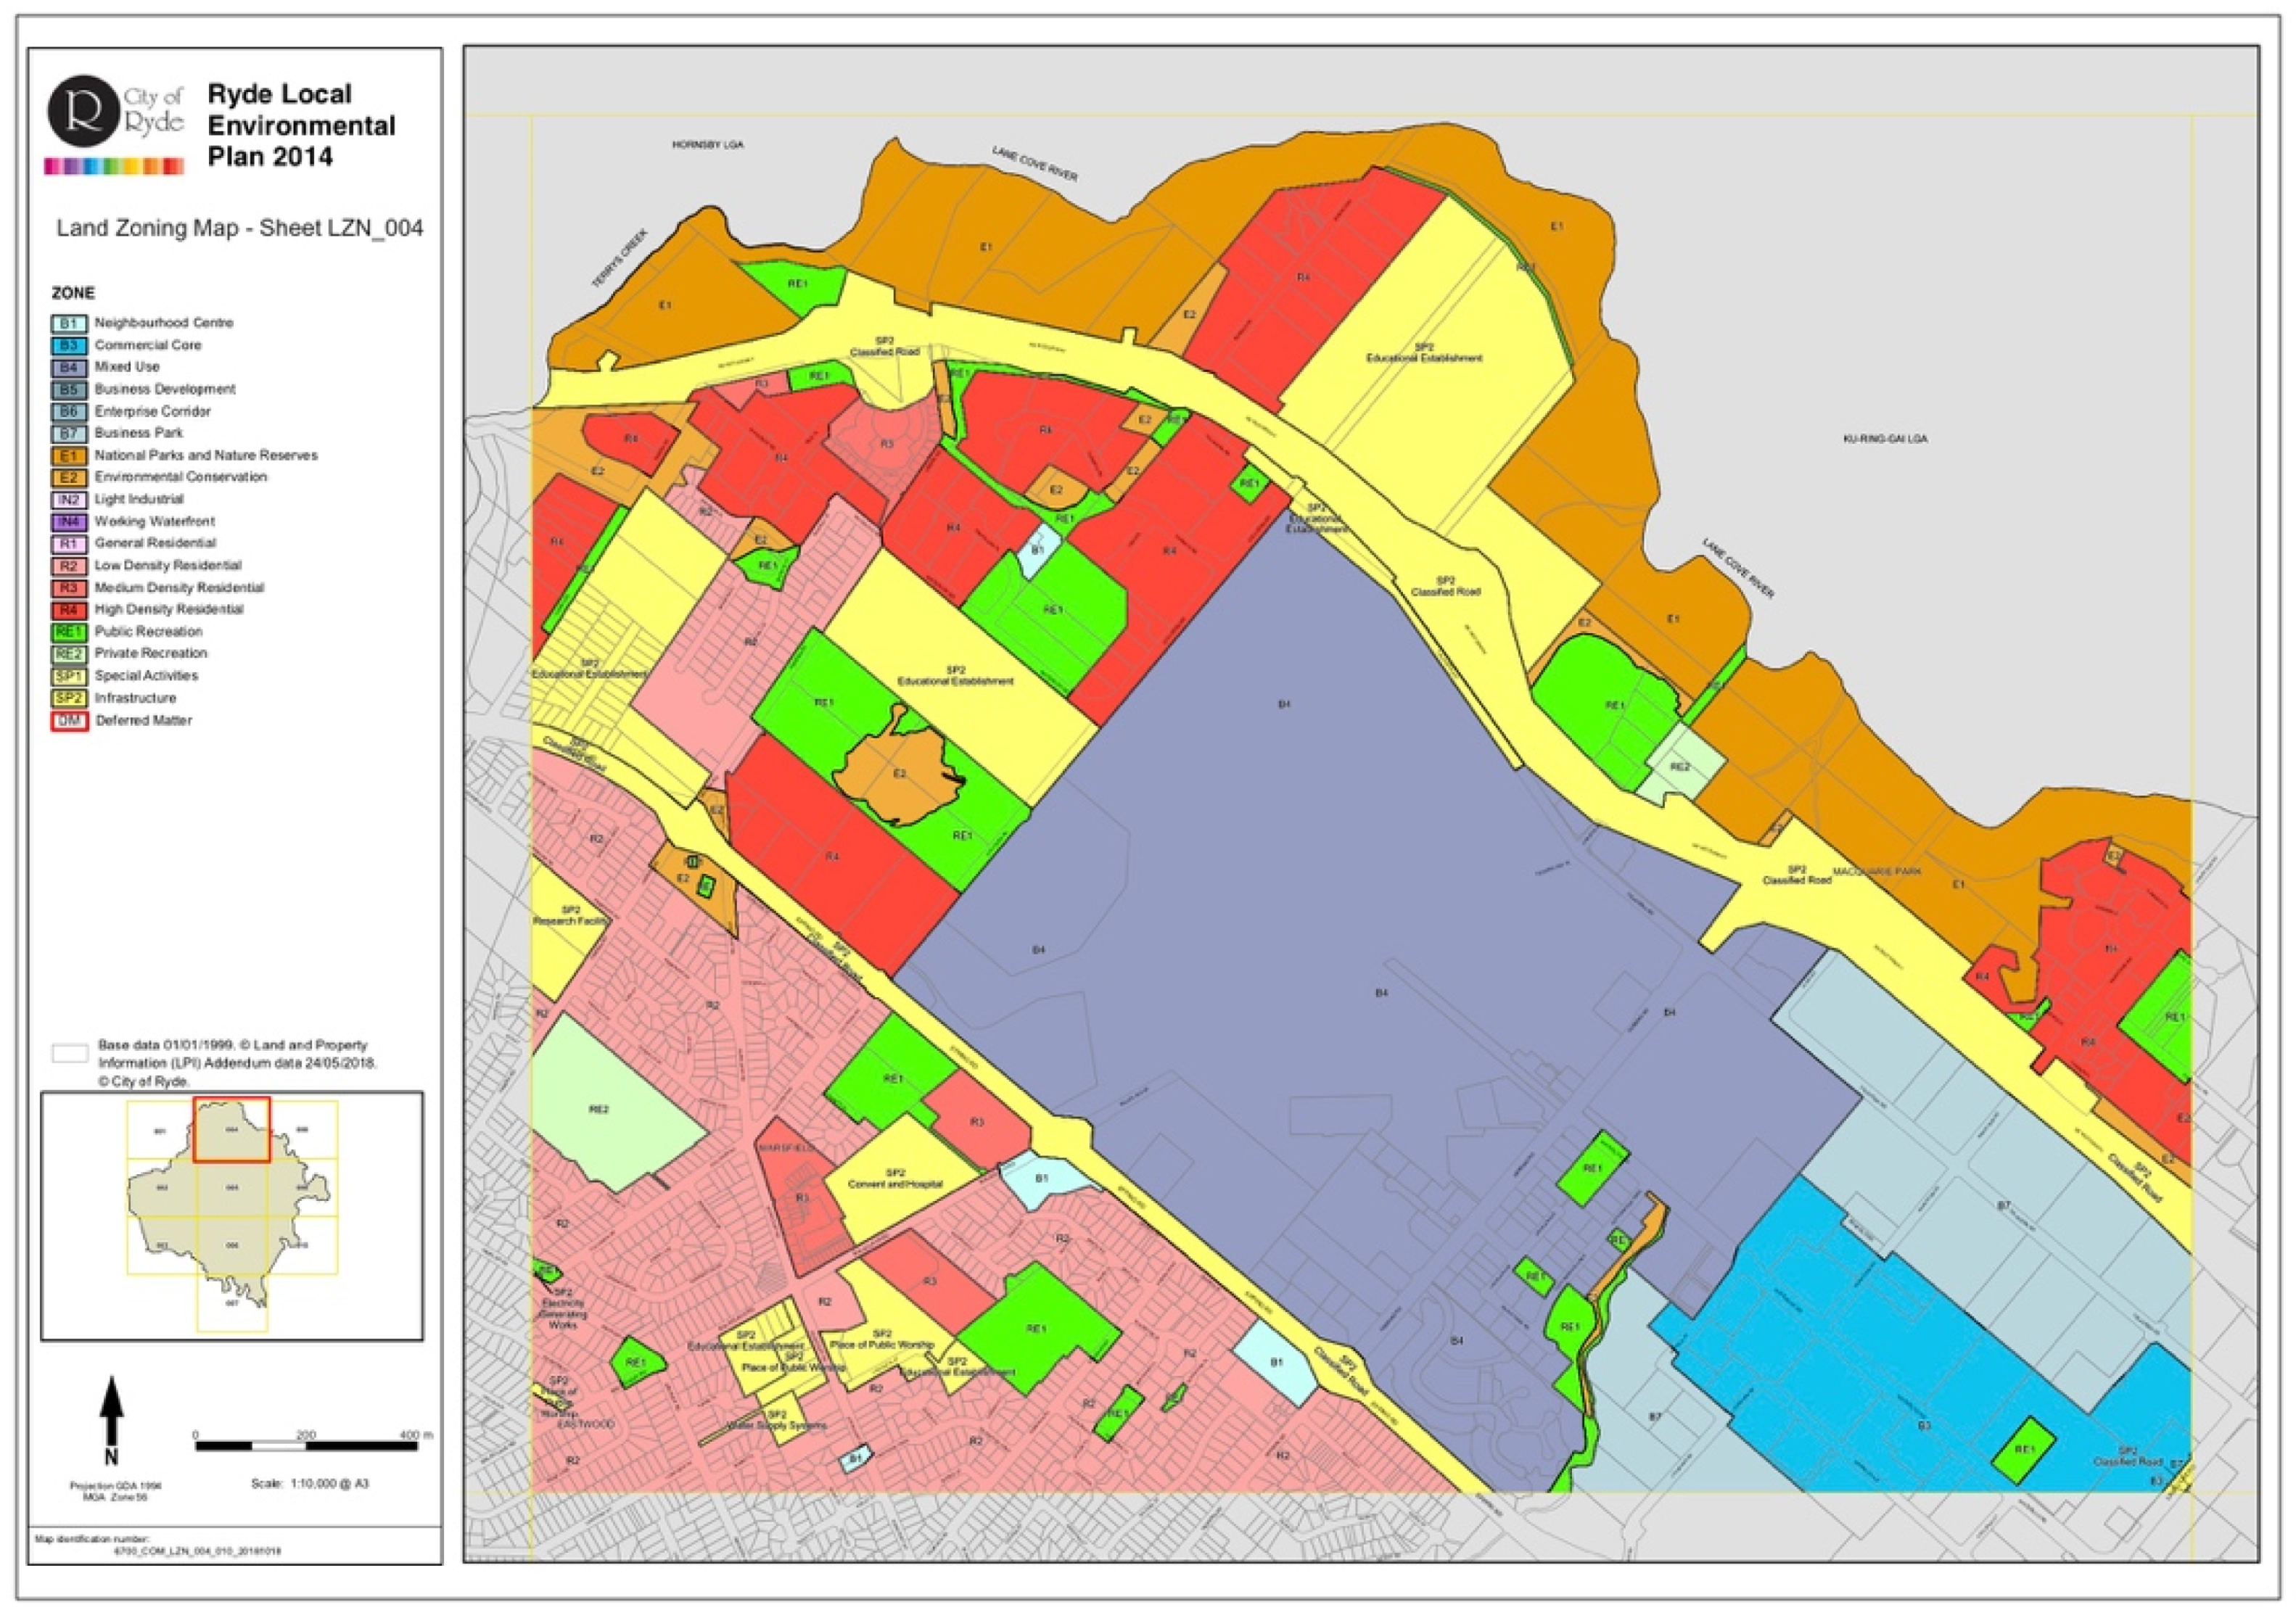
  • Contain at least 20 hectares of high-density residential real estate (R4 zoned) or high-density mixed use (B4 zoned) within 2 kilometres of the suburb’s town centre.
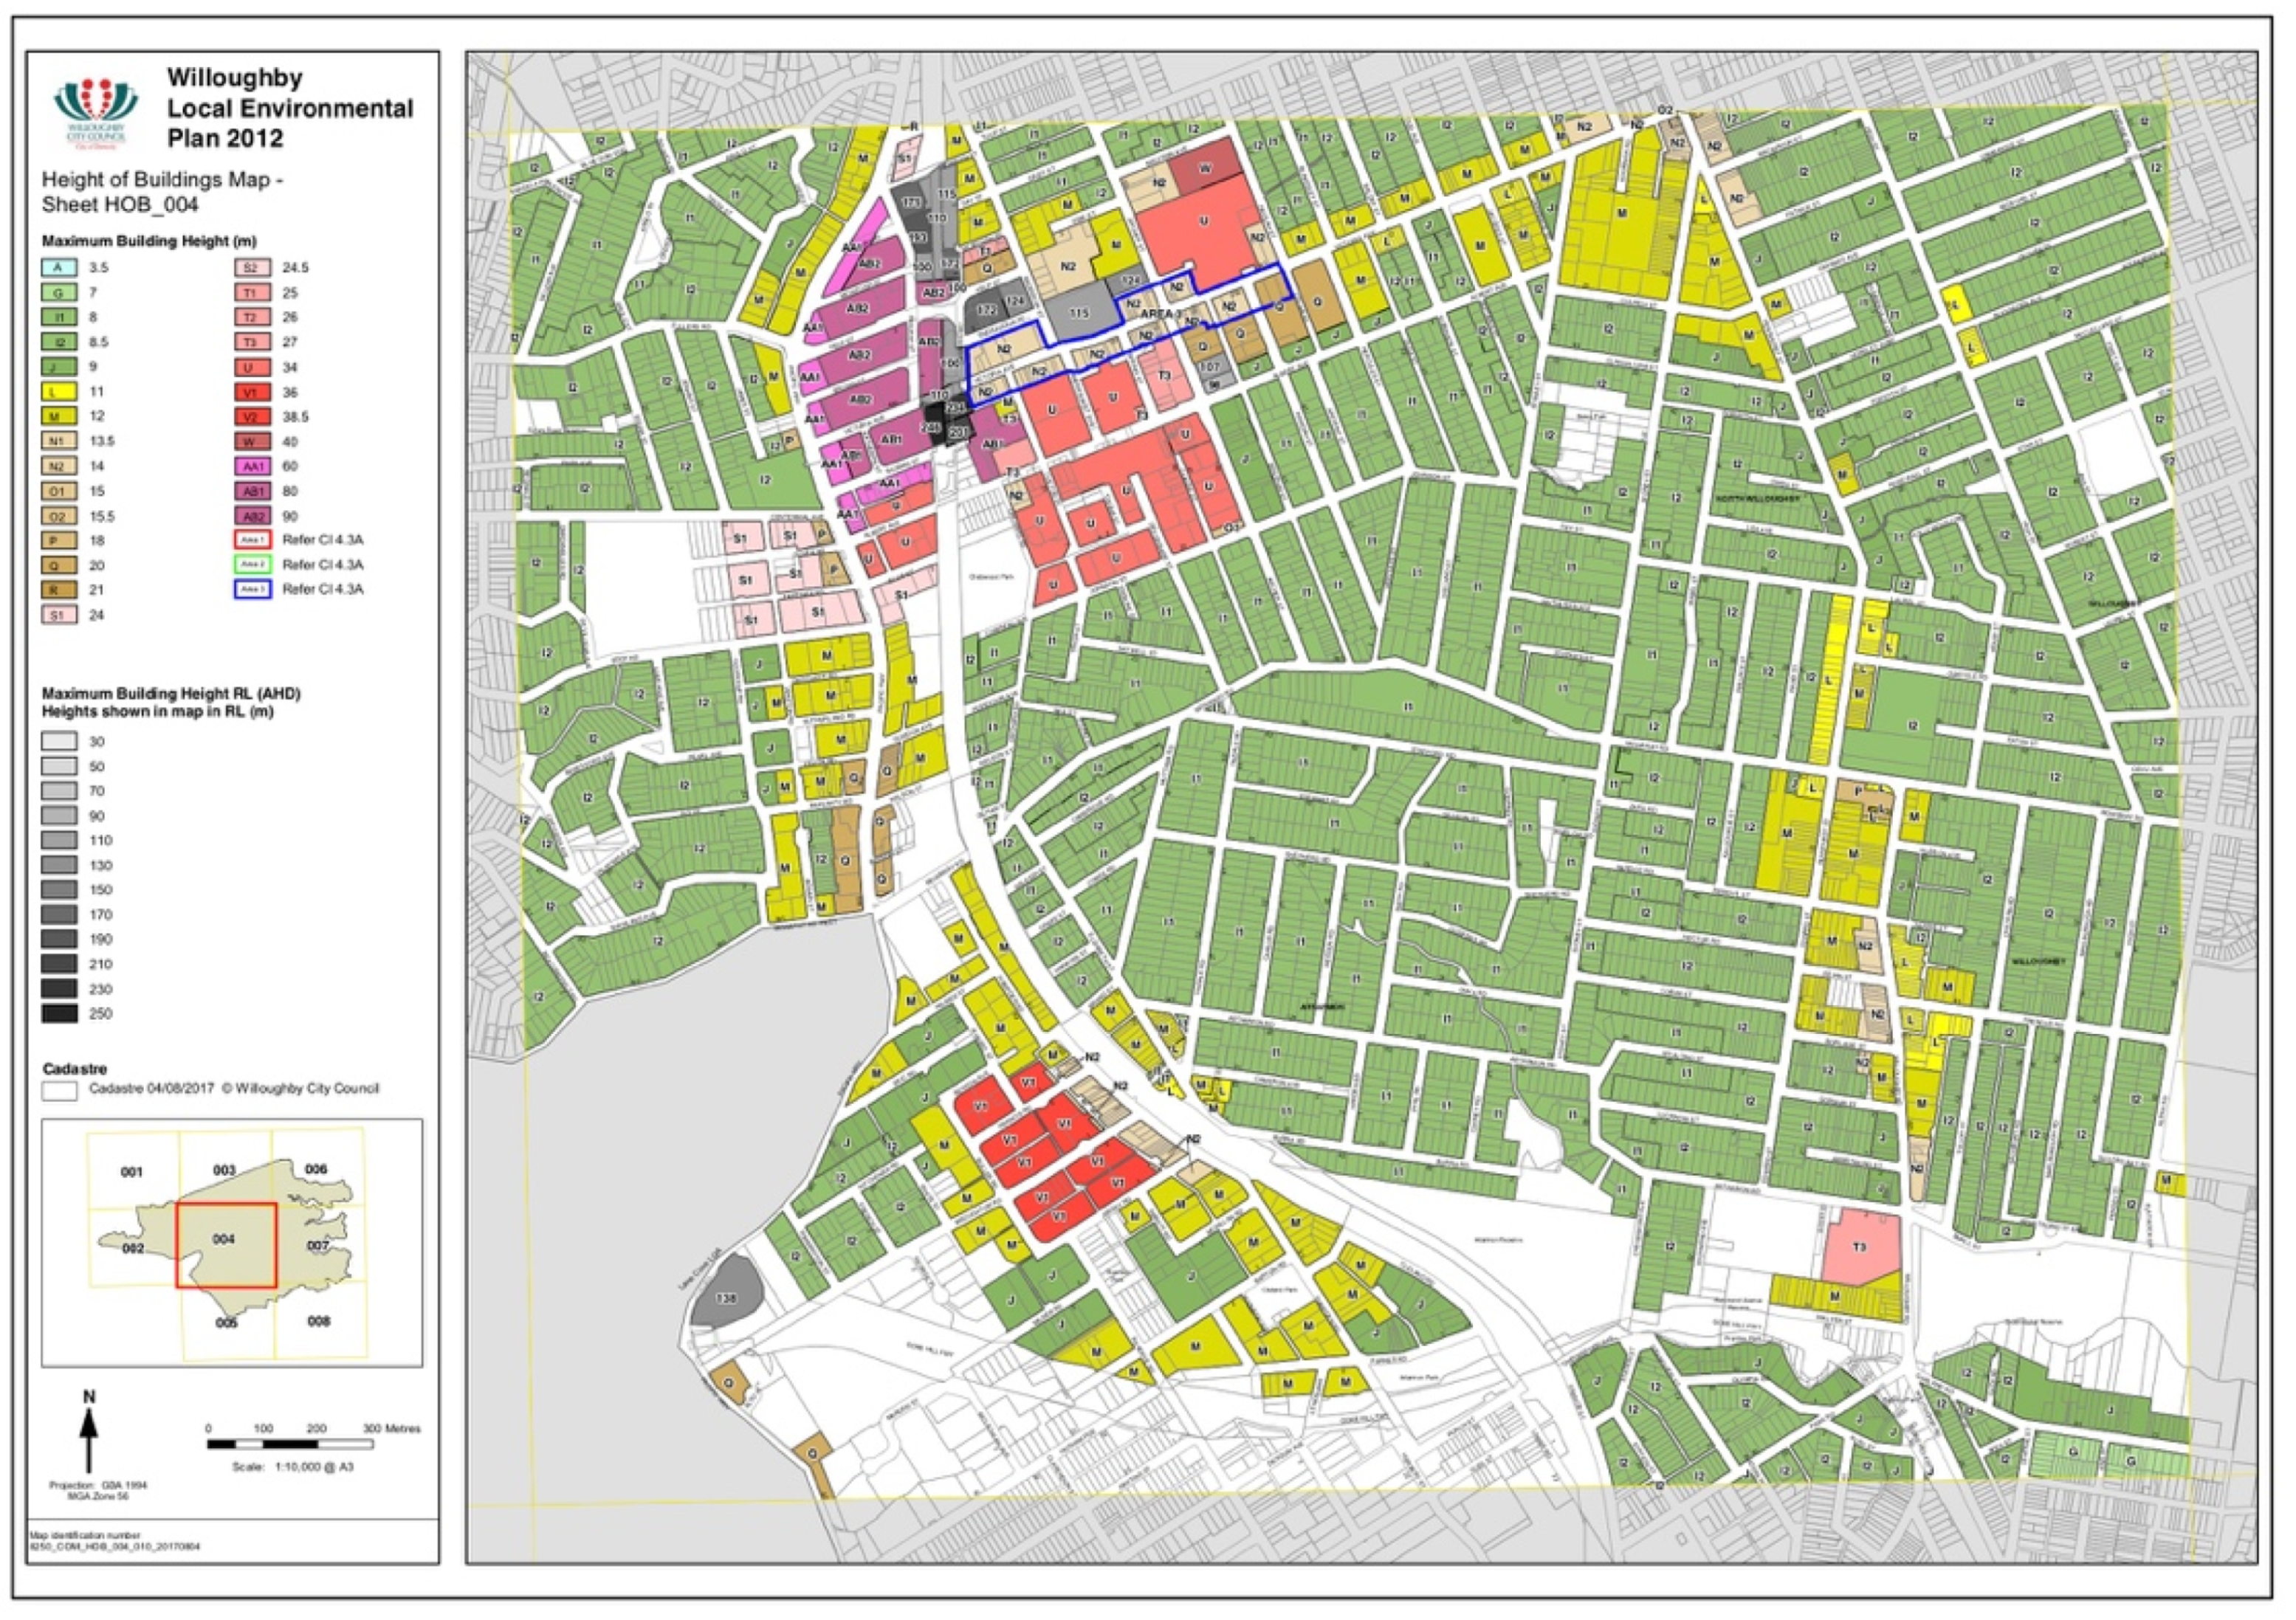
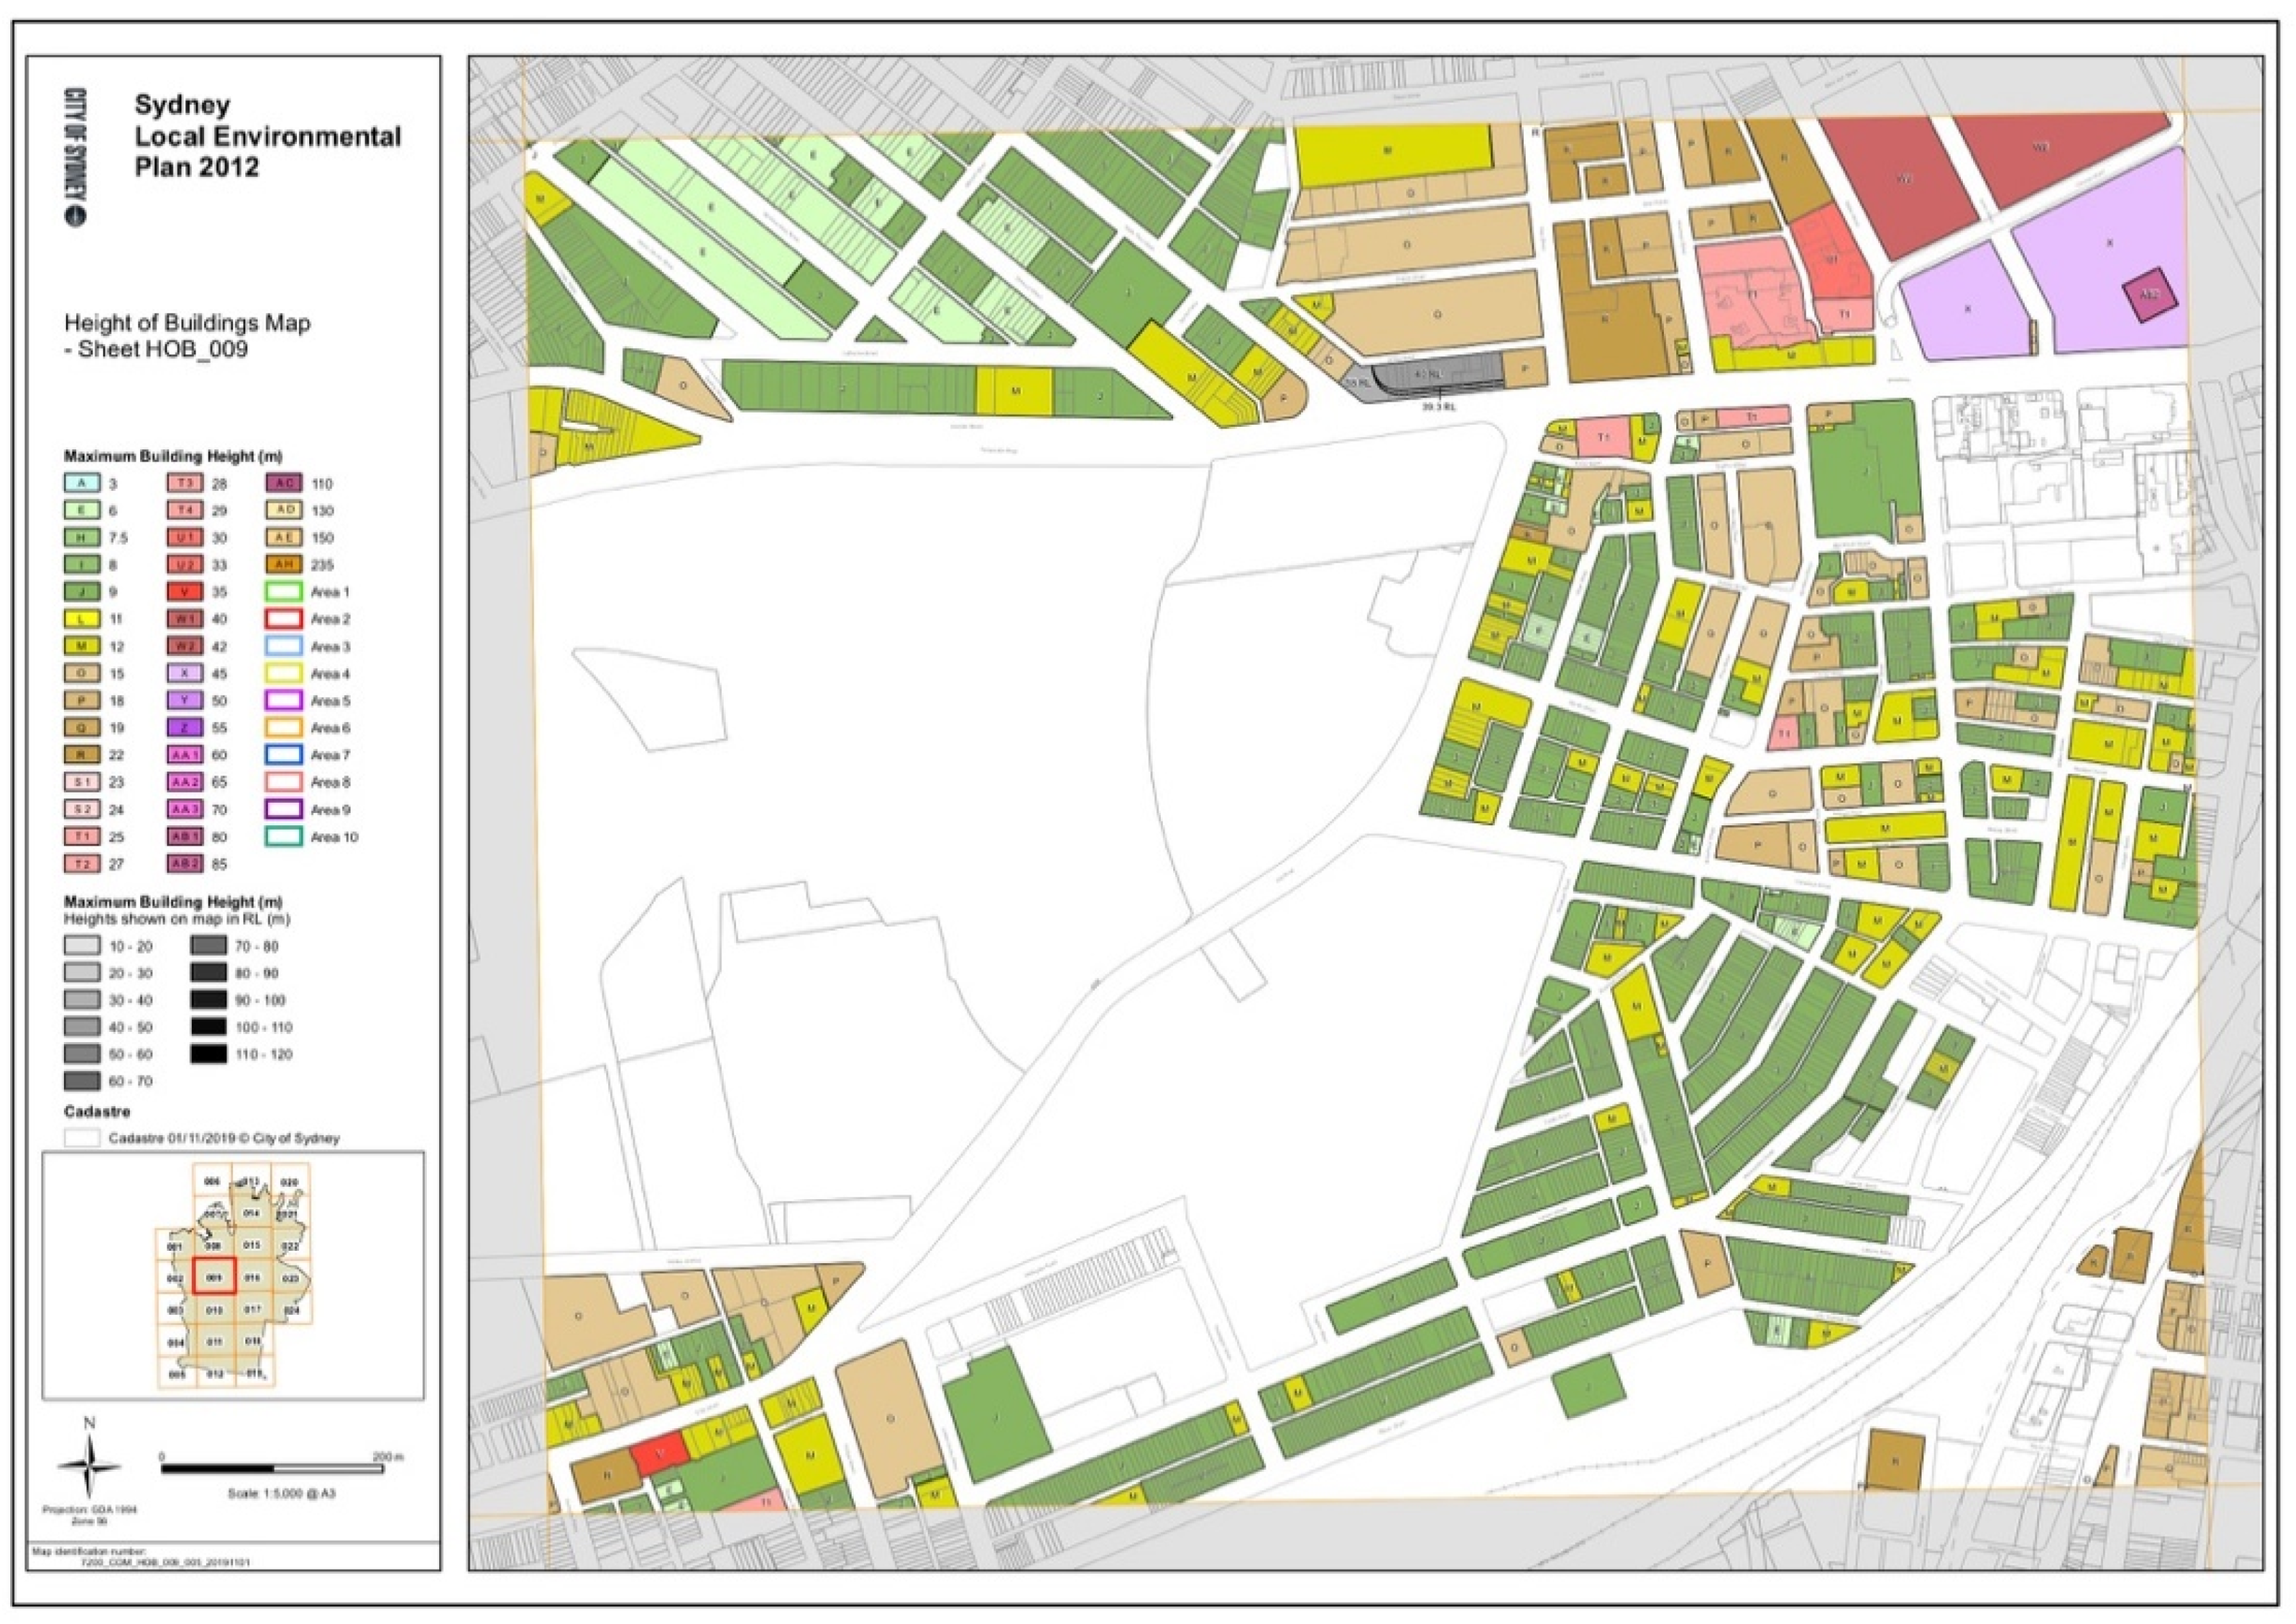
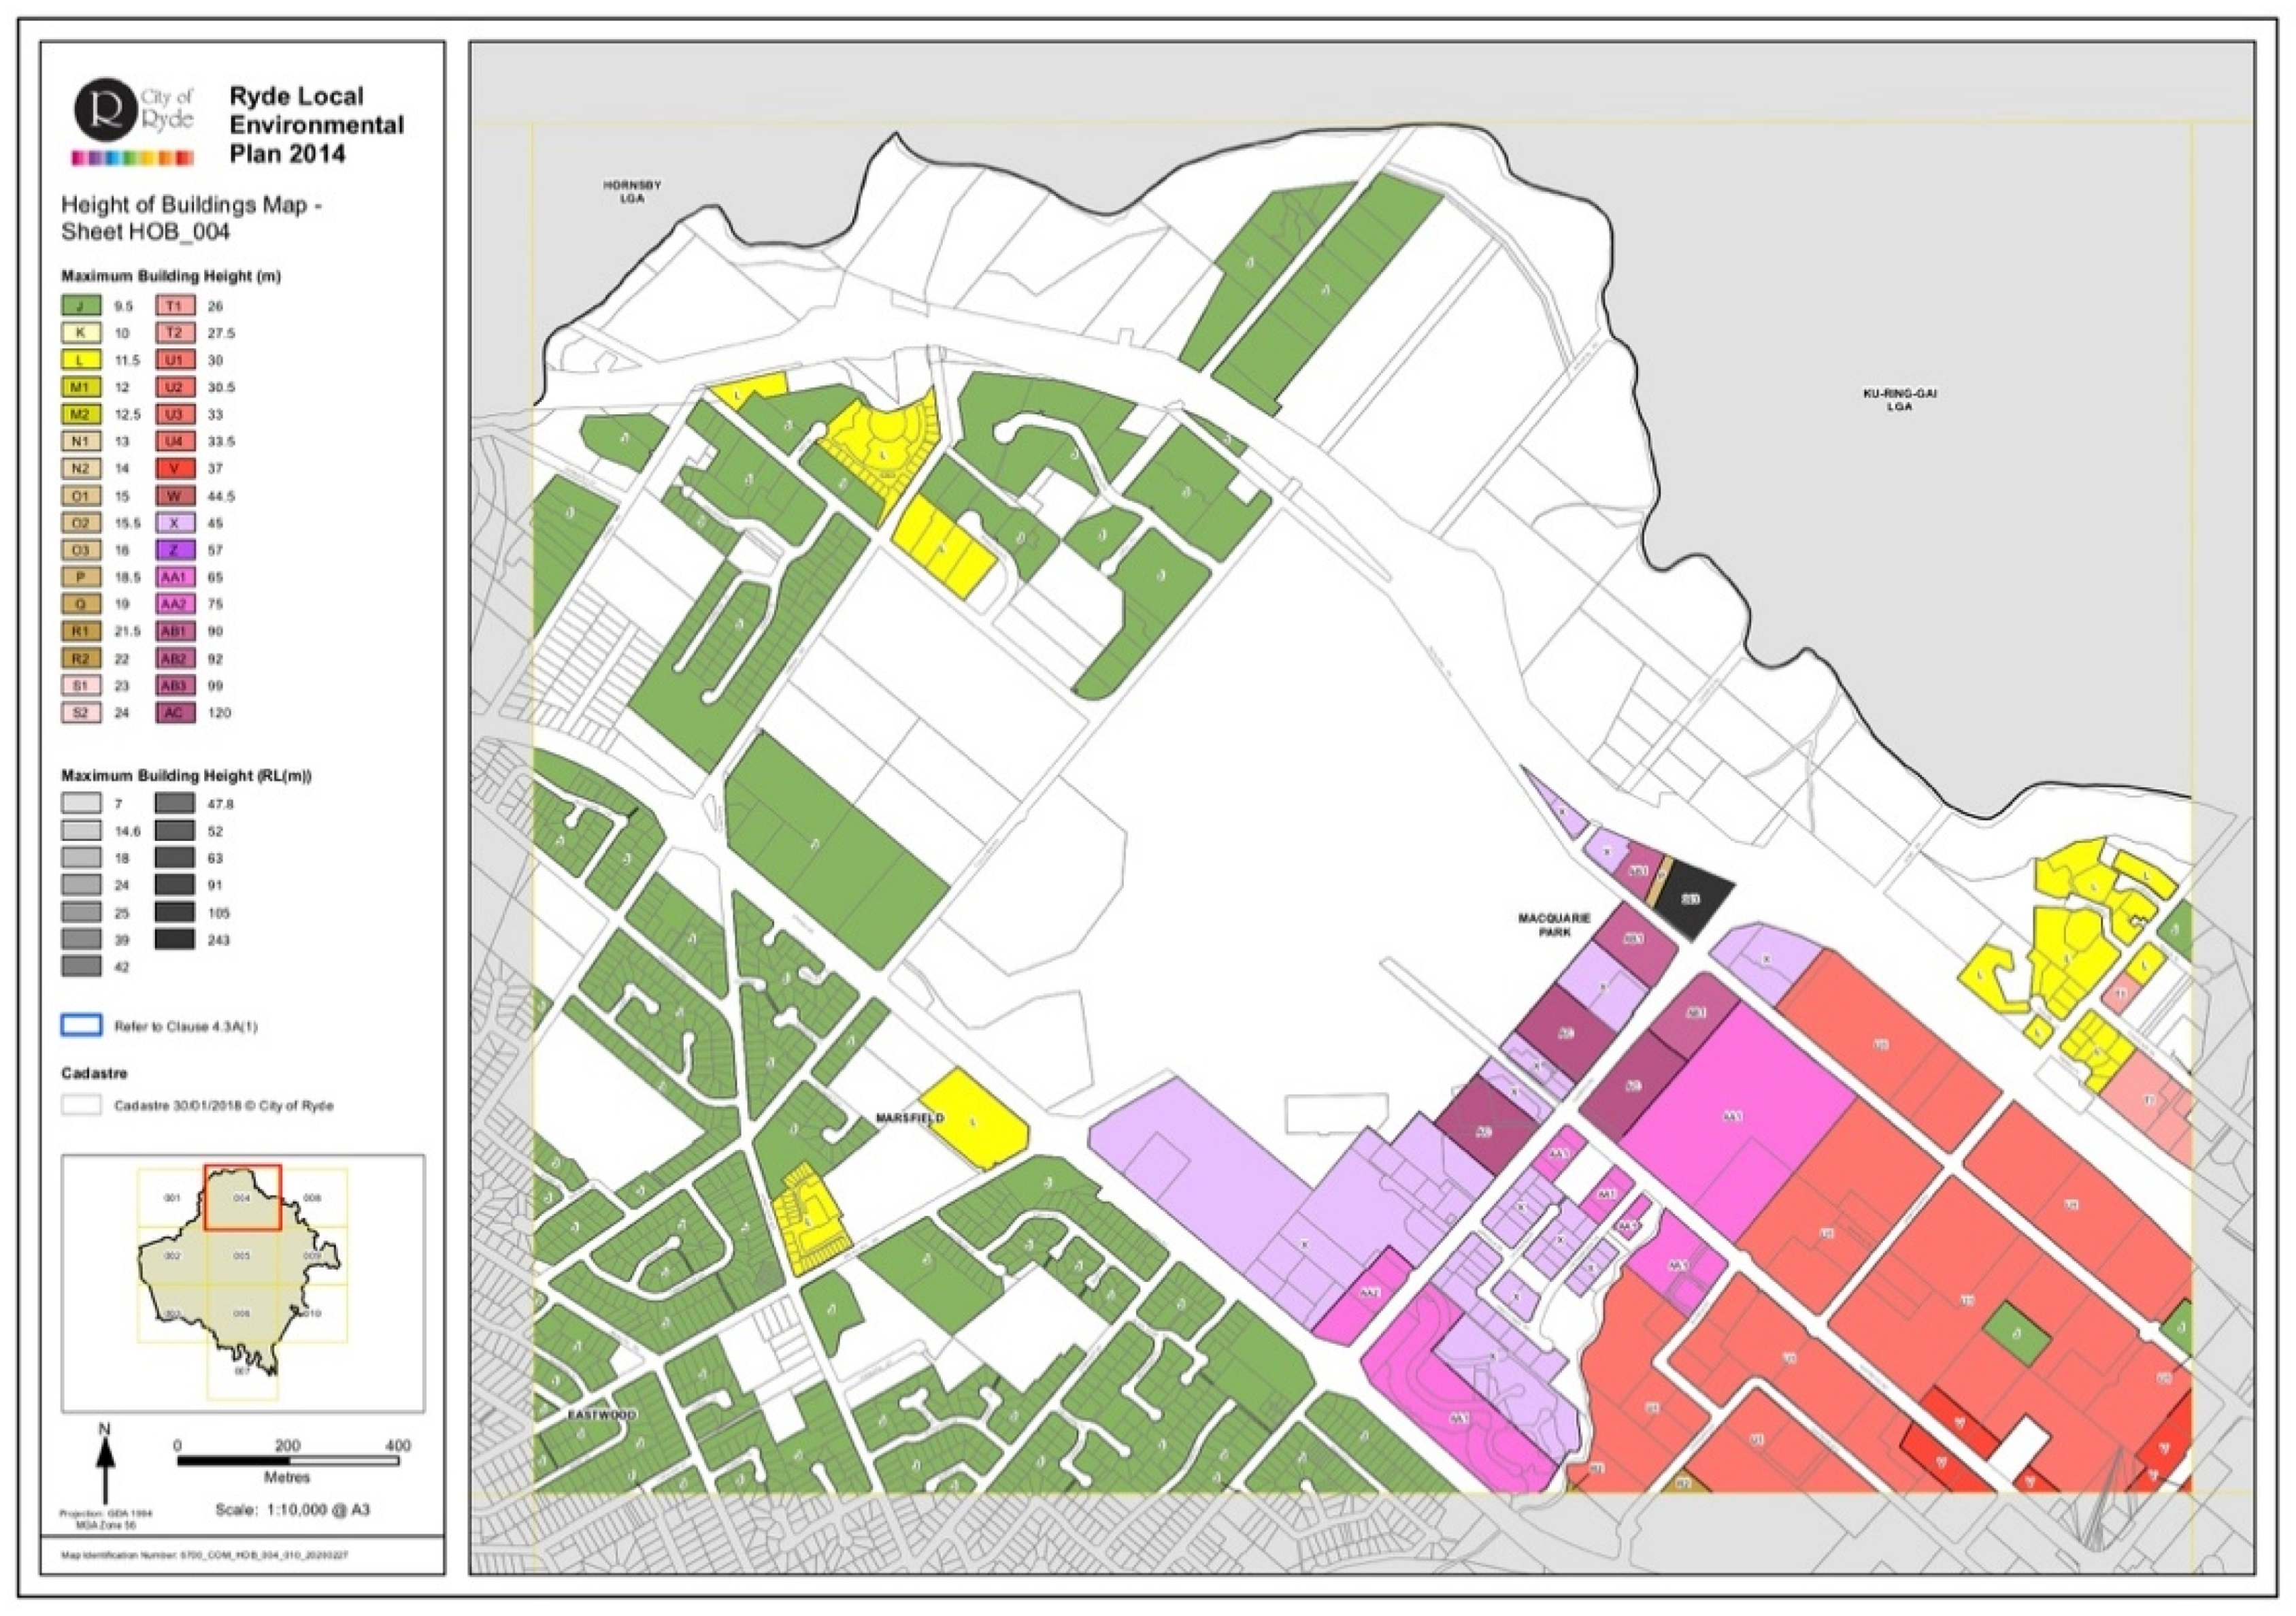
  • Contain at least one lot with a permissible height of at least 30 m.
  • Contain at least 50% of residential land in the form of low to medium density (R1/2/3 zoned).
  • Contain at least 20 hectares of high-density mixed use (B4 zoned) or commercial core (B3 zoned) within the suburb’s town centre.
  • Contains at least 10 hectares of parkland within 2 km of the suburb’s town centre.
  • Offer communal facilities such as a library, educational establishments (SP2 zoned), local recreation (RE1 zoned), sports facilities/special activities (SP1 zoned).
The research focuses on understanding Sydney residents’ perceptions of high-density local characteristics and as such does not require the sampling frame to consist of suburbs displaying those characteristics. However, in order to provide structure to the research’s participant recruitment methods, it is beneficial to build a sampling frame consisting of areas’ which exemplify high-density local characteristics. These benefits include (1) engaging participants who have experience in understanding how urban elements interact with their lifestyle, (2) engaging participants who are more likely to be impacted by the implications of this research and (3) engaging participants who do not present a bias towards low-density local characteristics. Therefore, although it is not essential to have a highly specified sampling frame selection criteria, the provision of one offers benefit with little to no downside.
The selection criteria were formed through consideration of the definition of high-density characteristics and an assessment of the Local Environmental Plans of local government areas in Sydney. The specifics of each parameter were formed through a visual comparison of the LEPs, leading to a broad understanding of how much land was typically needed for particular zoning in order for it to impose its significance within its suburb’s characteristics. The suburbs sought were required to present high-density local characteristics whilst still remaining a mostly residential area. The parameter requiring 30 m permissible height for at least one lot was provided by the literature [3], which states that high-rise buildings in Europe are typically those with 12 floors or more in the context of high-density [3]. As Australia is a Western nation with a largely European inspired town centre topography [3], this figure was appropriated to Sydney in which each floor is typically 3-m tall. As this research is seeking high-density characteristics rather than specific topographies, this figure is rounded to 30m and considered appropriate to convey a high-density topographic environment.

3.4.2. Sampling Frame Selection

Upon determining the sampling frame criteria, a detailed assessment of each LEP was conducted, in which each suburb was assessed and accepted or rejected against the criteria. The following suburbs were identified as presenting the required characteristics to be included in the sampling frame:
  • Chatswood
  • Parramatta
  • Chippendale
  • Macquarie Park
  • Rhodes
This list is not exhaustive of all the suburbs which meet this criterion, but rather those which were selected at random from the shortlist. Future research can aim to isolate the sampling frame suburbs in a more justified and systematic manner to determine the differences in preferences/findings, between the suburbs or through the selection of different suburbs. However, this is not required for this research’s objective, and as such, the LEPs are assessed against the selection criteria. The LEPs for the sampling frame suburbs can be found in Appendix A.

3.5. Participant Recruitment Methods

Number of Participants

30 participants were selected from each of the sampled suburbs.
Leading to a total of 150 research participants. Inclusion Criteria:
  • Minimum 21 years of age—to ensure participant has had time as an adult to reflect upon and refine their personal preferences.
  • Individuals living within the sampling frame suburbs.
  • Individuals who would prefer to live in a low-density property type.
  • Individuals who have access to the internet and have the language skills to comprehend and complete the questionnaire.
Exclusion Criteria:
  • Individuals outside of the sampling frame.
  • Individuals who prefer to exclusively live in a high-density property type.
  • Individuals who cannot access or understand the questionnaire.

3.6. Questionnaire

The questionnaire will act as an instrument to provide a conclusive understanding of low-density residents’ individual preferences for certain local characteristics. The administered questionnaire can be found in Appendix B Table A1.
Questionnaire structure [19]: it adopts the route of recruitment/exclusion questions, followed by screening questions, then the main body. The questionnaire body presents behavioural questions before attitude and spontaneous questions before prompted. This structure stives to prevent the occurrence of a consistency or a priming effect.
Objective alignment [19]: The questionnaire route ensures that the question’s measurement objective aligns with the question type and data type. When measuring behaviours, both spontaneous and prompted question types were used, with the closed prompted question and open spontaneous question both collecting pre-coded data. When measuring attitudes, both spontaneous and prompted questions were used. However, the open spontaneous questions cannot all be pre-coded.
Techniques Employed [19]: Funneling is the predominant technique used to simplify the extraction of large complex pieces of information. The questionnaire will not offer respondents relief through “don’t know” responses for closed questions measuring attitudes, with the intent to tease out unaware personal preferences. Prompting techniques intentionally extract information indirectly, allowing for quick situational self-assumptions. Future orientation is addressed through attitude measurement and inference rather than behavioural assessment, as behaviour is unpredictable, aspirational and bias ridden. Language used is simple, approachable and unambiguous, so as to not prompt unintended emotional connotations.

3.7. Data Analysis Method

In answering each research question, a different data analysis method must be adopted. This is because each research question requires different interpretations of the data to allow for specific understandings to be formed. As the Research Questions (RQ) follow a funneling format, in order to answer the primary research question, the secondary research questions must be answered first.
RQ2. (Secondary) Does a person with a preference for low-density properties like high-density local characteristics?
In order to answer RQ2, the collected data will be analysed using the Pearson’s Correlation Coefficient, also known as the Bivariate Correlation. The coefficient is an index of the degree and direction of linear association between two continuous variables [16]. The method has been selected as it provides the necessary interpretation of the data to derive an understanding that can answer RQ2, whilst also being a simple and commonly employed statistical method in the social and behavioural sciences testing procedures.
RQ3. (Secondary) If so, which characteristics do they like? Which characteristics do they not like?
In order to answer RQ3, the data will be analysed and presented using a Word Cloud. This method was selected as the understanding sought is not for a definitive answer but rather an understanding of the main likes and dislikes amongst the variety of responses collected through the open-ended questions.
RQ4. (Secondary) If these high-density local characteristics were provided in a low-density context (i.e., removing the property density negative externalities), would those with a low-density preference find this attractive? If so, to what extent?
In answering RQ4, the question must be considered in two parts. The first part of the research question seeks a yes or no answer. In order to determine the answer a simple assessment of the respondent’s placement upon the Resident Preferences Graph (Figure 1) is required to be conducted. If more respondents are in the Top Left Quadrant than the Top Right Quadrant then the answer will be no, those with a LD property preference find LD characteristics attractive. However, if there are more respondents in the top right quadrant, then the answer will be yes, those with a LD property preference find HD characteristics more attractive and therefore if these HD characteristics were provided in a LD context, this proposition would be attractive to most respondents. Only the top two quadrants will be assessed, due to the fact that only the LD property context is being considered.
The second part of the research question aims to determine the extent to which these HD characteristics are found attractive in a LD property type. In order to assess the extent, an analysis of shared variance will be conducted. This method was selected as it is simple to conduct, easy to interpret and builds upon the Bivariate Correlation analysis conducted for RQ1.
The extent will be considered as it aids in answering the primary research question. However, it is not the primary focus of this research and as such, it is considered and presented at a preliminary level.
In gaining an understanding of the data and answering the three secondary research questions, the primary research question can be answered.
RQ1. (Primary) What is the perception of high-density local characteristics by a low-density resident?
In answering RQ1 and determining the perceptions held by LD residents, an understanding of the secondary research answers must be formed. This understanding will lead to the formation of the perceptions and will be expressed in prose format. The perceptions held are multi-facetted opinions and therefore require all three secondary research questions to be answered prior to achieving a justifiable conclusion. Whilst the answer to the primary research question is a cumulation of the secondary research answers, it requires the interpretation of the analyst to review the collected information and derive a suitable response.
Through determining these perceptions and forming a prose response to RQ1, this research can then justify whether to accept or not accept the hypothesis.
Hypothesis—Low-density residents perceive high-density local characteristics to be attractive.
If the hypothesis is accepted, this then allows for the concept to be accepted and evolves the conceptual theory in this direction. However, if the hypothesis is not accepted then the concept is by default also not accepted, thereby allowing for an understanding of the concept to be formed but not allowing it to evolve.
Concept—If high-density local characteristics are able to be utilised by low-density properties, low-density residents will consider these properties to be more valuable.
As established in the literature review, it is known that the value of a residential property is based on the extent of its attractiveness to residents within its market. Through this, the link between the hypothesis and the concept is made evident as one aims to establish whether a residential proposition is attractive and the other seeks to establish if this proposition is more valuable than the norm. Although it may seem evident that if a proposition is more attractive than the norm then it will also be more valuable, in order to validate a positive correlation between the two X and Y variables, the analysis of Shared Variance conducted for RQ4 can be considered. Whilst this analysis will mathematically allow for the concept to either be accepted or not accepted, it will also reveal the extent to which LD residents find HD characteristics more valuable. However, the extent can be considered and mentioned, the extent to which these properties are more valuable based on hedonic changes is not the purpose of this research. Therefore, future research may observe these findings and build upon this analysis to develop a more structured approach in measuring the extent of change in value with each change in local characteristics.

4. Data and Discussion

The data was collected from 150 research participants during September 2020 as COVID restrictions eased and it was safe to conduct field research in accordance with the recommendations of local government in the selected area.
The following section presents an analysis of the collected data from the 150 participants and their demographic factors. It then interprets this analysis and explains what is presented and what it means. In answering each research question a different data analysis method is adopted. As the research questions follow a funneling format, in order to analyse and answer the primary research question (RQ1), the secondary research questions are analysed and answered first (RQ2, 3 and 4), processes stated in Section 3.6.

4.1. Data Sample Analysis (Demographic Profile of Respondents)

This section presents the demographic composition and residential history of the respondents in Table 1. The data was collected using the digital questionnaire tool Qualtrics, from which the following respondent demographic composition can be derived.
Table 2 below analyses the Demographic Factors that were presented in Table 1 above, by presenting the data in a comparable averages format. The screening questions provided an understanding of the demographic factors of the 150 research participants. This information unveils contextual insight into the respondents, thereby allowing for the determination whether the individuals in the study are an accurate representative sample of the target population or not. This determination is necessary to allow generalisations to be made when drawing conclusions for the research questions that represent the greater Sydney population’s perceptions as a whole [16].
The demographic factors serve as independent variables by definition, as they cannot be manipulated. As such, the data analysis presents a basic analysis of averages and considers the data in a descriptive prose format. As this research did not aim to discriminate in selecting research participants, the comparison is for the purposes of discussion and to describe the Study Sample.

4.2. Analysis and Results

In order to answer RQ1 (Primary) What is the perception of high-density local characteristics by a low-density resident, and determine the perceptions held by LD residents, an understanding of the secondary research questions must be formed. This understanding will lead to the formation of the perceptions and will be expressed in prose format.
To analyse the collected data as a whole and to draw conclusions about the populous’ preferences, the analysis understands the specific preferences of each individual by placing them upon the Resident Preferences Graph. This is shown in Figure 3, in which the data of the 150 Sydney residents is presented, with darker dots indicating multiple scores. Preferences presentation is completed in accordance with scoring system specified in section. This graph is the predominant tool used for the analysis of this research’s data and answering RQ1, RQ2 and RQ4.

4.3. Secondary Research Question 2 (RQ2)

In order to assess RQ2 (Secondary) Does a person with a preference for low-density properties like high-density local characteristics, the collected data is analysed using the Pearson’s Correlation Coefficient, also known as the Bivariate Correlation. The population value is estimated by calculating a sample coefficient, which is denoted by “rho hat,” or r [16]. In this analysis, the population value was estimated to be r = −0.6246.
A positive correlation would imply because a person with a preference for low-density properties likes high-density local characteristics. An increase in X-value observes an increase in the Y-value. A shift towards HD local characteristics sees a shift towards LD property types.
A negative correlation would imply because a person with a preference for low-density property does not like high-density local characteristics. An increase in the X-value observes a decrease in the Y-value. A shift towards HD local characteristics sees a shift towards HD property types.
As such, r = −0.6246 conveys that “no, a person with a preference for low-density property does not like high-density local characteristics”. As their preference for HD local characteristics increases it is observed that their preference for HD property types also increases. The figure “0.246” conveys moderate strength of this correlation. However, the correlation and its strength does not imply causation. A shift in X does not cause a shift in Y, only that a linear relationship exists. Determining whether local characteristics are the drivers of property type preference is not the objective of this research. The objective of this research is to understand the LD residents’ preferences for both variables. As such, assessment of causal factors can be marked as an area for future research.

4.4. Secondary Research Question 3 (RQ3)

RQ3. (Secondary) If so, which characteristics do they like? Which characteristics do they not like?
The Secondary Research Question 3 aims to provide a direct presentation of the underlying perceptions held by Sydney residents for the varying degrees of density. Although the other secondary research questions and an array of literature present this data in the form of a quantitative analysis with an output in the form of an interpretable figure, the raw perceptions in the form of words are rarely presented. This secondary research question aims to provide a clear overview of the perceptions held in the minds of residents, prior to them being extrapolated and analysed. In doing so, it is desired that each person interacting with this research can not only rely on the understanding presented to them but understand the perceptions through their own interpretations as well. This is because language is a multi-faceted transfer of information and although we may rely on scoring systems and numerical analysis to provide easily discernible figures, word clouds are also needed to reflect these sentiments. Subsequently, this secondary research question has been added as a component of the Primary Research Question to allow for an open analysis of what local characteristics Sydney residents like and don’t like.
Respondent Density Perceptions
This section discusses the main themes emerging from the transcriptions of research respondents, based on the frequency of the words occurring, visualised as different clouds. Figure 4a shows the main themes used by the participants relating to low-density suburban homes. Figure 4b shows the transcriptions relating to medium-density inner-city town homes and Figure 4c shows the transcriptions relating to high-density apartment residences. The Word Clouds were derived from the prompted open-ended questions, which assessed the attitudes of the respondents.
Although, this research adopts the Word Cloud analysis as a means to convey the broader sentiments of the respondents, the following analysis aims to specify these sentiments and assess them against those suggested by literature. Table 3 identifies and ranks the top five most frequently used words by the respondents to describe each density type, as is visually evident within the Word Clouds.
Figure 5 shows the visualisation of the co-occurrence of the selected literature from the review, which is based on a systematic search using the following strings in Scopus database using the following string: (TITLE-ABS-KEY (“Urban Environment” OR Neighbourhood OR Urban OR City) AND TITLE-ABS-KEY (Density) AND TITLE-ABS-KEY (Perceived OR Perception)) AND (LIMIT-TO (DOCTYPE, “Ar”)) AND (LIMIT-TO (LANGUAGE, “English”)) AND (LIMIT-TO (SRCTYPE, “J”)) AND (LIMIT-TO (SUBJAREA, “SOCI”) OR LIMIT-TO (SUBJAREA, “ENGI”) OR LIMIT-TO (SUBJAREA, “ARTS”) OR LIMIT-TO (SUBJAREA, “MULT”)). A total of 639 document results were found and visualised in Figure 5. Figure 5 shows that the key concepts are revolving around human and gender (male/female). Figure 5 also shows emerging themes in this literature such as neighbourhood perceptions, physical activity, residence characteristics. The questionnaire is also emerged in the figure as a dominated research method. The search resulted in identifying 354 keywords out of 4646 keywords with minimum number of five occurrences.
Table 4 presents the sentiments above alongside those determined in the literature review. As such, an understanding of the research participants perceptions for each density can be formed and a comparison can be facilitated to show how these perceptions deviate from those posed by the literature review.

4.5. Interpretation of the Analysis

To answer RQ3, the data is analysed and presented using a Word Cloud. This method was selected as the understanding sought is not for a definitive answer but rather an understanding of the main likes and dislikes amongst the range of responses collected through the open-ended questions. Therefore, the analysis seeks to gauge the sentiments of the research participants and this interpretation seeks to draw meaning from said analysis.
An assessment of the sentiments reveals that as density increases, greater negative connotations can be perceived. Respondents describe the LD prompts as spacious and nature orientated, medium density prompts as modern and uniform, and HD prompts as congested and urban. These are not the sentiments presented by the identified literature, in which the sentiment improves as density increases. In literature, those with a LD preference are in certain cases labelled as NIMBY’s (not in my backyard) [23], yet a title with similar negative connotations for those with a HD preference is not used.
While research participants believe HD to be concrete and LD to be natural, literature disagrees and believes HD to be sustainability focused. This may be due to the technical understanding of environmental impact possessed by literature, which the layperson would not have. Yet, the layperson is likely to view their environmental impact not by their carbon footprint but rather by their interaction with nature. Low-density neighbourhoods allow for greater space for natural elements within the locale, therefore the daily interactions with these elements rises. A layperson’s perceptions are dependent on their human experience, which in turn is dependent on their behaviours. As such, while this research aims to understand the behaviours of respondents, it also seeks to assess their attitudes to extrapolate their true underlying perceptions. These are determined within RQ4.

4.6. Secondary Research Question 4

RQ4. (Secondary) If these high-density local characteristics were provided in a low-density context (i.e., removing the property density negative externalities), would those with a low-density preference find this attractive? If so, to what extent?
Analysis—Scatter Plot Assessment and Shared Variance
In answering RQ4, the question is considered in two parts.

4.6.1. RQ4 Analysis—Part 1

The first part of the research question seeks a Yes or No answer. In order to determine the answer a simple assessment of the respondent’s placement upon the Resident Preferences Graph can be conducted (Figure 3). The graph conveys the score of each respondent, and the score conveys the exact degree of preference each respondent has for densities associated with local characteristics and property types. In doing so, the graph categorises the respondents into four categories. The assessment conducted in accordance with the process specified and seeks to determine if more respondents are in the top right quadrant or the top left. This is due to the fact that only the LD property context is being considered. The assessment shows that: more respondents are in the top right quadrant than the top left.

4.6.2. RQ4 Analysis—Part 2

The second part of the research question aims to determine the extent to which these HD characteristics are found attractive in a LD property type. In order to assess the extent, an analysis of shared variance is conducted, using the data assessment tool SPSS.
The regression line is computed into the Sydney Residents Preferences Graph, as shown in Figure 6.

4.7. Interpretation of Analysis

4.7.1. RQ4 Interpretation—Part 1

In interpreting the analysis for the first part of this question, the following logic can be followed. If more respondents are in the top left quadrant of the Preferences Graph, than the top right quadrant, then the answer to the research question will be “no, the majority of respondents with a LD property preference find LD characteristics attractive”. However, if more respondents are in the top right quadrant, then the answer will be “yes, the majority of respondents with a LD property preference find HD characteristics more attractive” and so subsequently if these HD characteristics were provided in a LD context, this proposition would be attractive to most respondents.
MORE respondents are in the TOP RIGHT quadrant THAN the TOP LEFT
The Respondent Graph Placement table (Table 5) conveys the breakdown of the 4 quadrants, revealing that 22% of respondents prefer to live in a LD property with LD characteristics, but a significantly larger proportion of respondents, 59%, prefer to live in a LD property with access to HD local characteristics. As such, part one of RQ4 can be answered as “yes, the majority of respondents with a LD property preference find HD characteristics more attractive” and so, subsequently, if these HD characteristics were provided in a LD context, this proposition would be attractive to most respondents.

4.7.2. RQ4 Interpretation—Part 2

While the figure r conveys the strength of correlation between the two variables, r2 conveys the degree of variance. This is the variance accounted for in one variable by another. An r2 of 0.3902 suggests that X accounts for 39% of the variance in Y. A change in the local characteristic preference accounts for a 39% change in the property density preference.
As such, it is determined that a 100% shift towards HD local characteristics will only see a 39% shift towards HD property types. As there is not a perfect correlation, a 61% discrepancy can be observed. This discrepancy conveys that 39% of LD property preference occurs irrespective of local characteristics, as local characteristics only account for 61% variance in property density. Therefore, if HD local characteristics were provided in a LD property type, those with a LD property preference would find these HD characteristics less attractive in their LD property to the extent of 39%. Note: This does not convey causation.

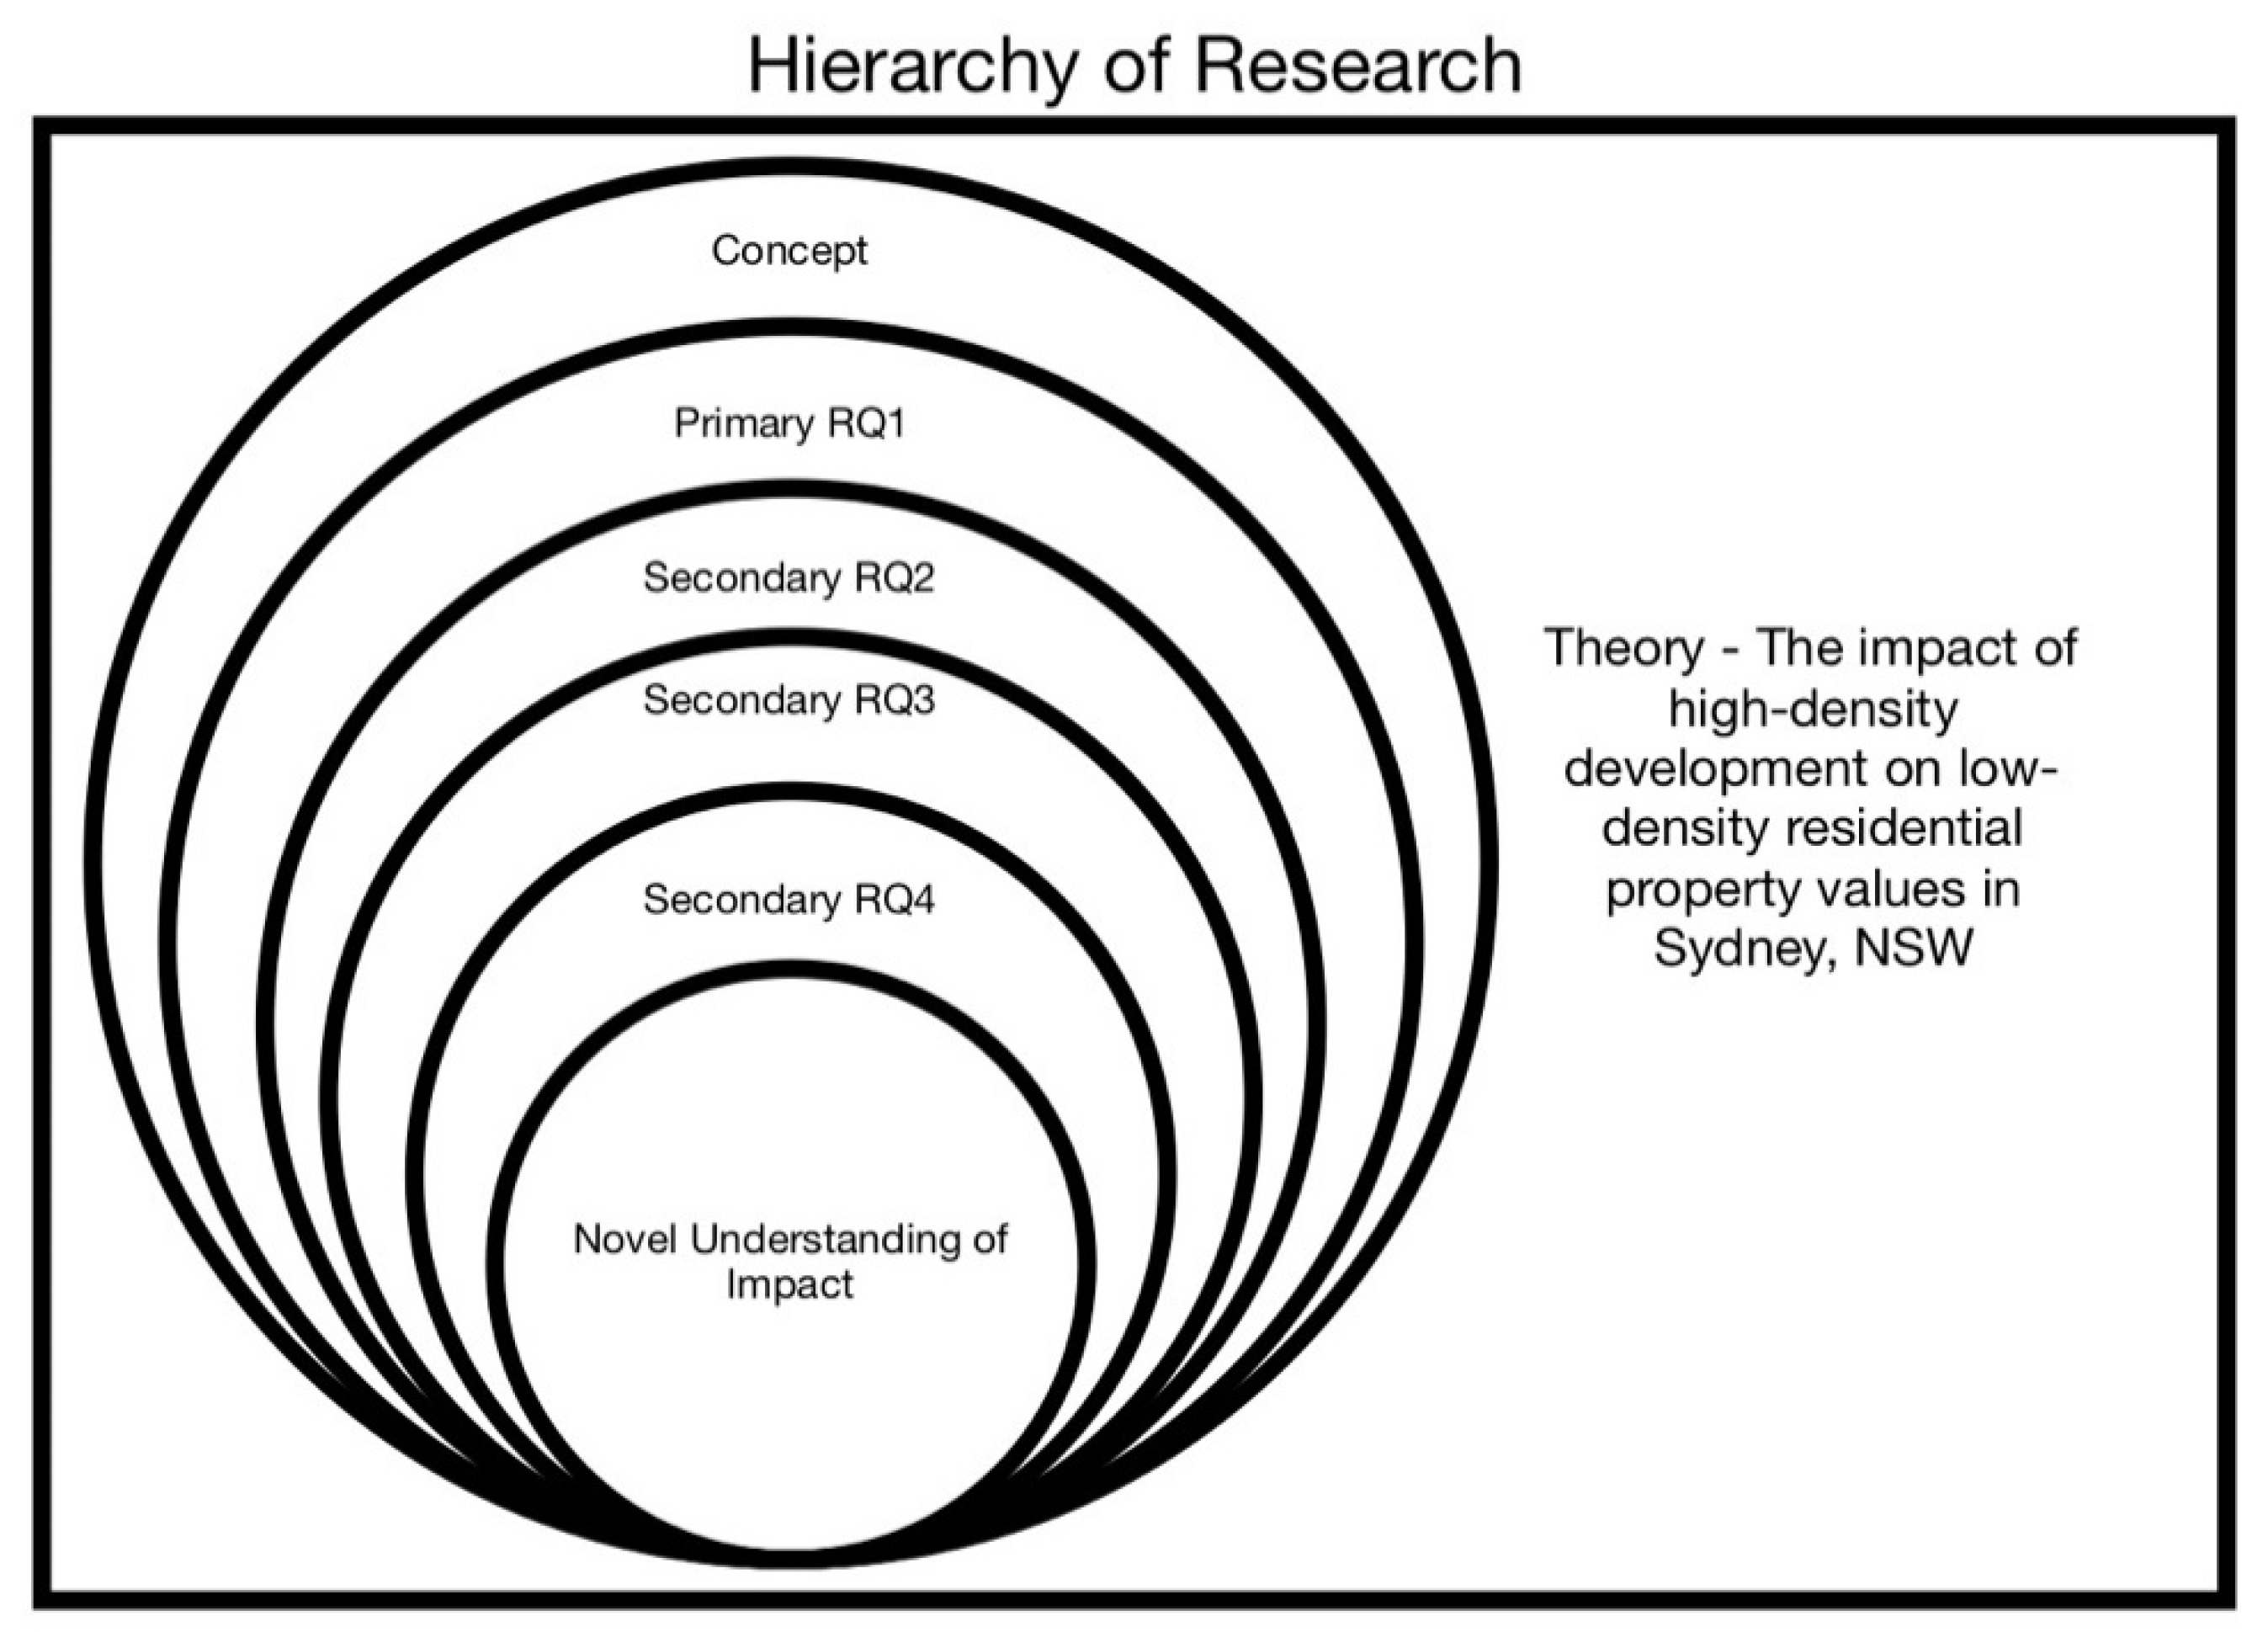
4.8. Funnelling into Research Question 1

RQ1. (Primary) What is the perception of high-density local characteristics by a low-density resident?
Through gaining an understanding of the Secondary Research Questions, the Primary Research Question is answered.
People with a preference for low property densities prefer both LD and HD local characteristics, this is conveyed through the spread of respondents across the top two quadrants of the Preferences Graph. However, as residents’ preference for HD local characteristics increases, so does their preference for HD property types. This is an expected logical outcome, reiterated by the data interpretation in RQ2. Residents perceive LD topography as being spacious, family orientated and ecologically focused. They perceive medium density residences, such as townhouses, to be modern, private and uniform. HD topography is perceived as being urban, concrete and congested. A general sentiment can be observed in which greater negative connotations are visible as residential density increases.
Through this understanding the sentiment becomes increasingly prevalent that LD residents do not perceive HD local characteristics as being attractive. As their desire for HD local characteristics increases, they gradually reduce their preference of being a LD resident and shift towards becoming a HD resident in line with the local characteristics. However, RQ4 makes evident that whilst this may be the case, the majority of residents prefer HD local characteristics in a LD property type. This shows that although a shift in preference of one variable also sees a shift in the other, these variables are not the predominant motivators of one another. Other factors are exerting influence, and in order to develop a holistic understanding of what shapes these perceptions, causation must be assessed by future research. However, for the purposes of this research, an understanding of what these perceptions are has been formed.
Table 6 shows most of individuals interested in characteristics 1, 8, 10, 9, 2 and 5. The difference between female and male or individuals who are interested in meeting friends in public spots or home are also examined. Where the difference was significant, it is discussed in the following sections.
Table 7 shows that there is a significant relationship between the two variables (Q5a-Var4). Participants who are meeting a friend in their homes more likely than others would like individual facilities such as backyards, personal pools, home gym to be included in their local areas, X2 (1, N = 126) = 4.149, p = 0.04.
The analysis result shows that there is a significant relationship between the two variables (Q5a-Var1). Participants who are meeting a friend in public spots more likely than others would like easy access to local shops, cafés, restaurants, entertainment, office spaces to be included in their local areas, X2 (1, N = 126) = 4.698, p = 0.03.
As Table 8 shows, there is a significant relationship between the two variables (Q1-Var8). Male participants more likely than female individuals would like communal facilities such as parks, walkways, sport centres, large public gyms to be included in their local areas, X2 (1, N = 126) = 8.774, p = 0.003.
Table 8 also shows that there is a significant relationship between the two variables (Q1-Var6). Male participants more likely than female individuals would like all buildings to be near each other in their local areas, X2 (1, N = 126) = 5.298, p = 0.021.
Analysis results in Table A2 of Appendix C indicate that there is a significant relationship between the two variables (Q7a-Var3). Interestingly, participants who chose apartment as their ideal property type more likely than other individuals would like also an environment consisting of mostly apartments in their local areas, X2 (1, N = 126) = 58.288, p = 0.000 (see Appendix C).
As seen in Table A2 of Appendix C There is a significant relationship between the two variables (Q7a-Var12). Interestingly, participants who chose large house as their ideal property type more likely than other individuals would like also an environment consisting of mostly large family homes in their local areas, X2 (1, N = 126) = 30.341, p = 0.000 (see Appendix C).
The Chi Square test shows that both genders are independent from the home type and there is a significant relationship between the gender and home type, X2 (1, N = 126) = 4.993, p = 0.288 (see Appendix C).

4.9. Discussions

The following section discusses the data interpretations that answer the primary and secondary research questions. In doing so, it determines whether the Hypothesis can be accepted or not, thereby determining if the concept can also be accepted or not.
Hypothesis Assessment
The primary research question determines the perceptions of HD local characteristics held by LD residents. It finds that HD local characteristics are increasingly attractive as property density increases, additionally, the majority of LD residents prefer HD local characteristic in their property type as well. Through an understanding of these perceptions an argument is made to accept the hypothesis.
Hypothesis—Low-density residents perceive high-density local characteristics to be attractive.
Therefore, it can be understood that low-density residents perceive high-density local characteristics to be attractive, however, as the attractiveness for HD characteristics increases so does the attractiveness for HD property types. This twofold comprehension allows for a conceptual understanding to be formed. As the hypothesis is accepted, it allows for the concept to be accepted and evolves the conceptual theory in this direction.

Concept Assessment

Concept—If high-density local characteristics are able to be utilised by low-density properties, low-density residents will consider these properties to be more valuable.
The following discussion assesses this acceptance. As the primary research question accepts the hypothesis, it is evident that LD residents find HD local characteristics to be attractive. However, in answering the secondary research questions it is also evident that if these LD residents were to shift towards HD characteristics a shift towards HD property types should also be observed. Showing that in their exact property context, residents would find these HD characteristics to be less desirable, noting that the associated local characteristics account for 39% of the property types of desirability. If the concept were to be considered through this understanding, it would not be accepted. However, HD characteristics are found to be more attractive, the correlation between the two variables is negative. As such, for a resident to achieve their preference for increased HD local characteristics, they would need to reduce their preference for LD property types. This interaction between the variables would have a negative impact on the attractiveness and subsequently value of the LD property.
However, the acceptance of the concept is not dependent upon the shifting of residents’ preferences along an existing and logically expected correlation line. The research’s purpose is to address the concept through the lens of the Primary Research Question and the Hypothesis. Formative within this lens, Research Question 4 posed the question of a hypothetical scenario and found that most residents prefer LD property types and most of these residents prefer HD rather than LD local characteristics. Further discussion should note that: when considering the preference of a resident, their placement upon the Preferences Graph must be considered; and when considering a change in residents’ preferences, movement as per the existing correlation should be considered. The concept, however, seeks to determine the preferences for a hypothetical scenario. One which is dependent upon the attractiveness of a concept, an idea in which the interaction of the two variables is not considered along the logical correlation affirmed in residents’ minds, but rather along a route which decouples the two variables and assesses the scope of each individually. It is known that LD properties come with LD characteristics and HD properties come with HD characteristics. However, if this mould were to be broken and a new concept in which high-density local characteristics are able to be utilised by low-density properties were to be formed, would this be more attractive to the residents in the top half of the Preferences Graph. This research’s answer is yes.
As established in the literature review, it is known that the value of a residential property is based on the extent of its attractiveness to residents within its market. Through this, the link between the hypothesis and the concept is made evident as one aims to establish whether a residential proposition is attractive and the other seeks to establish if this proposition is more valuable than the norm. Therefore, with the determination of this understanding, it is found that the concept can be accepted, if high-density local characteristics are able to be utilised by low-density properties, low-density residents will consider these properties to be more valuable. As such, the conceptual understanding has evolved and to derive this unrealised value, further study and innovation will be needed from industry to decouple the variables, achieve this dichotomist outcome and deliver a truly attractive residence.

5. Findings and Limitations

The findings consider the interpretations and implications of the data analysis in Section 4, to draw conclusions from the research. It considers the findings of the literature review and its limitations, to determine how the review shaped the objectives of this research and how the objectives were reflected by the Research Questions. In doing so, the findings section aligns the Chapters of this research, to allow for conclusions to be drawn in the subsequent section.

5.1. Alignment of the Research Findings and Its Objectives

This research aims to study, the impact of high-density development on low-density residential property values in Sydney, NSW. In understanding the impact of high-density development, it is first determined what the predominant drivers of property values are. These drivers are accessibility, amenity levels and topography, defined in this research as local characteristics [1]. In order to understand the impact of HD development upon these factors, various models of HD development are considered. Literature presents the concept of TOD (transit-oriented development) as being the predominant thought process adopted by urban planners for achieving uplifts in urban growth, quality of life and subsequently, property value. The literature review makes evident how TOD can lead to positive impacts in HD property values. However, in order to understand its impact upon LD property values, TODs perceptions and attractiveness for LD residents, are considered.
While the literature review conveys an understanding of valuing housing and the interactions of housing and density, it does not provide a conclusive answer to the research. The review’s findings suggest that LD housing prices fall with proximity to HD properties, but not necessarily with HD local characteristics. These suggestions are extrapolated during the review. However, the review identifies several limitations in the literature’s ability to provide the understanding sought, and identifies assumptions made which require further investigation. As such, the objectives of this research are formed and follow the direction stated by Higgins and Kanaroglou [8], that future research should seek to analyse the relationship between the heterogeneous individual and household preferences, their spatial, TOD and household type sorting decisions [8].
The data collected from 150 research participants through the self-administered online questionnaire aims to address this objective. The Methodology Chapter outlines four research questions which needed to be answered in order for the objective to be achieved. An analysis of the data through quantitative and qualitative methods, allowed for the three Secondary Research Questions to be assessed and subsequently, the Primary Research Question to be answered.
These sought the following understandings and provided the following findings:

5.1.1. Secondary Research Question 2—Understanding Shifts in Preferences

Findings: The correlation between the two variables, finds that a shift in preference towards HD local characteristics also sees a shift towards HD property types.

5.1.2. Secondary Research Question 3—Understanding the General Sentiment

Findings: Residents perceive LD topography as being spacious, family orientated and ecologically focused. They perceive medium density residences, such as townhouses, to be modern, private and uniform. HD topography is perceived as being urban, concrete and congested.

5.1.3. Secondary Research Question 4—Understanding What the Market Wants

Findings: The majority of respondents with a LD property preference find HD characteristics to be more attractive and if these HD characteristics were provided in a LD context, this proposition would be attractive to most respondents.
Which lead to the understanding of:

5.1.4. Primary Research Question 1—Understanding Residents Perceptions

Findings: Low-density residents perceive high-density local characteristics to be attractive.
Through these findings, the analysis recommended by Higgins and Kanaroglou [8] is addressed, and therefore conclusions about this research can be formed.
Prior to proceeding with the conclusion, it is important to note the following. The process of devising this research began in February 2020. Over the next few months as the research became more defined, Australia and the world went into lockdown to address the impact of COVID-19. This research aimed to study residential preferences and their interaction with various local characteristics, such as, housing density, use of communal facilities, societal factors and the use of public transport. In studying these interactions, it would be negligent to ignore the impact of the global pandemic, which forced Sydney and global residents to reconsider how they interact with their community, their transport and their work. Subsequently, understanding residential preferences and their impact on land value in a period where people are constantly being signalled to re-evaluate their preferences, is an imperfect study. It is, therefore, a recommendation for future research, that this conceptual understanding be further developed in a time period where the new global interactions of work, leisure and rest are redefined and once again matured. However, despite said factors, this research provides an insight into the Sydney resident’s personal preferences during this time of adaptation and transformation.
This comparative analysis conveys that while the Sample is not a perfect representation of the Sydney populous, it is also not an inaccurate representation either, and can be used in this research to draw conclusions about Sydney residents. This Study Sample was not intentionally constructed, therefore, to mitigate any inaccuracies in population representation a large sample size of 150 respondents was selected. Future research may increase the sample size or develop a strict participant selection criterion to ensure greater accuracy in representation.

6. Conclusions

The primary research question accepts the hypothesis and determines that low-density residents perceive high-density local characteristics to be attractive. Through this determination and the discussion shown, the concept is accepted, and it is understood that if high-density local characteristics are able to be utilised by low-density properties, low-density residents will consider these properties to be more valuable. The consideration and acceptance of this conceptual understanding provides novel insight into the objectives of this research. The individual’s preference for property types and local characteristics should be decoupled. Through decoupling these two elements of housing, an understanding is gained, while LD residents like LD local characteristics, the majority prefer HD local characteristics. As such, the impact of HD development upon the topography, communal facilities, accessibility and social and societal factors, is found to be a desirable outcome for the majority of LD residents. The review of academic literature conveys an existing understanding of the impact of HD development upon each of these individual factors, which has been largely considered through hedonic methods assessing market factors. However, in considering the perceptions, preferences and psychology behind the impact, a broad conceptual understanding of the impact as a whole can be made by this research. As the acceptance of the concept implies, if HD development were to occur in LD areas, LD properties which can access these HD developed amenities will be more valuable, thereby allowing for a conclusion to be formed of the impact of high-density development on low-density residential property values. This research concludes that despite the negative externalities of high-density development, it will have a positive impact upon low-density residential property values.
Through an assessment of the relationship between the individual and their housing preferences, an understanding is gained of the impact that certain development models have upon residential property values. This understanding progresses the thought of Higgins and Kanaroglou [8] and their study of land value in Toronto, as well as building upon and progressing the thought of academic texts considered in the literature review. Conclusions formed, can assist governing bodies, financial interests and societal participants of the property industry to better understand the concept of impact. In doing so, this research believes that industry stakeholders can make better informed decisions when anticipating the impact of increased HD characteristics upon LD residences. Subsequently, when new HD development is proposed, stakeholders can approach the changing local character with greater insight, in respect to the desirability and value of the impacted LD real estate assets.
The findings of this research provide insight that can assist governing bodies, financial interests and societal participants, in achieving the most desirable outcomes for each involved. By understanding the psychology surrounding the preferences and perceptions held by LD residents, the aforementioned interests can make better informed decisions relating to the impact of (1) HD development, (2) changes in permissive planning/zoning, (3) urban growth, (4) population growth, (5) local amenities, and (6) the development of public infrastructure. The impact of these factors considered in the context of property value, conveys the economic impact changes in the Sydney housing market may have and subsequently, its associated social impact can also be considered. While this research provides novel insight into a specified aspect of property value, suggestions for future research can assist in further studying property valuations and assisting industry participants in forming more accurate predictions regarding the impact of their actions.

Limitations and Suggestions for Future Research

The undertaking of this research project identified several limitations within itself and directions for future research to develop upon.
As this research was conducted, some concessions were made in the methodology of this research based on state-mandated lockdown measures. Requiring, the questionnaire to be self-administered despite providing an in-person invitation to participate. Additionally, the research could not be conducted over the intended period and reliability check measures of test-retest were not able to be conducted over the intended time gap to remove temporal influencers. As such, the research validity test was conducted, while the reliability check method could not be conducted in this iteration of the data collection process. Although the test-retest could not be conducted, it does not negate the fact that it is the optimal identified method for conducting the reliability check for this research. Although the data collected from 150 respondents could have been segmented into two iterations, each consisting of 75 respondents and having a test-retest spacing period of two weeks, it would compromise the capacity of the check to not have the pre-determined minimum two-month gap period. However, as this is a coursework submission and with consideration of the global human condition, the retest has been marked for future research.
Future research can develop upon the methodology of this research through two underdeveloped avenues, the development of which was considered non-essential for this research. (1) Future research can further develop the Sampling Frame by isolating the sampling frame suburbs in a more justified and systematic manner to determine the differences in preferences/findings, between the suburbs or through the selection of different suburbs. (2) This research did not aim to discriminate in selecting research participants, therefore an extensive/strict Participant Selection Criteria was not needed. As such, the risk of forming a study sample from the sampling frame, which does not accurately represent Sydney as a whole, presents itself and acts as one of the limitations of this study. Although this risk was mitigated through a large data sample size, future research in this area can explore the moderating effects of these factors on the dependent variables.
The analysis conducted in this research presents directions for future research to develop upon the understanding derived. (1) This research understands what the impact of HD development is. However, future research may observe these findings and build upon this analysis to develop a more structured approach in measuring the extent of change in value with each change in local characteristics. (2) Additionally, while this research determines the preferences and perceptions of residents, it does not aim to determine the causal factors for these preferences or perceptions. It is recommended that future research aim to determine these causal factors, and in doing so, provide a more holistic understanding of the motivators of resident psychology and their impact upon residential property values.

Author Contributions

Conceptualization, N.S.; methodology, N.S., S.S. (Samad Sepasgozar), S.S. (Sara Shirowzhan); software, N.S. and S.S. (Sara Shirowzhan); validation, S.S. (Samad Sepasgozar), S.S. (Sara Shi-rowzhan) and N.S.; formal analysis, S.S. (Sara Shirowzhan) and N.S.; investigation, N.S.; re-sources, N.S.; data curation, S.S. (Sara Shirowzhan) and N.S.; writing—original draft prepara-tion, N.S.; writing—review and editing, S.S. (Sara Shirowzhan) and N.S., S.S. (Samad Sepasgozar); visuali-zation, S.S. (Sara Shirowzhan) and N.S.; supervision, S.S.( Samad Sepasgozar); project admin-istration, N.S.; funding acquisition, N/A. All authors have read and agreed to the published version of the manuscript.

Funding

This research received no external funding.

Institutional Review Board Statement

The study was conducted according to the guidelines of the Declaration of Helsinki, and approved by the University of New South Wales Institutional Review Board (or Research Ethics Compliance Support (RECS) Committee). The processes used by this HREC review multi-centre research proposals have been certified by the National Health and Medical Research Council (protocol code HC200659 and date of approval 25 August 2021).

Informed Consent Statement

Informed consent was obtained from all subjects involved in the study.

Conflicts of Interest

The authors declare no conflict of interest.

Appendix A. Sampling Frame Data

Chatswood [21]
Figure A1. Chatswood Height of Building LEP.
Buildings 11 00650 g0a1
Figure A2. Chatswood Land Zoning Map LEP.
Buildings 11 00650 g0a2
Chippendale [24]
Figure A3. Chippendale Height of Building LEP.
Buildings 11 00650 g0a3
Figure A4. Chippendale Land Zoning Map LEP.
Buildings 11 00650 g0a4
Macquarie Park [25]
Figure A5. Macquarie Park Height of Building LEP.
Buildings 11 00650 g0a5
Figure A6. Macquarie Park Land Zoning Map LEP.
Buildings 11 00650 g0a6
Parramatta [26]
Figure A7. Parramatta Height of Building LEP.
Buildings 11 00650 g0a7
Figure A8. Parramatta Land Zoning Map LEP.
Buildings 11 00650 g0a8
Rhodes [27]
Figure A9. Rhodes Height of Building LEP.
Buildings 11 00650 g0a9
Figure A10. Rhodes Land Zoning Map LEP.
Buildings 11 00650 g0a10

Appendix B. The Administered Questionnaire

Table A1. The Administered Questionnaire (Pertaining to Section 3.6).
QuestionnaireAssessment Method/Analysis MethodDesired Determination (Property or Local
Characteristic)
Recruitment/Exclusion Questions
Q1. Do you consent to participating in this questionnaire?
Q2. Are you 21 years old or older?
Q3. Can you read and understand English?
Q4. Do you have access to the Internet?
Q5. Would you ever consider living in a house?
Screening Questions
Q1. Are you Male or Female? Analysed in averages. Compared with Australian Bureau of Statistics CensusSelect: Male/Female.Demographic background.
Determinations made in Section 4.
Q2. What is your age?ScaleDemographic background, see Section 4.
Q3. Relationship Status?Select: Married/ In a relationship/ Single Demographic background, see Section 4.
Q4. How many family members are in your household?ScaleDemographic background, see Section 4.
Q5. What type of property do you live in?Select: House/Town house/Apartment Demographic background, see Section 4.
Q6. What is your highest level of education? High School Certificate/ Diploma/ Advanced Diploma/ Graduate Certificate/ Bachelors/ Masters/ PhD.Select Demographic background, see Section 4.
Q7. What is your yearly income bracket? Income Brackets $0–350k+ (25k intervals)Select Demographic background, see Section 4.
Main Questionnaire Body
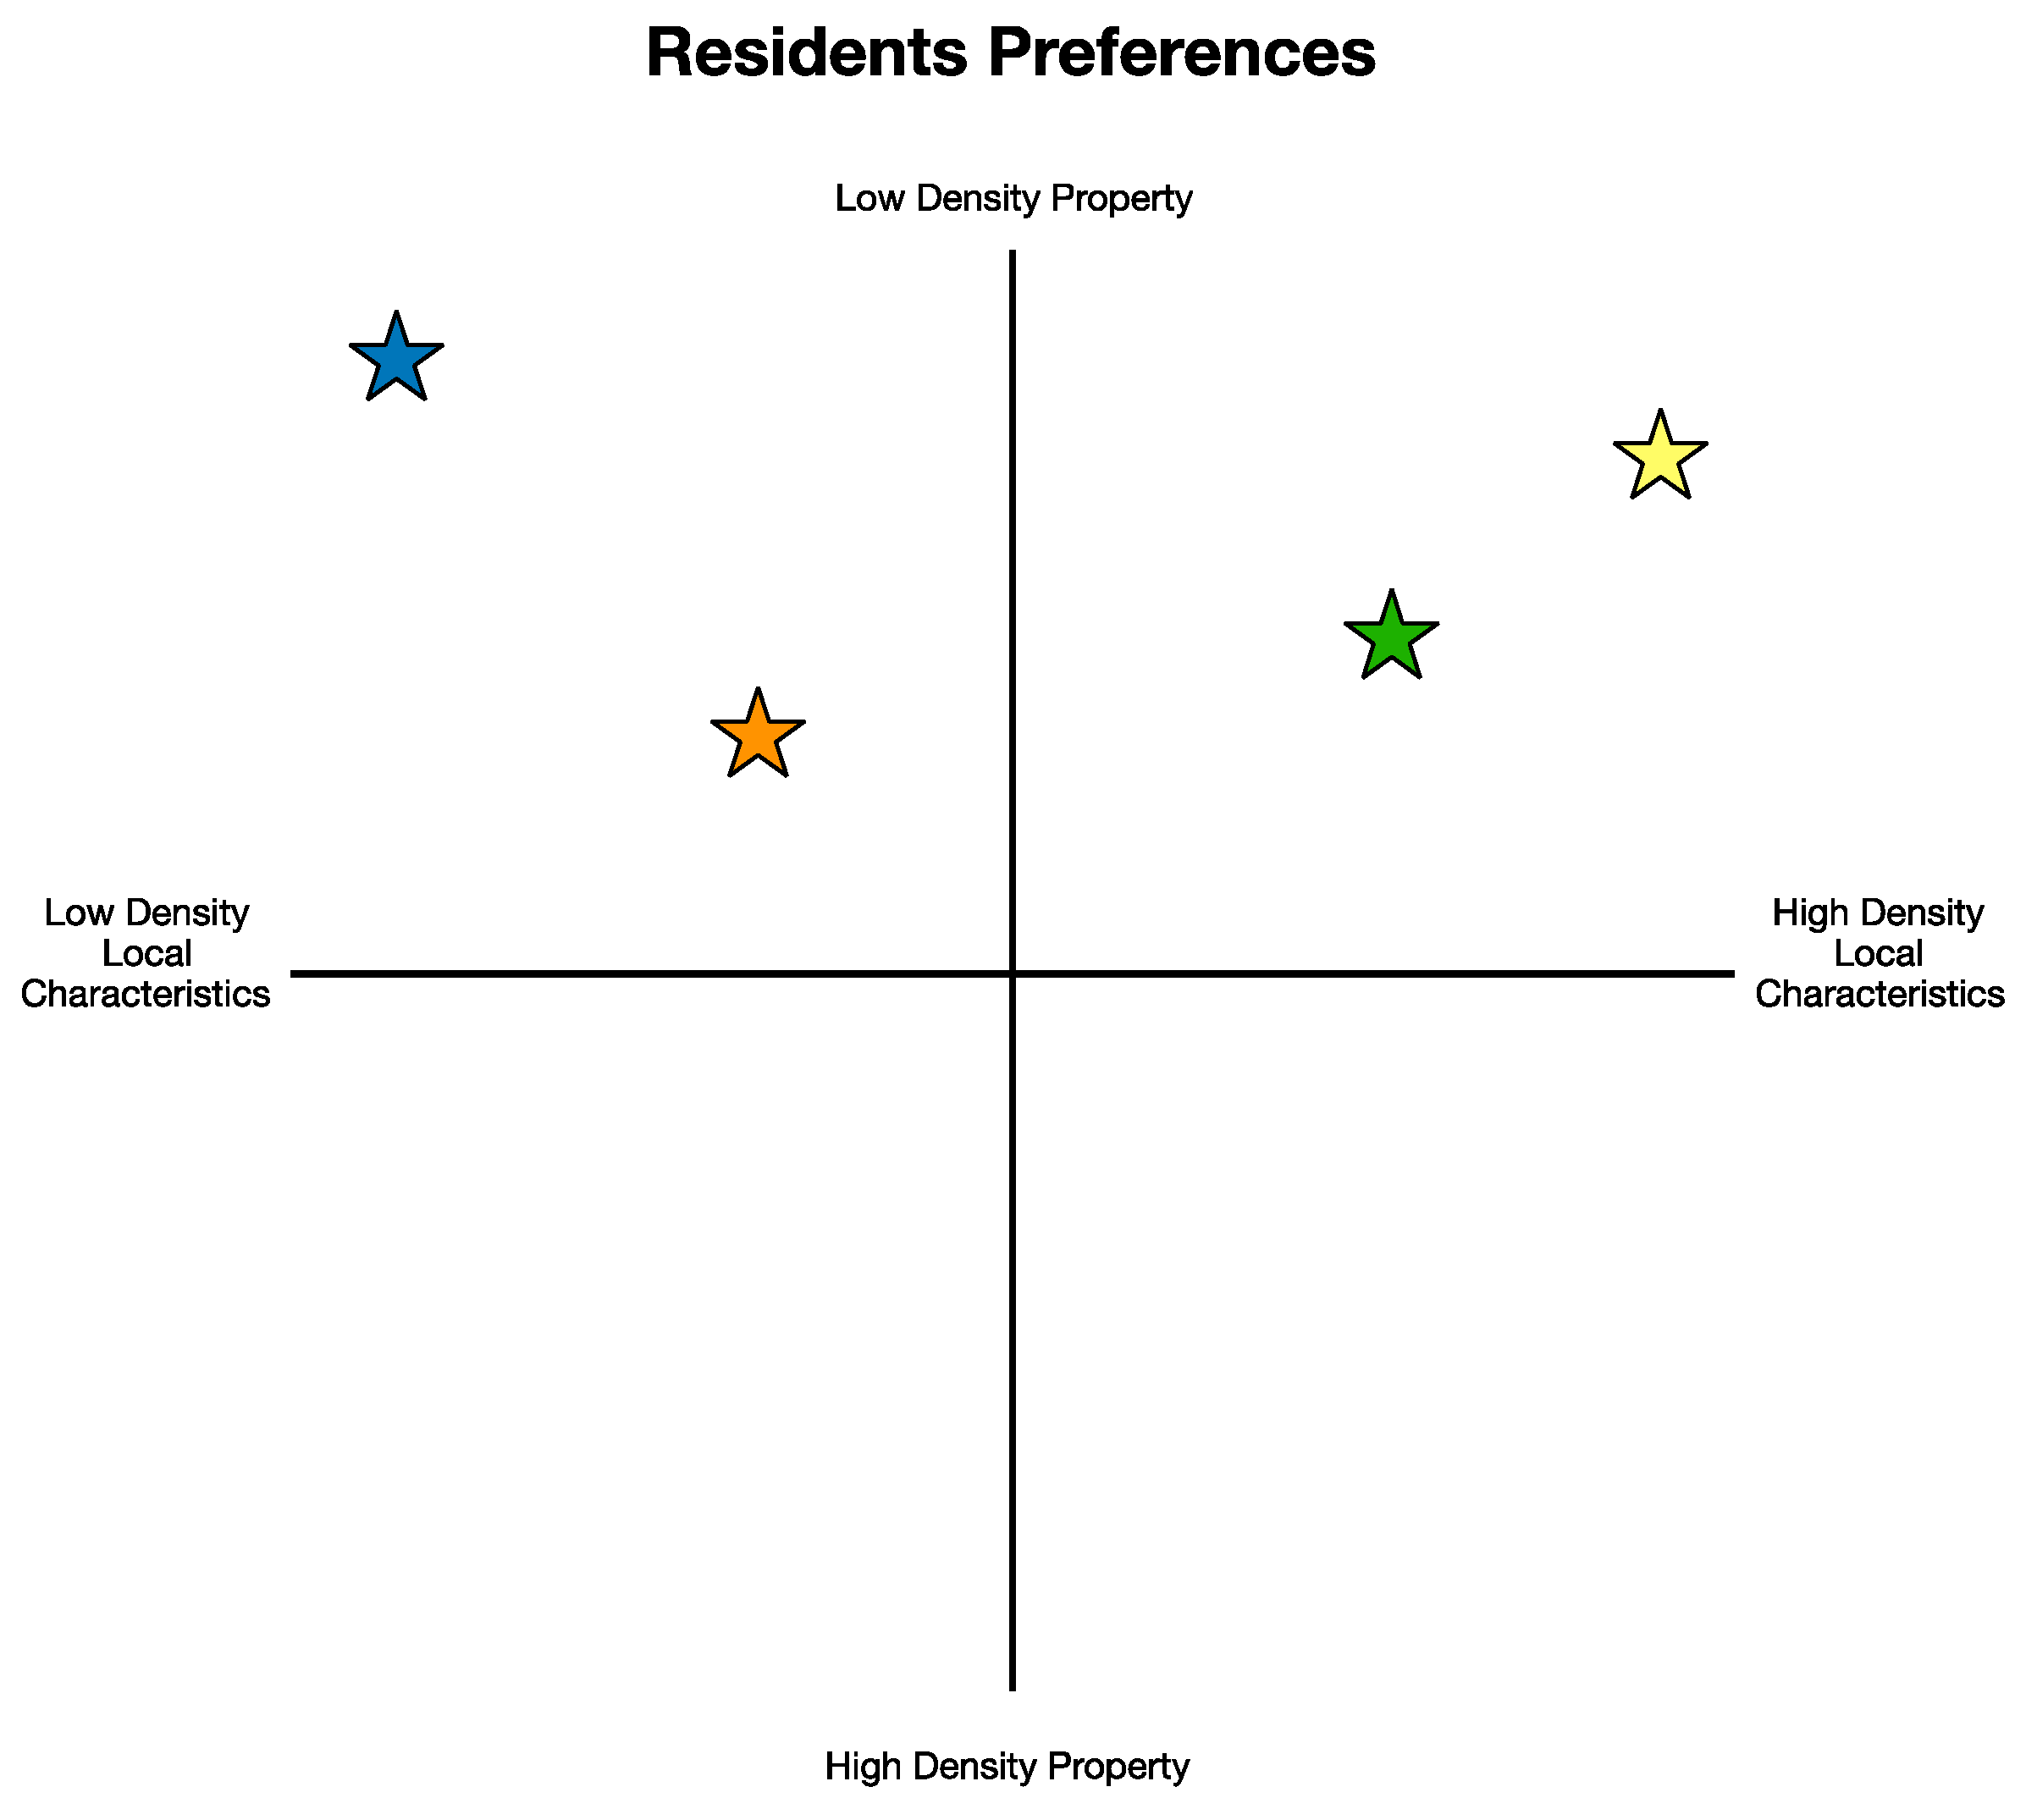
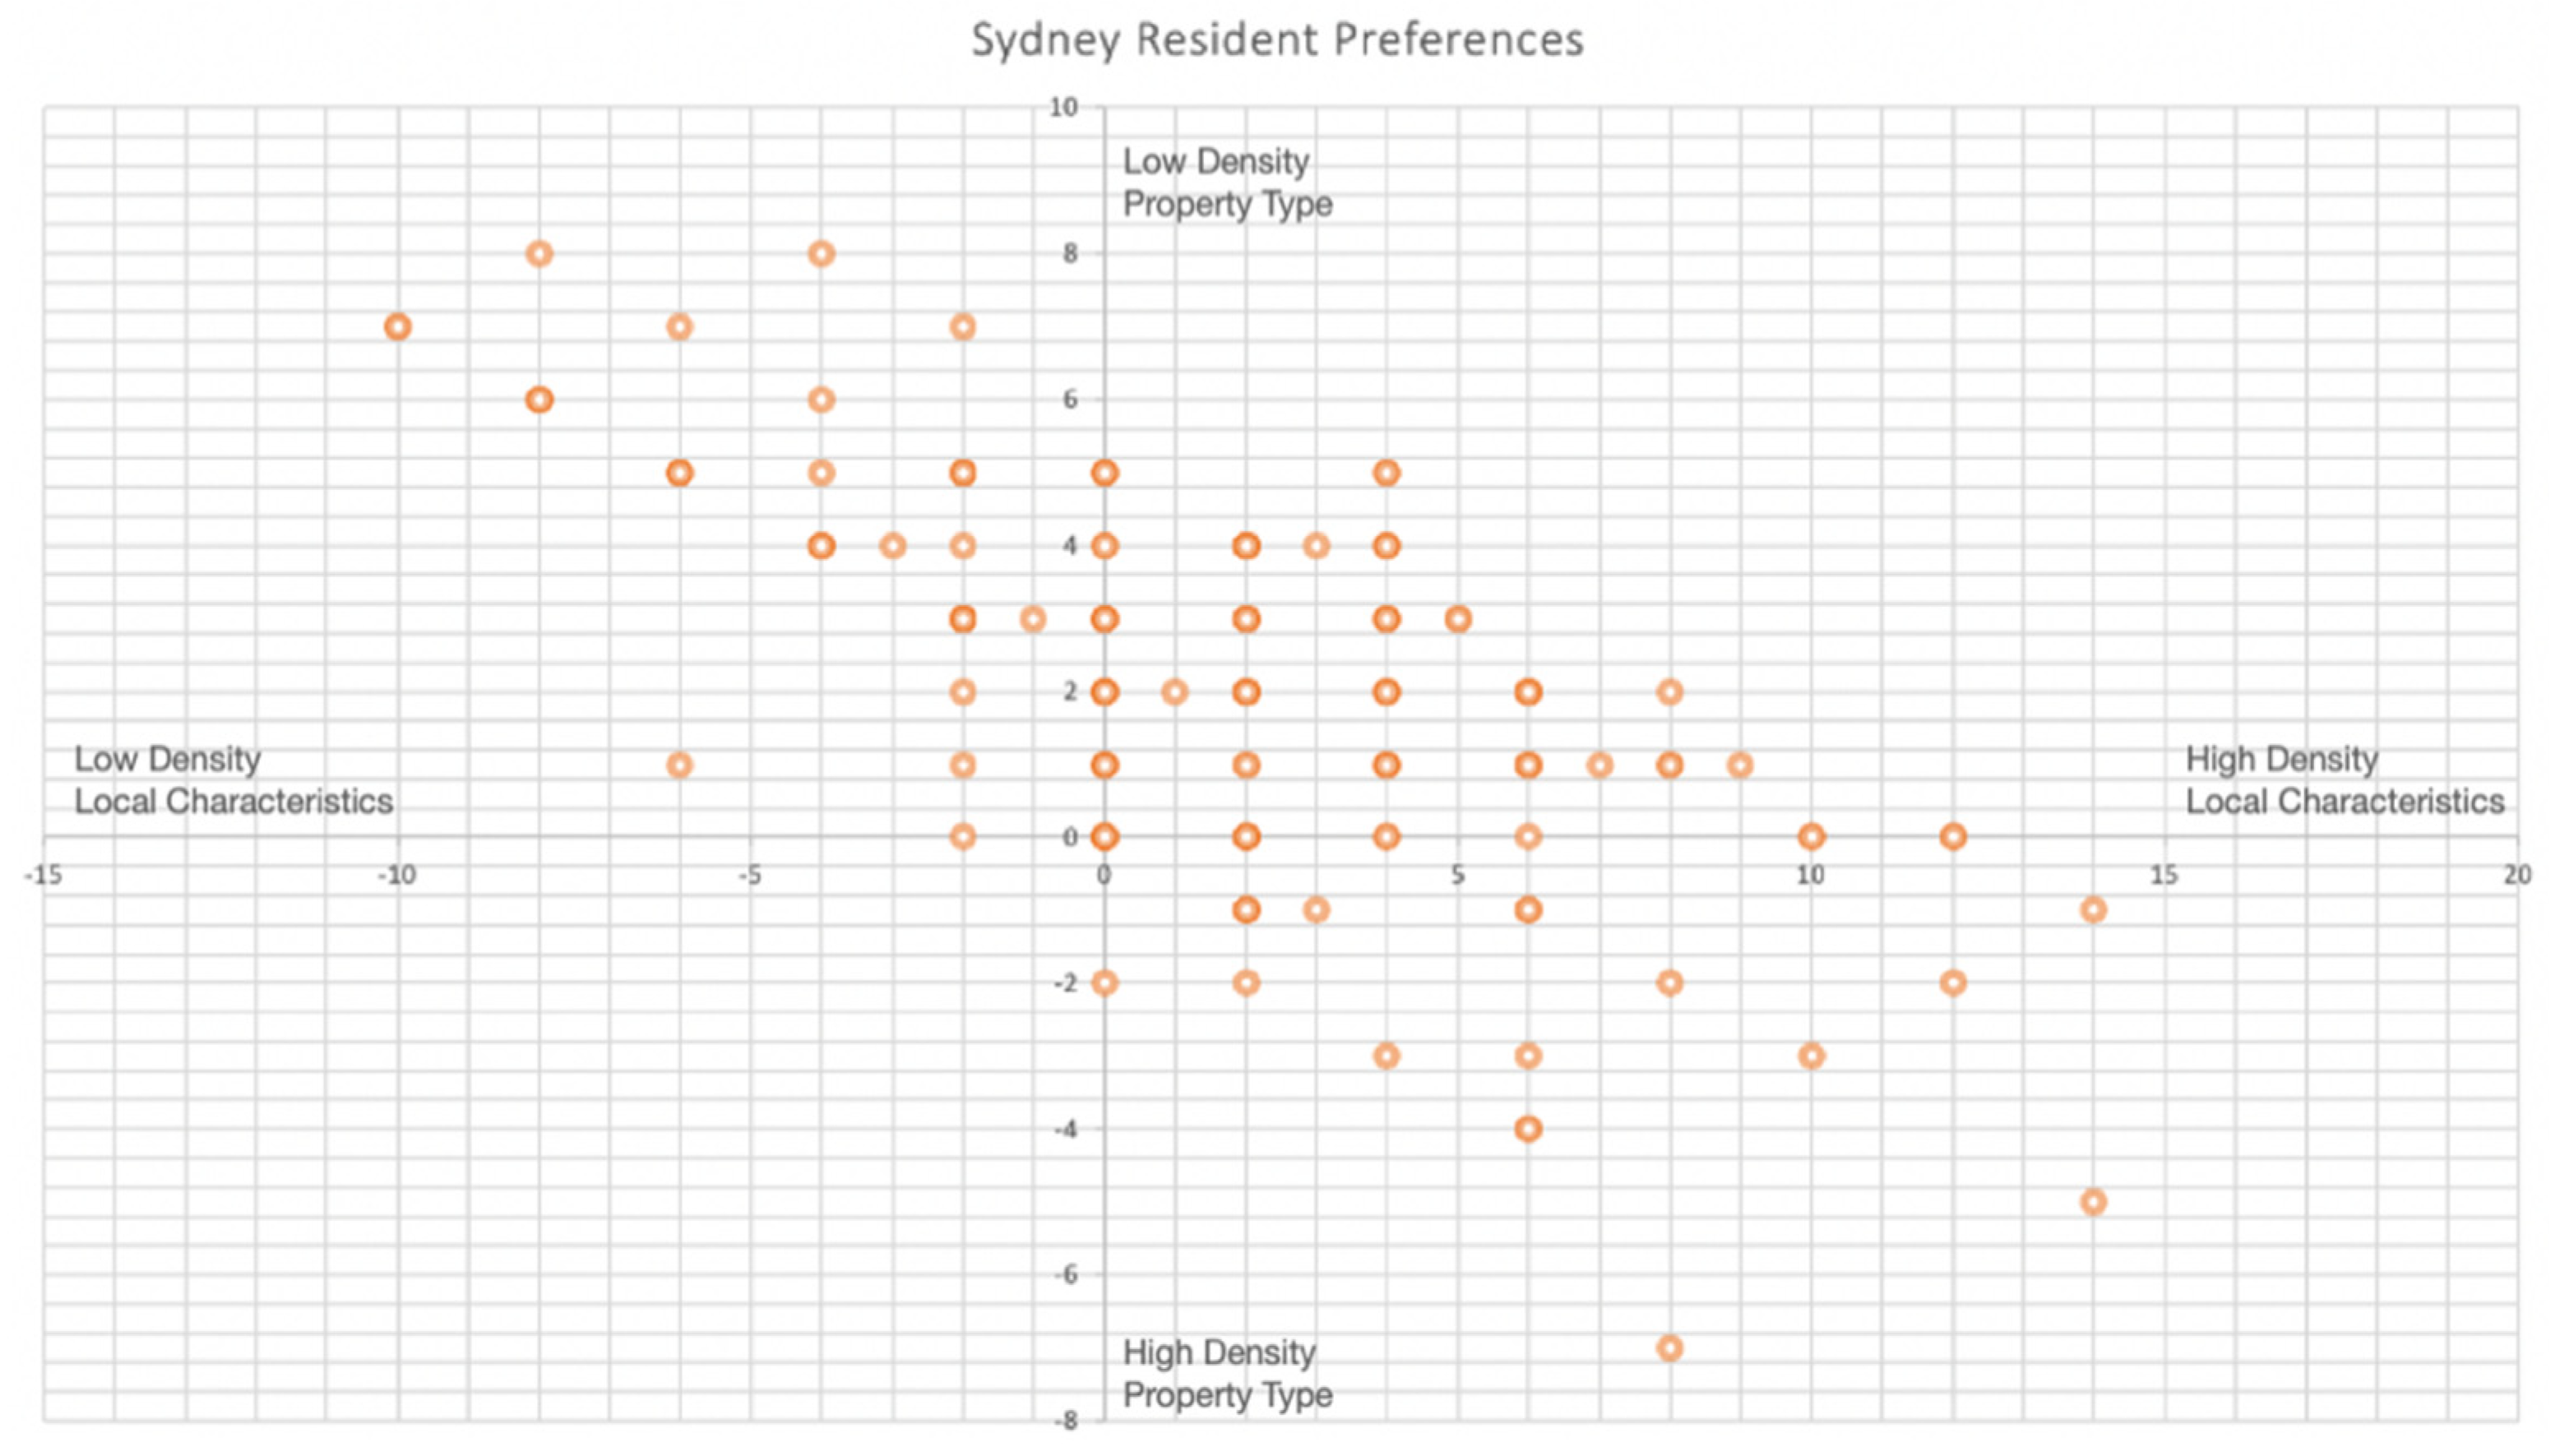
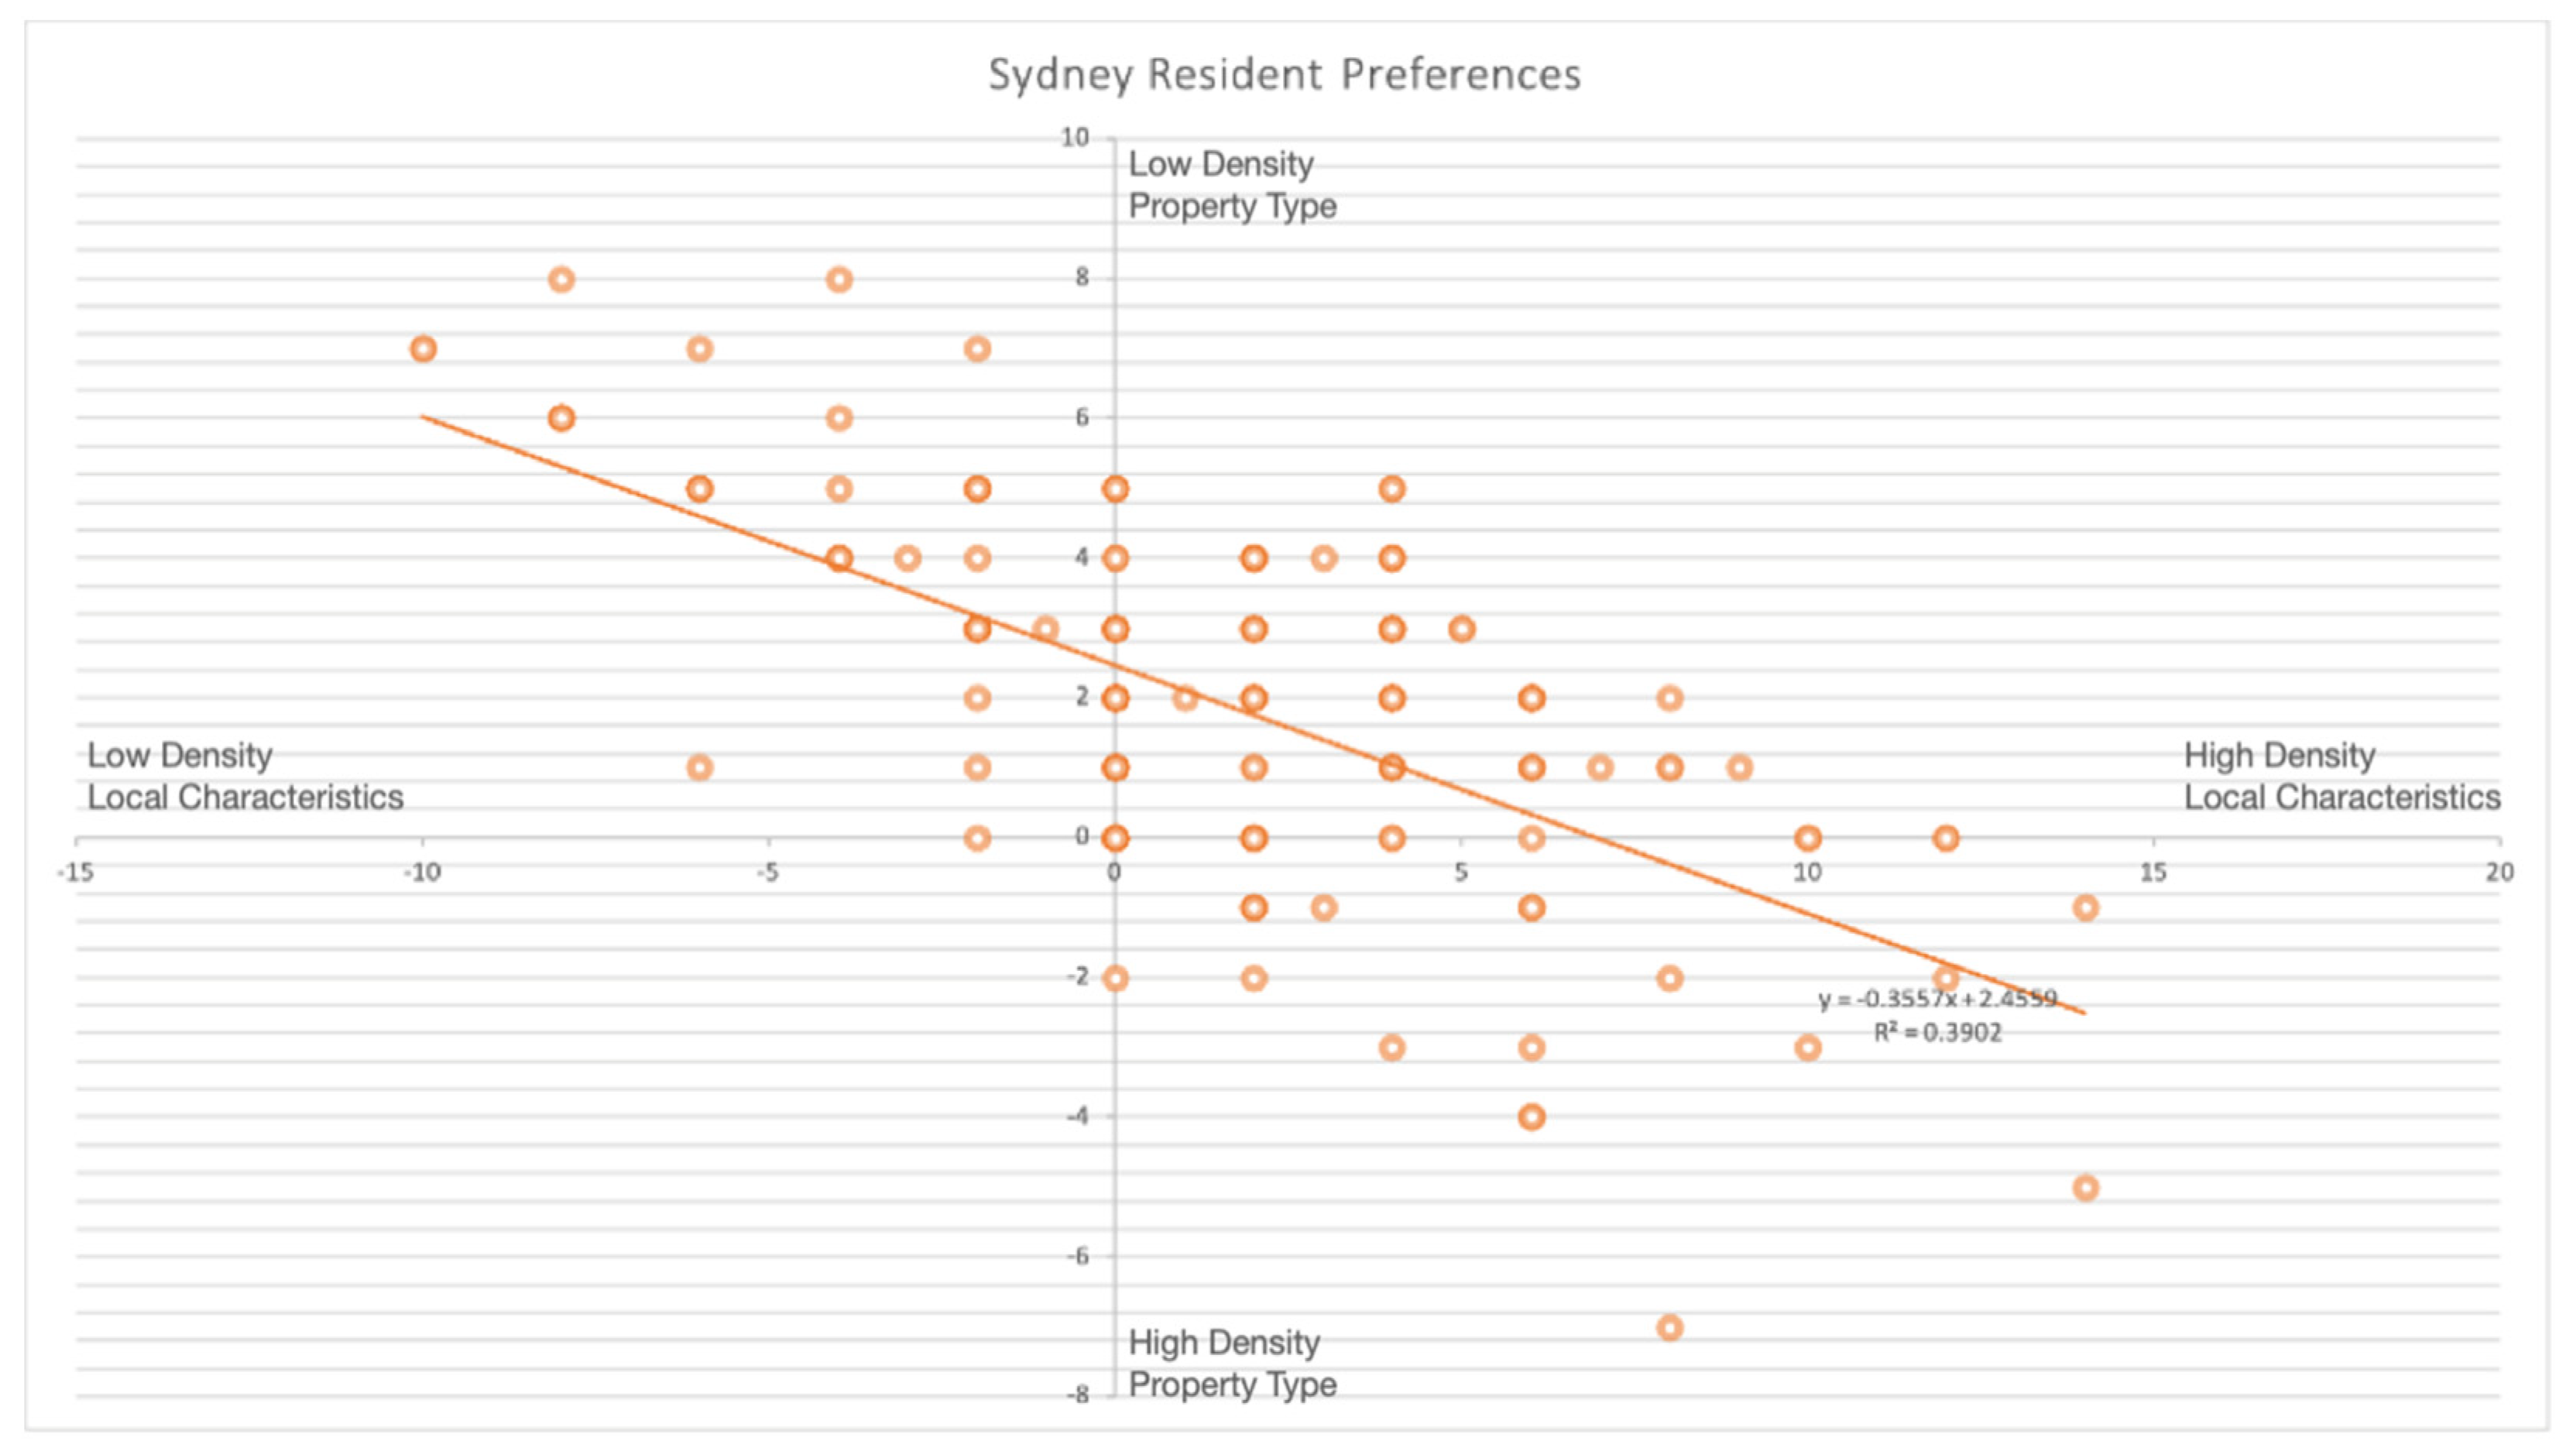
The scoring system begins here
As respondents answer the questions of the main questionnaire, they are given a score for each option they select.
Characteristics Scoring (X-value): HD selection = +1; LD selection = −1
Property Scoring (Y-value): HD selection = −1; LD selection = +1
At the end of the questionnaire, each respondent receives two scores (Characteristic, Property) (X, Y). Based on this score they are placed upon the Resident Preferences Graph (Figure 3), to facilitate the data analysis.
Q1. (Demonstrating Preference for Low Density)
(a) Have you previously rented/purchased a property? Graphs and Comparison of averages(Behaviour, open precoded, spontaneous)Determining respondent Housing Background, see Section 4.
Property Scoring (Y value).
(b) If so what type of property have you rented or purchased? Graphs and Comparison of averages(Behaviour, open precoded, spontaneous)Determining respondent Housing Background, see Section 4.
Property Scoring (Y value).
(c) Why did you choose this type of property over a house or townhouse? Graphs and Comparison of averages(Behaviour, open precoded, spontaneous)Determining respondent Housing Background.
Determinations made in Section 4.
Property Scoring (Y value).
Q2. Over the past fortnight which public facilities have you used within your local area?(Behaviour, open precoded, spontaneous)Determining Recollection.
Precoded responses feed into scoring system, as per Research Question 2 & 4.
Characteristic Scoring (X-value).
Q3. Topography Preferences
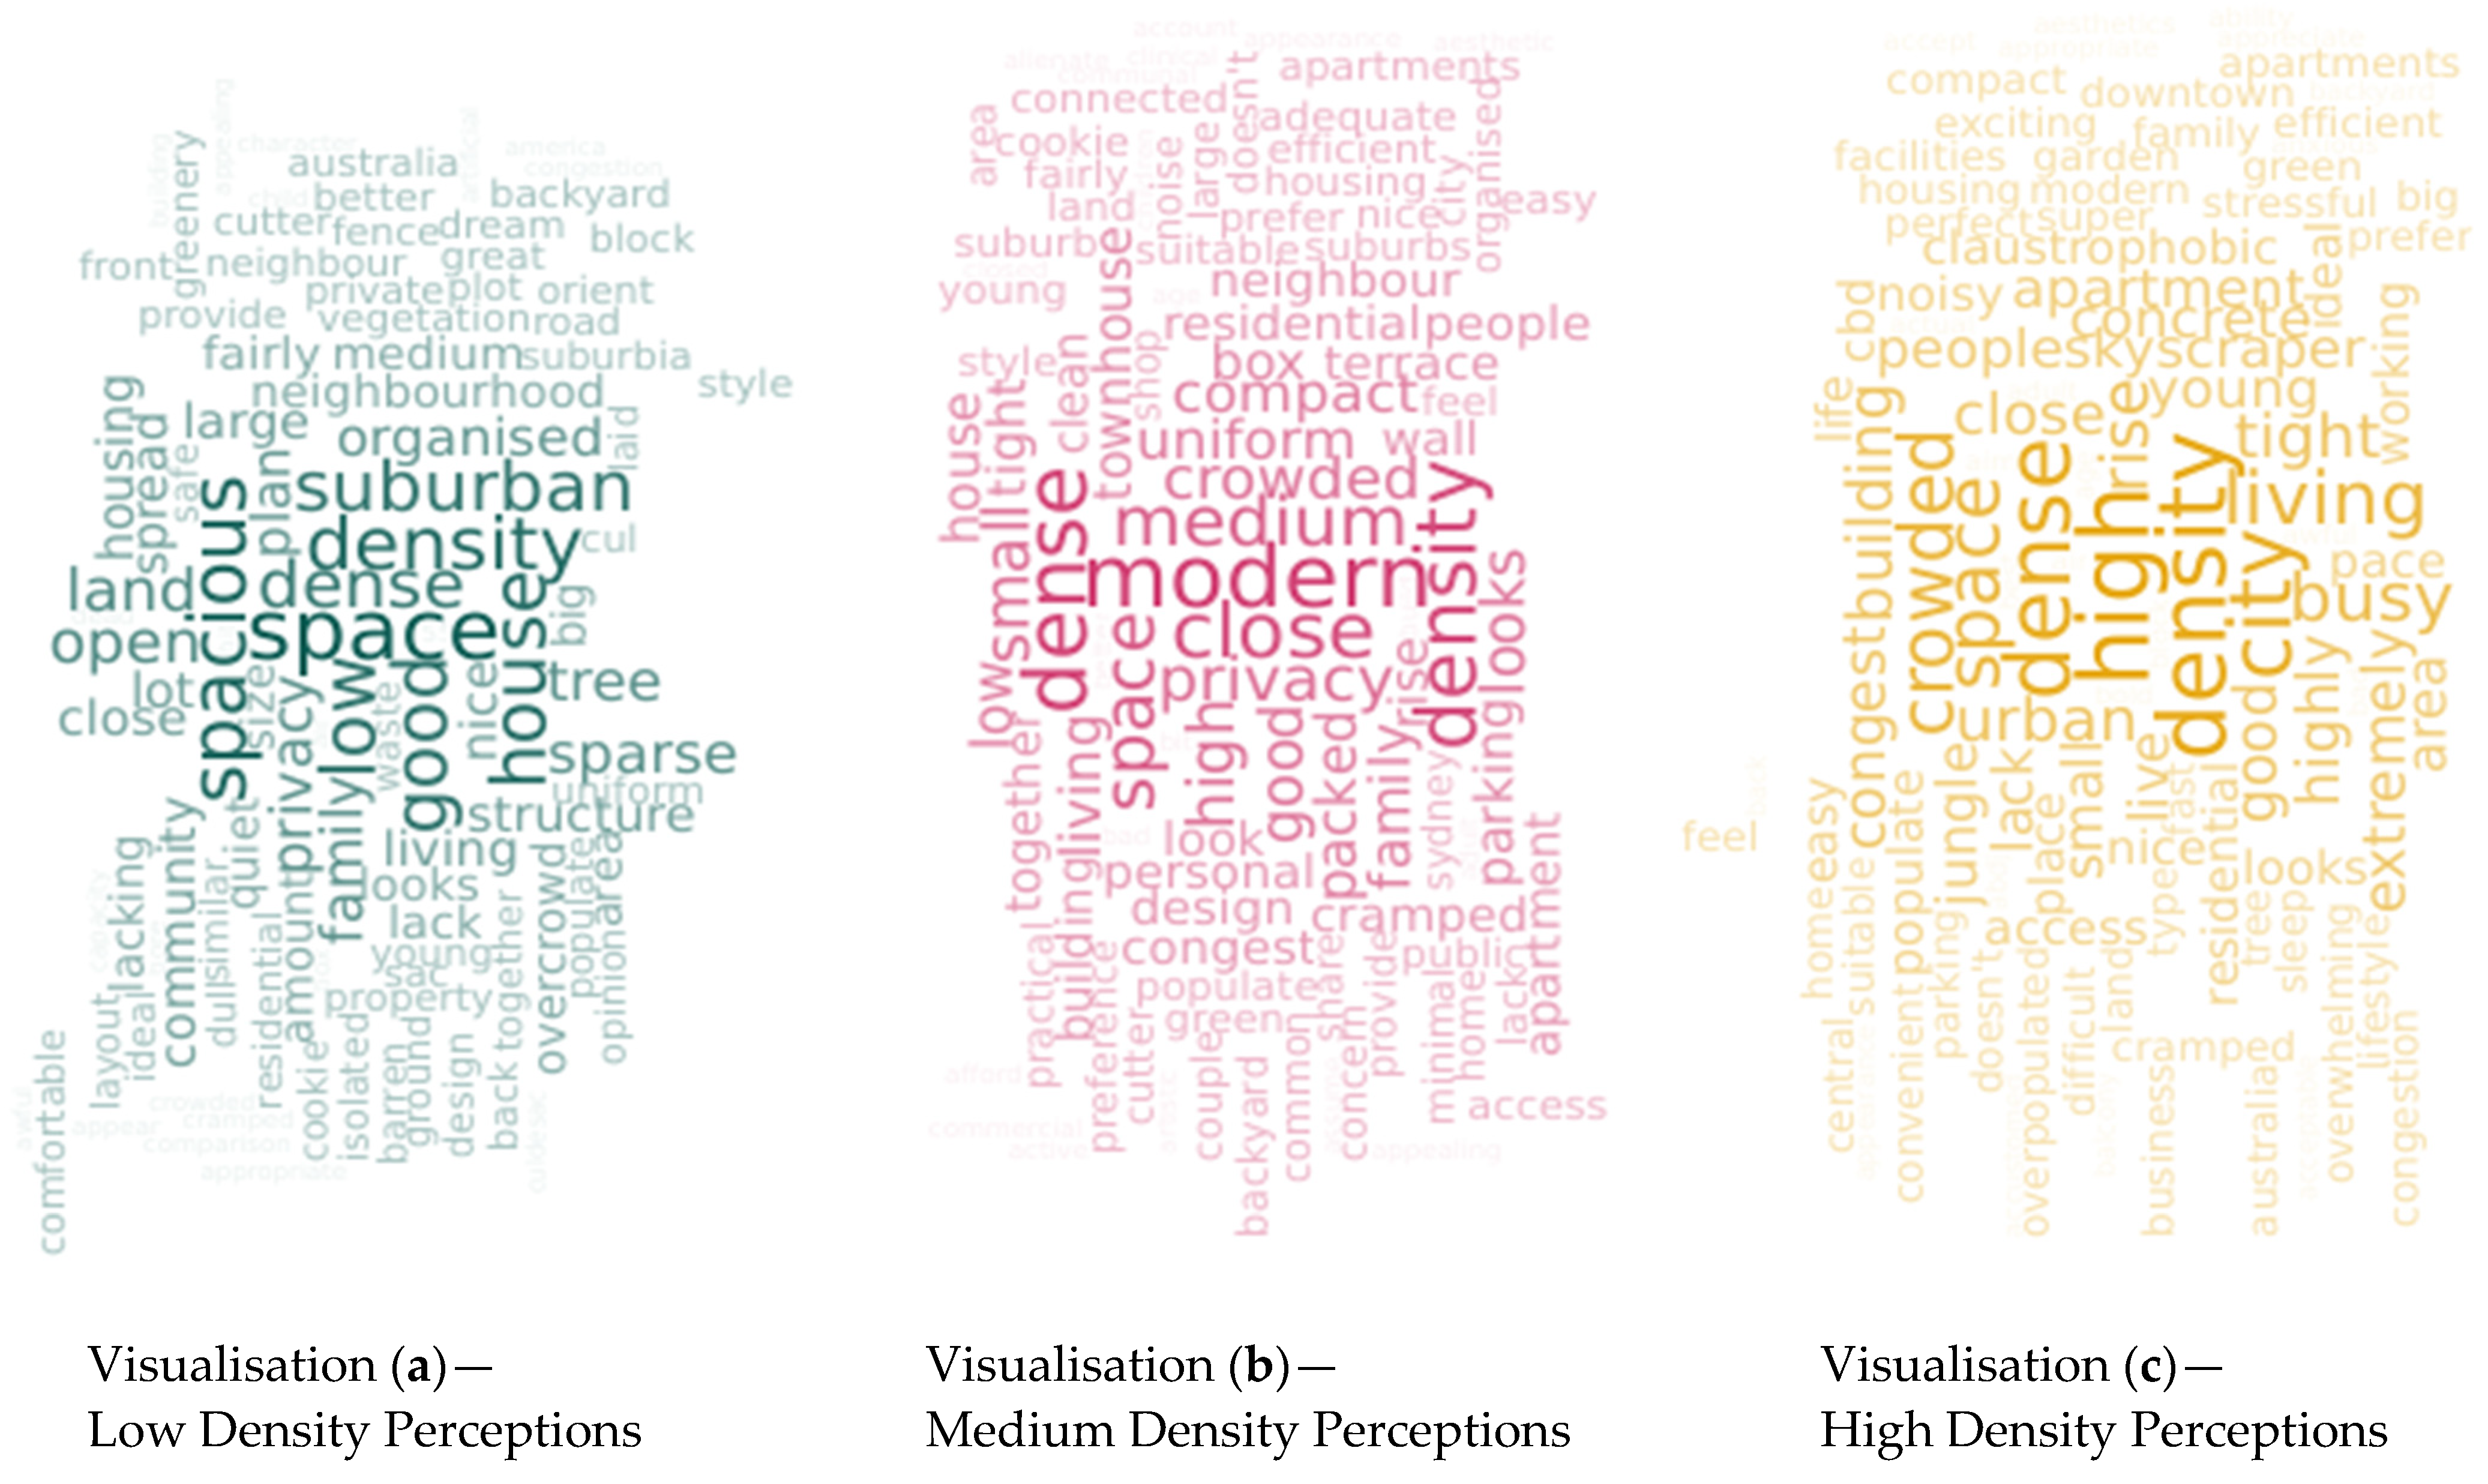
(a) Please use a few words to describe your thoughts on the following building densities.
i. Picture Prompt of Inefficiently placed suburban houses
ii. Picture Prompt of efficiently placed townhouses
iii. Picture Prompt of High Density apartment buildings
(Attitude, open ended, prompted)
Word Cloud Analysis.
Literature Comparison Table 5, Table 6 and Table 7
Determining Topography Preferences.
Determinations made in Section 4.5
Open ended responses, feed into the word cloud, as per Research Question 3.
(b) When shopping would you prefer to go to a large shopping centre in your area?
Such as Macquarie Centre, Parramatta Westfield, Chatswood Westfield, Broadway Shopping Centre.
Or
Would you prefer to go to the individual local shops within your suburb?
Such as local grocery shops, convenience stores or stand-alone Woolworths/Coles.
(Attitude, closed, prompted)
Correlation (RQ2) and Share Variance (RQ4) Analysis.
Determining Topography Preferences.
Closed responses feed into scoring system, as per Research Question 2 & 4.
Characteristic Scoring (X-value).
ii. When shopping would you prefer to do a big load of shopping in one go, or do smaller loads more frequently?(Attitude, closed, prompted)
Correlation (RQ2) and Share Variance (RQ4) Analysis.
Determining Topography Preferences.
Closed responses feed into scoring system, as per Research Question 2 & 4.
Characteristic Scoring (X-value).
Q4. Communal Facilities Preferences
(a) Would you rather have a small backyard to yourself? Or easy access to a large park with BBQ facilities, benches, swings and sports facilities. (Attitude, closed, prompted)
Correlation (RQ2) and Share Variance (RQ4) Analysis.
Determining Communal Facilities Preferences.
Closed responses feed into scoring system, as per Research Question 2 & 4.
Characteristic and Property Scoring (X, Y-value).
(b) In an emergency situation how quickly would you EXPECT emergency services (police/fire/ambulance) to arrive? Ratio Scale
(Attitude, open precoded)
Determining Communal Facilities Preferences. Scale response feeds into scoring system, as per Research Question 2 & 4. Characteristic Scoring (X-value).
Q5. Social and Societal Factors Preferences
(a) i. When meeting a friend would you rather meet in a public spot, such as a park, café, or bar? or would you rather meet at your or their home? Correlation (RQ2) and Share Variance (RQ4) Analysis(Attitude, closed, prompted)Determining Social and Societal Factor Preferences.
Closed responses feed into scoring system, as per Research Question 2 & 4.
Characteristic and Property Scoring (X, Y-value).
ii. When spending time in the city would you rather go when its vibrant, lively and busy? Or when it is peaceful, quiet and empty? Correlation (RQ2) and Share Variance (RQ4) Analysis(Attitude, closed, prompted)Determining Social and Societal Factor Preferences.
Closed responses feed into scoring system, as per Research Question 2 & 4.
Characteristic Scoring (X-value).
iii. When visiting a bar or a restaurant, would you rather go when it is lively and energetic or quiet and relaxed?(Attitude, closed, prompted)
Correlation (RQ2) and Share Variance (RQ4) Analysis.
Determining Social and Societal Factor Preferences.
Closed responses feed into scoring system, as per Research Question 2 & 4.
Characteristic Scoring (X-value).
(b) Imagine you are in a zombie apocalypse with 10 other people. You have all managed to gather some resources which you will need to survive. Would you rather:(Attitude, closed, prompted)
Correlation (RQ2) and Share Variance (RQ4) Analysis.
Determining Social and Societal Factor Preferences.
Closed responses feed into scoring system, as per Research Question 2 & 4. Characteristic Scoring (X-value).
Q6. Accessibility Preferences
(a) i. When travelling to a destination, if travel time, cost of travel and ease of travel were equal, would you rather travel by car or public transport?(Attitude, closed, prompted)
Correlation (RQ2) and Share Variance (RQ4) Analysis.
Determining Accessibility Preferences. Closed responses feed into scoring system, as per Research Question 2 & 4. Characteristic Scoring (X-value).
ii. What is your ideal commute time to work:Ratio Scale
(Attitude, closed, prompted)
Determining Accessibility Preferences. Scale responses feed into scoring system, as per Research Question 2 & 4. Characteristic Scoring (X-value).
Q7. The respondents are asked to design their IDEAL suburb in which they want to live. (Attitude, closed, prompted)
(a) Choose one (1) ideal property type in which you would like to live. Respondent must select from the following:
A1. Large House
A2. Small House
A3. Townhouse
A4. Apartment
A5. Penthouse
Correlation (RQ2) and Share Variance (RQ4) Analysis.Determining Property Preferences.
Closed responses feed into scoring system, as per Research Question 2 & 4.
Property Scoring (-value).
(b) Choose (quantity—6) which local characteristics you would like:
Respondent must select from the following:
HD Score
A1. All buildings are near each other
A2. Easy access to local shops, cafés, restaurants, entertainment, office spaces.
A3. An environment consisting of mostly apartments
A4. Communal facilities such as parks, walkways, sport centres, large public gyms
A5. Immediate access to emergency services
A6. A large, lively local community filled with many diverse cultures
A7. Easy access to public transport with shorter commute times
LD score
A8. Spaced out buildings
A9. An environment consisting of mostly large family homes
A10. Individual facilities such as backyards, personal pools, home gym
A11. A small, tight community filled familiar people from similar cultures
A12. Greater access to motorways and distant commutes
Correlation (RQ2) and Share Variance (RQ4) Analysis.Determining Local Characteristic Preferences.
Closed responses feed into scoring system, as per Research Question 2 & 4.
Characteristic Scoring (X-value).
(c) Choose 4 negative factors which are NOT ACCEPTABLE in your ideal suburb?
Respondent must select from the following:
HD Score
A1. Loss of greenery through greater emphasis on the built environment
A2. Increased social contact and exposure to pathogens through emphasis on communal facilities
A3. Reduced privacy outside of the personal domain due to high population density
A4. Increased noise, light and air pollution due to increased activity in the locality
LD Score
A5. Increased commute time and distance
A6. Reduced access to public services such as restaurants, shops, support services
A7. Reduced levels of security through increased entry points for burglars
A8. Increased local taxes and community contributions towards councils
Correlation (RQ2) and Share Variance (RQ4) Analysis.Determining Local Characteristic Negative Externality Tolerance.
Closed responses feed into scoring system, as per Research Question 2 & 4.
Characteristic Scoring (X-value).

Appendix C

Table A2. The difference between individuals with different ideal property type in which they would like to live against variables 3 and 12.
VAR12TotalVAR3Total
0.001.000.001.00
1.00Count415145
Expected Count3.41.65.04.70.35.0
% within Home type80.0%20.0%100.0%20.0%80.0%100.0%
% within VAR124.7%2.5%4.0%0.8%57.1%4.0%
% of Total3.2%0.8%4.0%0.8%3.2%4.0%
2.00Count1801816218
Expected Count12.35.718.017.01.018.0
% within Home type100.0%0.0%100.0%88.9%11.1%100.0%
% within VAR1220.9%0.0%14.3%13.4%28.6%14.3%
% of Total14.3%0.0%14.3%12.7%1.6%14.3%
3.00Count808808
Expected Count5.52.58.07.60.48.0
% within Home type100.0%0.0%100.0%100.0%0.0%100.0%
% within VAR129.3%0.0%6.3%6.7%0.0%6.3%
% of Total6.3%0.0%6.3%6.3%0.0%6.3%
4.00Count3284039140
Expected Count27.312.740.037.82.240.0
% within Home type80.0%20.0%100.0%97.5%2.5%100.0%
% within VAR1237.2%20.0%31.7%32.8%14.3%31.7%
% of Total25.4%6.3%31.7%31.0%0.8%31.7%
5.00Count24315555055
Expected Count37.517.555.051.93.155.0
% within Home type43.6%56.4%100.0%100.0%0.0%100.0%
% within VAR1227.9%77.5%43.7%46.2%0.0%43.7%
% of Total19.0%24.6%43.7%43.7%0.0%43.7%
Count86401261197126
Expected Count86.040.0126.0119.07.0126.0
% within Home type68.3%31.7%100.0%94.4%5.6%100.0%
% within VAR12100.0%100.0%100.0%100.0%100.0%100.0%
% of Total68.3%31.7%100.0%94.4%5.6%100.0%

References

  1. Kok, N.; Monkkonen, P.; Quigley, J.M. Land use regulations and the value of land and housing: An intra-metropolitan analysis. J. Urban Econ. 2014, 81, 136–148. [Google Scholar] [CrossRef] [Green Version]
  2. Hossny Aziz, A.-R.; Jamal, A. The impact of zoning on residential land value in Jeddah, Saudi Arabia. Ekistics 1996, 63, 138–142. [Google Scholar]
  3. Moon, S.-K.; Lee, S.-H.; Min, K.-M.; Lee, J.-S.; Kim, J.-H.; Kim, J.-J. An analysis of Land Mark impact factors on high-rise residential buildings value assessment. Int. J. Strateg. Prop. Manag. 2010, 14, 105–120. [Google Scholar] [CrossRef] [Green Version]
  4. Suen, I.S. The Impact of Compact and Mixed Development on Land Value: A Case Study of Richmond, Virginia. Urban Sci. 2018, 2, 47. [Google Scholar] [CrossRef] [Green Version]
  5. Michael, D. The Impact of Transit-oriented Development on Housing Prices in San Diego, CA. Urban Stud. 2011, 48, 101–127. [Google Scholar] [CrossRef]
  6. Duncan, M. The Synergistic Influence of Light Rail Stations and Zoning on Home Prices. Environ. Plan. A 2011, 43, 2125–2142. [Google Scholar] [CrossRef]
  7. Asadi Bagloee, S.; Heshmati, M.; Tavana, M.; Di Caprio, D. A logit-based model for measuring the effects of transportation infrastructure on land value. Transp. Plan. Technol. 2017, 40, 143–166. [Google Scholar] [CrossRef]
  8. Higgins, C.; Kanaroglou, P. Rapid transit, transit-oriented development, and the contextual sensitivity of land value uplift in Toronto. Urban Stud. 2018, 55, 2197–2225. [Google Scholar] [CrossRef] [Green Version]
  9. Cervero, R.; Kang, C.D. Bus rapid transit impacts on land uses and land values in Seoul, Korea. Transp. Policy 2011, 18, 102–116. [Google Scholar] [CrossRef] [Green Version]
  10. Koster, H.R.A.; Rouwendal, J. The Impact of Mixed Land Use on Residential Property Values. J. Reg. Sci. 2012, 52, 733–761. [Google Scholar] [CrossRef] [Green Version]
  11. Jan, K.B. Growth Controls and Land Values in an Open City. Land Econ. 1990, 66, 237–248. [Google Scholar] [CrossRef]
  12. Shilling, J.D.; Sirmans, C.F.; Guidry, K.A. The impact of state land-use controls on residential land values. J. Reg. Sci. 1991, 31, 83–92. [Google Scholar] [CrossRef]
  13. Burge, G. The capitalization effects of school, residential, and commercial impact fees on undeveloped land values. Reg. Sci. Urban Econ. 2014, 44, 1–13. [Google Scholar] [CrossRef]
  14. Song, Y.; Knaap, G.-J. Measuring the effects of mixed land uses on housing values. Reg. Sci. Urban Econ. 2004, 34, 663–680. [Google Scholar] [CrossRef]
  15. Lewis, C.; Goodwin, G. Impact of bus transit centers on values of nearby single-family residential land in Houston, Texas. Transp. Res. Rec. 2012, 2276, 72–77. [Google Scholar] [CrossRef]
  16. Salkind, N.J. Encyclopedia of Research Design; SAGE Publications: Thousand Oaks, CA, USA, 2010. [Google Scholar]
  17. Amaratunga, D.; Baldry, D.; Sarshar, M.; Newton, R. Quantitative and qualitative research in the built environment: Application of “mixed” research approach. Work Study 2002, 51, 17–31. [Google Scholar] [CrossRef]
  18. Ng, E. Designing High-Density Cities for Social and Environmental Sustainability; Routledge: Oxfordshire, UK, 2009. [Google Scholar]
  19. Brace, I. Questionnaire Design: How to Plan, Structure and Write Survey Material for Effective Market Research; Kogan Page Publishers: London, UK, 2018. [Google Scholar]
  20. Australian Bureau of Statistics. Census Quickstats: Greater Sydney. Available online: https://quickstats.censusdata.abs.gov.au/census_services/getproduct/census/2016/quickstat/1GSYD?opendocument= (accessed on 23 June 2020).
  21. NSW Legislation. Willoughby Local Environmental Plan. Available online: https://www.legislation.nsw.gov.au/view/html/inforce/current/epi-2012-0679 (accessed on 23 June 2020).
  22. Haarhoff, E.; Beattie, L.; Dupuis, A. Does higher density housing enhance liveability? Case studies of housing intensification in Auckland. Cogent Soc. Sci. 2016, 2, 1243289. [Google Scholar] [CrossRef]
  23. Ruming, K.J. Urban consolidation, strategic planning and community opposition in Sydney, Australia: Unpacking policy knowledge and public perceptions. Land Use Policy 2014, 39, 254–265. [Google Scholar] [CrossRef]
  24. NSW Legislation. Sydney Local Environmental Plan. Available online: https://www.legislation.nsw.gov.au/view/html/inforce/current/epi-2012-0628 (accessed on 23 June 2020).
  25. NSW Legislation. Ryde Local Environmental Plan. Available online: https://www.legislation.nsw.gov.au/view/html/inforce/current/epi-2014-0608/maps (accessed on 23 June 2020).
  26. NSW Legislation. Parramatta Local Environmental Plan. Available online: https://www.legislation.nsw.gov.au/view/html/inforce/current/epi-2011-0540 (accessed on 23 June 2020).
  27. NSW Legislation. Canada Bay Local Environmental Plan. Available online: https://www.legislation.nsw.gov.au/view/whole/html/inforce/current/epi-2013-0389 (accessed on 23 June 2020).
Figure 1. Residents Preferences Graph.
Buildings 11 00650 g001
Figure 2. Hierarchy of Research.
Buildings 11 00650 g002
Figure 3. Sydney Resident Preferences.
Buildings 11 00650 g003
Figure 4. The visualisation of the frequency of words in the transcriptions representing different concepts.
Buildings 11 00650 g004
Figure 5. Visualisation of the co-occurrence of the selected literature including 354 keywords out of 4646 keywords with minimum number of five occurrences.
Buildings 11 00650 g005
Figure 6. Graphed Regression Line.
Buildings 11 00650 g006
Table 1. Demographic Profile of Respondents.
Respondent DataComposition
Gender ProfileMale: 52.52%, Female: 47.48% respondents
Age ProfileRespondent: Minimum: 21 yr, Maximum: 71 yr, Mean: 36 yr of ages
Relationship StatusMarried: 44.6%, In a relationship: 27.34%, Single: 28.06%
Current Housing TypesHouse: 77.42%, Townhouse: 2.42%, Apartment 20.16%
Education LevelHigh School Certificate: 5.76%, Diploma: 1.44%, Graduate Certificate: 1.44%, Bachelors: 58.27%, Masters: 31.65%, PhD: 1.44%
Individual Per Annum IncomeIndividual Income Brackets, per annum: $50–75k: 16%, $75k–99k: 22%, $100k–124k: 12%, $125k–149k: 11%, $150k–199k: 15%, +$200k: 20%
Housing Ownership HistoryRespondents who have rented or purchased before: 76%.
Who have no rented to purchased before: 24%
Housing TypeRespondent Housing History: House: 49%, Townhouse: 7%, Apartment: 44%
Housing Selection JustificationThose who selected apartment, why was this type selected over others: Monetary Reasons: 56%, Space Requirements: 20%, Suitable Characteristics: 18%, Security Reasons: 6%
Table 2. Respondent Demographic Analysis.
Demographic Profile—Analysis of Averages
150 pax—Data Sample2016 Greater Sydney Census
[20]
Gender 52.5% Male
47.5% Female
49% Male
51% Female
Age36 years old36 years old
Relationship Status45% Married
27% in Relationship (Defacto Marriage)
28% Single
(Not Married)
48% Registered Marriage
9% Defacto Marriage
43% Not Married
Highest Education Level 32% High School Certificate
60% Bachelors and above
17% High School Certificate
28% Bachelors and above
Housing Type77% House
2.4% Townhouse
20% Apartment
60% House
14% Townhouse
28% Apartment
Household Size3.5 pax2.8 pax
Annual Income Sample Average
$100,000–124,000
Australian Average 2020
$91,000
Table 3. Word Cloud Analysis.
Research Participant Density Perceptions
(Word Cloud Analysis)
RankedLow-DensityMedium DensityHigh-Density
1.SpaciousModernBusy
2.SuburbanCloseCrowded
3.SparsePrivacyCongested/Tight
4.FamilyCrowdedConcrete
5.TreesUniformUrban
Top ranked words omitted due to consistency across all three density typesDense, Density, Space, Good
Table 4. Density Perceptions Comparison.
Low-Density Perceptions
Perceptions in LiteraturePerceptions found in Research
NeighbourhoodSpacious
Family OrientedSuburban
High IncomeSparse
NIMBY (not in my back yard)Family
UnaffordableTrees
Sources: [10,14,21]
Medium Density Perceptions
Perceptions in LiteraturePerceptions found in Research
LiveableModern
AffordableClose
Community Privacy
SpaciousCrowded
AccessibleUniform
Sources: [10,22]
High-density Perceptions
Perceptions in LiteraturePerceptions found in Research
SustainableBusy
EfficientCrowded
RestrictiveCongested/Tight
Accessible Concrete
Diverse Urban
Sources: [4,10]
Table 5. Sydney Residents’ Preferences—Graph Analysis.
Respondent Graph Placement
Bottom Left Quadrant (−X, −Y)
LD Characteristics
HD Property
0
Bottom Right Quadrant (+X, −Y)
HD Characteristics
HD Property
17
Neutral (0, 0)
No Preference
12
Top Left Quadrant (−X, +Y)
LD Characteristics
LD Property
33
Top Right Quadrant (+X, +Y)
HD Characteristics
LD Property
88
Total No. of Respondents150
Table 6. Highest local characteristics that participants would like to include in their ideal suburb in order.
IDAnswer% of Chosen CharactersCount% of Individuals
1Easy access to local shops, cafes, restaurants, entertainment, office spaces.15.74%11995.97%
8Communal facilities such as parks, walk ways, sport centres, large public gyms14.02%10685.48%
10Easy access to public transport with shorter commute times13.89%10584.68%
9Immediate access to emergency services11.64%8870.97%
2A large, lively local community filled with many diverse cultures11.11%8467.74%
4Individual facilities such as backyards, personal pools, home gym10.19%7762.10%
11Spaced out buildings6.61%5040.32%
7Greater access to motorways and distant commutes6.48%4939.52%
12An environment consisting of mostly large family homes5.29%4032.26%
5A small, tight community filled familiar people from similar cultures2.78%2116.94%
6All buildings are near each other1.32%108.06%
3An environment consisting of mostly apartments0.93%75.65%
Table 7. The difference between individuals who meet a friend in a public spot, such as a park, café or bar or at their home against variables 4 and 1.
VAR4 TotalVAR1 Total
0.001.00 0.001.00
Home Public1.00Count17415865258
Expected Count22.635.458.03.254.858.0
% within Home Public29.3%70.7%100.0%10.3%89.7%100.0%
% within VAR434.7%53.2%46.0%85.7%43.7%46.0%
% of Total13.5%32.5%46.0%4.8%41.3%46.0%
2.00Count32366816768
Expected Count26.441.668.03.864.268.0
% within Home Public47.1%52.9%100.0%1.5%98.5%100.0%
% within VAR465.3%46.8%54.0%14.3%56.3%54.0%
% of Total25.4%28.6%54.0%0.8%53.2%54.0%
Total Count49771267119126
Table 8. The difference between female and male individuals against variables 8 and 6.
VAR8TotalVAR6Total
0.001.000.001.00
Gender1.00Count3545749857
Expected Count9.048.057.052.54.557.0
% within Gender5.3%94.7%100.0%86.0%14.0%100.0%
% within VAR815.0%50.9%45.2%42.2%80.0%45.2%
% of Total2.4%42.9%45.2%38.9%6.3%45.2%
2.00Count17526967269
Expected Count11.058.069.063.55.569.0
% within Gender24.6%75.4%100.0%97.1%2.9%100.0%
% within VAR885.0%49.1%54.8%57.8%20.0%54.8%
% of Total13.5%41.3%54.8%53.2%1.6%54.8%
Total Count2010612611610126
Publisher’s Note: MDPI stays neutral with regard to jurisdictional claims in published maps and institutional affiliations.

