
Lockout, Lockdown and Land Use: Exploring the Spatio-Temporal Evolution Patterns of Licensed Venues in Sydney, Australia between 2012 and 2021 in the Context of NSW Public Policy


Abstract
:1. Introduction
1.1. A History of Alcohol Regulation in NSW
1.2. Current Policy Setting
- Were only applicable to venues within the Sydney CBD precinct and Kings Cross precinct, two adjacent areas located in the inner-city area of Sydney LGA;
- Required bars, pubs and clubs to refuse people entry past 1:30 a.m.;
- Restricted the sale of last drinks to 3:00 a.m.;
- Gave the NSW Government greater powers to impose conditions on licensed premises [19].
- Enforced social distancing requirements;
- Restricted the number of people who could attend specific venues;
1.3. Spatial Analysis
1.4. Spatio-Temporal Analysis
1.5. Online Display
1.6. Research Aim
- The NSW Government earlier this year repealed the lockout laws entirely. As such, it is necessary to explore the full impact of the policy to assist policymakers, government regulators and industry bodies in better understanding the spatial implications of such policies targeting the hospitality sector.
- With the pandemic still underway, there is a need to better understand the effect of the COVID-19 lockdowns to assist the government in providing targeted stimulus to businesses recovering from the COVID-19 pandemic.
- What is the spatial distribution of licensed venues in Inner Sydney? How does this relate to local government areas (LGAs) and land use zones?
- How have these spatial patterns changed between 2012 and 2021?
- Do these changes correspond with the introduction of the lockout laws and COVID-19 lockdowns?
- How can the data of this study be visualised in a way that allows the audience to interactively explore the results?
2. Materials and Methods
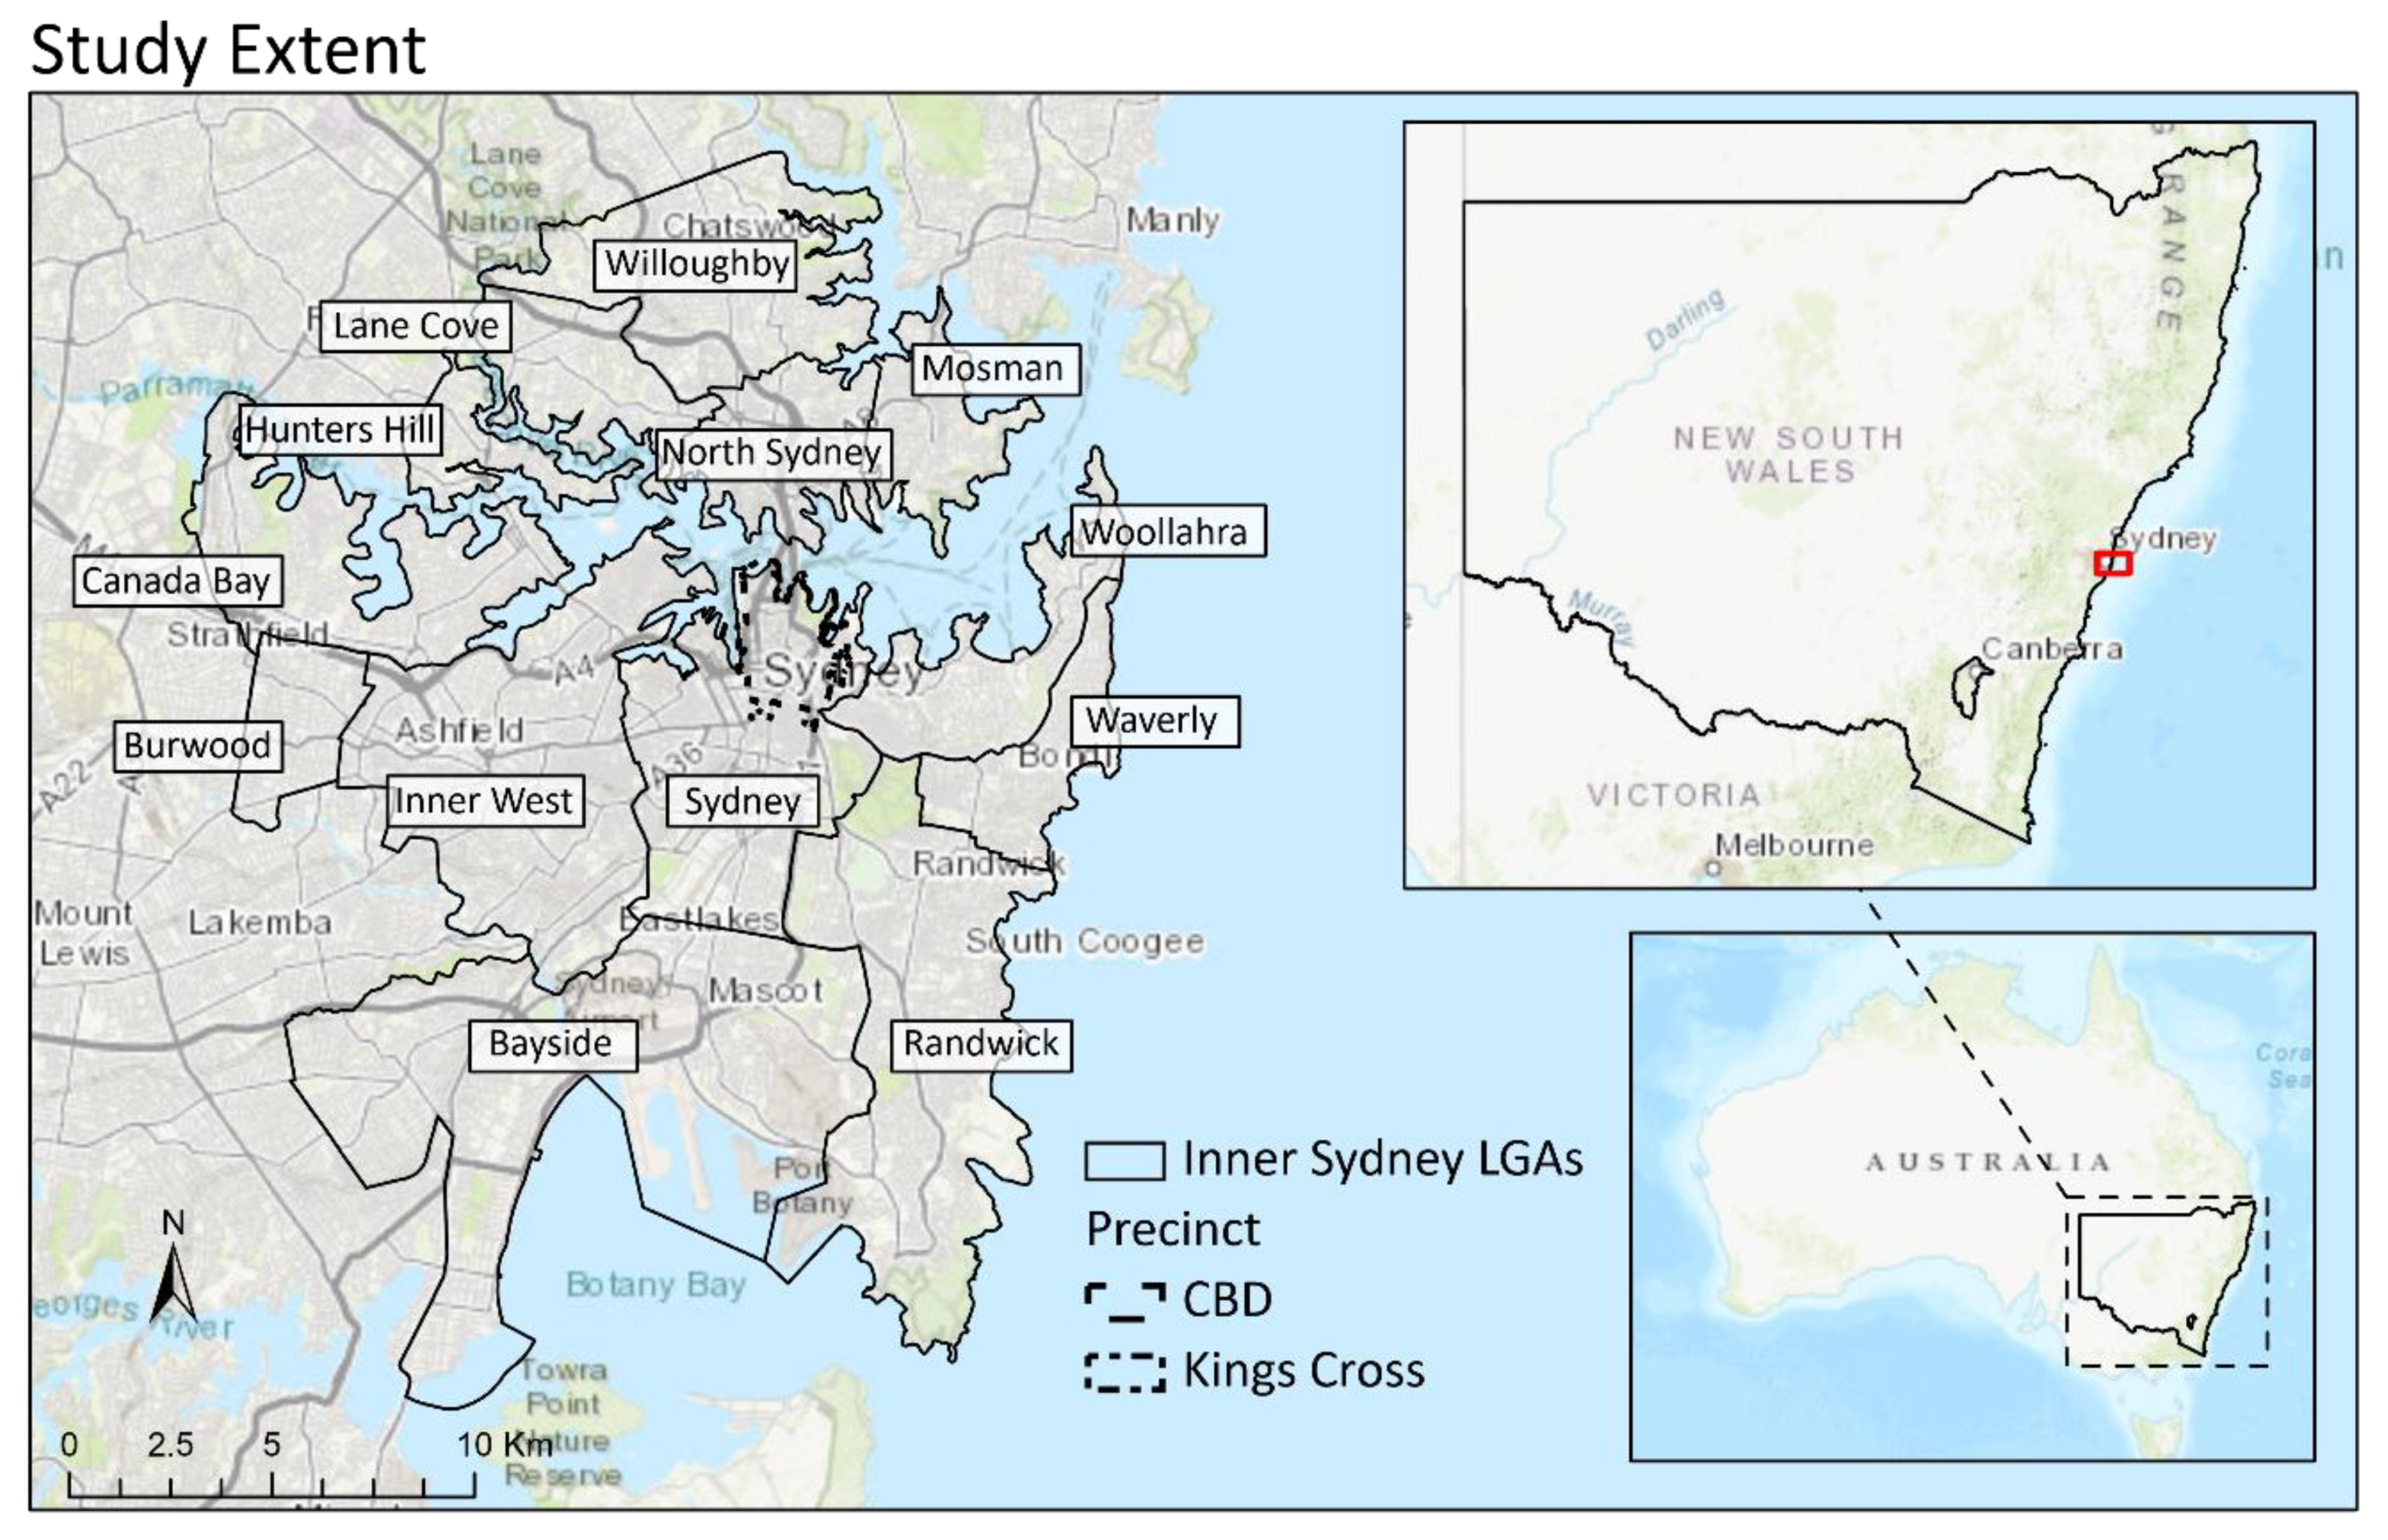
2.1. Study Extent
- Bayside, Burwood, Canada Bay, Hunters Hill, Inner West, Lane Cove, Mosman, North Sydney Council, Randwick, Sydney, Waverley, Willoughby, Woollahra.
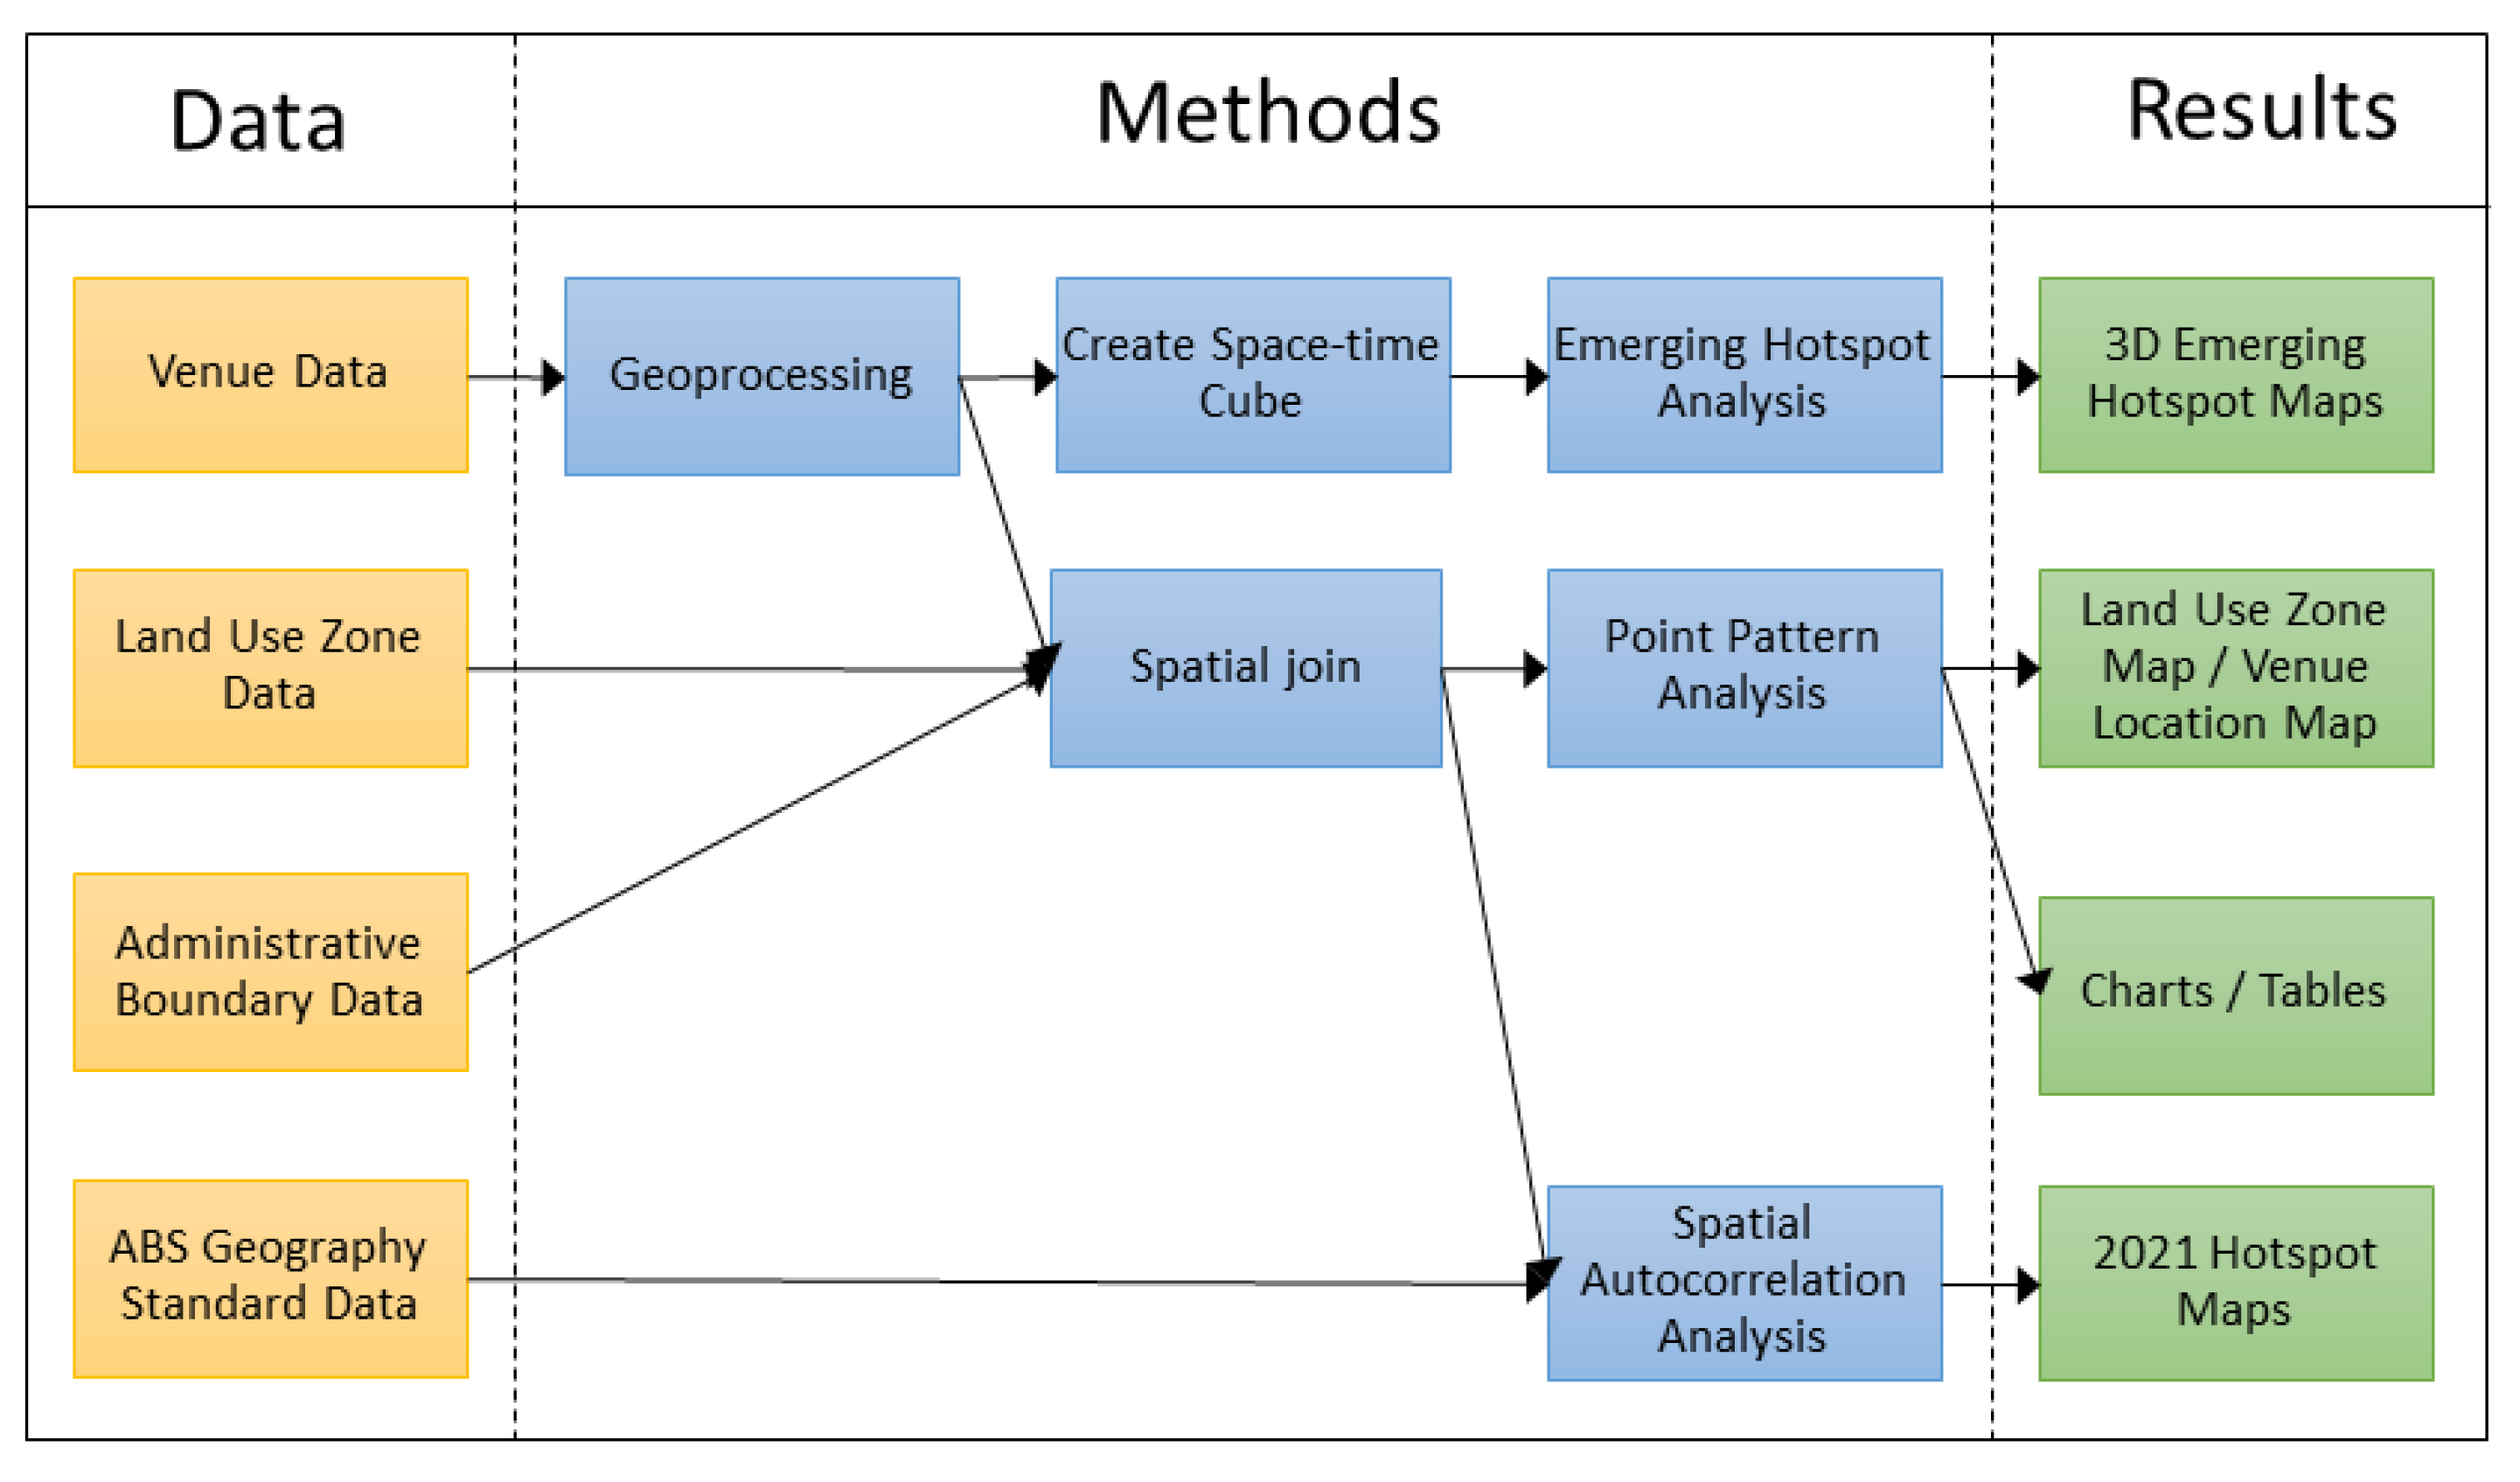
2.2. Data
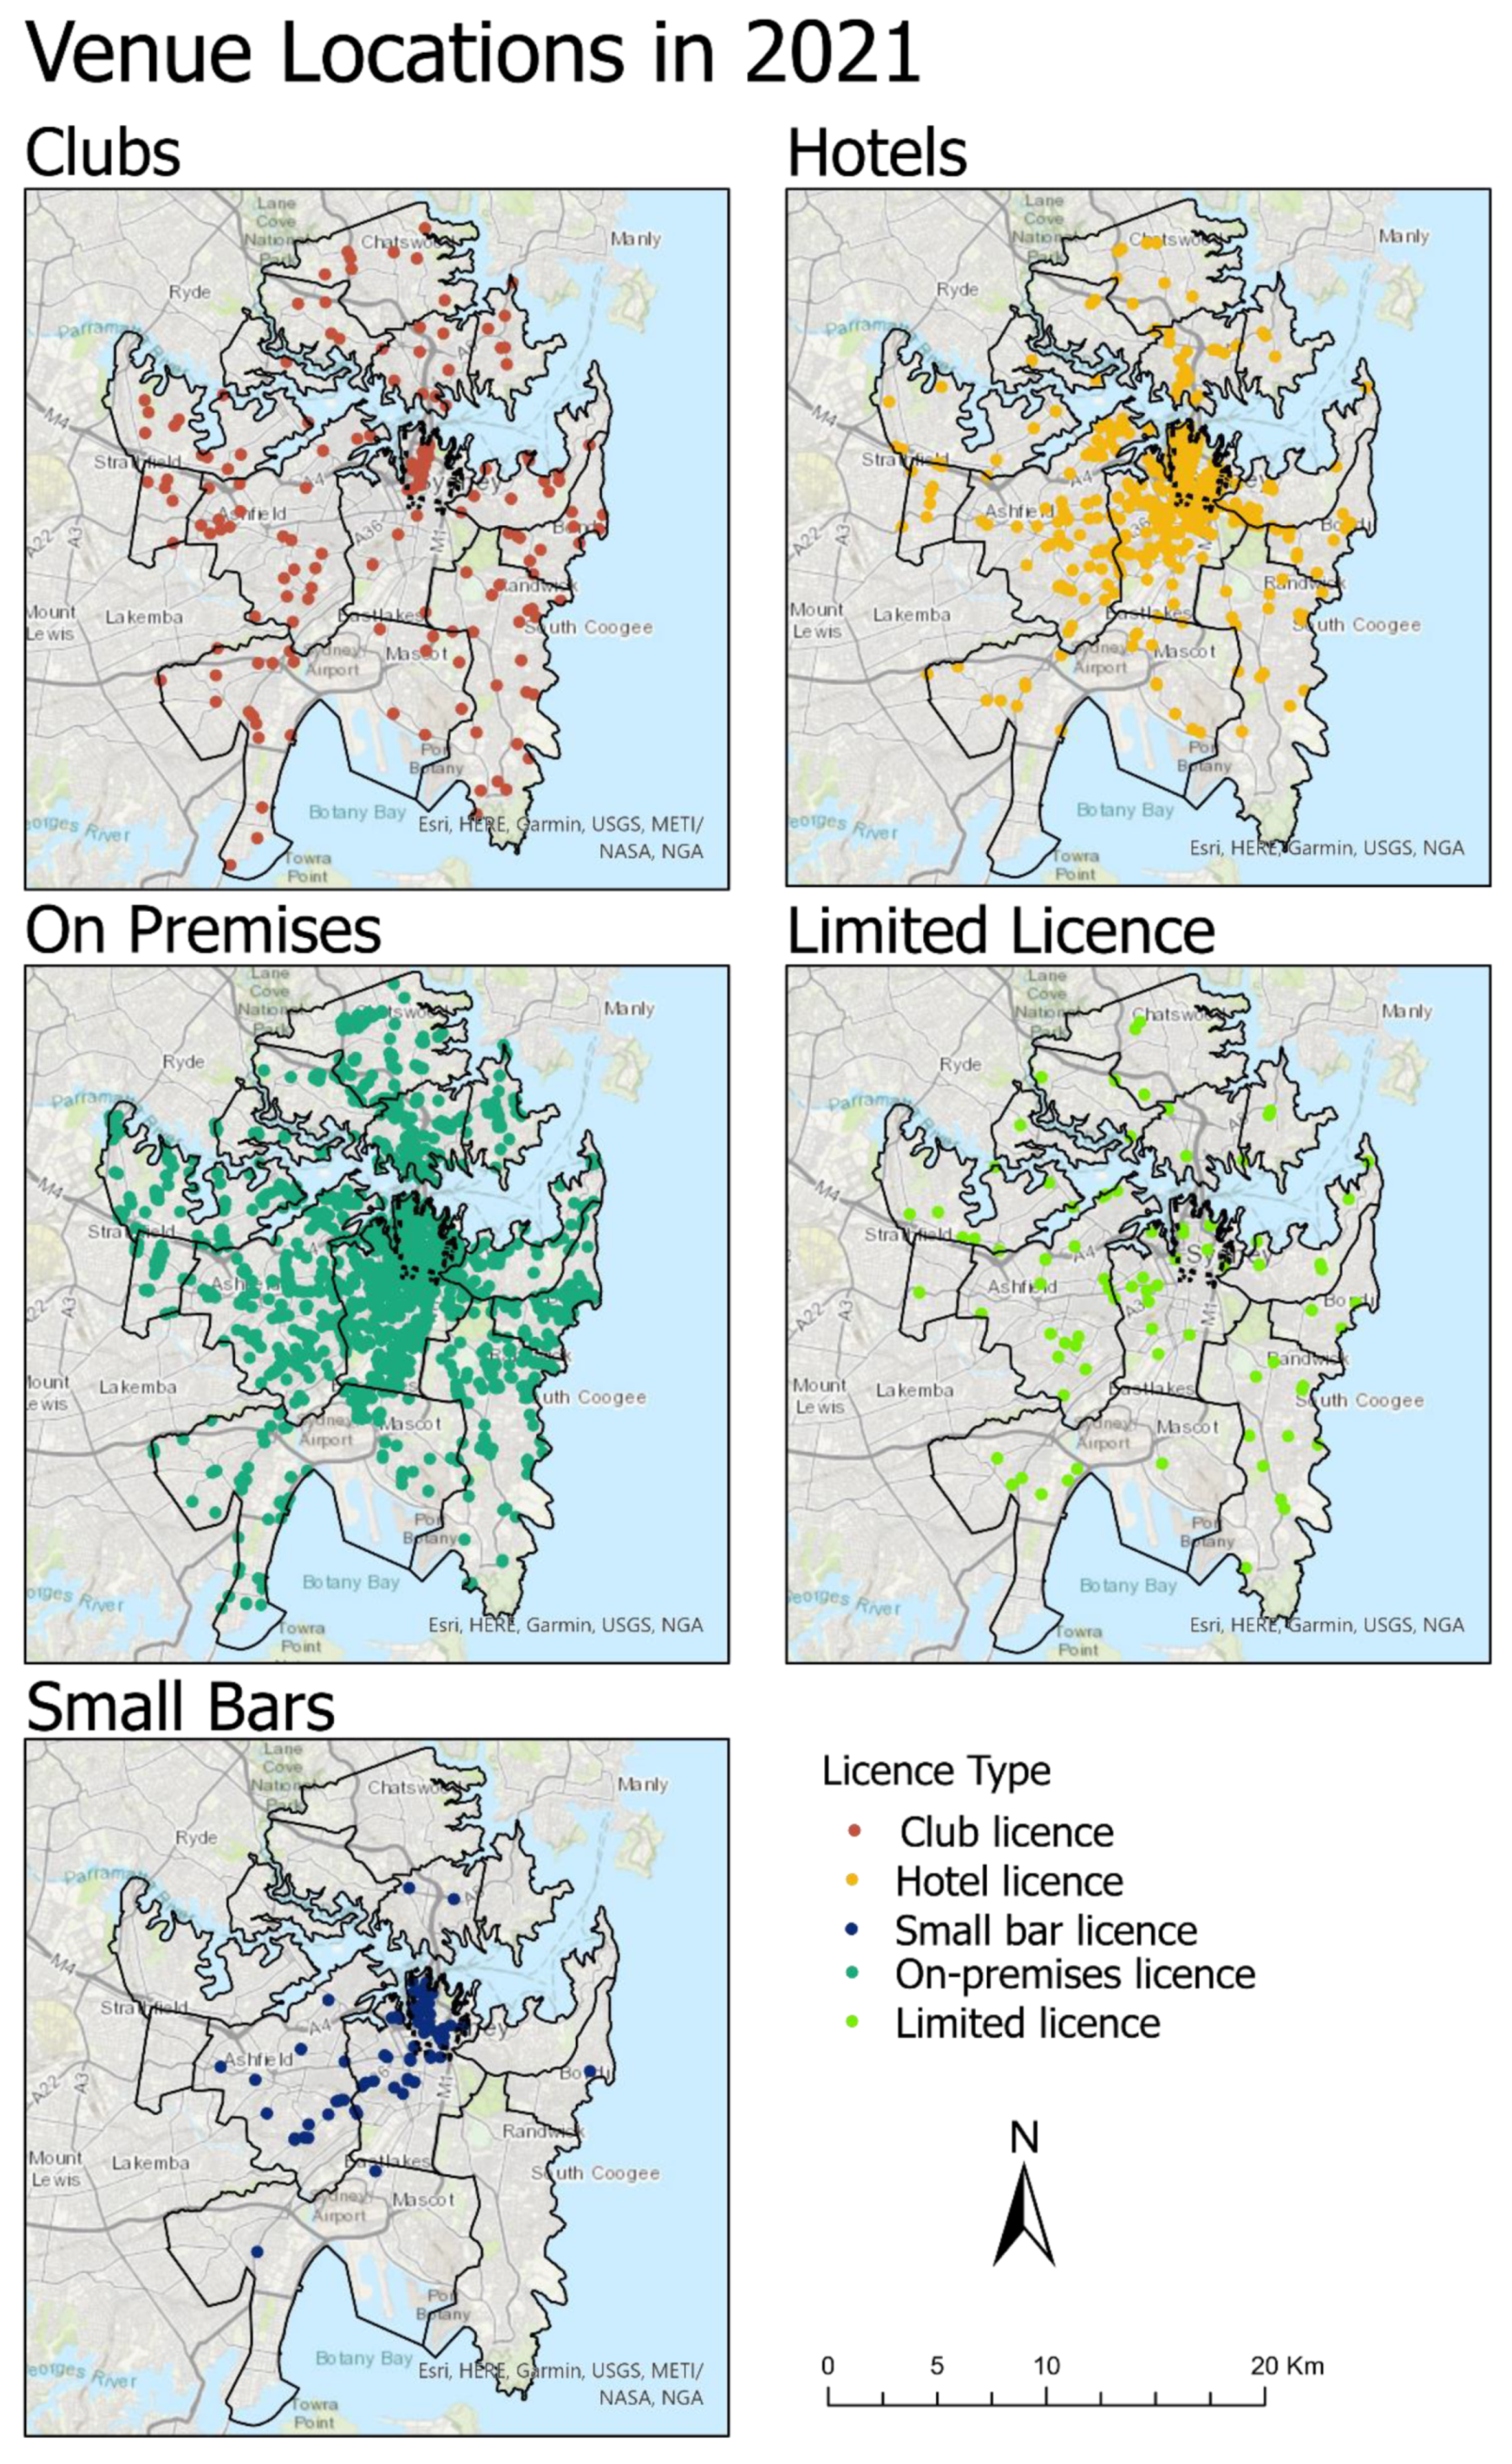
- Club Licence, Hotel Licence, On-Premises Licence, Limited Licence, Small Bar Licence.
- NSW Administrative Boundary Data, which consists of a collection of legislative, regulatory, political, maritime and general administrative boundaries sourced from local and state boundary datasets within NSW [79].
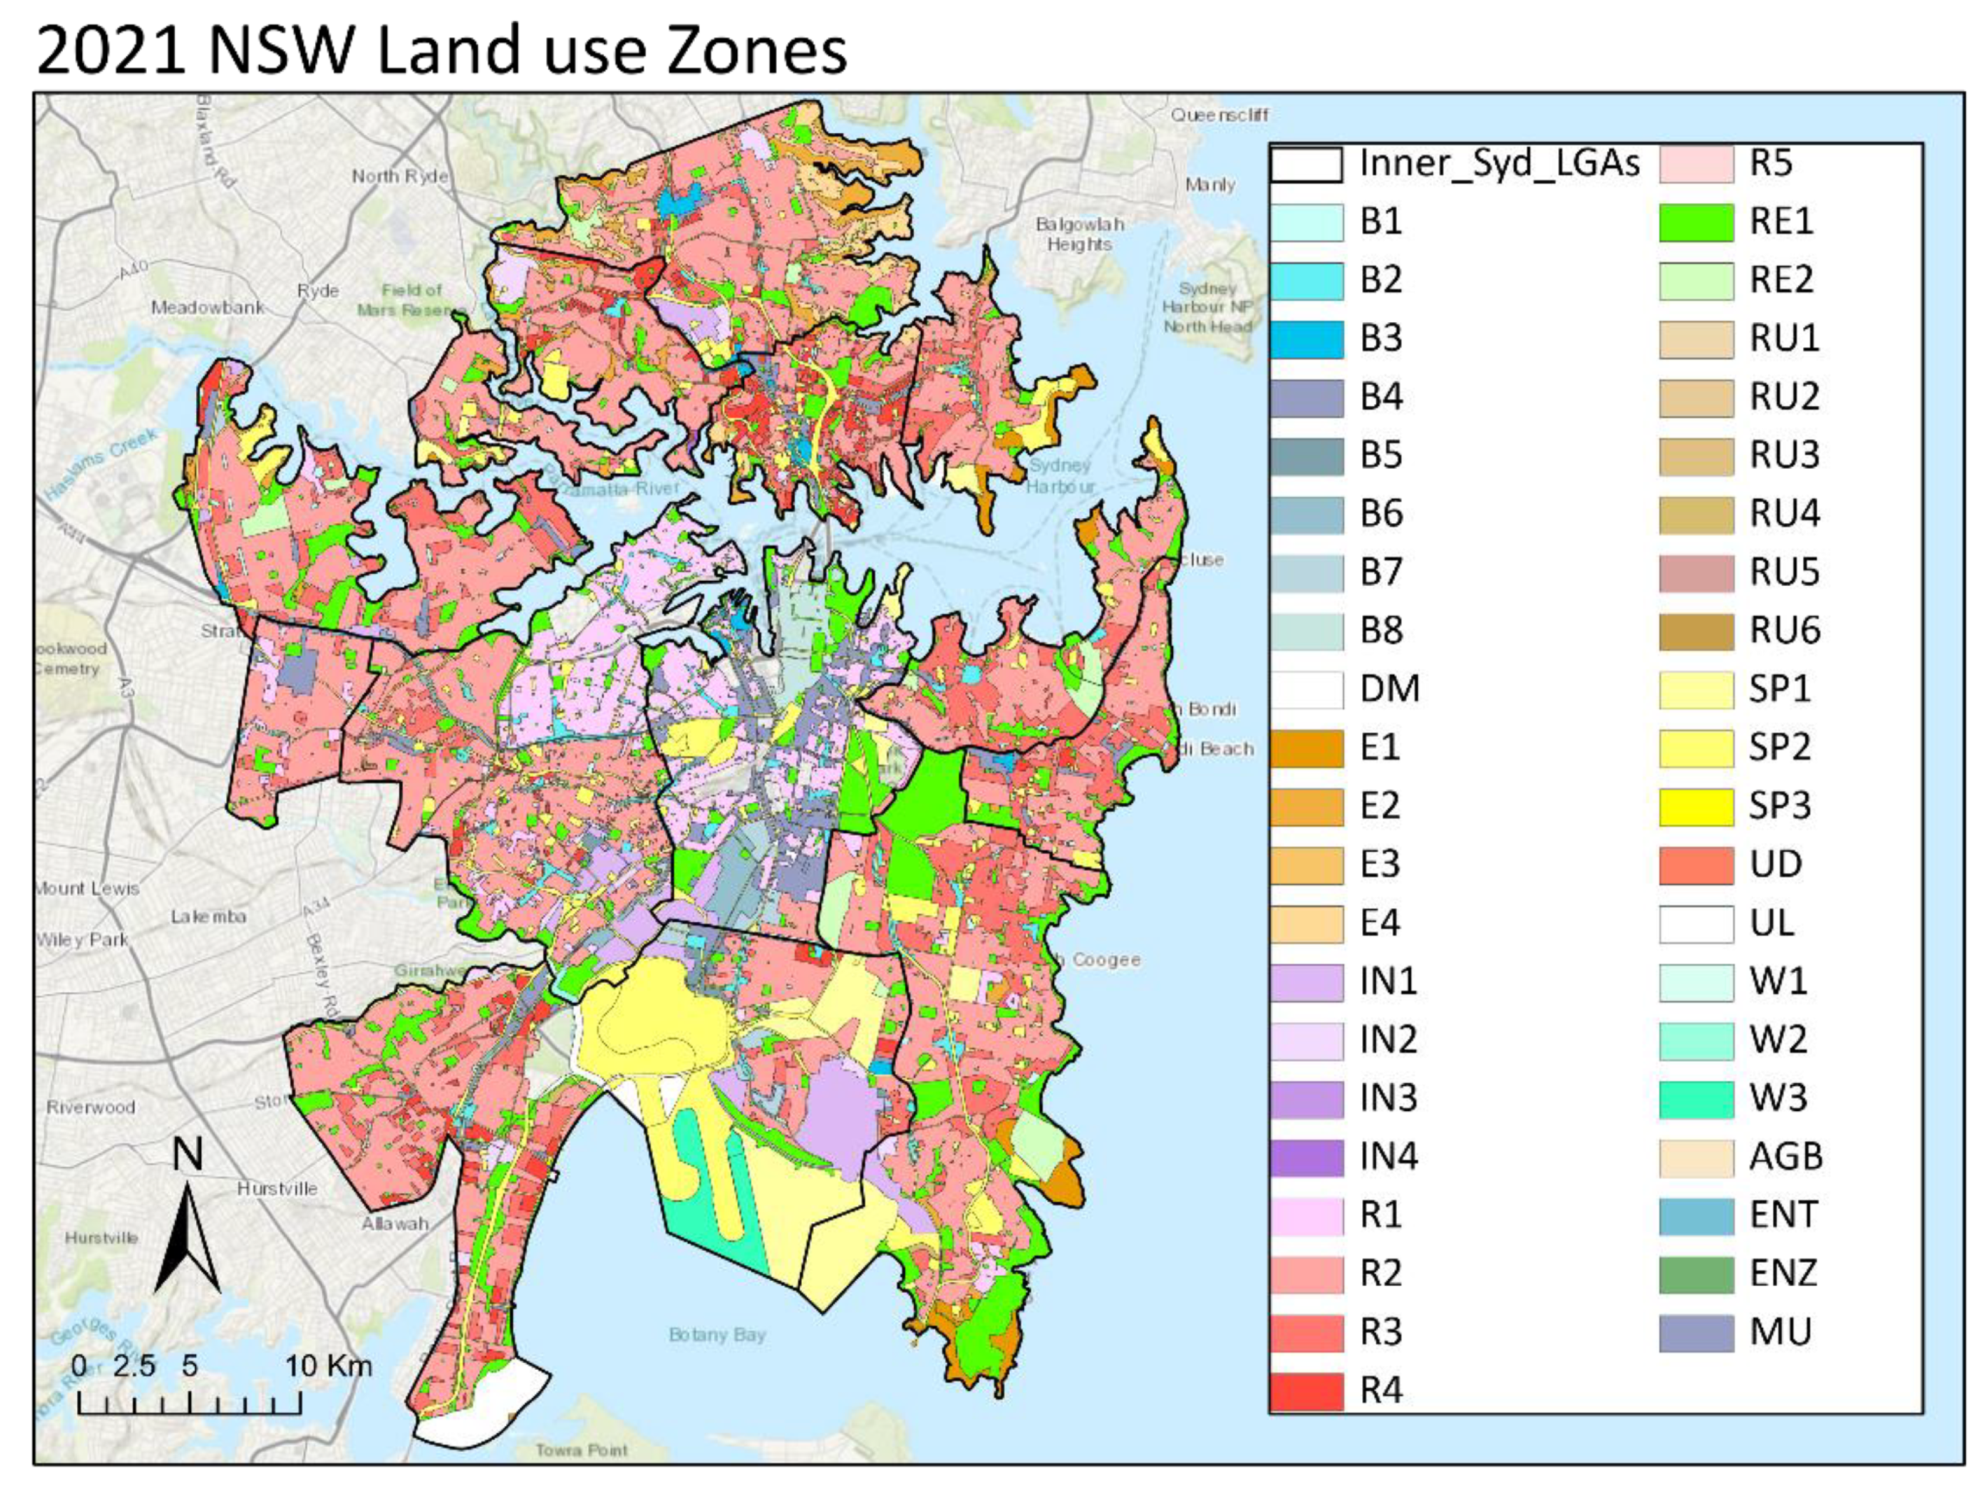
- NSW Land Zoning Data, which identifies land use zones and the type of development that is permitted or prohibited in each zone on any given land as designated by the relevant NSW environmental planning instrument (EPI) under the Environmental Planning and Assessment Act 1979 [80]. More information on the different land use zones can be found on the NSW Government Legislation Website [81].
- Australian Bureau of Statistics (ABS) Geography Standard Data, which includes small-sized general-purpose area polygons, employed by the ABS to assist in the collation of census and other data [82].
2.3. Data Preparation
2.4. Spatial Analysis
2.4.1. Point Pattern Analysis
2.4.2. Spatial Autocorrelation: Getis–Ord Gi*
2.5. Spatio-Temporal Analysis
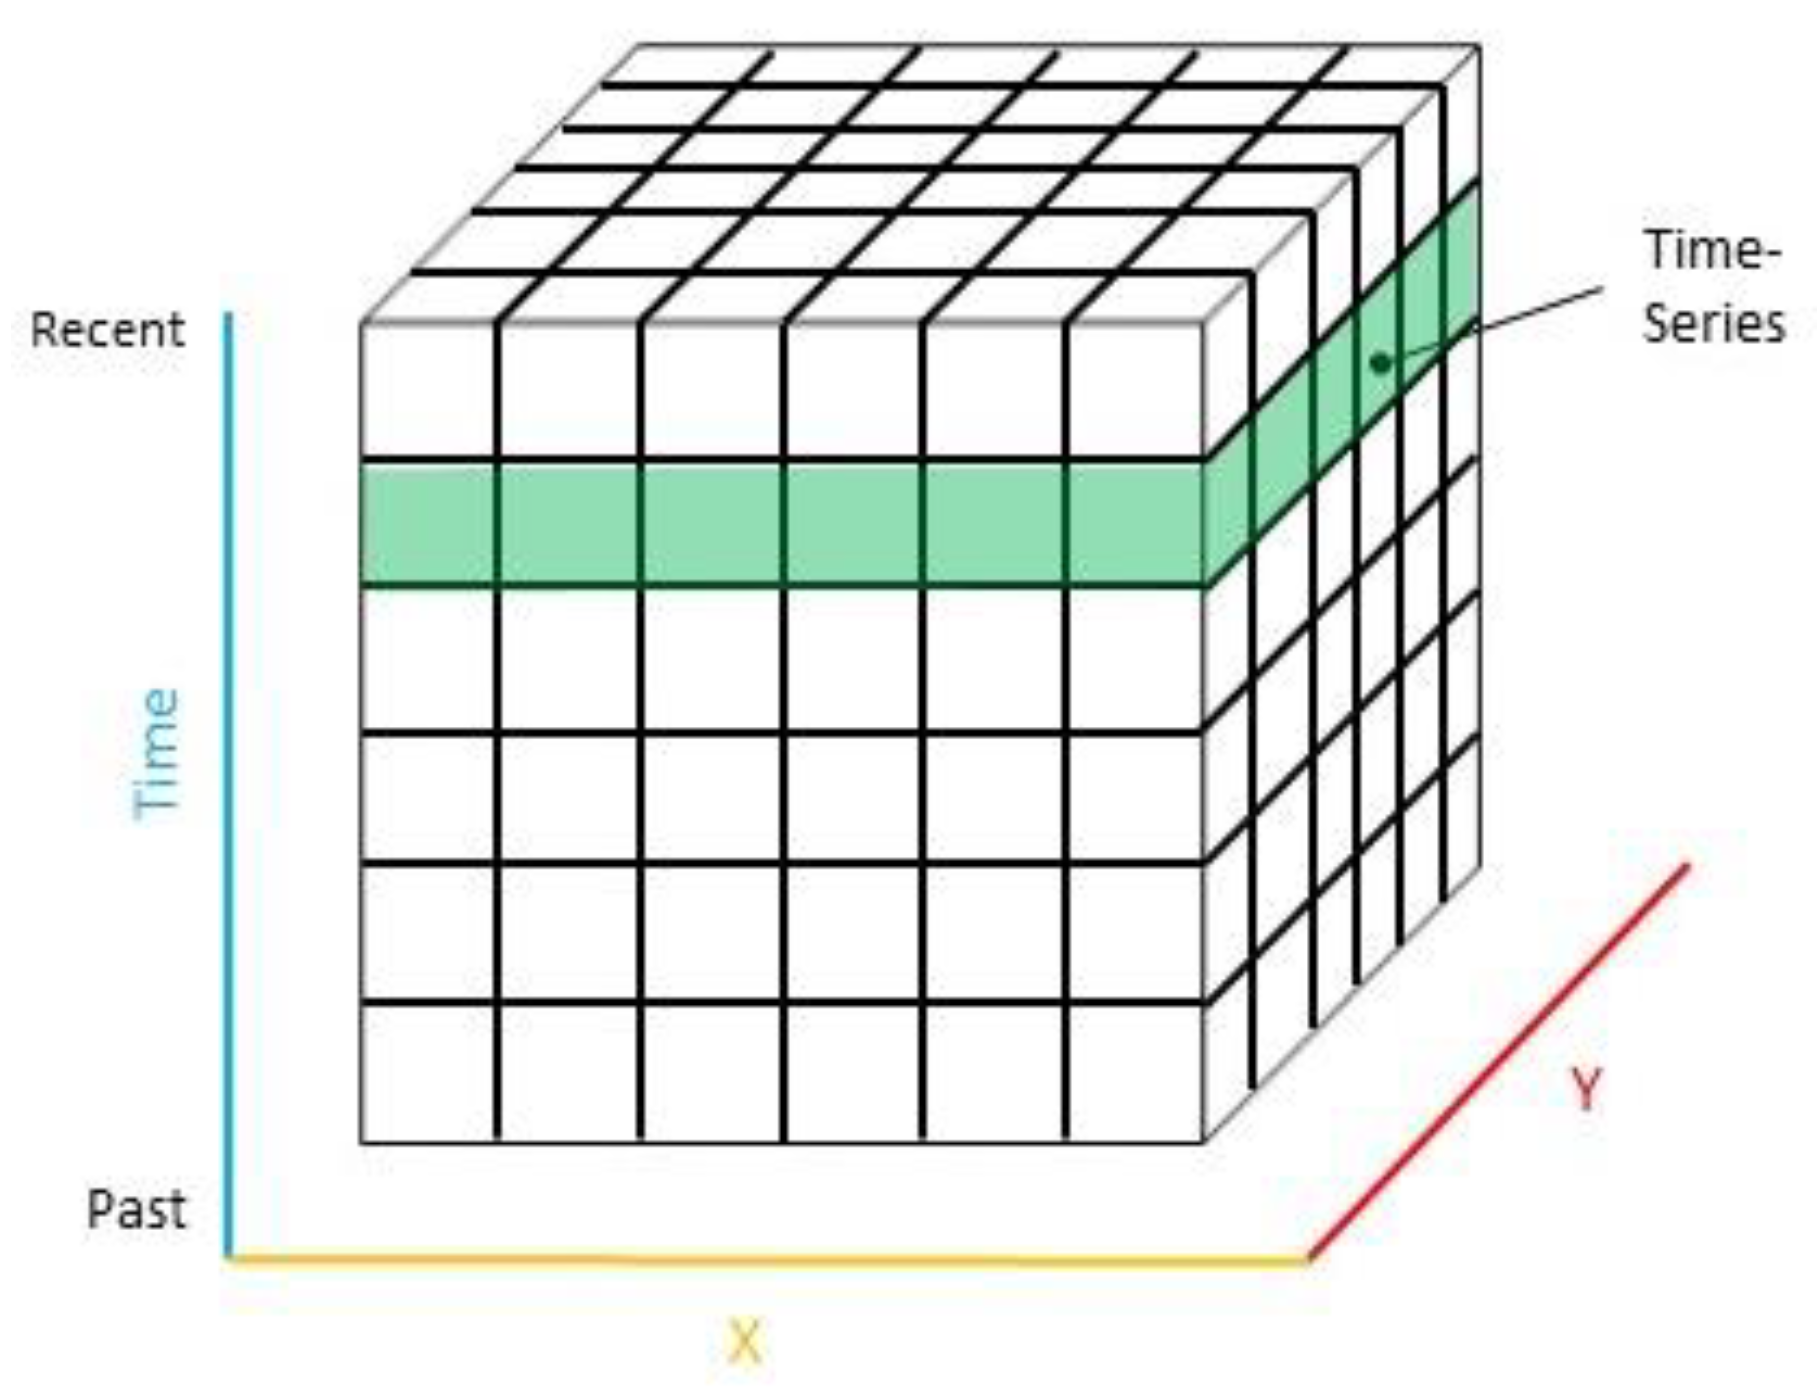
2.5.1. Space-Time Cube
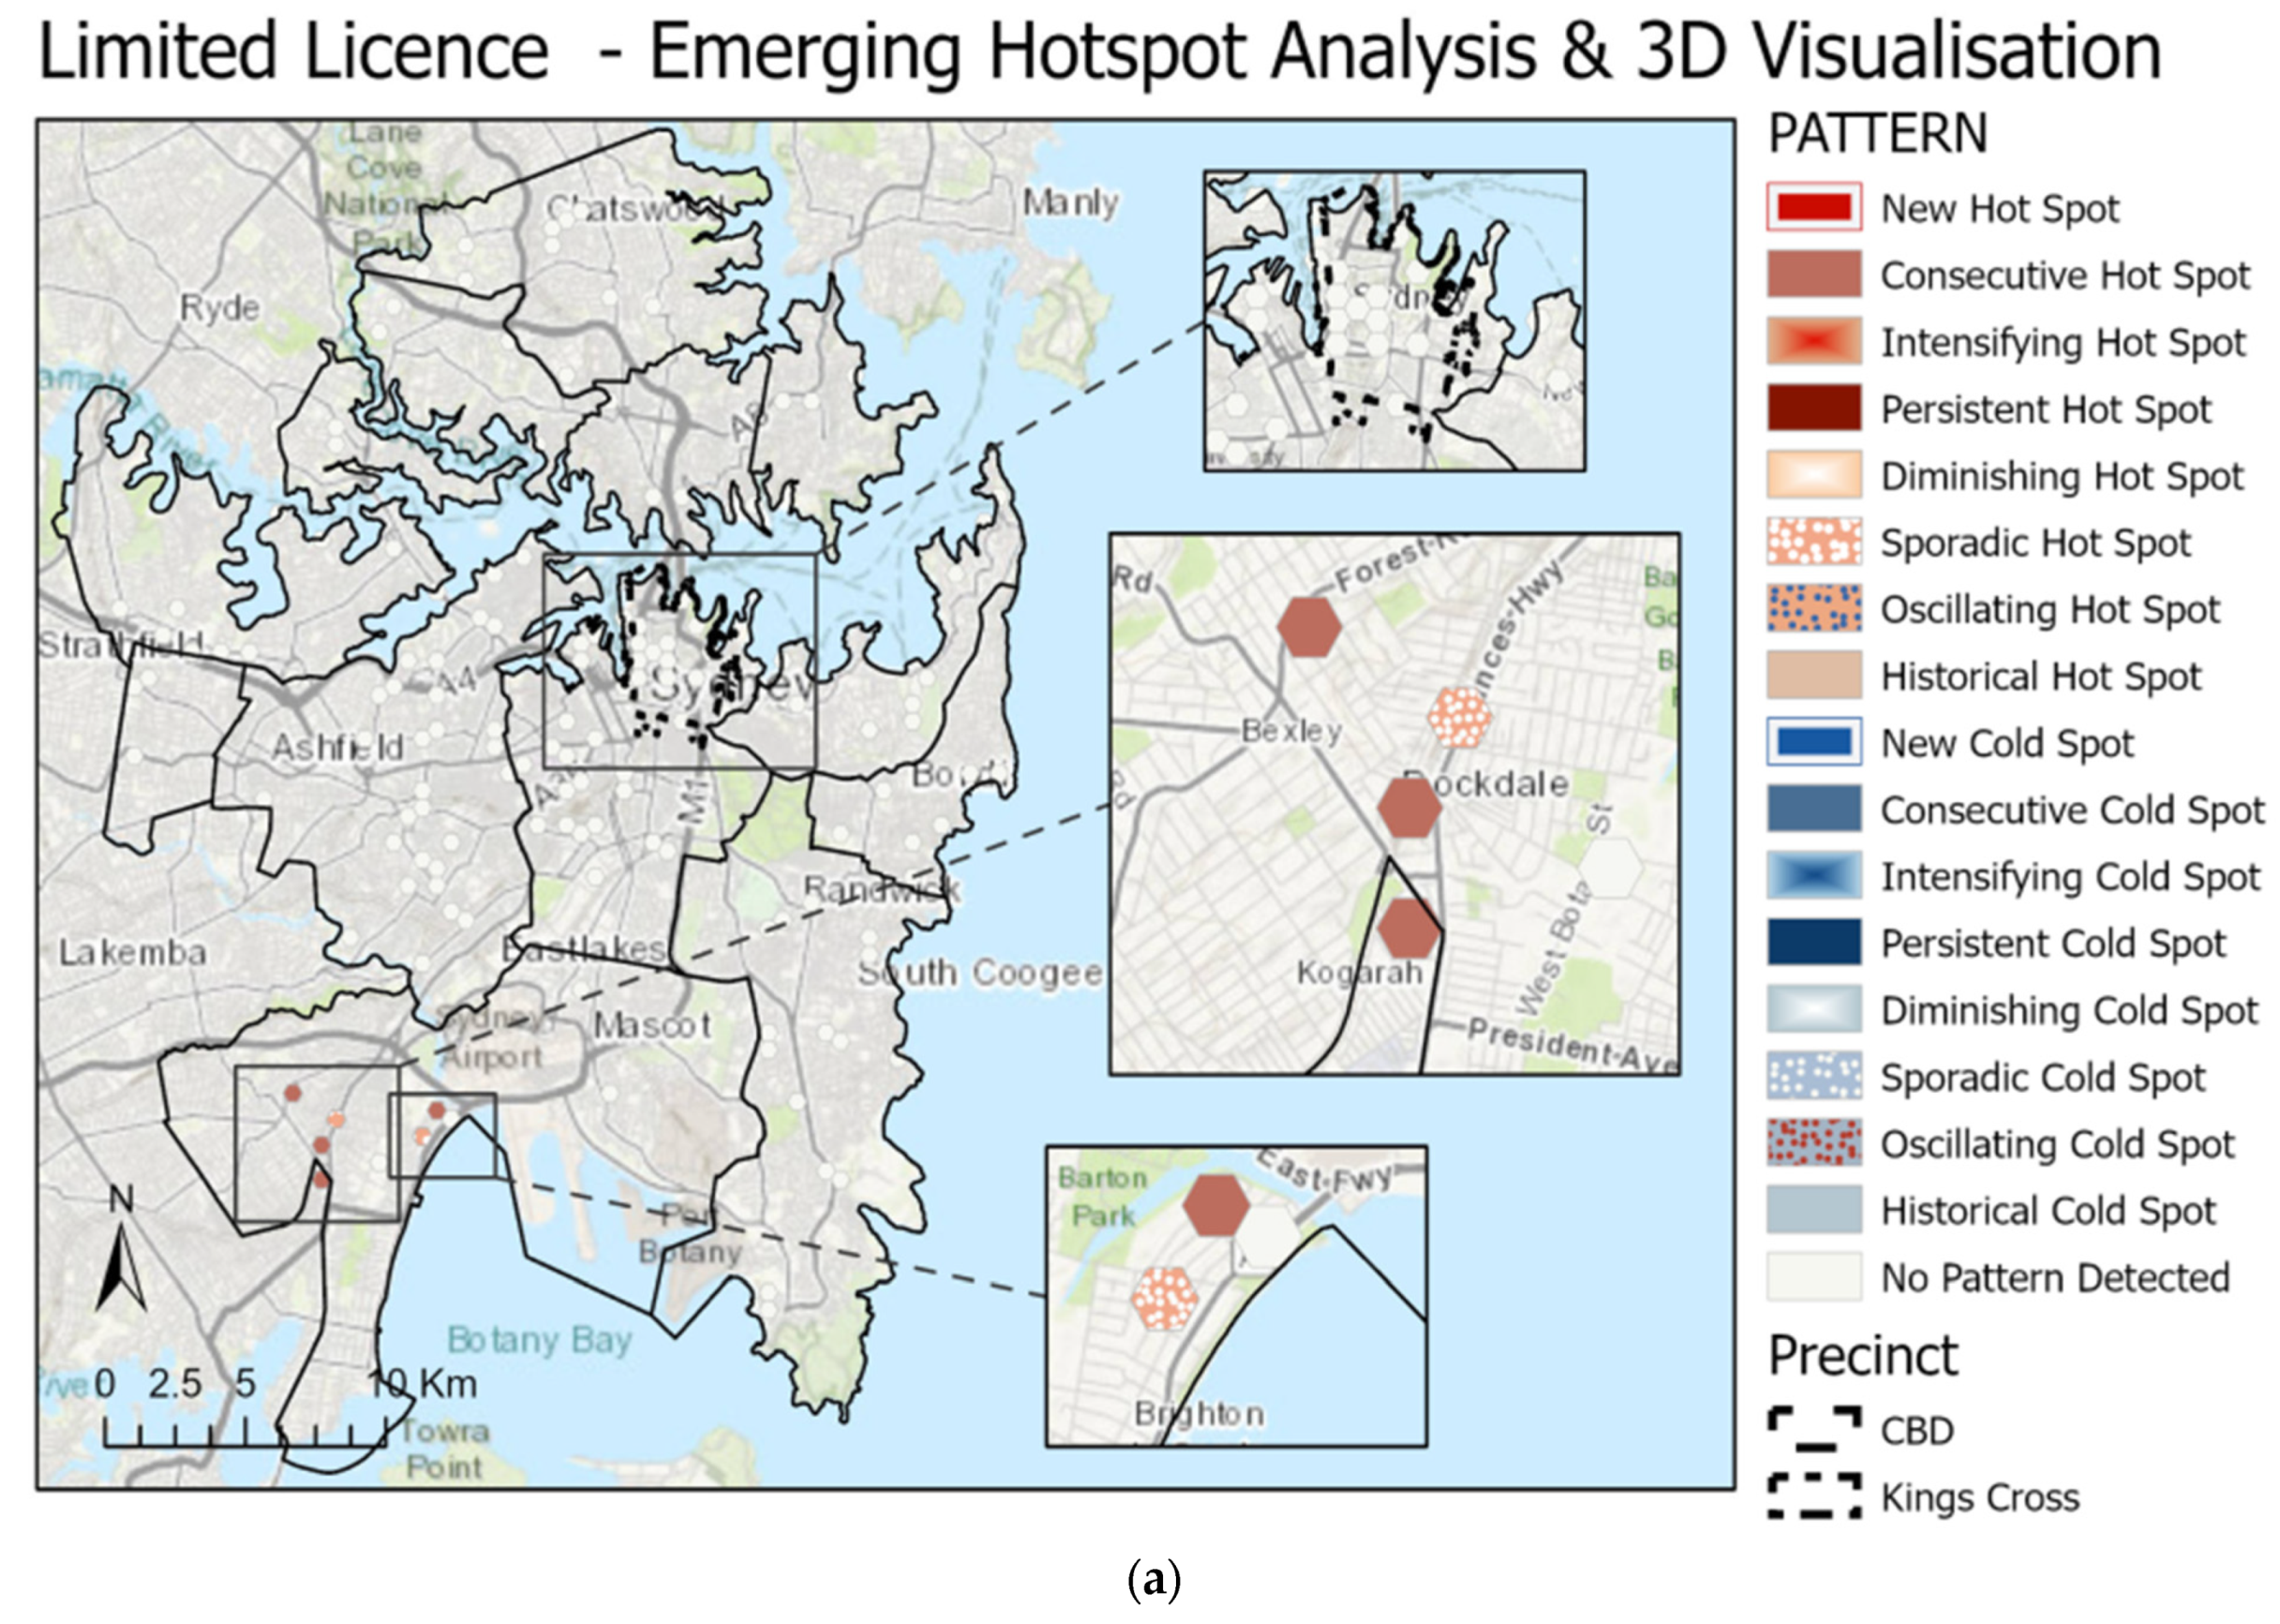
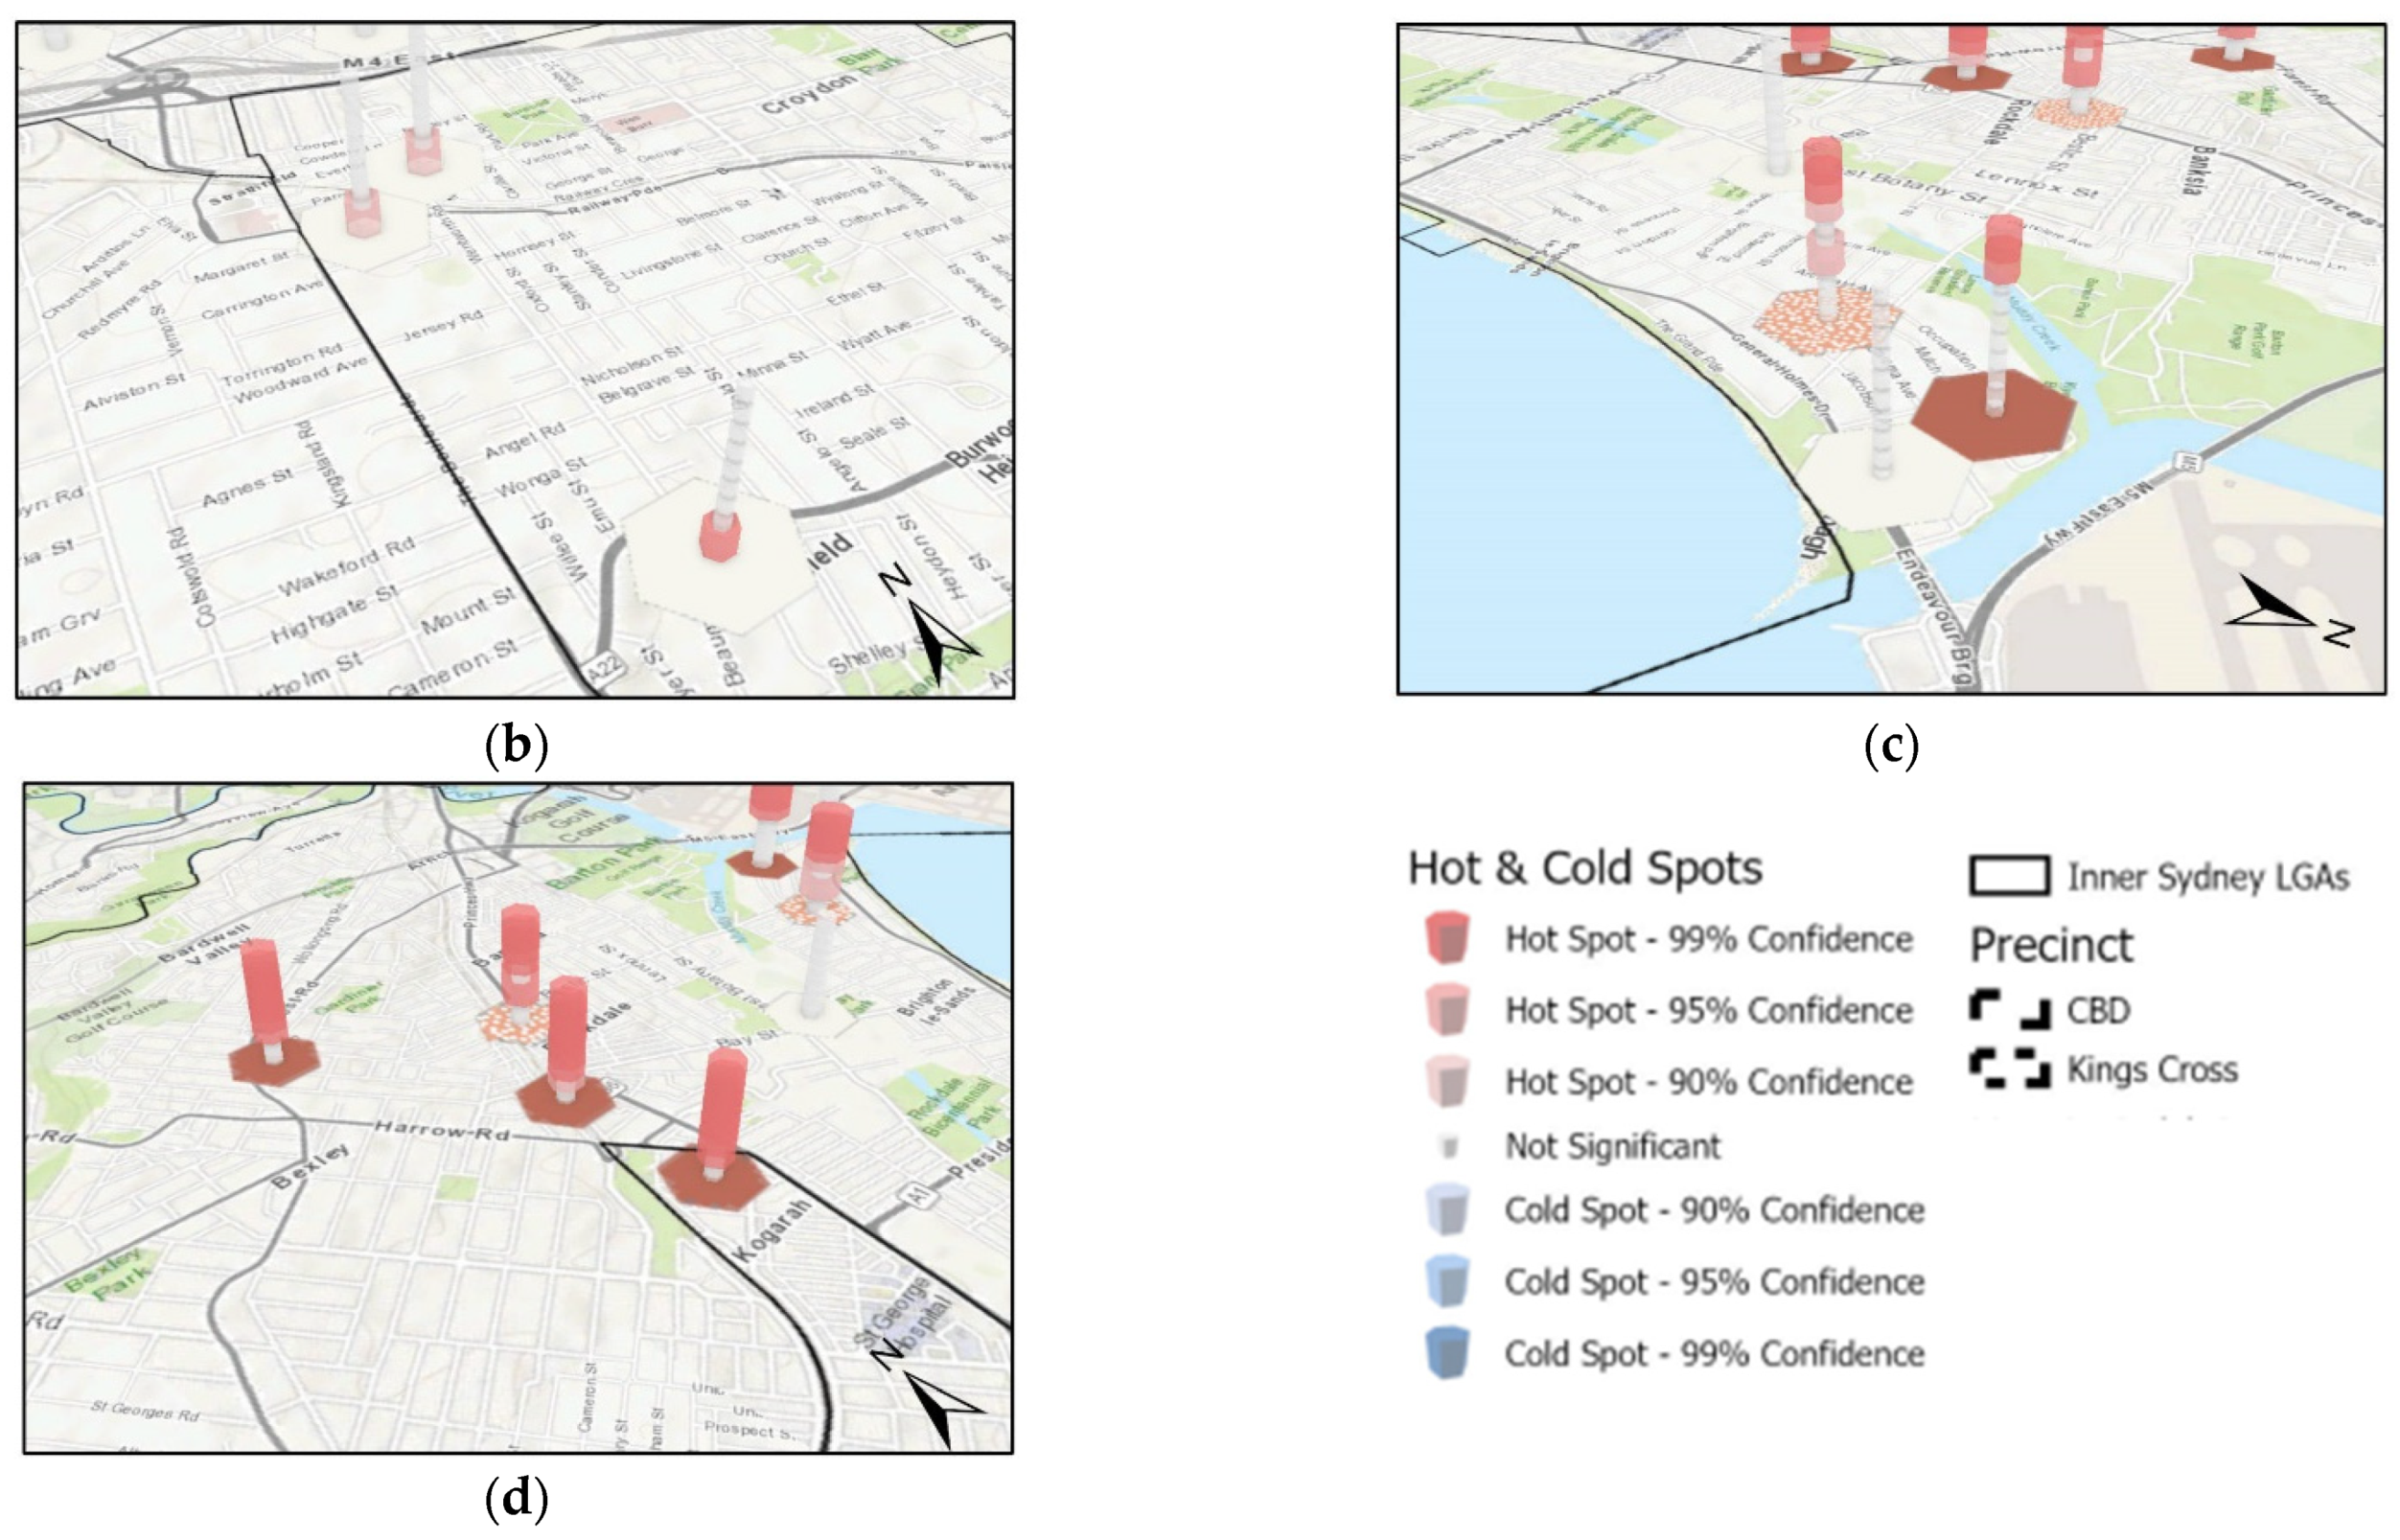
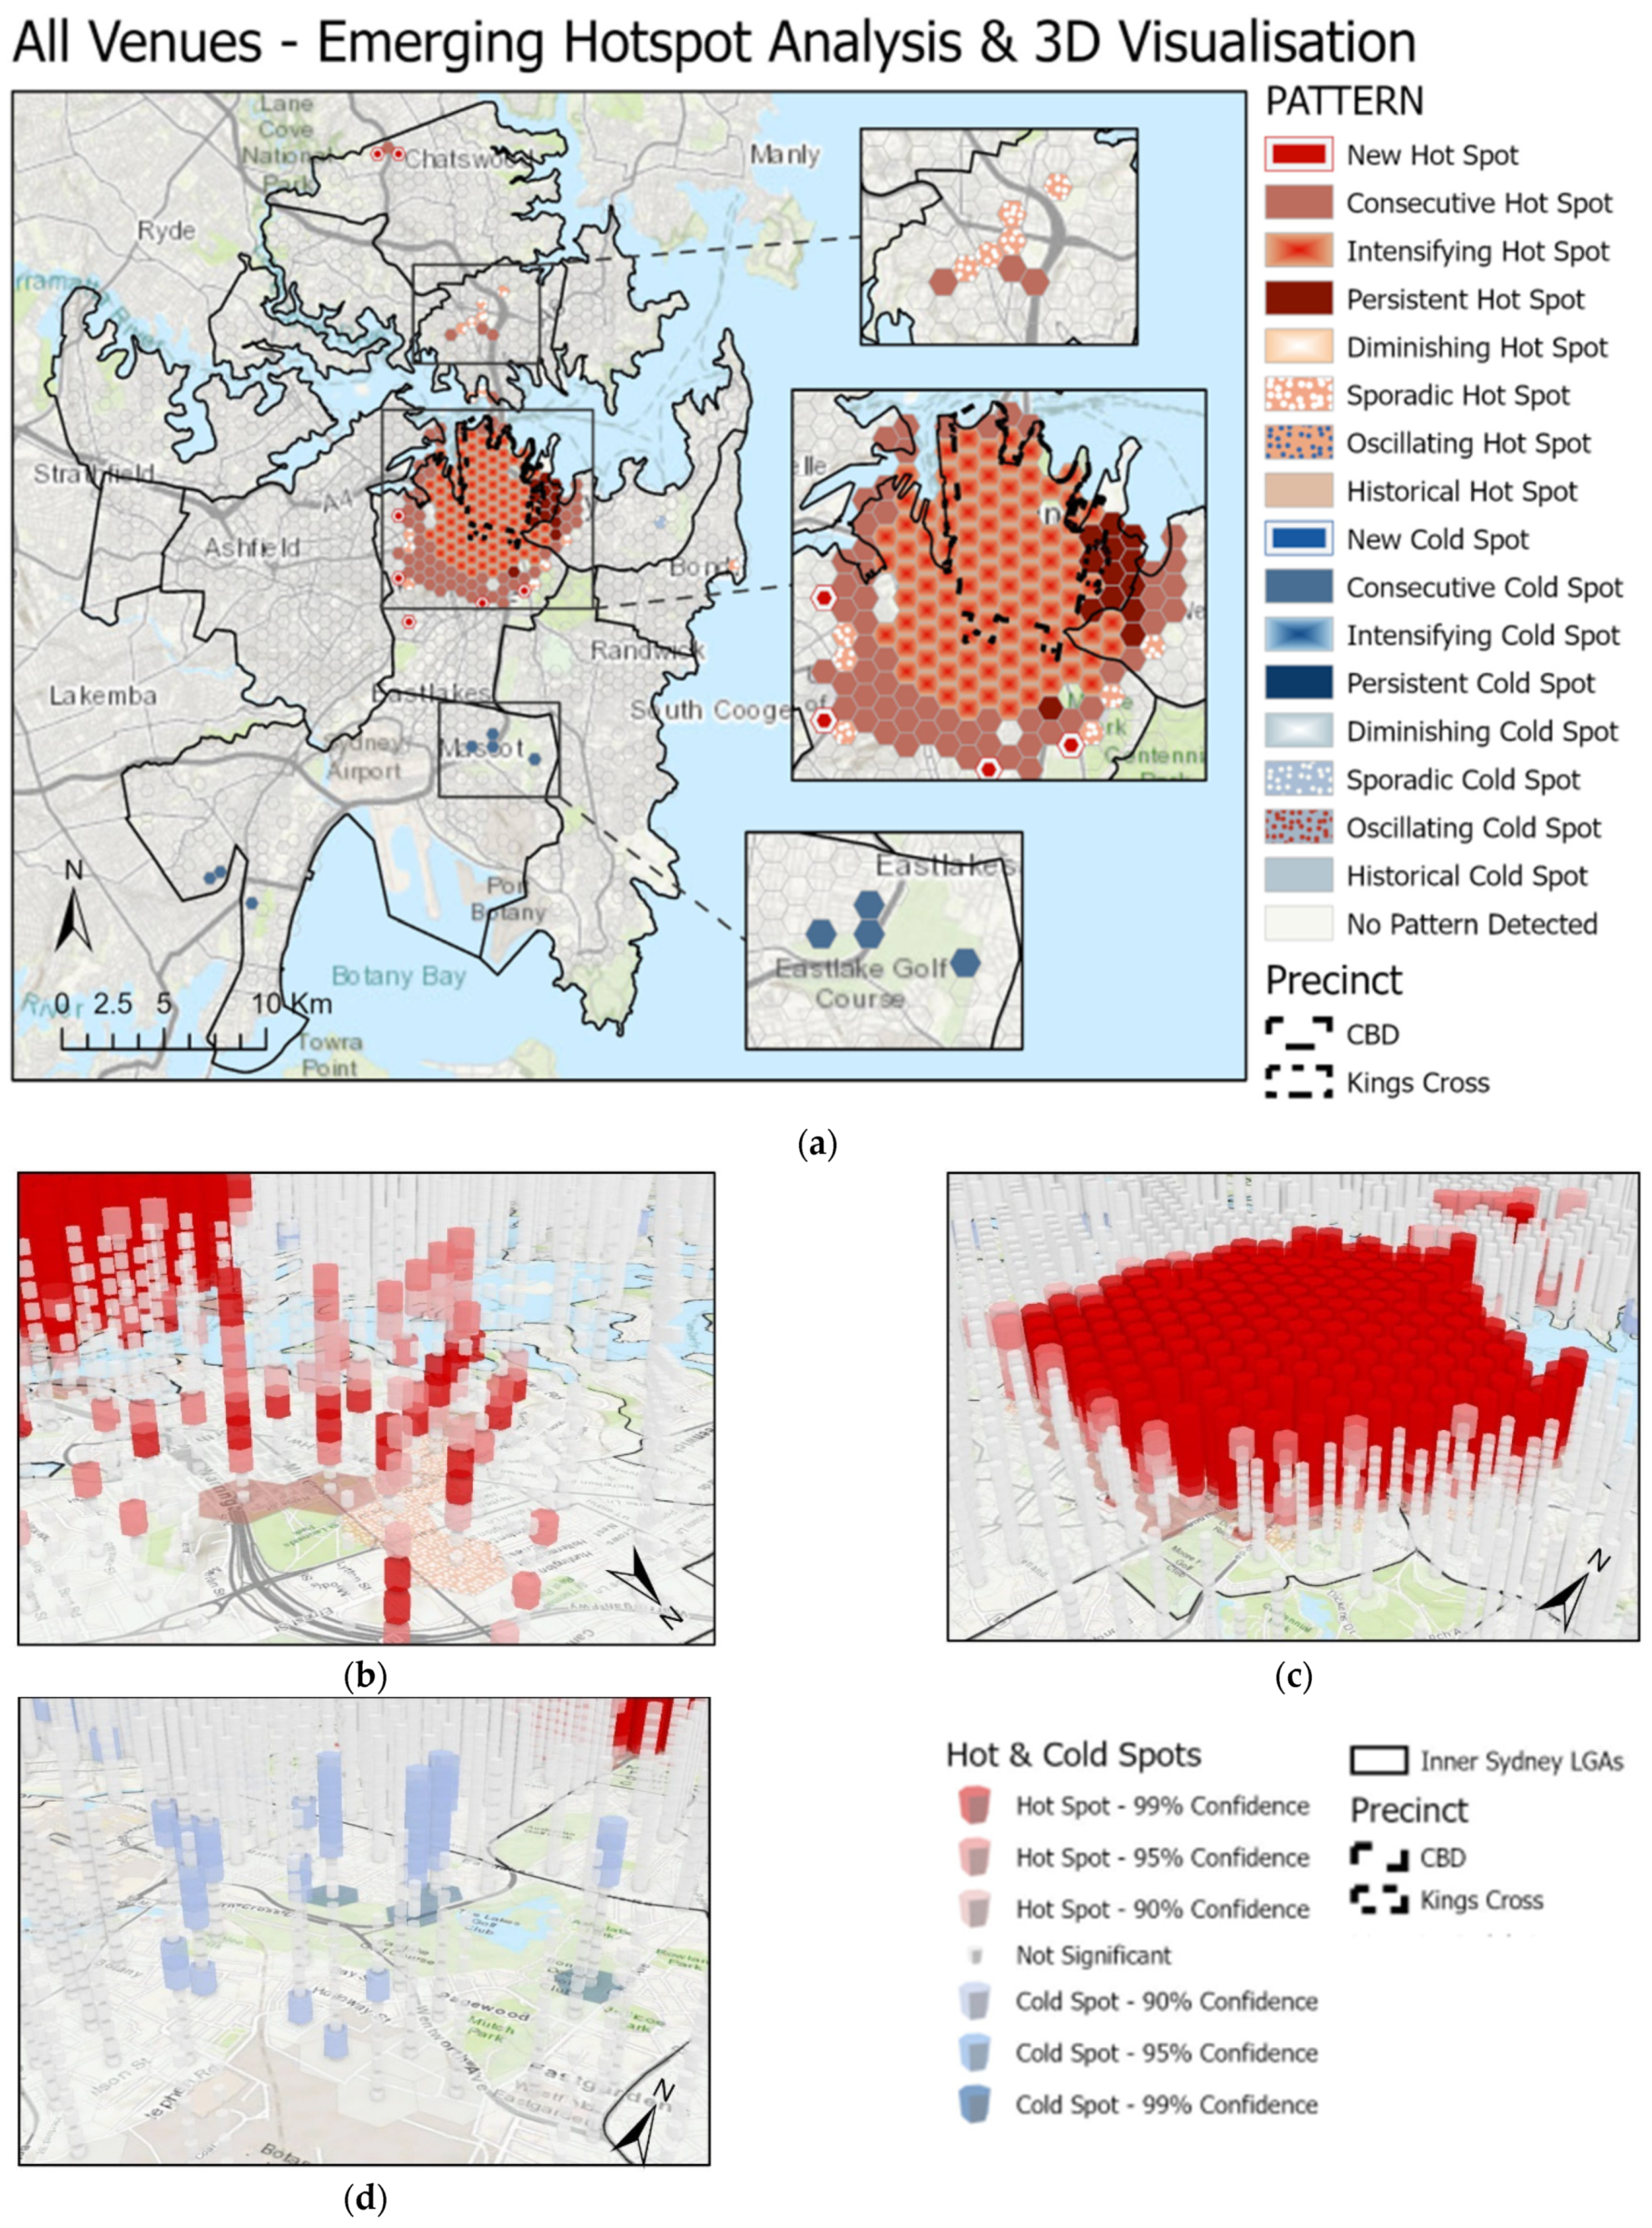
2.5.2. Emerging Hotspot Analysis
2.6. Venues Temporarily Ceased Trading
2.7. Interactive Display
3. Results
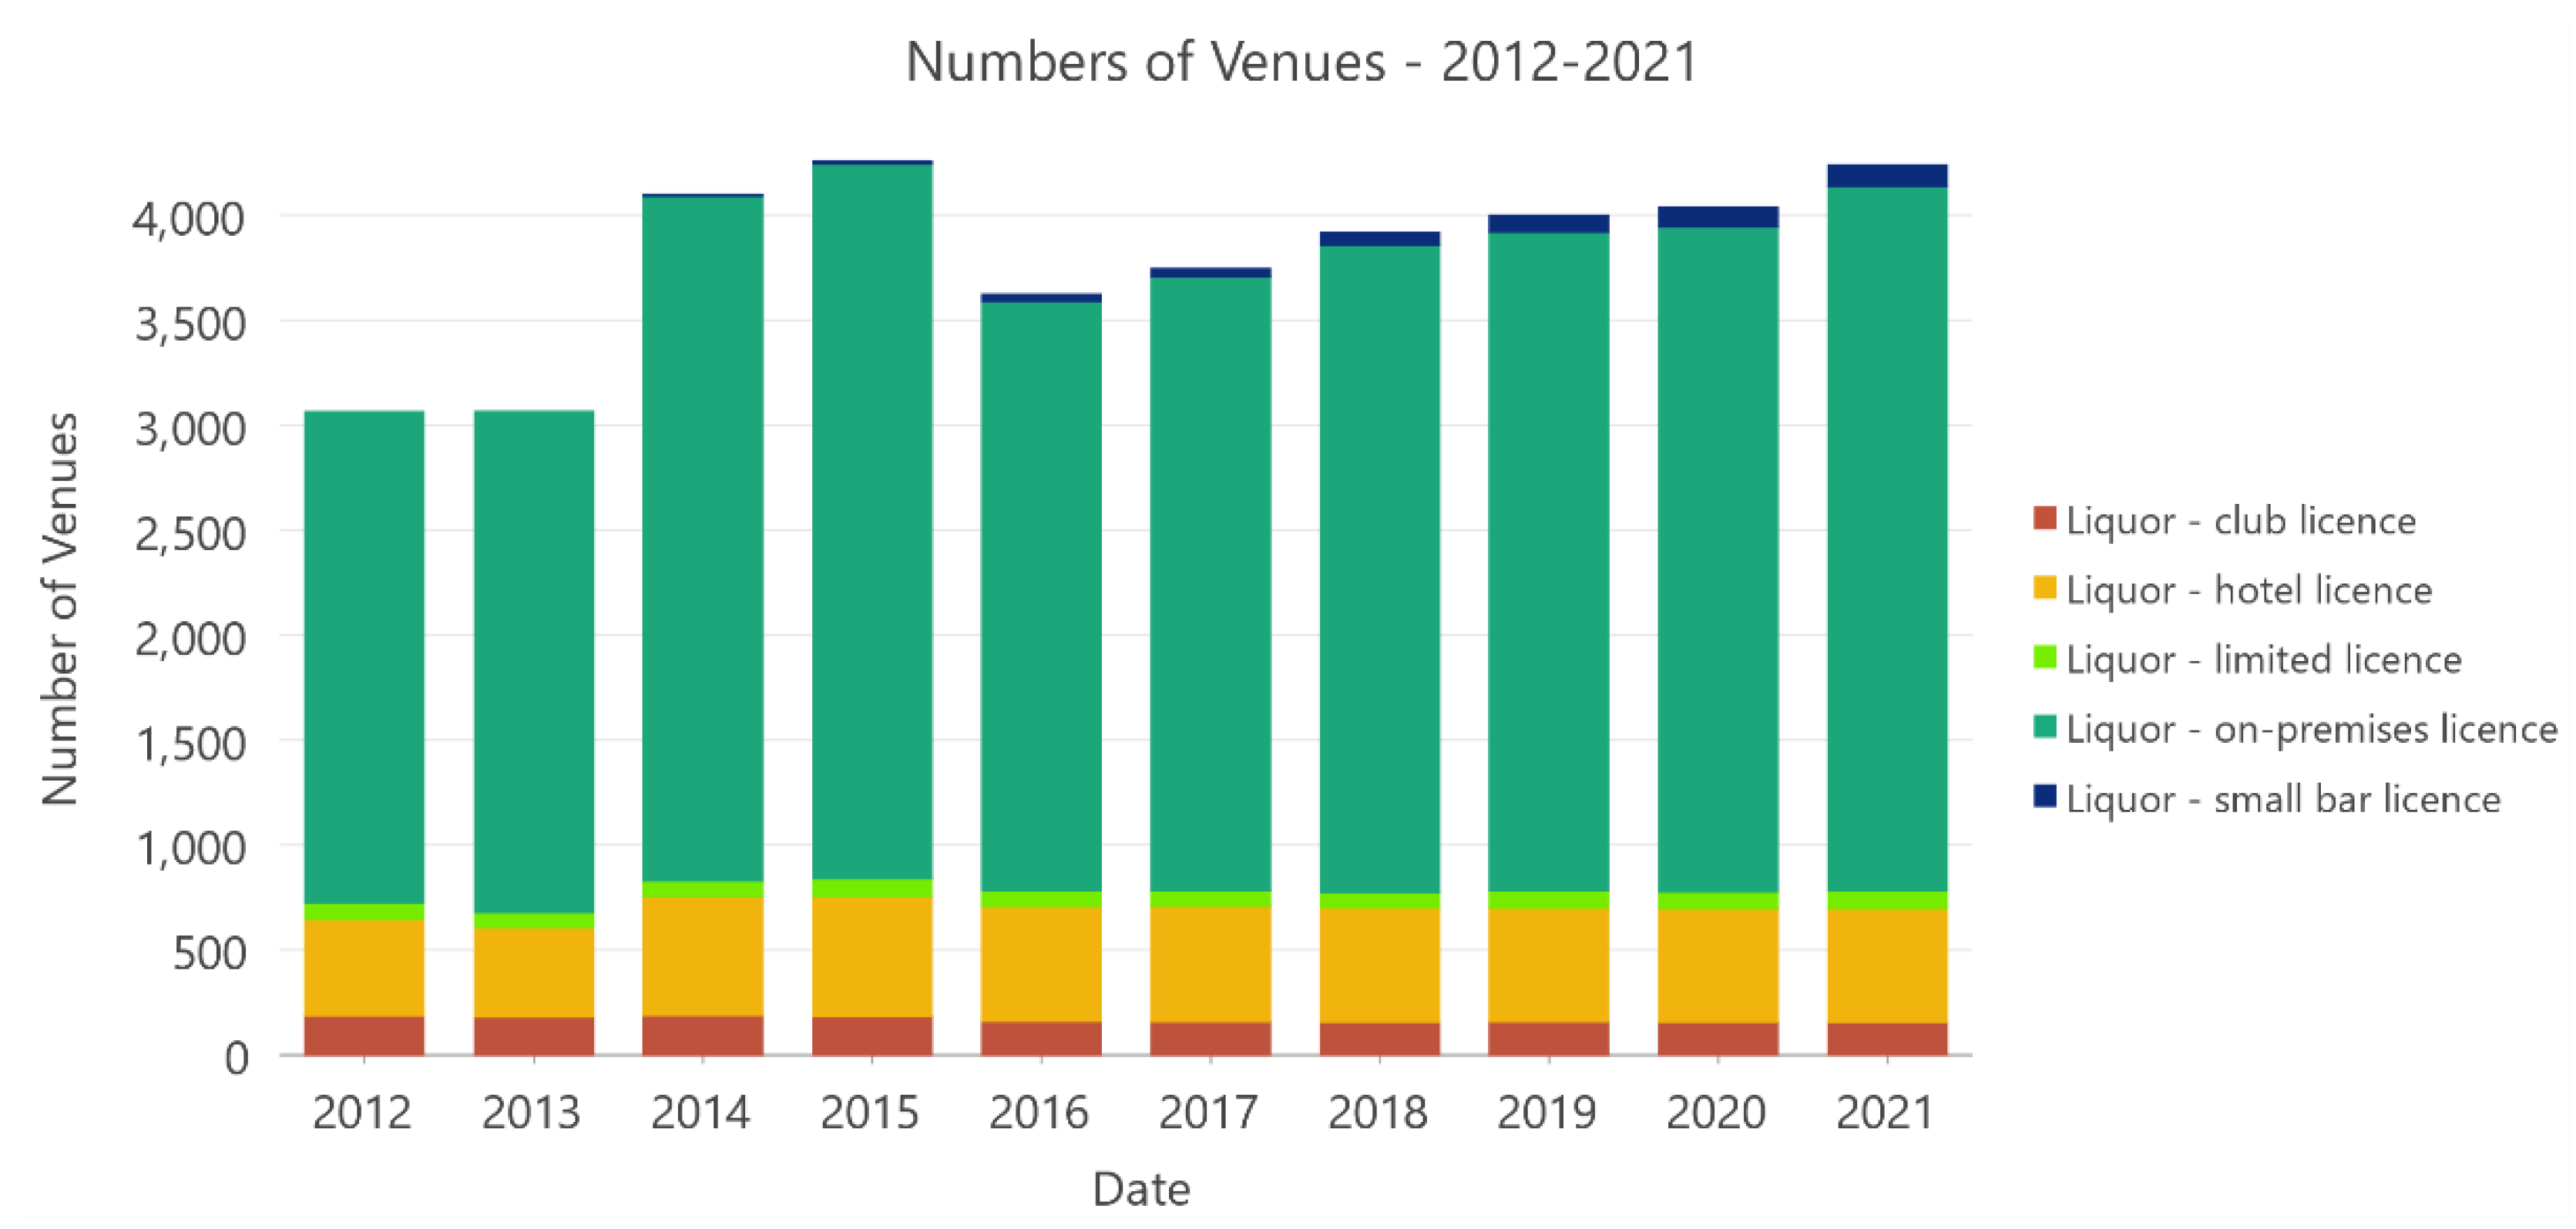
3.1. Data Summary
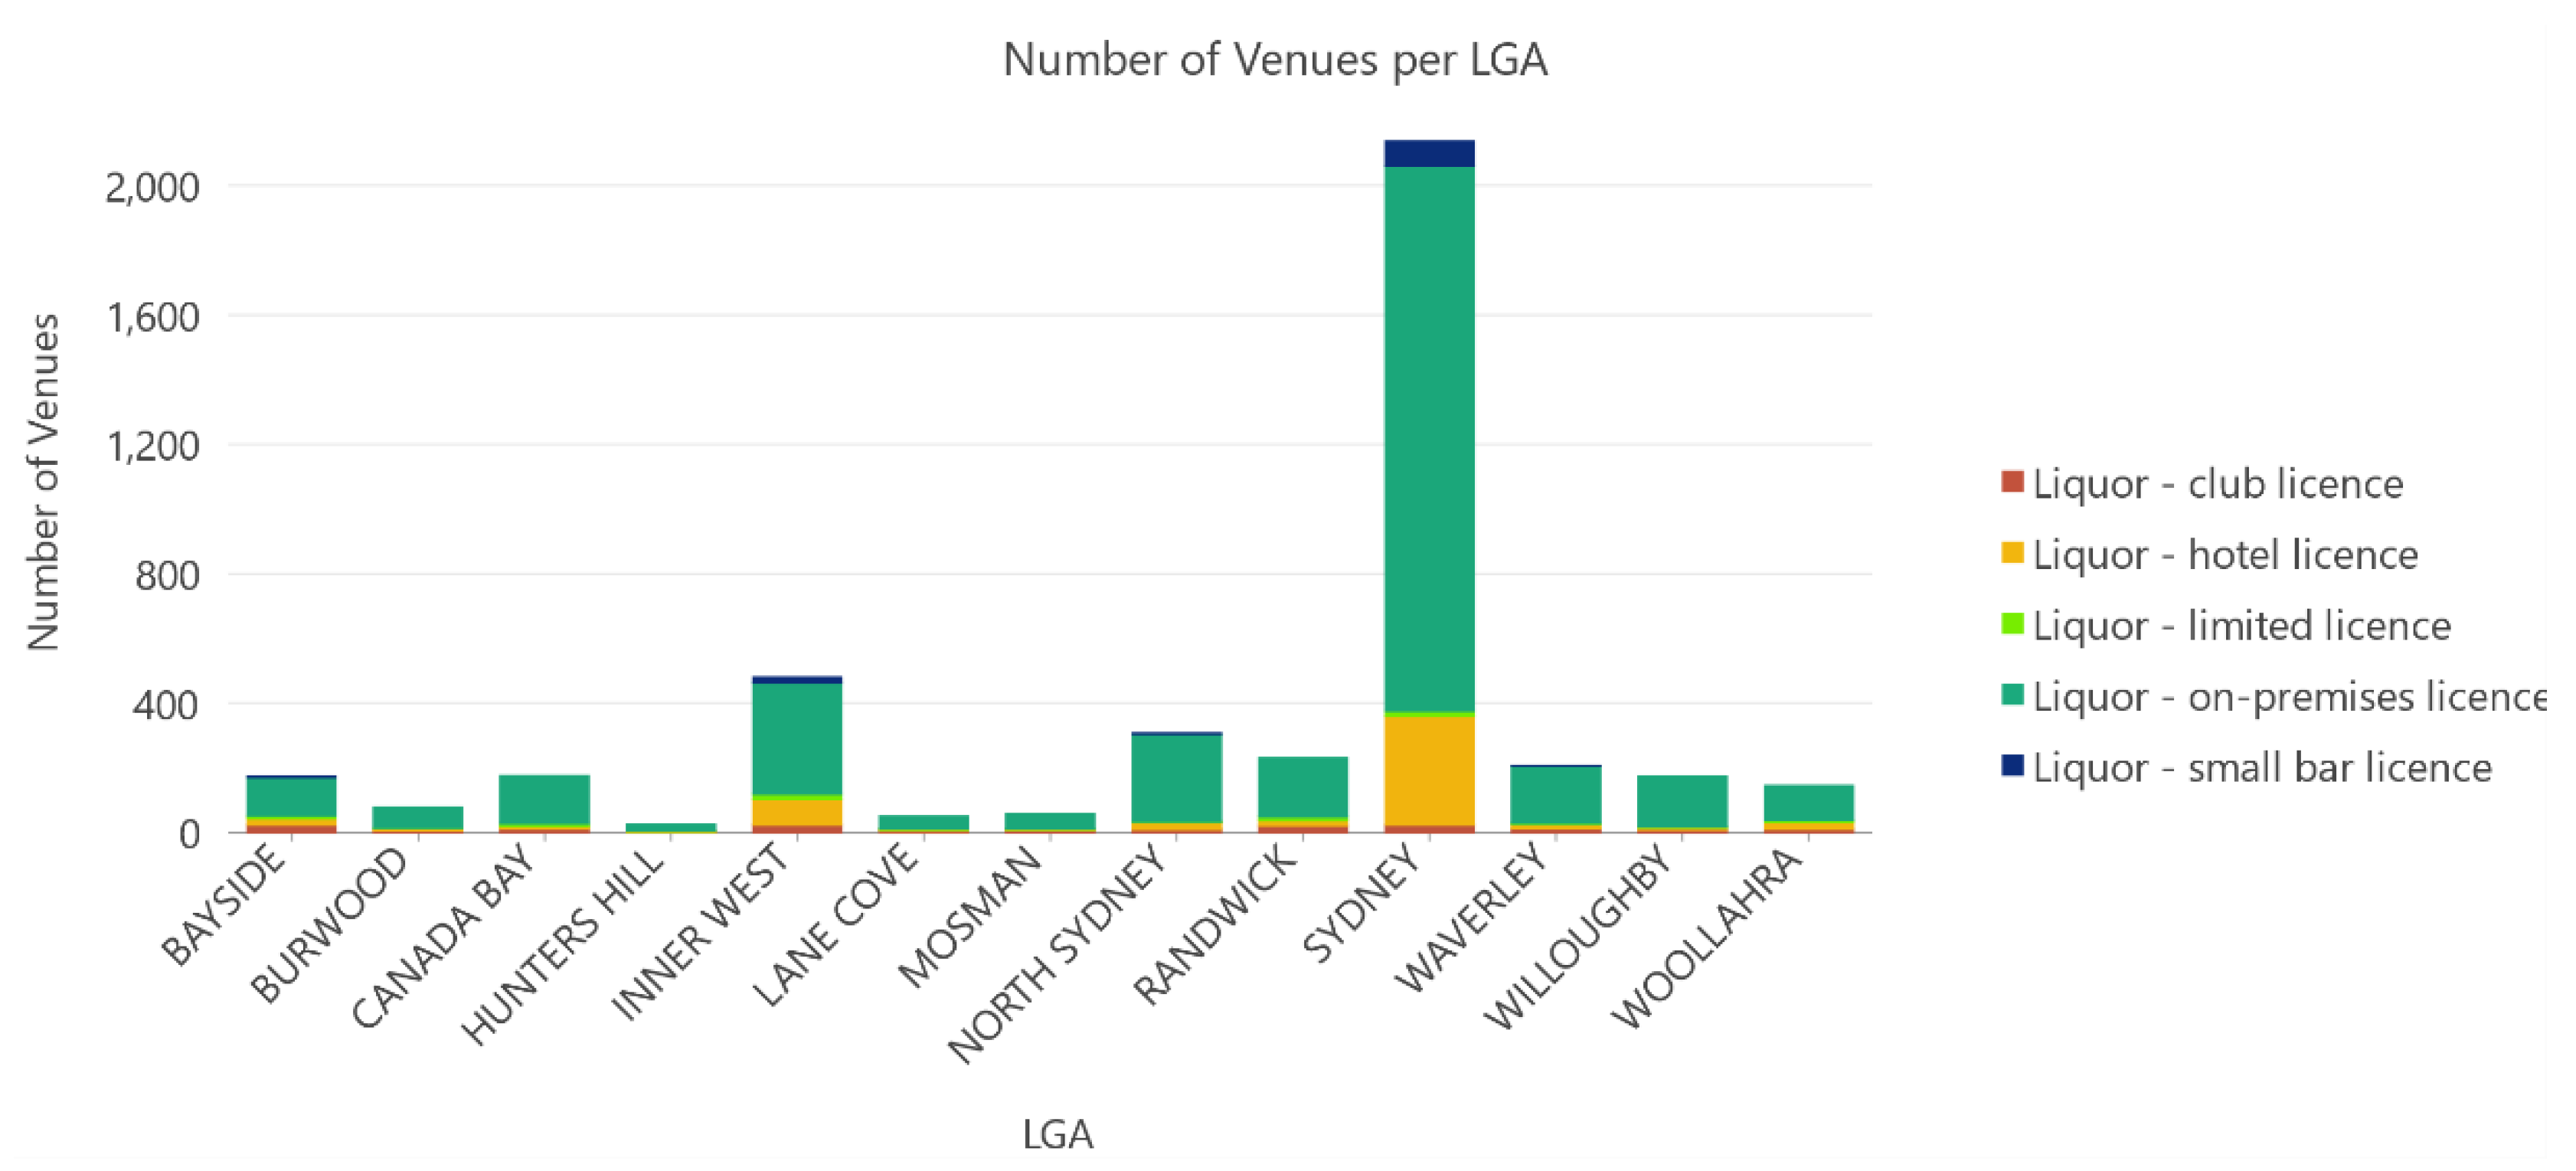
3.1.1. Licensed Venues per LGA
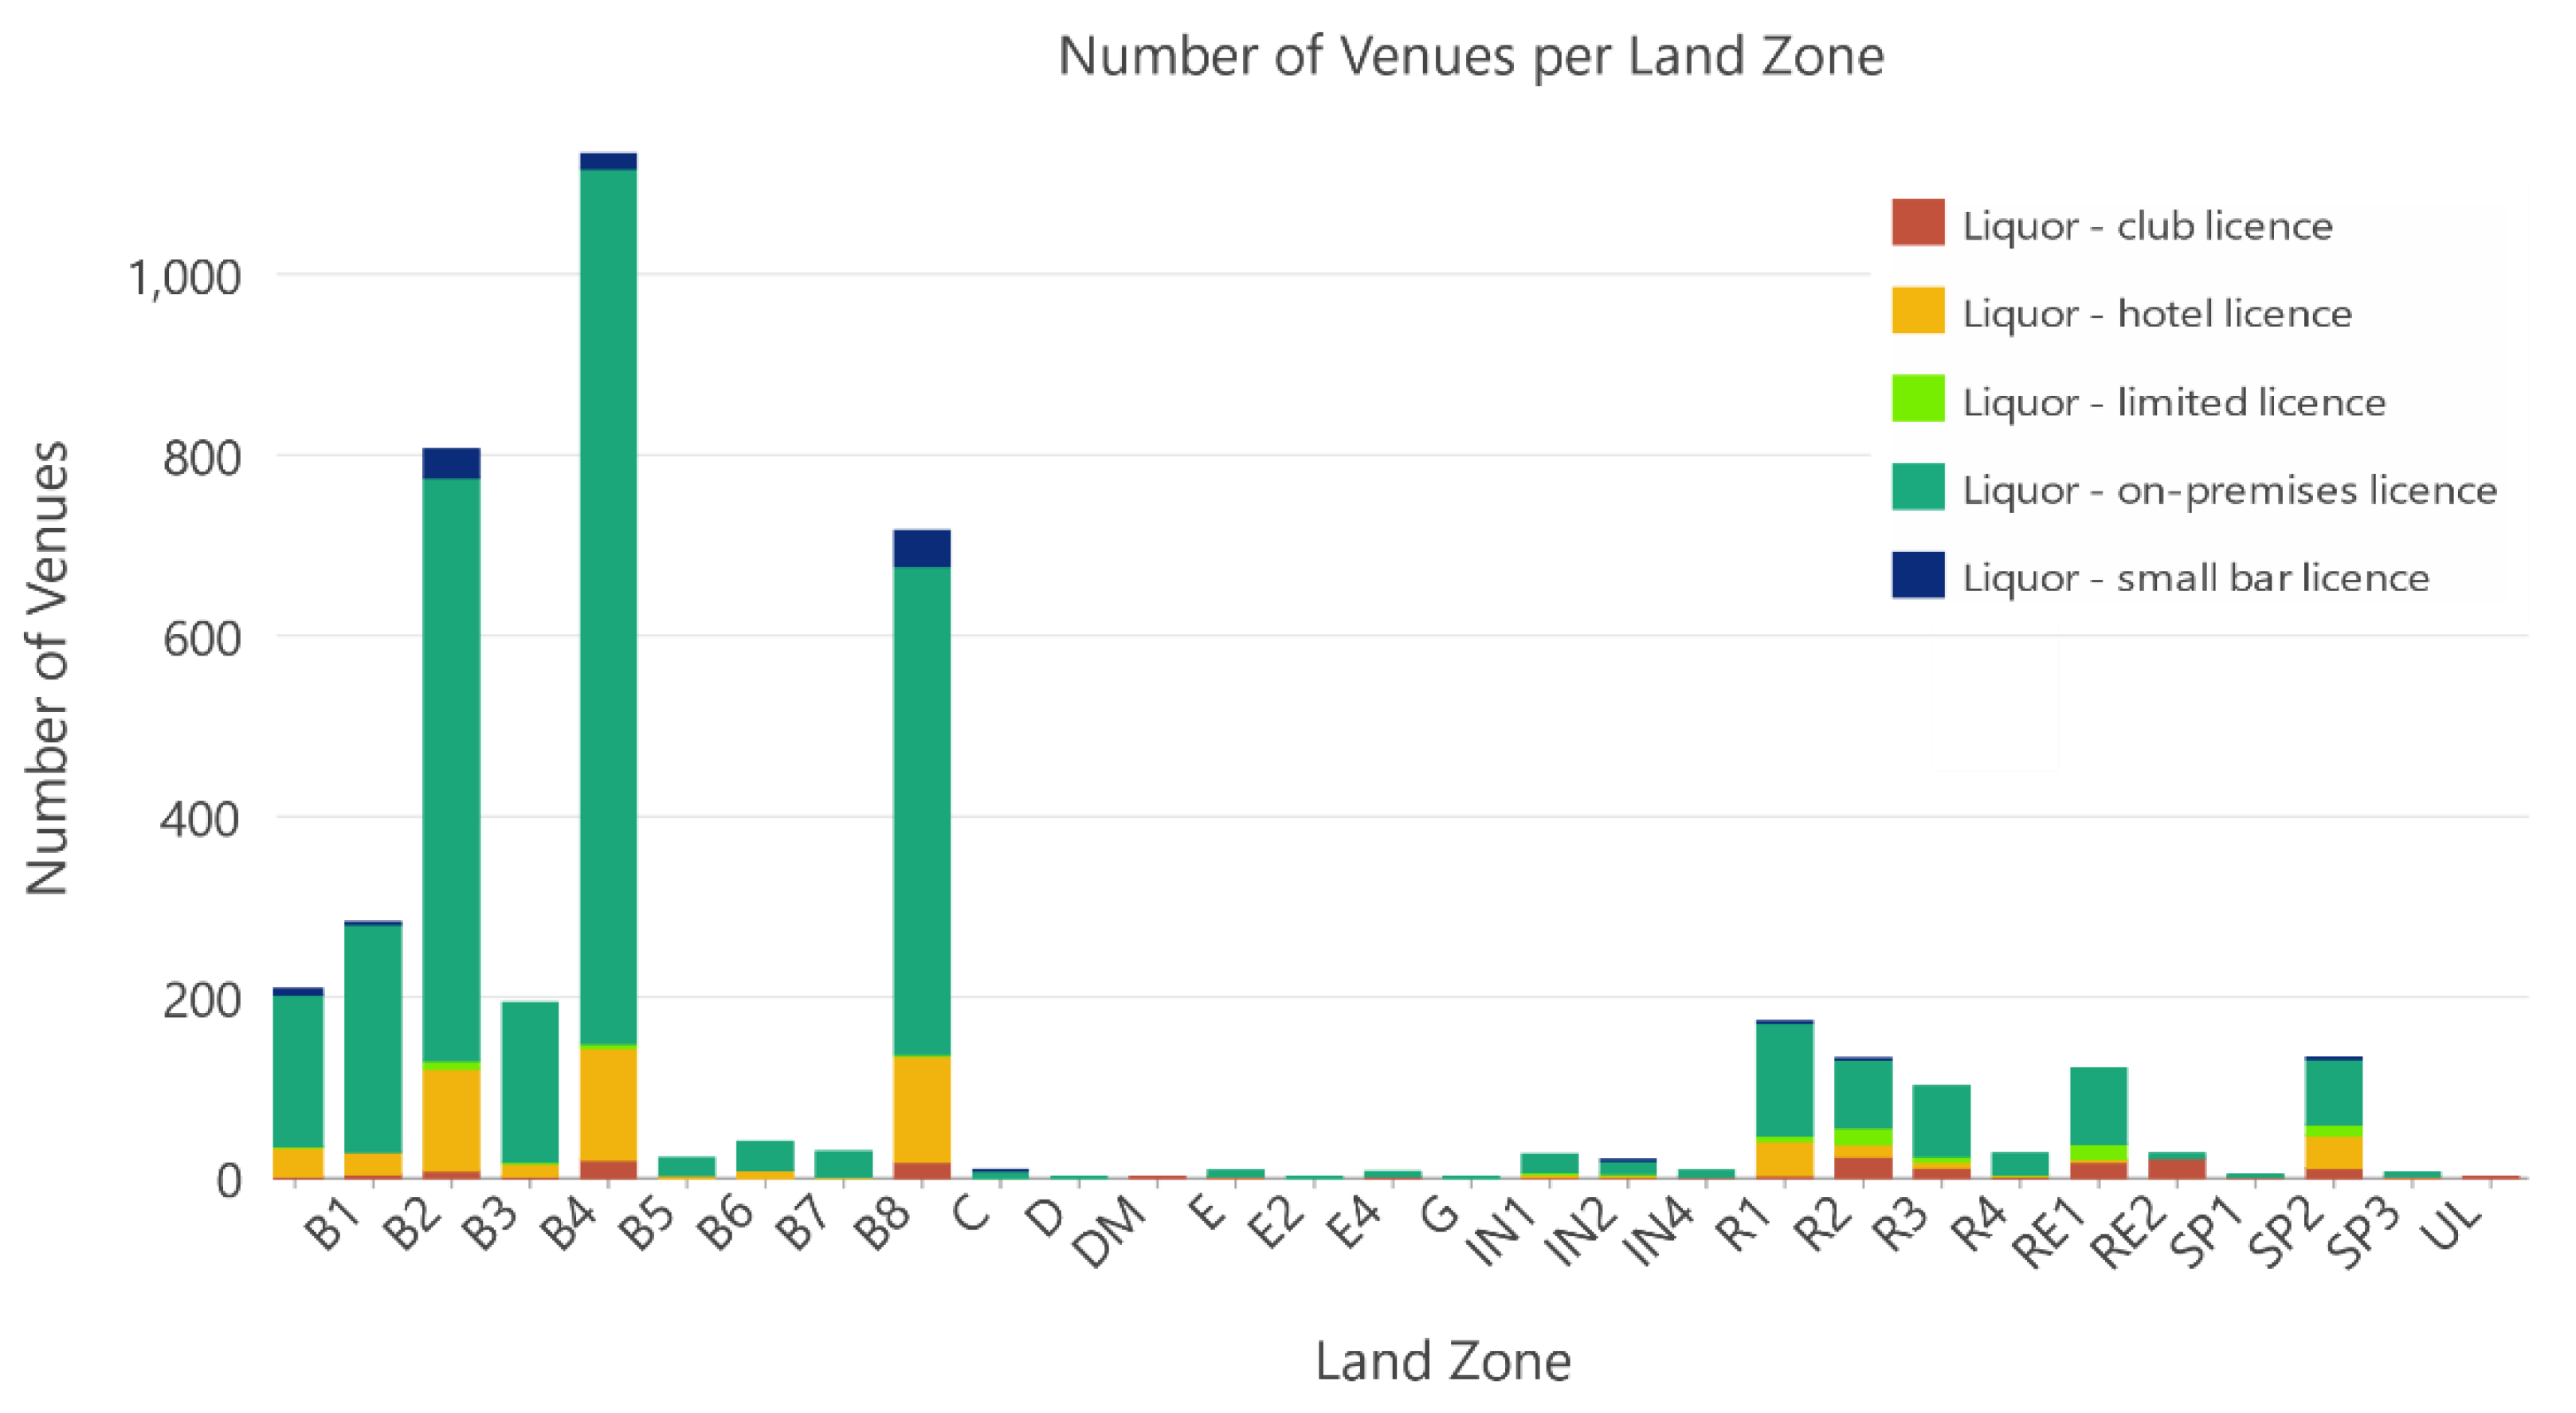
3.1.2. Licensed Venues per Land Use Zone
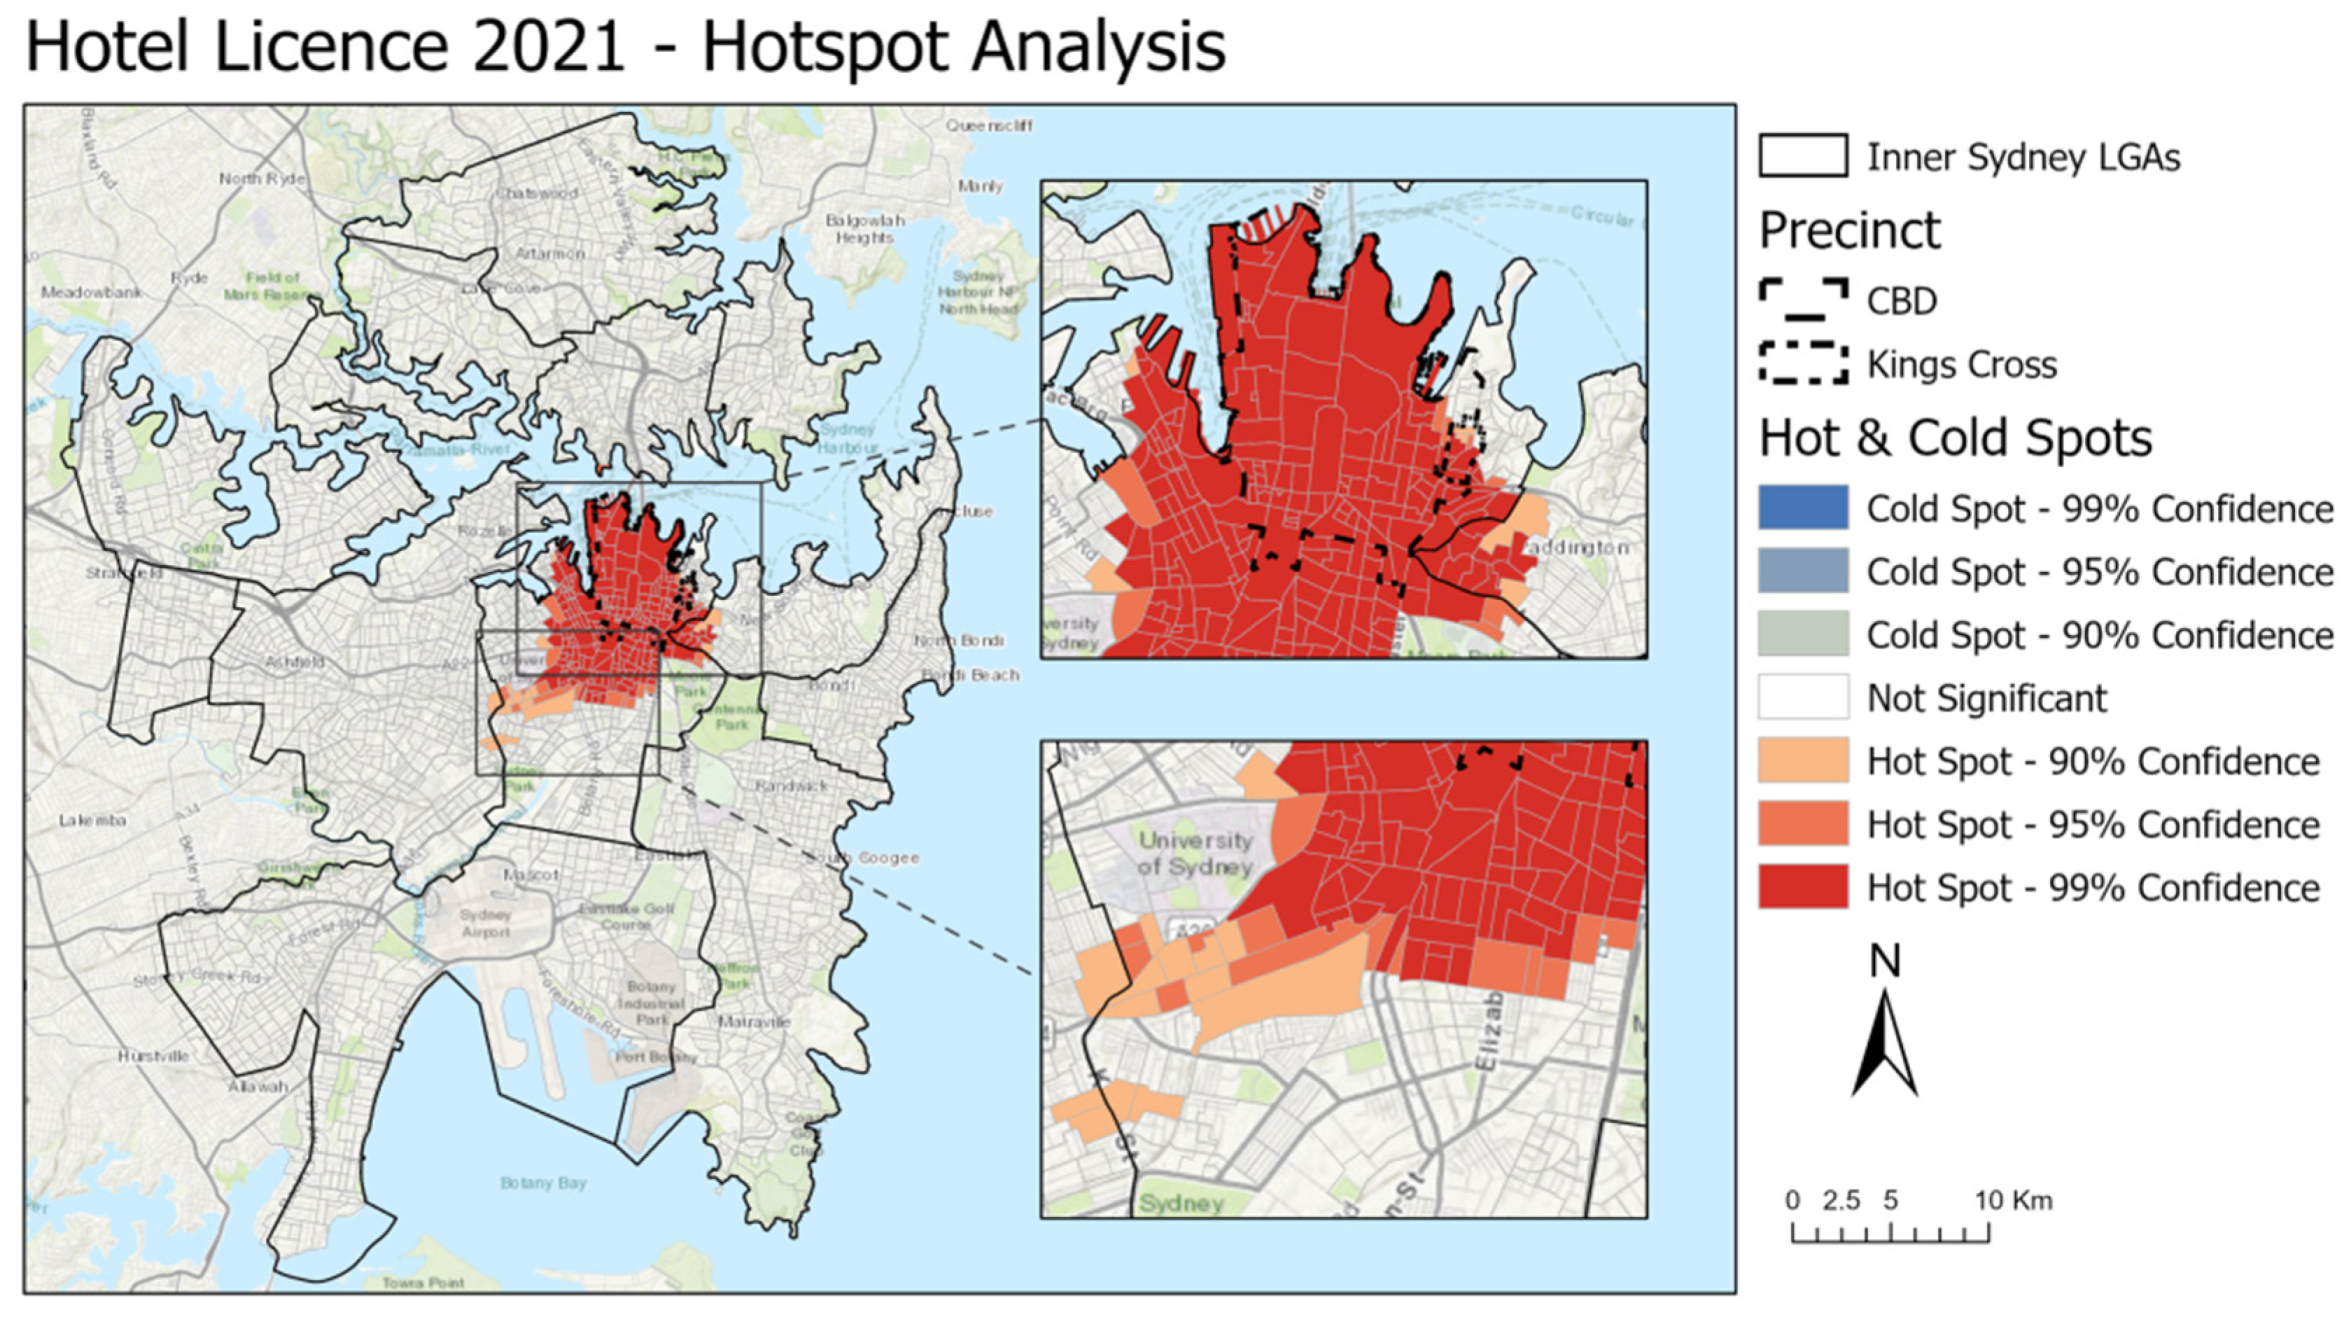
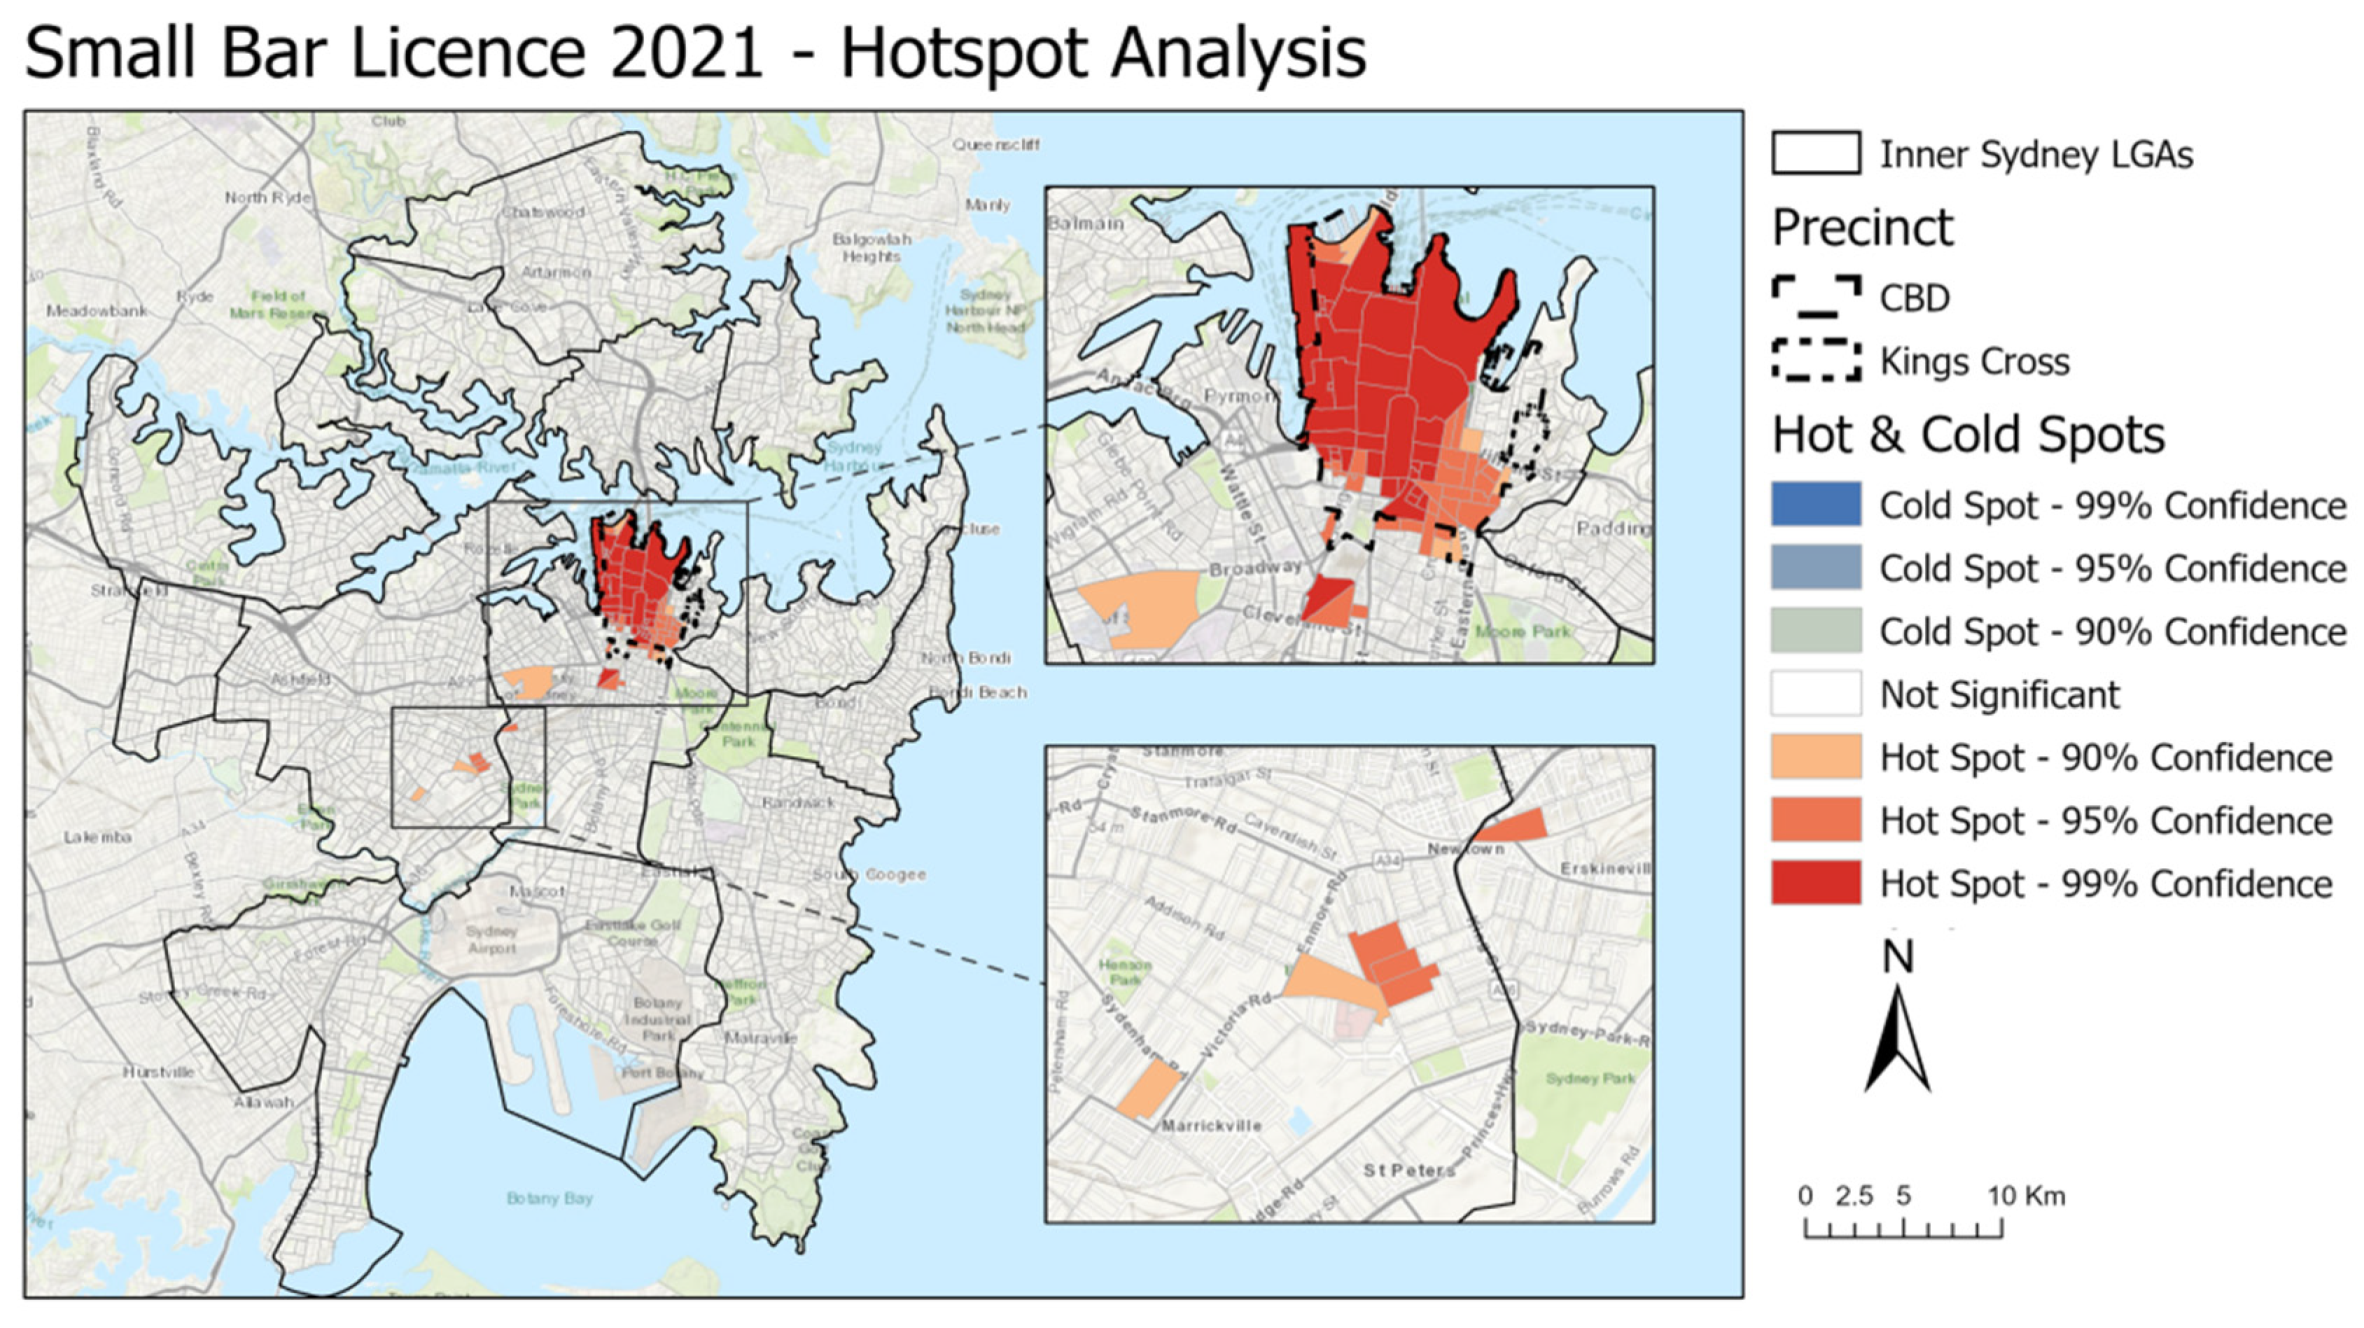
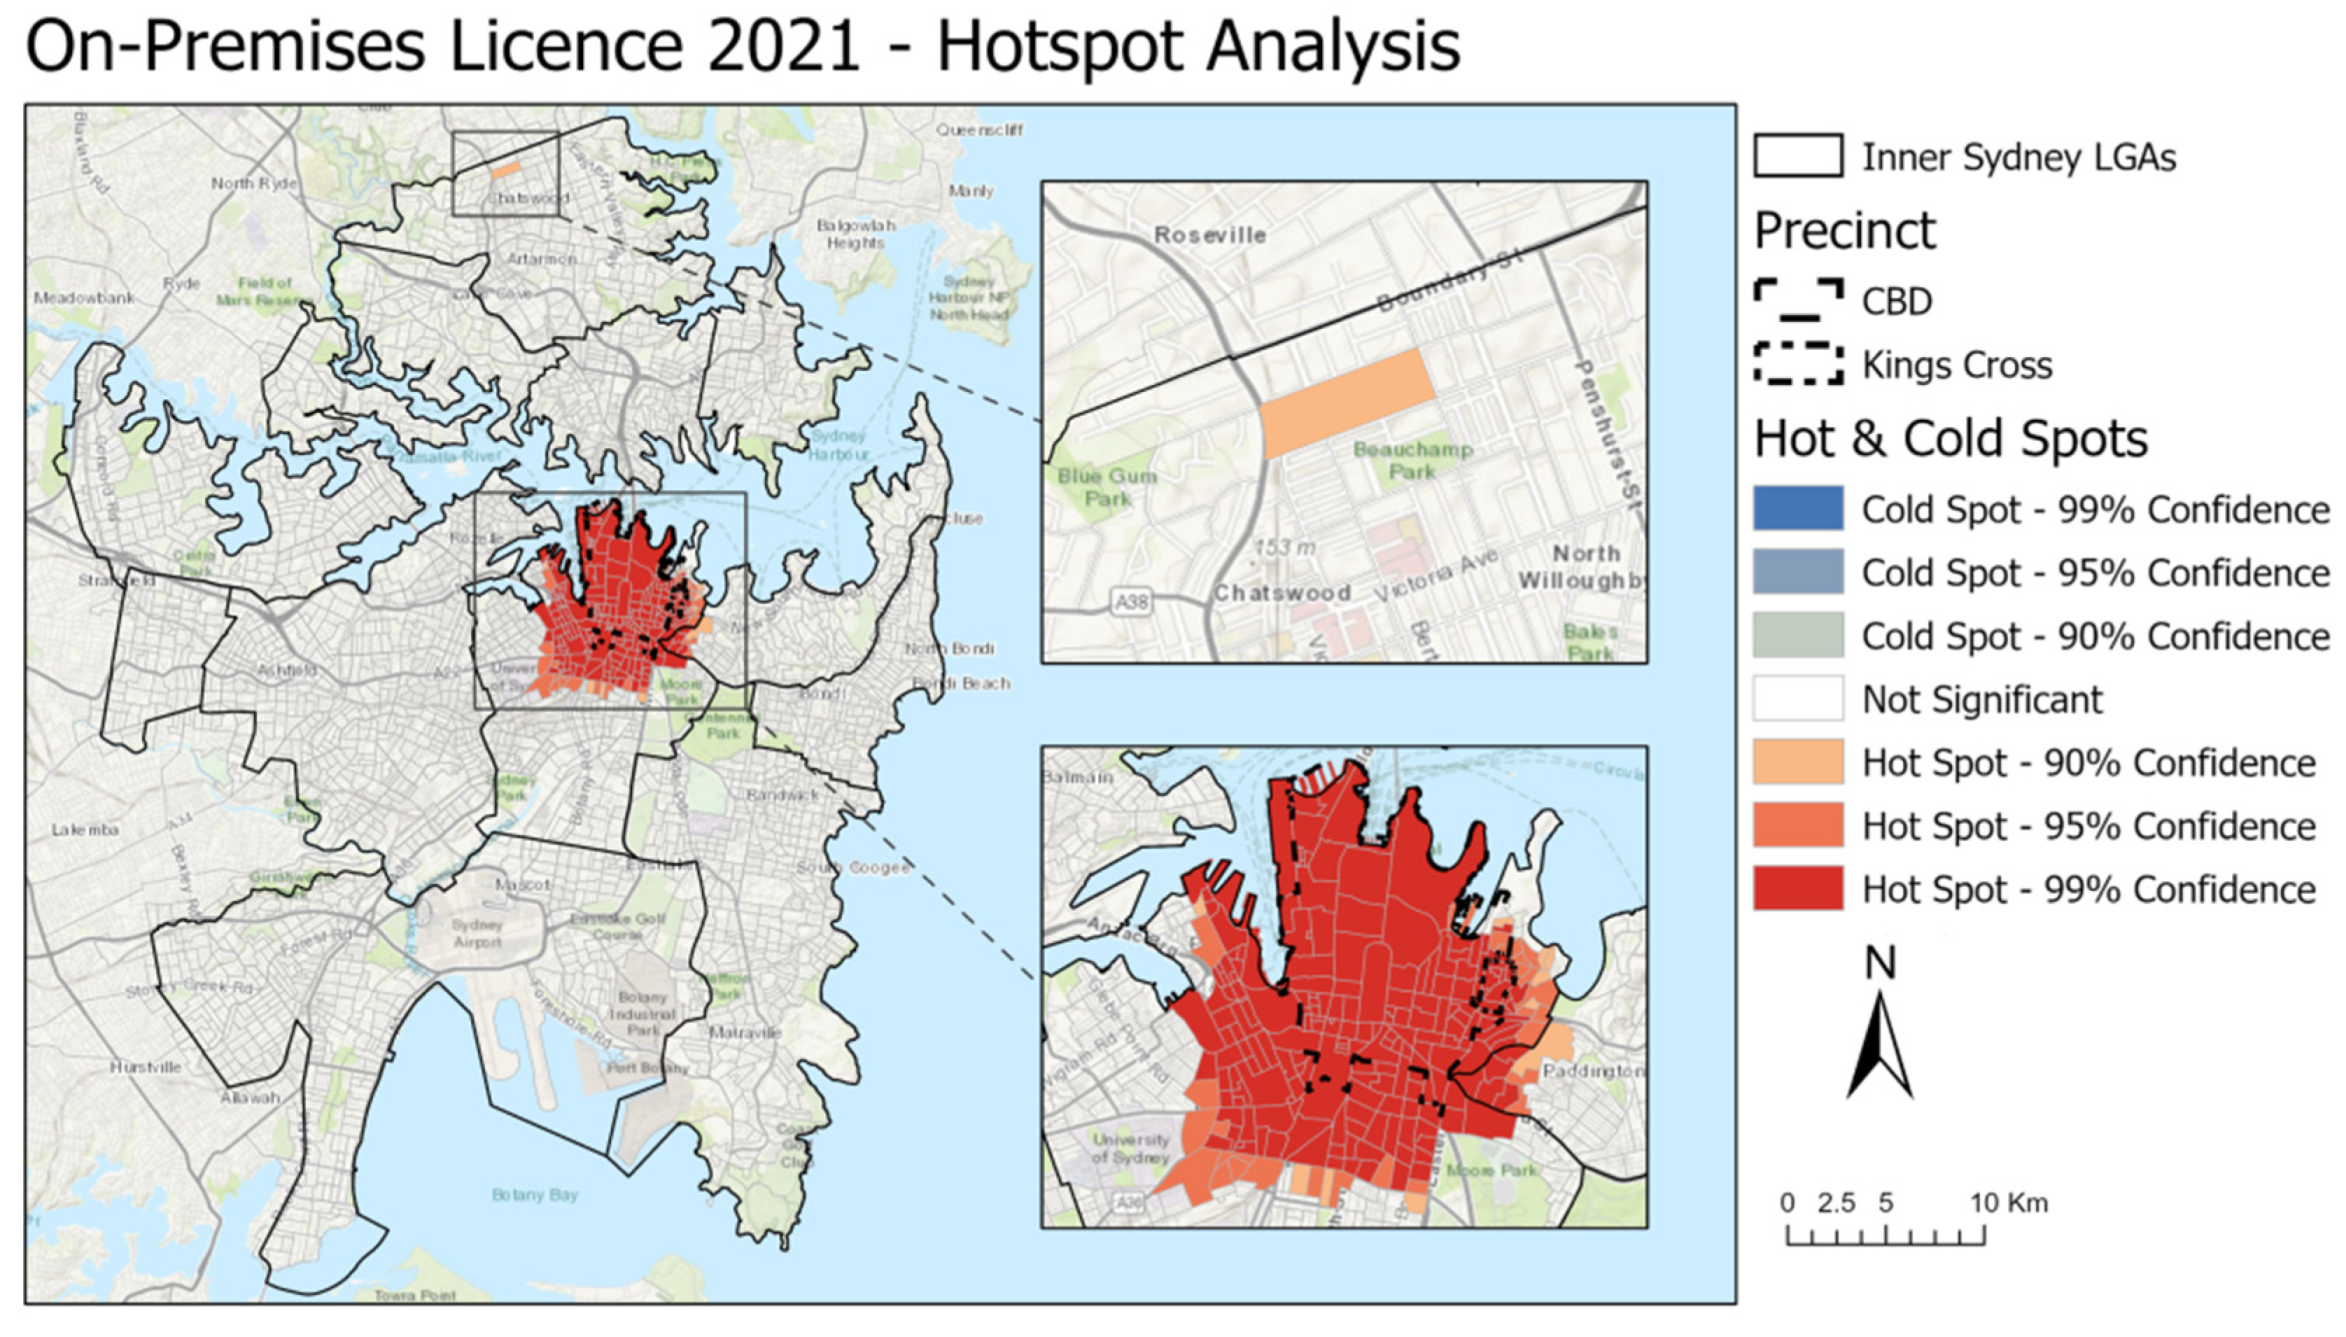
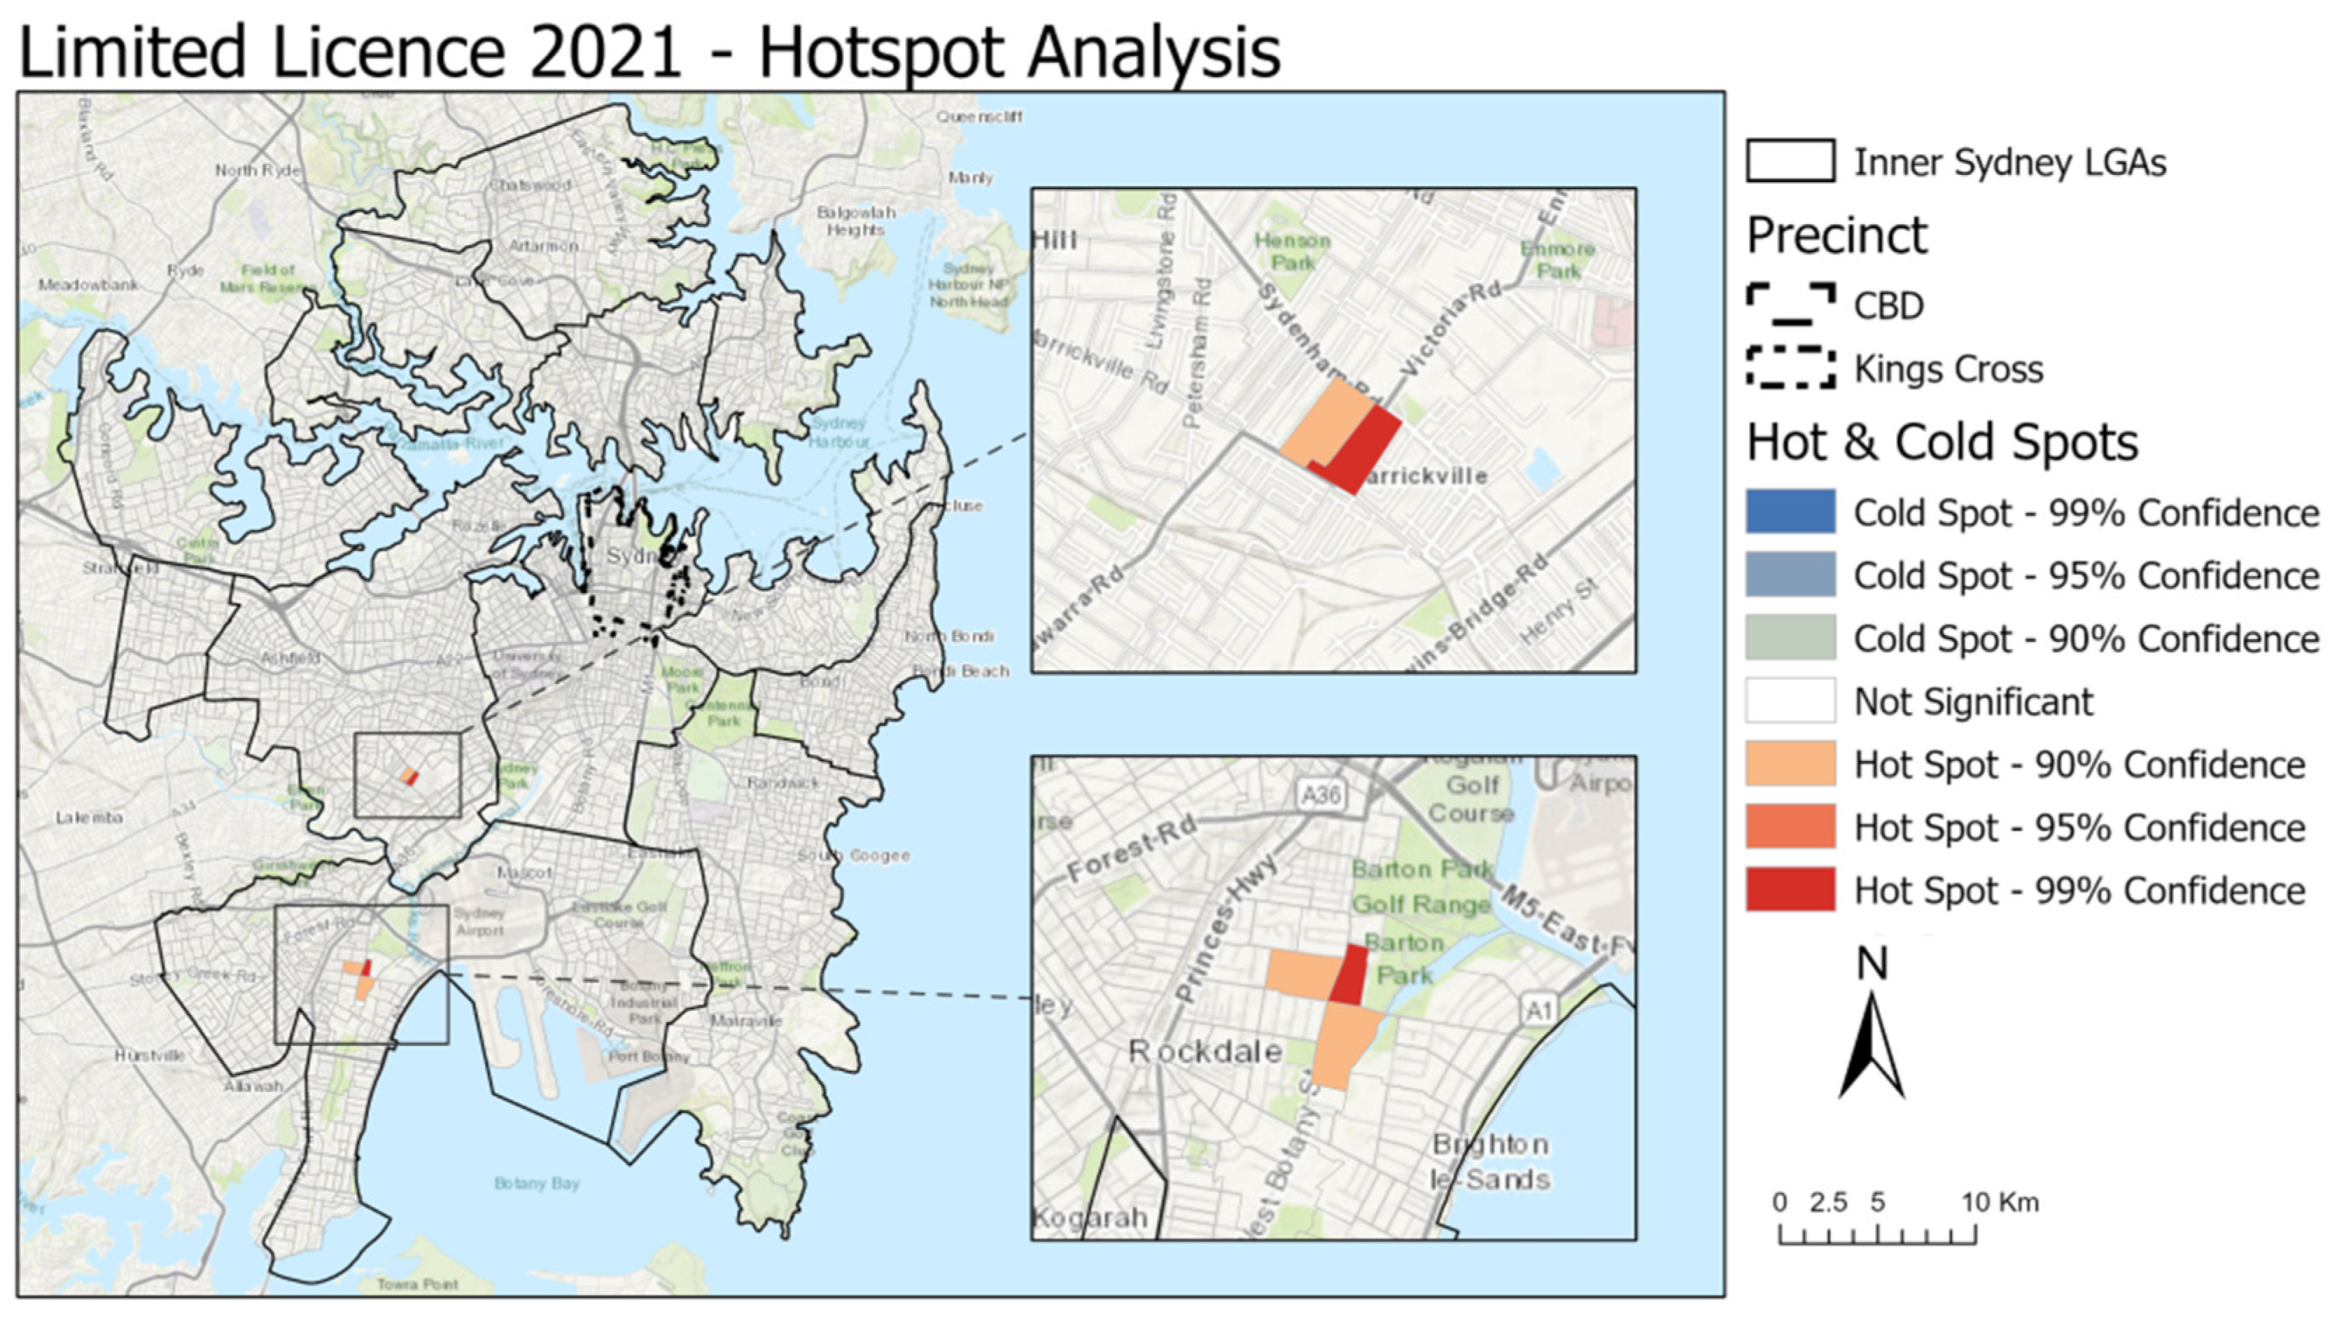
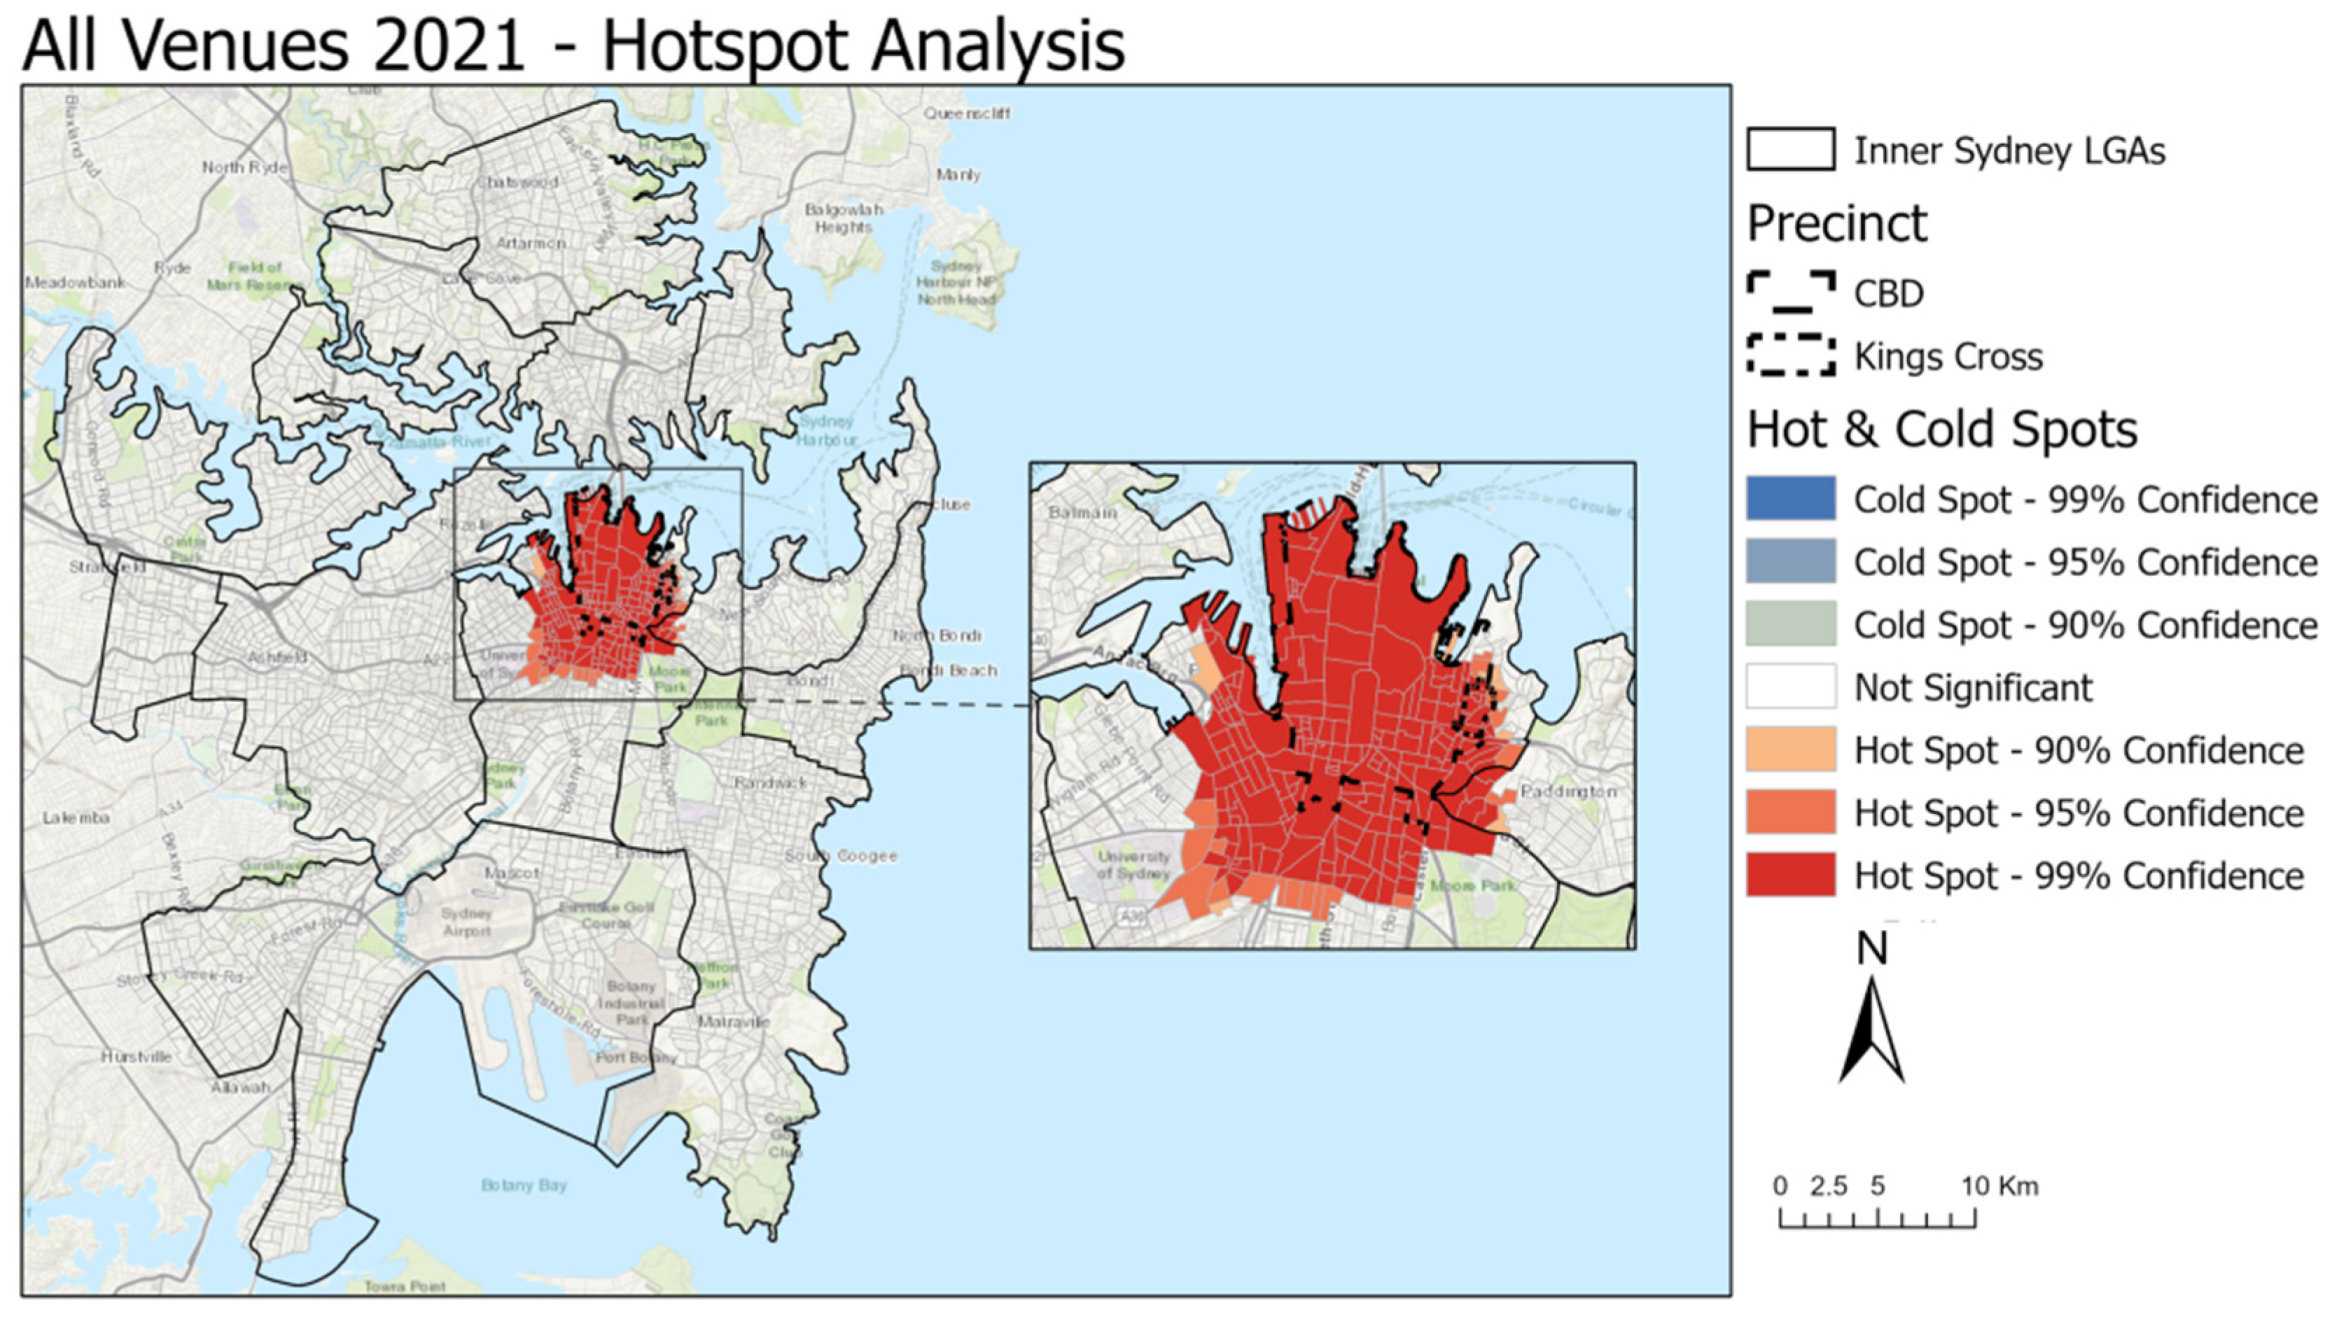
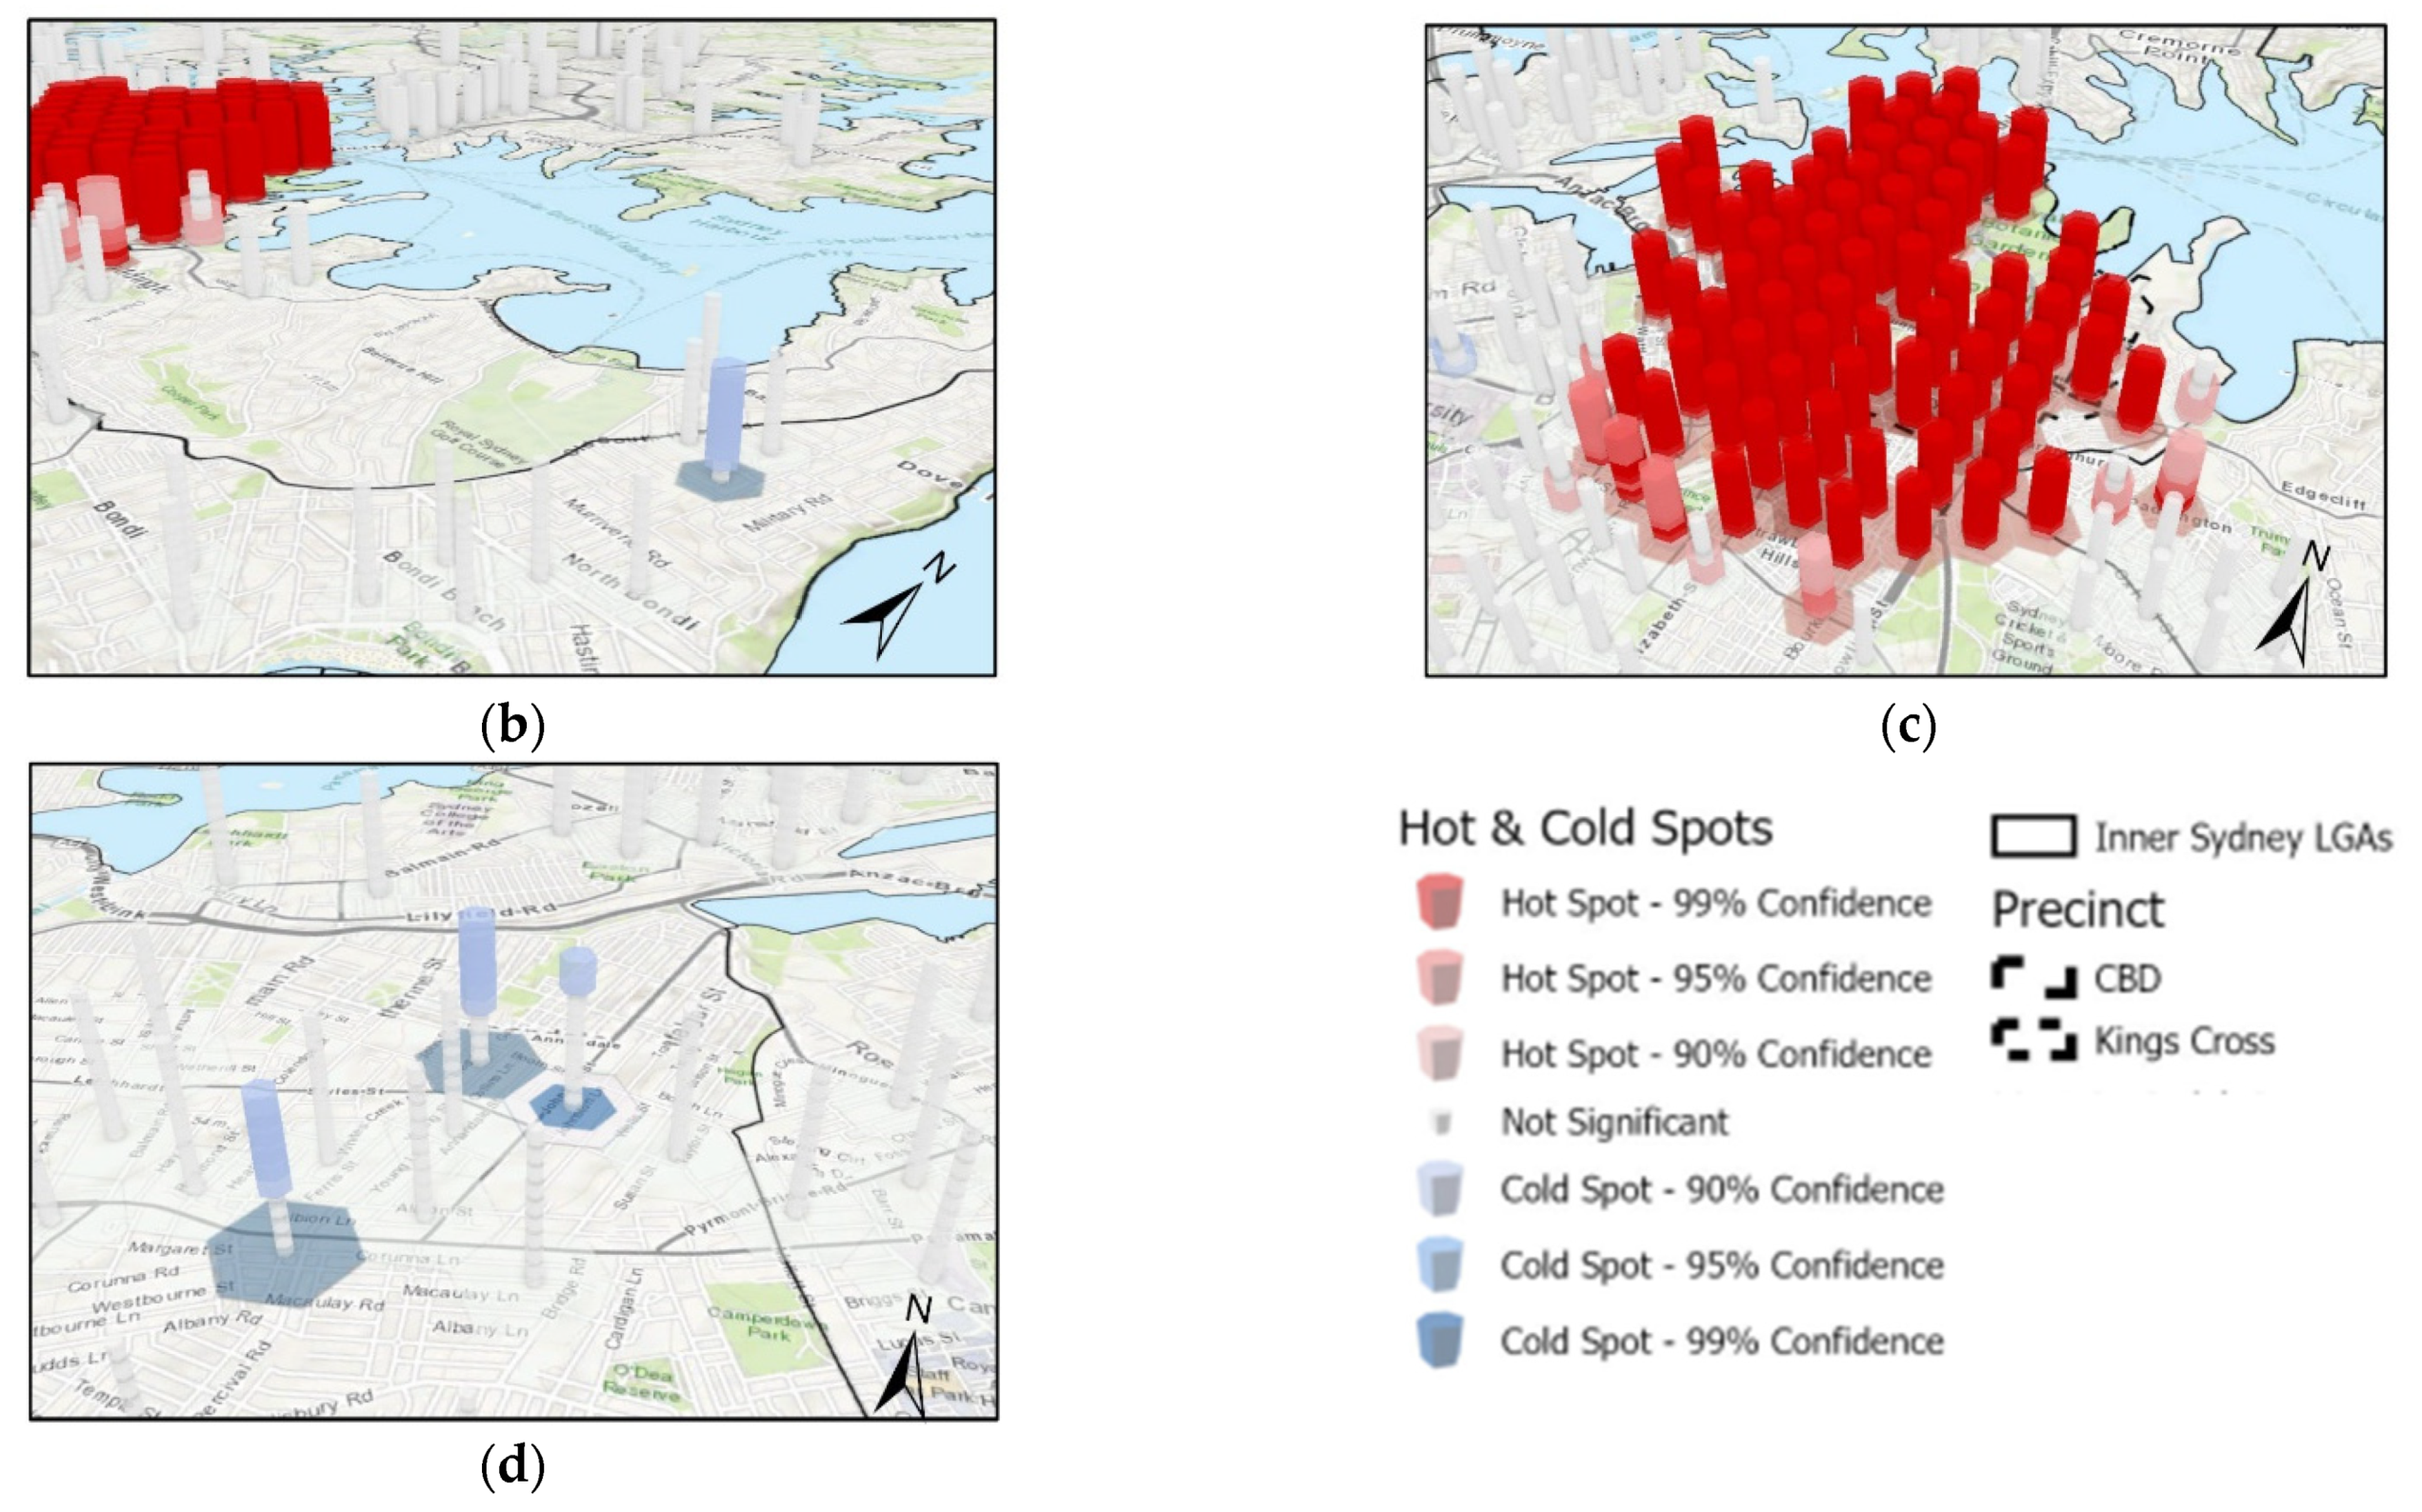
3.2. Spatial Autocorrelation
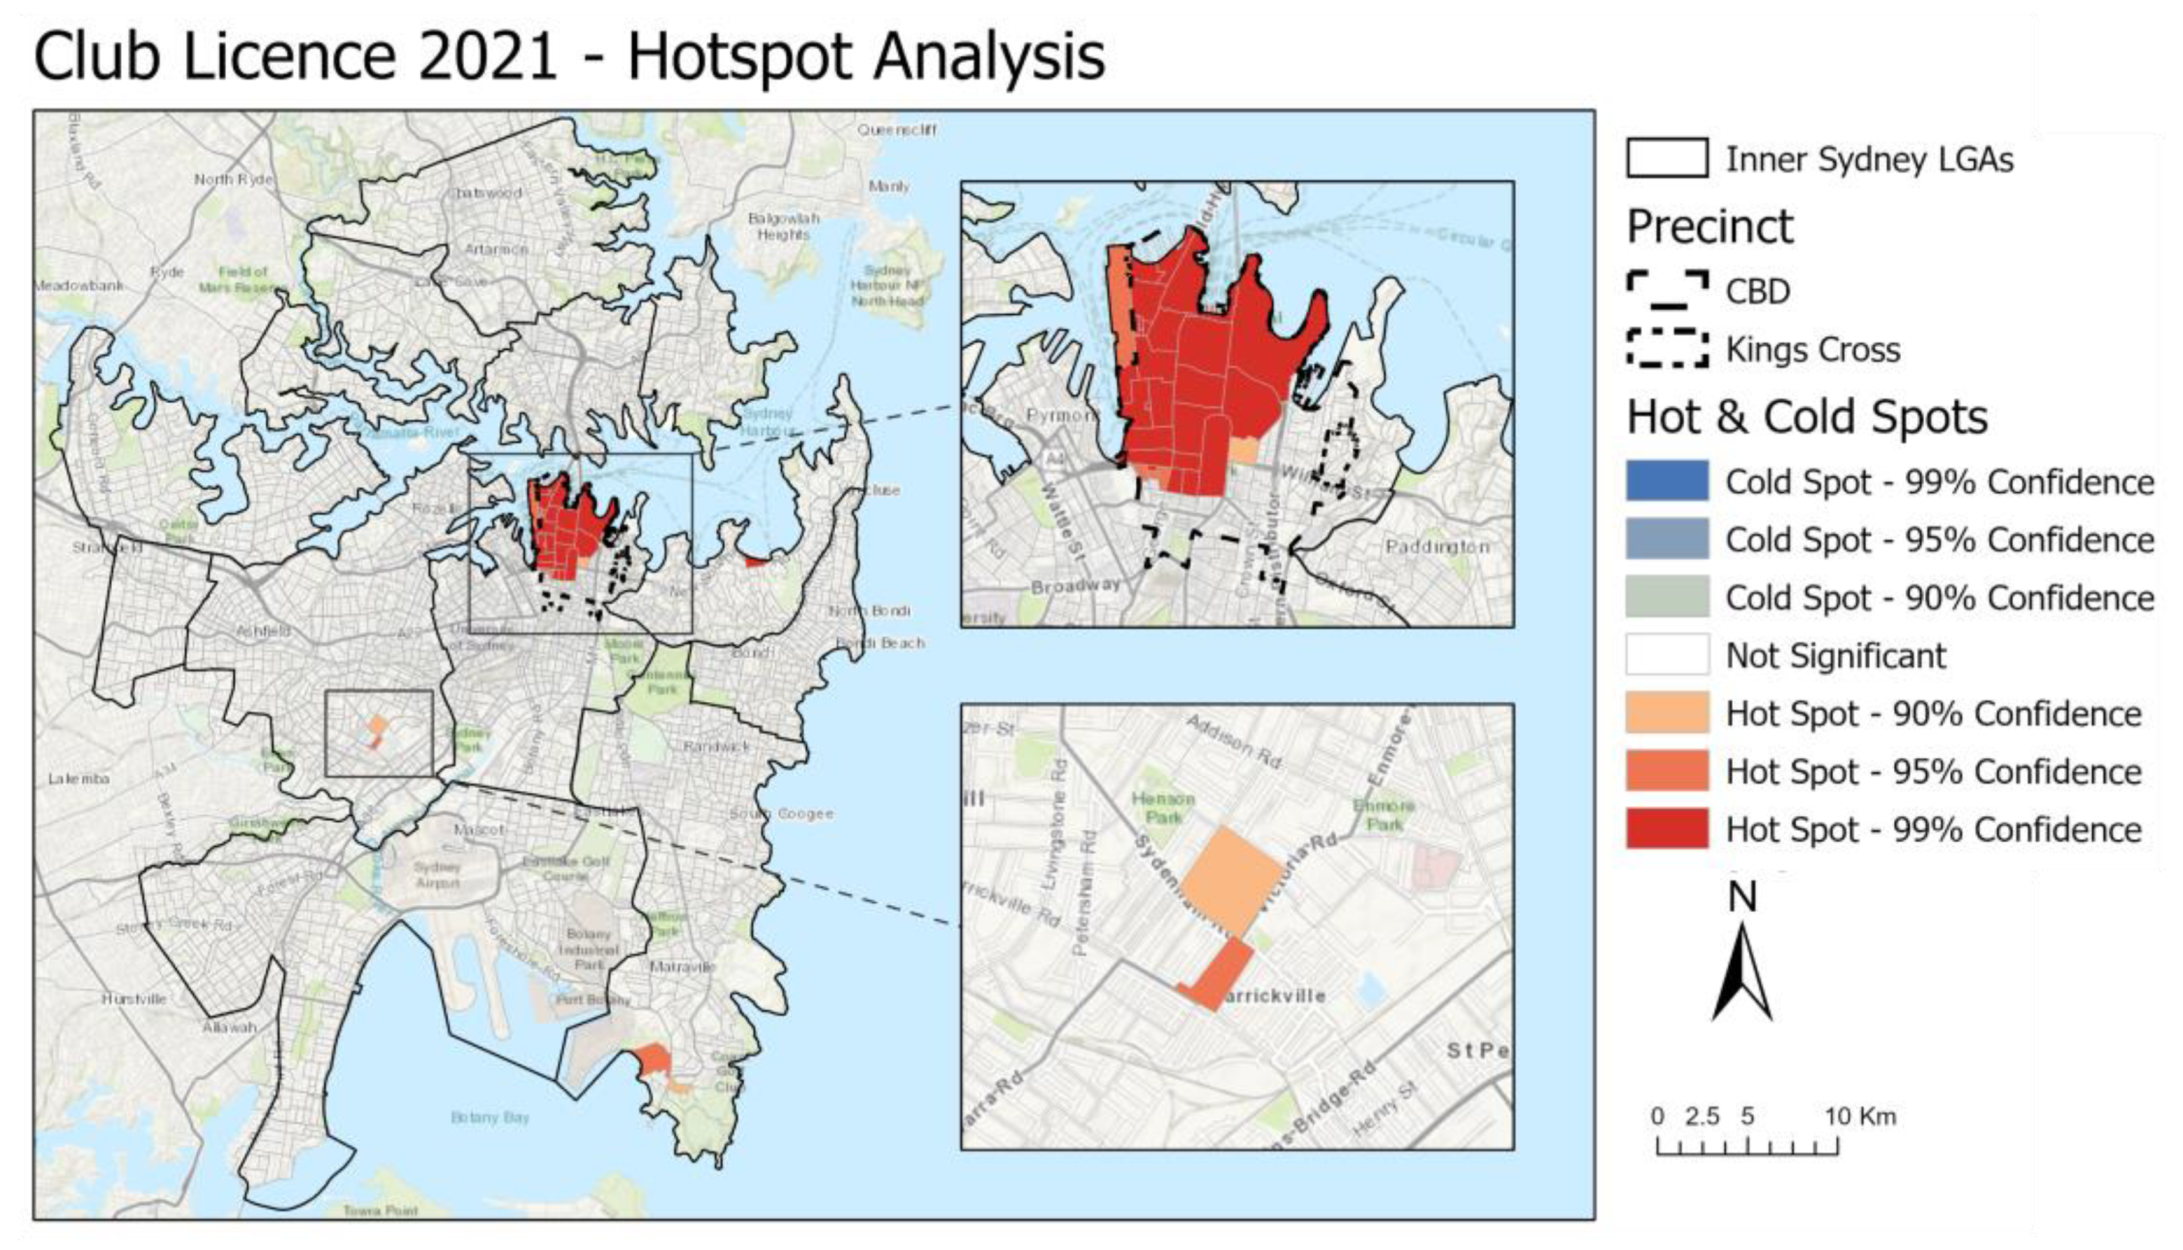
2021 Hotspot Analysis
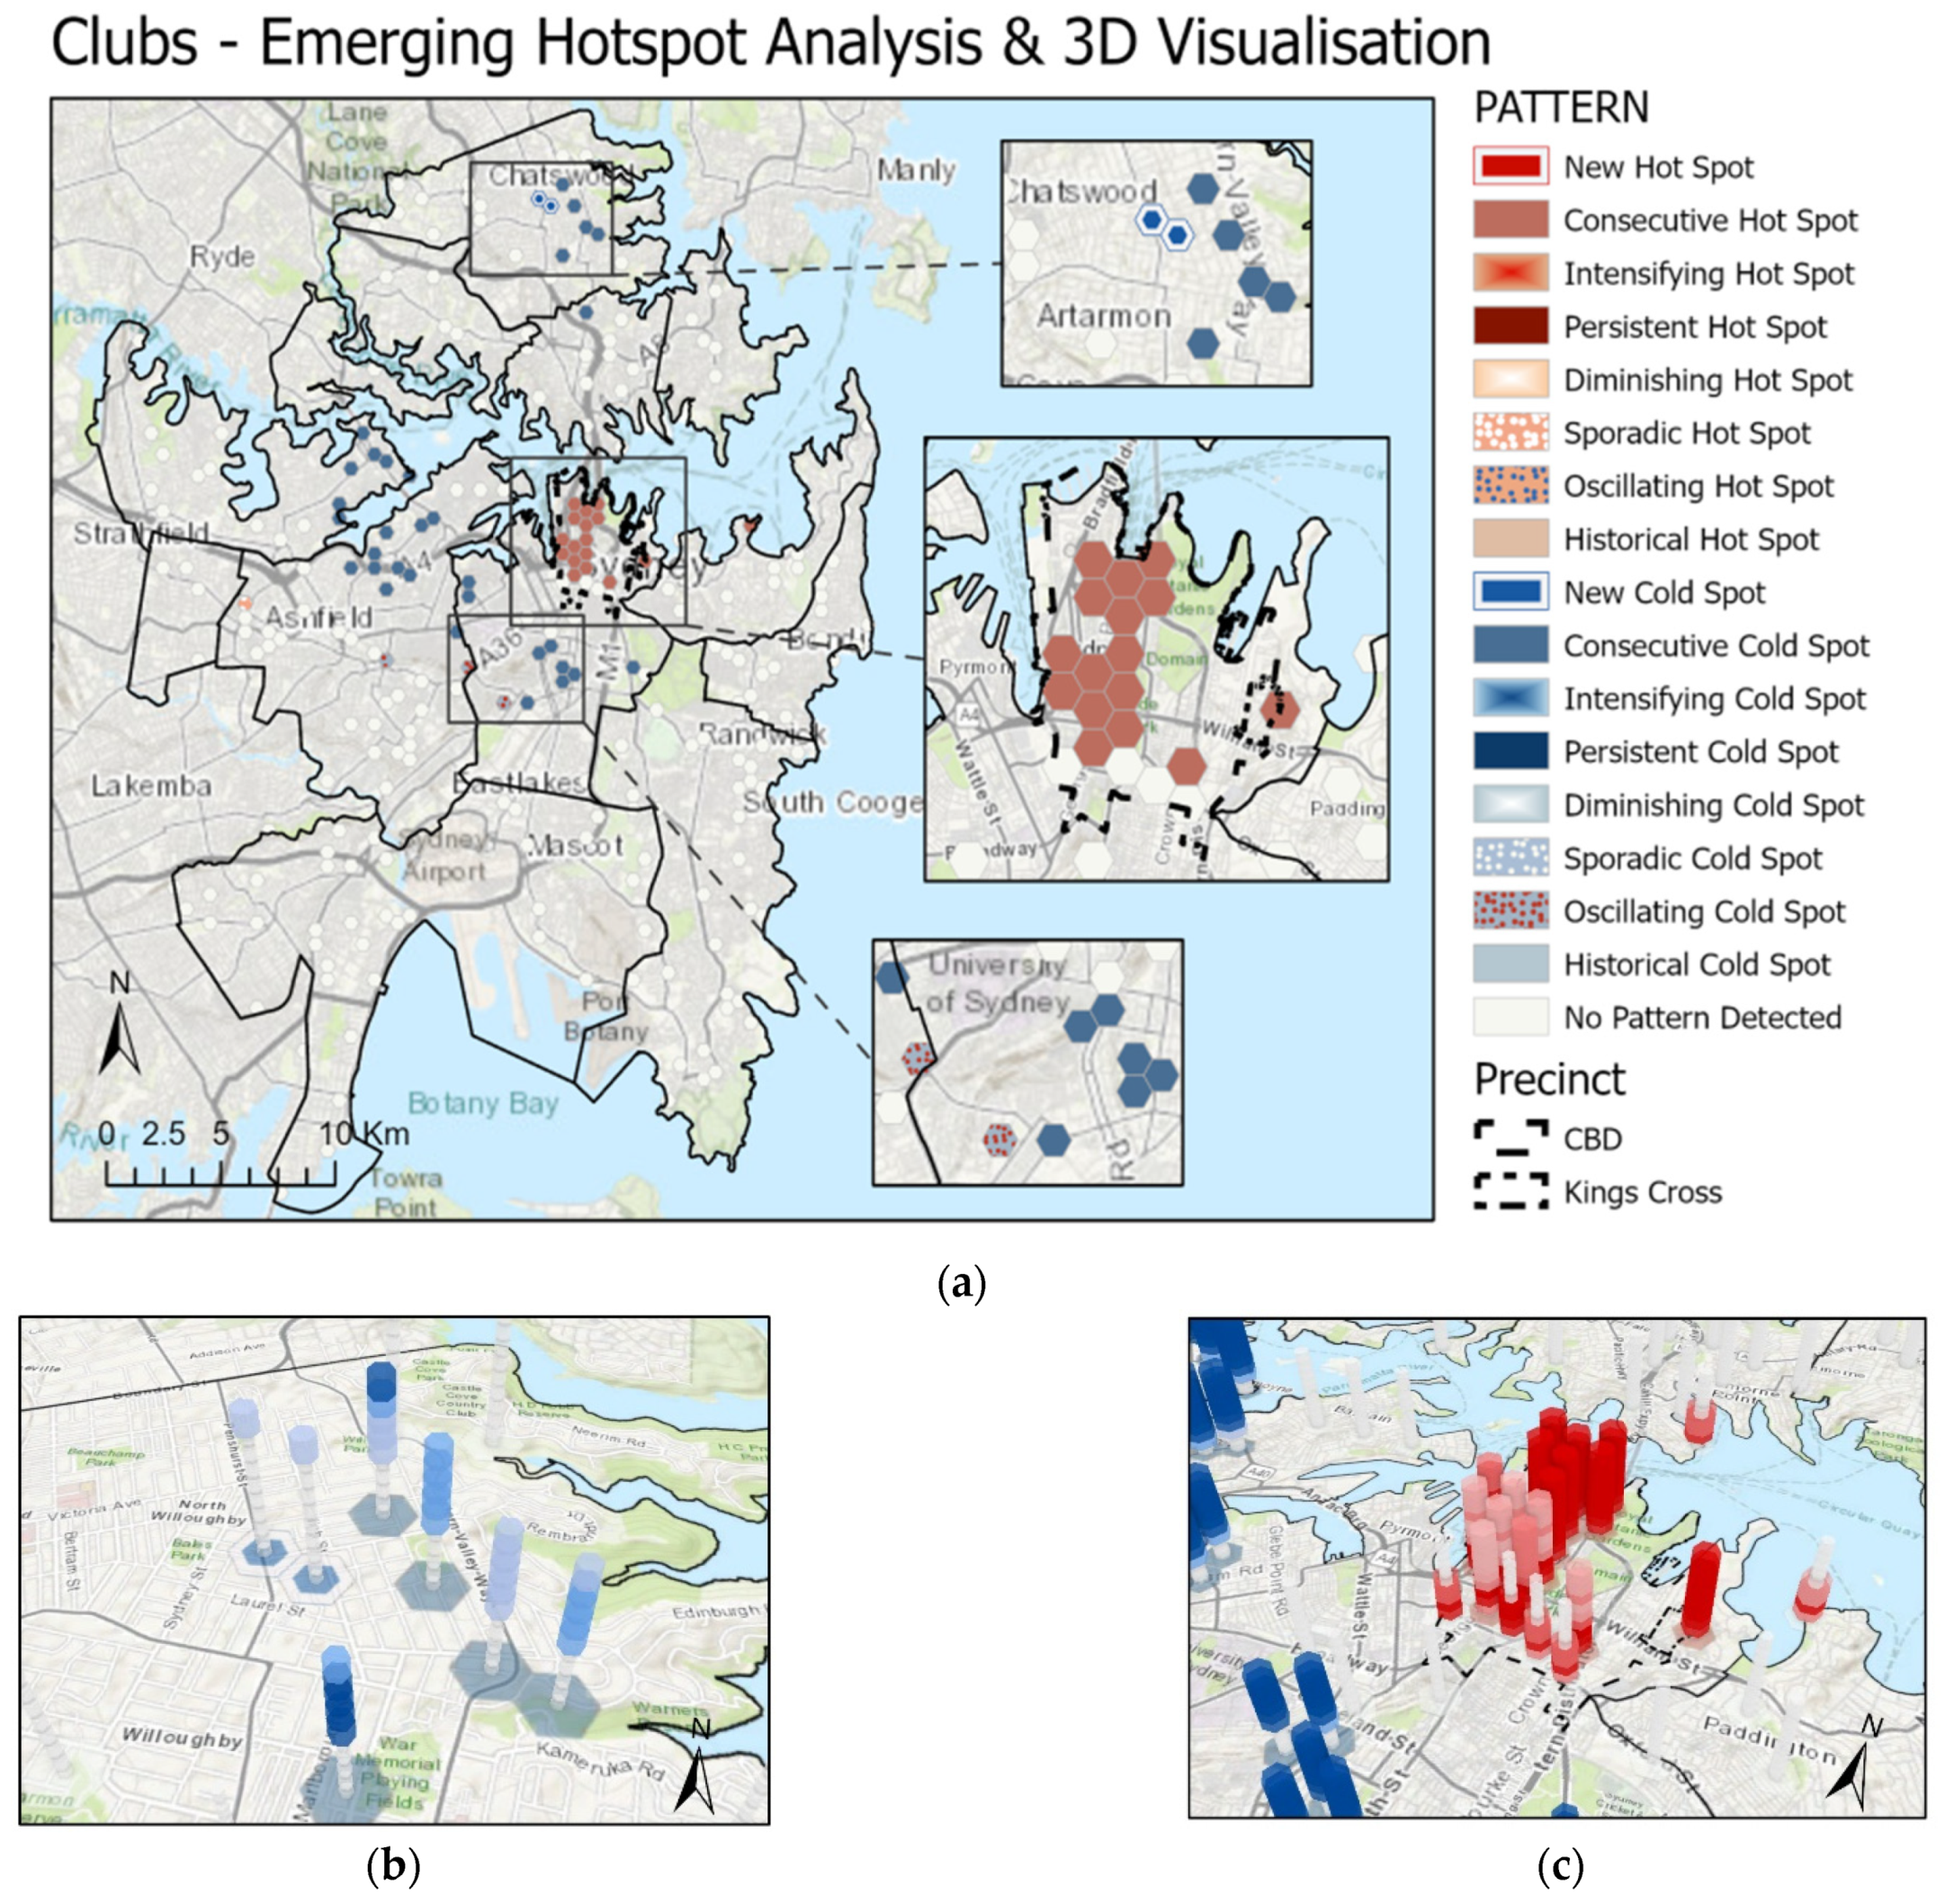
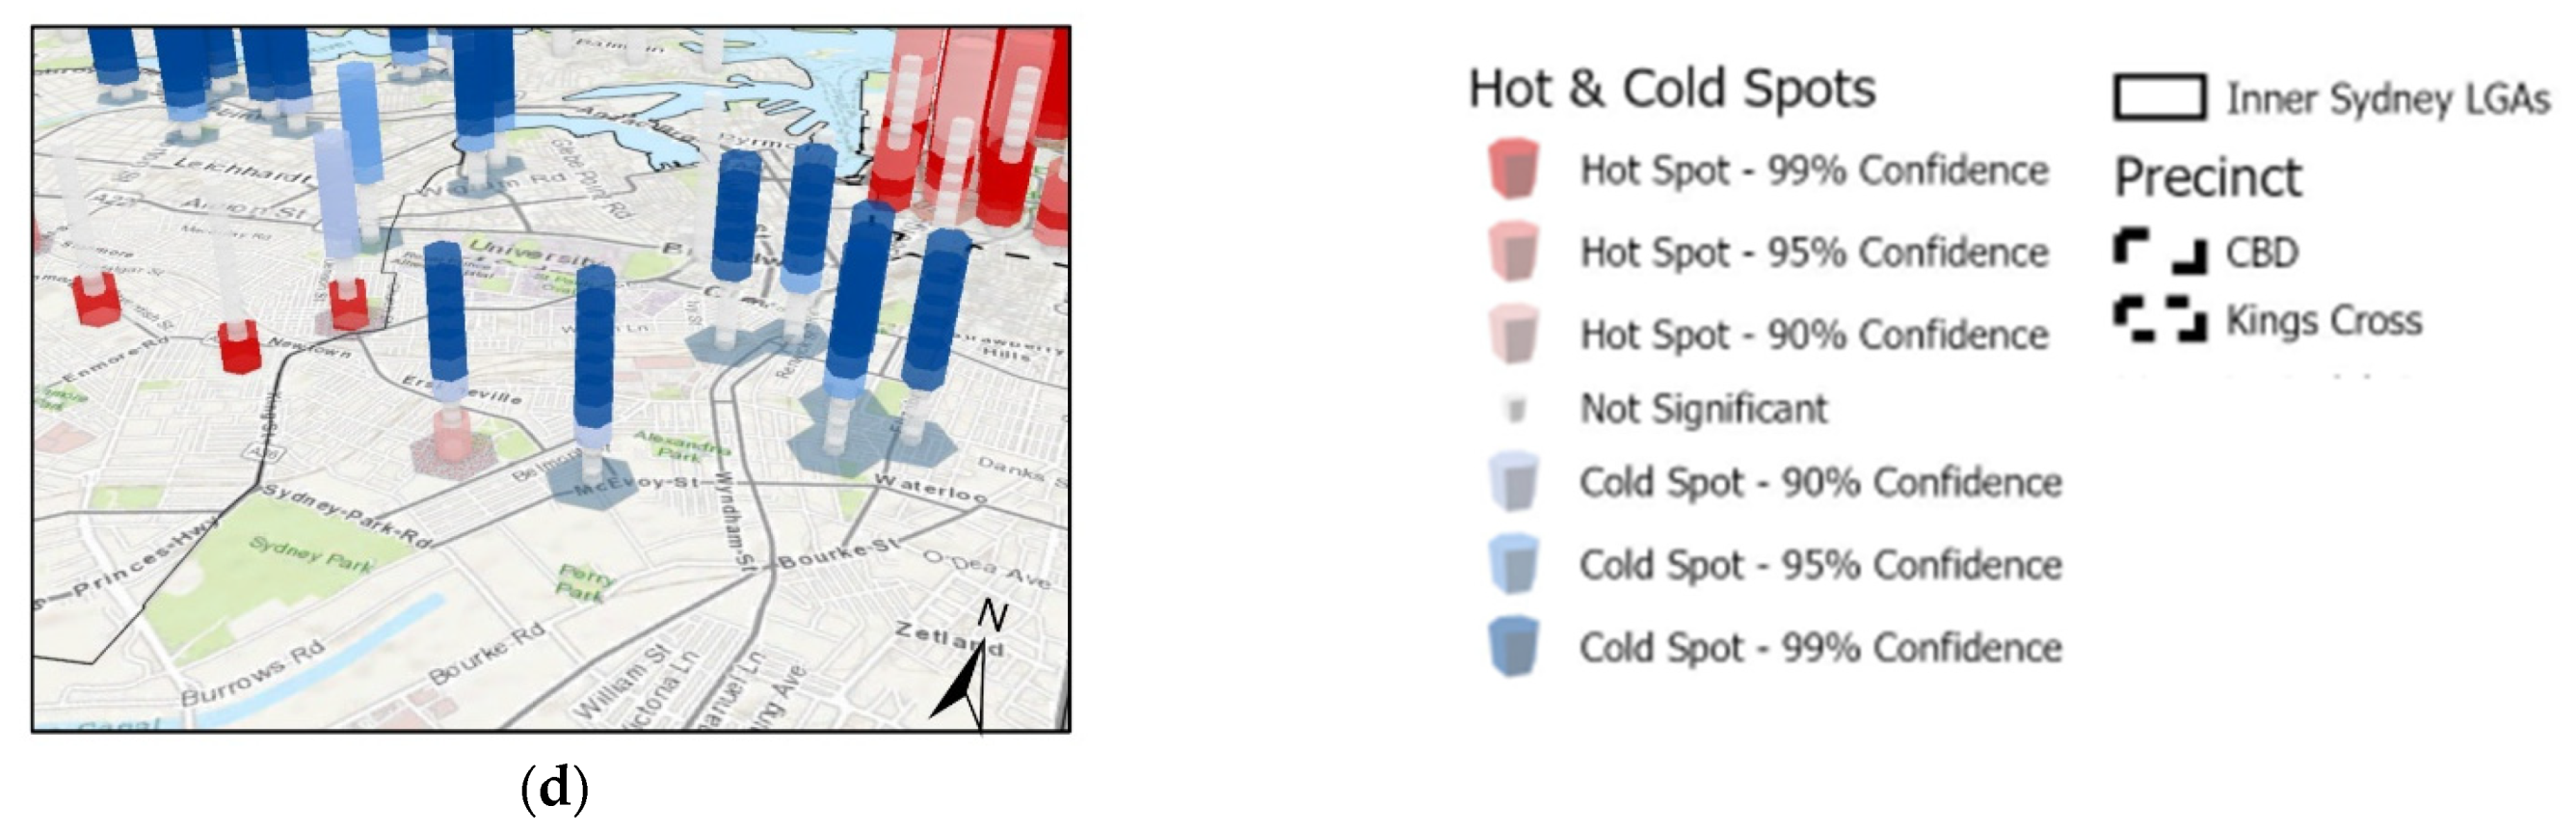
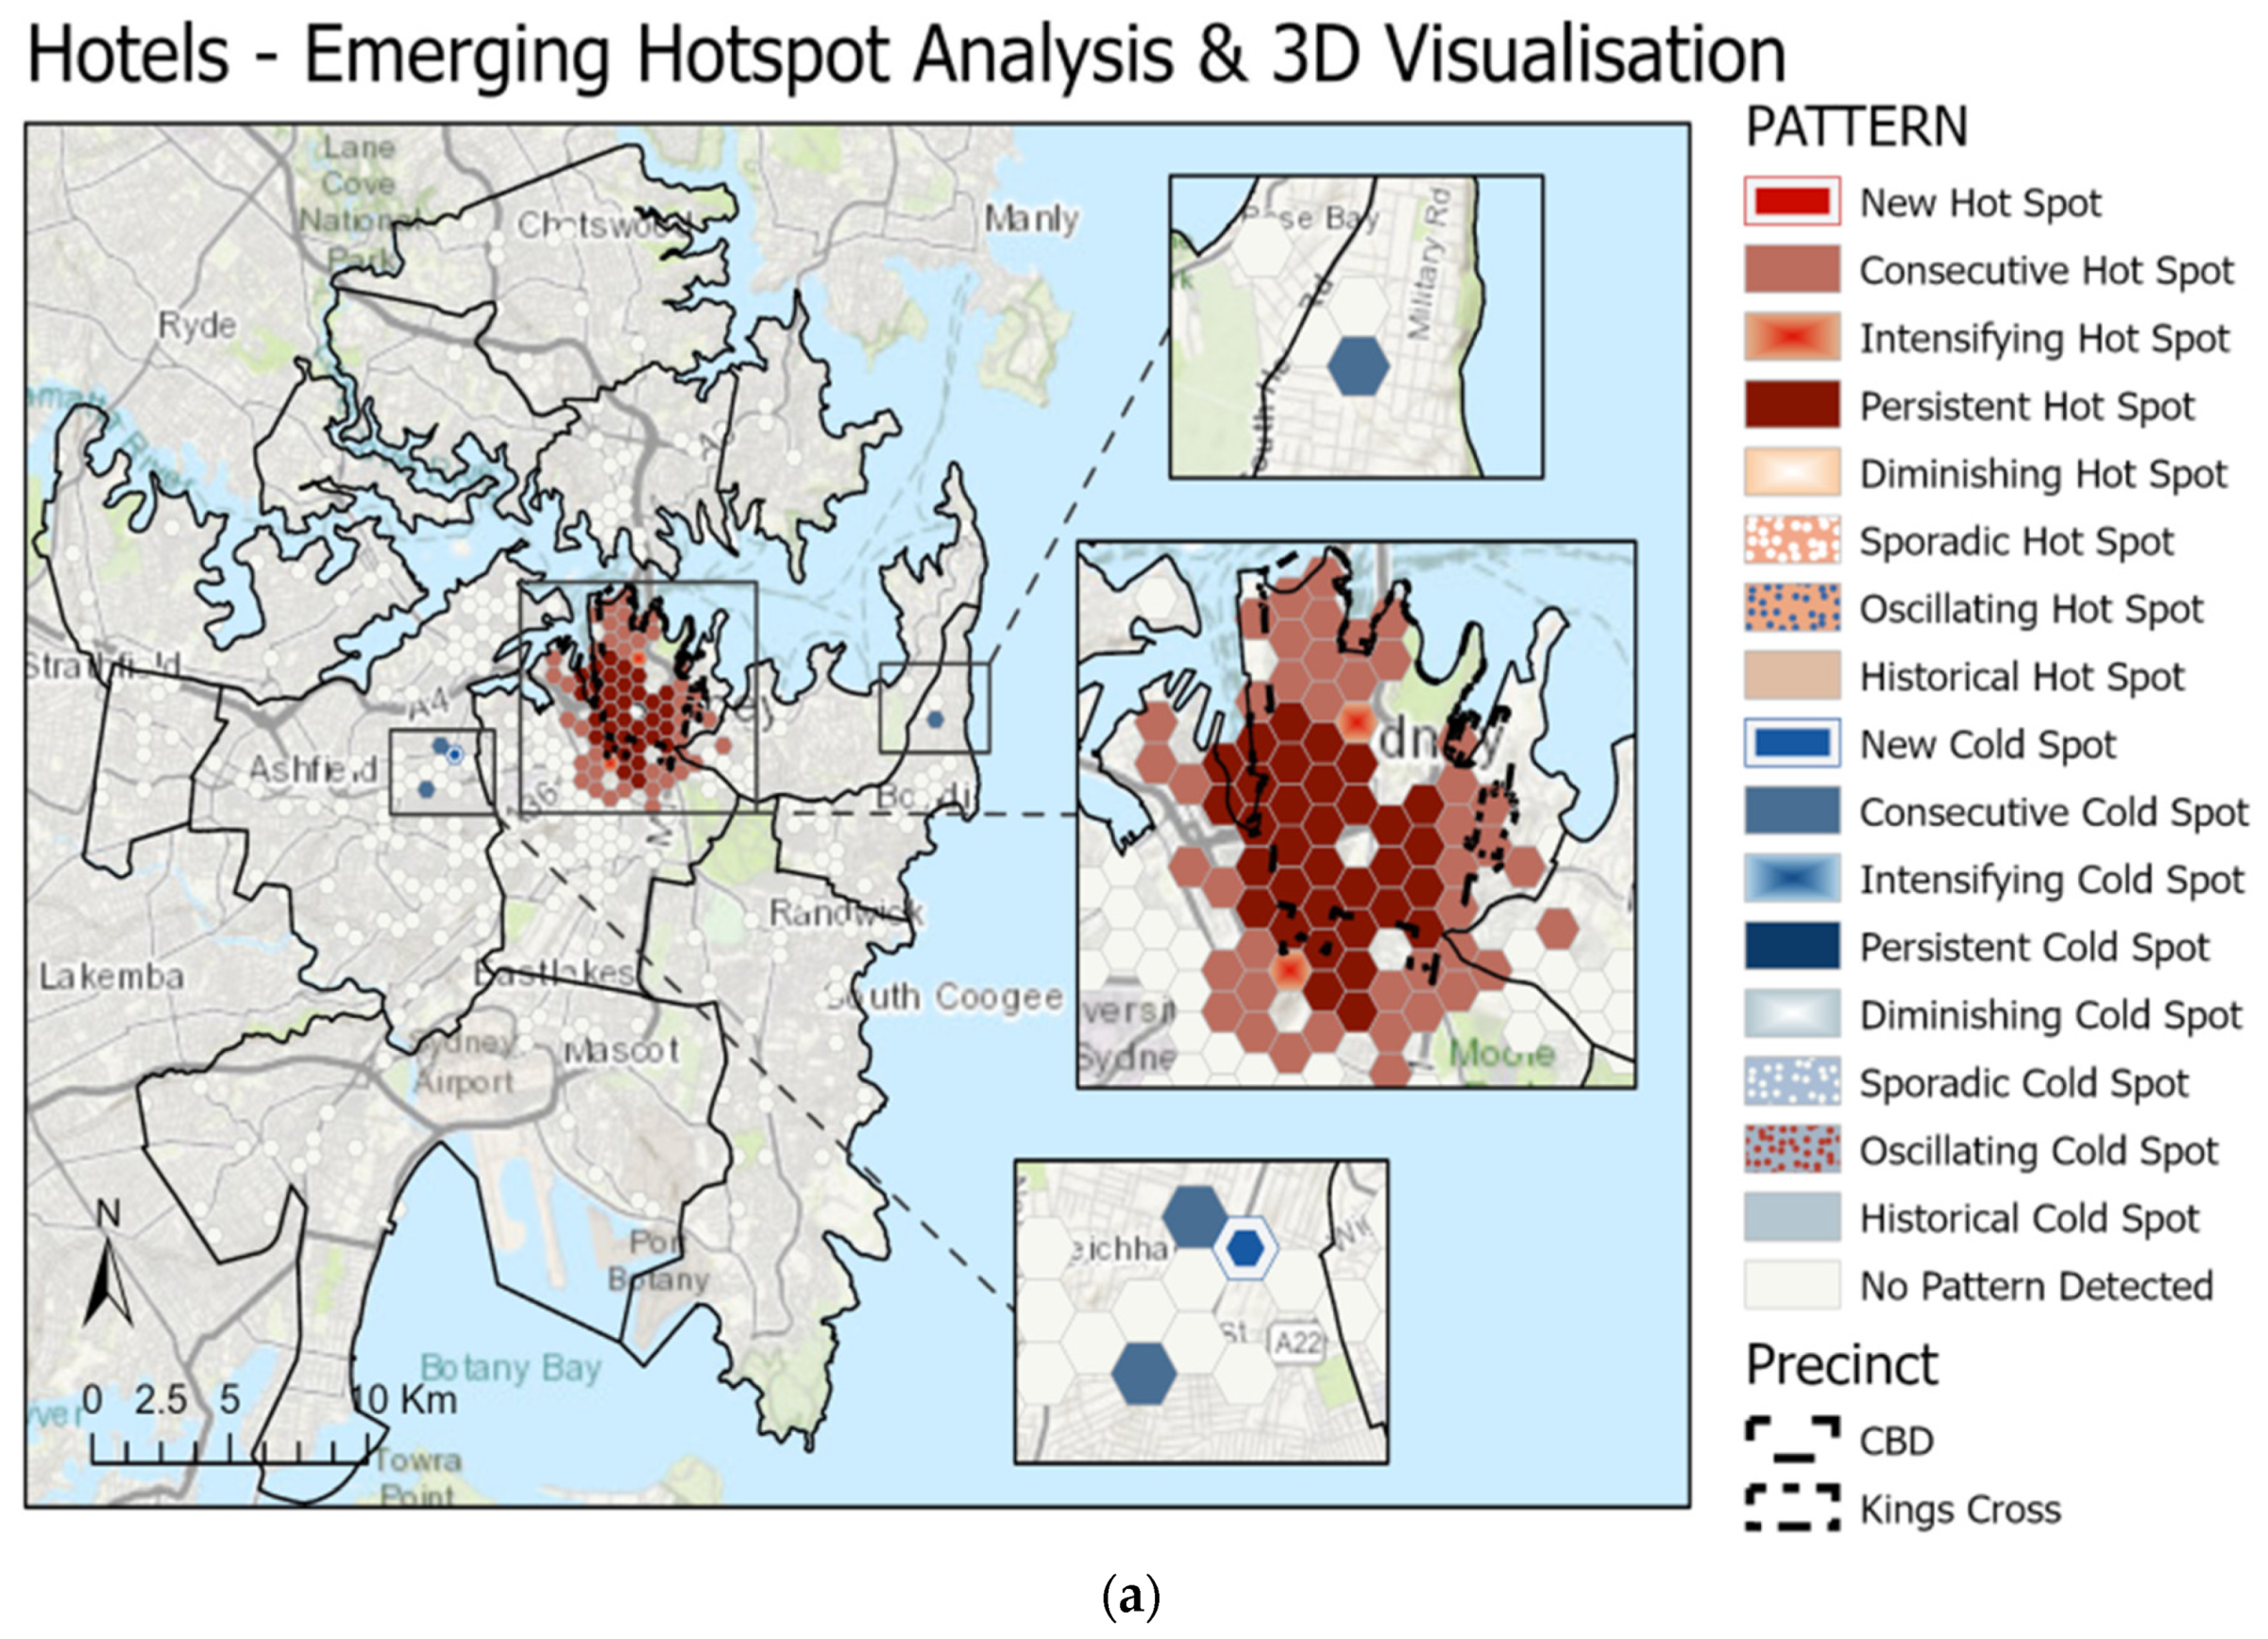
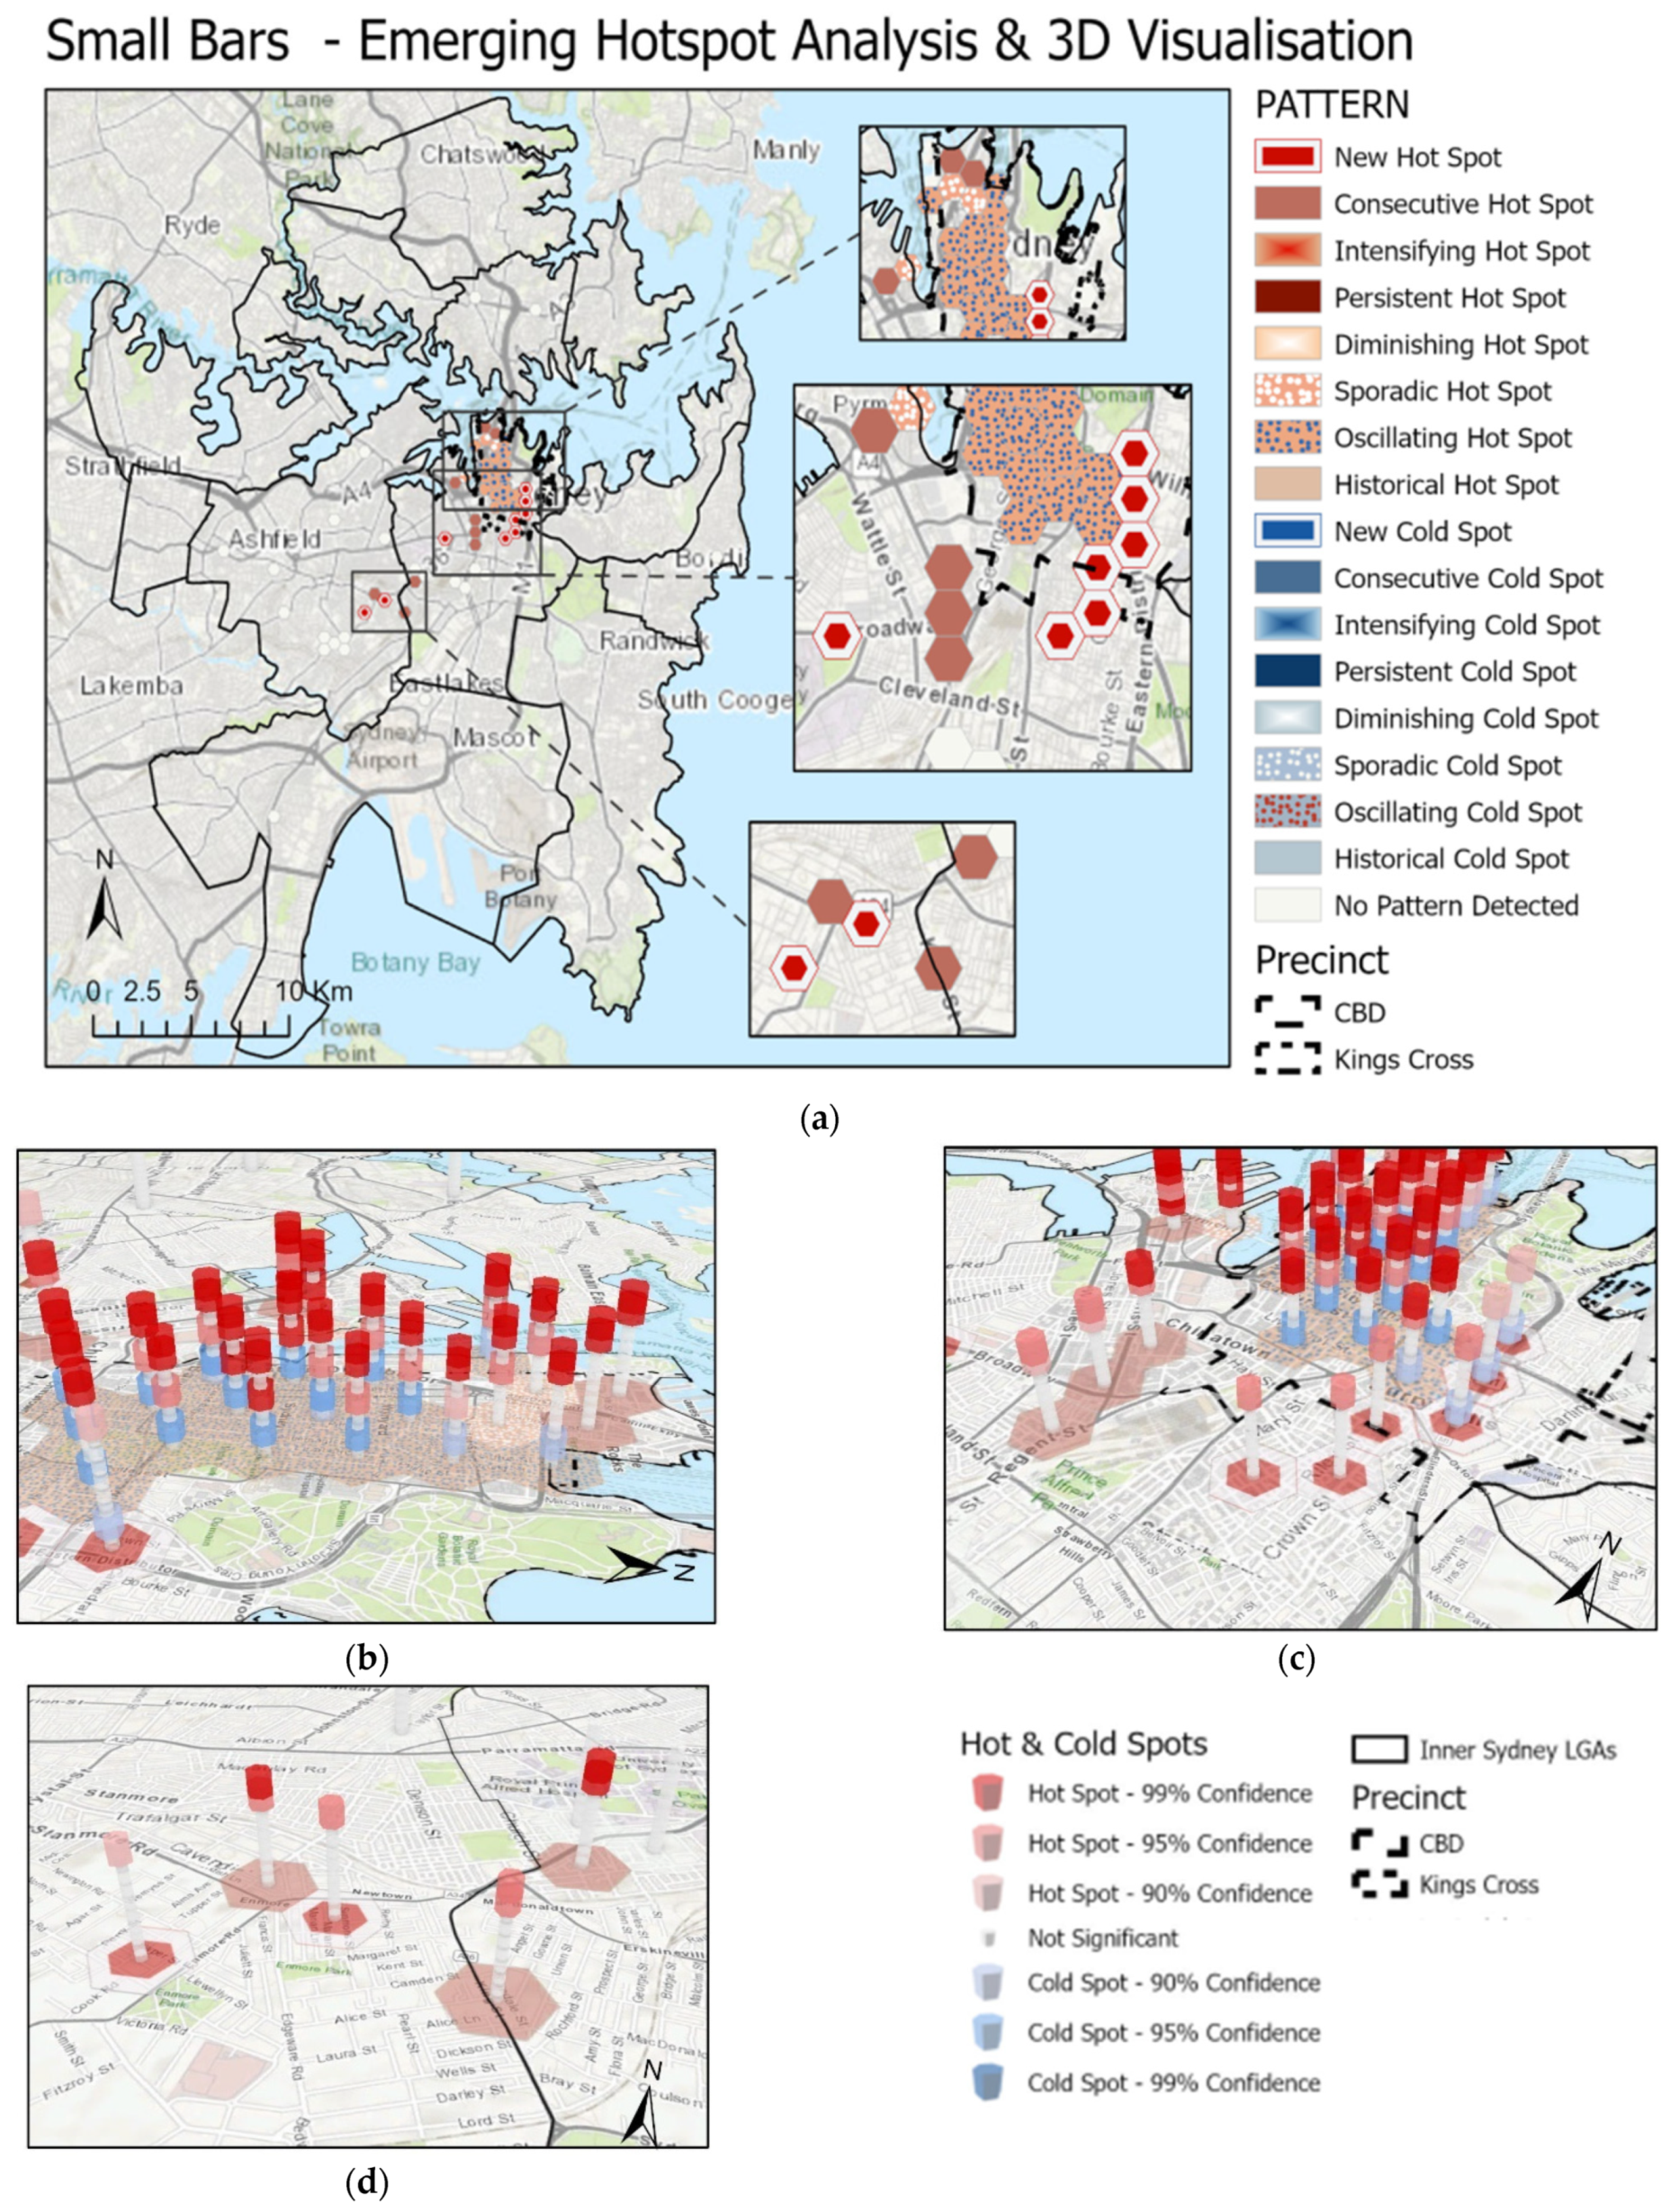
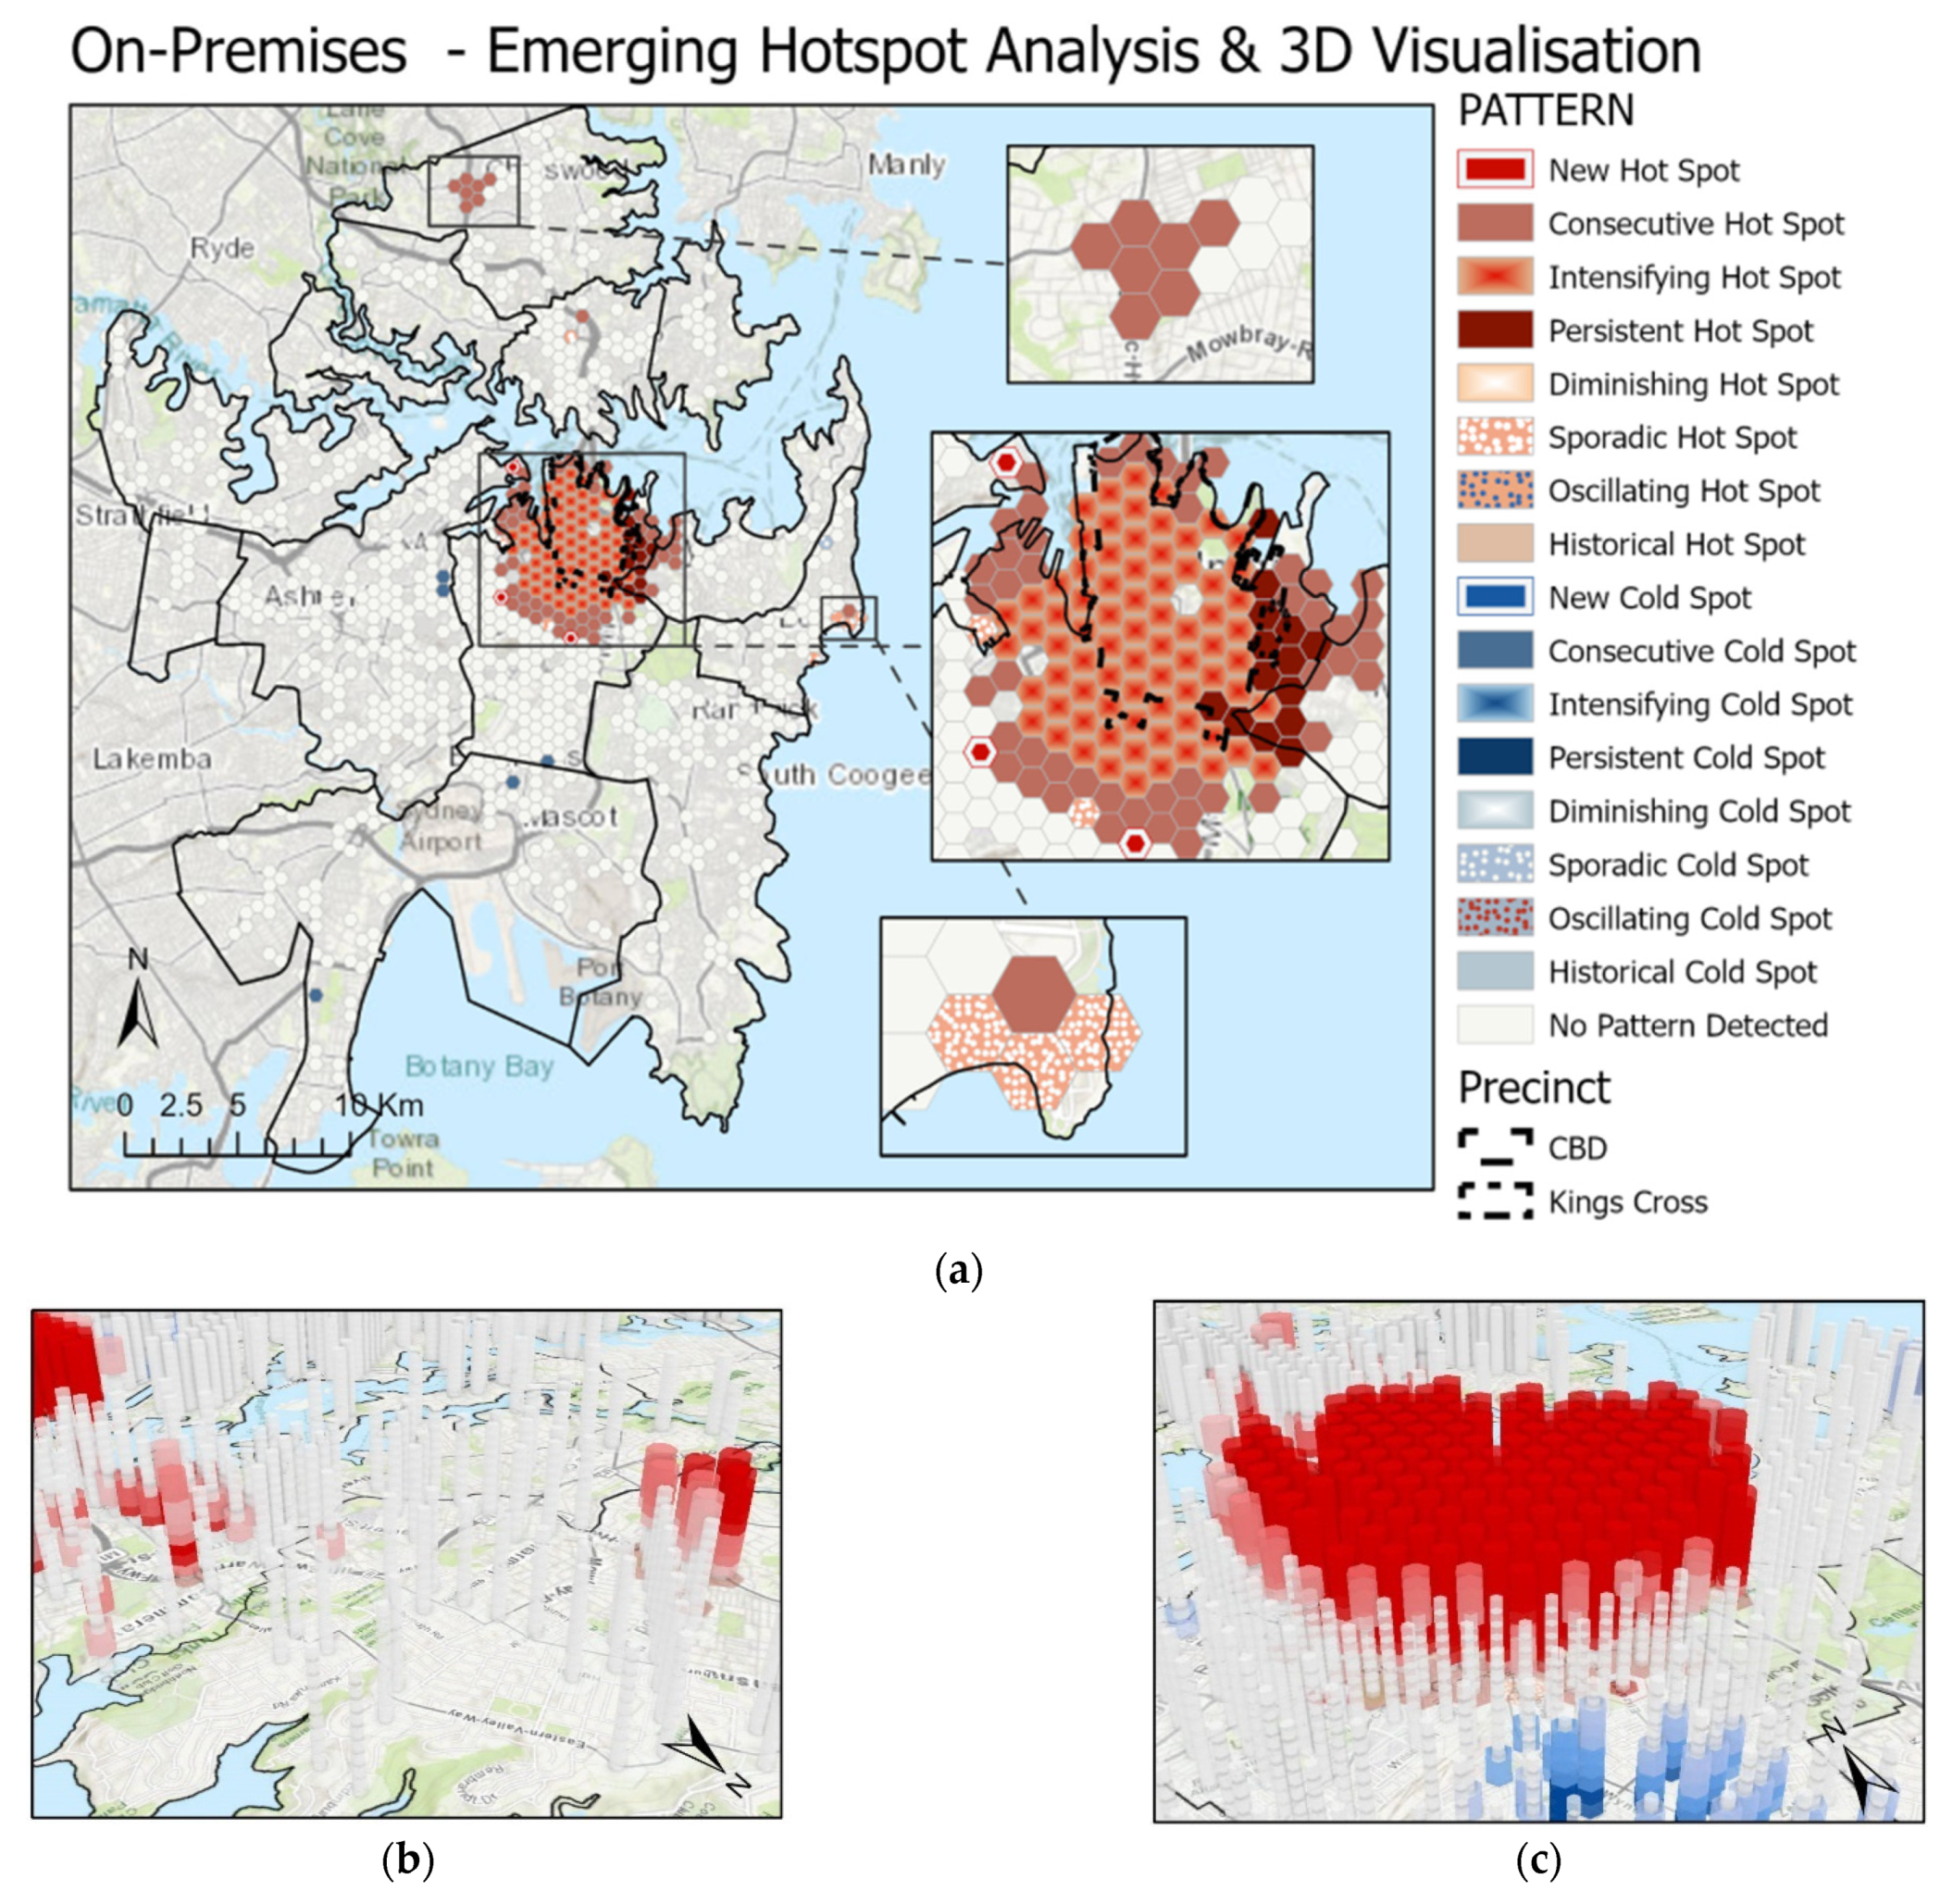
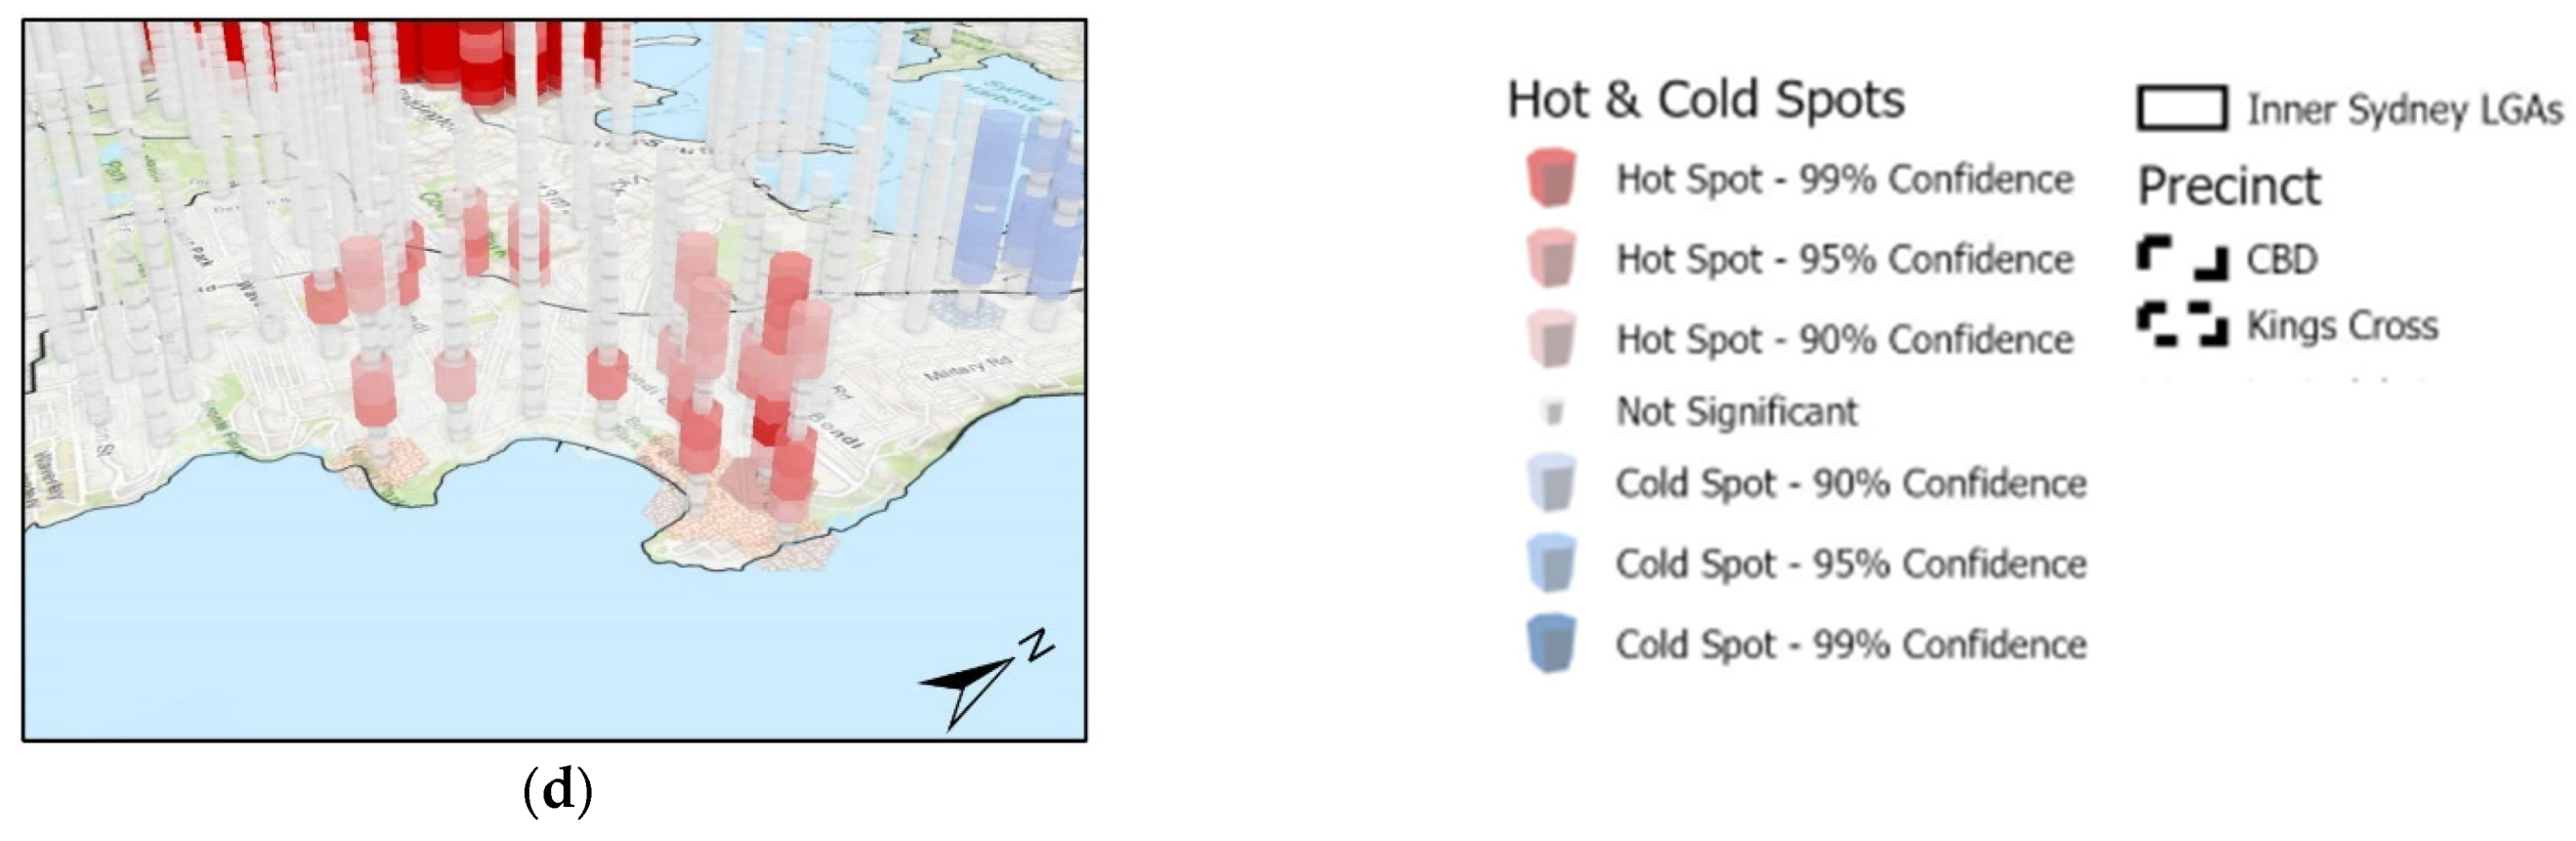
3.3. Spatio-Temporal Analysis
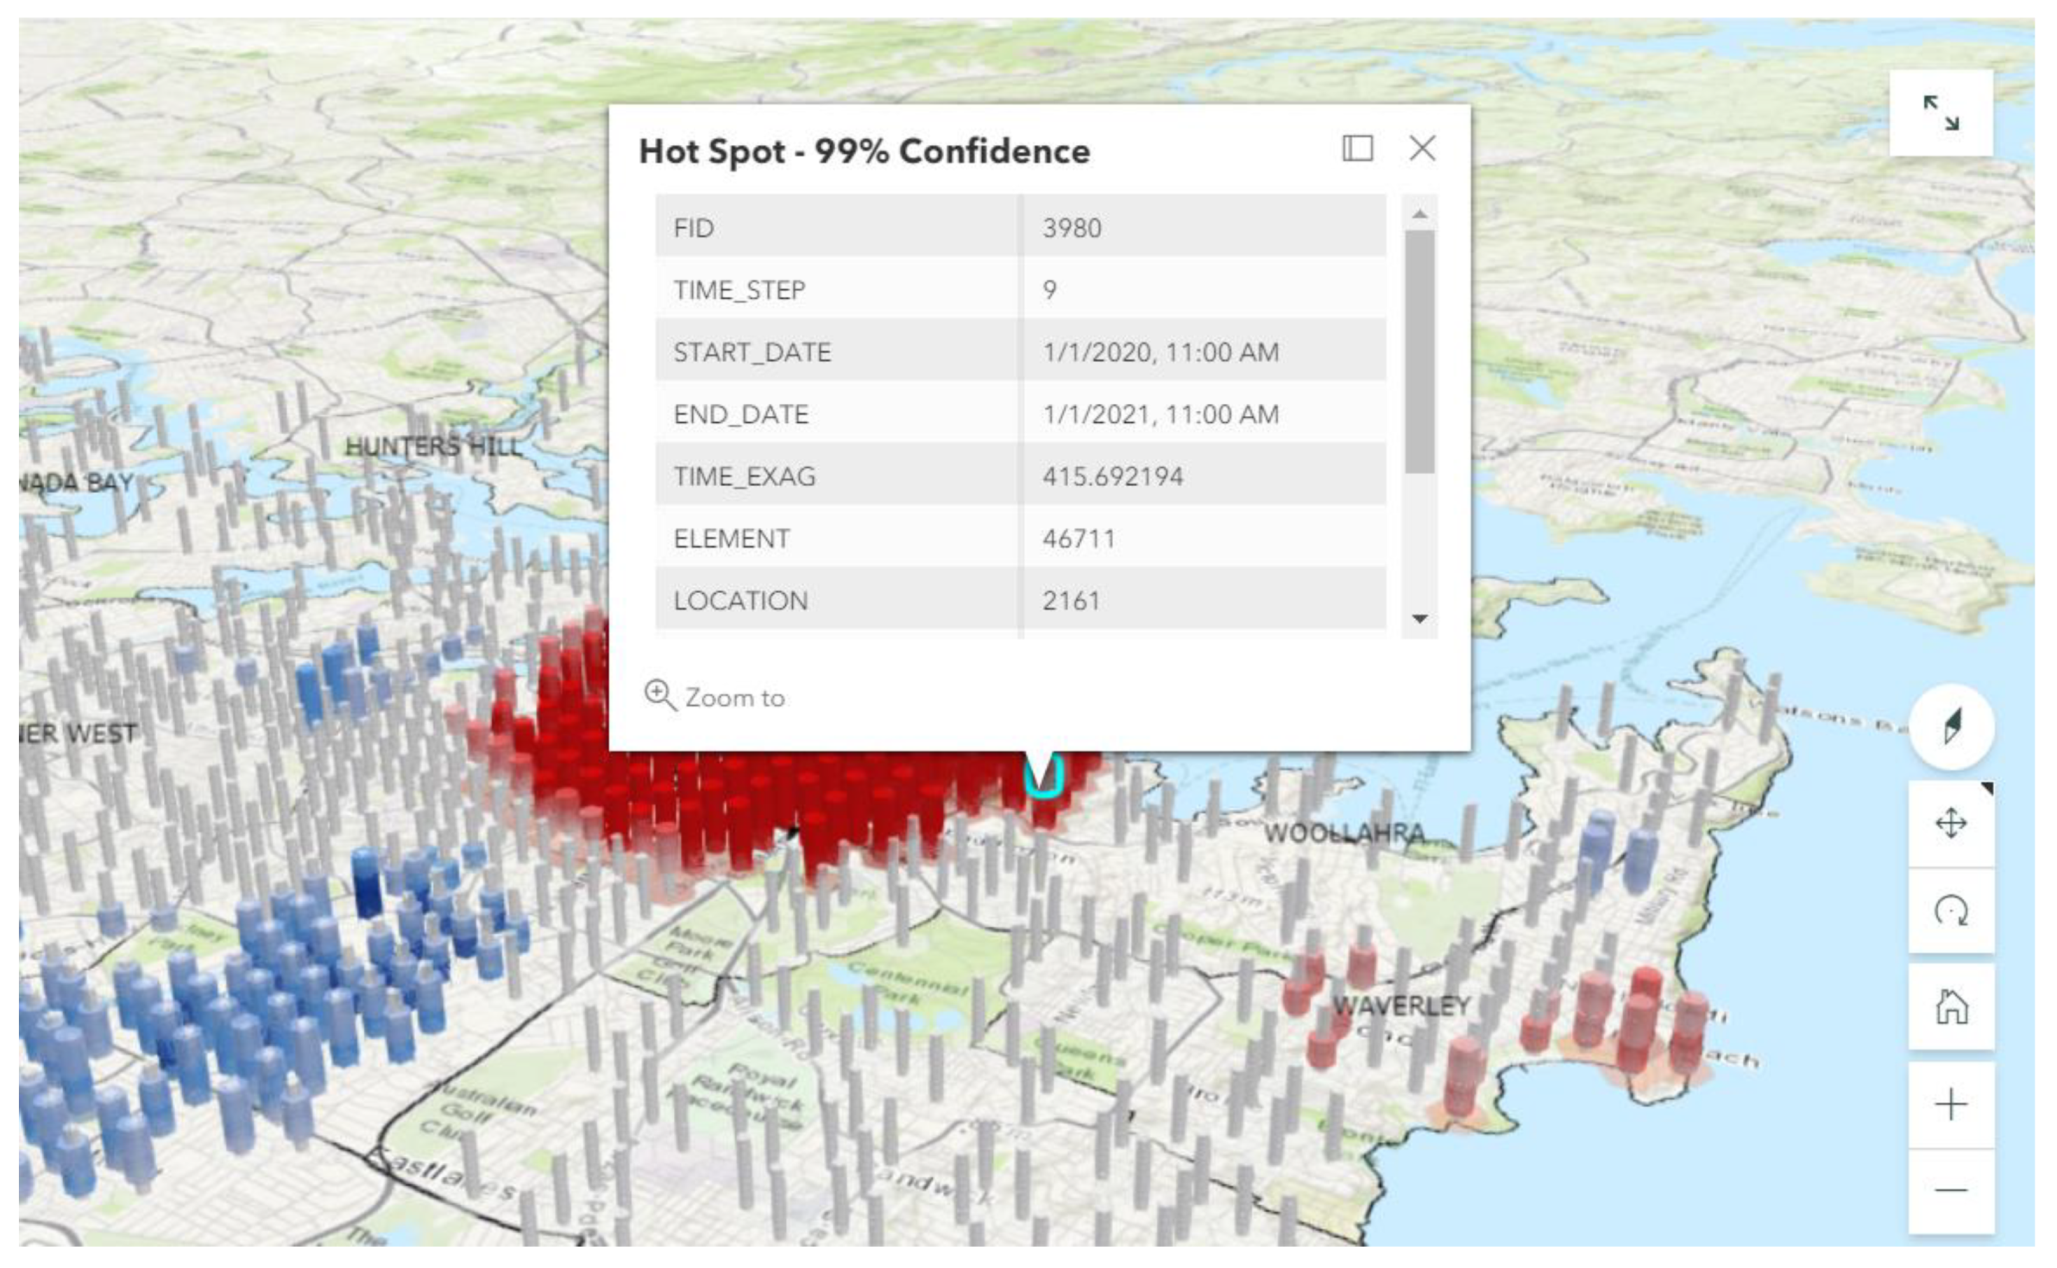
Space-Time Cube and Emerging Hotspot Analysis
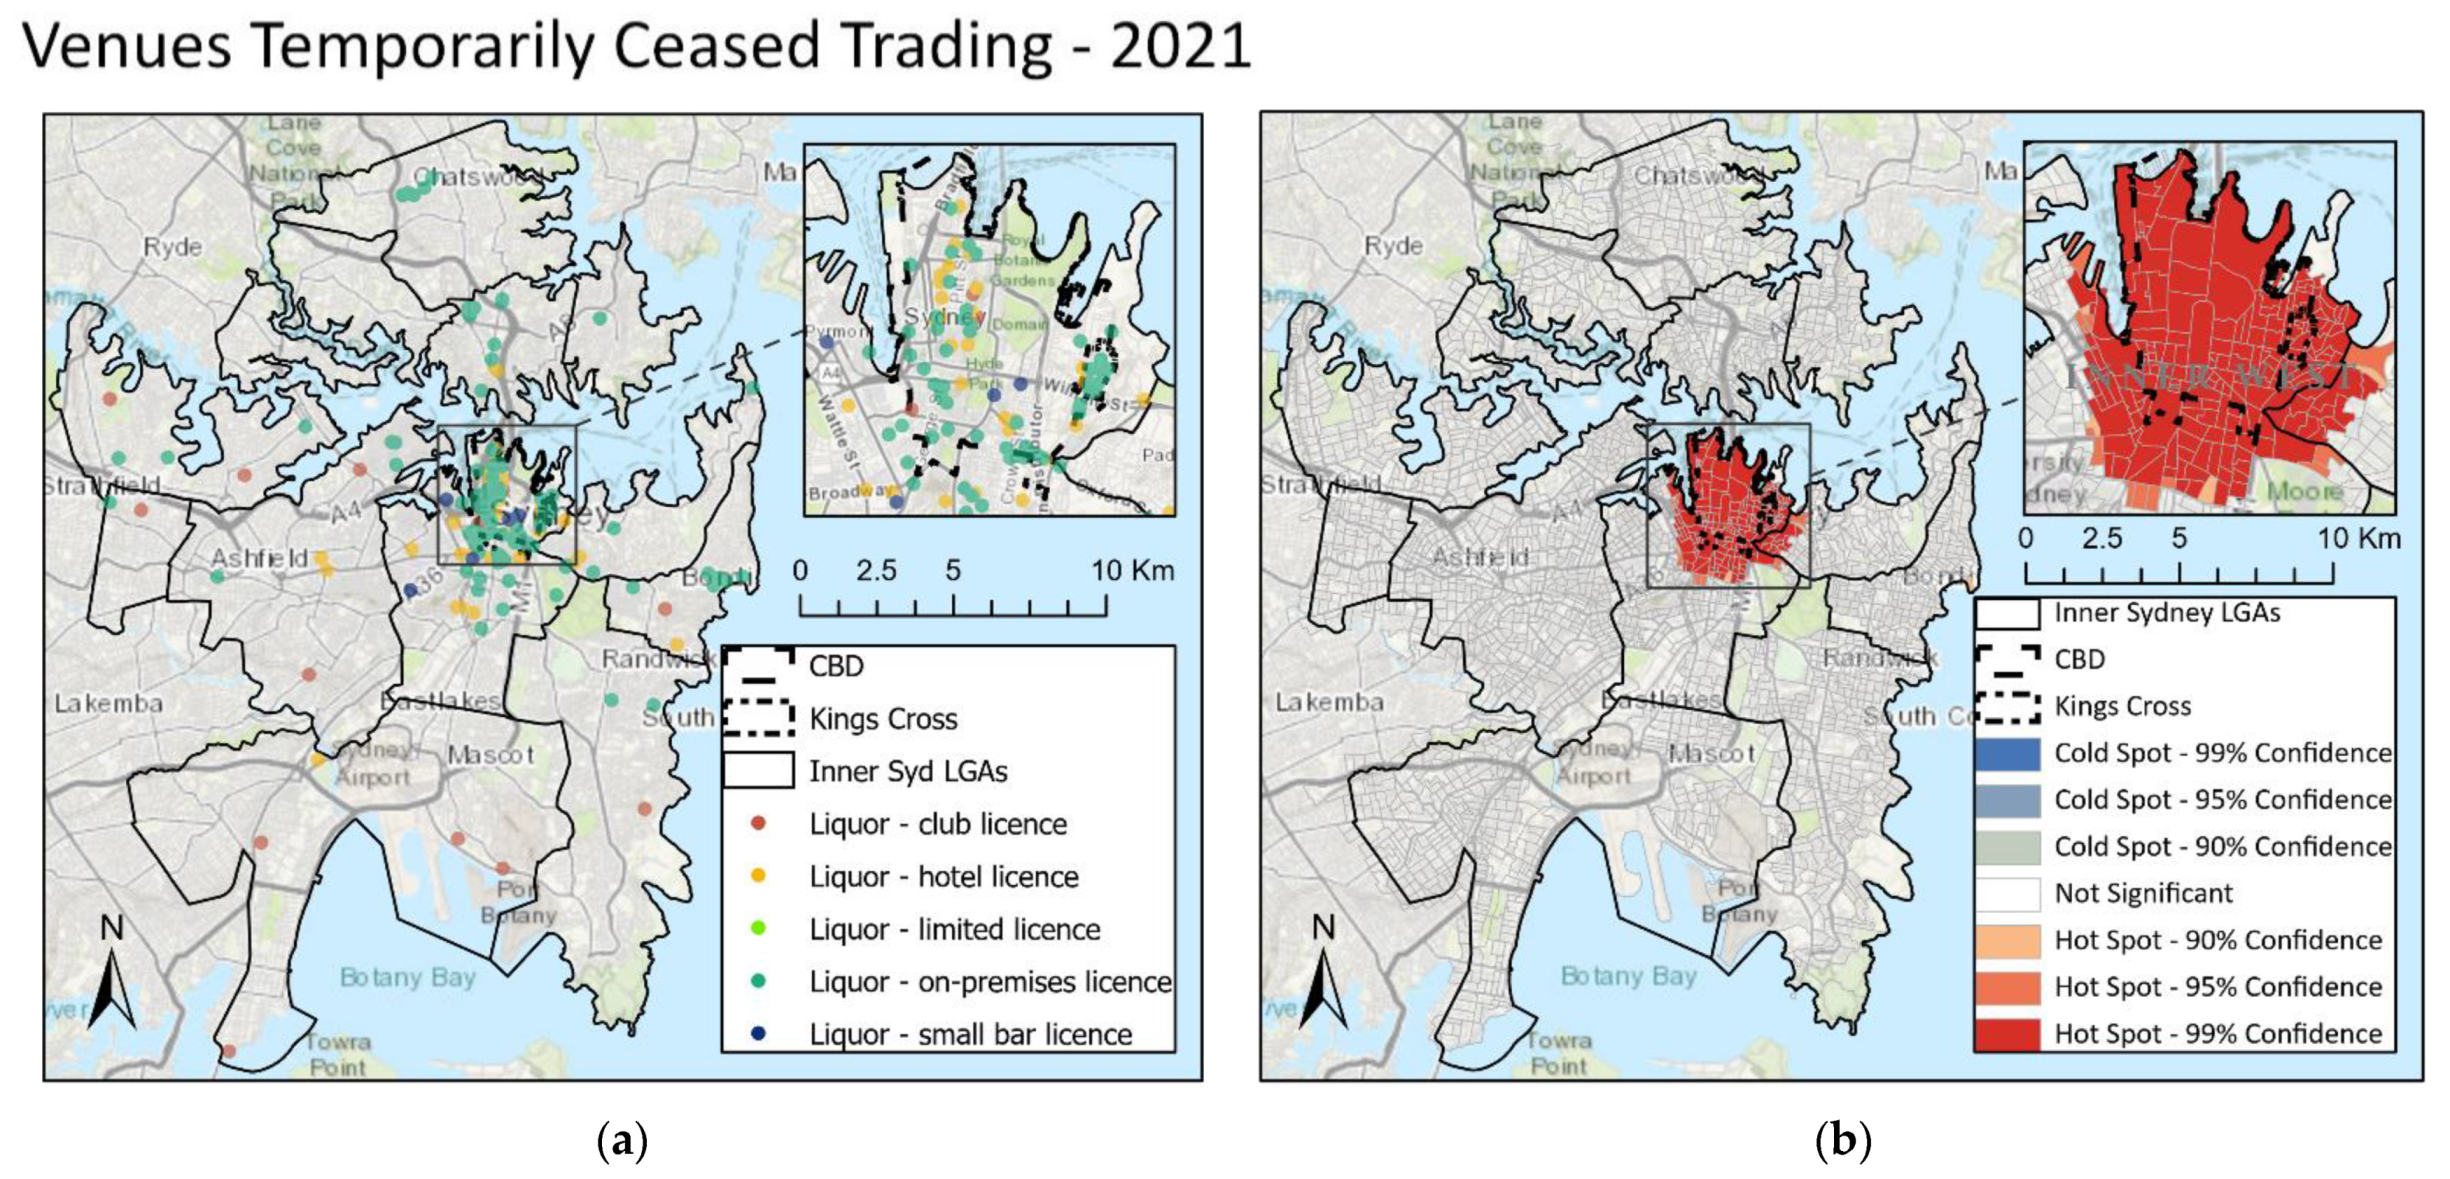
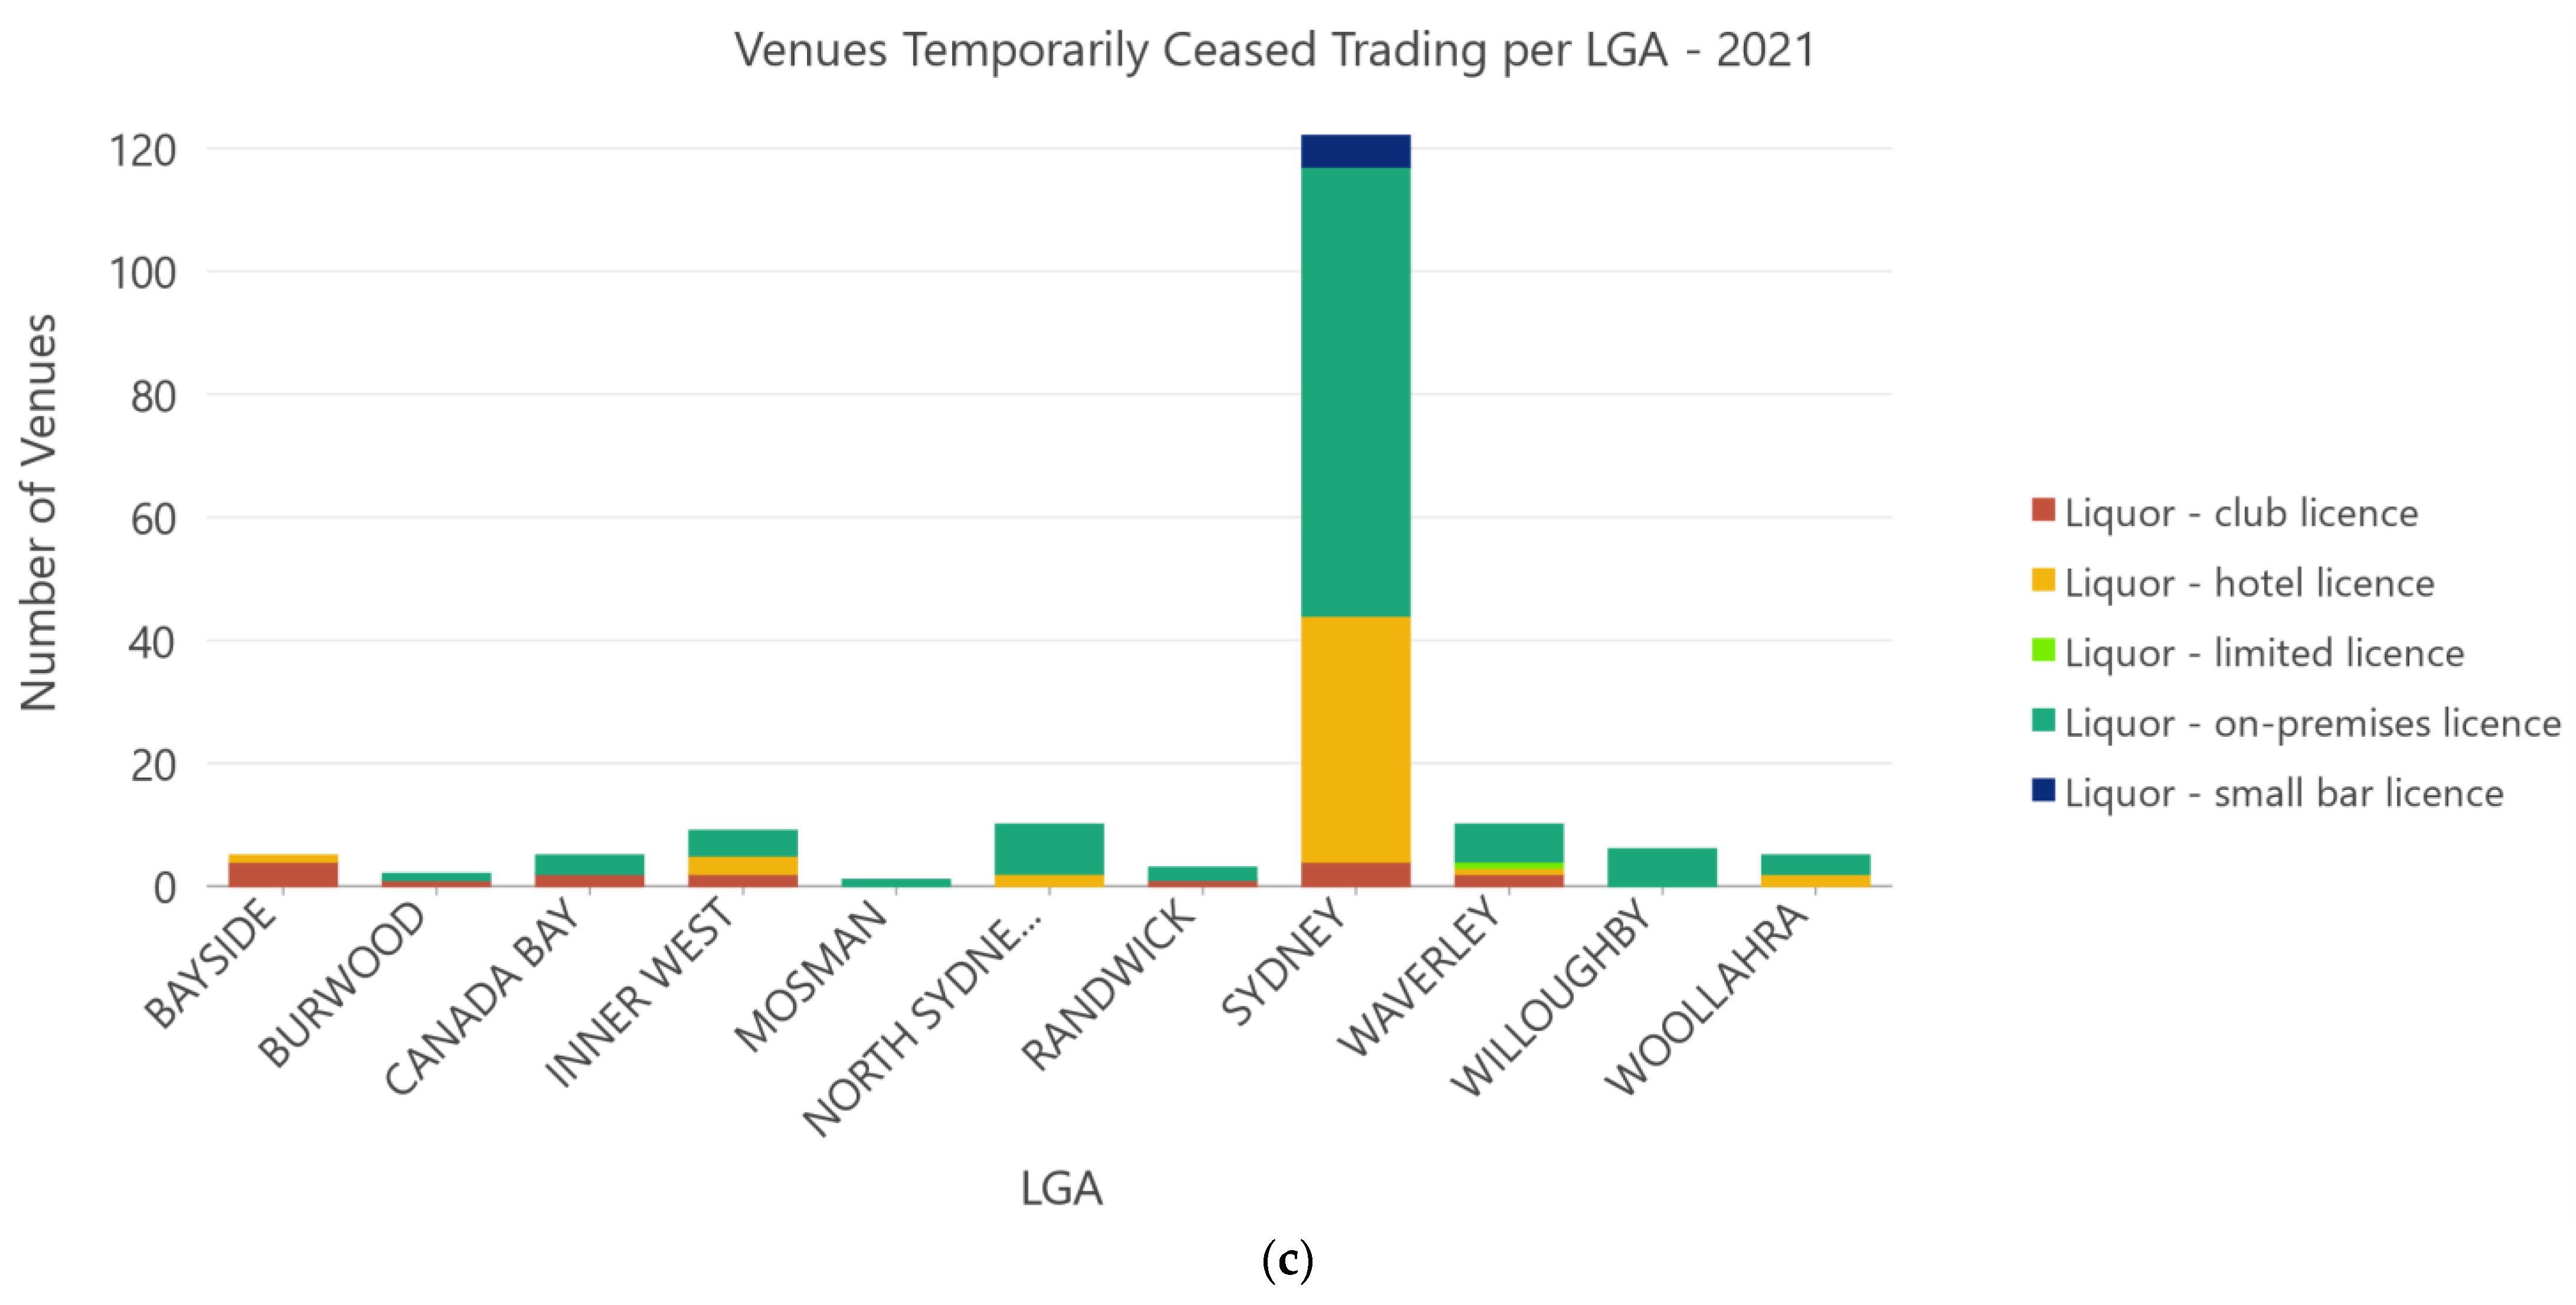
3.4. Venues Ceased Trading
3.5. Online Storymap
4. Discussion
4.1. Research Findings
4.1.1. Spatial Distribution of Venues and Relationship to LGA and Land Use Zone
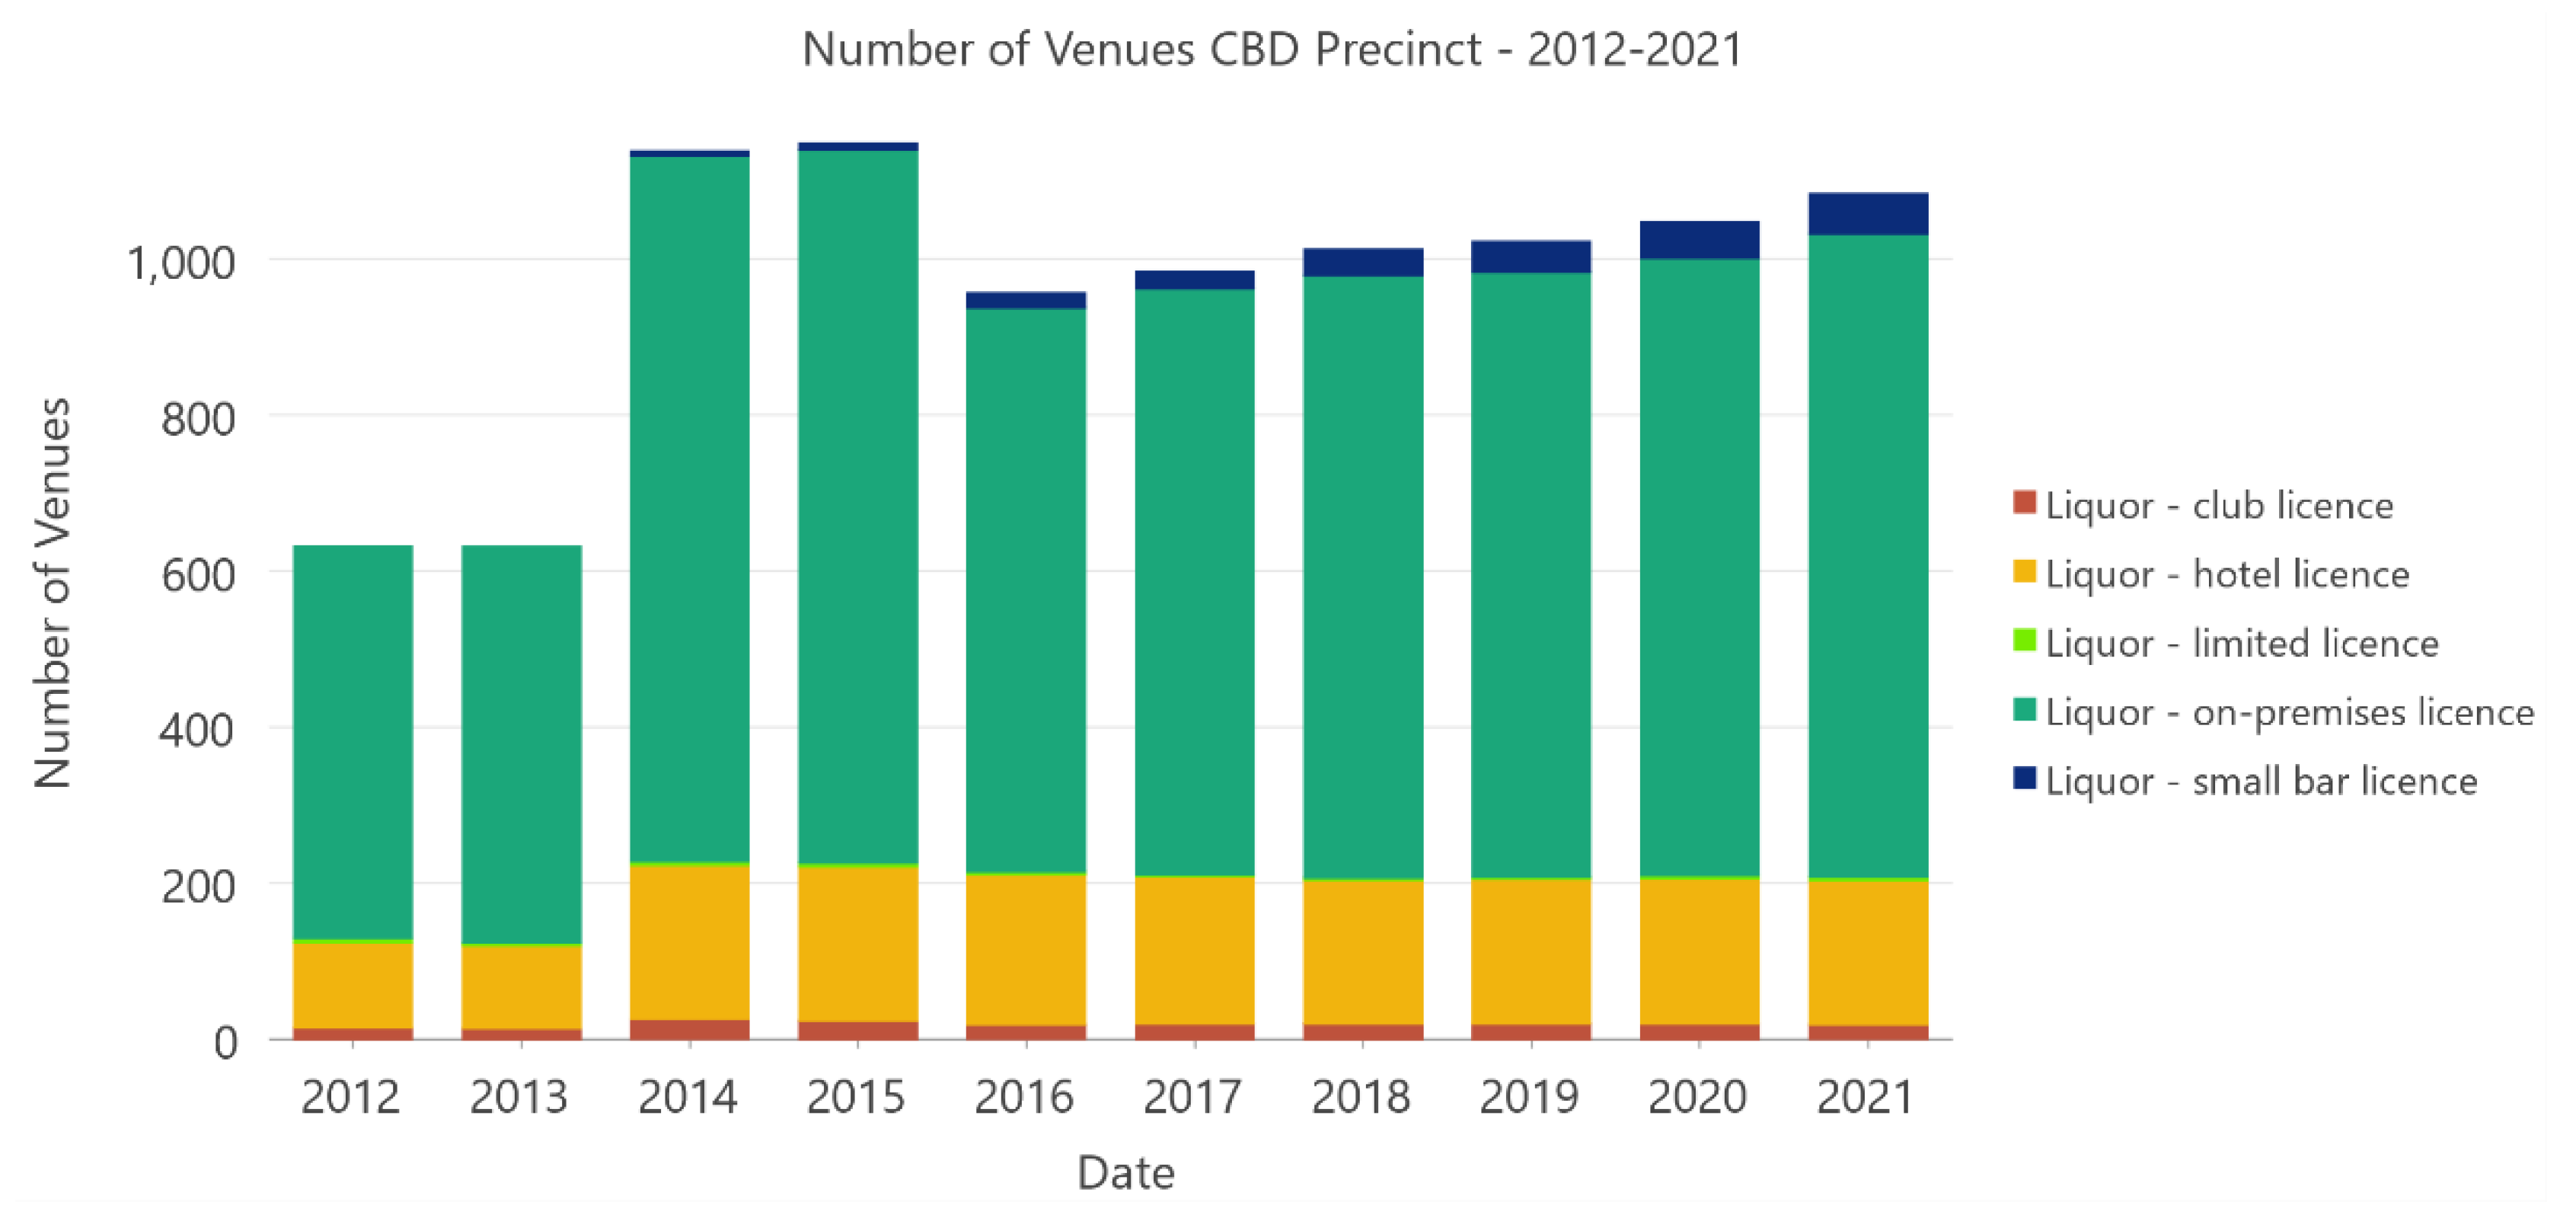
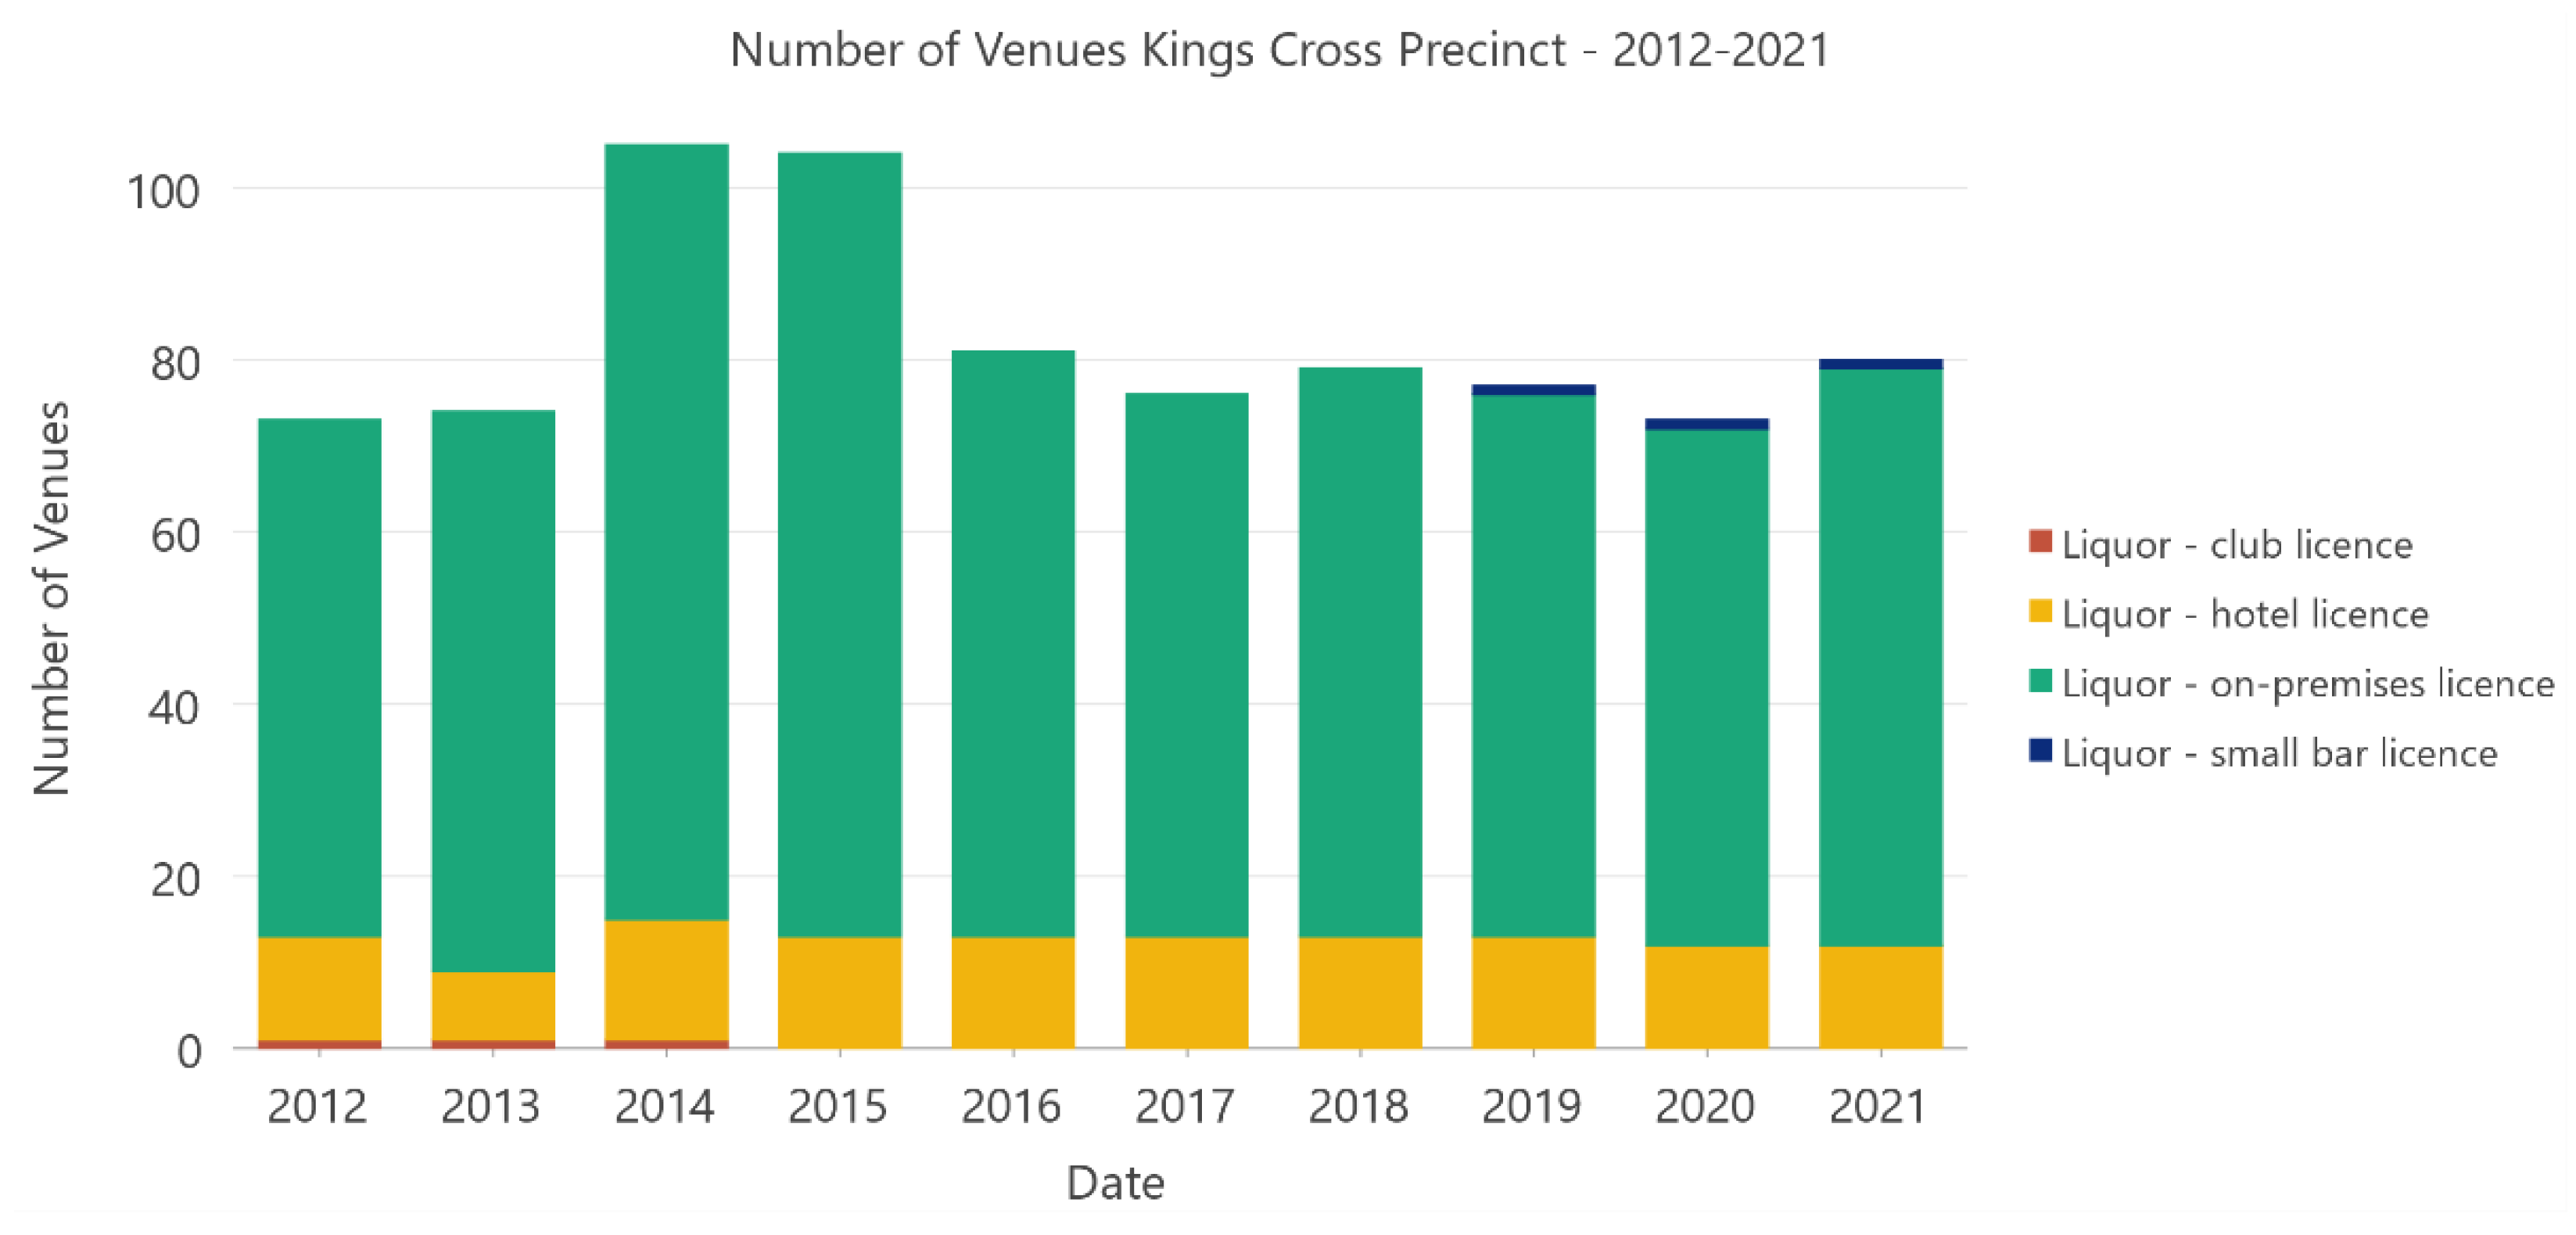
4.1.2. Trends over Time: 2012–2021
4.1.3. Impact of Lockout Laws and COVID-19 Lockdowns
4.1.4. Storymap Display
4.2. Limitations and Further Research
5. Conclusions
- Most venues were located in the Sydney CBD on business-zoned land and showed a high degree of spatial clustering. This clustering was consistent over time, with variations between venue types;
- Venue numbers declined following the introduction of the lockout laws, with numbers steadily recovering in the following years;
- There was no discernible change in the number of venues following the COVID-19 lockdowns; however, economic data suggest that there has been a decline in revenue. Some venues were identified as having temporarily ceased trading, with these clustered in the Sydney CBD.
Author Contributions
Funding
Data Availability Statement
Conflicts of Interest
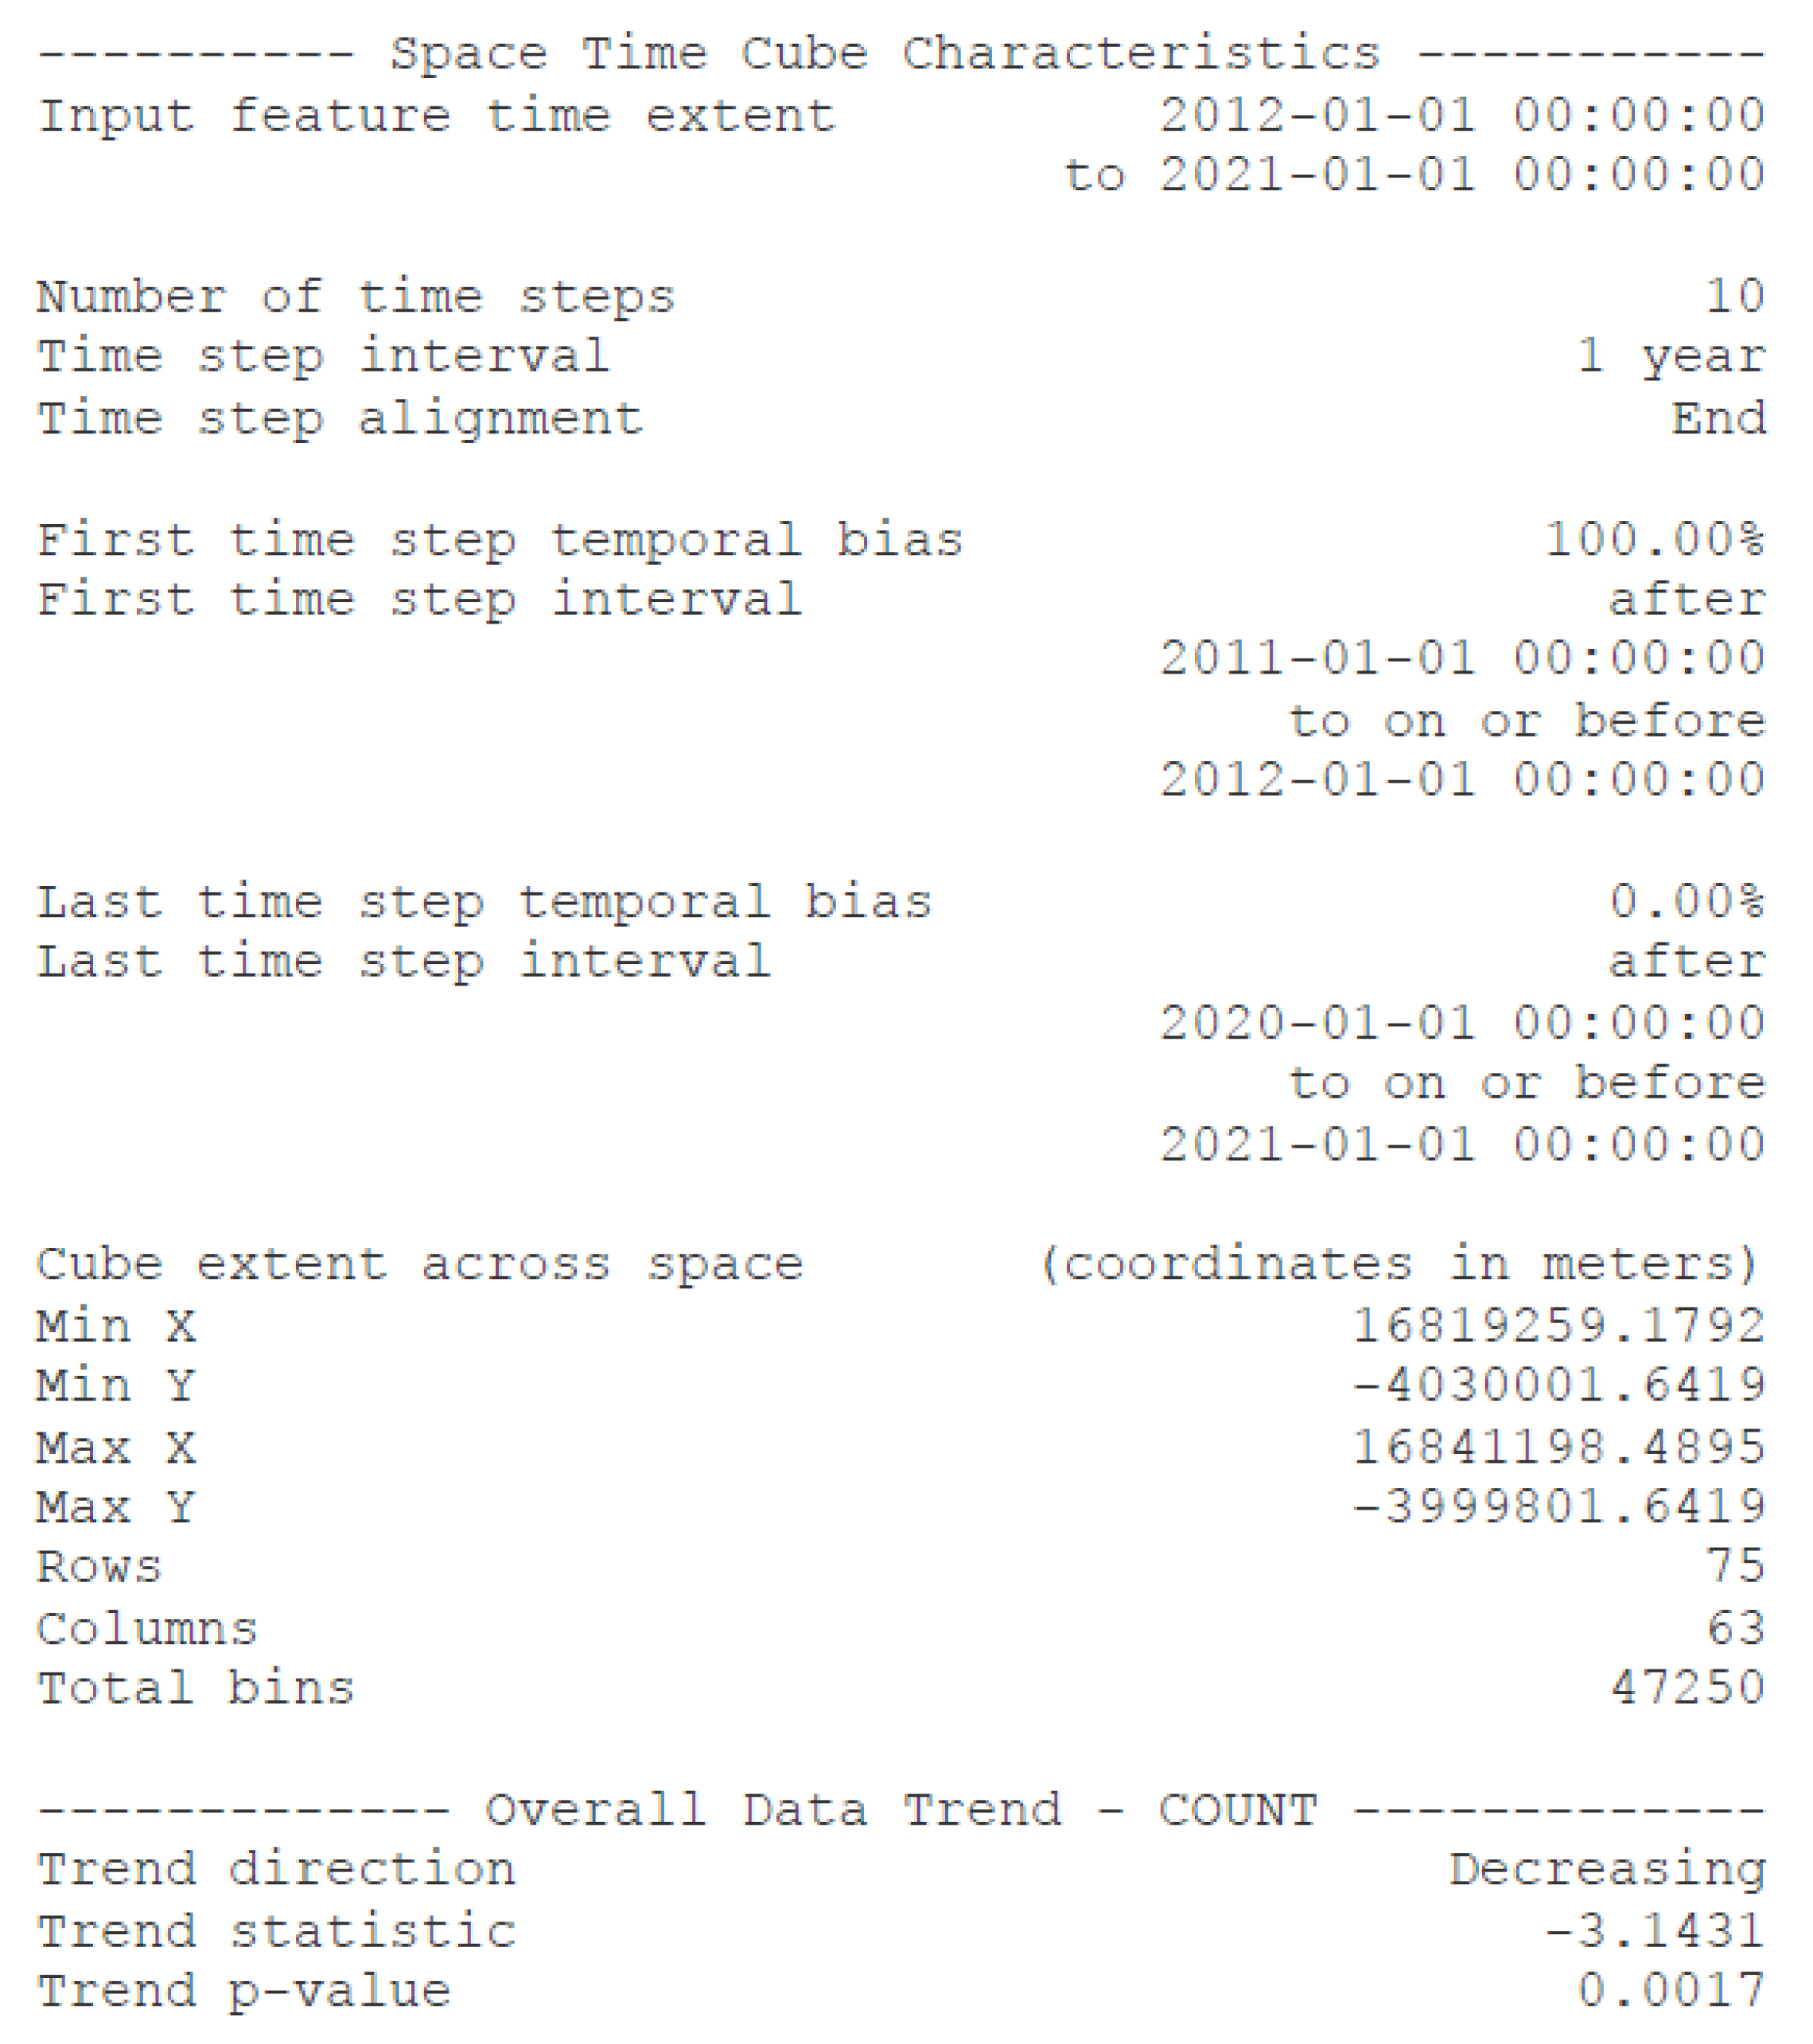
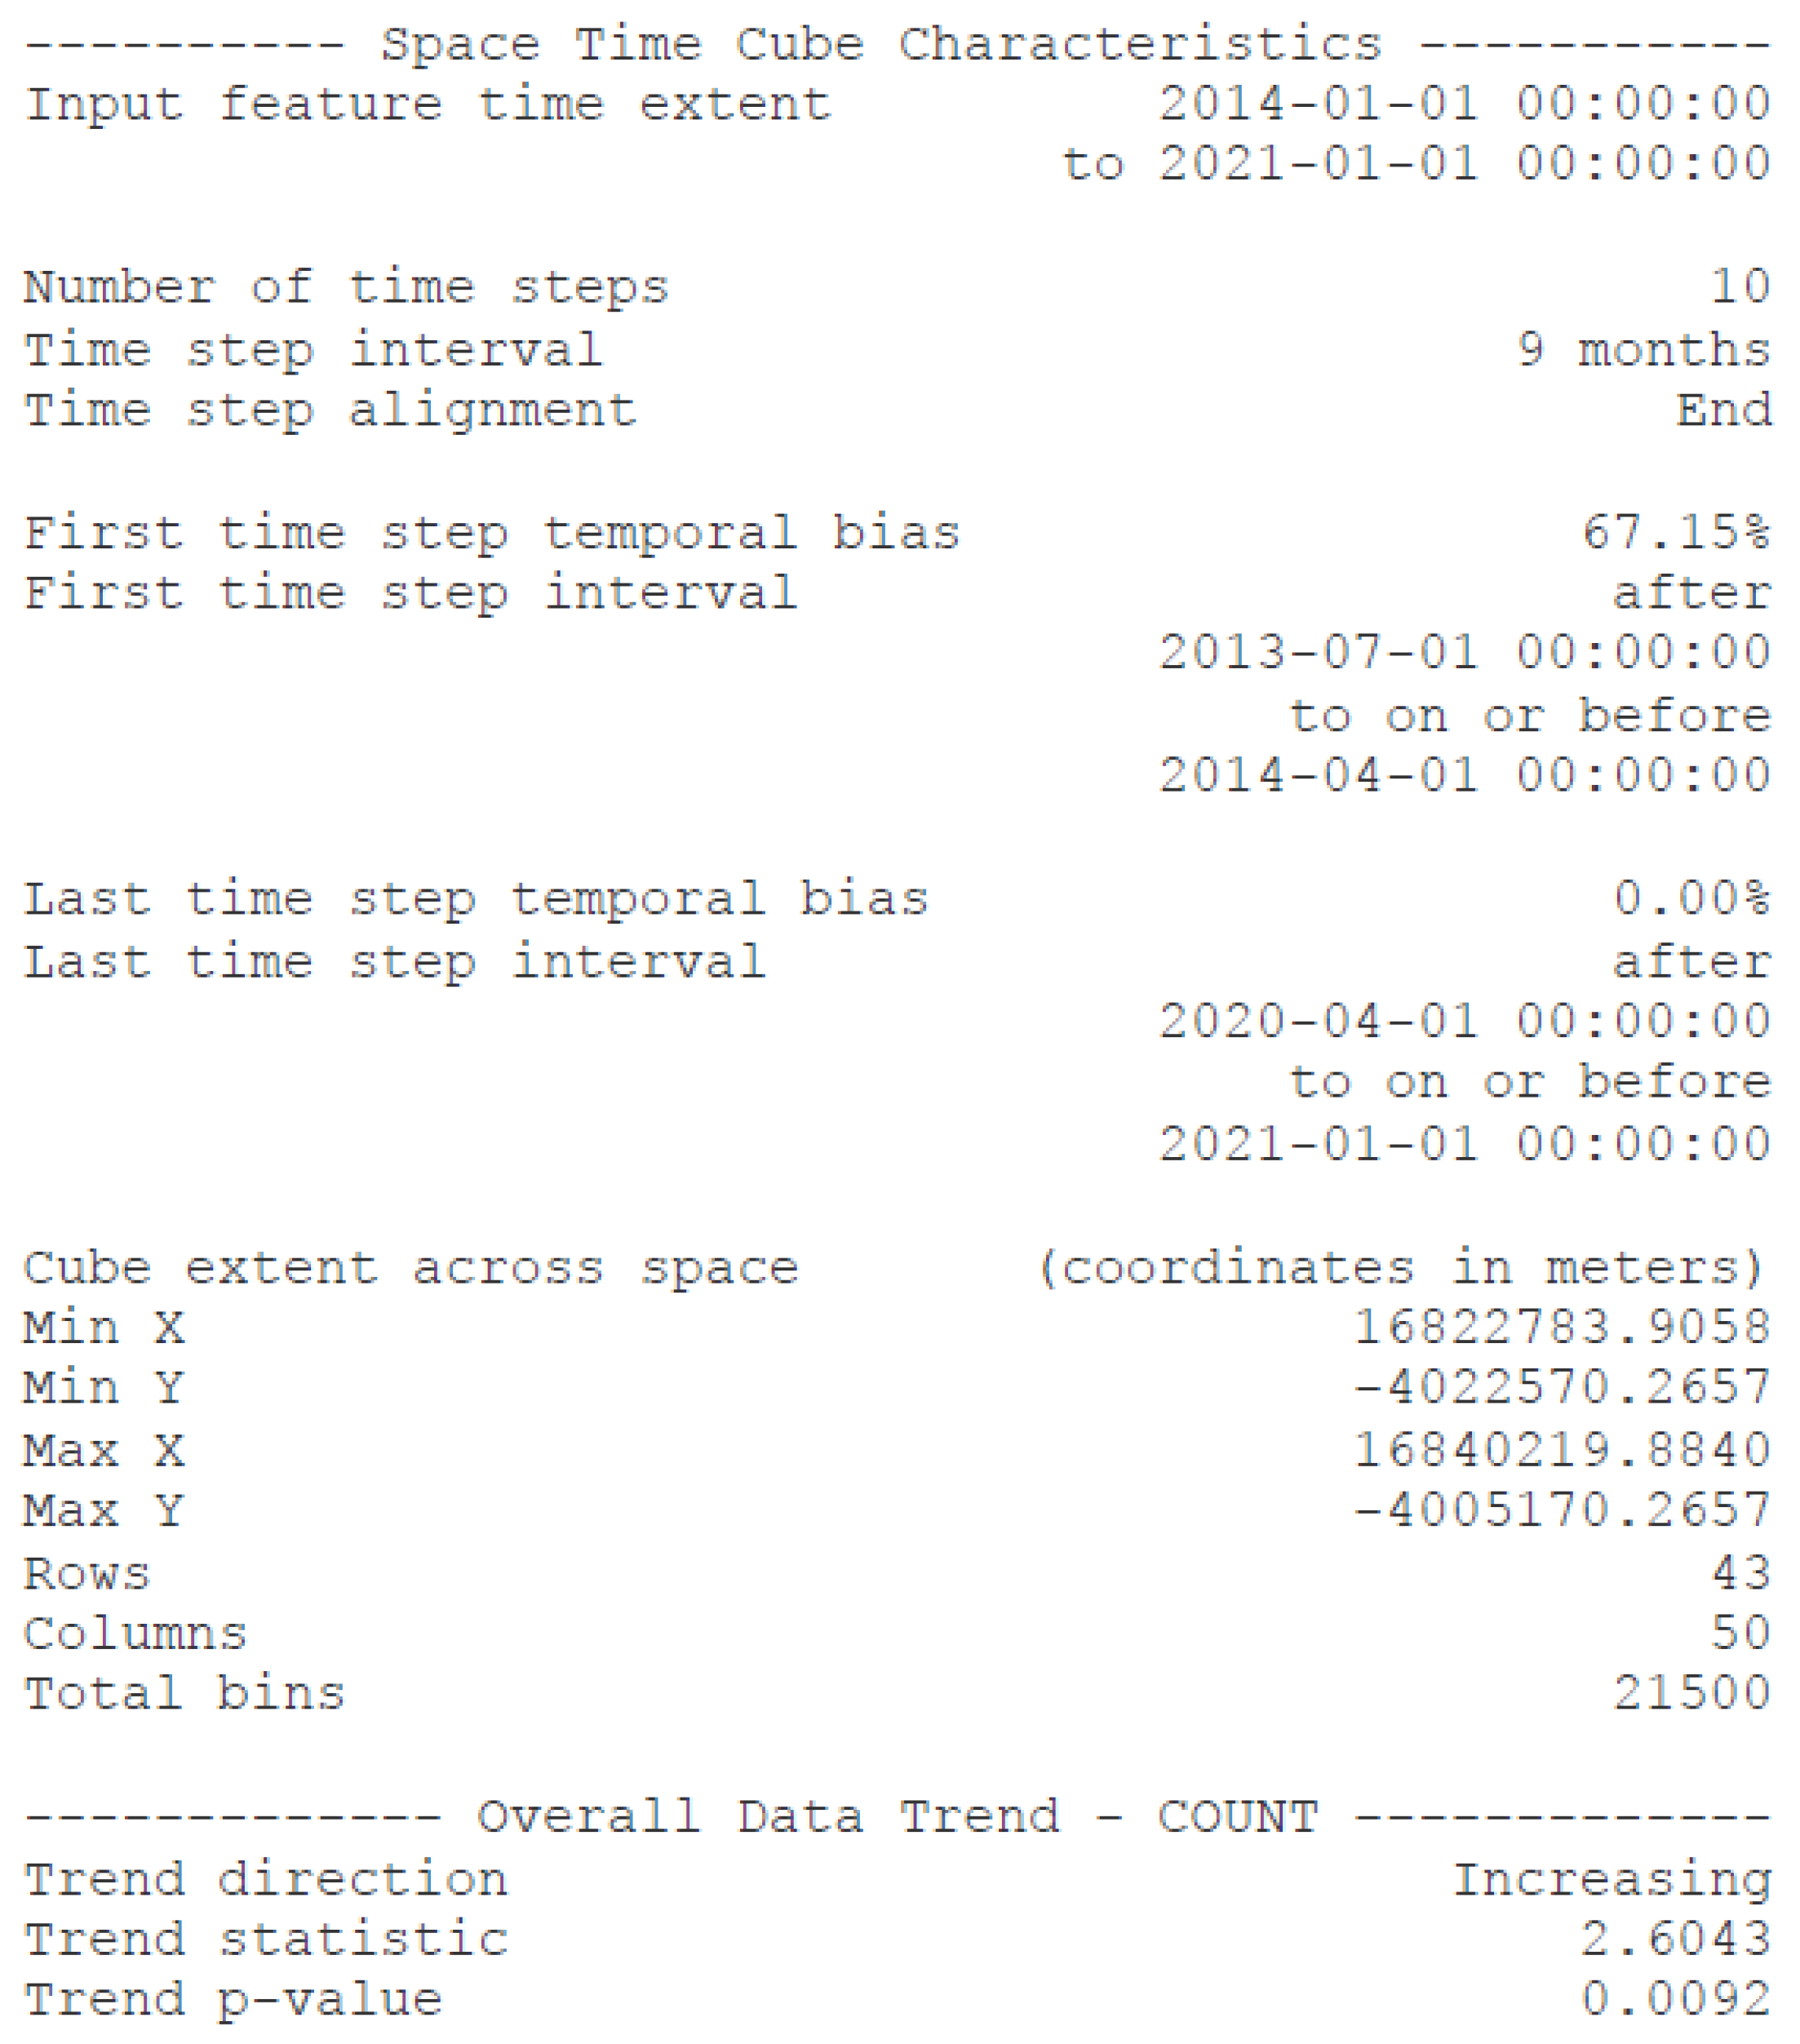
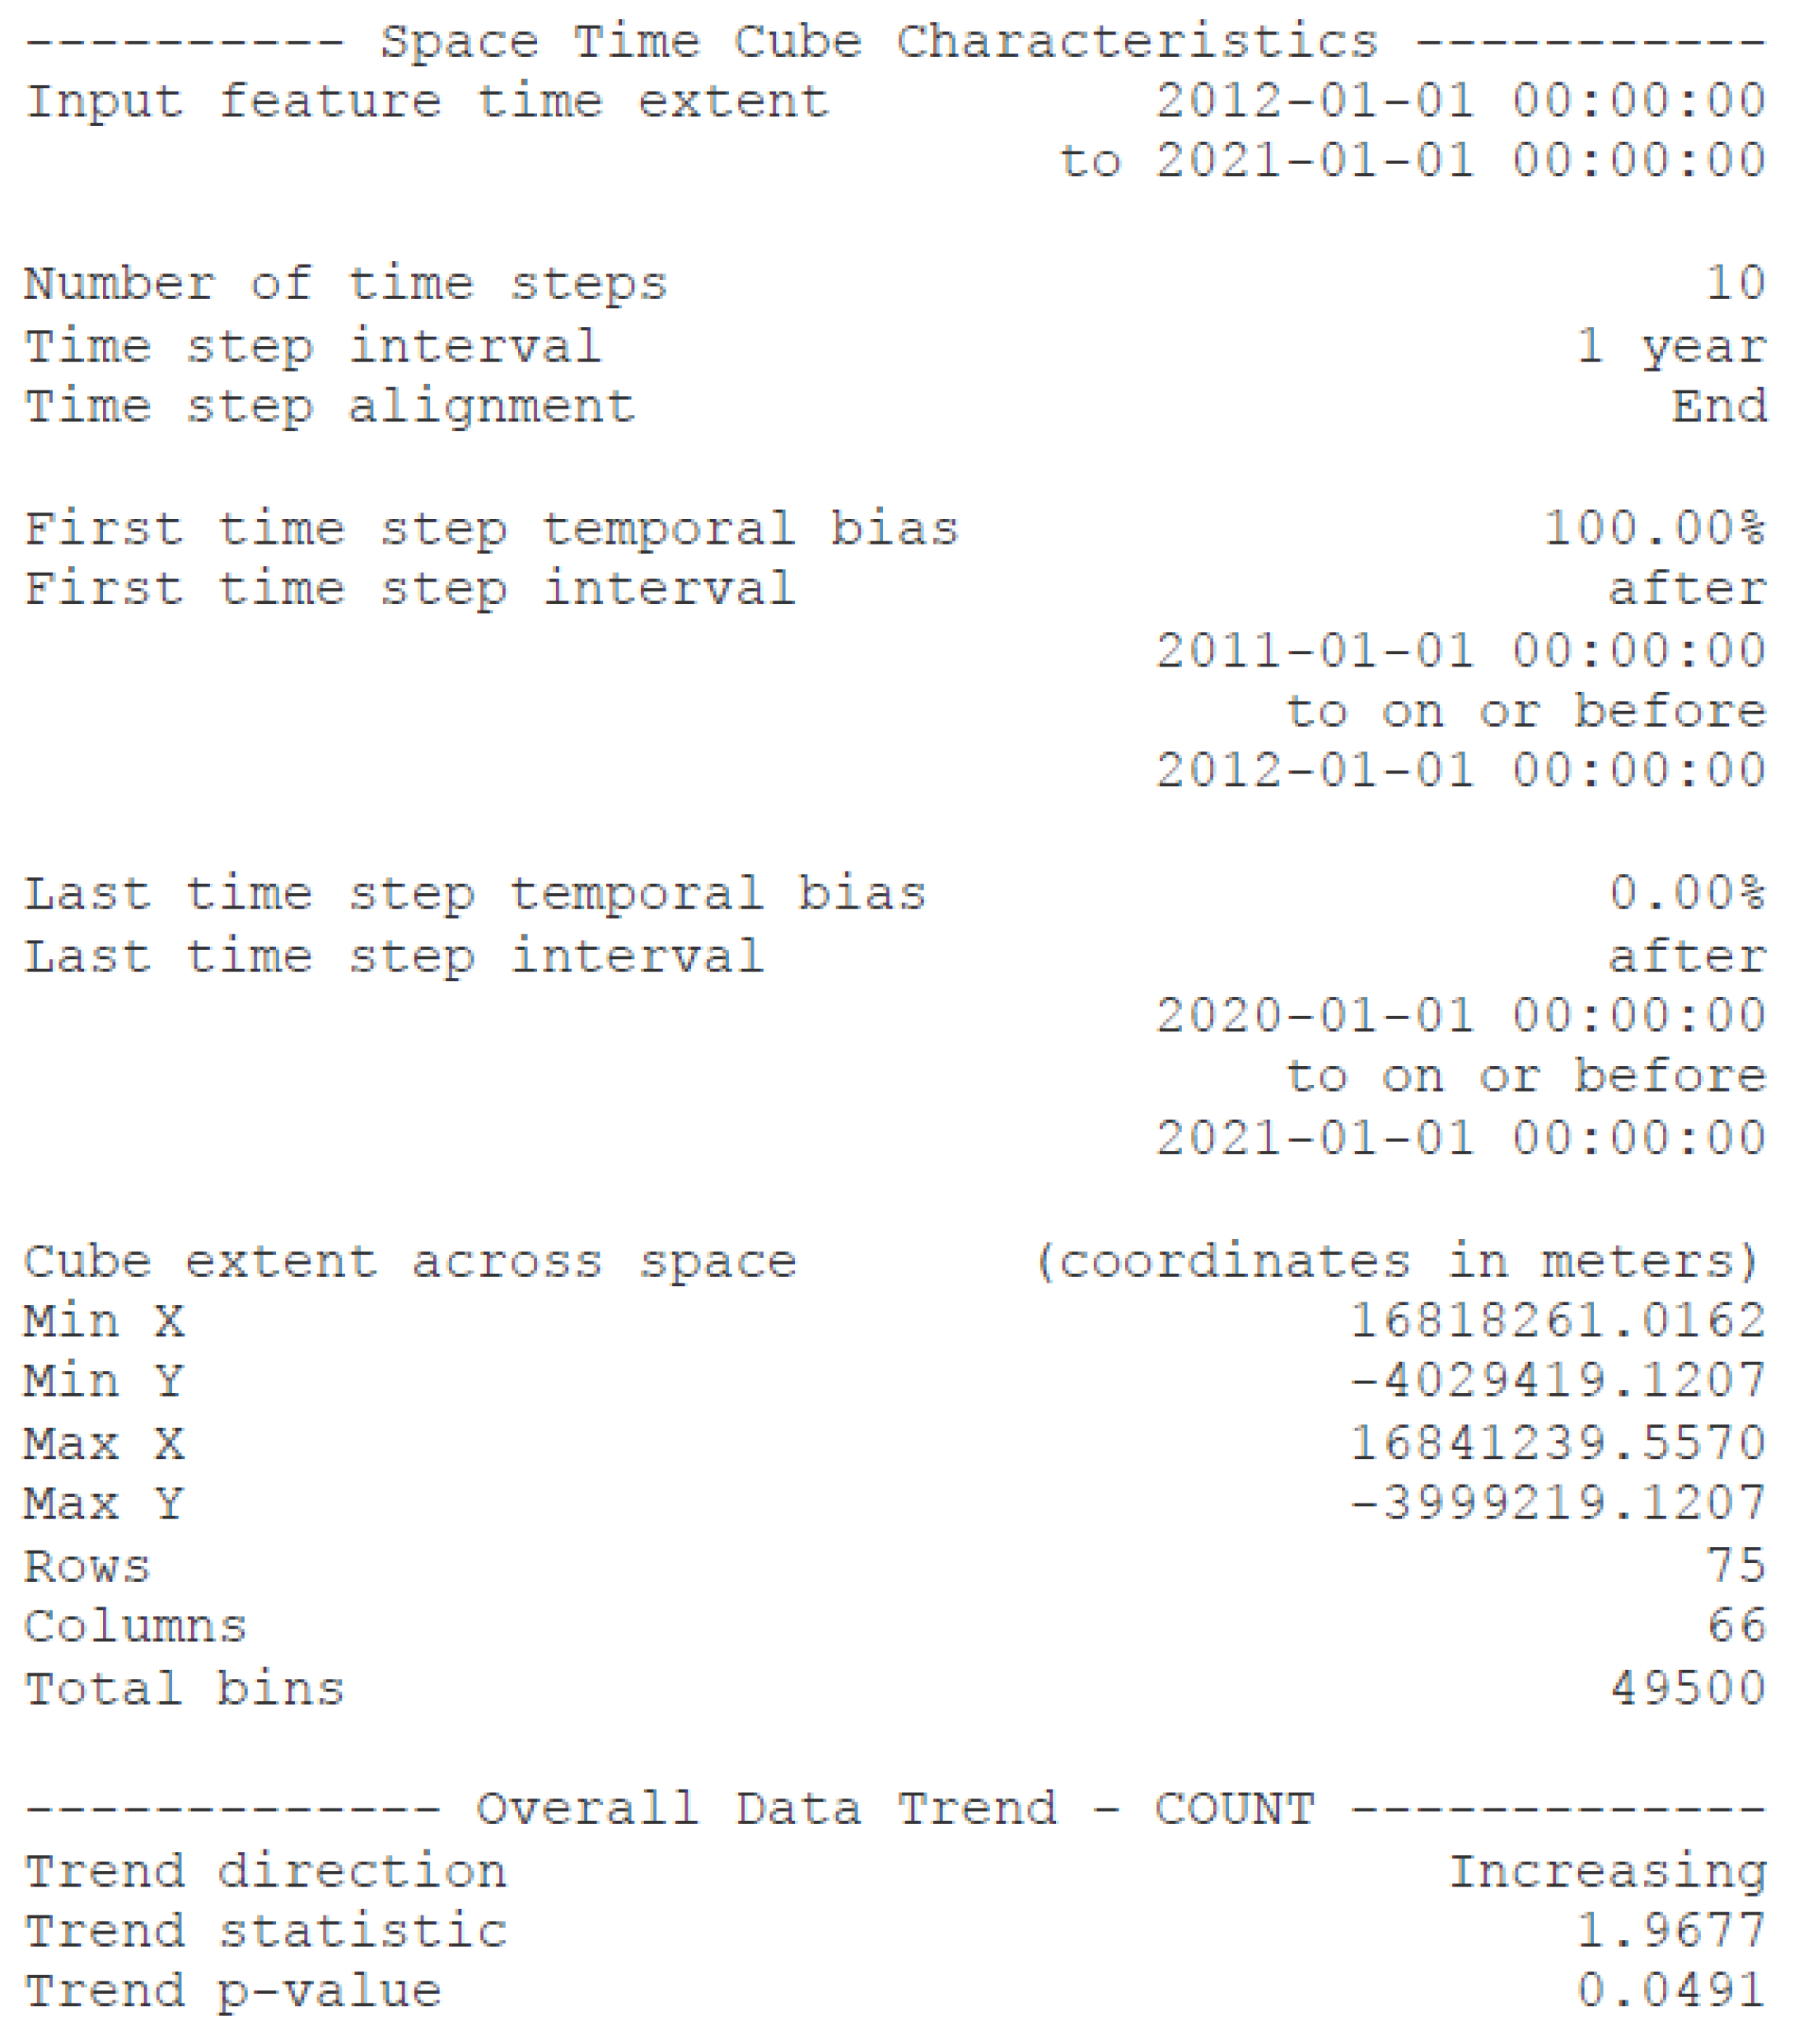
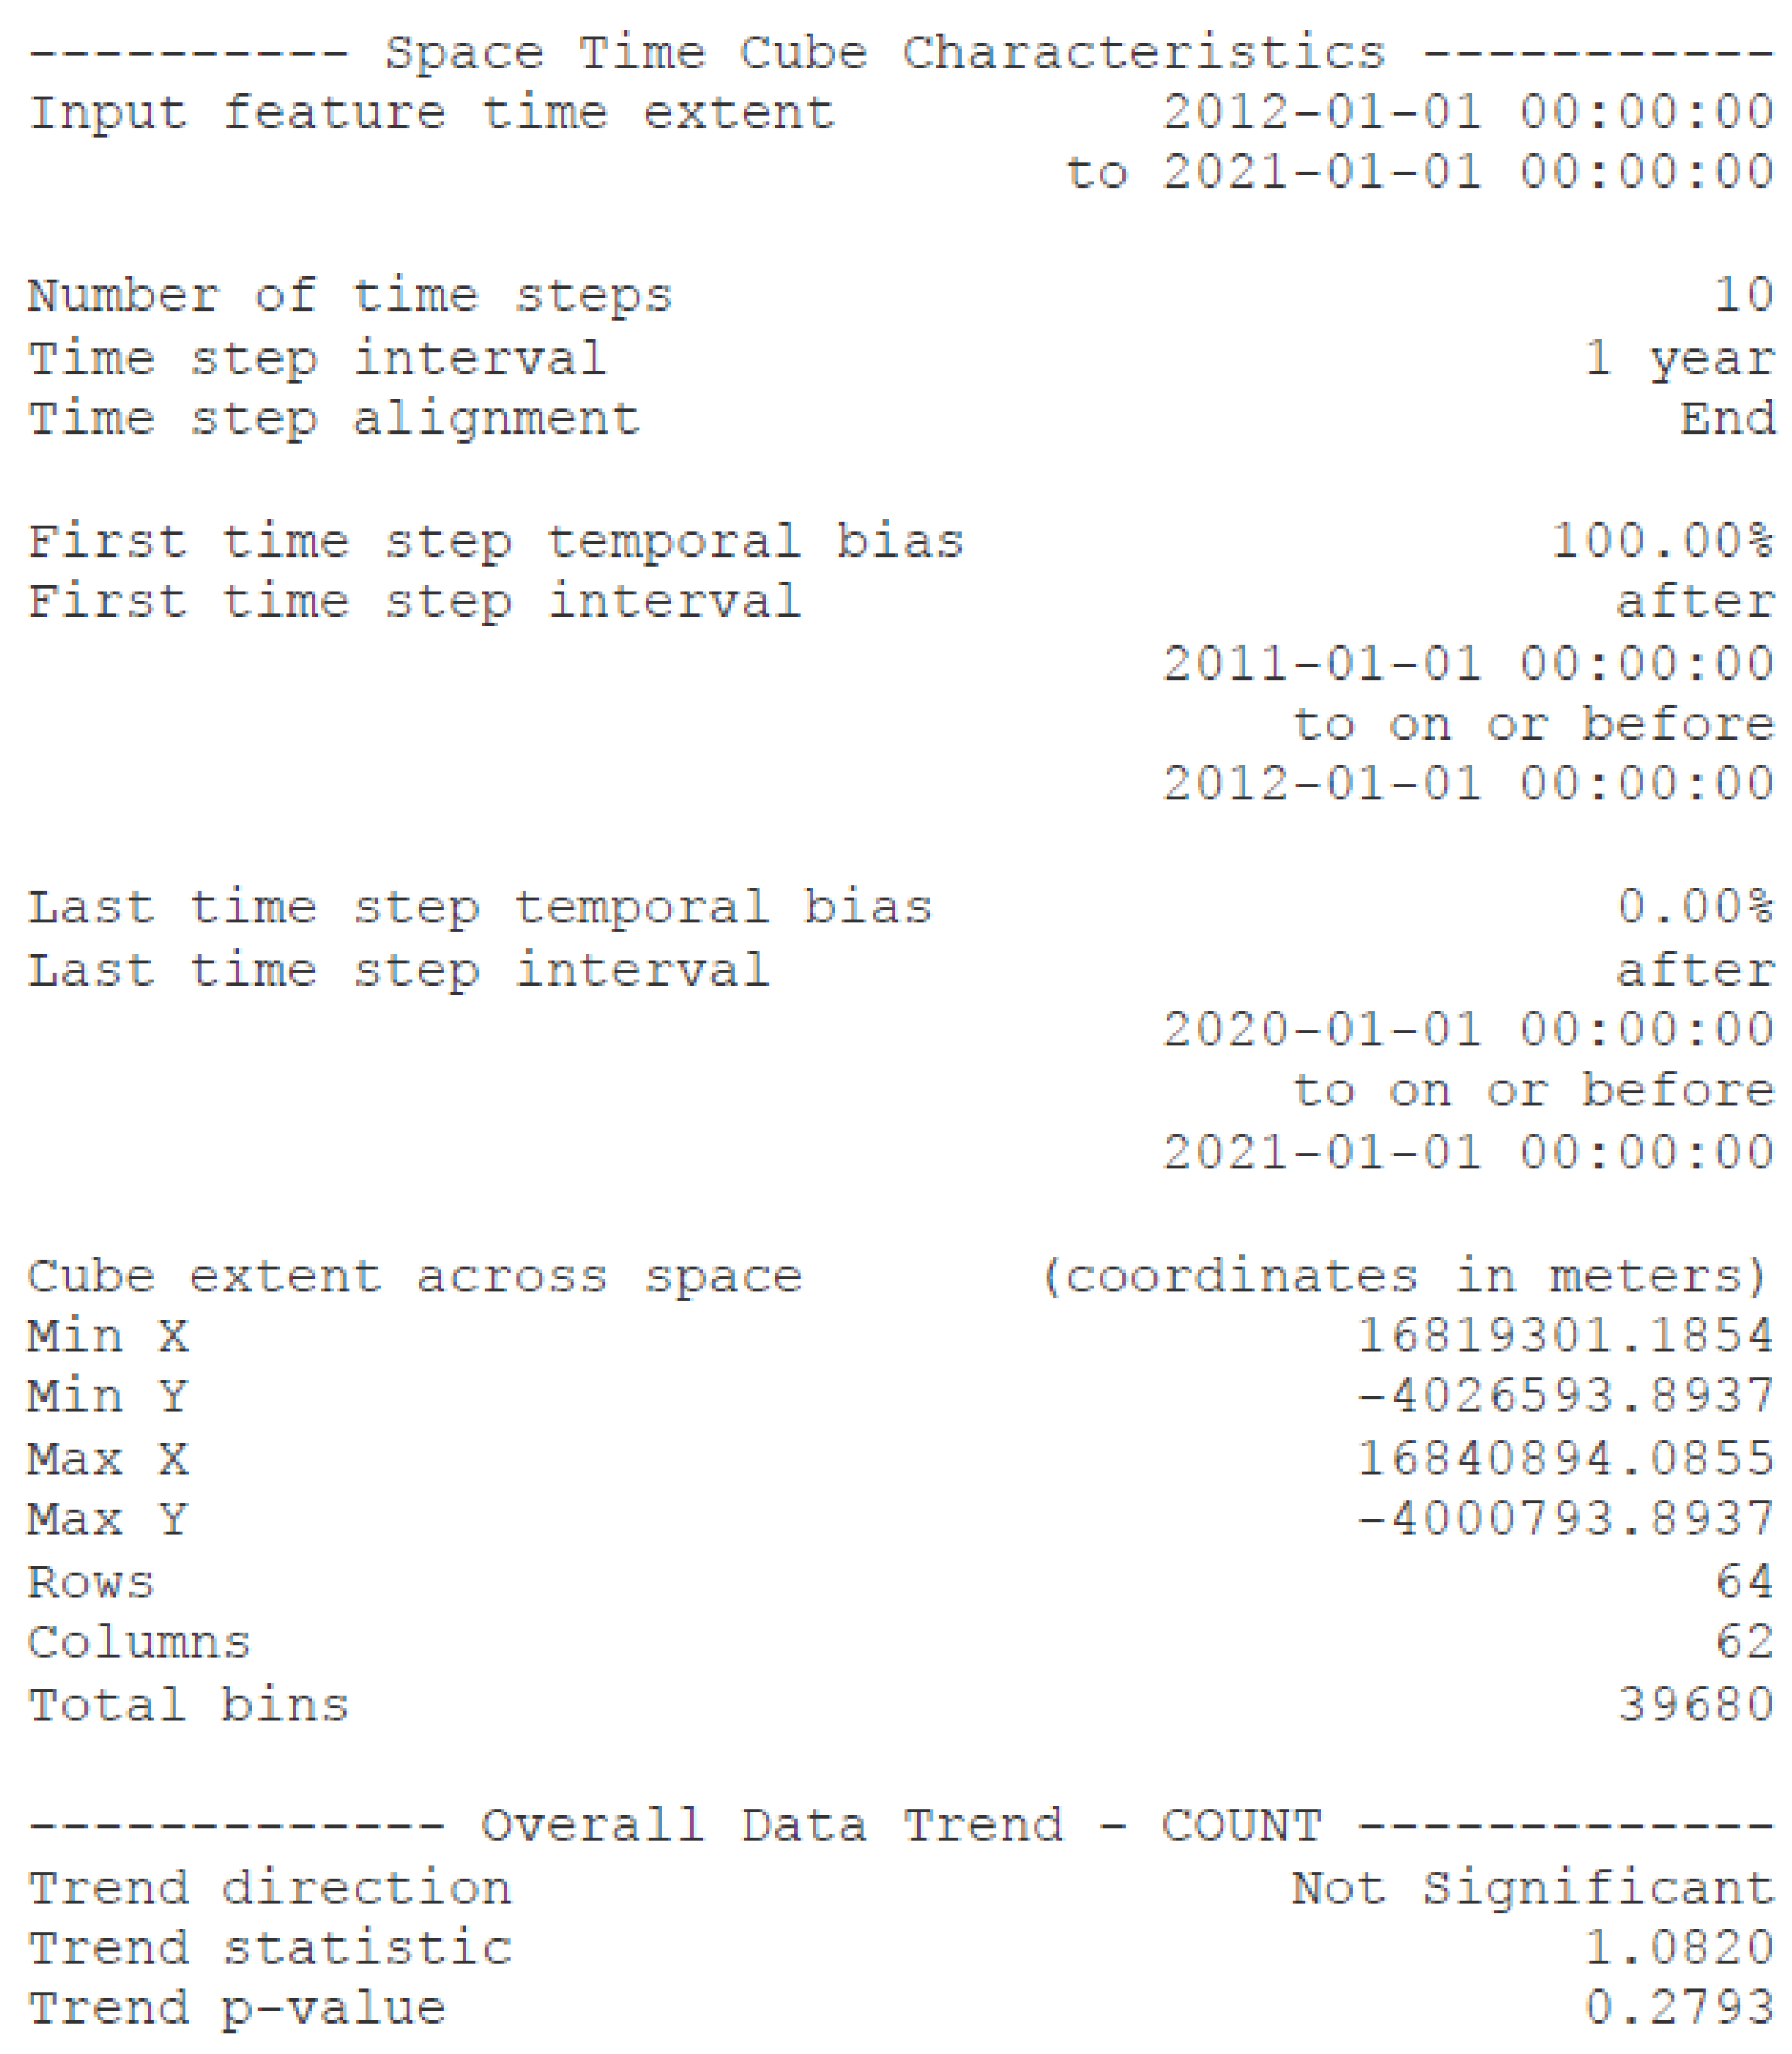
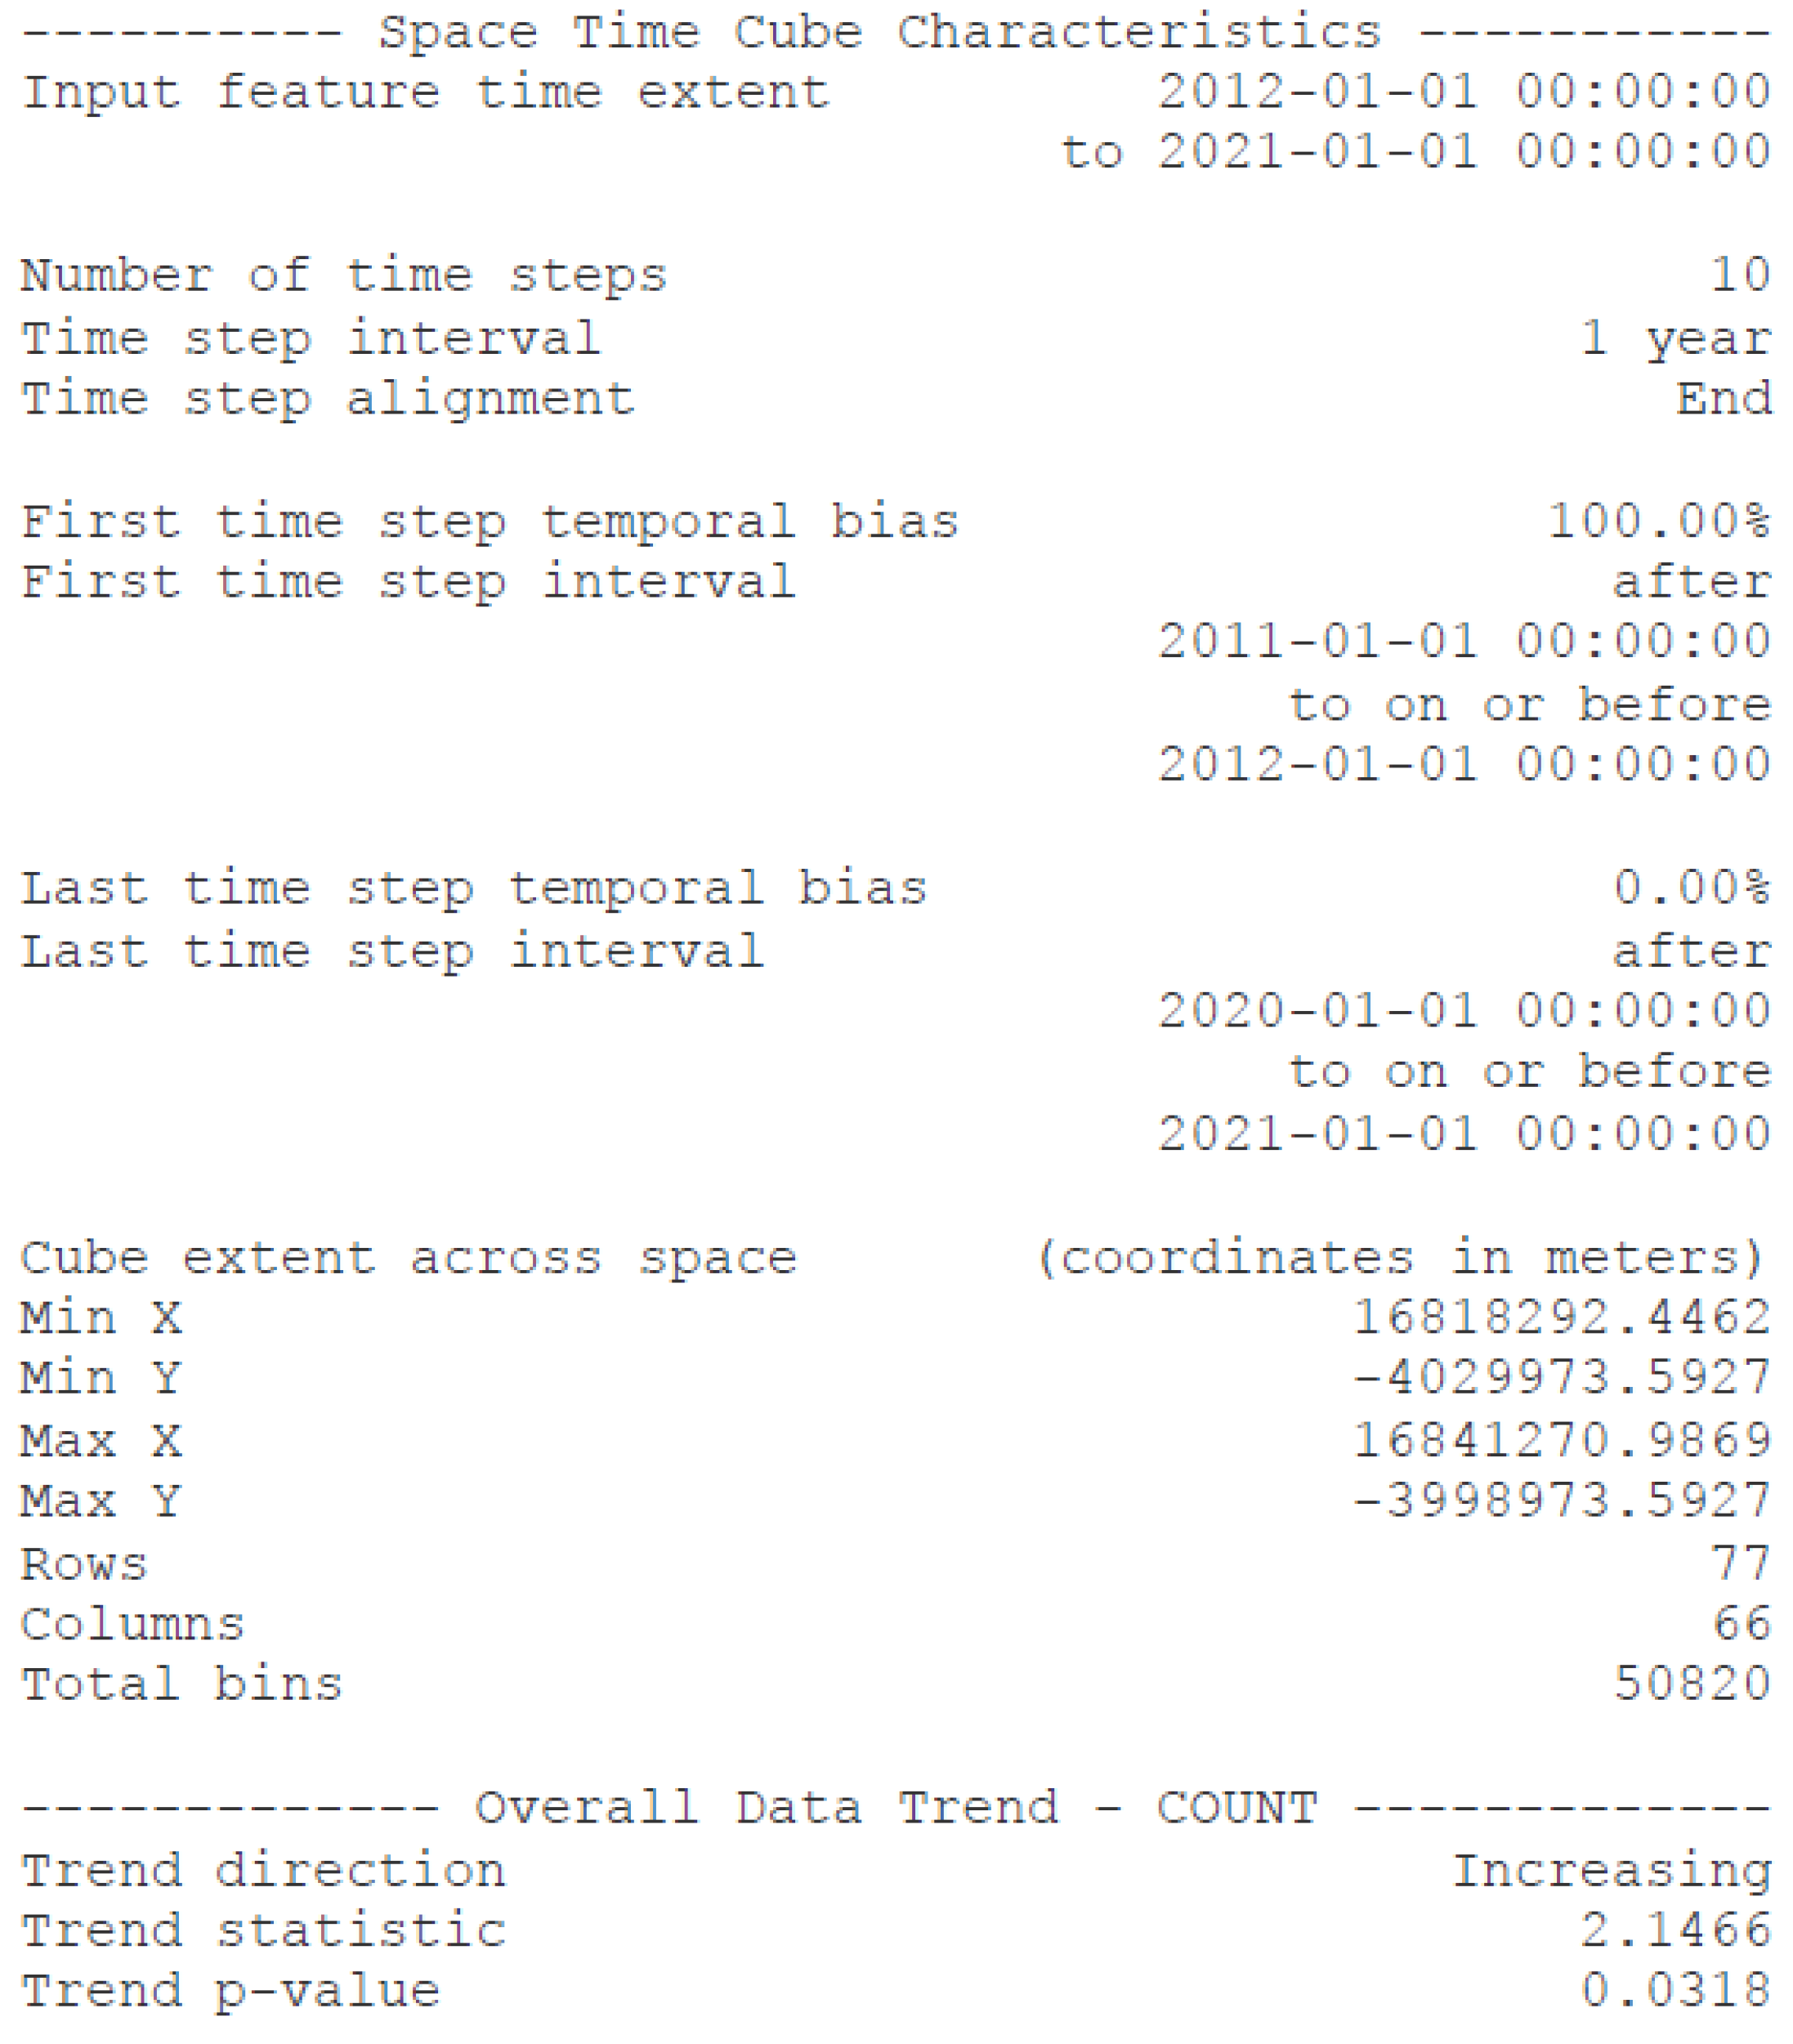
Appendix A. Space-Time Cube Logfiles


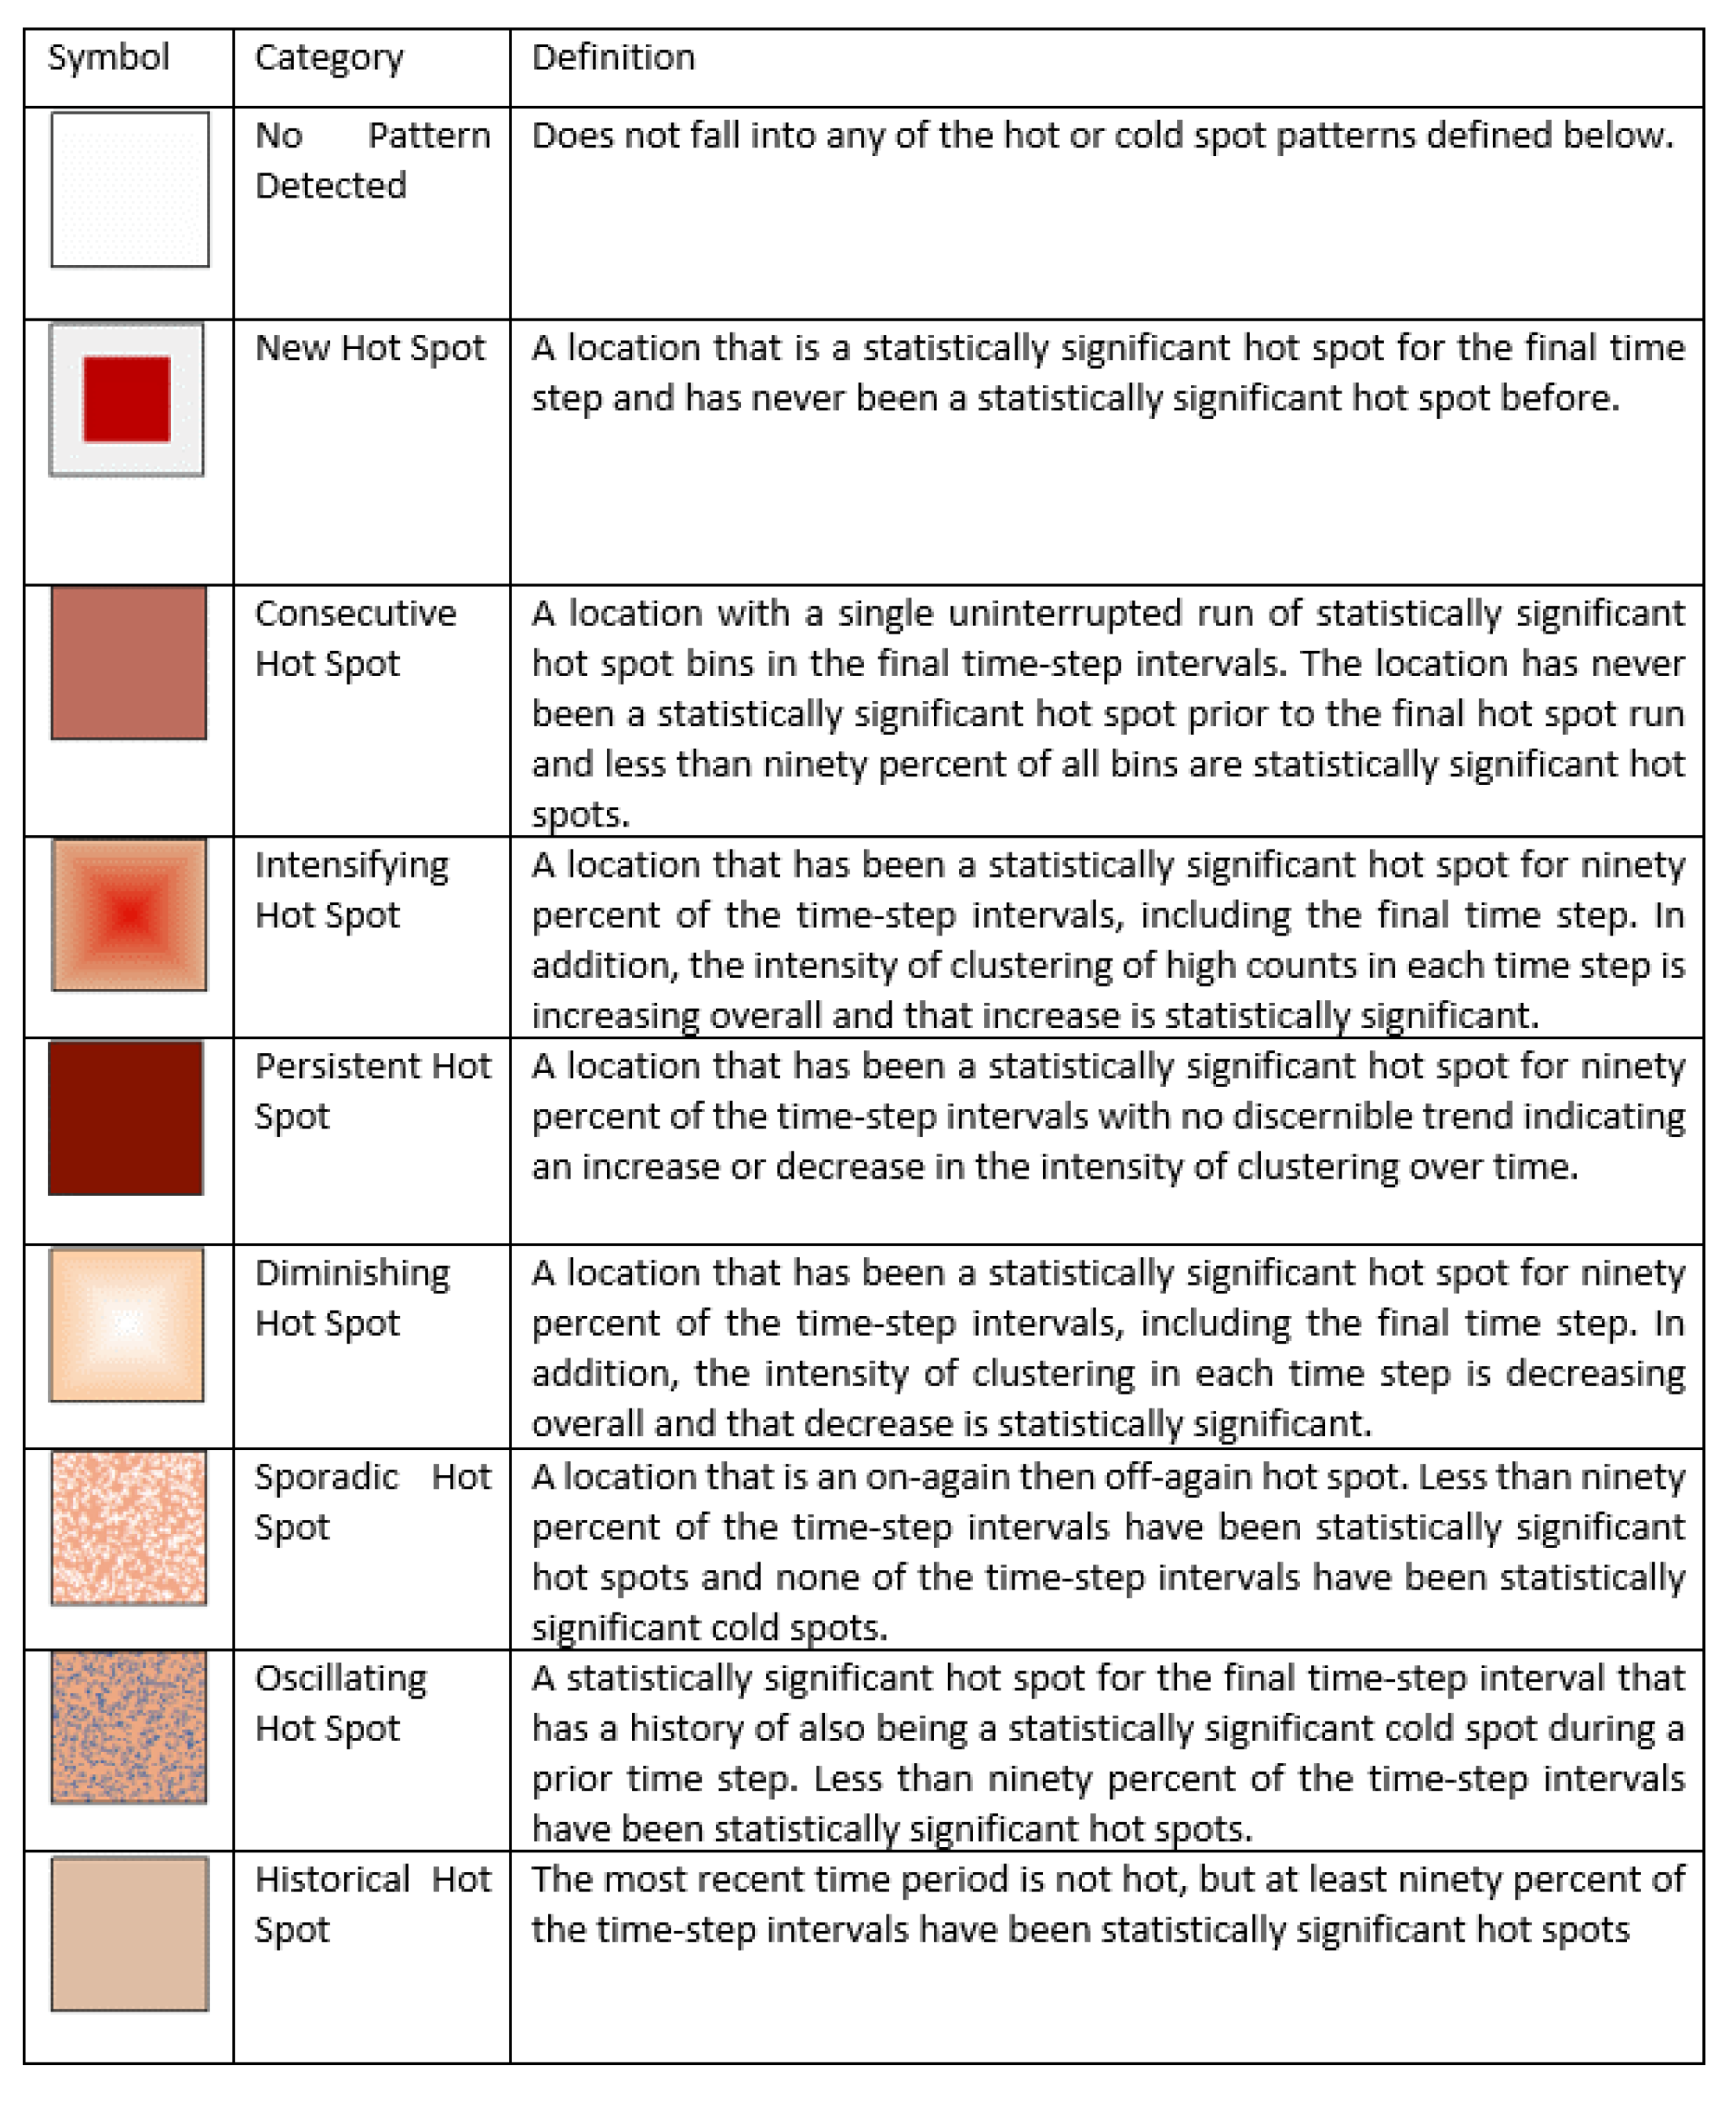
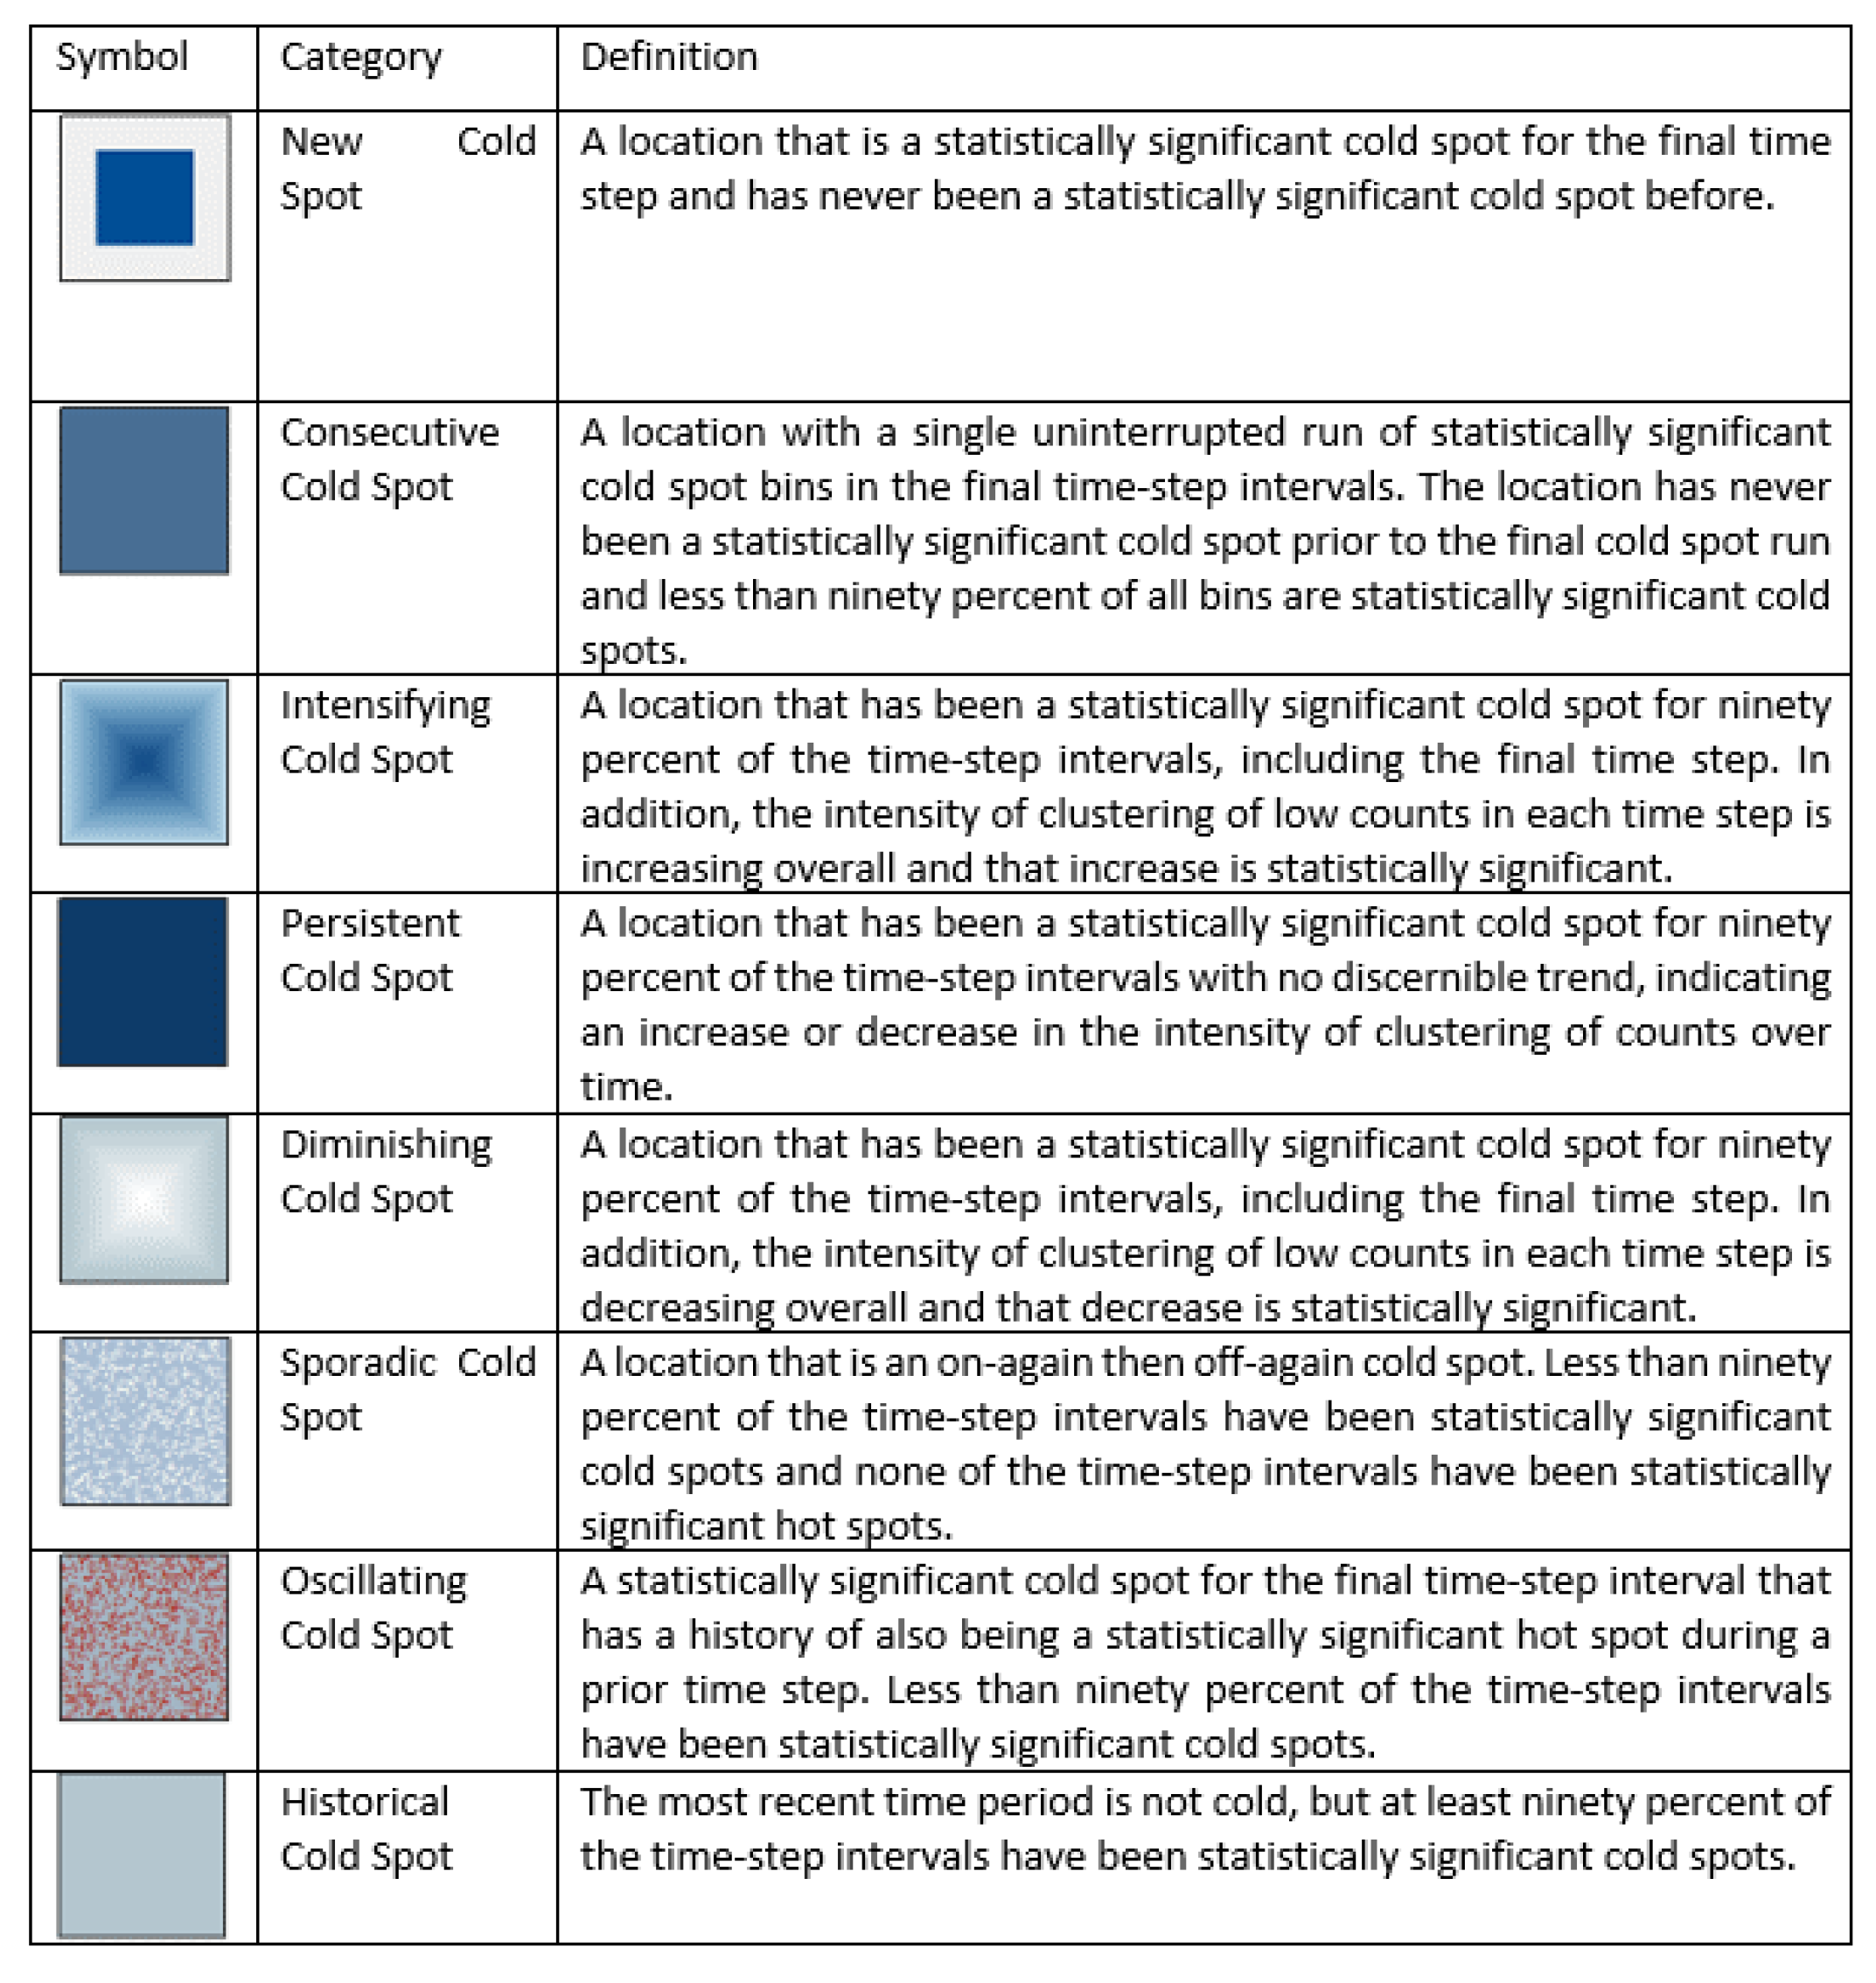
Appendix B. Emerging Hotspot Analysis Categories


References
- Anderson, K. Evolving from a rum state: Australia’s alcohol consumption. Aust. J. Agric. Resour. Econ. 2020, 64, 724–749. [Google Scholar] [CrossRef]
- Savic, M.; Room, R.; Mugavin, J.; Pennay, A.; Livingston, M. Defining “drinking culture”: A critical review of its meaning and connotation in social research on alcohol problems. Drugs Educ. Prev. Policy 2016, 23, 270–282. [Google Scholar] [CrossRef] [Green Version]
- Dingle, A.E. The truly magnificent thirst: An historical survey of Australian drinking habits. Hist. Stud. 1980, 19, 227–249. [Google Scholar] [CrossRef]
- Pettigrew, S. A grounded theory of beer consumption in Australia. Qual. Mark. Res. 2002, 5, 112–122. [Google Scholar] [CrossRef] [Green Version]
- economy.id. Greater Sydney—Tourism and Hospitality Value. Available online: https://economy.id.com.au/rda-sydney/tourism-value (accessed on 12 June 2021).
- Stevenson, R.J.; Lind, B.; Weatherburn, D. The relationship between alcohol sales and assault in New South Wales, Australia: (Alcoholism and Drug Addiction). Addiction 1999, 94, 397–410. [Google Scholar] [CrossRef]
- Howard, S.J.; Gordon, R.; Jones, S.C. Australian alcohol policy 2001–2013 and implications for public health. BMC Public Health 2014, 14, 848. [Google Scholar] [CrossRef] [Green Version]
- Gmel, G.; Holmes, J.; Studer, J. Are alcohol outlet densities strongly associated with alcohol-related outcomes? A critical review of recent evidence. Drug Alcohol Rev. 2016, 35, 40–54. [Google Scholar] [CrossRef]
- Hughes, R. The Fatal Shore: A History of the Transportation of Convicts to AUSTRALIA, 1787–1868; Guild: London, UK, 1987. [Google Scholar]
- The Editors of Encyclopedia of Britannica (Revised and Updated by Amy Tikkanen). Rum Rebellion. In Encyclopedia Britannica. Australia, New South Wales. 2021. Available online: https://www.britannica.com/event/Rum-Rebellion (accessed on 12 June 2021).
- Allen, M. Curfews and Lockouts: Battles over Drinking Time Have a Long History in NSW. The Conversation. 4 June 2016. Available online: https://theconversation.com/curfews-and-lockouts-battles-over-drinking-time-have-a-long-history-in-nsw-58220 (accessed on 12 June 2021).
- Phillips, W. ‘Six o’clock swill’: The introduction of early closing of hotel bars in Australia. Hist. Stud. 1980, 19, 250–266. [Google Scholar] [CrossRef]
- Kirkby, D. From Wharfie Haunt to Foodie Haven. Food Cult. Soc. 2008, 11, 29–48. [Google Scholar] [CrossRef]
- Australian Bureau of Statistics. Australian Industry. 28 May 2021. Available online: https://www.abs.gov.au/statistics/industry/industry-overview/australian-industry/latest-release (accessed on 12 June 2021).
- Chikritzhs, T.; Gray, D.; Lyons, Z.; Saggers, S. Restrictions on the Sale and Supply of Alcohol: Evidence and Outcomes; National Drug Research Institute, Curtin University of Technology: Perth, Australia, 2007; ISBN 174067533-9. [Google Scholar]
- Taylor, N.; Miller, P.; Coomber, K.; Mayshak, R.; Zahnow, R.; Patafio, B.; Burn, M.; Ferris, J. A mapping review of evaluations of alcohol policy restrictions targeting alcohol-related harm in night-time entertainment precincts. Int. J. Drug Policy 2018, 62, 1–13. [Google Scholar] [CrossRef] [Green Version]
- Liquor & Gaming NSW. Our Role. Available online: https://www.liquorandgaming.nsw.gov.au/about-us/our-role (accessed on 4 April 2021).
- Liquor & Gaming NSW. Liquor Licence Types. Available online: https://www.liquorandgaming.nsw.gov.au/operating-a-business/liquor-licences/liquor-licence-types (accessed on 4 April 2021).
- NSW Government. Liquor Amendment Act 2014 in No 3. 2014. Available online: https://legislation.nsw.gov.au/view/pdf/asmade/act-2014-3 (accessed on 12 June 2021).
- Quilter, J. Populism and criminal justice policy: An Australian case study of non-punitive responses to alcohol-related violence. Aust. N. Z. J. Criminol. 2015, 48, 24–52. [Google Scholar] [CrossRef] [Green Version]
- Homan, S. ‘Lockout’ laws or ‘rock out’ laws? Governing Sydney’s night-time economy and implications for the ‘music city’. Int. J. Cult. Policy 2019, 25, 500–514. [Google Scholar] [CrossRef]
- Menendez, P.; Weatherburn, D.; Kypri, K.; Fitzgerald, J. Lockouts and last drinks: The impact of the January 2014 liquor licence reforms on assaults in NSW, Australia. Crime Justice Bull. 2015, 1–12. [Google Scholar] [CrossRef]
- Nepal, S.; Kypri, K.; Pursey, K.; Attia, J.; Chikritzhs, T.; Miller, P. Effectiveness of lockouts in reducing alcohol-related harm: Systematic review. Drug Alcohol Rev. 2018, 37, 527–536. [Google Scholar] [CrossRef]
- Kypri, K.; Livingston, M. Incidence of assault in Sydney, Australia, throughout 5 years of alcohol trading hour restrictions: Controlled before-and-after study. Addiction 2020, 115, 2045–2054. [Google Scholar] [CrossRef]
- Callinan, I. Review of Amendments to the Liquor Act 2007 (NSW). 13 September 2016. Available online: https://apo.org.au/node/71748 (accessed on 12 June 2021).
- GetUp. Keep Sydney Open—Fight Sydney’s Lockout Legislation! Available online: https://me.getup.org.au/petitions/fight-barry-o-farrell-s-cbd-legislation (accessed on 13 June 2021).
- NSW Parliament. Report on the Joint Select Committee on Sydney’s Night Time Economy/Joint Select Committee on Sydney’s Night Time Economy. September 2019. Available online: https://www.parliament.nsw.gov.au/committees/listofcommittees/Pages/committee-details.aspx?pk=260 (accessed on 12 June 2021).
- May, L. Lockout Laws Repeat Centuries-Old Mistake of Denying Value of Cities as Messy Places. The Conversation. 7 June 2016. Available online: https://theconversation.com/lockout-laws-repeat-centuries-old-mistake-of-denying-value-of-cities-as-messy-places-58281 (accessed on 12 June 2021).
- Perks, G.; Maruyama, S. The ‘Flock’ Phenomenon of the Sydney Lockout Laws: Dual Effects on Rental Prices. Econ. Rec. 2017, 93, 517–532. [Google Scholar] [CrossRef] [Green Version]
- Taylor, A. What the Hell Is Going on in Sydney? 176 Venues Disappear. The Sydney Morning Herald. 27 May 2018. Available online: https://www.smh.com.au/national/nsw/what-the-hell-is-going-on-in-sydney-176-venues-disappear-20180527-p4zhst.html (accessed on 12 June 2021).
- Williams, S. Kings Cross Businesses Plead for Relaxation of Lockout Laws. Commercial Real Estate. 31 May 2019. Available online: https://www.commercialrealestate.com.au/news/kings-cross-businesses-plead-for-relaxation-of-lock-out-laws-843990/ (accessed on 12 June 2021).
- Committee for Sydney. A Vision for Kings Cross. 23 April 2021. Available online: https://sydney.org.au/publications/a-vision-for-kings-cross/ (accessed on 12 June 2021).
- World Health Organisation. Coronavirus Overview. Available online: https://www.who.int/health-topics/coronavirus#tab=tab_1 (accessed on 5 May 2021).
- Health NSW. Public Health Orders and Restrictions. Available online: https://www.health.nsw.gov.au/Infectious/covid-19/Pages/public-health-orders.aspx (accessed on 8 May 2021).
- Prime Minister of Australia. Update on Coronavirus Measures—Media Statement. 22 March 2020. Available online: https://www.pm.gov.au/media/update-coronavirus-measures-220320 (accessed on 12 June 2021).
- Australian Bureau of Statistics. Insights into Australian Industries—Hospitality Industries Record Unprecedented Falls. Available online: https://www.abs.gov.au/articles/insights-australian-industries#hospitality-industries-record-unprecedented-falls (accessed on 6 April 2021).
- Dube, K.; Nhamo, G.; Chikodzi, D. COVID-19 cripples global restaurant and hospitality industry. Curr. Issues Tour. 2020, 24, 1487–1490. [Google Scholar] [CrossRef]
- Brown, S.L. Restaurants and Cafes Facing Mass Closures without More Coronavirus Support, Industry Group Warns. Australian Broadcasting Corporation (ABC). 8 July 2020. Available online: https://www.abc.net.au/news/2020-07-08/coronavirus-hit-restaurants-and-cafes-risk-of-closures-industry/12415648 (accessed on 12 June 2021).
- O’Sullivan, D.; Rahamathulla, M.; Pawar, M. The Impact and Implications of COVID-19: An Australian Perspective. Int. J. Community Soc. Dev. 2020, 2, 134–151. [Google Scholar] [CrossRef]
- Napierała, T.; Leśniewska-Napierała, K.; Burski, R. Impact of Geographic Distribution of COVID-19 Cases on Hotels’ Performances: Case of Polish Cities. Sustainability 2020, 12, 4697. [Google Scholar] [CrossRef]
- The Treasury. Economic Response to the Coronavirus—JobKeeper Payment. Available online: https://treasury.gov.au/coronavirus/jobkeeper (accessed on 16 May 2021).
- NSW Government. Dine and Discover NSW. Available online: https://www.nsw.gov.au/covid-19/dine-discover-nsw (accessed on 7 May 2021).
- Google. COVID-19 Community Mobility Reports. 2021. Available online: https://www.google.com/covid19/mobility/index.html?hl=en (accessed on 12 June 2021).
- Maginn, P.; Mortimer, G. How COVID all but killed the Australian CBD. The Conversation. 30 October 2020. Available online: https://theconversation.com/how-covid-all-but-killed-the-australian-cbd-147848 (accessed on 12 June 2021).
- Praharaj, S.; King, D.; Pettit, C.; Wentz, E. Using Aggregated Mobility Data to Measure the Effect of COVID-19 Policies on Mobility Changes in Sydney, London, Phoenix, and Pune. Transp. Find. 2020. [Google Scholar] [CrossRef]
- Patrick, A. Work from Home Comforts Are Killing Sydney’s CBD. Financial Review. 1 April 2021. Available online: https://www.afr.com/companies/retail/work-from-home-comforts-are-killing-sydney-s-cbd-20210401-p57fxj (accessed on 12 June 2021).
- Young, A. New Voucher Scheme Aims to ‘Turbocharge’ Sydney’s CBD. Australian Hotelier. 21 June 2021. Available online: https://theshout.com.au/australian-hotelier/sydney-cbd-friday-lunch-scheme-welcomed/ (accessed on 12 June 2021).
- Department of Planning Industry and Environment NSW. Local Planning and Zoning. Available online: https://www.planning.nsw.gov.au/Plans-for-your-area/Local-Planning-and-Zoning (accessed on 22 May 2021).
- City of Sydney. Night-Time Economy. Available online: https://www.cityofsydney.nsw.gov.au/business-economy/night-time-economy (accessed on 10 May 2021).
- Department of Planning Industry and Environment NSW. Night Time Economy. Available online: https://www.planning.nsw.gov.au/Policy-and-Legislation/Night-Time-Economy (accessed on 21 May 2021).
- NSW Department of Planning Industry and Environment. Employment Zones Reform. Available online: https://www.planning.nsw.gov.au/Policy-and-Legislation/Planning-reforms/Employment-Zones-Reform (accessed on 5 June 2021).
- Symanzik, J. Exploratory Spatial Data Analysis. In Handbook of Regional Science; Fischer, M.M., Nijkamp, P., Eds.; Springer: Berlin/Heidelberg, Germany, 2021; pp. 1845–1861. [Google Scholar]
- Fotheringham, A.S. Exploratory spatial data analysis and GIS. Environ. Plan. A 1992, 24, 1675–1678. [Google Scholar]
- Snow, J. On the Mode of Communication of Cholera; John Churchill: London, UK, 1855. [Google Scholar]
- Jing, Y.; Liu, Y.; Cai, E.; Liu, Y.; Zhang, Y. Quantifying the spatiality of urban leisure venues in Wuhan, Central China—GIS-based spatial pattern metrics. Sustain. Cities Soc. 2018, 40, 638–647. [Google Scholar] [CrossRef]
- Bailey, T.C. Interactive Spatial Data Analysis; Gatrell, A.C., Ed.; Burnt Mill: New York, NY, USA; Longman Scientific & Technical: Harlow, UK, 1995. [Google Scholar]
- O’Sullivan, D.; Unwin, J. The Pitfalls and Potential of Spatial Data. In Geographic Information Analysis; John Wiley & Sons, Inc.: Hoboken, NJ, USA, 2010; pp. 33–54. [Google Scholar]
- Cui, C.; Wang, J.; Wu, Z.; Ni, J.; Qian, T. The Socio-Spatial Distribution of Leisure Venues: A Case Study of Karaoke Bars in Nanjing, China. ISPRS Int. J. Geo-Inf. 2016, 5, 150. [Google Scholar] [CrossRef] [Green Version]
- Ripley, B.D. The second-order analysis of stationary point processes. J. Appl. Probab. 1976, 13, 255–266. [Google Scholar] [CrossRef] [Green Version]
- Moran, P.A.P. Notes on Continuous Stochastic Phenomena. Biometrika 1950, 37, 17–23. [Google Scholar] [CrossRef]
- Anselin, L. Local Indicators of Spatial Association—LISA. Geogr. Anal. 1995, 27, 93–115. [Google Scholar] [CrossRef]
- Fang, L.; Xie, Y.; Yao, S.; Liu, T. Agglomeration and/or differentiation at regional scale? Geographic spatial thinking of hotel distribution—A case study of Guangdong, China. Curr. Issues Tour. 2021, 24, 1358–1374. [Google Scholar] [CrossRef]
- Chhetri, A.; Chhetri, P.; Arrowsmith, C.; Corcoran, J. Modelling tourism and hospitality employment clusters: A spatial econometric approach. Tour. Geogr. 2017, 19, 398–424. [Google Scholar] [CrossRef]
- Marshall, A. Principles of Economics: An Introductory Volume, 8th ed.; Macmillan & Co.: London, UK, 1920. [Google Scholar]
- Sánchez-Martín, J.-M.; Rengifo-Gallego, J.-I.; Blas-Morato, R. Hot Spot Analysis versus Cluster and Outlier Analysis: An Enquiry into the Grouping of Rural Accommodation in Extremadura (Spain). ISPRS Int. J. Geo-Inf. 2019, 8, 176. [Google Scholar] [CrossRef] [Green Version]
- Parsa, H.G.; Kreeger, J.C.; van der Rest, J.-P.; Xie, L.K.; Lamb, J. Why Restaurants Fail? Part V: Role of Economic Factors, Risk, Density, Location, Cuisine, Health Code Violations and GIS Factors. Int. J. Hosp. Tour. Adm. 2021, 22, 142–167. [Google Scholar] [CrossRef]
- Moghadam, A.S.; Soltani, A.; Parolin, B. Transforming and changing urban centres: The experience of Sydney from 1981 to 2006. Lett. Spat. Resour. Sci. 2018, 11, 37–53. [Google Scholar] [CrossRef]
- Taylor, S. A place to play: An historical geographical perspective on live music and poker machines in Australian pubs. Hist. Environ. 2018, 30, 112–133. [Google Scholar] [CrossRef]
- Kim, Y.-R.; Kim, J.-W.; Huh, C. The spatial clustering patterns of the U.S hotels during 1985–2017. Int. J. Tour. Sci. 2018, 18, 192–201. [Google Scholar] [CrossRef]
- Hägerstrand, T. What about people in regional science? Pap. Reg. Sci. Assoc. 1970, 24, 7. [Google Scholar] [CrossRef]
- Gudes, O.; Varhol, R.; Sun, Q.; Meuleners, L. Investigating articulated heavy-vehicle crashes in Western Australia using a spatial approach. Accid. Anal. Prev. 2017, 106, 243–253. [Google Scholar] [CrossRef]
- Visner, M.; Shirowzhan, S.A.; Pettit, C. Spatial Analysis, Interactive Visualisation and GIS-Based Dashboard for Monitoring Spatio-Temporal Changes of Hotspots of Bushfires over 100 Years in New South Wales, Australia. Buildings 2021, 11, 37. [Google Scholar] [CrossRef]
- Qin, Y.; Qin, J.; Liu, C. Spatial-temporal evolution patterns of hotels in China: 1978–2018. Int. J. Contemp. Hosp. Manag. 2021. ahead-of-print. [Google Scholar] [CrossRef]
- Esri. ArcGIS StoryMaps—Storytelling that Resonates. Available online: https://www.esri.com/en-us/arcgis/products/arcgis-storymaps/overview (accessed on 16 May 2021).
- Kitchin, R.; Lauriault, T.P.; McArdle, G. Knowing and governing cities through urban indicators, city benchmarking and real-time dashboards. Reg. Stud. Reg. Sci. 2015, 2, 6–28. [Google Scholar] [CrossRef] [Green Version]
- Knight, M. Data journalism in the UK: A preliminary analysis of form and content. J. Media Pract. 2015, 16, 55–72. [Google Scholar] [CrossRef]
- Esri. ArcGIS Pro—The World’s Leading GIS Software. Available online: https://www.esri.com/en-us/arcgis/products/arcgis-pro/overview (accessed on 15 May 2021).
- Liquor & Gaming NSW. Liquor Licence Data and Dashboard/Map. 2021. Available online: https://www.liquorandgaming.nsw.gov.au/resources/liquor-licence-data (accessed on 12 June 2021).
- Department of Customer Service NSW. NSW Administrative Boundaries. 2021. Available online: https://data.nsw.gov.au/data/dataset/nsw-administrative-boundaries (accessed on 12 June 2021).
- Data NSW. Environmental Planning Instrument—Land Zoning. 2021. Available online: https://data.nsw.gov.au/data/dataset/environment-planning-instrument-local-environmental-plan-land-zoning (accessed on 12 June 2021).
- NSW Government. Standard Instrument—Principal Local Environmental Plan (2006 EPI 155a). 2021. Available online: https://legislation.nsw.gov.au/view/html/inforce/current/epi-2006-155a (accessed on 12 June 2021).
- Australian Bureau of Statistics. 1270.0.55.001—Australian Statistical Geography Standard (ASGS): Volume 1—Main Structure and Greater Capital City Statistical Areas. July 2016. Available online: https://www.abs.gov.au/AUSSTATS/abs@.nsf/Lookup/1270.0.55.001Main+Features10018July%202016?OpenDocument (accessed on 10 May 2021).
- Getis, A.; Ord, J.K. The Analysis of Spatial Association by Use of Distance Statistics. Geogr. Anal. 1992, 24, 189–206. [Google Scholar] [CrossRef]
- Kwak, H.; Lee, W.-K.; Saborowski, J.; Lee, S.-Y.; Won, M.-S.; Koo, K.-S.; Lee, M.-B.; Kim, S.-N. Estimating the spatial pattern of human-caused forest fires using a generalized linear mixed model with spatial autocorrelation in South Korea. Int. J. Geogr. Inf. Sci. 2012, 26, 1589–1602. [Google Scholar] [CrossRef]
- Esri. Create Space Time Cube By Aggregating Points (Space Time Pattern Mining). Available online: https://pro.arcgis.com/en/pro-app/latest/tool-reference/space-time-pattern-mining/create-space-time-cube.htm (accessed on 13 May 2021).
- Mann, H.B. Nonparametric Tests against Trend; The Economic Society: Cleveland, OH, USA, 1945; pp. 245–259. [Google Scholar]
- Kendall, M.G. Rank Correlation Methods, 5th ed.; Griffin: London, UK, 1990. [Google Scholar]
- Esri. Emerging Hot Spot Analysis (Space Time Pattern Mining). Available online: https://pro.arcgis.com/en/pro-app/latest/tool-reference/space-time-pattern-mining/emerginghotspots.htm (accessed on 15 May 2021).
- Department of Planning Industry and Environment NSW. Environmental Planning Instrument—Land Zoning. Available online: https://www.planningportal.nsw.gov.au/opendata/dataset/environment-planning-instrument-local-environmental-plan-land-zoning (accessed on 27 May 2021).
- Farrelly, K. Chatswood: A Bustling Suburb Proving It’s More than Just a Shopping Haven. Domain: Fairfax Media. 9 July 2021. Available online: https://www.domain.com.au/news/chatswood-a-bustling-suburb-proving-its-more-than-just-the-shopping-haven-of-the-north-shore-1067676/ (accessed on 12 June 2021).
- Dye, J. Apartment Oversupply and Construction Defects Give Lenders Pause for Thought. Sydney Morning Herald: Fairfax Media. 22 September 2020. Available online: https://www.smh.com.au/national/nsw/apartment-oversupply-and-construction-defects-give-lenders-pause-for-thought-20190918-p52sjs.html (accessed on 12 June 2021).
- Barlass, T. Membership Drops as RSL Competes with Rival Charities to Help Veterans. Sydney Morning Herald: Fairfax Media. 30 October 2019. Available online: https://www.smh.com.au/national/membership-drops-as-rsl-competes-with-rival-charities-to-help-veterans-20191030-p535rv.html (accessed on 12 June 2021).
- Bleby, M. Mirvac Rolls up to the Waverley Bowls. Financial Review: Fairfax Media. 21 December 2020. Available online: https://www.afr.com/property/commercial/mirvac-rolls-up-to-the-waverley-bowls-20201221-p56pbo (accessed on 12 June 2021).
- City of Sydney. Submission 780—Joint Select Committee on Sydney’s Night Time Economy. July 2019. Available online: https://www.parliament.nsw.gov.au/committees/listofcommittees/Pages/committee-details.aspx?pk=260#tab-submissions (accessed on 12 June 2021).
- NSW Government. COVID-19 Economic Recovery Strategy—A Brighter Future for NSW. Available online: https://www.nsw.gov.au/covid-19/economic-recovery-strategy (accessed on 12 June 2021).
- Durkin, P. Melbourne, Sydney CBDs Will Need Four Years to Recover from Lockdown. Australian Financial Review: Nine Entertainment Co. 11 July 2021. Available online: https://www.afr.com/policy/economy/melbourne-sydney-cbds-will-need-four-years-to-recover-from-lockdown-20210709-p588hm (accessed on 12 June 2021).
- Fotheringham, A.S.; Brunsdon, C.; Charlton, M. Geographically Weighted Regression: The Analysis of Spatially Varying Relationships; John Wiley & Sons: Hoboken, NJ, USA, 2002. [Google Scholar]
- Fotheringham, A.S.; Crespo, R.; Yao, J. Geographical and Temporal Weighted Regression (GTWR). Geogr. Anal. 2015, 47, 431–452. [Google Scholar] [CrossRef] [Green Version]
- Wikle, C.K. Modern perspectives on statistics for spatio-temporal data. WIREs Comput. Stat. 2015, 7, 86–98. [Google Scholar] [CrossRef]
- Leung, A.; Law, J.; Cooke, M.; Leatherdale, S. Exploring and visualizing the small-area-level socioeconomic factors, alcohol availability and built environment influences of alcohol expenditure for the City of Toronto: A spatial analysis approach. Mal. Chron. Blessures Can. 2019, 39, 15–24. [Google Scholar] [CrossRef] [Green Version]
- NSW Government. COVID-19 Legislation Amendment (Emergency Measures) Act 2020. No. 1; NSW Government, Ed.; 2020. Available online: https://legislation.nsw.gov.au/view/pdf/asmade/act-2020-1 (accessed on 12 June 2021).
- Lam, Y. The World Bar Is Closing Tomorrow. Broadsheet: Broadsheet Media. 27 November 2018. Available online: https://www.broadsheet.com.au/sydney/entertainment/article/world-bar-closing-tomorrow (accessed on 12 June 2021).
- Teague, S. Cali Club Is Sydney’s New Live Music Venue and Nightclub in the Former World Bar Site. Concrete Playground: Concrete Playground. 10 December 2018. Available online: https://concreteplayground.com/sydney/arts-entertainment/cali-club-is-kings-cross-new-live-music-venue-and-nightclub-in-the-former-world-bar-site (accessed on 12 June 2021).
- Gelman, A.; Loken, E. The Statistical Crisis in Science. Am. Sci. 2014, 102, 460–465. [Google Scholar] [CrossRef]


| LGA | Club Licence | Hotel Licence | Limited Licence | On-Premises Licence | Small Bar Licence | Total |
|---|---|---|---|---|---|---|
| BAYSIDE | 23 | 20 | 9 | 119 | 2 | 173 |
| BURWOOD | 5 | 8 | 1 | 63 | 77 | |
| CANADA BAY | 11 | 9 | 8 | 147 | 175 | |
| HUNTERS HILL | 1 | 2 | 1 | 21 | 25 | |
| INNER WEST | 23 | 79 | 17 | 343 | 17 | 479 |
| LANE COVE | 4 | 4 | 3 | 39 | 50 | |
| MOSMAN | 6 | 3 | 2 | 46 | 57 | |
| NORTH SYDNEY | 9 | 22 | 3 | 271 | 2 | 307 |
| RANDWICK | 21 | 16 | 12 | 181 | 230 | |
| SYDNEY | 23 | 337 | 15 | 1685 | 77 | 2137 |
| WAVERLEY | 12 | 13 | 4 | 177 | 1 | 207 |
| WILLOUGHBY | 8 | 7 | 3 | 155 | 173 | |
| WOOLLAHRA | 10 | 22 | 6 | 106 | 144 | |
| Total | 156 | 542 | 84 | 3353 | 99 | 4234 |
| Zone | Club Licence | Hotel Licence | Limited Licence | On-Premises Licence | Small Bar Licence | Total |
|---|---|---|---|---|---|---|
| 2 | 32 | 1 | 168 | 6 | 209 | |
| B1 | 4 | 25 | 252 | 2 | 283 | |
| B2 | 8 | 113 | 9 | 644 | 31 | 805 |
| B3 | 2 | 14 | 2 | 176 | 194 | |
| B4 | 20 | 124 | 5 | 965 | 16 | 1130 |
| B5 | 3 | 19 | 22 | |||
| B6 | 9 | 31 | 40 | |||
| B7 | 1 | 28 | 29 | |||
| B8 | 18 | 117 | 2 | 540 | 39 | 716 |
| C | 8 | 1 | 9 | |||
| D | 1 | 1 | ||||
| DM | 1 | 1 | ||||
| E | 1 | 1 | 6 | 8 | ||
| E2 | 1 | 1 | ||||
| E4 | 2 | 5 | 7 | |||
| G | 1 | 1 | ||||
| IN1 | 1 | 3 | 2 | 20 | 26 | |
| IN2 | 1 | 2 | 2 | 14 | 1 | 20 |
| IN4 | 1 | 7 | 8 | |||
| R1 | 3 | 38 | 6 | 125 | 1 | 173 |
| R2 | 24 | 13 | 19 | 75 | 1 | 132 |
| R3 | 12 | 6 | 6 | 77 | 101 | |
| R4 | 2 | 1 | 1 | 23 | 27 | |
| RE1 | 18 | 3 | 17 | 83 | 121 | |
| RE2 | 22 | 5 | 27 | |||
| SP1 | 1 | 3 | 4 | |||
| SP2 | 11 | 36 | 12 | 72 | 1 | 132 |
| SP3 | 1 | 1 | 4 | 6 | ||
| UL | 1 | 1 | ||||
| Total | 156 | 542 | 84 | 3353 | 99 | 4234 |
Publisher’s Note: MDPI stays neutral with regard to jurisdictional claims in published maps and institutional affiliations. |
© 2022 by the authors. Licensee MDPI, Basel, Switzerland. This article is an open access article distributed under the terms and conditions of the Creative Commons Attribution (CC BY) license (https://creativecommons.org/licenses/by/4.0/).
Share and Cite
Perry, J.M.; Shirowzhan, S.; Pettit, C.J. Lockout, Lockdown and Land Use: Exploring the Spatio-Temporal Evolution Patterns of Licensed Venues in Sydney, Australia between 2012 and 2021 in the Context of NSW Public Policy. Buildings 2022, 12, 35. https://doi.org/10.3390/buildings12010035
Perry JM, Shirowzhan S, Pettit CJ. Lockout, Lockdown and Land Use: Exploring the Spatio-Temporal Evolution Patterns of Licensed Venues in Sydney, Australia between 2012 and 2021 in the Context of NSW Public Policy. Buildings. 2022; 12(1):35. https://doi.org/10.3390/buildings12010035
Chicago/Turabian StylePerry, Jayden Mitchell, Sara Shirowzhan, and Christopher James Pettit. 2022. "Lockout, Lockdown and Land Use: Exploring the Spatio-Temporal Evolution Patterns of Licensed Venues in Sydney, Australia between 2012 and 2021 in the Context of NSW Public Policy" Buildings 12, no. 1: 35. https://doi.org/10.3390/buildings12010035