
Evaluation of Photovoltaic Energy Saving Potential and Investment Value of Urban Buildings in China Based on GIS Technology


Abstract
:1. Introduction
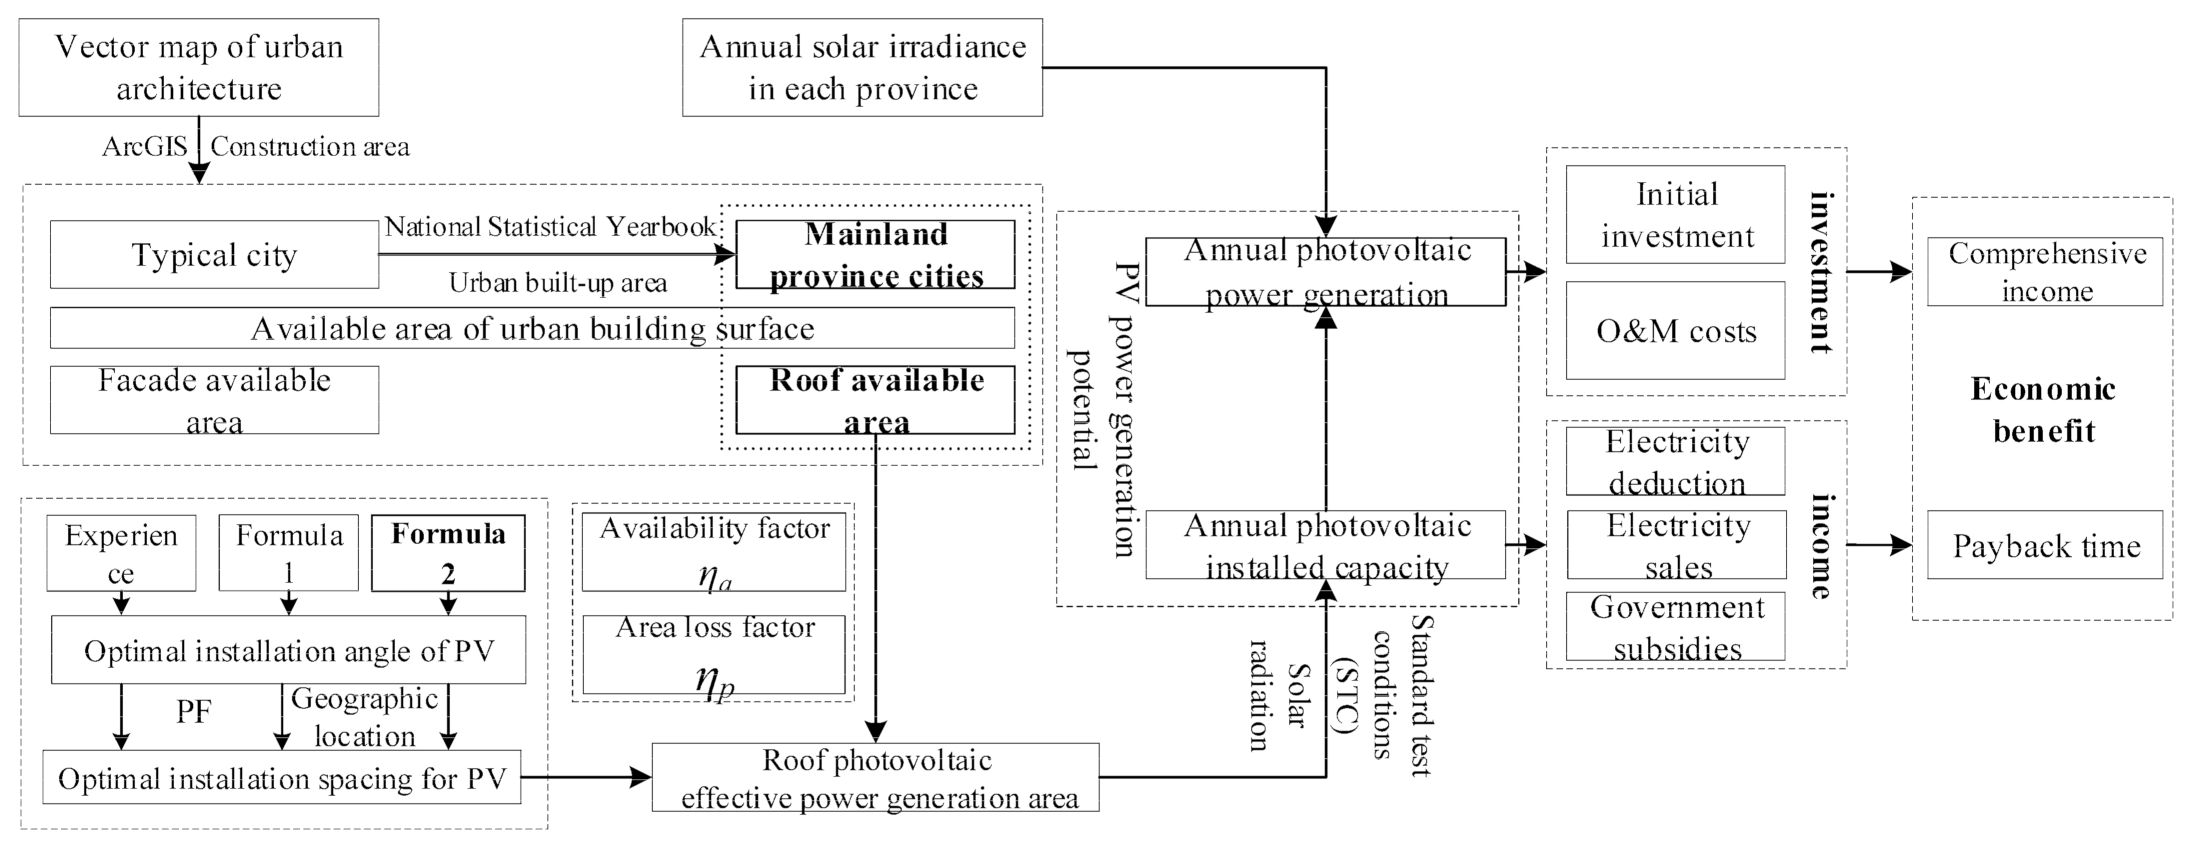
2. Methodology
3. Photovoltaic Potential and Economic Analysis of Urban Buildings
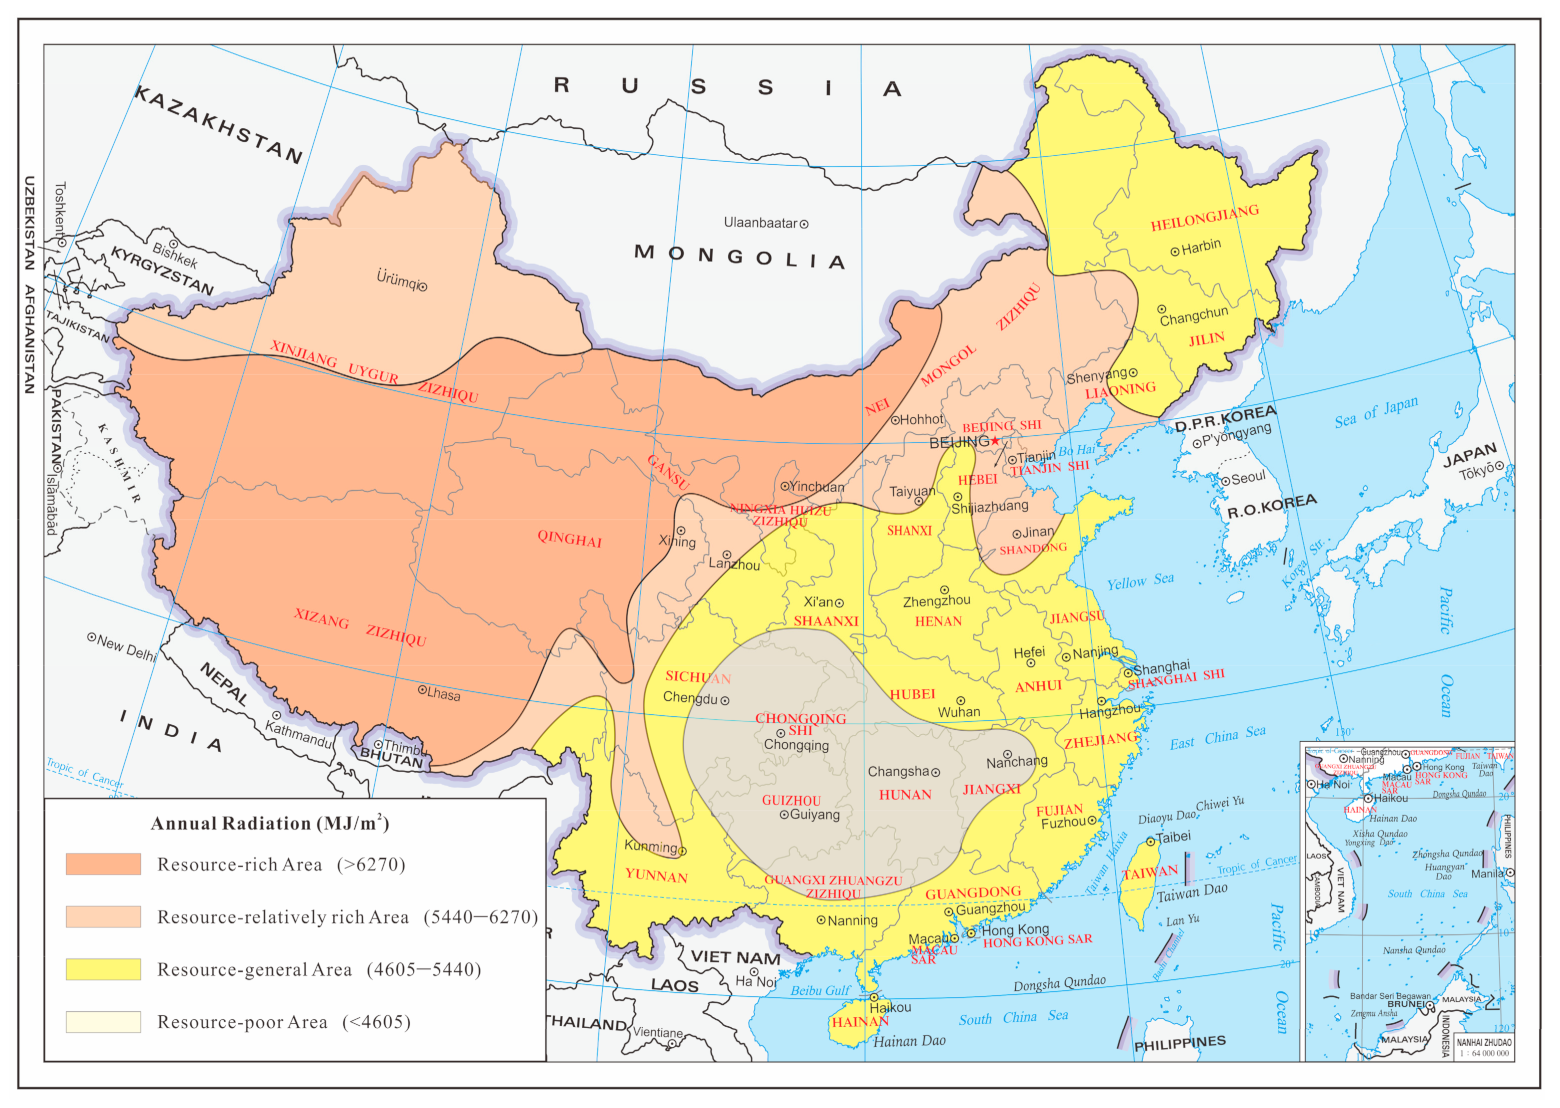
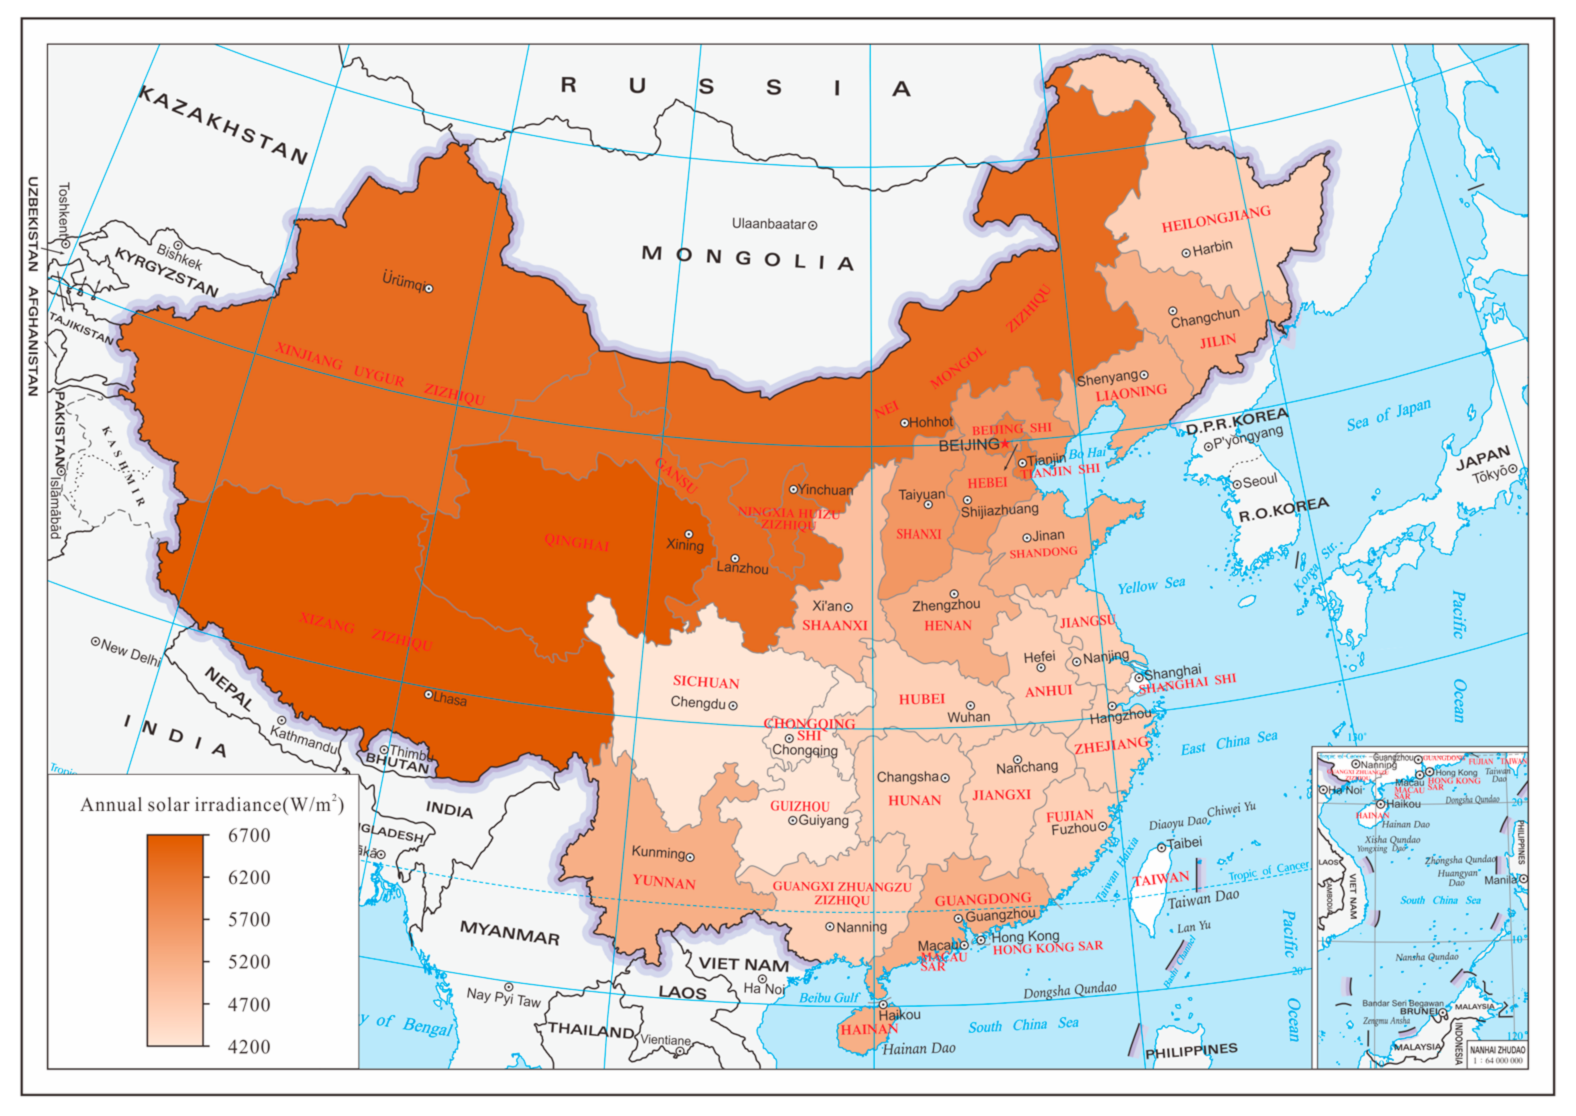
3.1. Solar Radiation Resources
3.1.1. Spatial Distribution of Solar Energy Resources in Chinese Mainland
3.1.2. Statistics of Solar Energy Resources in Different Provinces
3.2. Available Area of Urban Building Surface
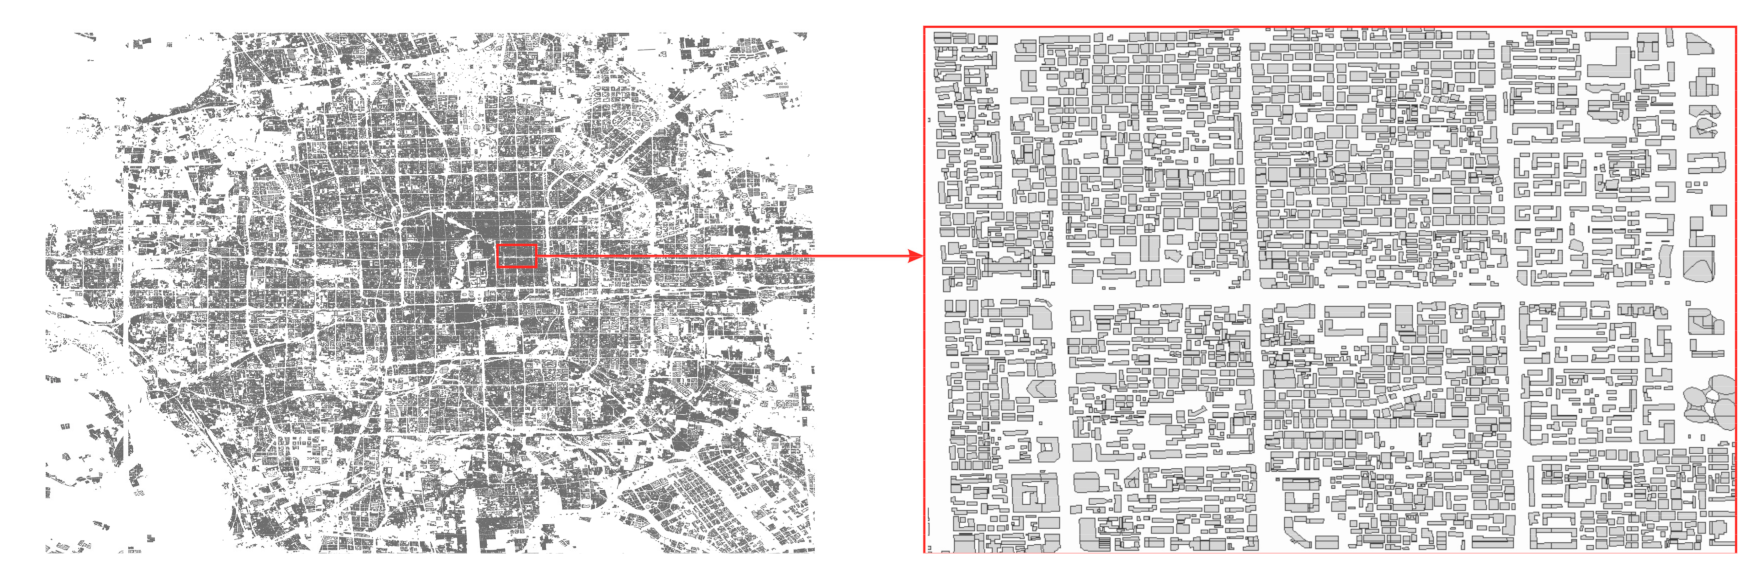
3.2.1. Available Area of Building Surface in Typical Cities of Each Province
- (1)
- The area and perimeter of each building contour in a typical city map are calculated statistically;
- (2)
- The area of all building blocks in the map calculated in the previous step is accumulated to obtain the building area of the typical city, namely the building roof area;
- (3)
- After reading the building layers corresponding to each building block in the building outline map of a typical city by ArcGIS map processing software, assuming that the floor height of each building is 3 m, the building height corresponding to each building block is calculated.
- (4)
- Multiply the perimeter of each building block in the map obtained in step (1) by the building height of the corresponding building block obtained in step (3) to calculate the elevation area of each building outline block in the map;
- (5)
- The building elevation area of the typical city can be calculated by adding up the elevation area corresponding to each building block on the building outline map.
3.2.2. Usable Area of Building Surface
- (1)
- The data of the provincial statistical yearbook of each province and the Municipal Statistical Yearbook of each typical city are statistically sorted, and the urban built-up area data [25] of each province and typical city are obtained.
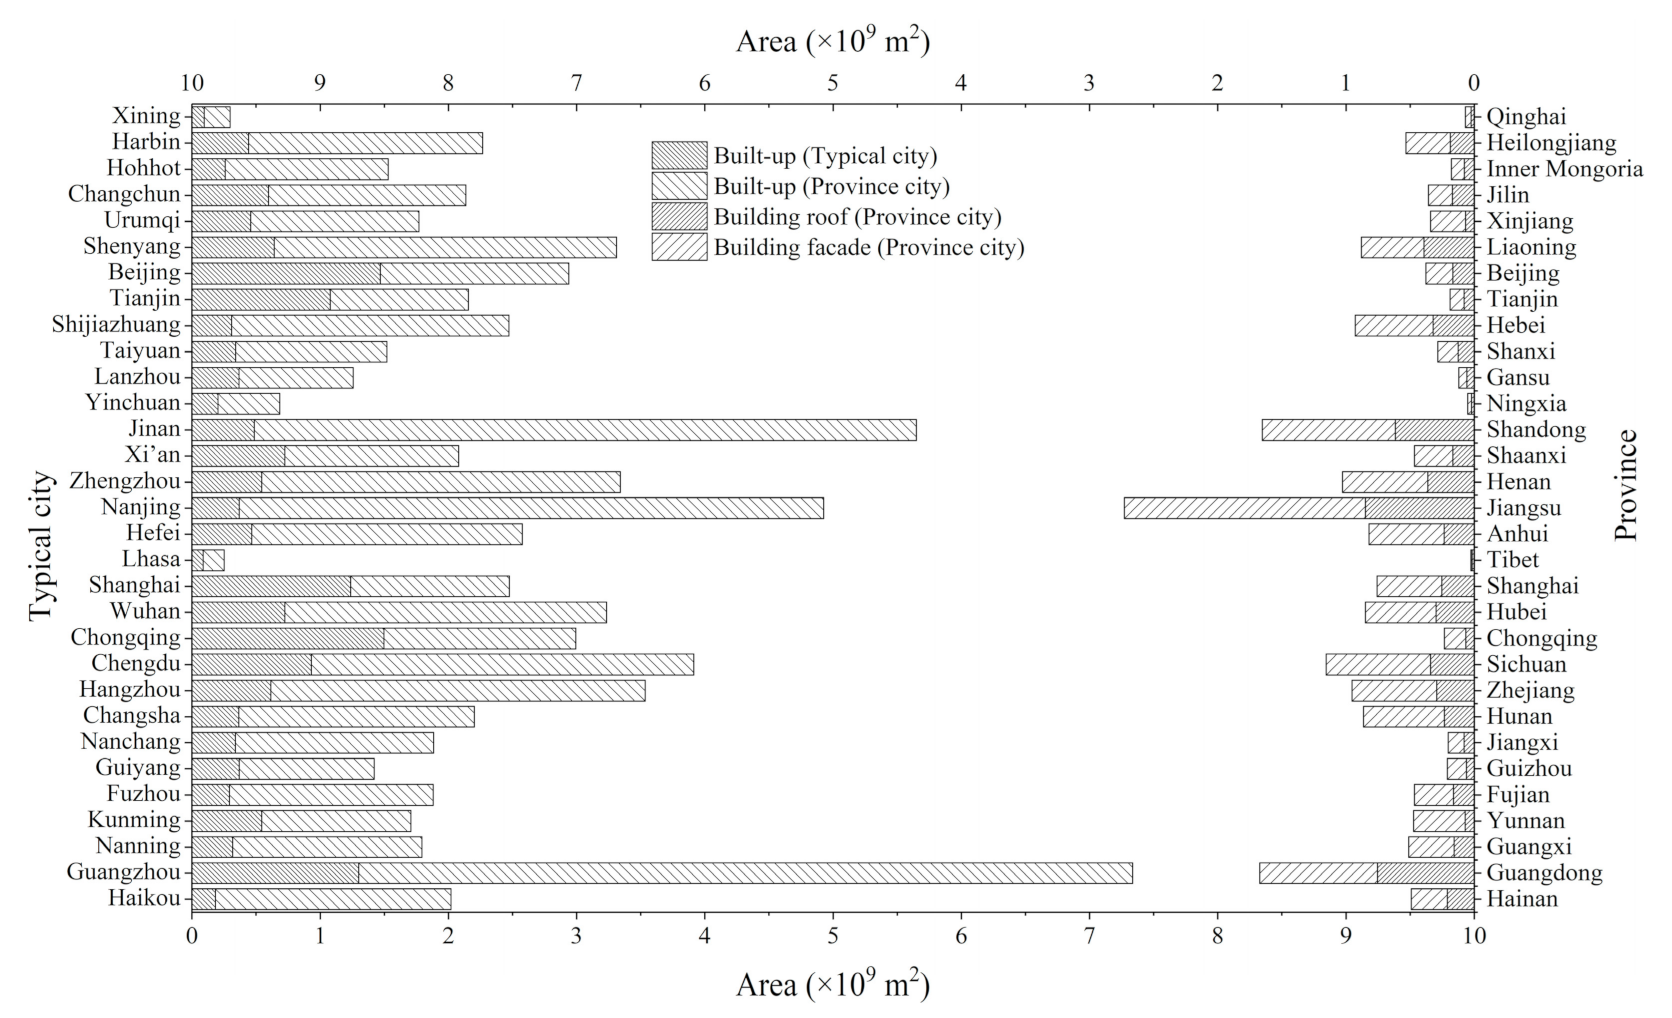
- (2)
- According to the proportional relationship between the urban built-up area of each province and its corresponding typical cities in the previous step, combined with the data calculated in Section 3.1, the overall situation of urban building roof area and facade area of each province is calculated, as shown in Figure 5.
3.3. The Area of PV Installed in Urban Building Roof
3.3.1. Optimum Installation Angle of Roof Photovoltaic
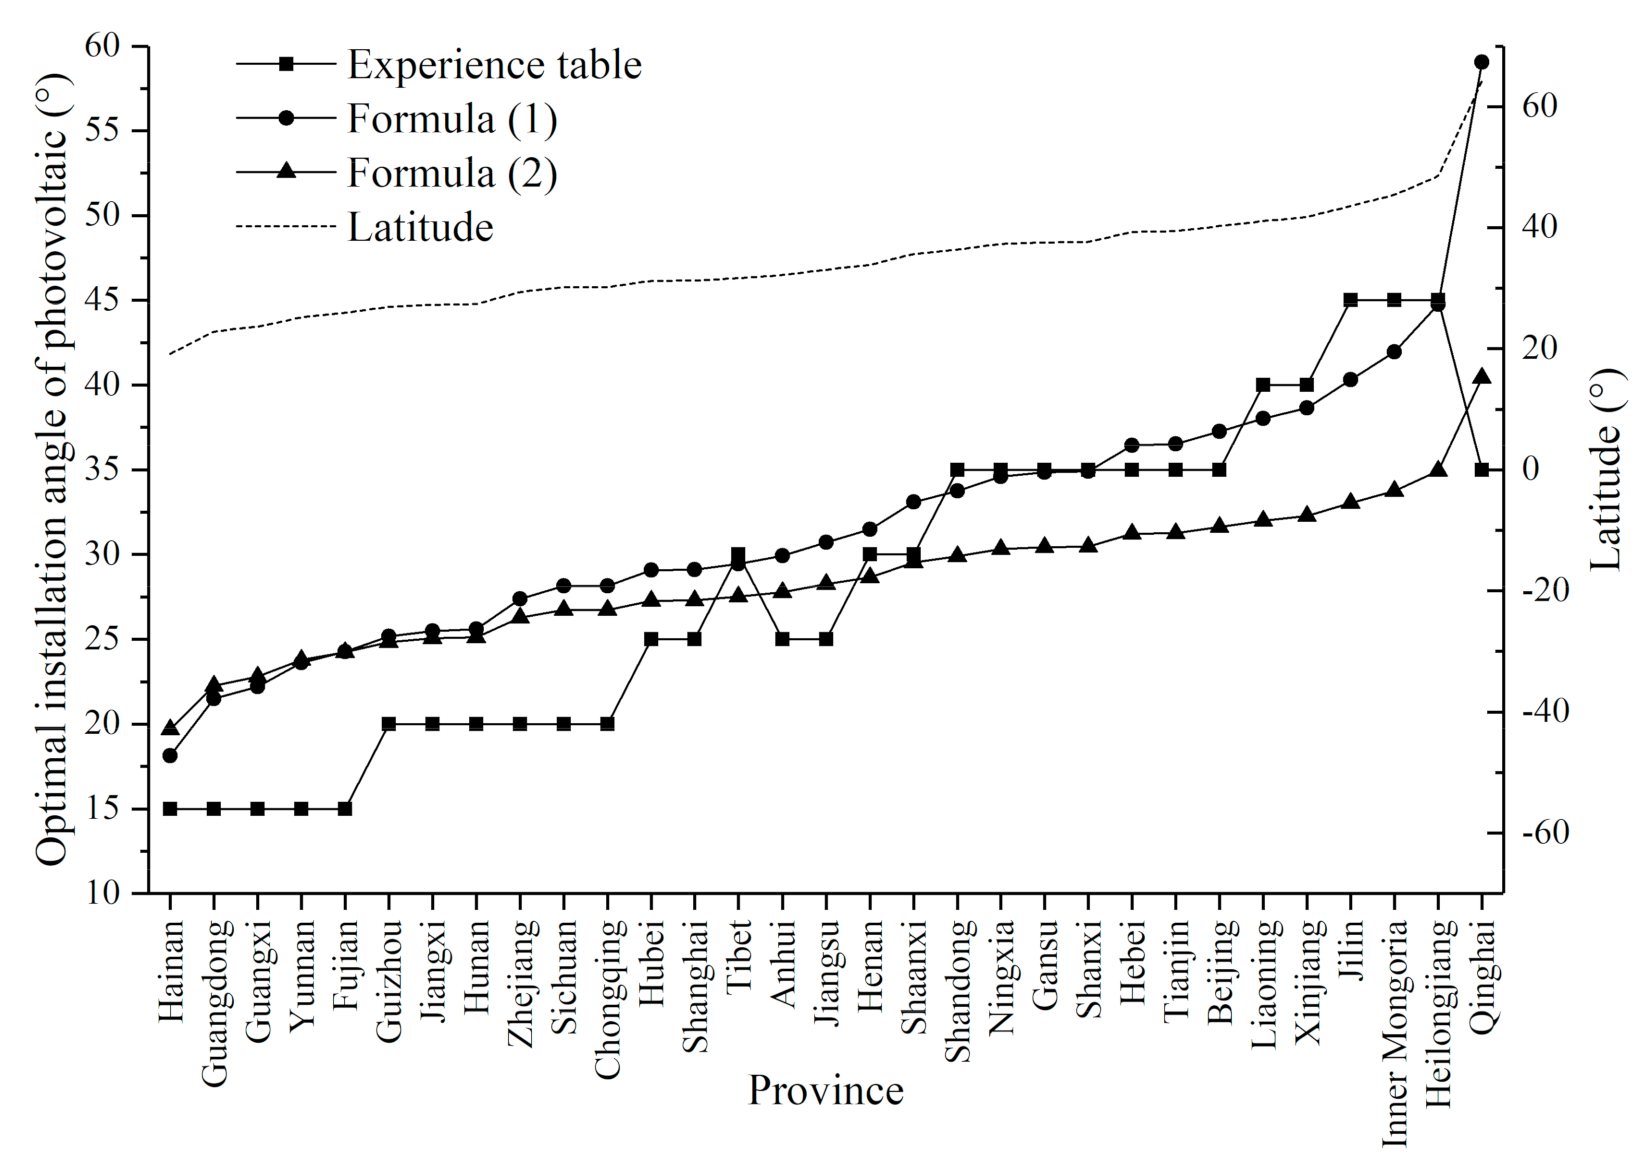
- (1)
- First of all, the first type of formula [26] is relatively simple, and the optimal installation angle of photovoltaics varies linearly with latitude, but the coefficient of the formula will change in different latitudes, as shown below.where, φ is the geographic latitude, where is the average latitude of each province.
- (2)
- The other kind of formula is more complex, and the accuracy of the best installation angle of photovoltaics is higher, and the formula has a wide range of applications. Formula (2) has been modified from the original Formula [7], as shown in the following.
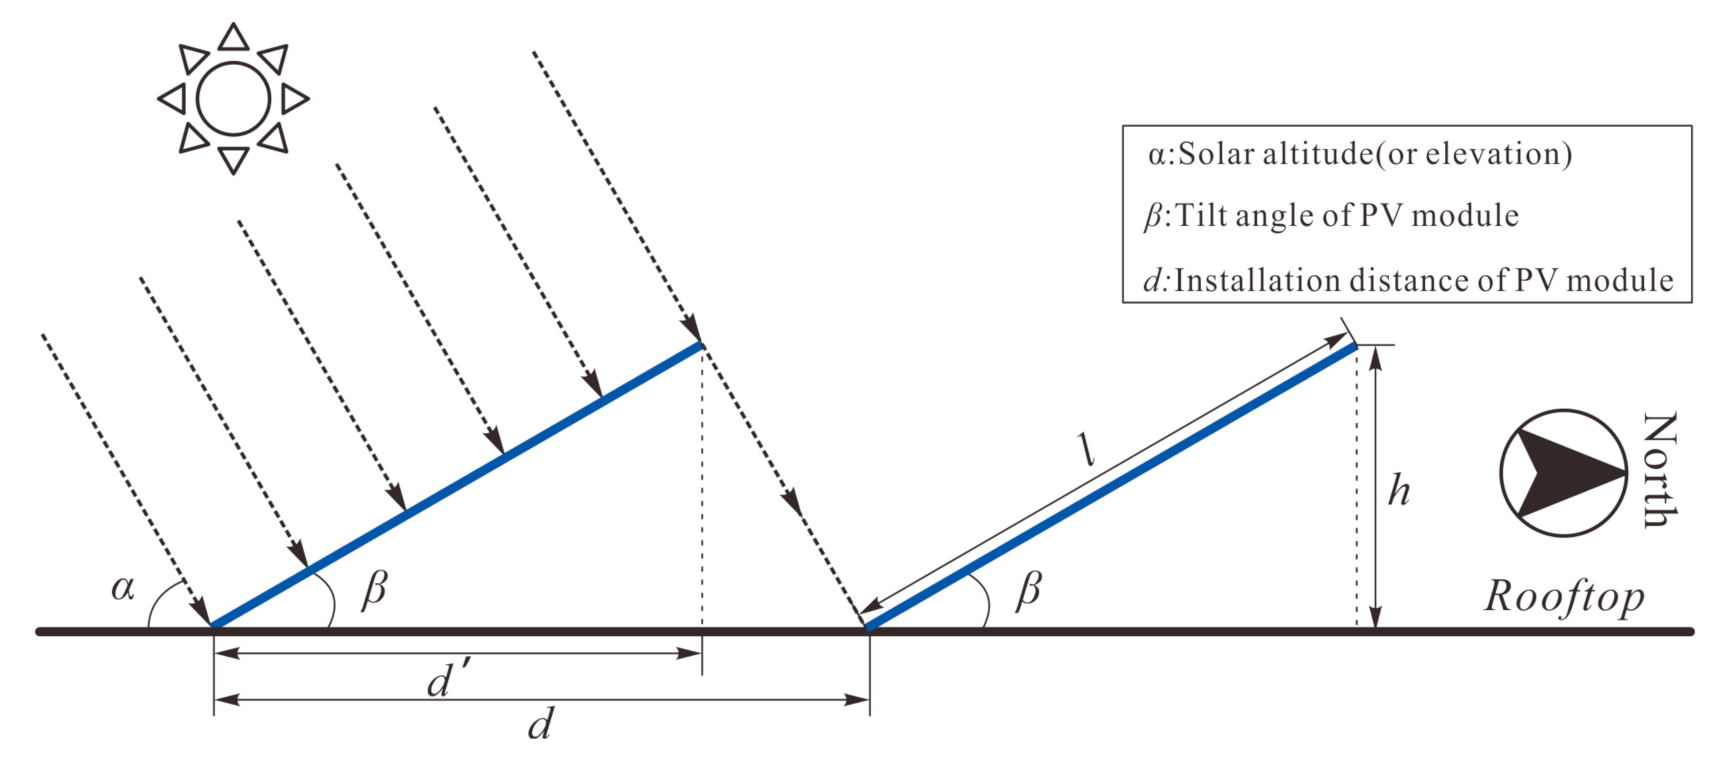
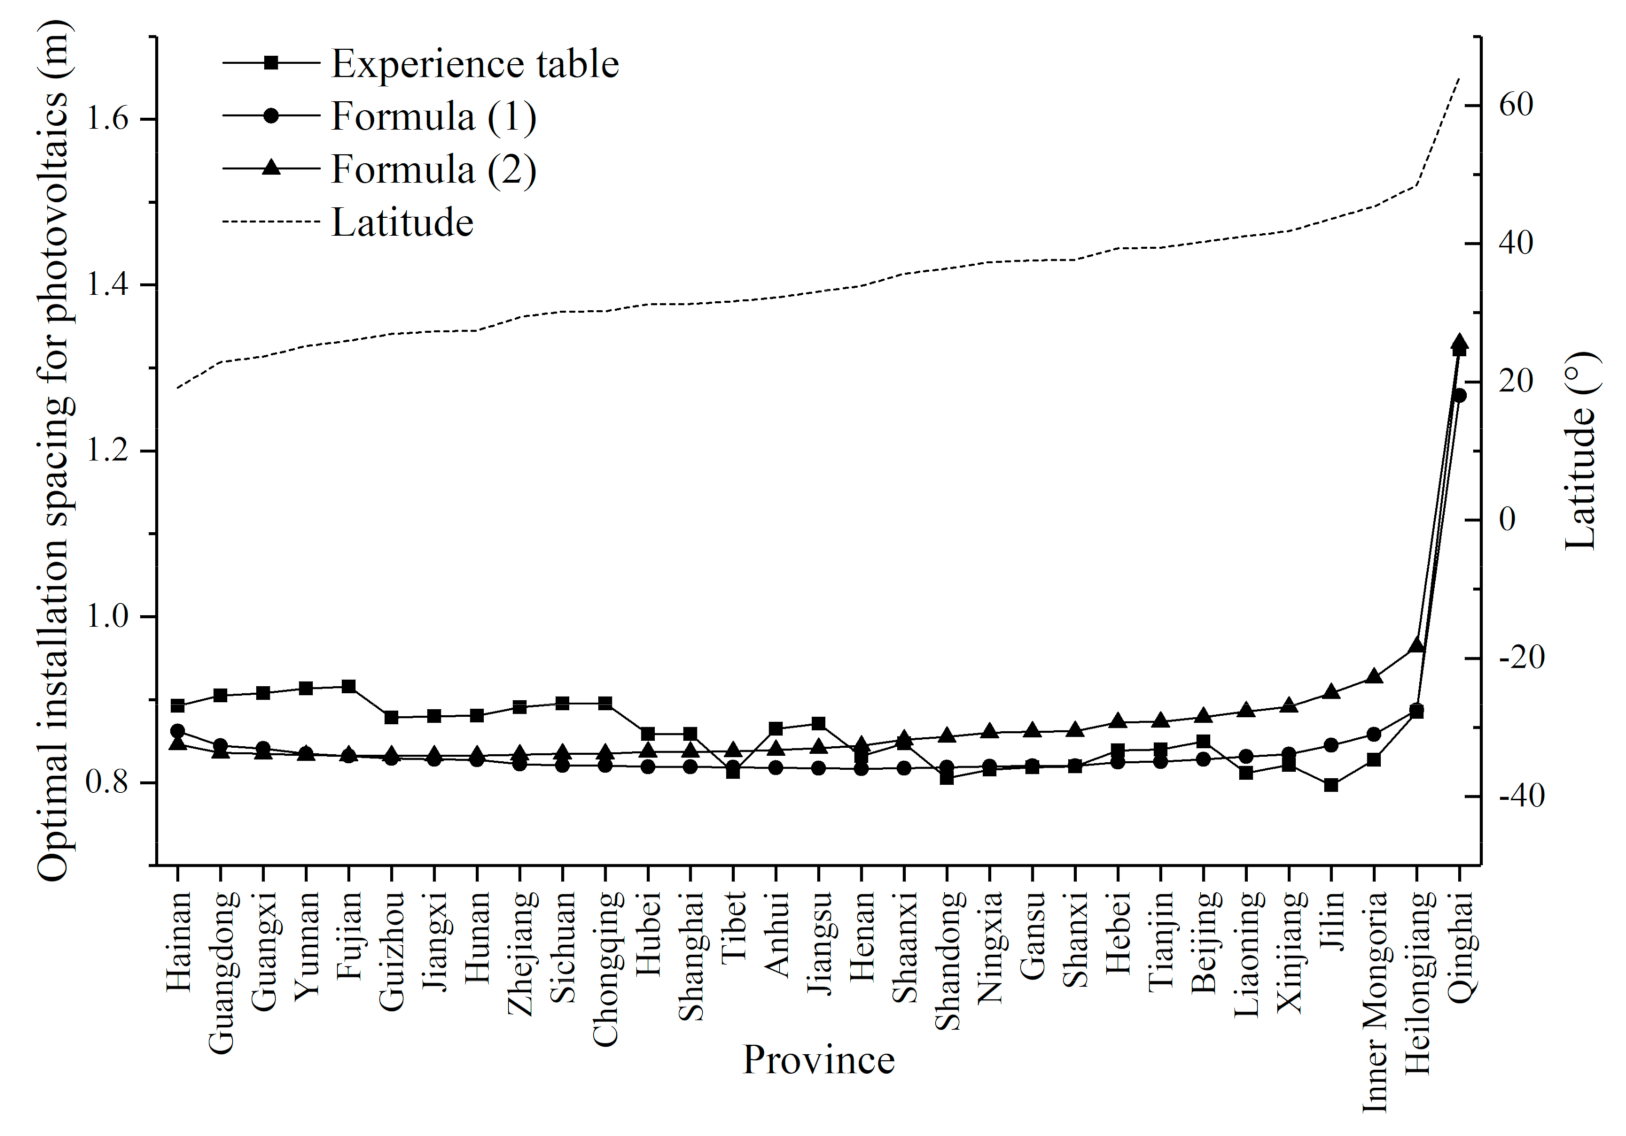
3.3.2. Optimal Installation Spacing of Roof Photovoltaic
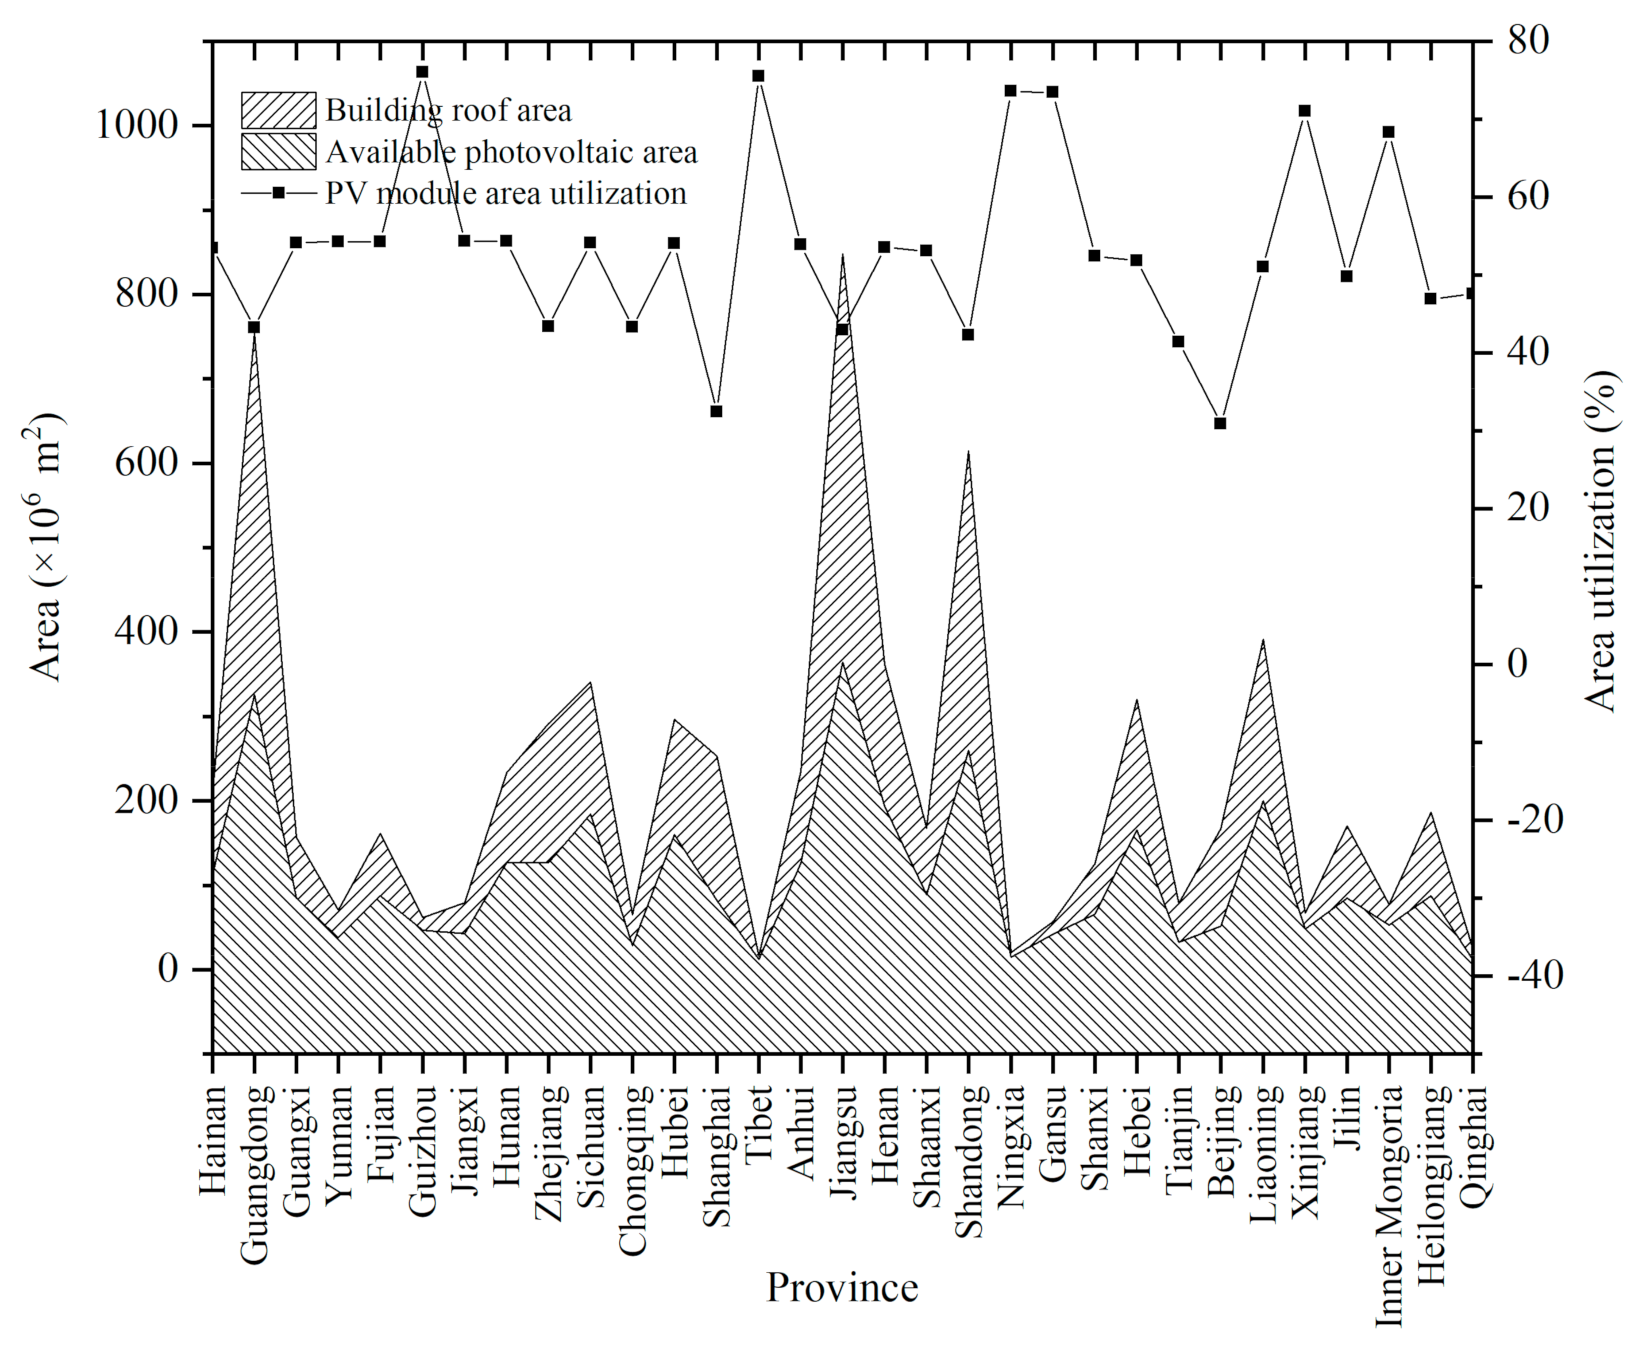
3.3.3. Roof Photovoltaic Effective Power Generation Area
- (1)
- Shadows caused by nearby buildings, trees, or other structures of some roofs themselves;
- (2)
- Use of the roof area for other purposes, such as other household facilities installed on the roof, such as outdoor air conditioners;
- (3)
- A part of the area needs to be reserved for the inspection and maintenance of photovoltaic modules by the staff.
- (4)
- According to different geographical conditions, the available coefficient ηa has different values in different literature studies, as shown in Table 2.
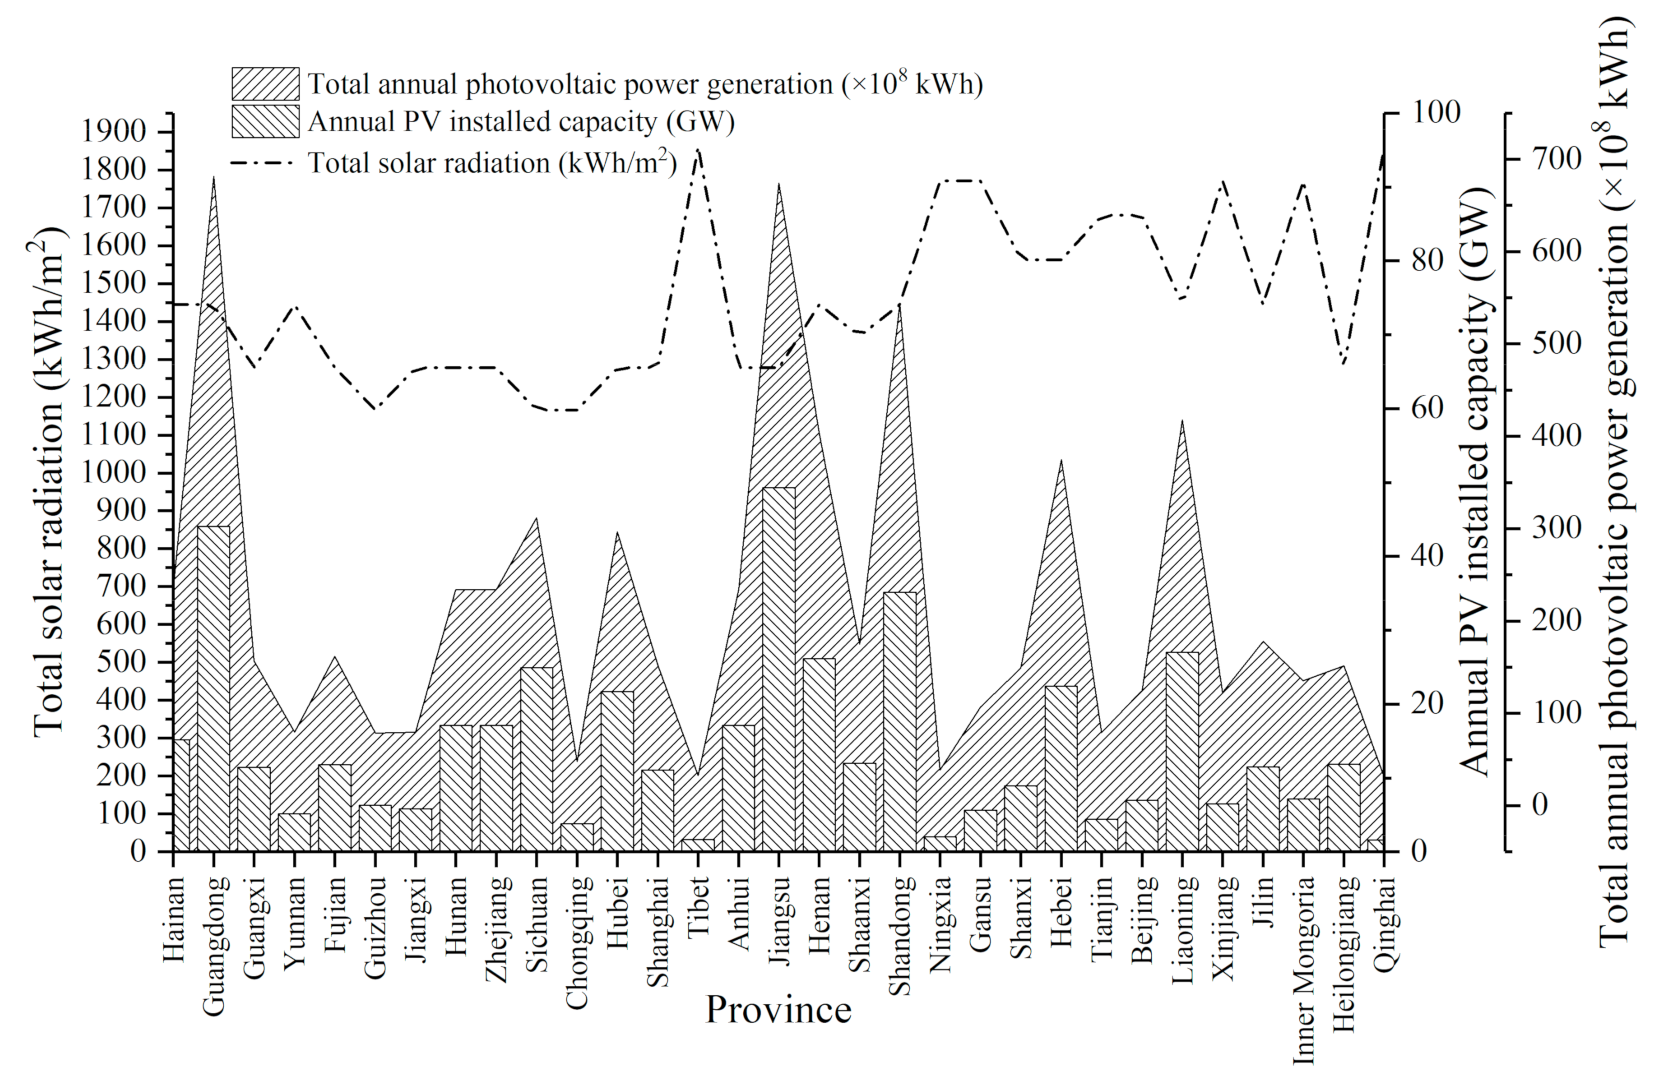
3.4. China’s Urban Photovoltaic Power Generation Potential
3.4.1. Urban PV Installed Capacity
3.4.2. Annual Power Generation of Urban Photovoltaic System
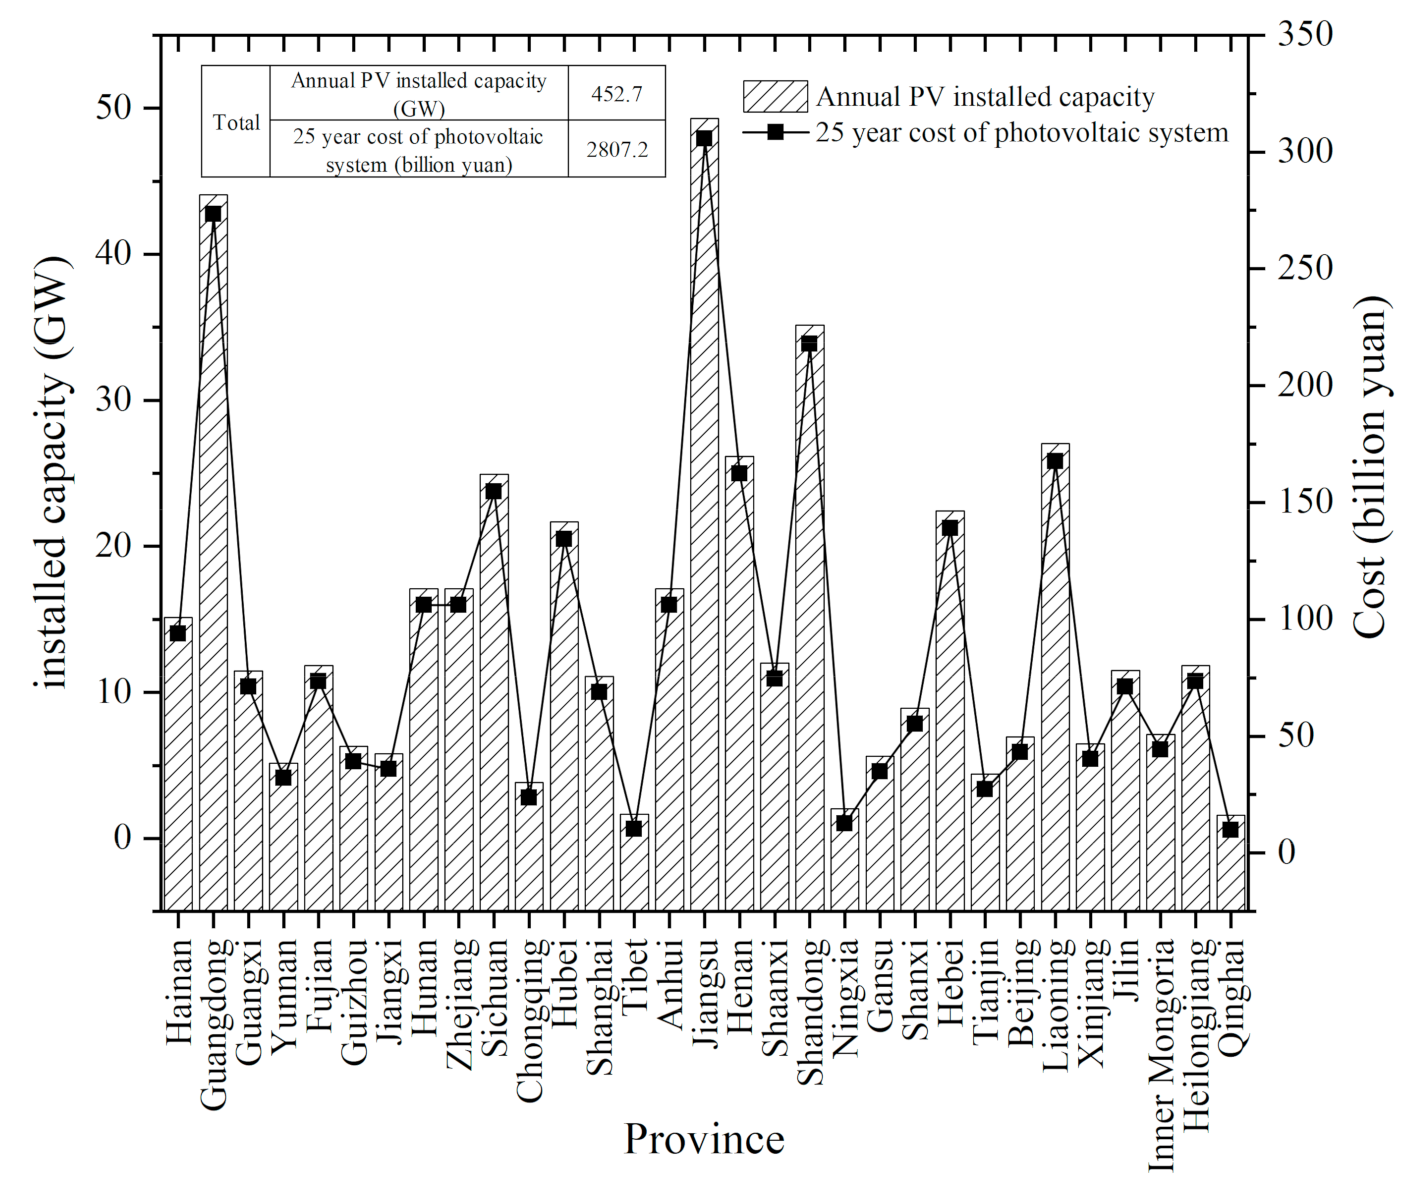
3.5. Economic Prediction and Analysis of Urban Photovoltaic Construction
3.5.1. Cost Analysis of Urban Photovoltaic Construction
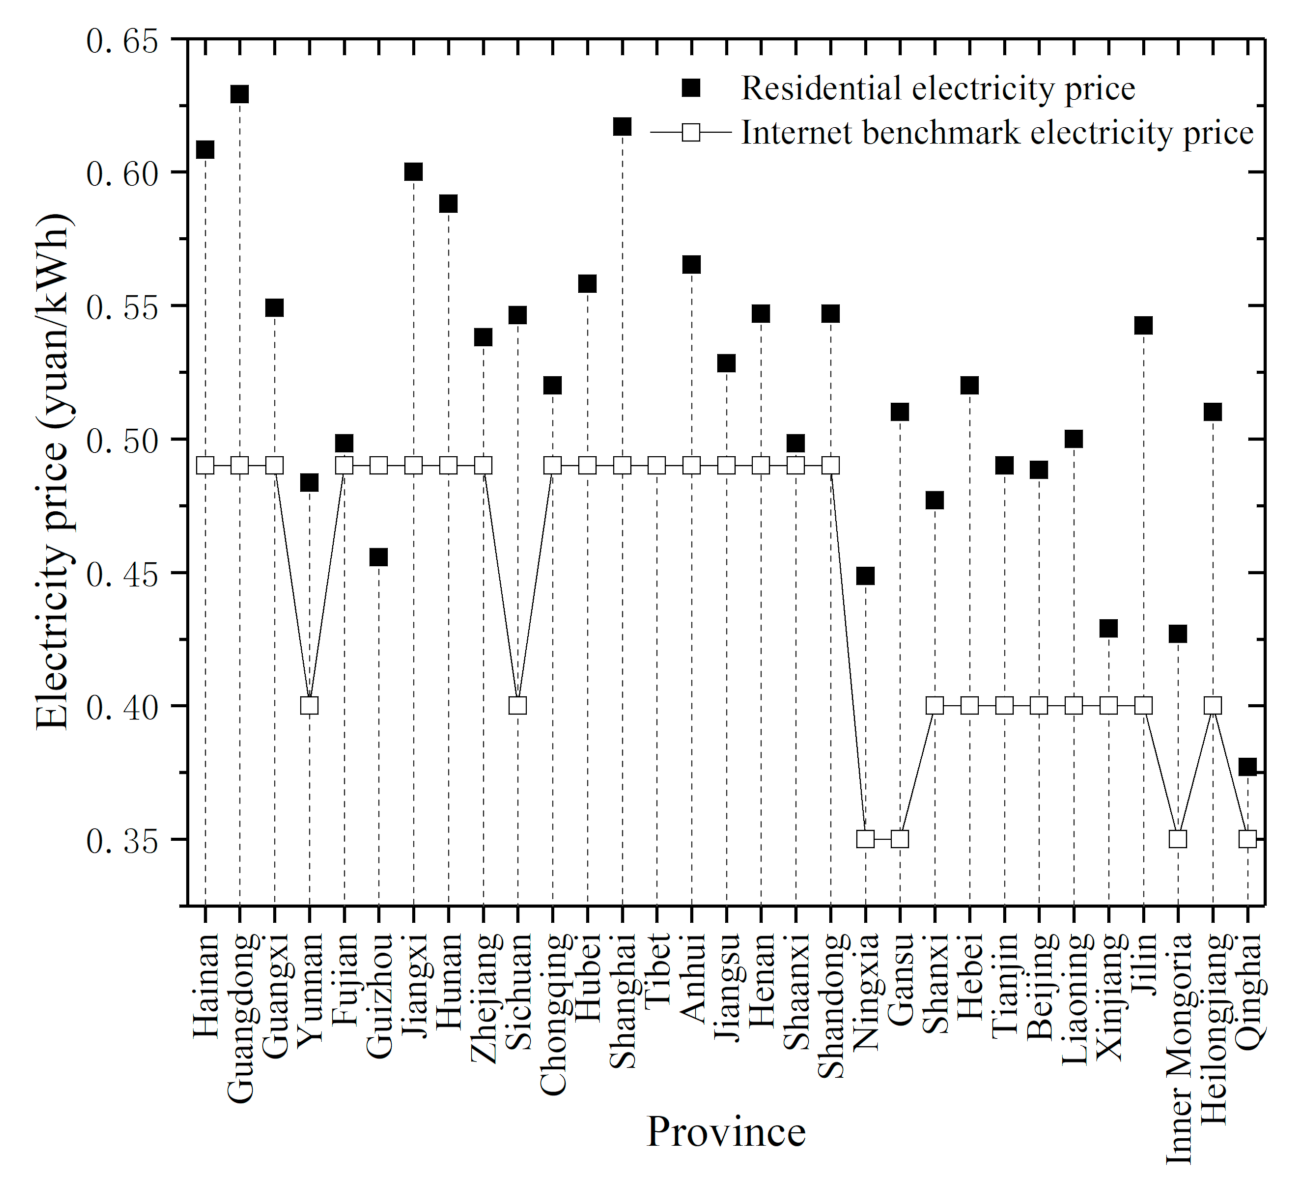
3.5.2. Urban Photovoltaic Construction Income and Return Time
4. Conclusions
Author Contributions
Funding
Institutional Review Board Statement
Informed Consent Statement
Data Availability Statement
Acknowledgments
Conflicts of Interest
References
- IPCC. Summary for Policymakers. Available online: https://www.ipcc.ch/sr15/chapter/spm/ (accessed on 10 April 2021).
- Mata, E.; Korpal, A.K.; Cheng, S.H.; Navarro, J.P.J.; Filippidou, F.; Reyna, J.; Wang, R. A map of roadmaps for zero and low energy and carbon buildings worldwide. Environ. Res. Lett. 2020, 15, 19. [Google Scholar] [CrossRef]
- International Energy Agency. World Energy Outlook 2019 Executive Summary. Available online: https://www.iea.org/reports/world-energy-outlook-2019 (accessed on 10 April 2021).
- Robati, M.; Oldfield, P.; Nezhad, A.A.; Carmichael, D.G.; Kuru, A. Carbon value engineering: A framework for integrating embodied carbon and cost reduction strategies in building design. Build. Environ. 2021, 192, 17. [Google Scholar] [CrossRef]
- Mohajeri, N.; Upadhyay, G.; Gudmundsson, A.; Assouline, D.; Kampf, J.; Scartezzini, J.L. Effects of urban compactness on solar energy potential. Renew. Energy 2016, 93, 469–482. [Google Scholar] [CrossRef] [Green Version]
- Yi, S. The Spatial Distribution of Solar Energy and the Comprehensive Potential Evaluation of Regional Exploitation and Utilization in China. Master’s Thesis, Lanzhou University, Lanzhou, China, 2014. [Google Scholar]
- Yang, Y.; Campana, P.E.; Stridh, B.; Yan, J.Y. Potential analysis of roof-mounted solar photovoltaics in Sweden. Appl. Energy 2020, 279, 14. [Google Scholar] [CrossRef]
- Vardimon, R. Assessment of the potential for distributed photovoltaic electricity production in Israel. Renew. Energy 2011, 36, 591–594. [Google Scholar] [CrossRef]
- Shafique, M.; Luo, X.W.; Zuo, J. Photovoltaic-green roofs: A review of benefits, limitations, and trends. Solar Energy 2020, 202, 485–497. [Google Scholar] [CrossRef]
- Koo, C.; Hong, T.; Park, H.S.; Yun, G. Framework for the analysis of the potential of the rooftop photovoltaic system to achieve the net-zero energy solar buildings. Prog. Photovolt. 2014, 22, 462–478. [Google Scholar] [CrossRef]
- Notice on Submitting the Pilot Scheme of Roof Distributed Photovoltaic Development in the Whole County (City, District). Available online: http://zfxxgk.nea.gov.cn/index.htmt (accessed on 30 July 2021).
- 11th Province Shanxi Province Issued the Policy of Promoting Distributed Photovoltaic in the Whole County (Report before 9 July). Available online: https://baijiahao.baidu.com/s?id=1703804914999411688&wfr=spider&for=pc (accessed on 30 July 2021).
- Zhang, W.J.; Zhao, Y.Q.; Huang, F.C.; Zhong, Y.H.; Zhou, J.W. Forecasting the Energy and Economic Benefits of Photovoltaic Technology in China’s Rural Areas. Sustainability 2021, 13, 22. [Google Scholar] [CrossRef]
- Shen, X.; Zhaojian, H.; Jianghua, W.; Mendis, T.; Jing, H. Evaluation of photovoltaic potential by urban block typology: A case study of Wuhan, China. Renew. Energy Focus 2019, 29, 141–147. [Google Scholar]
- Yue, C.D.; Huang, G.R. An evaluation of domestic solar energy potential in Taiwan incorporating land use analysis. Energy Policy 2011, 39, 7988–8002. [Google Scholar] [CrossRef]
- “A Very Encouraging Step”—China Strives to Achieve Carbon Neutrality by 2060. Available online: https://www.ccdi.gov.cn/yaowen/202009/t20200926_226245.html (accessed on 30 July 2021).
- Building Contour Vector Data of 62 Cities in China. Available online: https://www.sohu.com/a/324288814_100020239 (accessed on 30 November 2021).
- Cao, Y. Research on automatic calculation method of building area indices of urban planning. Sci. Surv. Mapp. 2017, 42, 75–79. [Google Scholar]
- Wang, Y. Energy Consumption Characteristic Model and Strength Dynamic Characteristic Analysis of Civil Buildings in China and Provinces. Master’s Thesis, Beijing University of Civil Engineering and Architecture, Beijing, China, 2019. [Google Scholar]
- Liang, J.; Zhang, W.; Tian, X.; Zhang, J.; Zhou, J. Prediction of Heating Energy Consumption and Analysis of Energy Saving Potential in Northern Urban Areas of China. In Proceedings of the 2020 2nd International Conference on Environment, Resources and Energy Engineering, Singapore, 24–26 July 2020; Volume 566. [Google Scholar]
- Niu, Q. GIS Based Large Scale Modeling and Archiving of Buildings in Historic Conservation Area: Take Luojia Hill Historic Conservation Area for Example. In Progress in Industrial and Civil Engineering, Pts. 1–5; Yang, W.J., Li, Q.S., Eds.; Trans Tech Publications Ltd: Stafa-Zurich, Switzerland, 2012; Volume 204–208, pp. 3553–3556. [Google Scholar]
- Freitas, S.; Catita, C.; Redweik, P.; Brito, M.C. Modelling solar potential in the urban environment: State-of-the-art review. Renew. Sustain. Energy Rev. 2015, 41, 915–931. [Google Scholar] [CrossRef]
- Faisal, K.; Shaker, A.; Habbani, S. Modelling the Relationship between the Gross Domestic Product and Built-Up Area Using Remote Sensing and GIS Data: A Case Study of Seven Major Cities in Canada. ISPRS Int. Geo-Inf. 2016, 5, 16. [Google Scholar]
- Zhou, R.; Li, Y.-H.; Hu, Y.-M.; Xi, F.-M.; Shan, T.; He, H.-S.; Liu, M.; Wang, J.-N. Spatiotemporal expansion of urban and rural built-up areas in Shenyang City: An analysis based on remote sensing and GIS technology. Yingyong Shengtai Xuebao 2009, 20, 2446–2454. [Google Scholar] [PubMed]
- National Data. Available online: https://data.stats.gov.cn/ (accessed on 30 November 2021).
- Chang, T.P. The Sun’s apparent position and the optimal tilt angle of a solar collector in the northern hemisphere. Solar Energy 2009, 83, 1274–1284. [Google Scholar] [CrossRef]
- Martin-Chivelet, N. Photovoltaic potential and land-use estimation methodology. Energy 2016, 94, 233–242. [Google Scholar] [CrossRef]
- Karteris, M.; Slini, T.; Papadopoulos, A.M. Urban solar energy potential in Greece: A statistical calculation model of suitable built roof areas for photovoltaics. Energy Build. 2013, 62, 459–468. [Google Scholar] [CrossRef]
- China Electric Power Industry Statistics in 2020. Available online: http://www.nea.gov.cn/2021-01/20/c_139683739.htm (accessed on 20 September 2021).
- Zou, H.Y.; Du, H.B.; Brown, M.A.; Mao, G.Z. Large-scale PV power generation in China: A grid parity and techno-economic analysis. Energy 2017, 134, 256–268. [Google Scholar] [CrossRef]
- Adefarati, T.; Bansal, R.C. Reliability and economic assessment of a microgrid power system with the integration of renewable energy resources. Appl. Energy 2017, 206, 911–933. [Google Scholar] [CrossRef]
- SolarZoom. Price Monitoring of Photovoltaic Industry China. Available online: http://m.solarzoom.com/article-152517-1.html (accessed on 10 October 2021).
- Alibaba. Purchase and Wholesale Trade. Available online: https://www.1688.com/ (accessed on 10 October 2021).
- Jia, X.Y.; Du, H.B.; Zou, H.Y.; He, G. Assessing the effectiveness of China’s net-metering subsidies for household distributed photovoltaic systems. J. Clean Prod. 2020, 262, 9. [Google Scholar] [CrossRef]


| City | Latitude (°) | Area of Building Roof (×106 m2) | Perimeter of Building Roof (×103 m) | Area of Building Facade (×106 m2) |
|---|---|---|---|---|
| Haikou | 19.17 | 20.85 | 4404.84 | 48.83 |
| Guangzhou | 22.86 | 162.31 | 28,485.95 | 360.24 |
| Nanning | 23.64 | 33.63 | 6747.72 | 109.90 |
| Kunming | 25.19 | 32.82 | 6655.82 | 220.76 |
| Fuzhou | 25.93 | 29.72 | 5406.67 | 86.14 |
| Guiyang | 26.92 | 21.50 | 4090.10 | 73.55 |
| Nanchang | 27.28 | 17.32 | 3402.70 | 44.38 |
| Changsha | 27.38 | 46.34 | 9266.99 | 171.69 |
| Hangzhou | 29.36 | 61.49 | 11,683.38 | 200.73 |
| Chengdu | 30.18 | 106.43 | 20,059.58 | 360.98 |
| Chongqing | 30.19 | 65.21 | 11,472.57 | 233.61 |
| Wuhan | 31.21 | 85.55 | 16,090.66 | 244.79 |
| Shanghai | 31.25 | 253.15 | 48,170.54 | 756.98 |
| Lhasa | 31.63 | 8.59 | 2105.54 | 13.89 |
| Hefei | 32.16 | 51.82 | 10,064.33 | 181.04 |
| Nanjing | 33.04 | 68.61 | 15,716.20 | 220.76 |
| Zhengzhou | 33.88 | 70.30 | 13,172.33 | 199.86 |
| Xi’an | 35.64 | 89.31 | 15,758.83 | 248.47 |
| Jinan | 36.38 | 57.80 | 10,747.60 | 155.43 |
| Yinchuan | 37.31 | 8.61 | 1701.85 | 21.47 |
| Lanzhou | 37.57 | 23.36 | 4305.66 | 49.84 |
| Taiyuan | 37.64 | 36.22 | 7107.44 | 82.13 |
| Shijiazhuang | 39.32 | 45.73 | 8856.75 | 132.58 |
| Tianjin | 39.41 | 78.64 | 15,189.70 | 188.18 |
| Beijing | 40.24 | 166.71 | 30,447.49 | 377.72 |
| Shenyang | 41.08 | 93.98 | 17,709.32 | 211.36 |
| Urumqi | 41.77 | 23.52 | 4584.09 | 119.17 |
| Changchun | 43.58 | 66.12 | 11,691.43 | 138.22 |
| Hohhot | 45.39 | 15.81 | 3169.13 | 36.68 |
| Harbin | 48.48 | 45.17 | 8210.48 | 128.87 |
| Xining | 64.24 | 11.66 | 2443.30 | 32.99 |
| Country and Region | Available Coefficients ηa |
|---|---|
| Taiwan [15] | 0.4 |
| Sweden [7] | 0.7 |
| Greece [28] | 0.5 |
| Israel [8] | 0.3 |
| The Level of Development | Province City | Available Coefficient ηa |
|---|---|---|
| High | Beijing, Shanghai | 0.3 |
| Higher | Guangdong, Zhejiang, Jiangsu, Shandong, Chongqing, Tianjin | 0.4 |
| Medium | Heilongjiang, Jilin, Liaoning, Shanxi, Sichuan, Hubei, Hebei, Anhui, Fujian, Henan, Hunan, Hainan, Guangxi, Jiangxi, Shaanxi, Yunnan | 0.5 |
| General | Qinghai, Ningxia, Gansu, Guizhou, Xinjiang, Tibet, Inner Mongolia | 0.7 |
| Characteristics of a PV Module (Jinko Solar, JKMS 350 M-72 V Maxim) | |
|---|---|
| Max power point voltage (V) | 39.3 |
| Max power point current (A) | 8.89 |
| Power temper. Coefficient (%/°C) | −0.38 |
| Efficiency (Module area) (%) | 18.03 |
| Efficiency (Cells area) (%) | 20.5 |
| Province | Photovoltaic Power Generation Area ×106 m2 | Installed Capacity GW |
|---|---|---|
| Hainan | 111.89 | 15.1 |
| Guangdong | 325.88 | 44.1 |
| Guangxi | 84.78 | 11.5 |
| Yunnan | 38.14 | 5.2 |
| Fujian | 87.49 | 11.8 |
| Guizhou | 46.65 | 6.3 |
| Jiangxi | 42.95 | 5.8 |
| Hunan | 126.54 | 17.1 |
| Zhejiang | 126.52 | 17.1 |
| Sichuan | 184.42 | 24.9 |
| Chongqing | 28.24 | 3.8 |
| Hubei | 160.25 | 21.7 |
| Shanghai | 82.03 | 11.1 |
| Tibet | 12.20 | 1.6 |
| Anhui | 126.37 | 17.1 |
| Jiangsu | 364.41 | 49.3 |
| Henan | 193.48 | 26.2 |
| Shaanxi | 88.80 | 12.0 |
| Shandong | 259.88 | 35.1 |
| Ningxia | 15.01 | 2.0 |
| Gansu | 41.67 | 5.6 |
| Shanxi | 65.90 | 8.9 |
| Hebei | 165.75 | 22.4 |
| Tianjin | 32.56 | 4.4 |
| Beijing | 51.42 | 7.0 |
| Liaoning | 199.83 | 27.0 |
| Xinjiang | 47.81 | 6.5 |
| Jilin | 84.93 | 11.5 |
| Inner Mongoria | 52.74 | 7.1 |
| Heilongjiang | 87.52 | 11.8 |
| Qinghai | 11.67 | 1.6 |
| Components | Capital Yuan/kW | Replacement Yuan/kW | O&M Yuan/(kW·Year) | Lifetime Year |
|---|---|---|---|---|
| PV module 1 | 1750 | 1750 | 22.16 | 25 |
| Converter 1 | 800 | 640 | 0 | 15 |
| Battery 1 | 600 | 1857 | 0 | 5 |
| Year | Power Generation Billion kWh | Self-Consumption Billion kWh | Electricity Sales Billion kWh | Subsidized Price Yuan/kWh | Resident Electricity Price Yuan/kWh | Feed-in Tariff Yuan/kWh | Income (Including Subsidies) Billion Yuan | Income (Excluding Subsidies) Billion Yuan |
|---|---|---|---|---|---|---|---|---|
| 1 | 67.40 | 47.18 | 20.22 | 0.08 | 0.5283 | 0.49 | 40.22 | 34.83 |
| 2 | 64.03 | 44.82 | 19.21 | 0.08 | 0.5547 | 0.47 | 78.90 | 68.64 |
| 3 | 60.83 | 42.58 | 18.25 | 0.07 | 0.5825 | 0.44 | 116.16 | 101.51 |
| 4 | 57.79 | 40.45 | 17.34 | 0.07 | 0.6116 | 0.42 | 152.14 | 133.53 |
| 5 | 54.90 | 38.43 | 16.47 | 0.07 | 0.6422 | 0.40 | 186.97 | 164.78 |
| 6 | 52.15 | 36.51 | 15.65 | 0.06 | 0.6743 | 0.38 | 220.75 | 195.33 |
| 7 | 49.55 | 34.68 | 14.86 | 0.06 | 0.7080 | 0.36 | 253.57 | 225.23 |
| 8 | 47.07 | 32.95 | 14.12 | 0.06 | 0.7434 | 0.34 | 285.52 | 254.56 |
| 9 | 44.71 | 31.30 | 13.41 | 0.05 | 0.7805 | 0.33 | 316.69 | 283.35 |
| 10 | 42.48 | 29.74 | 12.74 | 0.05 | 0.8196 | 0.31 | 347.13 | 311.66 |
| 11 | 40.35 | 28.25 | 12.11 | 0.05 | 0.8605 | 0.29 | 376.93 | 339.52 |
| 12 | 38.34 | 26.84 | 11.50 | 0.05 | 0.9036 | 0.28 | 406.12 | 366.97 |
| 13 | 36.42 | 25.49 | 10.93 | 0.04 | 0.9488 | 0.26 | 434.78 | 394.05 |
| 14 | 34.60 | 24.22 | 10.38 | 0.04 | 0.9962 | 0.25 | 462.94 | 420.79 |
| 15 | 32.87 | 23.01 | 9.86 | 0.04 | 1.0460 | 0.24 | 490.64 | 447.21 |
| 16 | 31.23 | 21.86 | 9.37 | 0.04 | 1.0983 | 0.23 | 517.93 | 473.35 |
| 17 | 29.66 | 20.77 | 8.90 | 0.04 | 1.1532 | 0.22 | 544.85 | 499.21 |
| 18 | 28.18 | 19.73 | 8.45 | 0.03 | 1.2109 | 0.20 | 571.41 | 524.83 |
| 19 | 26.77 | 18.74 | 8.03 | 0.03 | 1.2714 | 0.19 | 597.65 | 550.22 |
| 20 | 25.43 | 17.80 | 7.63 | 0.03 | 1.3350 | 0.18 | 623.59 | 575.40 |
| 21 | 24.16 | 16.91 | 7.25 | 0.03 | 1.4017 | 0.18 | 649.27 | 600.38 |
| 22 | 22.95 | 16.07 | 6.89 | 0.03 | 1.4718 | 0.17 | 674.69 | 625.18 |
| 23 | 21.81 | 15.26 | 6.54 | 0.03 | 1.5454 | 0.16 | 699.88 | 649.80 |
| 24 | 20.72 | 14.50 | 6.21 | 0.02 | 1.6227 | 0.15 | 724.86 | 674.27 |
| 25 | 19.68 | 13.78 | 5.90 | 0.02 | 1.7038 | 0.14 | 749.63 | 698.59 |
| Province | Cumulative Total Income (Including Subsidies) Billion Yuan | Payback Time (Including Subsidies) Year | Cumulative Total Income (Excluding Subsidies) Billion Yuan | Payback Time (Excluding Subsidies) Year |
|---|---|---|---|---|
| Hainan | 291.97 | 7 | 274.25 | 8 |
| Guangdong | 874.49 | 7 | 822.88 | 8 |
| Guangxi | 179.94 | 9 | 168.06 | 10 |
| Yunnan | 80.61 | 9 | 74.57 | 10 |
| Fujian | 171.74 | 10 | 159.48 | 11 |
| Guizhou | 77.89 | 11 | 71.92 | 13 |
| Jiangxi | 98.03 | 8 | 92.01 | 9 |
| Hunan | 284.04 | 8 | 266.31 | 9 |
| Zhejiang | 264.13 | 8 | 246.40 | 10 |
| Sichuan | 348.00 | 10 | 324.41 | 11 |
| Chongqing | 52.37 | 12 | 48.76 | 13 |
| Hubei | 344.60 | 9 | 322.15 | 10 |
| Shanghai | 191.59 | 8 | 180.10 | 9 |
| Tibet | 34.41 | 6 | 31.92 | 7 |
| Anhui | 274.65 | 9 | 256.95 | 10 |
| Jiangsu | 749.64 | 9 | 698.59 | 10 |
| Henan | 462.72 | 8 | 432.08 | 9 |
| Shaanxi | 185.68 | 9 | 172.43 | 10 |
| Shandong | 621.50 | 8 | 580.35 | 9 |
| Ningxia | 36.06 | 8 | 33.15 | 9 |
| Gansu | 111.22 | 8 | 103.13 | 9 |
| Shanxi | 148.98 | 8 | 137.69 | 9 |
| Hebei | 402.08 | 8 | 373.69 | 9 |
| Tianjin | 80.92 | 8 | 74.92 | 9 |
| Beijing | 127.43 | 8 | 117.96 | 9 |
| Liaoning | 433.93 | 9 | 402.29 | 10 |
| Xinjiang | 112.49 | 8 | 103.21 | 9 |
| Jilin | 197.21 | 8 | 183.76 | 9 |
| Inner Mongoria | 121.73 | 8 | 111.49 | 9 |
| Heilongjiang | 159.64 | 11 | 148.18 | 12 |
| Qinghai | 25.64 | 8 | 23.26 | 10 |
Publisher’s Note: MDPI stays neutral with regard to jurisdictional claims in published maps and institutional affiliations. |
© 2021 by the authors. Licensee MDPI, Basel, Switzerland. This article is an open access article distributed under the terms and conditions of the Creative Commons Attribution (CC BY) license (https://creativecommons.org/licenses/by/4.0/).
Share and Cite
Zhang, W.; Huang, F.; Mao, K.; Lin, C.; Pan, Z. Evaluation of Photovoltaic Energy Saving Potential and Investment Value of Urban Buildings in China Based on GIS Technology. Buildings 2021, 11, 649. https://doi.org/10.3390/buildings11120649
Zhang W, Huang F, Mao K, Lin C, Pan Z. Evaluation of Photovoltaic Energy Saving Potential and Investment Value of Urban Buildings in China Based on GIS Technology. Buildings. 2021; 11(12):649. https://doi.org/10.3390/buildings11120649
Chicago/Turabian StyleZhang, Wenjie, Fengcheng Huang, Kai Mao, Changqing Lin, and Zhen Pan. 2021. "Evaluation of Photovoltaic Energy Saving Potential and Investment Value of Urban Buildings in China Based on GIS Technology" Buildings 11, no. 12: 649. https://doi.org/10.3390/buildings11120649