
Interaction between Thermal Comfort, Indoor Air Quality and Ventilation Energy Consumption of Educational Buildings: A Comprehensive Review


Abstract
:1. Introduction
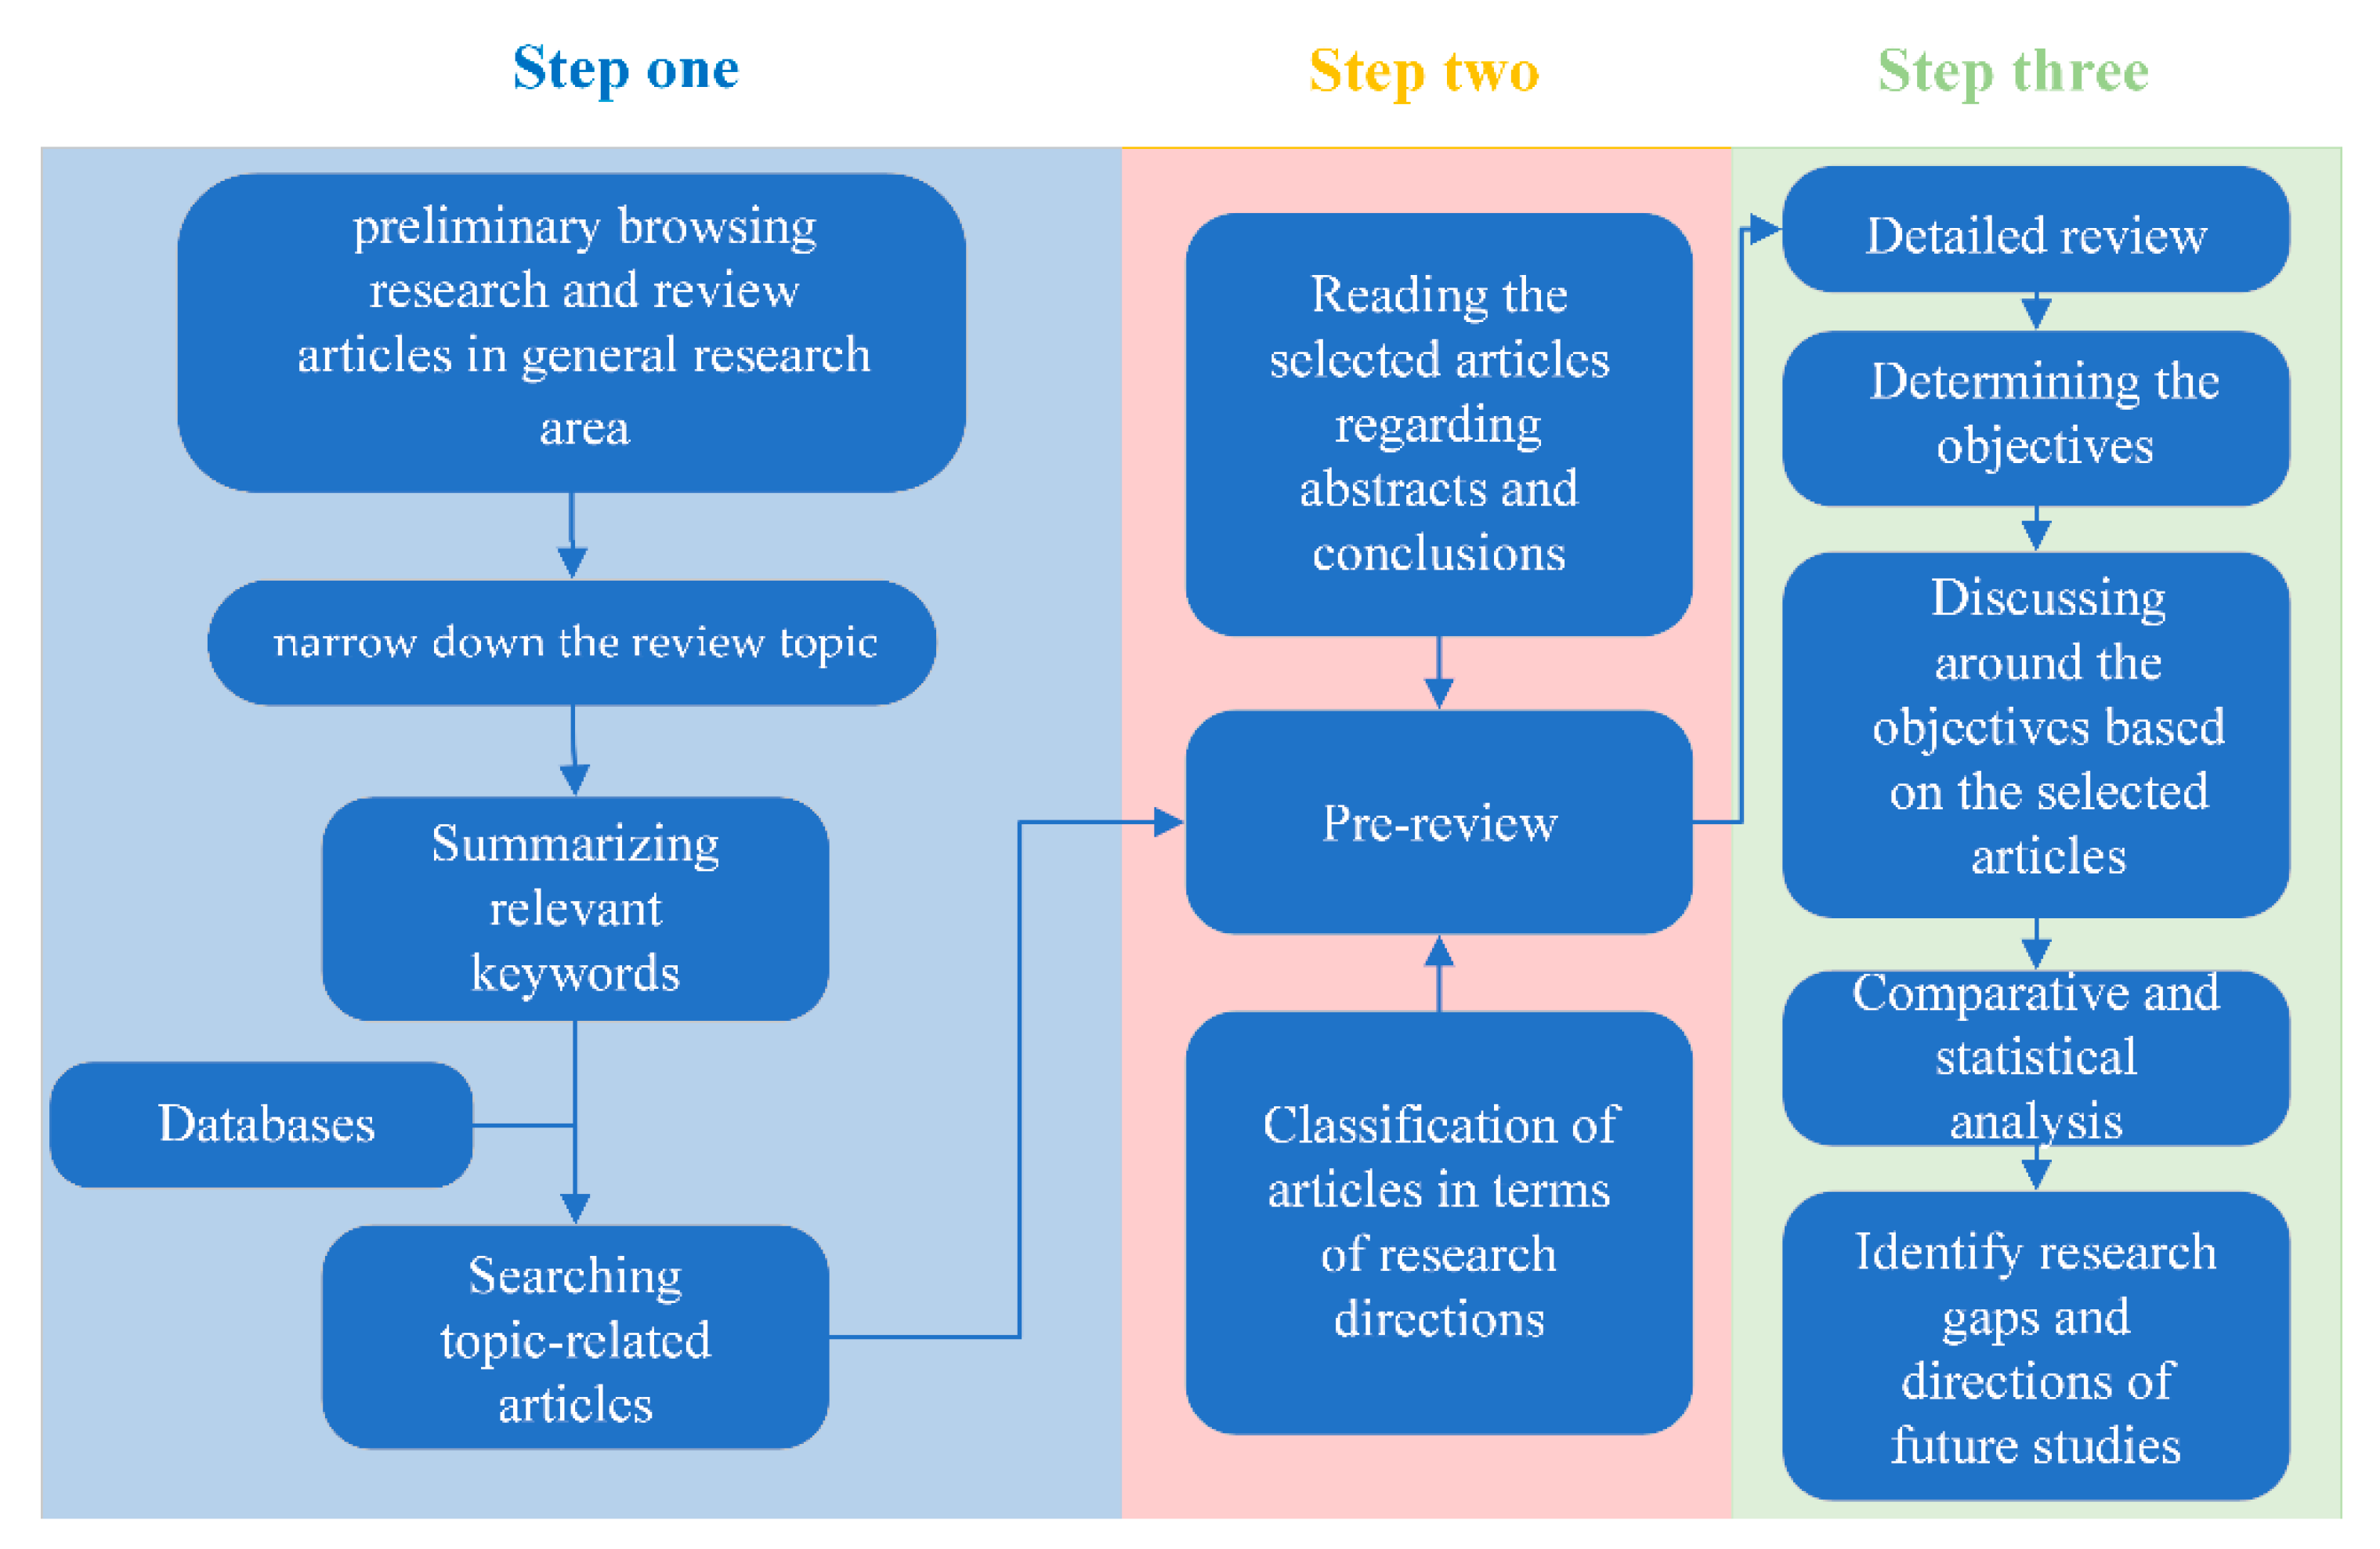
2. Methodology
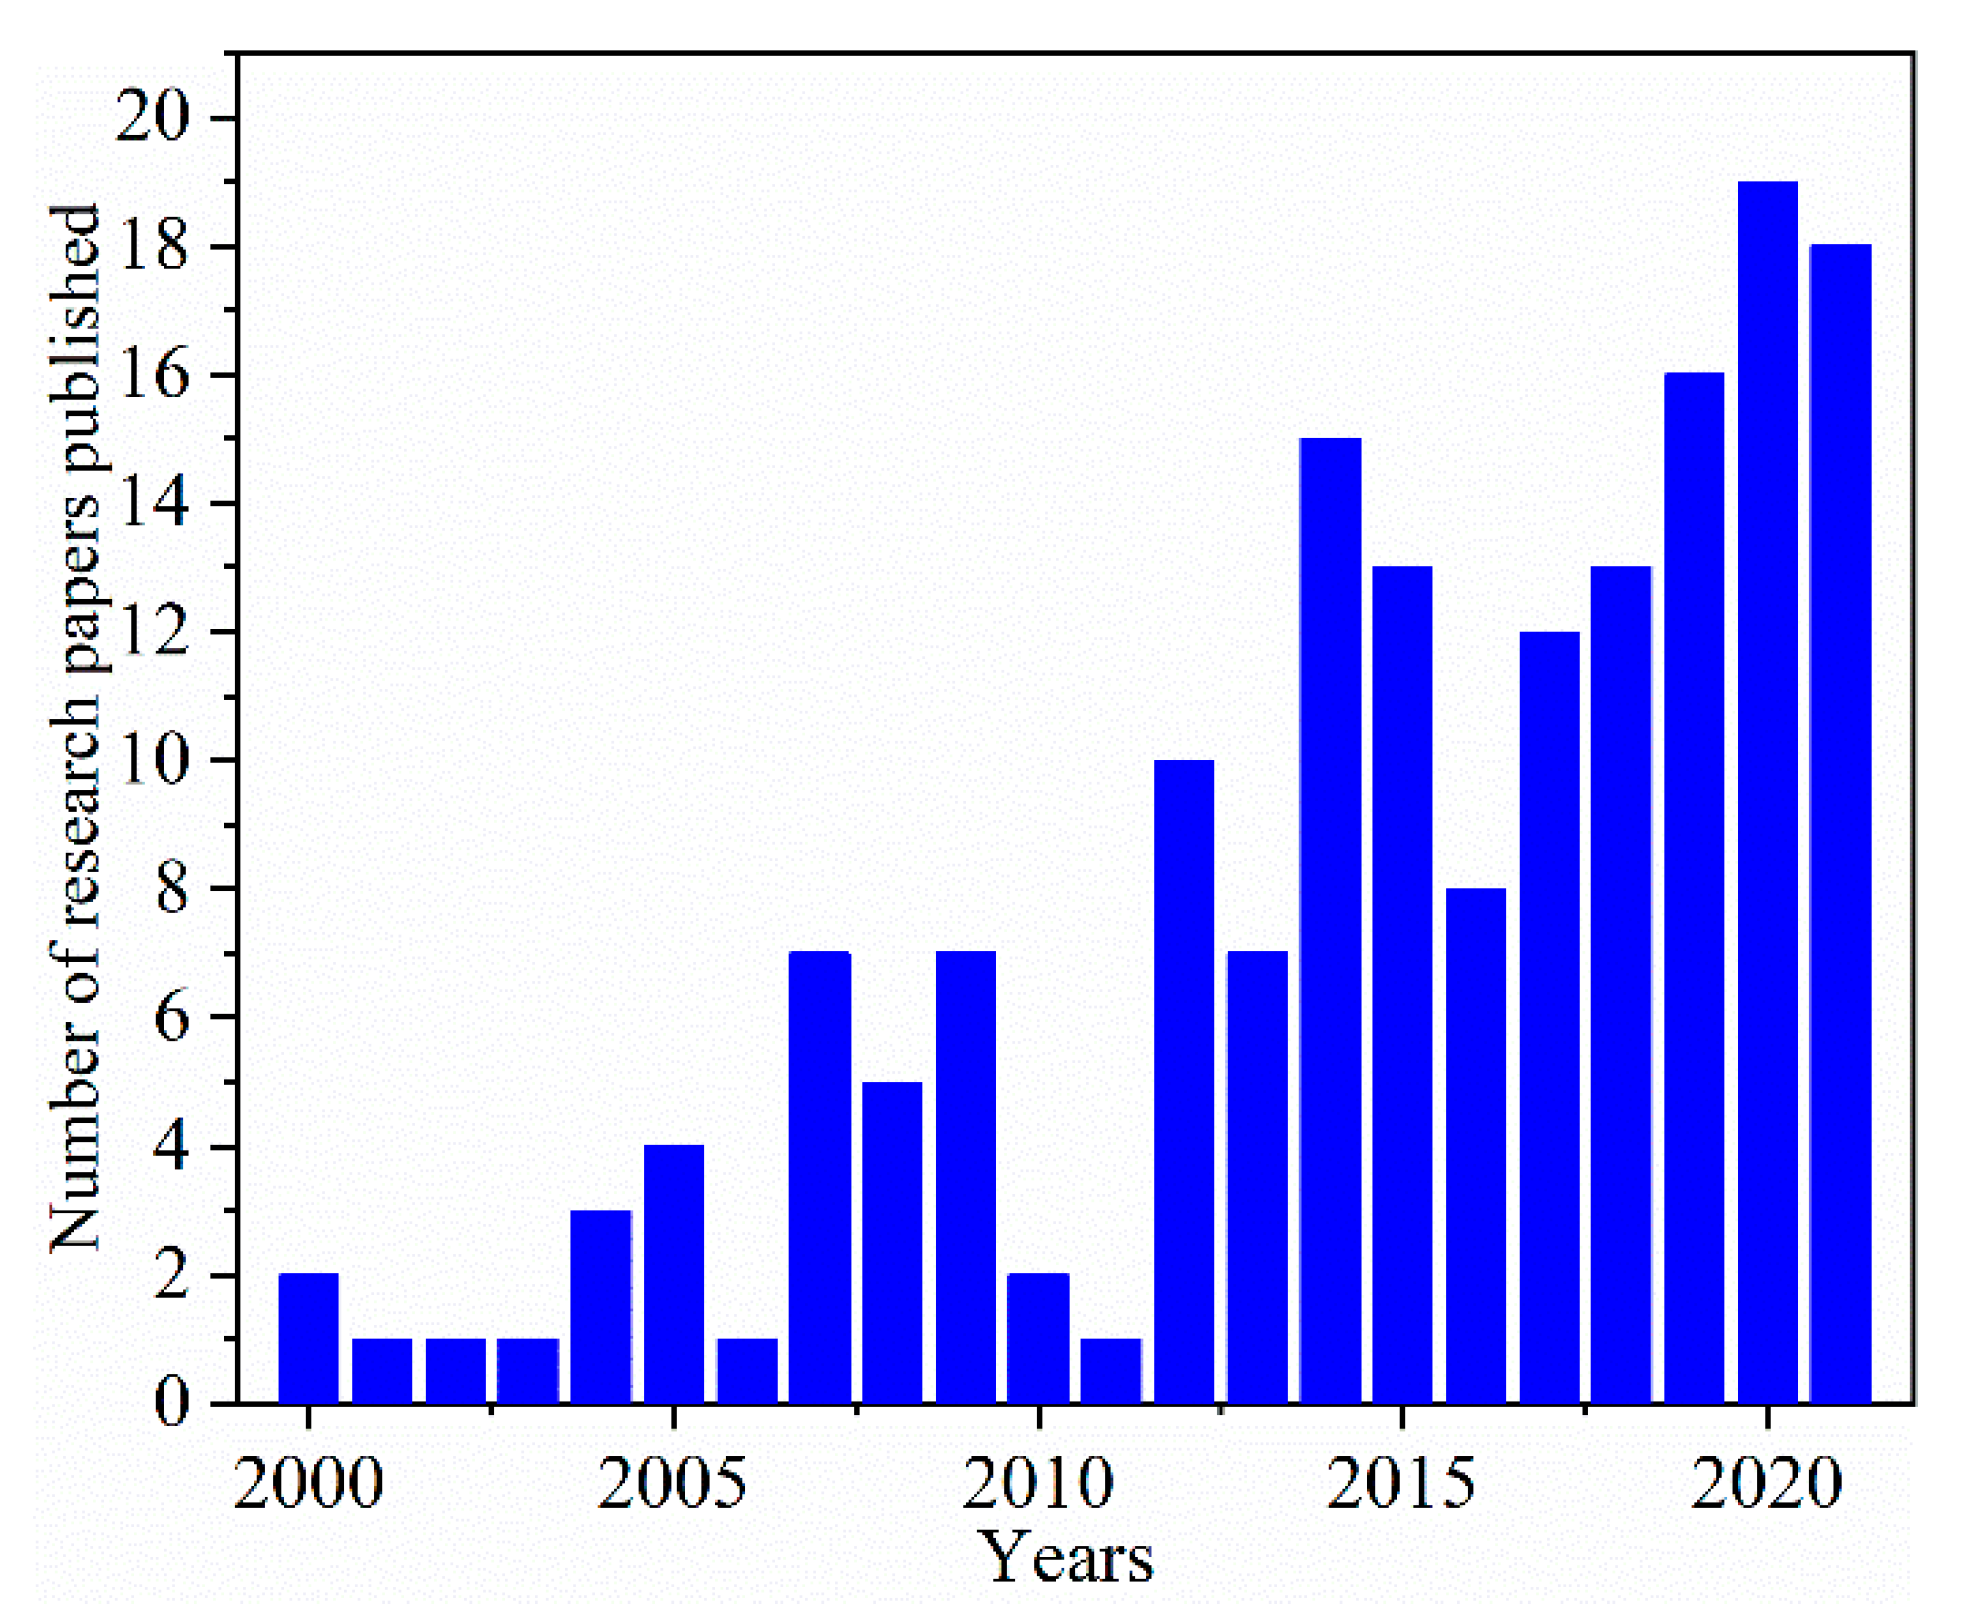
2.1. Year of Publication
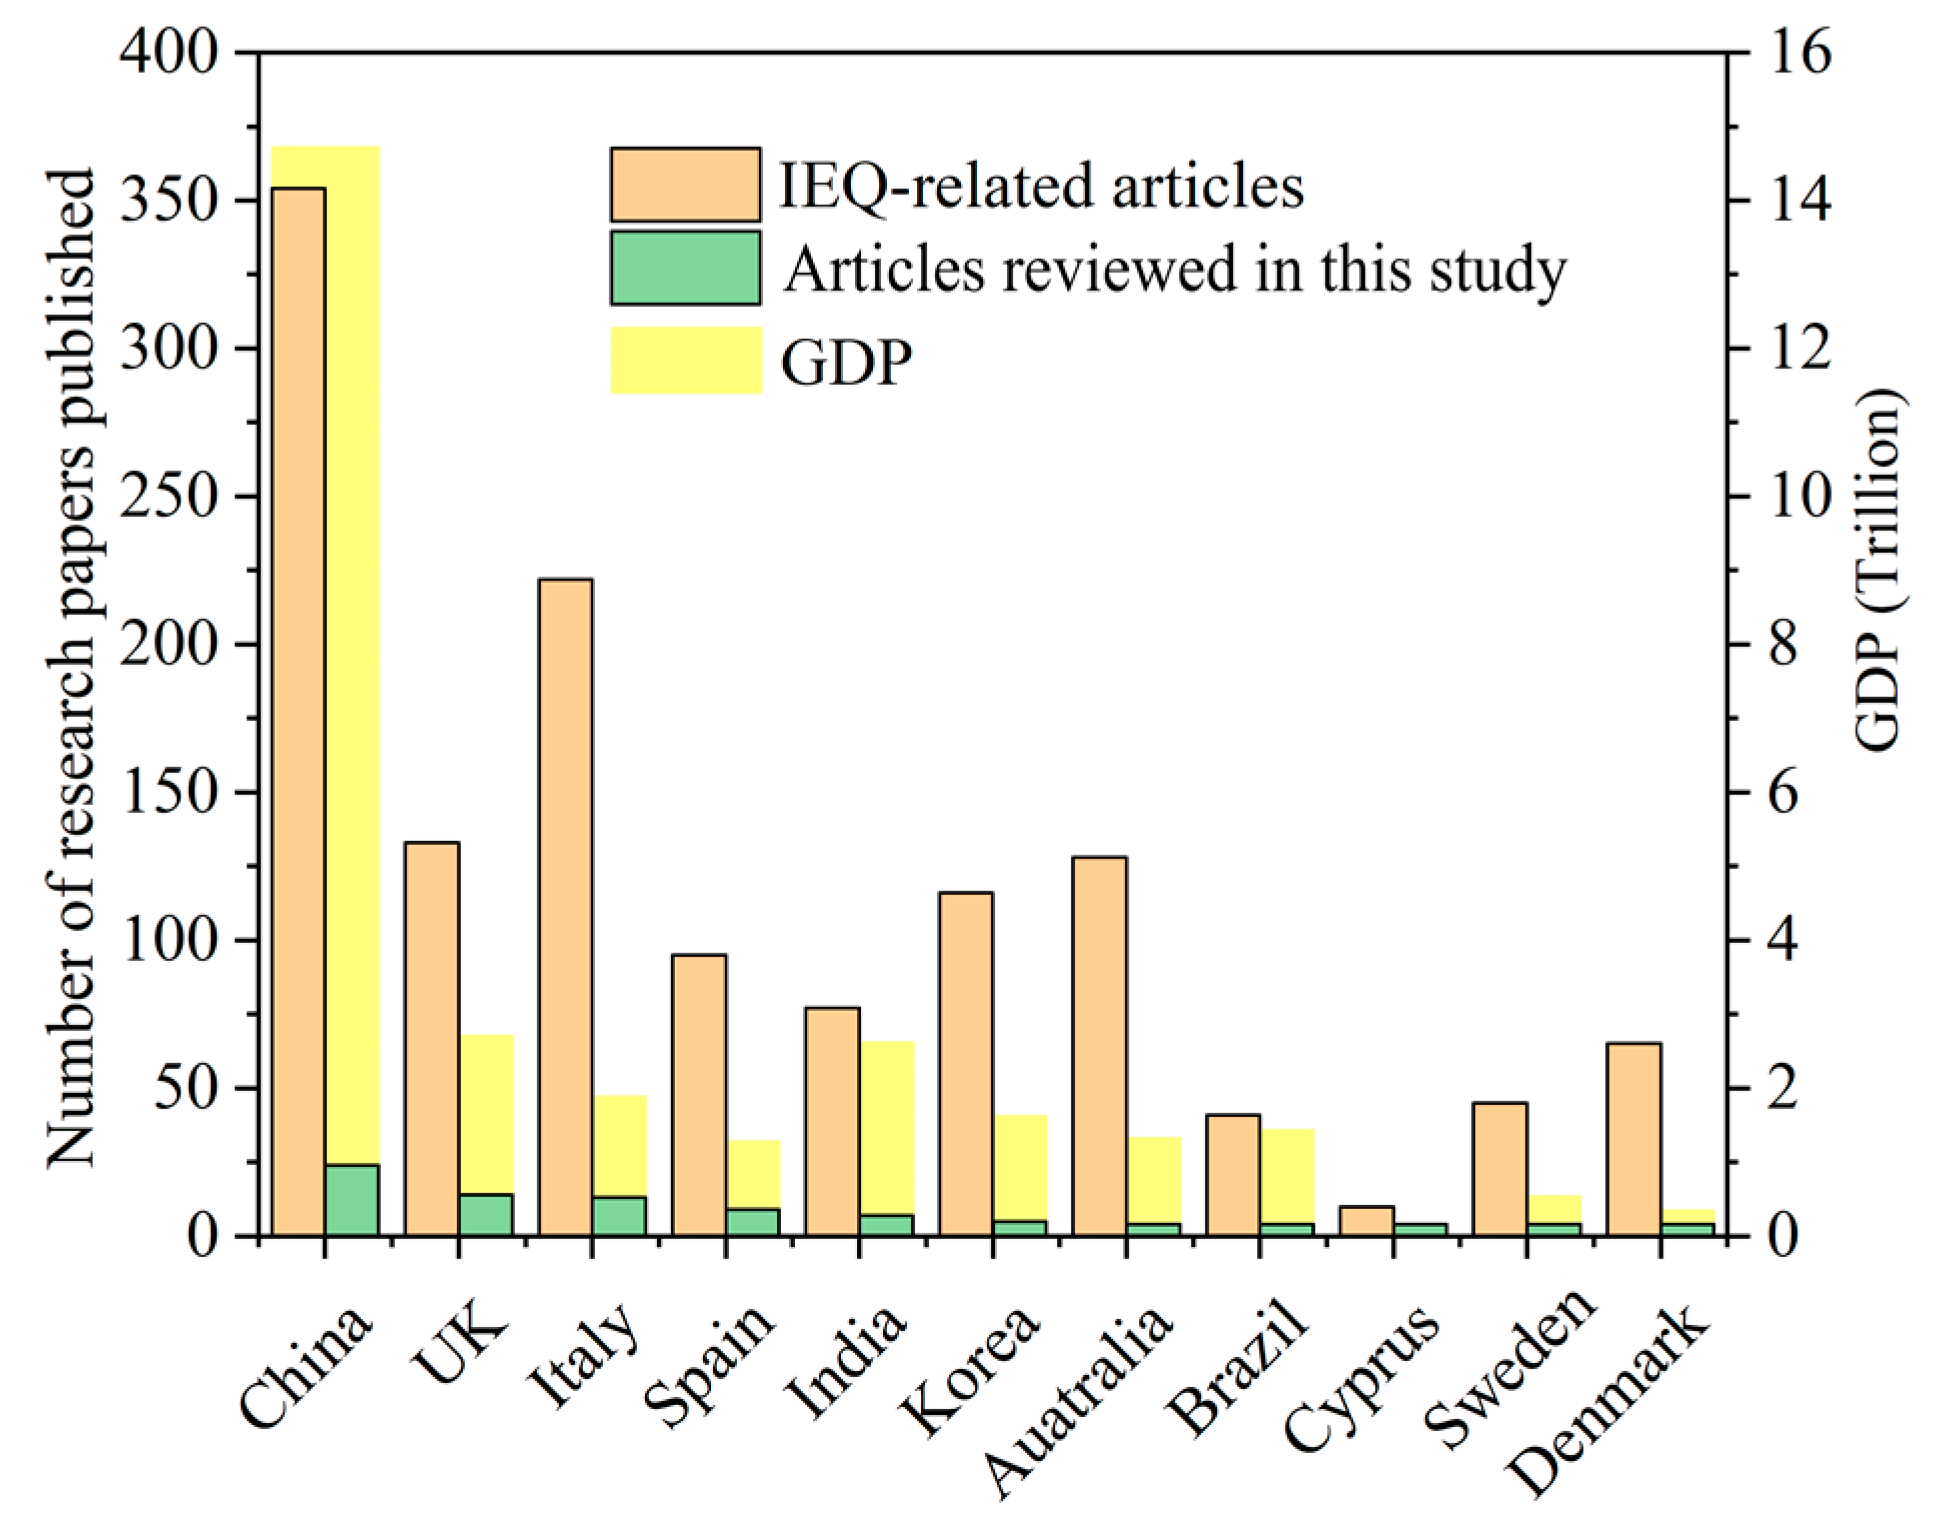
2.2. Country and Region of Publication
2.3. Journal of Publication
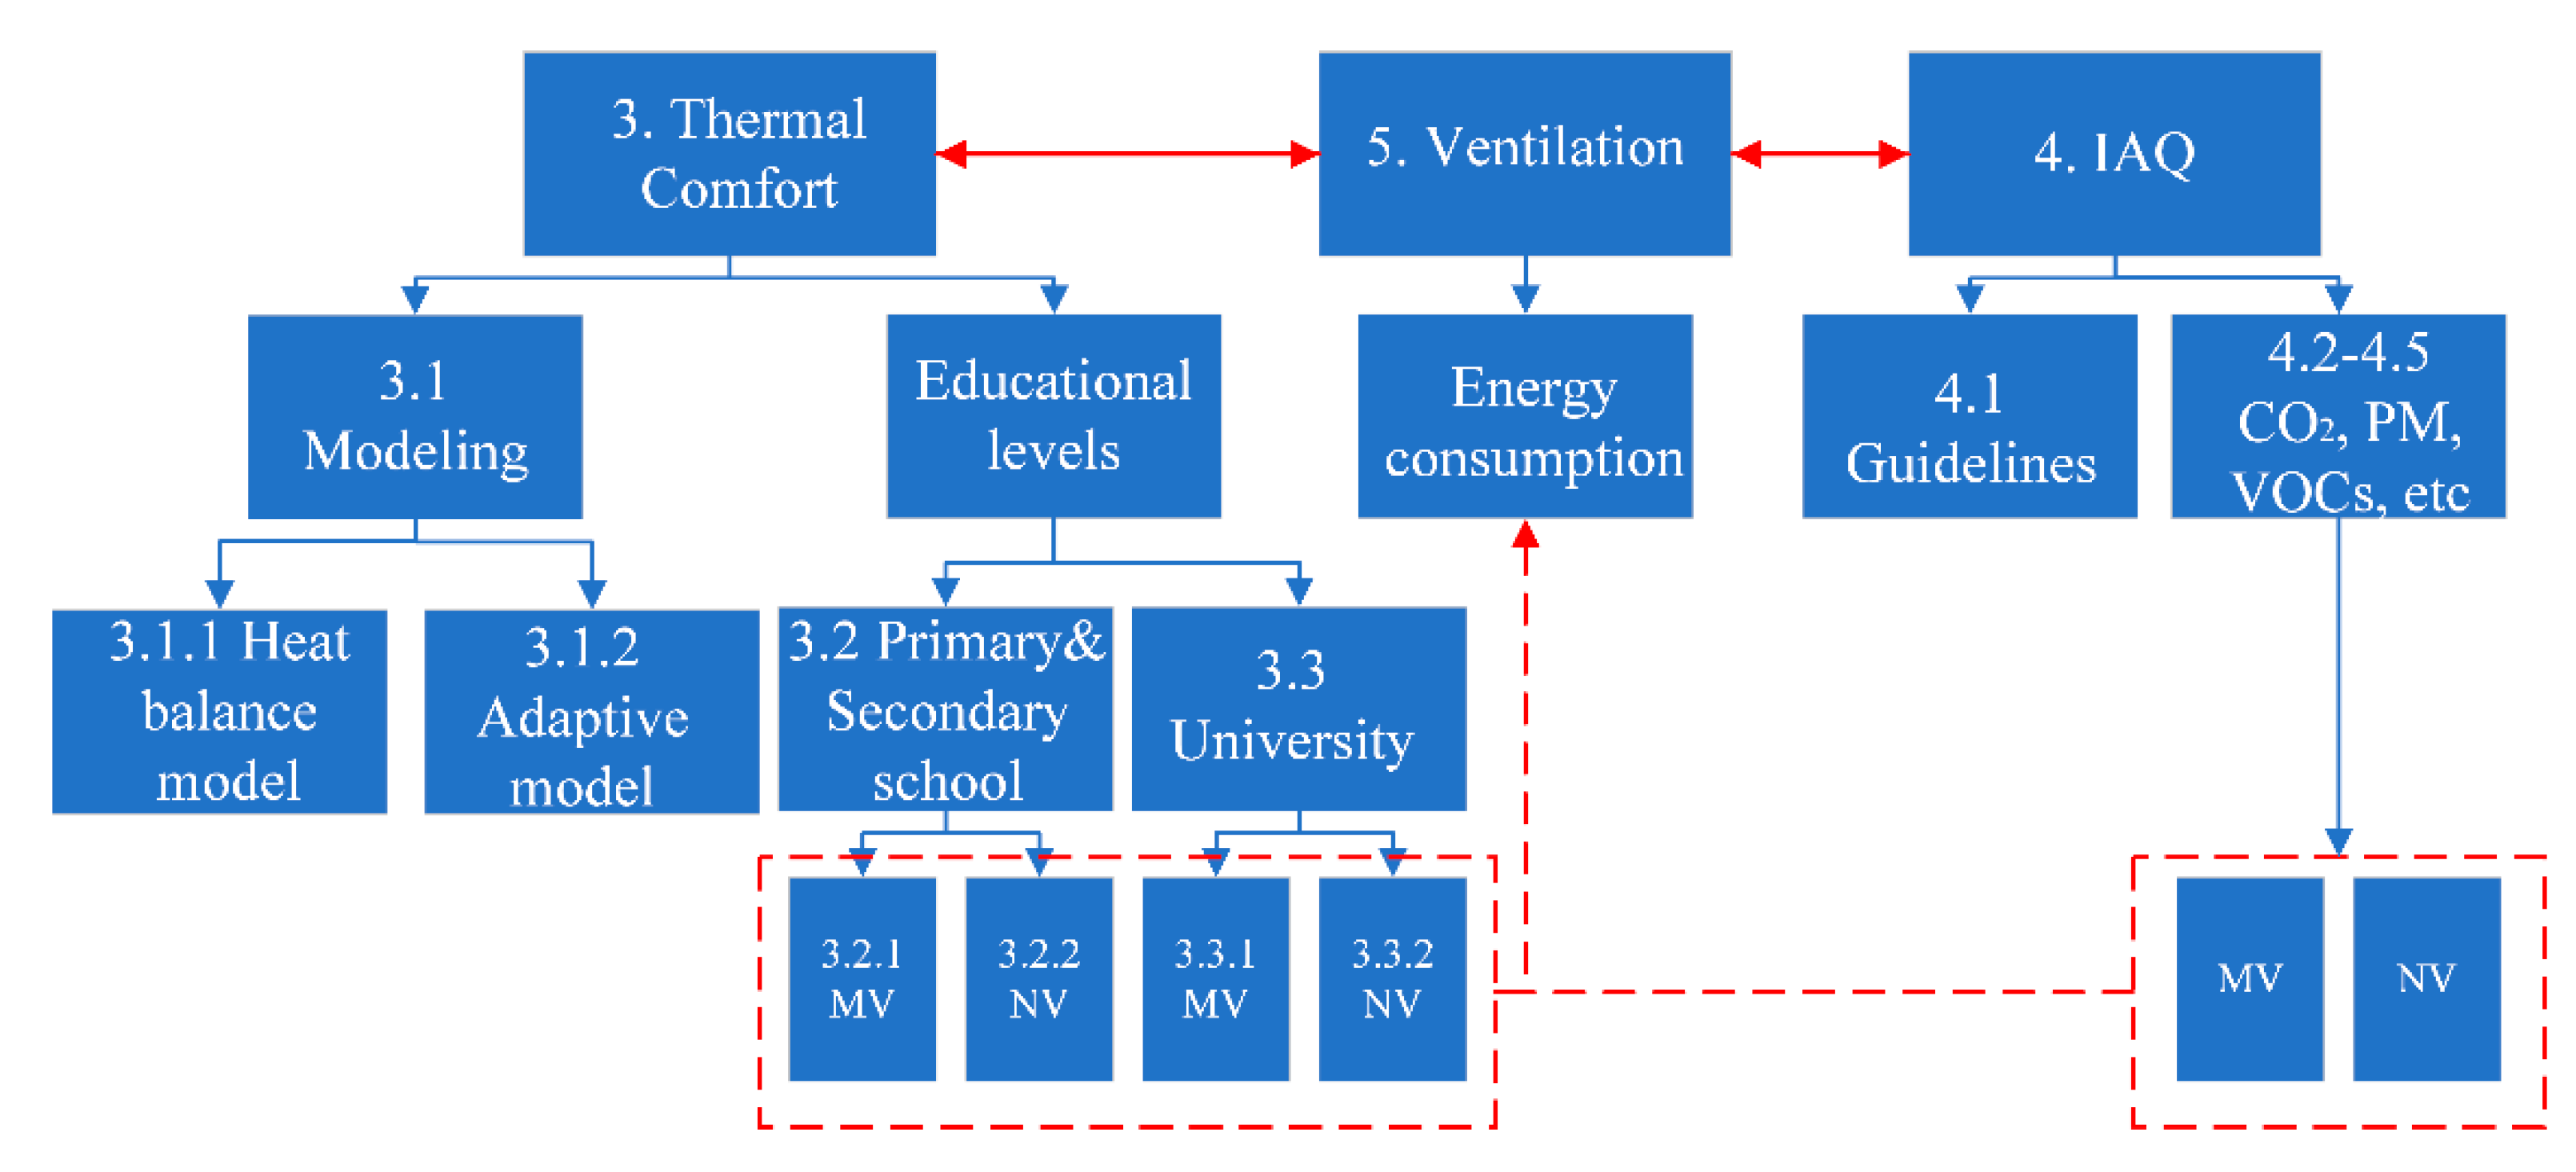
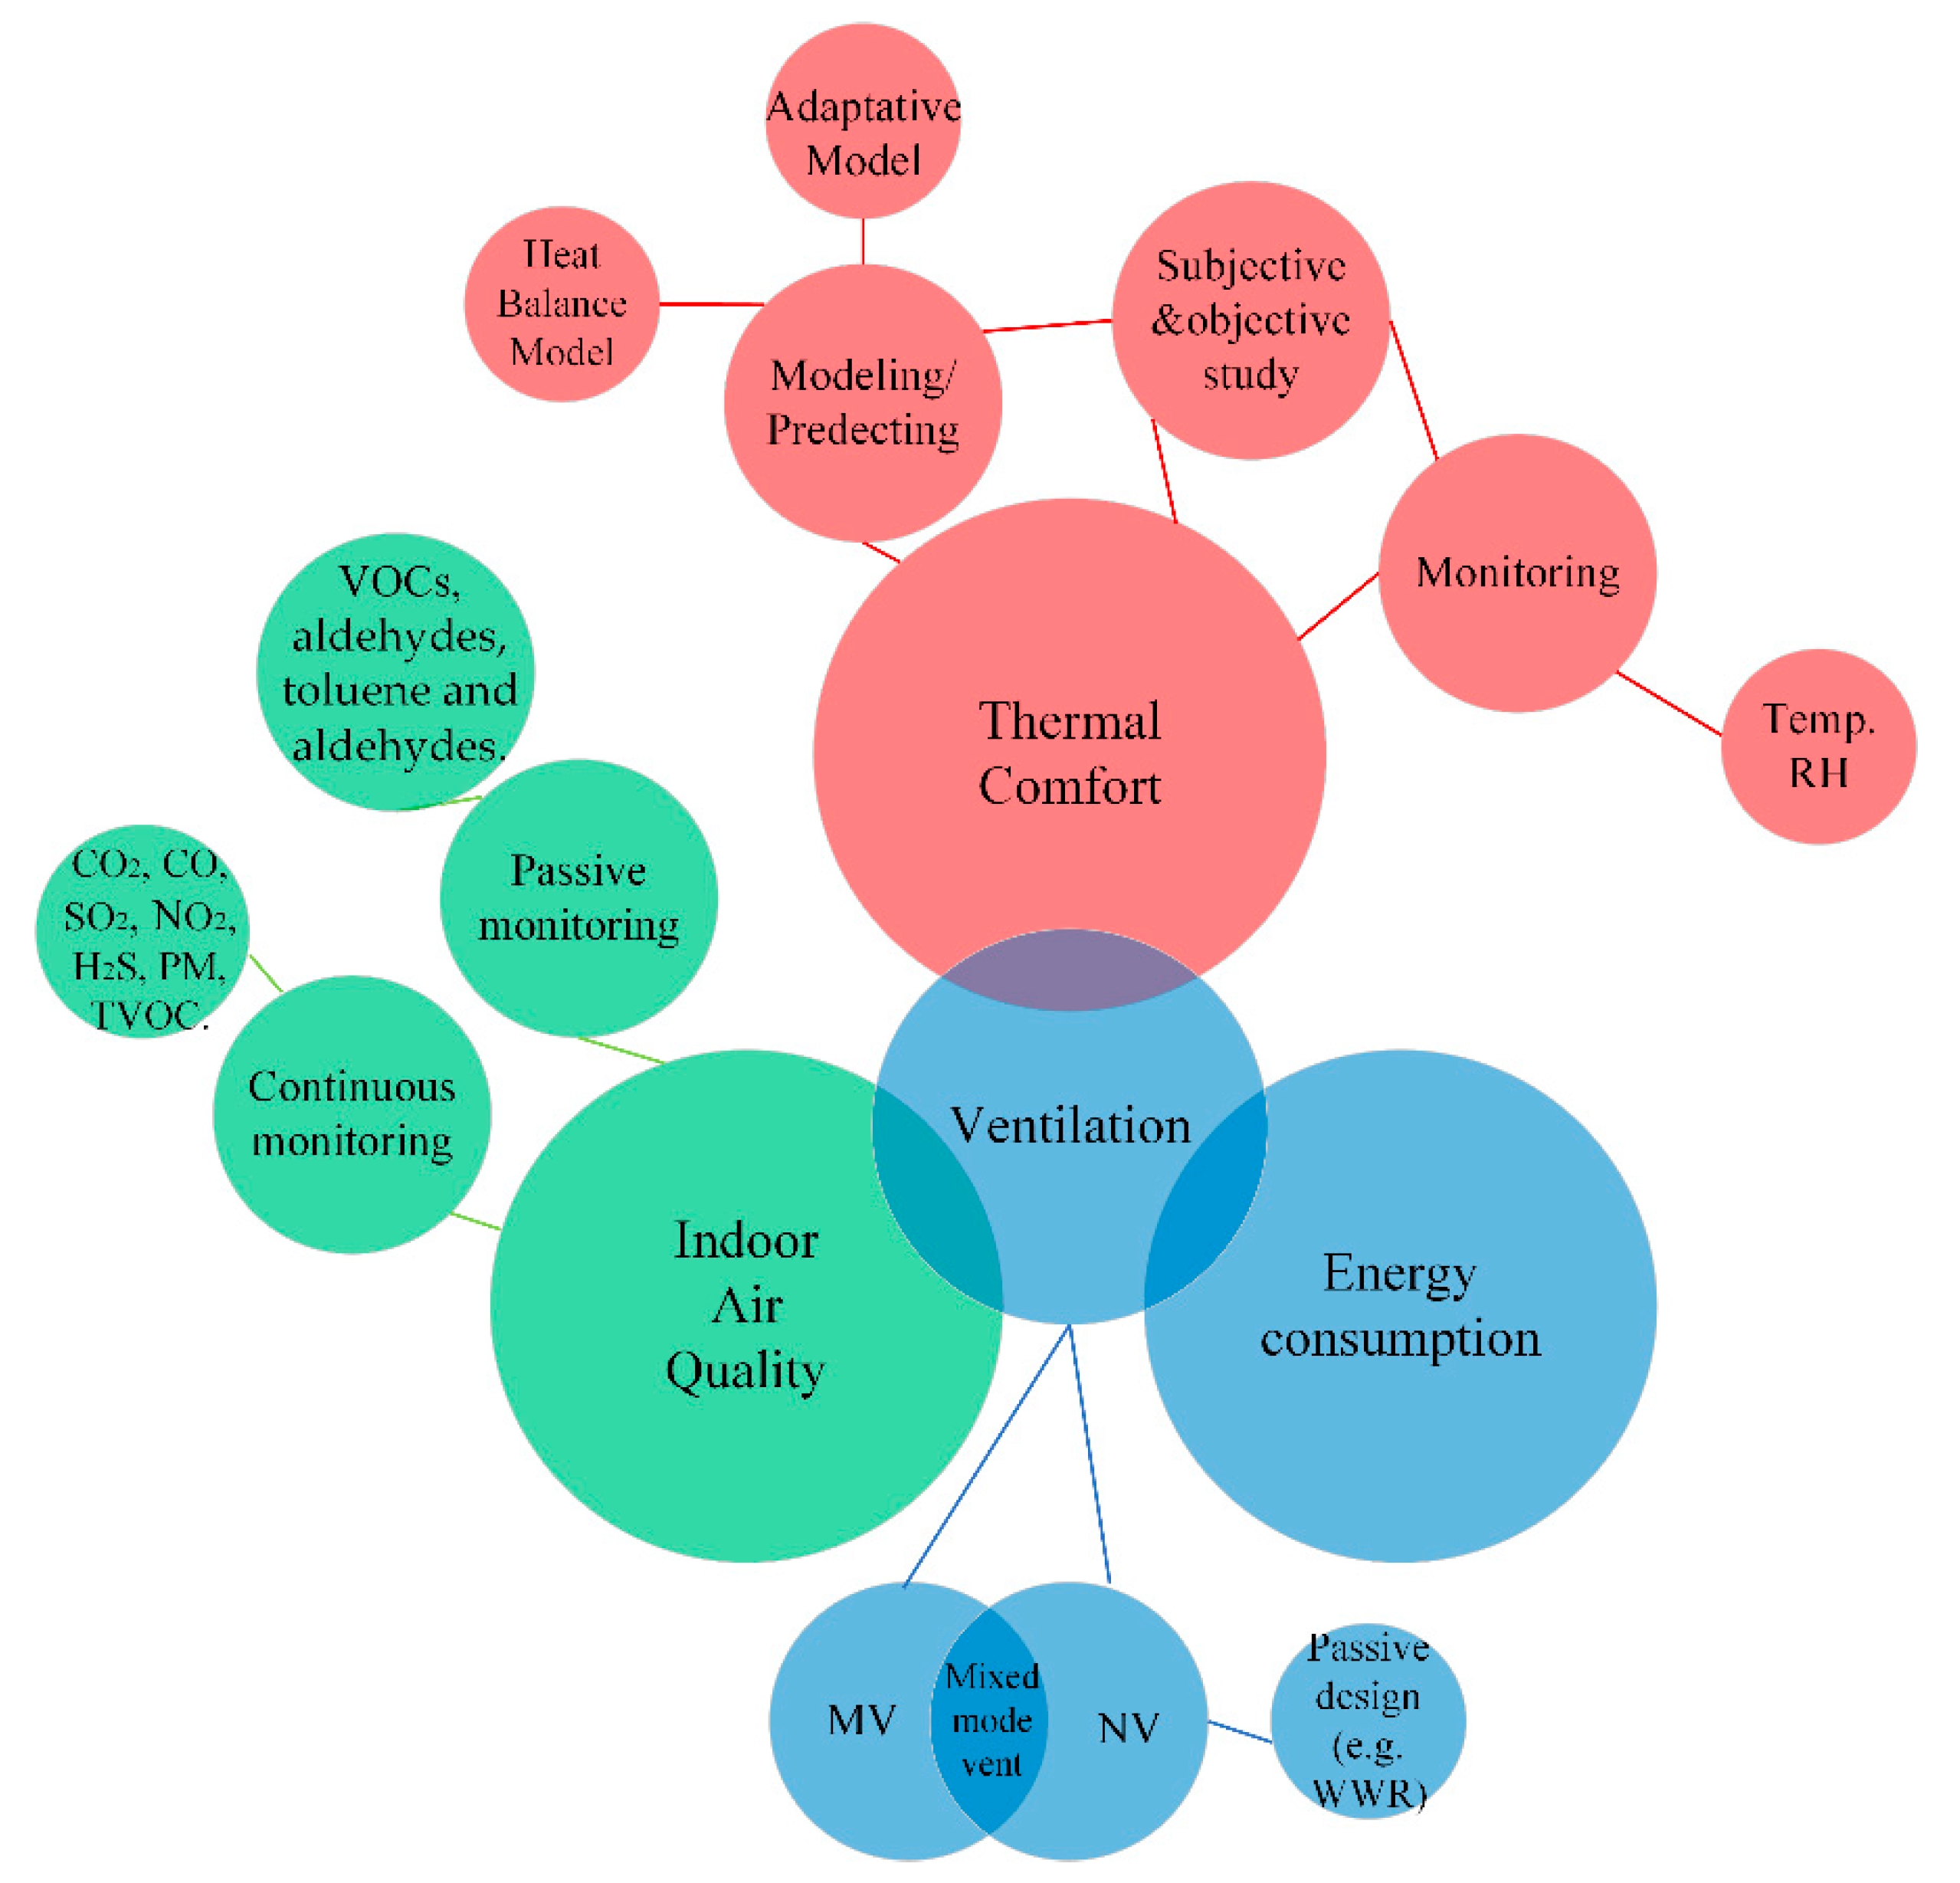
3. The Studies on Thermal Comfort
3.1. Thermal Comfort Assessment Model
3.1.1. Heat Balance Model
3.1.2. Adaptive Model
3.2. Thermal Comfort in Primary School and Secondary School
3.2.1. Natural Ventilation (NV)
3.2.2. Mechanical Ventilation

| Reference | Country | School Types | Time of Survey | Operation Types | NO. of Students | NO. of Schools | Age |
|---|---|---|---|---|---|---|---|
| Mors et al. [19] | Netherlands | P | 24 days, including winter, spring, summer, 2010 | NV | 79 | 1 | 9–11 |
| Aparicio et al. [50] | Spain | P | summer | NV + MV | 67 | 1 | 10–11 |
| Kim et al. [62] | Australia | P + S | Two summer seasons (2012–2013) | MV | - | 11 | 10–15; 16–18 |
| Hamzah et al. [63] | Australia | S | - | NV | 1594 | 8 | - |
| Montazami, et al. [65] | UK | P | Cooling season (2014–2015) | MV | 662 | 8 | 8–11 |
| Vassella, et al. [40] | Swiss | S | winters | NV | - | 96 | - |
| Teli, D., et al. [66] | UK | P | outside the heating season. June and July 2012 | NV | 560 | 2 | 7–11 |
| Teli, D., et al. [67] | UK | P | April to July 2011 | NV | 230 | 1 | 7–11 |
| Korsavi et al. [71] | UK | P | during Non-Heating (NH) and Heating (H) seasons | NV | 805 | - | 9–11 |
| Corgnati et al. [69] | Italy | S + U | Heating period from 15 October to 15 April in 2002 | NV + MV | - | 4 | - |
| Giuli et al. [70] | Italy | P | Spring, 2010 | NV | 614 | - | 9–11 |
| Trebilcock et al. [72,73] | Chile | P | winter (July–August) and spring (November–December) | NV | 440 | 12 | 9–10 |
| Wargocki et al. [76] | Denmark | P | summer (in 2004 and 2005 | MV | - | - | 6–16 |
| Ukawa et al. [77] | Japan | P | - | - | 4254 | 12 | 6–12 |
| Al-Rashidi, et al. [78] | Kuwait | P | 16–27 May 2010 | NV + MV | - | - | 6–10 |
| Mumovic et al. [79] | UK | S | 2006–2007 | NV + MV | - | - | - |
| Conceição et al. [80] | Portugal | - | January 2004 | MV | - | 800 | - |
| Liang et al. [83] | China | P + S | 1 September 2005 to 5 February 2006 | NV | - | - | - |
| Pereira et al. [84] | Portugal | S | From the end of April until mid May 2013 | NV | - | - | - |
| Wang et al. [82] | China | S | November 2014 to December 2015 | MV | 1126 | 13 | - |
| Katafygiotou et al. [85] | Cyprus | S | September to June in next year | MV | 20 | 1 | - |
3.3. Thermal Comfort in Universities
3.3.1. Natural Ventilation (NV)
| Reference | Country | School Types | Time of Survey | Operation Types | NO. of Students | Classroom Types | Age |
|---|---|---|---|---|---|---|---|
| Jowkar et al. [86] | UK | U | October and November 2017; January to March 2018 | NV + MV | 3000 | Lecture rooms; Studios; PC labs | - |
| Krüger et al. [93] | Brazil | U | August 2000; January 2001 | NV | - | - | |
| Hwang et al. [97] | China | U | 2003–2004 | NV + MV | 944 | - | - |
| A. Mishra [87] | India | U | January to April in 2013 | NV | 121 | Laboratories | 19–21 |
| Yao et al. [88] | China | U | March 2005 to May 2006 | NV | 3621 | Lecture buildings | 16–40 |
| Kumar et al. [89] | India | U | Peak summer months | NV | 900 | - | - |
| Mishra et al. [90] | India | U | Autumn 2013; Spring 2014 | NV | 67 | - | - |
| Nico et al. [91] | Italy | U | - | NV + MV | 126 | - | - |
| Corgnati et al. [94] | Italy | U | Heating period, January to April in 2002 | NV | 230 | - | - |
| Costa et al. [96] | Brazil | U | Februauy, March, April in 2017 | NV + MV | 178 | - | 18–67 |
| Jing et al. [98] | China | U | December 2018 | MV | 40 | - | - |
| Mishra et al. [99] | Netherlands | U | Heating season, March 2016 | MV | 384 | - | - |
| Fanga et al. [100] | Hong Kong, China | U | August to October in 2015 | MV | 982 | - | - |
| Wang et al. [101] | China | U | October 2013 to April 2014 | MV | 30 | Classrooms and dormitories | - |
| Fong et al. [102] | Hong Kong, China | U | Summer | MV | 48 | - | 20–23 |
| Serghides et al. [103] | Cyprus | U | winter and summer of 2012 and 2013 | MV | 60 | - | - |
3.3.2. Mechanical Ventilation (MV)
3.4. Research Gapes and Recommendations
4. The Studies on Indoor Air Quality (IAQ)
4.1. IAQ Assessment Model
| Evaluated Parameter | Analytical Model | Limitation |
|---|---|---|
| CO2 | G = the generation rate, m3/s; Cout = outdoor CO2 concentrations, ppm; C0=initial indoor CO2 concentrations, ppm; Q = ventilation rates, m3/s; V = the volume of indoor air, m3; t = time, s. | Require to continue to monitor the data as input for the evaluation models, such as real-time occupancy. |
| PM | Cout = outdoor particles concentrations, μg/m3; Qs = mechanical ventilation flow rate, m3/h; QN = natural ventilation rate, m3/h; QL = leakage flow rate, m3/h; P = the penetration rate of leakage flow path; ηs = single-pass removal efficiency filtered by mechanically operated supply; QF = the flow rate of a particle-control filter, m3/h; ηF = single-pass removal efficiency of a practical-control filter; E = emission source rate, μg/h; ξ = a deposition rate of particles onto room surface, h−1; V = space volume, m3; Cin = indoor particles concentrations. | P and E which varies with PM sizes. |
| VOCs | V = the volume of the zone, m3; Cin = the VOCs concentration in the zone, μg/m3; t = time, s; Q = ventilation rate of the zone, m3/s; Ca = the compound concentration at the supply inlet, μg/m3; Esoi = the emission rate per unit area of the source material i, g/m2⋅s; Asoi = surface area of the source material i, m2; Ssij = absorption rate of sink material j, g/m2⋅s; Asij = surface area of the sink material j, m2; Cout = compounds concentration at outlet, g/m3. | |
| NO2 | EX = air exchange rate, h−1; KNO2 = the constant removal rate of the surface, h−1; | No indoor NO2 sources |
| O3 | EX = air exchange rate, h−1; Kd = the deposition velocity of ozone, m/h; A = total surface area, m2; V = the volume of the room, m3. |
4.2. Carbon Dioxide (CO2)
4.3. Particulate Matter (PM)
4.4. VOCs and TVOC Concentrations
4.5. Other Pollutants: NO2, SO2, and O3
4.6. Research Gaps and Recommendations
| Reference | School Types | Continuous IAQ Monitoring | Passive IAQ Monitoring | |||||||||
|---|---|---|---|---|---|---|---|---|---|---|---|---|
| CO2 | SO2 | NO2 | H2S | TVOC | PM | CO | O3 | TSP | VOC | Aldehydes | ||
| Hemoud et al. [126] | P + S | √ | √ | √ | √ | √ | √ | √ | ||||
| Becerra et al. [35] | N + P + S | √ | √ | √ | √ | |||||||
| Bennett et al. [36] | P | √ | √ | √ | ||||||||
| Branco et al. [37] | N + P | √ | √ | √ | √ | √ | ||||||
| Cai et al. [110] | N + P+S | √ | √ | |||||||||
| Chithra et al. [3] | - | √ | √ | |||||||||
| Fromme et al. [34] | P + S | √ | √ | |||||||||
| Godoi et al. [7] | P | √ | √ | √ | ||||||||
| Haddad et al. [127] | S | √ | √ | √ | ||||||||
| Hou et al. [119] | P | √ | √ | |||||||||
| Jovanović et al. [128] | P | √ | √ | √ | √ | |||||||
| Kalimeri et al. [6] | N + P | √ | √ | √ | √ | |||||||
| Leppanen et al. [118] | √ | |||||||||||
| Madureira et al. [114] | P | √ | √ | √ | √ | |||||||
| Mainka et al. [108] | N | √ | √ | √ | ||||||||
| Majd et al. [125] | P | √ | √ | √ | ||||||||
| Mohamed et al. [129] | P | √ | √ | |||||||||
| Poupard et al. [115] | - | √ | √ | √ | ||||||||
| Rivas et al. [31] | - | √ | √ | |||||||||
| Sohn et al. [130] | - | √ | √ | √ | √ | |||||||
| Stabile et al. [106] | - | √ | √ | |||||||||
| Theodosiou et al. [131] | N + P | √ | ||||||||||
| Yang et al. [24] | P | √ | √ | √ | √ | √ | ||||||
| Alves et al. [132] | U | √ | √ | √ | ||||||||
| Fan et al. [133] | U | √ | ||||||||||
5. Ventilation Energy Consumption
5.1. Mechanical Ventilation (MV)
5.2. Natural Ventilation (NV)
5.3. Research Gaps and Recommendations
6. Conclusions and Limitations
- (1)
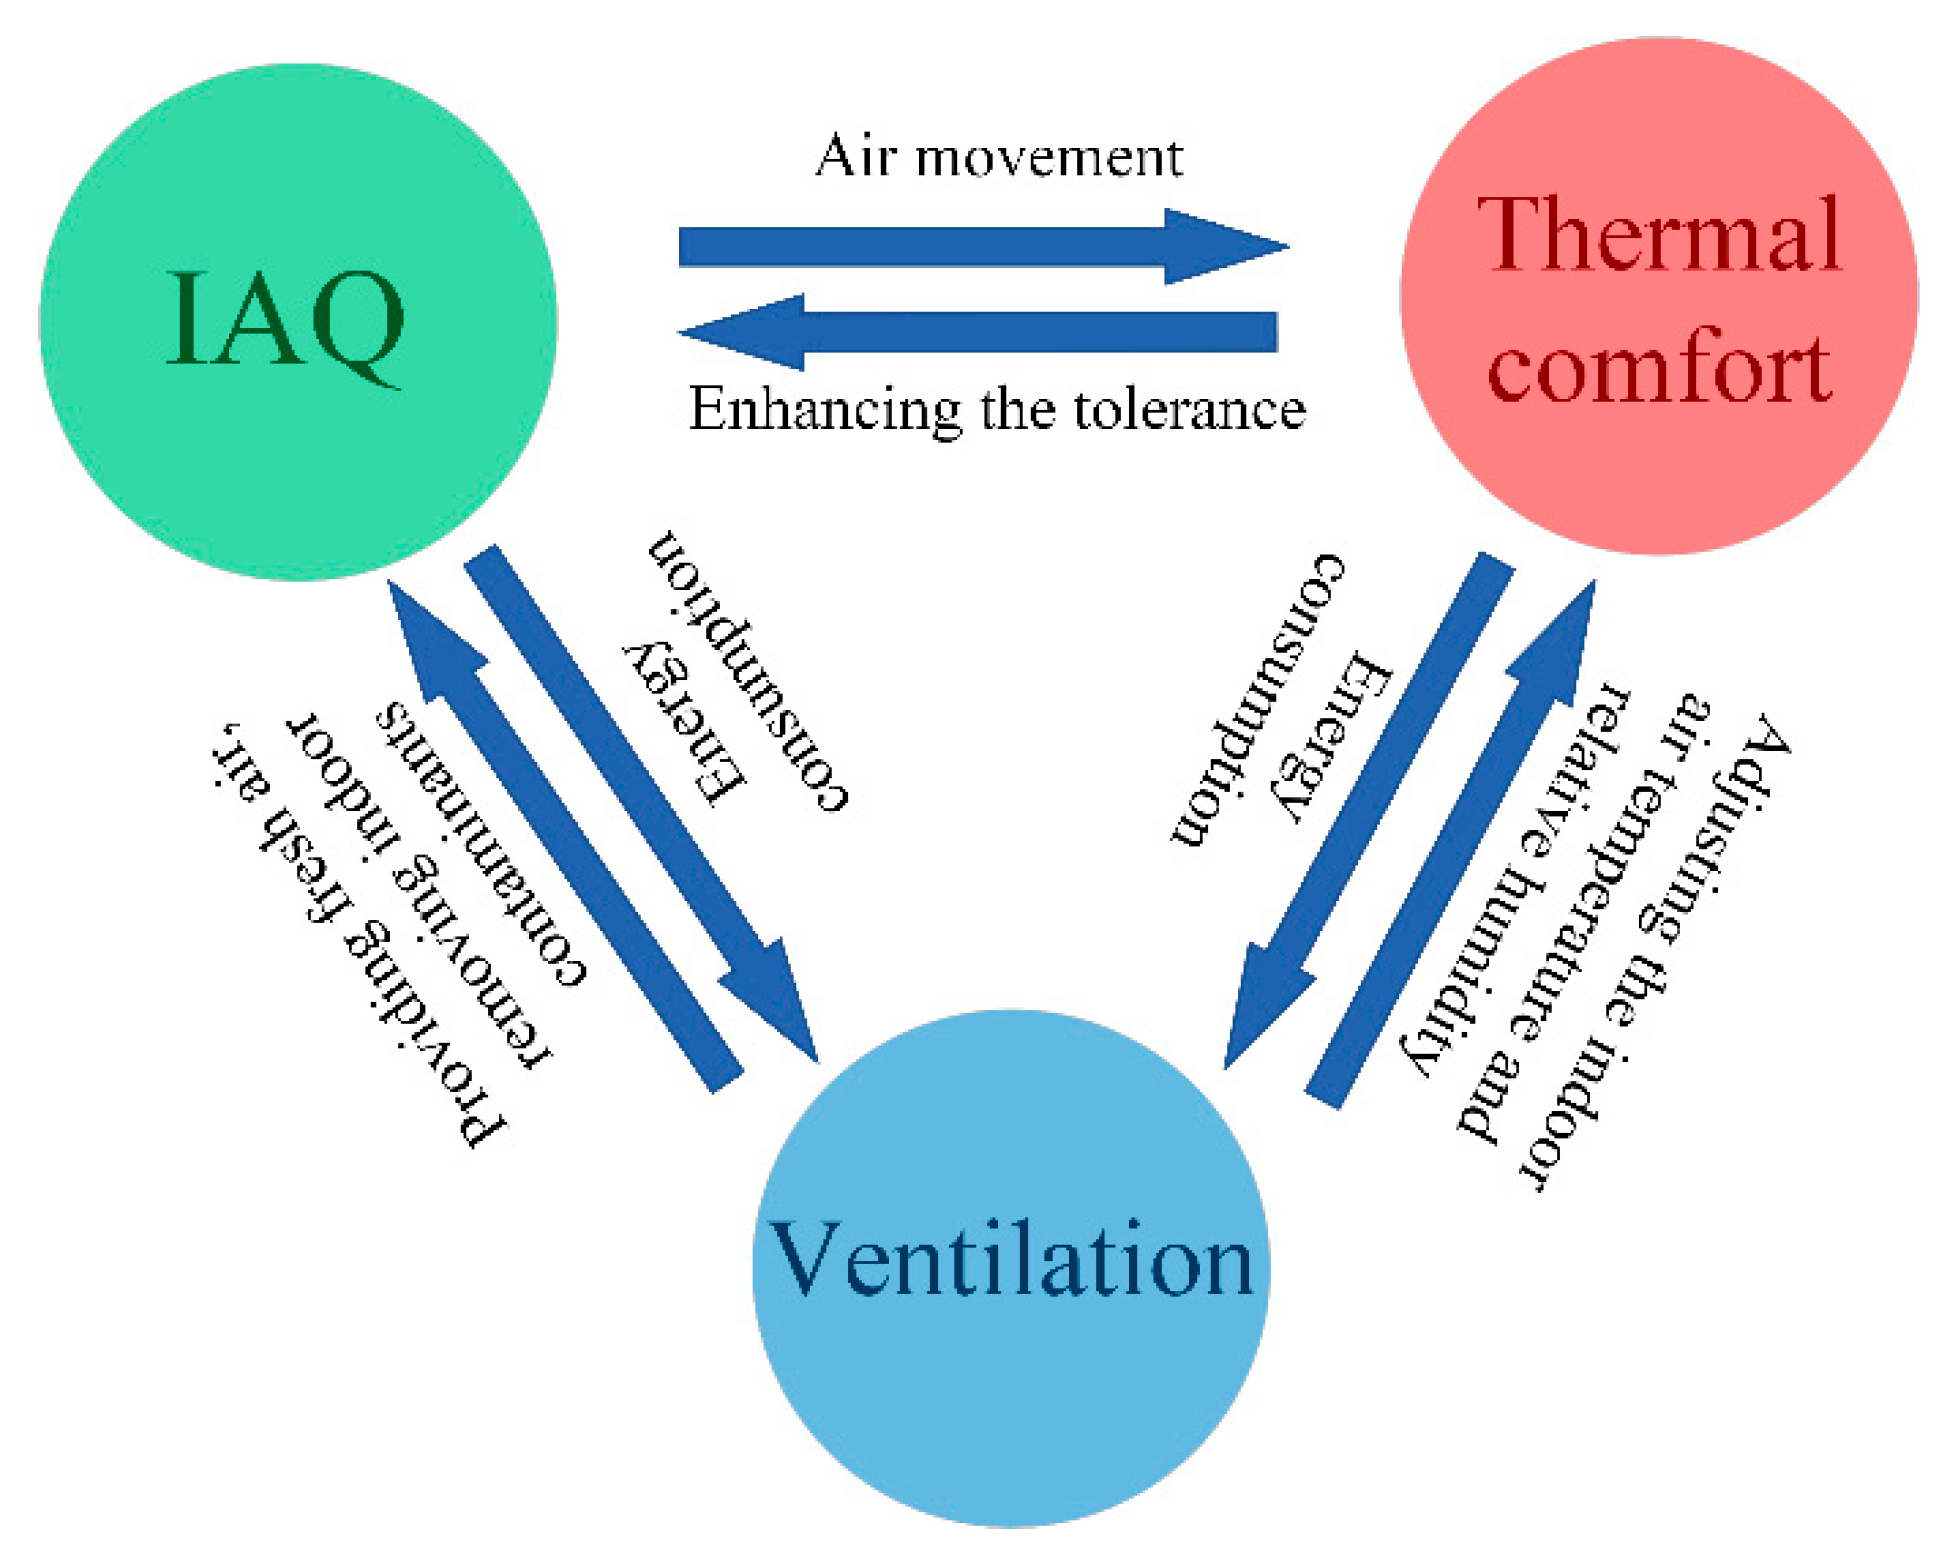
- Occupants’ thermal comfort conditions can affect the perception of IAQ to some extent by modulating the tolerance levels. Appropriate ventilation can adjust the thermal comfort and IAQ to an acceptable level with lower energy consumption. Most studies focus solely on thermal comfort, IAQ, or energy consumption, while few publications address multiple aspects simultaneously. The significant interaction between these three aspects should be covered in future research;
- (2)
- Using natural ventilation alone usually cannot guarantee thermal comfort and IAQ in extreme winter and summer conditions, while continuous mechanical ventilation will cause huge energy consumption. Therefore, mixed-mode ventilation and its corresponding control strategies should be further explored. Given these situations, internet of things (IoT) based or artificial intelligence (AI) based control, as an effective method, can provide optimized solutions for mixed ventilation strategies to balance NV and MV;
- (3)
- Most research related to IAQ is limited to primary and secondary schools, and university buildings need to be paid more attention. It should be noticed that the distribution of indoor pollutants is varied in different rooms of the school, but there are no corresponding guidelines focused on this issue. There is also a lack of research on bacterial and fungal aerosol pollutants for a comprehensive assessment of IAQ in educational buildings;
- (4)
- Some preliminary studies indicated that there might be a relationship between socioeconomic vulnerability and school children’s thermal sensation. However, the interactions between thermal comfort and students’ socioeconomic backgrounds at different types of classrooms in varied climates are still unclear, limiting the improvement of indoor environmental quality. The current thermal comfort evaluation models fail to consider this influential factor;
- (5)
- Considering the energy consumption, the passive designing of natural and mechanical ventilated classrooms benefits maintaining comfortable indoor environments. Optimizing WWRs for natural ventilation can help satisfy requirements in thermal comfort and IAQ while reducing energy consumption. Appropriate window orientation and sun shading can also limit the gains or losses of solar radiation, reduce the frequency of application of mechanical ventilation, and thus lower energy costs. However, there are not sufficient studies focused on the optimization among the WWR, window orientation and sun shading. Thus, more studies should be conducted to evaluate its impact on school buildings;
Author Contributions
Funding
Institutional Review Board Statement
Informed Consent Statement
Conflicts of Interest
Nomenclature
| AHU | Air handling units |
| AI | Artificial intelligence |
| HVAC | Heating, ventilation and air conditioning |
| IAQ | Indoor air quality |
| IEQ | Indoor environmental quality |
| IoT | Internet of Things |
| MV | Mechanical ventilation |
| NV | Natural ventilation |
| WWR | Window-to-wall ratio |
| WHO | World health organization |
| N, P, S, and U | Nursery, Primary school, Secondary school, and University |
References
- Heinzerling, D.; Schiavon, S.; Webster, T.; Arens, E. Indoor environmental quality assessment models: A literature review and a proposed weighting and classification scheme. Build. Environ. 2013, 70, 210–222. [Google Scholar] [CrossRef] [Green Version]
- Landrigan, P.J.; Fuller, R.; Acosta, N.J.R.; Adeyi, O. The Lancet Commission on pollution and health. Lancet 2018, 391, 462–512. [Google Scholar] [CrossRef] [Green Version]
- Chithra, V.S.; Nagendra, S.M.S. Indoor air quality investigations in a naturally ventilated school building located close to an urban roadway in Chennai, India. Build. Environ. 2012, 54, 159–167. [Google Scholar] [CrossRef]
- Korsavi, S.S.; Montazami, A.; Mumovic, D. The impact of indoor environment quality (IEQ) on school children’s overall comfort in the UK; a regression approach. Build. Environ. 2020, 185, 107309. [Google Scholar] [CrossRef]
- Kim, J.; Hong, T.; Jeong, J.; Lee, M.; Lee, M.; Jeong, K.; Koo, C.; Jeong, J. Establishment of an optimal occupant behavior considering the energy consumption and indoor environmental quality by region. Appl. Energy 2017, 204, 1431–1443. [Google Scholar] [CrossRef]
- Kalimeri, K.K.; Saraga, D.E.; Lazaridis, V.D.; Legkas, N.A.; Missia, D.A.; Tolis, E.I.; Bartzis, J.G. Indoor air quality investigation of the school environment and estimated health risks: Two-season measurements in primary schools in Kozani, Greece. Atmos. Pollut. Res. 2016, 7, 1128–1142. [Google Scholar] [CrossRef]
- Godoi, R.H.M.; Godoi, A.F.L.; Junior, S.J.G.; Paralovo, S.L.; Borillo, G.C.; Barbosa, C.G.G.; Arantes, M.G.; Charello, R.C.; Filho, N.A.R.; Grassi, M.T.; et al. Healthy environment--indoor air quality of Brazilian elementary schools nearby petrochemical industry. Sci. Total Environ. 2013, 463–464, 639–646. [Google Scholar] [CrossRef] [PubMed]
- Fransson, N.; Västfjäll, D.; Skoog, J. In search of the comfortable indoor environment: A comparison of the utility of objective and subjective indicators of indoor comfort. Build. Environ. 2007, 42, 1886–1890. [Google Scholar] [CrossRef]
- Almeida, R.M.S.F.; de Freitas, V.P. Indoor environmental quality of classrooms in Southern European climate. Energy Build. 2014, 81, 127–140. [Google Scholar] [CrossRef]
- Pellerey, F.; Astolfi, A. Subjective and objective assessment of acoustical and overall environmental quality in secondary school classrooms. J. Acoust. Soc. Am. 2008, 123, 163–173. [Google Scholar]
- Frontczak, M.; Schiavon, S.; Goins, J.; Arens, E.; Zhang, H.; Wargocki, P. Quantitative relationships between occupant satisfaction and satisfaction aspects of indoor environmental quality and building design. Indoor Air 2012, 22, 119–131. [Google Scholar] [CrossRef] [Green Version]
- Sundell, J. On the history of indoor air quality and health. Indoor Air 2004, 14, 1–8. [Google Scholar] [CrossRef]
- Zivelonghi, A.; Lai, M. Mitigating aerosol infection risk in school buildings: The role of natural ventilation, volume, occupancy and CO2 monitoring. Build. Environ. 2021, 204, 108139. [Google Scholar] [CrossRef]
- Nicol, F.; Humphreys, M.; Roaf, S. Adaptive Thermal Comfort: Principles and Practice; Heriot-Watt University: Edinburgh, UK, 2012. [Google Scholar]
- Nicol, F.; Humphreys, M. Derivation of the adaptive equations for thermal comfort in free-running buildings in European standard EN15251. Build. Environ. 2010, 45, 11–17. [Google Scholar] [CrossRef]
- Mendell, M.J.; Heath, G.A. Do indoor pollutants and thermal conditions in schools influence student performance? A critical review of the literature. Indoor Air 2005, 15, 27–52. [Google Scholar] [CrossRef]
- Ricciardi, P.; Buratti, C. Environmental quality of university classrooms: Subjective and objective evaluation of the thermal, acoustic, and lighting comfort conditions. Build. Environ. 2018, 127, 23–36. [Google Scholar] [CrossRef]
- Barbhuiya, S.; Barbhuiya, S. Thermal comfort and energy consumption in a UK educational building. Build. Environ. 2013, 68, 1–11. [Google Scholar] [CrossRef]
- Mors, S.T.; Hensen, J.L.M.; Loomans, M.G.L.C.; Boerstra, A.C. Adaptive thermal comfort in primary school classrooms: Creating and validating PMV-based comfort charts. Build. Environ. 2011, 46, 2454–2461. [Google Scholar] [CrossRef] [Green Version]
- Kükrer, E.; Eskin, N. Effect of design and operational strategies on thermal comfort and productivity in a multipurpose school building. J. Build. Eng. 2021, 44, 1–14. [Google Scholar] [CrossRef]
- Fanger, P.O. Thermal Comfort Analysis and Application in Environmential Engineering; Danish Technical Press: Copenhagen, Danmark, 1970. [Google Scholar]
- Deng, J.; Wei, Q.; Liang, M.; He, S.; Zhang, H. Field test on energy performance of medium-depth geothermal heat pump systems (MD-GHPs). Energy Build. 2019, 184, 289–299. [Google Scholar] [CrossRef]
- Lee, S.C.; Chang, M. Indoor and outdoor air quality investigation at schools in Hong Kong. Chemosphere 2000, 41, 109–113. [Google Scholar] [CrossRef]
- Yang, J.; Nam, I.; Yun, H.; Kim, J.; Oh, H.-J.; Lee, D.; Jeon, S.-M.; Yoo, S.-H.; Sohn, J.-R. Characteristics of indoor air quality at urban elementary schools in Seoul, Korea: Assessment of effect of surrounding environments. Atmos. Pollut. Res. 2015, 6, 1113–1122. [Google Scholar] [CrossRef]
- Norbäck, D.; Torgén, M.; Edling, C. Volatile organic compounds, respirable dust, and personal factors related to prevalence and incidence of sick building syndrome in primary schools. Occup. Environ. Med. 1990, 47, 733–741. [Google Scholar] [CrossRef] [Green Version]
- Shendell, D.G.; Prill, R.; Fisk, W.J.; Apte, M.G.; Blake, D.; Faulkner, D. Associations between classroom CO2 concentrations and student attendance in Washington and Idaho. Indoor Air 2004, 14, 333–341. [Google Scholar] [CrossRef] [PubMed]
- Sørensen, M.; Autrup, H.; Møller, P.; Hertel, O.; Jensen, S.S.; Vinzents, P.; Knudsen, L.E.; Loft, S. Linking exposure to environmental pollutants with biological effects. Mutat. Res./Rev. Mutat. Res. 2003, 544, 255–271. [Google Scholar] [CrossRef] [PubMed]
- Oh, H.-J.; Nam, I.-S.; Yun, H.; Kim, J.; Yang, J.; Sohn, J.-R. Characterization of indoor air quality and efficiency of air purifier in childcare centers, Korea. Build. Environ. 2014, 82, 203–214. [Google Scholar] [CrossRef]
- Zhong, K.; Yang, F.; Kang, Y. Indoor and outdoor relationships of co concentrations in natural ventilating rooms in summer, Shanghai. Build. Environ. 2013, 62, 69–76. [Google Scholar] [CrossRef]
- Schembari, A.; Triguero-Mas, M.; Nazelle, A.; Dadvand, P.; Vrijheid, M.; Martinez, M.C.D.; Querol, F.F.X.; Basagaña, X.; Eeftens, M.; Meliefste, K.; et al. Personal, indoor and outdoor air pollution levels among pregnant women. Atmos. Environ. 2013, 64, 287–295. [Google Scholar] [CrossRef]
- Rivas, I.; Viana, M.; Moreno, T.; Pandolfi, M.; Amato, F.; Reche, C.; Bouso, L.; Àlvarez-Pedrerol, M.; Alastuey, A.; Sunyer, J.; et al. Child exposure to indoor and outdoor air pollutants in schools in Barcelona, Spain. Environ. Int. 2014, 69, 200–212. [Google Scholar] [CrossRef] [PubMed] [Green Version]
- Weichenthal, S.; Dufresne, A.; Joseph, C.R.L. Characterizing and predicting ultrafine particle counts in Canadian classrooms during the winter months: Model development and evaluation. Environ. Res. 2008, 106, 349–360. [Google Scholar] [CrossRef]
- Madureira, J.; Paciência, I.; Pereira, C.; Teixeira, J.P.; Fernandes, E.D.O. Indoor air quality in Portuguese schools: Levels and sources of pollutants. Indoor Air 2016, 26, 526–537. [Google Scholar] [CrossRef] [PubMed] [Green Version]
- Fromme, H.; Twardella, D.; Dietrich, S.; Heitmann, D.; Schierl, R.; Liebl, B.; Rüden, H. Particulate matter in the indoor air of classrooms—exploratory results from Munich and surrounding area. Atmos. Environ. 2007, 41, 854–866. [Google Scholar] [CrossRef]
- Becerra, J.A.; Lizana, J.; Gil, M.; Barrios-Padura, A.; Blondeau, P.; Chacartegui, R. Identification of potential indoor air pollutants in schools. J. Clean. Prod. 2020, 242, 118420. [Google Scholar] [CrossRef]
- Bennett, J.; Davy, P.; Trompetter, B.; Wang, Y.; Pierse, N.; Boulic, M.; Phipps, R.; Howden-Chapman, P. Sources of indoor air pollution at a New Zealand urban primary school; a case study. Atmos. Pollut. Res. 2019, 10, 435–444. [Google Scholar] [CrossRef]
- Branco, P.T.B.S.; Alvim-Ferraz, M.C.M.; Martins, F.G.; Sousa, S.I.V. Quantifying indoor air quality determinants in urban and rural nursery and primary schools. Environ. Res. 2019, 176, 108534. [Google Scholar] [CrossRef] [PubMed]
- Li, Y.; Leung, G.M.; Tang, J.W.; Yang, X.; Chao, C.Y.H.; Lin, J.Z.; Lu, J.W.; Nielsen, P.V.; Niu, J.; Qian, H.; et al. Role of ventilation in airborne transmission of infectious agents in the built environment—A multidisciplinary systematic review. Indoor Air 2007, 17, 2–18. [Google Scholar] [CrossRef] [PubMed]
- Ma, N.; Aviv, D.; Guo, H.; Braham, W.W. Measuring the right factors: A review of variables and models for thermal comfort and indoor air quality. Renew. Sustain. Energy Rev. 2021, 135, 110436. [Google Scholar] [CrossRef]
- Vassella, C.C.; Koch, J.; Henzi, A.; Jordan, A.; Waeber, R.; Iannaccone, R.; Charrière, R. From spontaneous to strategic natural window ventilation: Improving indoor air quality in Swiss schools. Int. J. Hyg. Environ. Health 2021, 234, 113746. [Google Scholar] [CrossRef]
- Khan, N.; Su, Y.; Riffat, S.B. A review on wind driven ventilation techniques. Energy Build. 2008, 40, 1586–1604. [Google Scholar] [CrossRef]
- Yuan, F.; Yao, R.; Sadrizadeh, S.; Li, B. Thermal comfort in hospital buildings-A literature review. J. Build. Eng. 2022, 45, 103463. [Google Scholar] [CrossRef]
- Sharma, A.; Kumar, A.; Kulkarni, K.S. Thermal comfort studies for the naturally ventilated built environments in Indian subcontinent: A review. J. Build. Eng. 2021, 44, 103242. [Google Scholar] [CrossRef]
- Yüksel, A.; Arıcı, M.; Krajčík, M. A review on thermal comfort, indoor air quality and energy consumption in temples. J. Build. Eng. 2021, 25, 102013. [Google Scholar] [CrossRef]
- Wang, Y.; Kuckelkorn, J.; Zhao, F.-Y.; Liu, D.; Kirschbaum, A.; Zhang, J.-L. Evaluation on classroom thermal comfort and energy performance of passive school building by optimizing HVAC control systems. Build. Environ. 2015, 89, 86–106. [Google Scholar] [CrossRef]
- Zomorodian, Z.S.; Tahsildoost, M.; Hafezi, M. Thermal comfort in educational buildings: A review article. Renew. Sustain. Energy Rev. 2016, 59, 895–906. [Google Scholar] [CrossRef]
- De Dear, R.J.; Akimoto, T.; Arens, E.A.; Brager, G.; Candido, C.; Cheong, K.W.D.; Li, B.; Nishihara, N.; Sekhar, S.C.; Tanabe, S.; et al. Progress in thermal comfort research over the last twenty years. Indoor Air 2013, 23, 442–461. [Google Scholar] [CrossRef] [PubMed]
- Rupp, R.F.; Vásquezb, N.G.; Lamberts, R. A review of human thermal comfort in the built environment. Energy Build. 2015, 105, 178–205. [Google Scholar] [CrossRef]
- Yau, Y.H.; Chew, B.T. A review on predicted mean vote and adaptive thermal comfort models. J. Build. Serv. Eng. Res. Technol. 2014, 35, 23–35. [Google Scholar] [CrossRef]
- Aparicio-Ruiz, P.; Barbadilla-Martín, E.; Guadix, J.; Muñuzuri, J. A field study on adaptive thermal comfort in Spanish primary classrooms during summer season. Build. Environ. 2021, 203, 1–14. [Google Scholar] [CrossRef]
- Ali, H.H.; Al-Hashlamun, R. Assessment of indoor thermal environment in different prototypical school buildings in Jordan. Alex. Eng. J. 2019, 58, 699–711. [Google Scholar] [CrossRef]
- Singh, M.K.; Kumar, S.; Ooka, R.; Rijal, H.B.; Gupta, G.; Kumar, A. Status of thermal comfort in naturally ventilated classrooms during the summer season in the composite climate of India. Build. Environ. 2018, 128, 287–304. [Google Scholar] [CrossRef]
- Yao, R.; Li, B.; Liu, J. A theoretical adaptive model of thermal comfort adaptive Predicted Mean Vote (aPMV). Build. Environ. 2009, 44, 2089–2096. [Google Scholar] [CrossRef]
- Havenith, G.; Holmer, I.; Parsons, K. Personal factors in thermal comfort assessment; clothing properties and metabolic heat production. Energy Build. 2002, 34, 581–591. [Google Scholar] [CrossRef]
- Rupp, R.F.; Parkinson, T.; Kim, J.; Toftum, J.; Dear, R. The impact of occupant’s thermal sensitivity on adaptive thermal comfort model. Build. Environ. 2021, 108517. [Google Scholar] [CrossRef]
- Brager, G.S.; Dear, R.J.D. Thermal adaptation in the built environment: A literature review. Energy Build. 1998, 27, 83–96. [Google Scholar] [CrossRef] [Green Version]
- Baker, N.; Standeven, M. Thermal comfort for free-running buildings. Energy Build. 1996, 23, 175–182. [Google Scholar] [CrossRef]
- Aghniaey, S.; Lawrence, T.M.; Sharpton, T.N.; Douglass, S.P.; Oliver, T.; Sutter, M. Thermal comfort evaluation in campus classrooms during room temperature adjustment corresponding to demand response. Build. Environ. 2019, 148, 488–497. [Google Scholar] [CrossRef]
- Yang, B.; Olofsson, T.; Wang, F.; Lu, W. Thermal comfort in primary school classrooms: A case study under subarctic climate area of Sweden. Build. Environ. 2018, 135, 237–245. [Google Scholar] [CrossRef]
- Cheng, F.; Wu, Y.; Gao, S.; Liao, C.; Cheng, Y. Experimental study of thermal comfort in a field environment chamber with stratum ventilation system in winter. Build. Environ. 2022, 207, 108445. [Google Scholar] [CrossRef]
- Gil-Baez, M.; Barrios-Padura, A.; Molina-Huelva, M.; Chacartegui, R. Natural ventilation systems in 21st-century for near zero energy school buildings. Energy 2017, 137, 1186–1200. [Google Scholar] [CrossRef]
- Kim, J.; de Dear, R. Thermal comfort expectations and adaptive behavioural characteristics of primary and secondary school students. Build. Environ. 2018, 127, 13–22. [Google Scholar] [CrossRef]
- Hamzah, B.; Gou, Z.; Mulyadi, R.; Amin, S. Thermal comfort analyses of secondary school students in the tropics. Buildings 2018, 8, 56. [Google Scholar] [CrossRef] [Green Version]
- Haddad, S.; Osmond, P.; King, S. Application of adaptive thermal comfort methods for Iranian schoolchildren. Build. Res. Inf. 2019, 47, 173–189. [Google Scholar] [CrossRef]
- Montazami, A.; Gaterell, M.; Nicol, F.; Lumley, M.; Thoua, C. Impact of social background and behaviour on children’s thermal comfort. Build. Environ. 2017, 122, 422–434. [Google Scholar] [CrossRef]
- Teli, D.; Jentsch, M.F.; James, P.A.B. The role of a building’s thermal properties on pupils’ thermal comfort in junior school classrooms as determined in field studies. Build. Environ. 2014, 82, 640–654. [Google Scholar] [CrossRef] [Green Version]
- Teli, D.; Jentsch, M.F.; James, P.A.B. Naturally ventilated classrooms: An assessment of existing comfort models for predicting the thermal sensation and preference of primary school children. Energy Build. 2012, 53, 166–182. [Google Scholar] [CrossRef]
- Singh, M.K.; Ooka, R.; Rijal, H.B.; Kumar, S.; Kumar, A.; Mahapatra, S. Progress in thermal comfort studies in classrooms over last 50 years and way forward. Energy Build. 2019, 188–189, 149–174. [Google Scholar] [CrossRef]
- Corgnati, S.P.; Filippi, M.; Viazzo, S. Perception of the thermal environment in high school and university classrooms: Subjective preferences and thermal comfort. Build. Environ. 2007, 42, 951–959. [Google Scholar] [CrossRef]
- Giuli, V.D.; Pos, O.D.; Carli, M.D. Indoor environmental quality and pupil perception in Italian primary schools. Build. Environ. 2012, 56, 335–345. [Google Scholar] [CrossRef]
- Korsavi, S.S.; Montazami, A. Children’s thermal comfort and adaptive behaviours; UK primary schools during non-heating and heating seasons. Energy Build. 2020, 214, 1–19. [Google Scholar] [CrossRef]
- Trebilcock, M.; Soto-Muñoz, J.; Yañez, M.; Martin, R.F.-S. The right to comfort: A field study on adaptive thermal comfort in free-running primary schools in Chile. Build. Environ. 2017, 114, 455–469. [Google Scholar] [CrossRef]
- Trebilcock, M.; Piderit, B.; Soto, J.; Figueroa, R. A parametric analysis of simple passive strategies for improving thermal performance of school classrooms in Chile. Archit. Sci. Rev. 2016, 59, 385–399. [Google Scholar] [CrossRef]
- Buratti, C.; Palladino, D.; Ricciardi, P. Application of a new 13-value thermal comfort scale to moderate environments. Appl. Energy 2016, 180, 859–866. [Google Scholar] [CrossRef]
- Bakó-Biró, Z.; Clements-Croome, D.J.; Kochhar, N.; Awbi, H.B. Ventilation rates in schools and pupils’ performance. Build. Environ. 2007, 48, 1434–1440. [Google Scholar] [CrossRef]
- Wargocki, P.; Wyon, D.P. The effects of moderately raised classroom temperatures and classroom ventilation rate on the performance of schoolwork by children. HVACR Res. 2007, 13, 193–220. [Google Scholar] [CrossRef]
- Ukawa, S.; Araki, A.; Kanazawa, A.; Yuasa, M. The relationship between atopic dermatitis and indoor environmental factors: A cross-sectional study among Japanese elementary school children. Int. Arch. Occup. Environ. Health 2013, 86, 77–87. [Google Scholar] [CrossRef] [PubMed]
- Al-Rashidi, K.; Loveday, D.; Al-Mutawa, N. Impact of ventilation modes on carbon dioxide concentration levels in Kuwait classrooms. Energy Build 2012, 47, 540–549. [Google Scholar] [CrossRef]
- Mumovic, D.; Palmer, J.; Davies, M.; Orme, M.; Ridley, I.; Oreszczyn, T.; Judd, C.; Critchlow, R.; Medina, H.A.; Pilmoor, G.; et al. Winter indoor air quality, thermal comfort and acoustic performance of newly built secondary schools in England. Build. Environ. 2009, 44, 1466–1477. [Google Scholar] [CrossRef]
- Conceição, E.Z.E.; Lúcio, M.M.J.R. Thermal study of school buildings in winter conditions. Build. Environ. 2008, 43, 782–792. [Google Scholar] [CrossRef]
- Tian, Z.; Zhang, X.; Jin, X.; Zhou, X.; Si, B.; Shi, X. Towards adoption of building energy simulation and optimization for passive building design: A survey and a review. Energy Build. 2018, 158, 1306–1316. [Google Scholar] [CrossRef]
- Wang, D.; Jiang, J.; Liu, Y.; Wang, Y.; Xu, Y.; Liu, J. Student responses to classroom thermal environments in rural primary and secondary schools in winter. Build. Environ. 2017, 115, 104–117. [Google Scholar] [CrossRef]
- Liang, H.-H.; Lin, T.-P.; Hwang, R.-L. Linking occupants’ thermal perception and building thermal performance in naturally ventilated school buildings. Appl. Energy 2012, 94, 355–363. [Google Scholar] [CrossRef]
- Dias Pereira, L.; Raimondo, D.; Corgnati, S.P.; Gameiro da Silva, M. Assessment of indoor air quality and thermal comfort in Portuguese secondary classrooms: Methodology and results. Build. Environ. 2014, 81, 69–80. [Google Scholar] [CrossRef]
- Katafygiotou, M.C.; Serghides, D.K. Thermal comfort of a typical secondary school building in Cyprus. Sustain. Cities Soc. 2014, 13, 303–312. [Google Scholar] [CrossRef]
- Jowkar, M.; Rijal, H.B.; Brusey, J.; Montazami, A.; Carlucci, S.; Lansdown, T.C. Comfort temperature and preferred adaptive behaviour in various classroom types in the UK higher learning environments. Energy Build. 2020, 211, 1–15. [Google Scholar] [CrossRef]
- Mishra, A.; Ramgopal, M. Thermal comfort field study in undergraduate laboratories–An analysis of occupant perceptions. Build. Environ. 2014, 76, 62–72. [Google Scholar] [CrossRef]
- Yao, R.; Liu, J.; Li, B. Occupants’ adaptive responses and perception of thermal environment in naturally conditioned university classrooms. Appl. Energy 2010, 87, 1015–1022. [Google Scholar] [CrossRef]
- Kumar, S.; Singh, M.K.; Mathu, A.; Mathur, J.; Mathur, S. Evaluation of comfort preferences and insights into behavioural adaptation of students in naturally ventilated classrooms in a tropical country, India. Build. Environ. 2018, 143, 532–547. [Google Scholar] [CrossRef]
- Mishra, A.K.; Ramgopal, M. A thermal comfort field study of naturally ventilated classrooms in Kharagpur, India. Build. Environ. 2015, 92, 396–406. [Google Scholar] [CrossRef]
- Nico, M.A.; Liuzzi, S.; Stefanizzi, P. Evaluation of thermal comfort in university classrooms through objective approach and subjective preference analysis. Appl. Ergon. 2015, 48, 111–120. [Google Scholar] [CrossRef]
- Zhang, G.; Zheng, C.; Yang, W.; Zhang, Q.; Moschandreasa, D.J. Thermal comfort investigation of naturally ventilated classrooms in a subtropical region. Indoor Built Environ. 2007, 16, 148–158. [Google Scholar] [CrossRef]
- Krüger, E.L.; Zannin, P.H.T. Acoustic, thermal and luminous comfort in classrooms. Build. Environ. 2004, 39, 1055–1063. [Google Scholar] [CrossRef]
- Corgnati, S.P.; Ansaldi, R.; Filippi, M. Thermal comfort in Italian classrooms under free running conditions during mid seasons: Assessment through objective and subjective approaches. Build. Environ. 2009, 44, 785–792. [Google Scholar] [CrossRef]
- Baruah, P.; Singh, M.K.; Mahapatra, S. Thermal comfort in naturally ventilated classrooms. In Proceedings of the 30th International PLEA Conference, Ahmedabad, India, 16–18 December 2014. [Google Scholar]
- Costa, M.L.; Freire, M.R.; Kiperstok, A. Strategies for thermal comfort in university buildings—The case of the faculty of architecture at the Federal University of Bahia, Brazil. J. Environ. Manag. 2019, 239, 114–123. [Google Scholar] [CrossRef]
- Hwang, R.; Lin, T.; Kuo, N. Field experiments on thermal comfort in campus classrooms in Taiwan. Energy Build. 2006, 38, 53–62. [Google Scholar] [CrossRef]
- Jing, S.; Lei, Y.; Wang, H.; Song, C.; Yan, X. Thermal comfort and energy-saving potential in university classrooms during the heating season. Energy Build. 2019, 202, 1–11. [Google Scholar] [CrossRef]
- Mishra, A.K.; Derks, M.T.H.; Kooi, L.; Loomans, M.G.L.C.; Kort, H.S.M. Analysing thermal comfort perception of students through the class hour, during heating season, in a university classroom. Build. Environ. 2017, 125, 464–474. [Google Scholar] [CrossRef]
- Fanga, Z.; Zhang, S.; Cheng, Y.Y.; Fong, A.M.L.; Oladokun, M.O.; Lind, Z.; Wu, H. Field study on adaptive thermal comfort in typical air conditioned classrooms. Build. Environ. 2018, 133, 73–82. [Google Scholar] [CrossRef] [Green Version]
- Wang, Z.; Ning, H.; Zhang, X.; Ji, Y. Human Thermal Adaptation in University Classrooms and Dormitories in Chinese Severe Cold Area in Winter. Procedia Eng. 2016, 146, 24–31. [Google Scholar] [CrossRef] [Green Version]
- Fong, M.L.; Hanby, V.; Greenough, R.; Lin, Z.; Cheng, Y. Acceptance of thermal conditions and energy use of three ventilation strategies with six exhaust configurations for the classroom. Build. Environ. 2015, 94, 606–619. [Google Scholar] [CrossRef]
- Serghides, D.K.; Chatzinikola, C.K.; Katafygiotou, M.C. Comparative studies of the occupants’ behaviour in a university building during winter and summer time. Int. J. Sustain. Energy 2015, 34, 528–551. [Google Scholar] [CrossRef]
- Davidsson, H.; Bernardo, R.; Hellstrom, B. Theoretical and Experimental Investigation of a Heat Exchanger Suitable for a Hybrid Ventilation System. Buildings 2013, 3, 18–38. [Google Scholar] [CrossRef] [Green Version]
- Turanjanin, V.; Vučićević, B.; Jovanović, M.; Mirkov, N.; Lazović, I. Indoor CO2 measurements in Serbian schools and ventilation rate calculation. Energy 2014, 77, 290–296. [Google Scholar] [CrossRef]
- Stabile, L.; Dell’Isola, M.; Russi, A.; Massimo, A.; Buonanno, G. The effect of natural ventilation strategy on indoor air quality in schools. Sci. Total Environ. 2017, 595, 894–902. [Google Scholar] [CrossRef] [PubMed]
- ESFA. Guidance on Ventilation, Thermal Comfort and Indoor Air Quality in Schools. In Building Bulletin 101. Draft for Public Consultation; Department for Education: London, UK, 2005; ISBN 011-2711642. [Google Scholar]
- Mainka, A.; Brągoszewska, E.; Kozielska, B.; Pastuszka, J.S.; Zajusz-Zubek, E. Indoor air quality in urban nursery schools in Gliwice, Poland: Analysis of the case study. Atmos. Pollut. Res. 2015, 6, 1098–1104. [Google Scholar] [CrossRef]
- Heebøll, A.; Wargocki, P.; Toftum, J. Window and door opening behavior, carbon dioxide concentration, temperature, and energy use during the heating season in classrooms with different ventilation retrofits—ASHRAE RP1624. Sci. Technol. Built Environ. 2018, 24, 626–637. [Google Scholar] [CrossRef] [Green Version]
- Cai, C.; Sun, Z.; Weschler, L.B.; Li, T.; Xu, W.; Zhang, Y. Indoor air quality in schools in Beijing: Field tests, problems and recommendations. Build. Environ. 2021, 205, 108179. [Google Scholar] [CrossRef]
- Heracleous, C.; Michael, A. Thermal comfort models and perception of users in free-running school buildings of East-Mediterranean region. Energy Build. 2020, 215, 1–17. [Google Scholar] [CrossRef]
- Heracleous, C.; Michael, A. Experimental assessment of the impact of natural ventilation on indoor air quality and thermal comfort conditions of educational buildings in the Eastern Mediterranean region during the heating period. J. Build. Eng. 2019, 26, 1–15. [Google Scholar] [CrossRef]
- WHO. Air Quality Guidelines for Particulate Matter, Ozone, Nitrogen Dioxide and Sulfur Dioxide; World Health Organization: Geneva, Switzerland, 2005. [Google Scholar]
- Madureira, J.; Paciência, I.; Rufo, J.; Ramos, E.; Barros, H.; Teixeira, J.P.; de Oliveira Fernandes, E. Indoor air quality in schools and its relationship with children’s respiratory symptoms. Atmos. Environ. 2015, 118, 145–156. [Google Scholar] [CrossRef] [Green Version]
- Poupard, O.; Blondeau, P.; Iordache, V.; Allard, F. Statistical analysis of parameters influencing the relationship between outdoor and indoor air quality in schools. Atmos. Environ. 2005, 39, 2071–2080. [Google Scholar] [CrossRef]
- Chan, L.Y.; Kwok, W.S.; Chan, C.Y. Human exposure to respirable suspended particulate and airborne lead in different roadside microenvironments. Chemosphere 2000, 41, 3–9. [Google Scholar] [CrossRef]
- Yang, D.; Mak, C.M. Effects of acoustical descriptors on speech intelligibility in Hong Kong classrooms. Appl. Acoust. 2021, 171, 107678. [Google Scholar] [CrossRef]
- Leppänen, M.; Peräniemi, S.; Koponen, H.; Sippul, O.; Pasanen, P. The effect of the shoeless course on particle concentrations and dust composition in schools. Sci. Total Environ. 2020, 710, 136272. [Google Scholar] [CrossRef]
- Zhou, L.; Chen, J.; Song, Z.; Ge, Z. Semi-supervised PLVR models for process monitoring with unequal sample sizes of process variables and quality variables. J. Process. Control 2015, 26, 1–16. [Google Scholar] [CrossRef]
- Hutter, H.P.; Moshammer, H.; Wallner, P.; Tappler, P.; Kundi, M. Volatile organic compounds: Guidelines from the Austrian working group on indoor air. Proc. Indoor Air 2005, 2005, 3519–3522. [Google Scholar]
- Hernandez, G.; Wallis, S.L.; Graves, L.; Narain, S.; Birchmore, R.; AnnBerry, T. The effect of ventilation on volatile organic compounds produced by new furnishings in residential buildings. Atmos. Environ. X 2020, 6, 100069. [Google Scholar]
- Hu, K.; Chen, Q. Ventilation optimization for reduction of indoor semi-volatile organic compound concentration based on the variational principle. Build. Environ. 2015, 94, 676–682. [Google Scholar] [CrossRef]
- Wang, J.; Smedje, G.; Nordquist, T.; Norbäck, D. Personal and demographic factors and change of subjective indoor air quality reported by school children in relation to exposure at Swedish schools: A 2-year longitudinal study. Sci. Total. Environ. 2015, 508, 288–296. [Google Scholar] [CrossRef]
- Bluyssen, P.M. The Indoor Environment Handbook: How to Make Buildings Healthy and Comfortable. Routledge: London, UK, 2009. [Google Scholar]
- Majd, E.; McCormack, M.; Davis, M.; Curriero, F.; Berman, J.; Connolly, F.; Leaf, P.; Rule, A.; Green, T.; Clemons-Erby, D.; et al. Indoor air quality in inner-city schools and its associations with building characteristics and environmental factors. Environ. Res. 2019, 170, 83–91. [Google Scholar] [CrossRef] [PubMed]
- Al-Hemoud, A.; Al-Awadi, L.; Al-Rashidi, M.; Rahman, K.A.; Al-Khayat, A.; Behbehani, W. Comparison of indoor air quality in schools: Urban vs. Industrial ‘oil & gas’ zones in Kuwait. Build. Environ. 2017, 122, 50–60. [Google Scholar] [CrossRef]
- Haddad, S.; Synnefa, A.; Ángel Padilla Marcos, M.; Paolini, R.; Delrue, S.; Prasad, D.; Santamouris, M. On the potential of demand-controlled ventilation system to enhance indoor air quality and thermal condition in Australian school classrooms. Energy Build. 2021, 238, 110838. [Google Scholar] [CrossRef]
- Jovanović, M.; Vučićević, B.; Turanjanin, V.; Živković, M.; Spasojević, V. Investigation of indoor and outdoor air quality of the classrooms at a school in Serbia. Energy 2014, 77, 42–48. [Google Scholar] [CrossRef]
- Mohamed, S.; Rodrigues, L.; Omer, S.; Calautit, J. Overheating and Indoor Air Quality in Primary Schools in the UK. Energy Build. 2021, 250, 111291. [Google Scholar] [CrossRef]
- Yang, W.; Sohn, J.; Kim, J.; Son, B.; Park, J. Indoor air quality investigation according to age of the school buildings in Korea. J. Environ. Manag. 2009, 90, 348–354. [Google Scholar] [CrossRef]
- Theodosiou, T.G.; Ordoumpozanis, K.T. Energy, comfort and indoor air quality in nursery and elementary school buildings in the cold climatic zone of Greece. Energy Build. 2008, 40, 2207–2214. [Google Scholar] [CrossRef]
- Alves, C.; Vicente, E.; Evtyugina, M.; Vicente, A.M. Indoor and outdoor air quality: A university cafeteria as a case study. Atmos. Pollut. Res. 2020, 11, 531–544. [Google Scholar] [CrossRef]
- Fan, G.; Xie, J.; Liu, J. Indoor air quality in a naturally ventilated research student office in chinese university during the heating period. Procedia Eng. 2017, 205, 1272–1278. [Google Scholar] [CrossRef]
- Abd, A.; Sumiyoshi, D.; Akashi, Y. Low cost humidity controlled air-conditioning system for building energy savings in tropical climate. J. Build. Eng. 2017, 11, 9–16. [Google Scholar]
- Yang, J.; Wang, Y.; Bing Xue, Y.L.; Xiao, X.; Xia, J.C.; He, B. Contribution of urban ventilation to the thermal environment and urban energy demand: Different climate background perspectives. Sci. Total Environ. 2021, 795, 148791. [Google Scholar] [CrossRef]
- Stabile, L.; Massimo, A.; Canale, L.; Russi, A.; Andrade, A.; Dell’lsola, M. The Effect of Ventilation Strategies on Indoor Air Quality and Energy Consumptions in Classrooms. Buildings 2019, 9, 110. [Google Scholar] [CrossRef] [Green Version]
- Gustafsson, M.; Dermentzis, G.; AreMyhren, J.; Bales, C.; Ochs, F.; Holmberg, S.; Feistb, W. Energy performance comparison of three innovative HVAC systems for renovation through dynamic simulation. Energy Build. 2014, 82, 2–9. [Google Scholar] [CrossRef] [Green Version]
- Stabile, L.; Buonanno, G.; Frattolillo, A.; Dell’Isola, M. The effect of the ventilation retrofit in a school on CO2, airborne particles, and energy consumptions. Build. Environ. 2019, 156, 1–11. [Google Scholar] [CrossRef]
- Haghshenaskashani, S.; Sajadi, B. Evaluation of thermal comfort, IAQ and energy consumption in an impinging jet ventilation (IJV) system with/without ceiling exhaust. J. Build. Eng. 2018, 18, 142–153. [Google Scholar] [CrossRef]
- Jagadeesh, L.R.; Mahesh, L. Experimental and numerical analysis of temperature and air flow in the classroom using CFD. Mater. Today Proc. 2021, 45, 385–388. [Google Scholar] [CrossRef]
- Wang, Y.; Zhao, F.; Kuckelkorn, J.; Li, X.; Wang, H. Indoor air environment and night cooling energy efficiency of a southern German passive public school building operated the heat recovery air conditioning unit. Energy Build. 2014, 81, 9–17. [Google Scholar] [CrossRef]
- Prabhakar, M.; Saffari, M.; Gracia, A.d.; Cabeza, L.F. Improving the energy efficiency of passive PCM system using controlled natural ventilation. Energy Build. 2020, 228, 110483. [Google Scholar] [CrossRef]
- Gainza-Barrencua, J.; Odriozola-Maritorena, M.; Minguillon, R.H.; Gomez-Arriaran, I. Energy savings using sunspaces to preheat ventilation intake air: Experimental and simulation study. J. Build. Eng. 2021, 40, 102343. [Google Scholar] [CrossRef]
- Che, W.W.; Tso, C.Y.; Sun, L.; Ip, D.Y.K.; Lee, H.; Chao, C.Y.H.; Lau, A.K.H. Energy consumption, indoor thermal comfort and air quality in a commercial office with retrofitted heat, ventilation and air conditioning (HVAC) system. Energy Build. 2019, 201, 202–215. [Google Scholar] [CrossRef]
- Schibuola, L.; Tambani, C. High energy efficiency ventilation to limit COVID-19 contagion in school environments. Energy Build. 2021, 240, 110882. [Google Scholar] [CrossRef]
- Wang, Y.; Zhao, F.-Y.; Kuckelkorn, J.; Spliethoff, H.; Rank, E. School building energy performance and classroom air environment implemented with the heat recovery heat pump and displacement ventilation system. Appl. Energy 2014, 114, 58–68. [Google Scholar] [CrossRef]
- Ji, Y.; Lomas, K.J.; Cook, M.J. Hybrid ventilation for low energy building design in south China. Build. Environ. 2009, 44, 2245–2255. [Google Scholar] [CrossRef] [Green Version]
- Huertas, D.B.; Bellido, C.R.; Fargallo, A.P.; Pulido-Arcas, J.A. Energy saving potential in current and future world built environments based on the adaptive comfort approach. J. Clean. Prod. 2020, 249, 119306. [Google Scholar] [CrossRef]
- Zhao, L.; Liu, J.; Ren, J. Impact of various ventilation modes on IAQ and energy consumption in Chinese dwellings: First long-term monitoring study in Tianjin, China. Build. Environ. 2018, 143, 99–106. [Google Scholar] [CrossRef]
- Ma’bdeh, S.N.; Al-Zghoul, A.; Alradaideh, T.; Bataineh, A.; Ahmad, S. Simulation study for natural ventilation retrofitting techniques in educational classrooms—A case study. Heliyon 2020, 6, 1–19. [Google Scholar] [CrossRef] [PubMed]
- De Abreu-Harbich, L.V.; Chaves, V.L.; Brandstetter, M.C.G. Evaluation of strategies that improve the thermal comfort and energy saving of a classroom of an institutional building in a tropical climate. Build. Environ. 2018, 135, 257–268. [Google Scholar] [CrossRef]
- Bienvenido-Huertas, D.; Sánchez-García, D.; Rubio-Bellido, C. Analysing natural ventilation to reduce the cooling energy consumption and the fuel poverty of social dwellings in coastal zones. Appl. Energy 2020, 279, 115845. [Google Scholar] [CrossRef] [PubMed]
- Sung, W.; Hsiao, S. The application of thermal comfort control based on Smart House System of IoT. Measurement 2020, 149, 106997. [Google Scholar] [CrossRef]
- Yu, K.; Chen, Y.; Jaimes, E.; Wu, W.; Liao, K.; Liao, J.; Lu, K.; Sheu, W.; Wang, C. Optimization of thermal comfort, indoor quality, and energy-saving in campus classroom through deep Q learning. Case Stud. Therm. Eng. 2021, 24, 100842. [Google Scholar] [CrossRef]
- Ashrafian, T.; Moazzen, N. The impact of glazing ratio and window configuration on occupants’ comfortand energy demand: The case study of a school building in Eskisehir, Turke. Sustain. Cities Soc. 2019, 47, 101483. [Google Scholar] [CrossRef]
- Phillips, R.; Troup, L.; Fannon, D.; Eckelman, M.J. Triple bottom line sustainability assessment of window-to-wall ratio in US office buildings. Build. Environ. 2020, 182, 107057. [Google Scholar] [CrossRef]
- Lakhdari, K.; Sriti, L.; Painter, B. Parametric optimization of daylight, thermal and energy performance of middle school classrooms, case of hot and dry regions. Build. Environ. 2021, 204, 108173. [Google Scholar] [CrossRef]
- Schünemann, C.; Schiela, D.; Ortlepp, R. How window ventilation behaviour affects the heat resilience in multi-residential buildings. Build. Environ. 2021, 202, 107987. [Google Scholar] [CrossRef]
- Chi, F.; Wang, Y.; Wang, R.; Li, G.; Peng, C. An investigation of optimal window-to-wall ratio based on changes in building orientations for traditional dwellings. Sol. Energy 2020, 195, 64–81. [Google Scholar] [CrossRef]
- Troup, L.; Phillips, R.; Eckelman, M.J.; Fannon, D. Effect of window-to-wall ratio on measured energy consumption in US office buildings. Energy Build. 2019, 23, 109434. [Google Scholar] [CrossRef]


| NO. | Journal Name | Number of Published Papers |
|---|---|---|
| 1 | Building and Environment | 46 |
| 2 | Energy and buildings | 24 |
| 3 | Indoor Air | 7 |
| 4 | Applied Energy | 6 |
| 5 | Atmospheric Pollution Research | 6 |
| 6 | Science of the Total Environment | 6 |
| 7 | Atmospheric Environment | 4 |
| 8 | Journal of Building Engineering | 4 |
| 9 | Energy | 3 |
| 10 | Journal of Environmental Management | 3 |
| Model Type | Analytical Model | Limitation |
|---|---|---|
| Heat balance model | PMV = f(M, W, fcl, pa, Tdb, Tcl, hc) M = the metabolic rate, W/m2; W = effective mechanical work/power, W/m2; fcl = the ratio of clothing surface area to the exposed surface area; pa = vapor pressure of water; Tcl = the clothing surface temperature, °C; Tdb = dry bulb temperature, °C; hc = the heat exchange by evaporation on the skin, °C. | steady-state |
| Adaptive model | β = adaptive coefficient. | Cause inaccurate estimation of thermal comfort due to the unsuitable estimation on occupants’ clothing insulation and metabolic rate |
| Adaptive model | Top = operation temperature; RH% = relative humidity; M = metabolic rate, fcl = the ratio of clothing surface area to the exposed surface area; Tout and the outdoor mean air temperature. |
Publisher’s Note: MDPI stays neutral with regard to jurisdictional claims in published maps and institutional affiliations. |
© 2021 by the authors. Licensee MDPI, Basel, Switzerland. This article is an open access article distributed under the terms and conditions of the Creative Commons Attribution (CC BY) license (https://creativecommons.org/licenses/by/4.0/).
Share and Cite
Jia, L.-R.; Han, J.; Chen, X.; Li, Q.-Y.; Lee, C.-C.; Fung, Y.-H. Interaction between Thermal Comfort, Indoor Air Quality and Ventilation Energy Consumption of Educational Buildings: A Comprehensive Review. Buildings 2021, 11, 591. https://doi.org/10.3390/buildings11120591
Jia L-R, Han J, Chen X, Li Q-Y, Lee C-C, Fung Y-H. Interaction between Thermal Comfort, Indoor Air Quality and Ventilation Energy Consumption of Educational Buildings: A Comprehensive Review. Buildings. 2021; 11(12):591. https://doi.org/10.3390/buildings11120591
Chicago/Turabian StyleJia, Lin-Rui, Jie Han, Xi Chen, Qing-Yun Li, Chi-Chung Lee, and Yat-Hei Fung. 2021. "Interaction between Thermal Comfort, Indoor Air Quality and Ventilation Energy Consumption of Educational Buildings: A Comprehensive Review" Buildings 11, no. 12: 591. https://doi.org/10.3390/buildings11120591