Article

Aged Care Energy Use and Peak Demand Change in the COVID-19 Year: Empirical Evidence from Australia

1
School of Architecture and Built Environment, Queensland University of Technology, Brisbane, QLD 4000, Australia
2
Bolton Clarke, Brisbane, QLD 4059, Australia
3
Department of Electrical and Electronic Engineering, University of Navarra, 20018 San Sebastian, Spain
*
Author to whom correspondence should be addressed.
Buildings 2021, 11(12), 570; https://doi.org/10.3390/buildings11120570
Submission received: 25 October 2021 / Revised: 17 November 2021 / Accepted: 19 November 2021 / Published: 23 November 2021
(This article belongs to the Collection Low-Carbon Buildings and Urban Energy Systems)

Abstract

:
Aged care communities have been under the spotlight since the beginning of 2020. Energy is essential to ensure reliable operation and quality care provision in residential aged care communities (RAC). The aim of this study is to determine how RAC’s yearly energy use and peak demand changed in Australia and what this might mean for RAC design, operation and energy asset investment and ultimately in the healthcare plan for elderly residents. Five years of electricity demand data from four case study RACs in the same climate zone are analyzed. Statistical tools are used to analyze the data, and a clustering algorithm is used to identify typical demand profiles. A number of energy key performance indicators (KPIs) are evaluated, highlighting their respective benefits and limitations. The results show an average 8% reduction for yearly energy use and 7% reduction for yearly peak demands in the COVID-19 year compared with the average of the previous four years. Typical demand profiles for the four communities were mostly lower in the pandemic year. Despite these results, the KPI analysis shows that, for these four communities, outdoor ambient temperature remains a very significant correlation factor for energy use.

1. Introduction

About 40% of global energy use is related to buildings [1,2]. Healthcare consumes a lot of energy, and healthcare buildings are often one of the most energy-intensive use buildings due to all year round 24/7 operation, health and medical needs in a restorative environment [3,4,5]. For example, healthcare is estimated to contribute to 4.4% of global net emissions [4]. Energy as an essential supply is critical to ensure reliable operation and quality care provision at healthcare facilities, such as hospitals or residential aged care communities (RACs). For example, electricity for space cooling and heating tends to account for the highest energy use in Australian RACs [6,7,8]. Nonetheless, the COVID-19 pandemic has disrupted the way aged care communities operate, promoted vulnerability and resilience considerations [9] and also resulted in changes in energy use and peak demand [10].
There have been multiple global reports, at an electrical power system level, of reduced electricity demand since the pandemic started. France, Germany, Italy, Spain and UK experienced 5% to 10% electricity demand reduction for most of 2020 [11,12]. During the COVID-19 lockdown in April 2020, New York City’s peak demand dropped by 12% and 20% respectively for weekends and weekdays [13]. In Saskatchewan’s power system (Canada), 5% to 15% of daily energy use reduction was observed between April and July 2020 [14]. India’s energy consumption reduced by 9% to 23% in March to May 2020 [15].
Similar to the power system level, changes to energy use have been reported in industry, commercial and residential sectors. For example, energy use reductions for commercial and industry customers were seen in Australia, Belgium and India [16]. Australian businesses in the state of Victoria also experienced 5% to 10% daily demand reduction in March 2020; however, for households in the same region, electricity demand in the same period increased by about 5% [17]. UK domestic energy usage was shifted to later in the day, and some increased usage occurred during March 2020 to February 2021 [18]. Increases in residential electricity demand were also observed in lockdown periods in Canada, Ireland and USA [19,20]. These outcomes were not unexpected, given the nature of lockdowns.
There has been limited research on energy and peak demand changes in COVID-19-impacted healthcare facilities. Further, RACs are both homes and healthcare facilities, containing residential and commercial features. Residents live in those communities with general support and healthcare services provided by clinical, administrative and operational staff. These facilities may comprise a mix of resident rooms, resident shared spaces (e.g., dining rooms, activity areas, library), commercial service spaces (e.g., kitchen, laundry, building management), clinical spaces (for nursing, allied health and medical staff and consultants) and retail spaces (e.g., café, hairdresser). A previous study identified that some changes to energy use were observed during a short (6-week) COVID-19 lockdown in early 2020, but that the extent of these changes had a strong relationship with climate [10]. This paper builds on that previous work by evaluating how energy use and peak demand changed for aged care facilities in a COVID-19 year.
In terms of analyzing energy use and peak demand data, statistical tools and data analytical algorithms can be used. Visualization, such as boxplots or scatterplots, can be very intuitive to present summary statistics or show a relationship [10,21]. Another way to examine change of energy use pattern is by studying how typical demand profiles look like [22]. Clustering algorithms can be quite helpful in identifying typical profiles, such as k-means clustering [23], SPSS 2-step technique (Statistical Package for Social Science software) [24] and Gaussian Mixture Model clustering [25]. Once typical profiles are identified, visualizations can show how energy is typically used across an interval, such as a day.
Aged care facilities’ energy use intensity or energy key performance indicators (KPIs) are often related to a site’s total energy use, energy use per bed or per unit floor area [7,8,26,27]. These KPI studies can help support energy management decision making and investment [28,29]. To facilitate comparisons among sites, a normalized energy use KPI can be helpful, such as the energy use per patient bed [30].
This work attempts to answer the following three research questions (RQ):
(1)
Have yearly energy use and peak demand changed during the 1st COVID-19 year for residential aged care facilities? If yes, what are the changes?
(2)
Have there been any changes to typical energy use patterns (i.e., demand profiles)? If yes, what are the changes, such as timing of peak demands or shapes of profiles?
(3)
Have energy KPI values changed when the epidemic year is compared with previous years? If yes, are there energy-saving opportunities from the KPI analysis?
Please note due to lack of submetering data, the research is unable to determine what caused the changes in energy use. However, statistical methods and analysis have been used to identify significant correlation factors to the changes (more details are in Section 3.3).
Following this introduction, the next section introduces the methods used to address the research questions. Then case study results are presented, and the findings are discussed. The last section concludes the paper.

2. Methods

Overall, this research uses a case study approach, combining visuals, statistical tools and a clustering algorithm to identify the changes in yearly energy use and demand profiles for four RACs. The research method flow chart (Figure 1) shows the first step uses descriptive and summary statistics to provide an overview, such as yearly energy use and peak demands to answer RQ1.
To answer RQ2, a Gaussian Mixture Modeling clustering algorithm is applied to analyze five years of 30-min interval electricity demand data to identify typical demand profiles for each community. The demand data are recorded from the communities’ main gate meters which are utility revenue meters of high accuracy (Australian Standard 62052 and 62053). Based on the identified typical demand profiles, typical magnitudes of energy use, timing of peak demands and shapes of energy use patterns are analyzed.
A clustering approach, rather than an average profile or usage distribution across hours of the day, can identify typical profiles with both magnitudes and timing information linked and unlost. Magnitudes and timing may review behavior change (please note this study does not have ethics approval to proceed to human behavior studies; no behavior study is conducted in this research). Moreover, the clustering algorithm can distinguish typical profiles in relationship to climate/seasonal factors, such as temperature measurements. Clustering is data-driven. For example, the clustering outcomes are based on real temperature measurements and a site’s main energy meters data over five years of time, and no arbitrary decision is made regarding defining seasons or high/low temperatures.
The third step identifies and analyzes the changes of a few energy key performance indicators for those case study communities. A range of energy use indicators in relationship with bed numbers and climate conditions are considered.

2.1. Case Study Selection

Four RACs in Southeast Queensland, Australia were selected as the case studies. The rationale behind the selection of Southeast Queensland as the context for the case studies include the region hosting an increasing number of older populations and the clusters of both naturally occurring communities and villages for aged population [31,32].
The principle for selecting those aged care communities is to minimize factors that may have impacts on energy use and peak demands. These selected communities:
  • Are in the same climate zone with warm humid summer and mild winter (Australian Climate Zone 2 [33]).
  • Have similar building styles and demographics.
  • Have been subject to the same government lockdown measures across the 1st COVID-19 year (February 2020 to January 2021). There have been different levels of restrictions and lockdowns [34]. More detailed timing and restriction levels are in Figure 2.
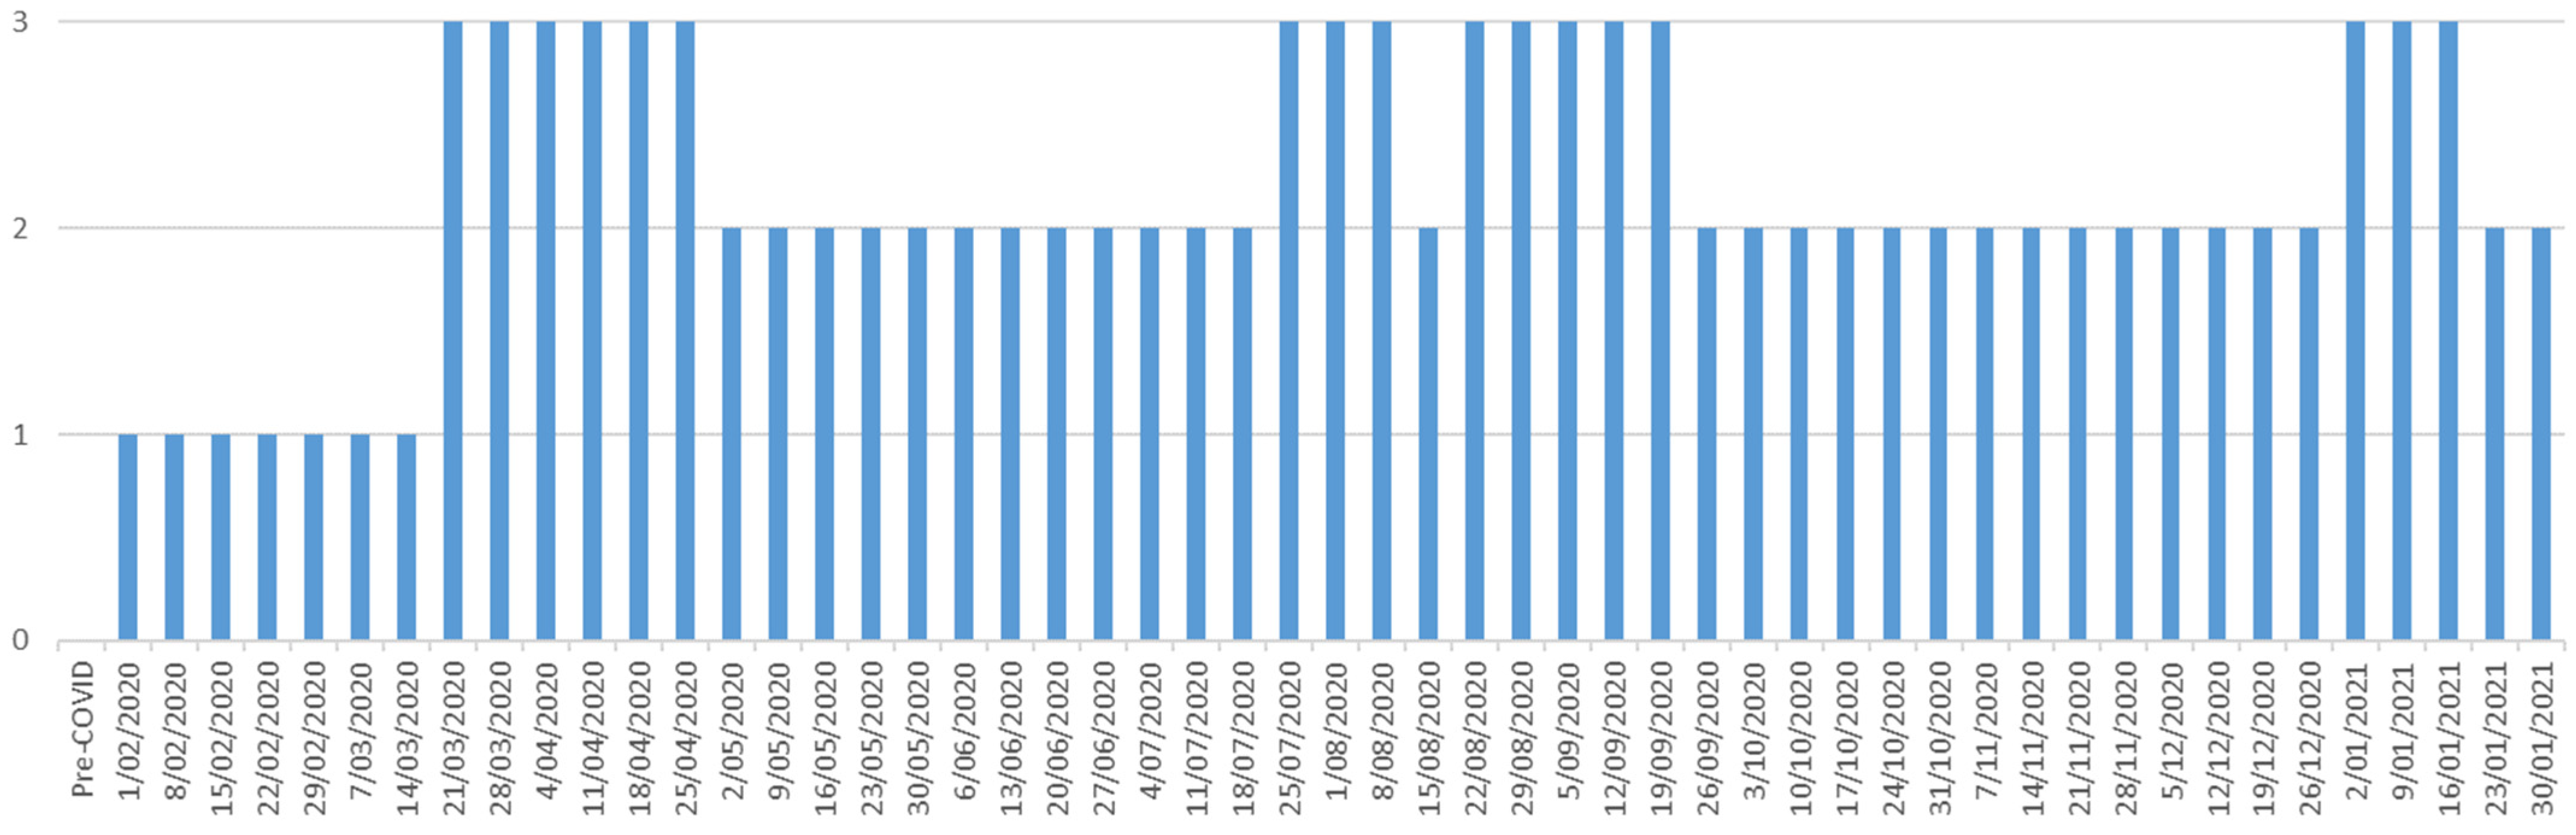
  • Are operated by the same not-for-profit organization with the same operational and health provision guidelines (such as restrictions for onsite group activities, exit and entry to communities).
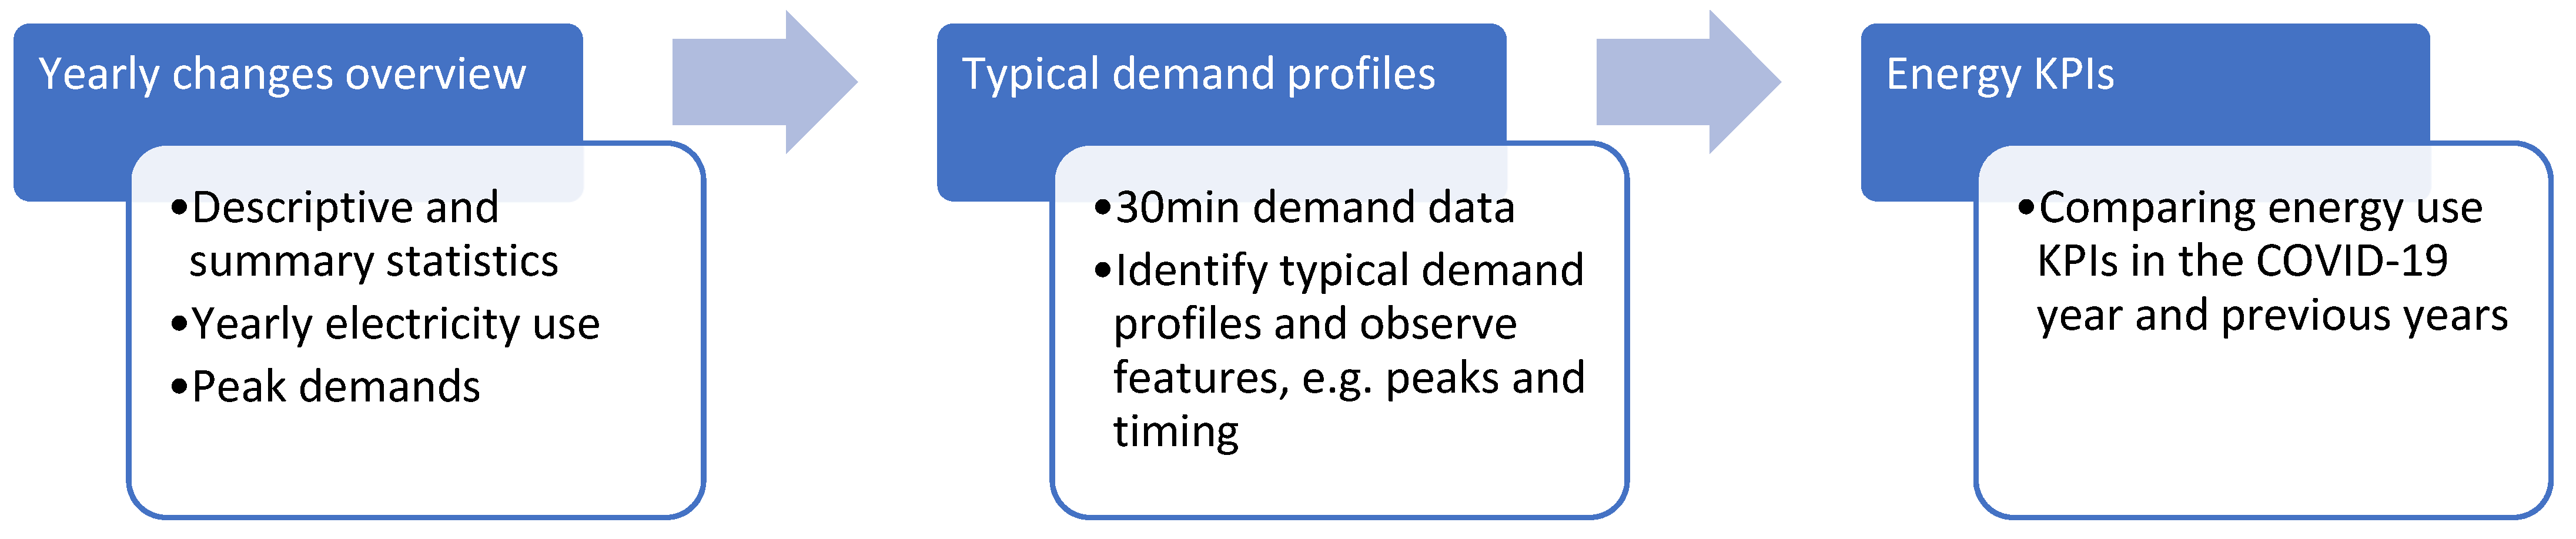
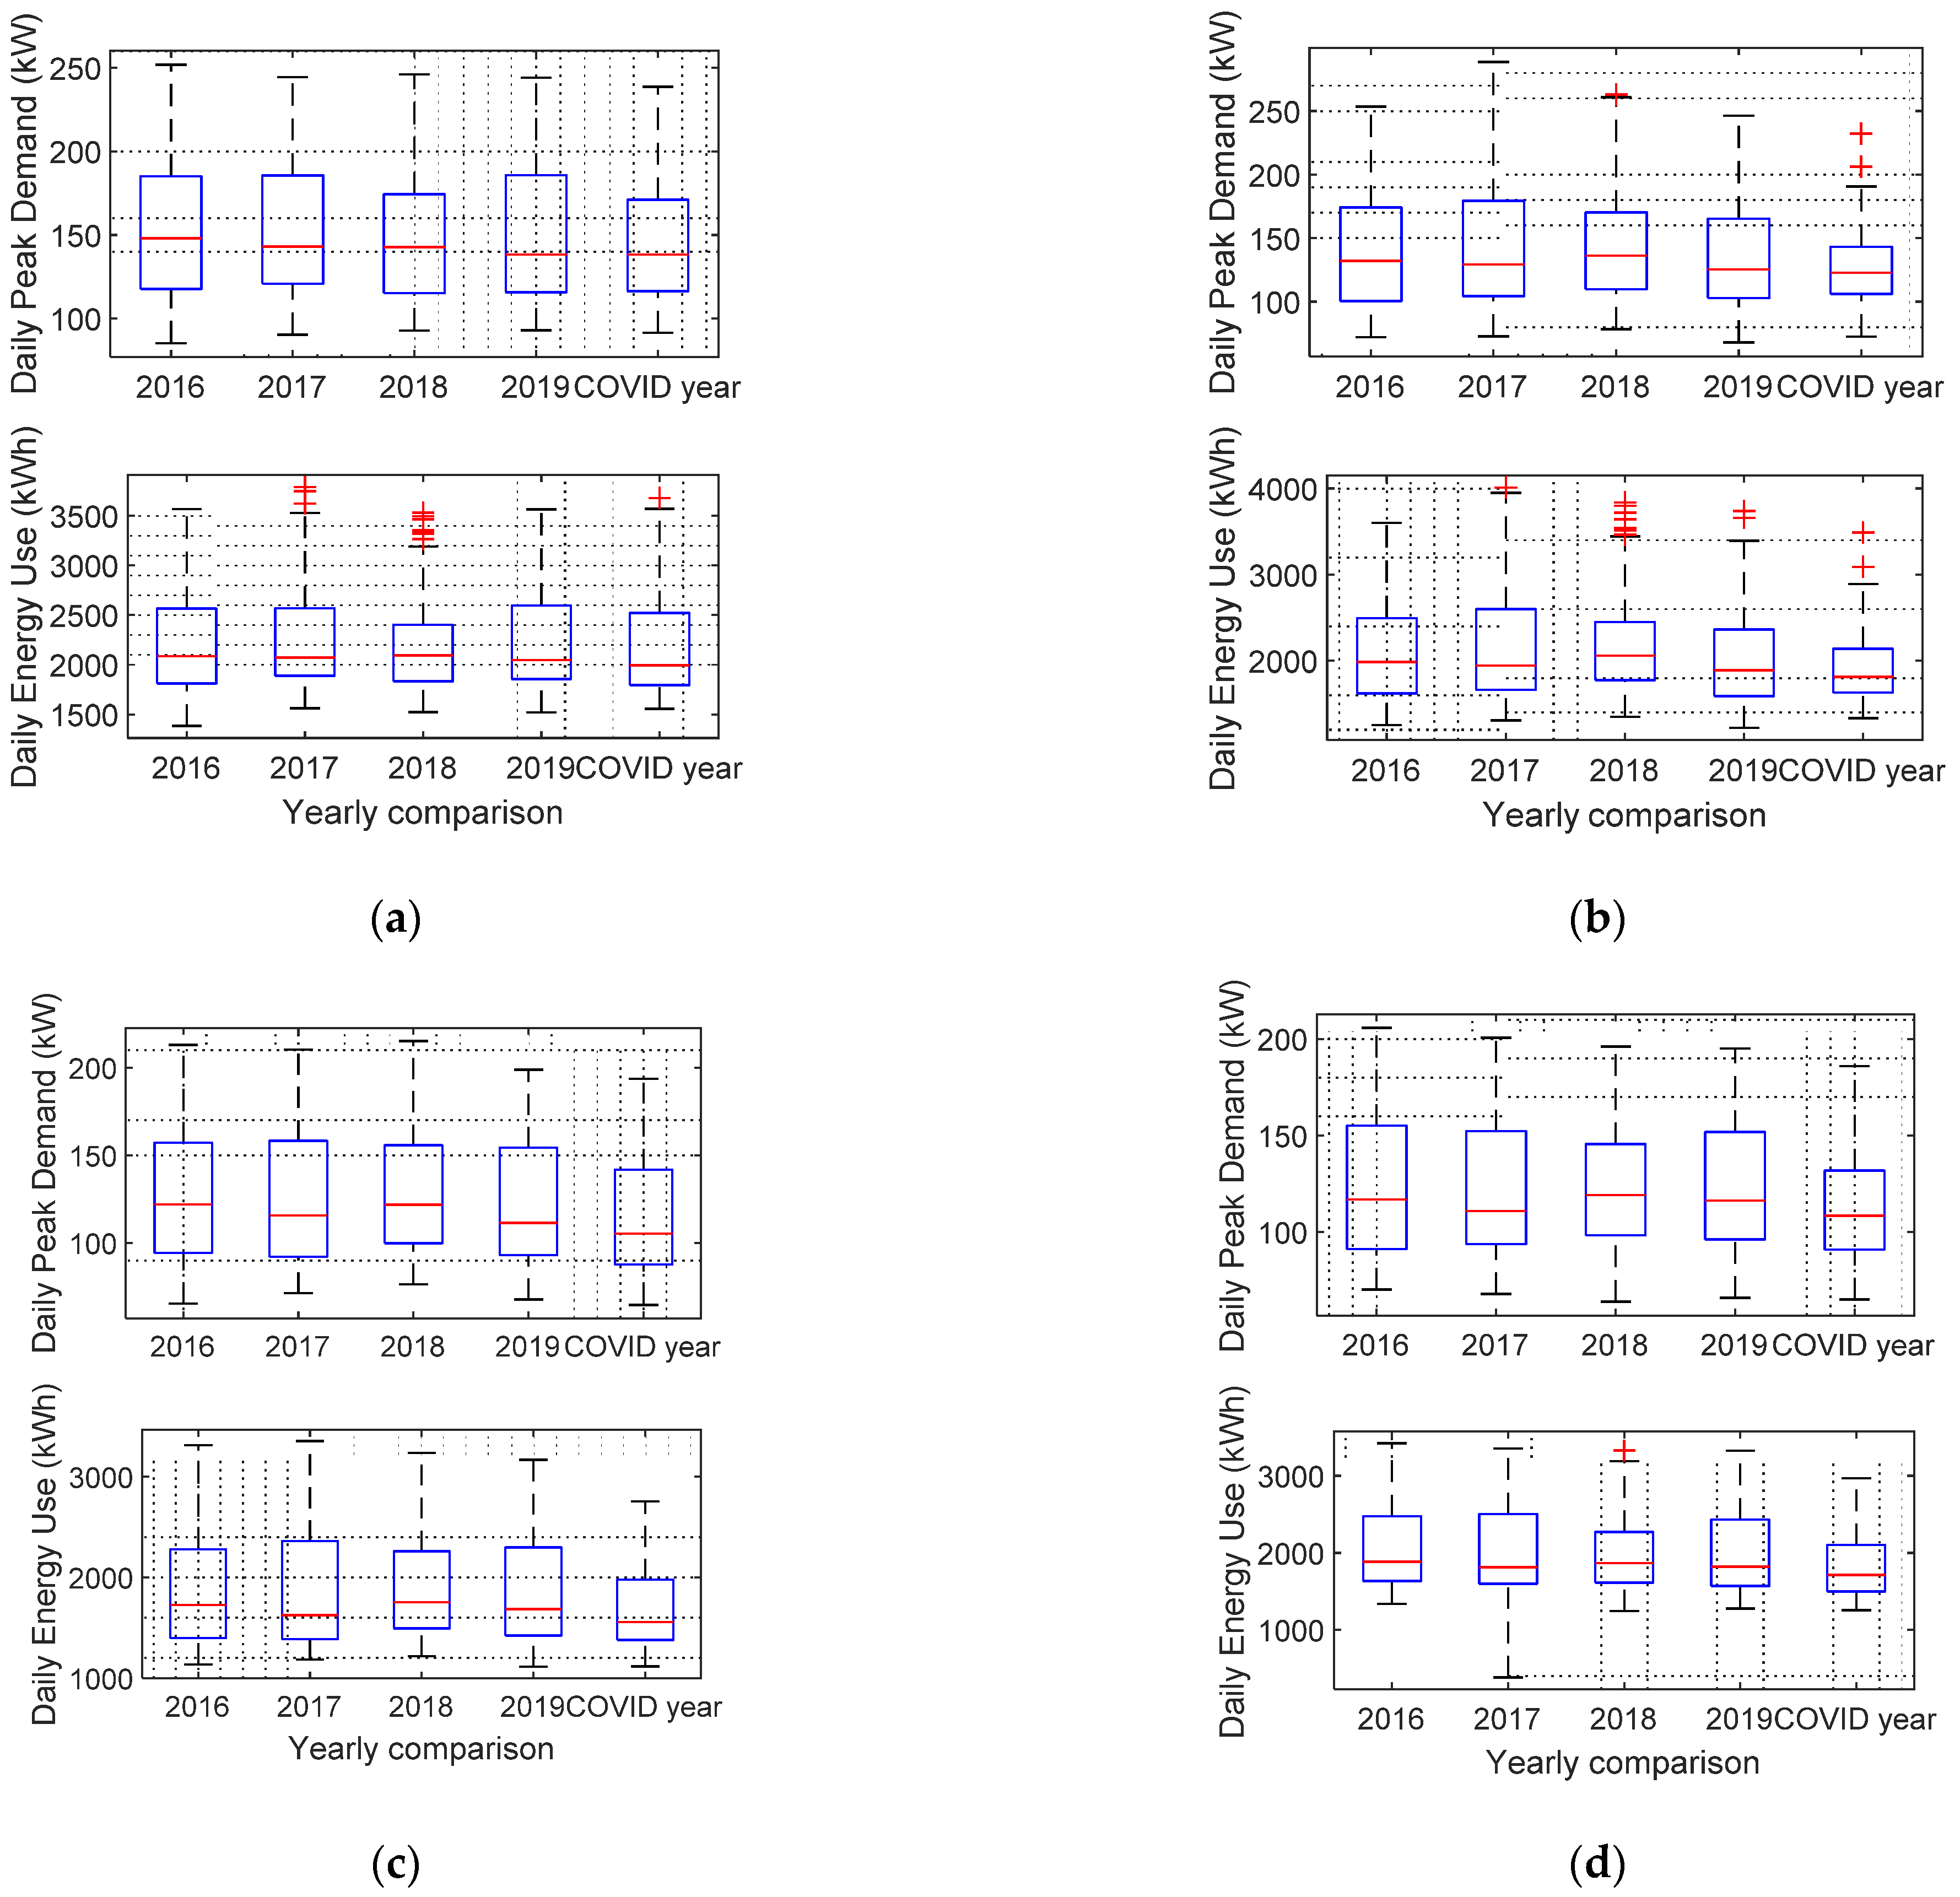
For confidentiality reasons, those communities in Table 1 are anonymized to not reveal their names or locations. In this paper, energy use for these communities is electrical energy for stationary purposes, excluding hot water (provided by gas heating).
Figure 2 provides an overview of lockdown timing and restriction levels across the first COVID-19 year. There have been different levels of restrictions and lockdowns throughout the year. Level 3 is the complete lockdown, meaning no visitor is allowed and an exception is medical emergency. Level 2 is an intermediate level with some restrictions on visitors, such as age limits, flu vaccine and health status [34].

2.2. Yearly Changes

In order to address the question of changes for yearly energy use and peak demand for RACs, statistical methods are used, including: summary statistics (boxplots) for daily electricity use and peak demands in each year as well as annual total electricity use.
Peak demand is the highest rate of using electricity in a defined time duration, such as a highest kilowatt reading for a month or a year. Peak demand is important because of its impact on electrical network, for example high power and high current flow may violate the thermal limits of cables and transformers. Temperature statistics (e.g., cooling degree days (CDD24) in this climatic context) are incorporated into electricity use and peak demand analysis, as energy use can be highly correlated to temperature [10,35]. After obtaining an overall understanding of annual energy use and peak demand in these communities, the next step is to analyze typical demand profiles.

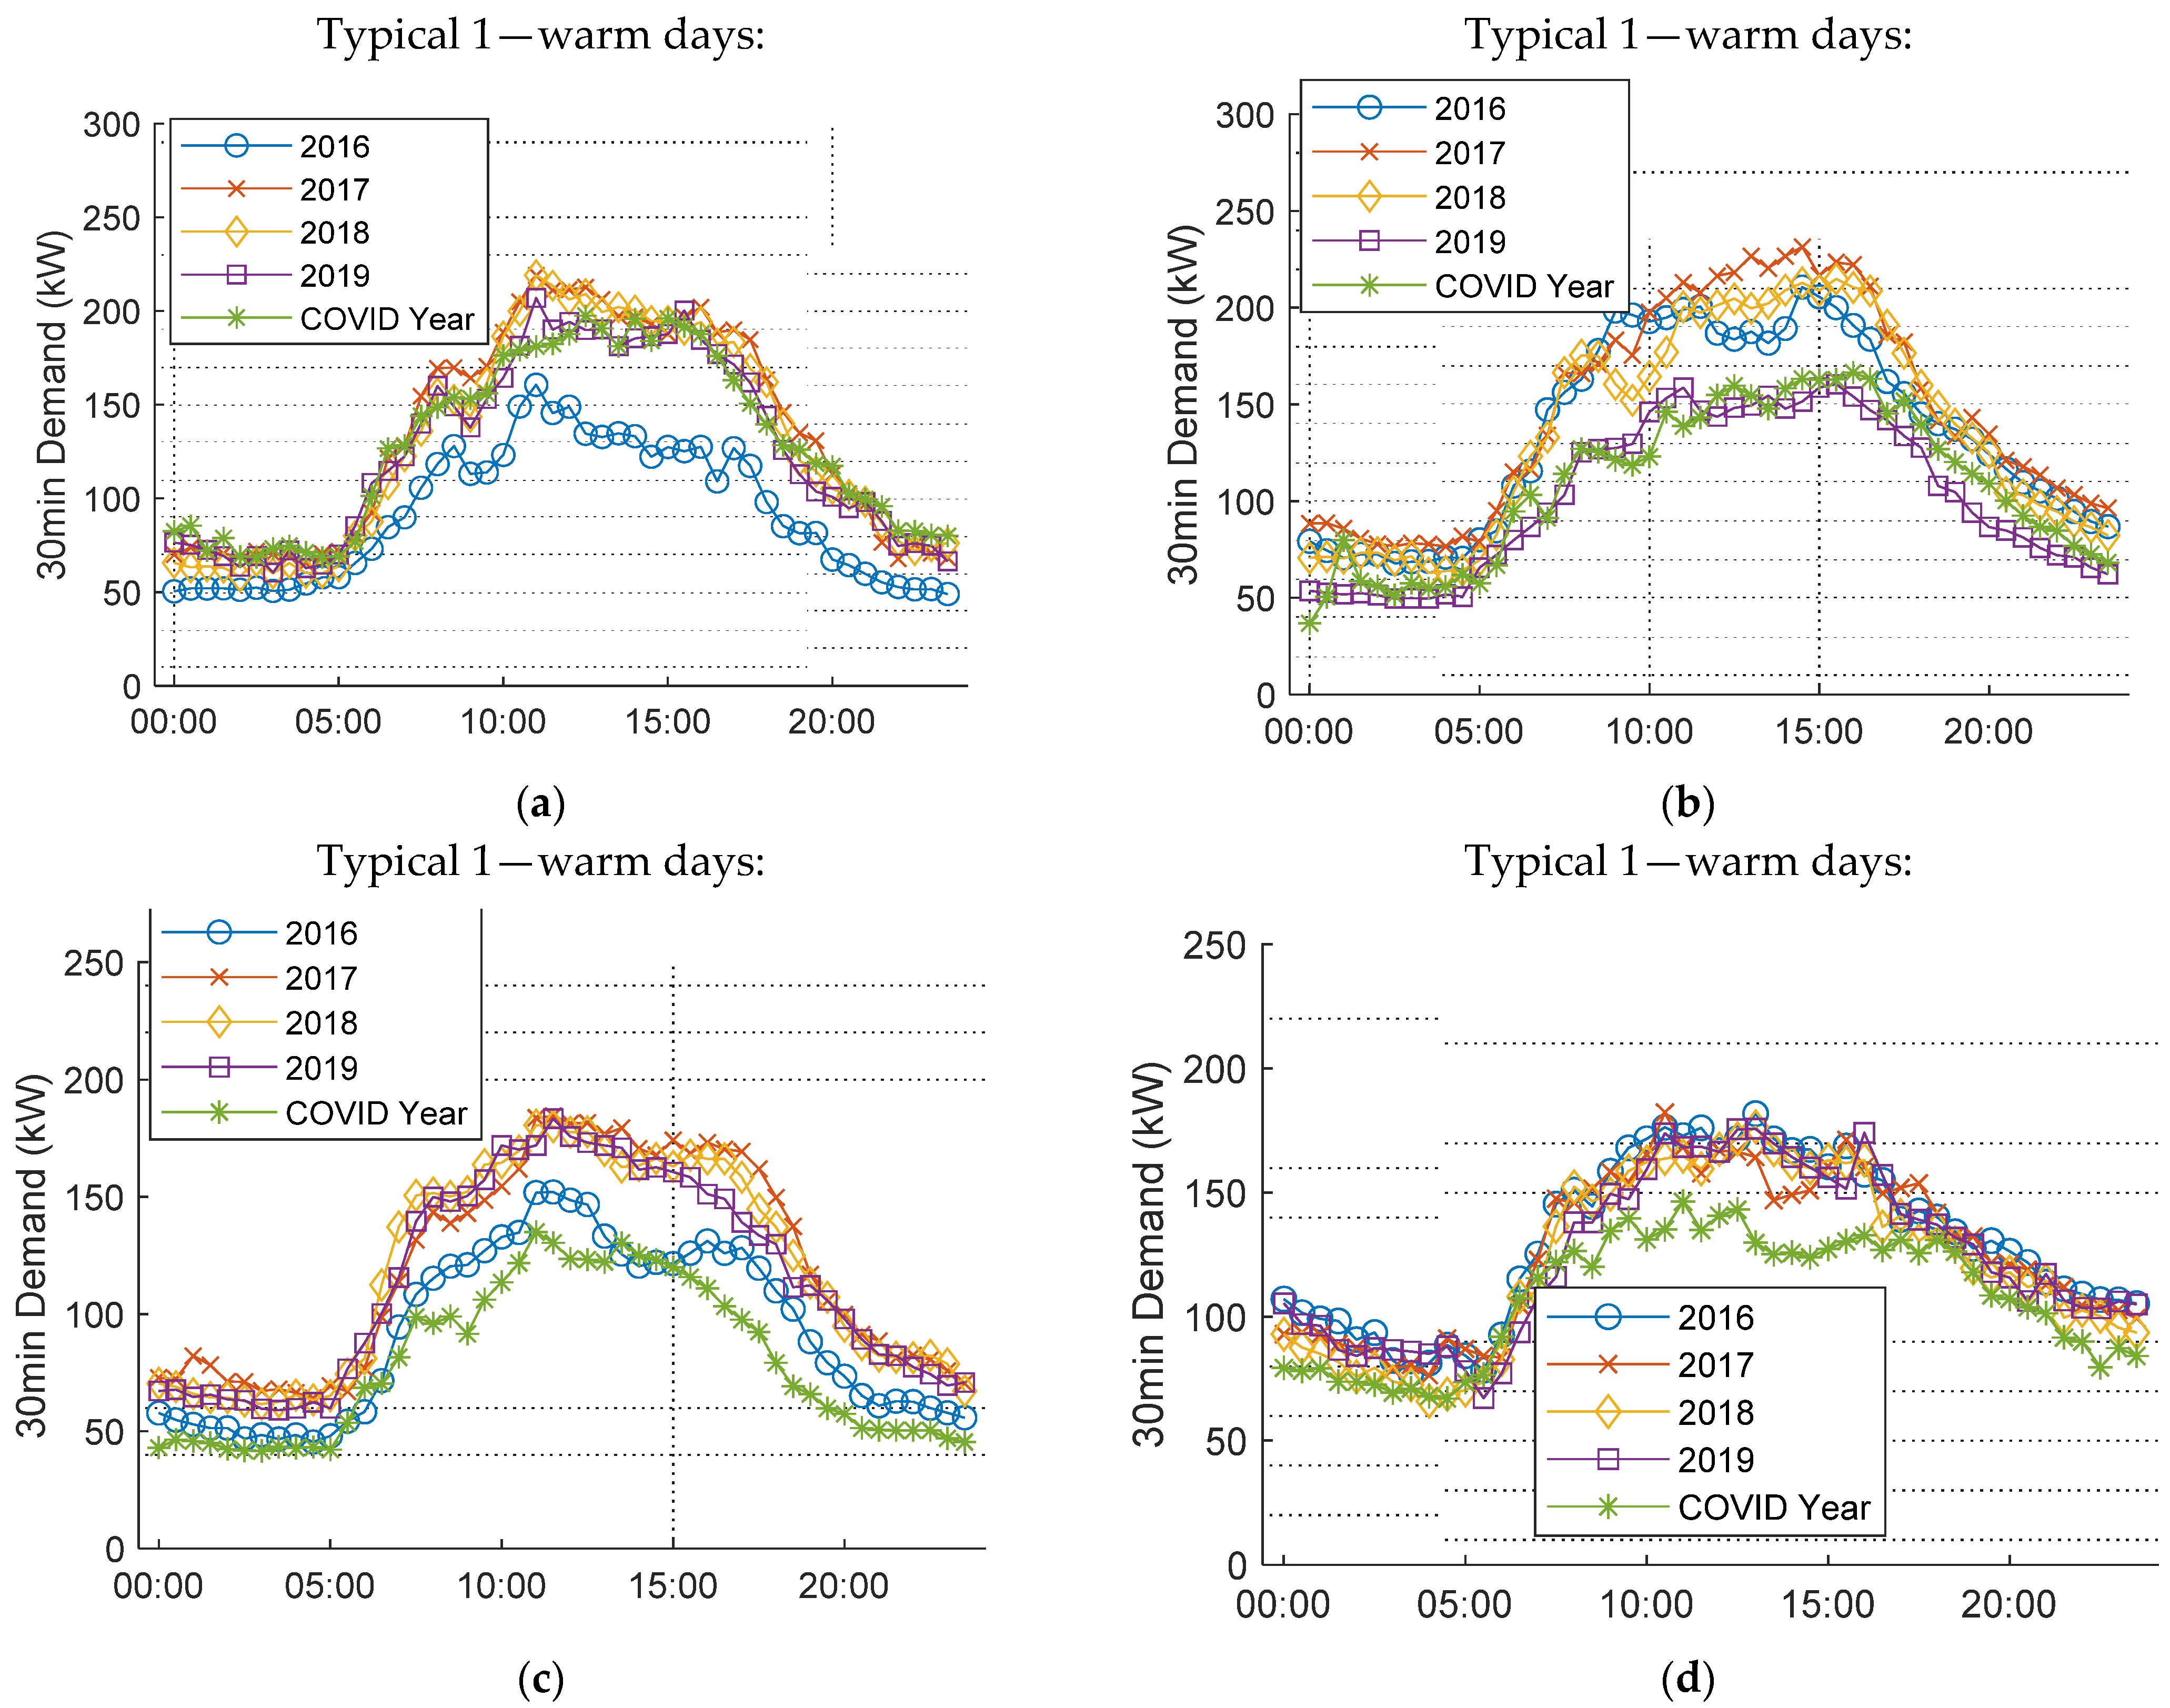
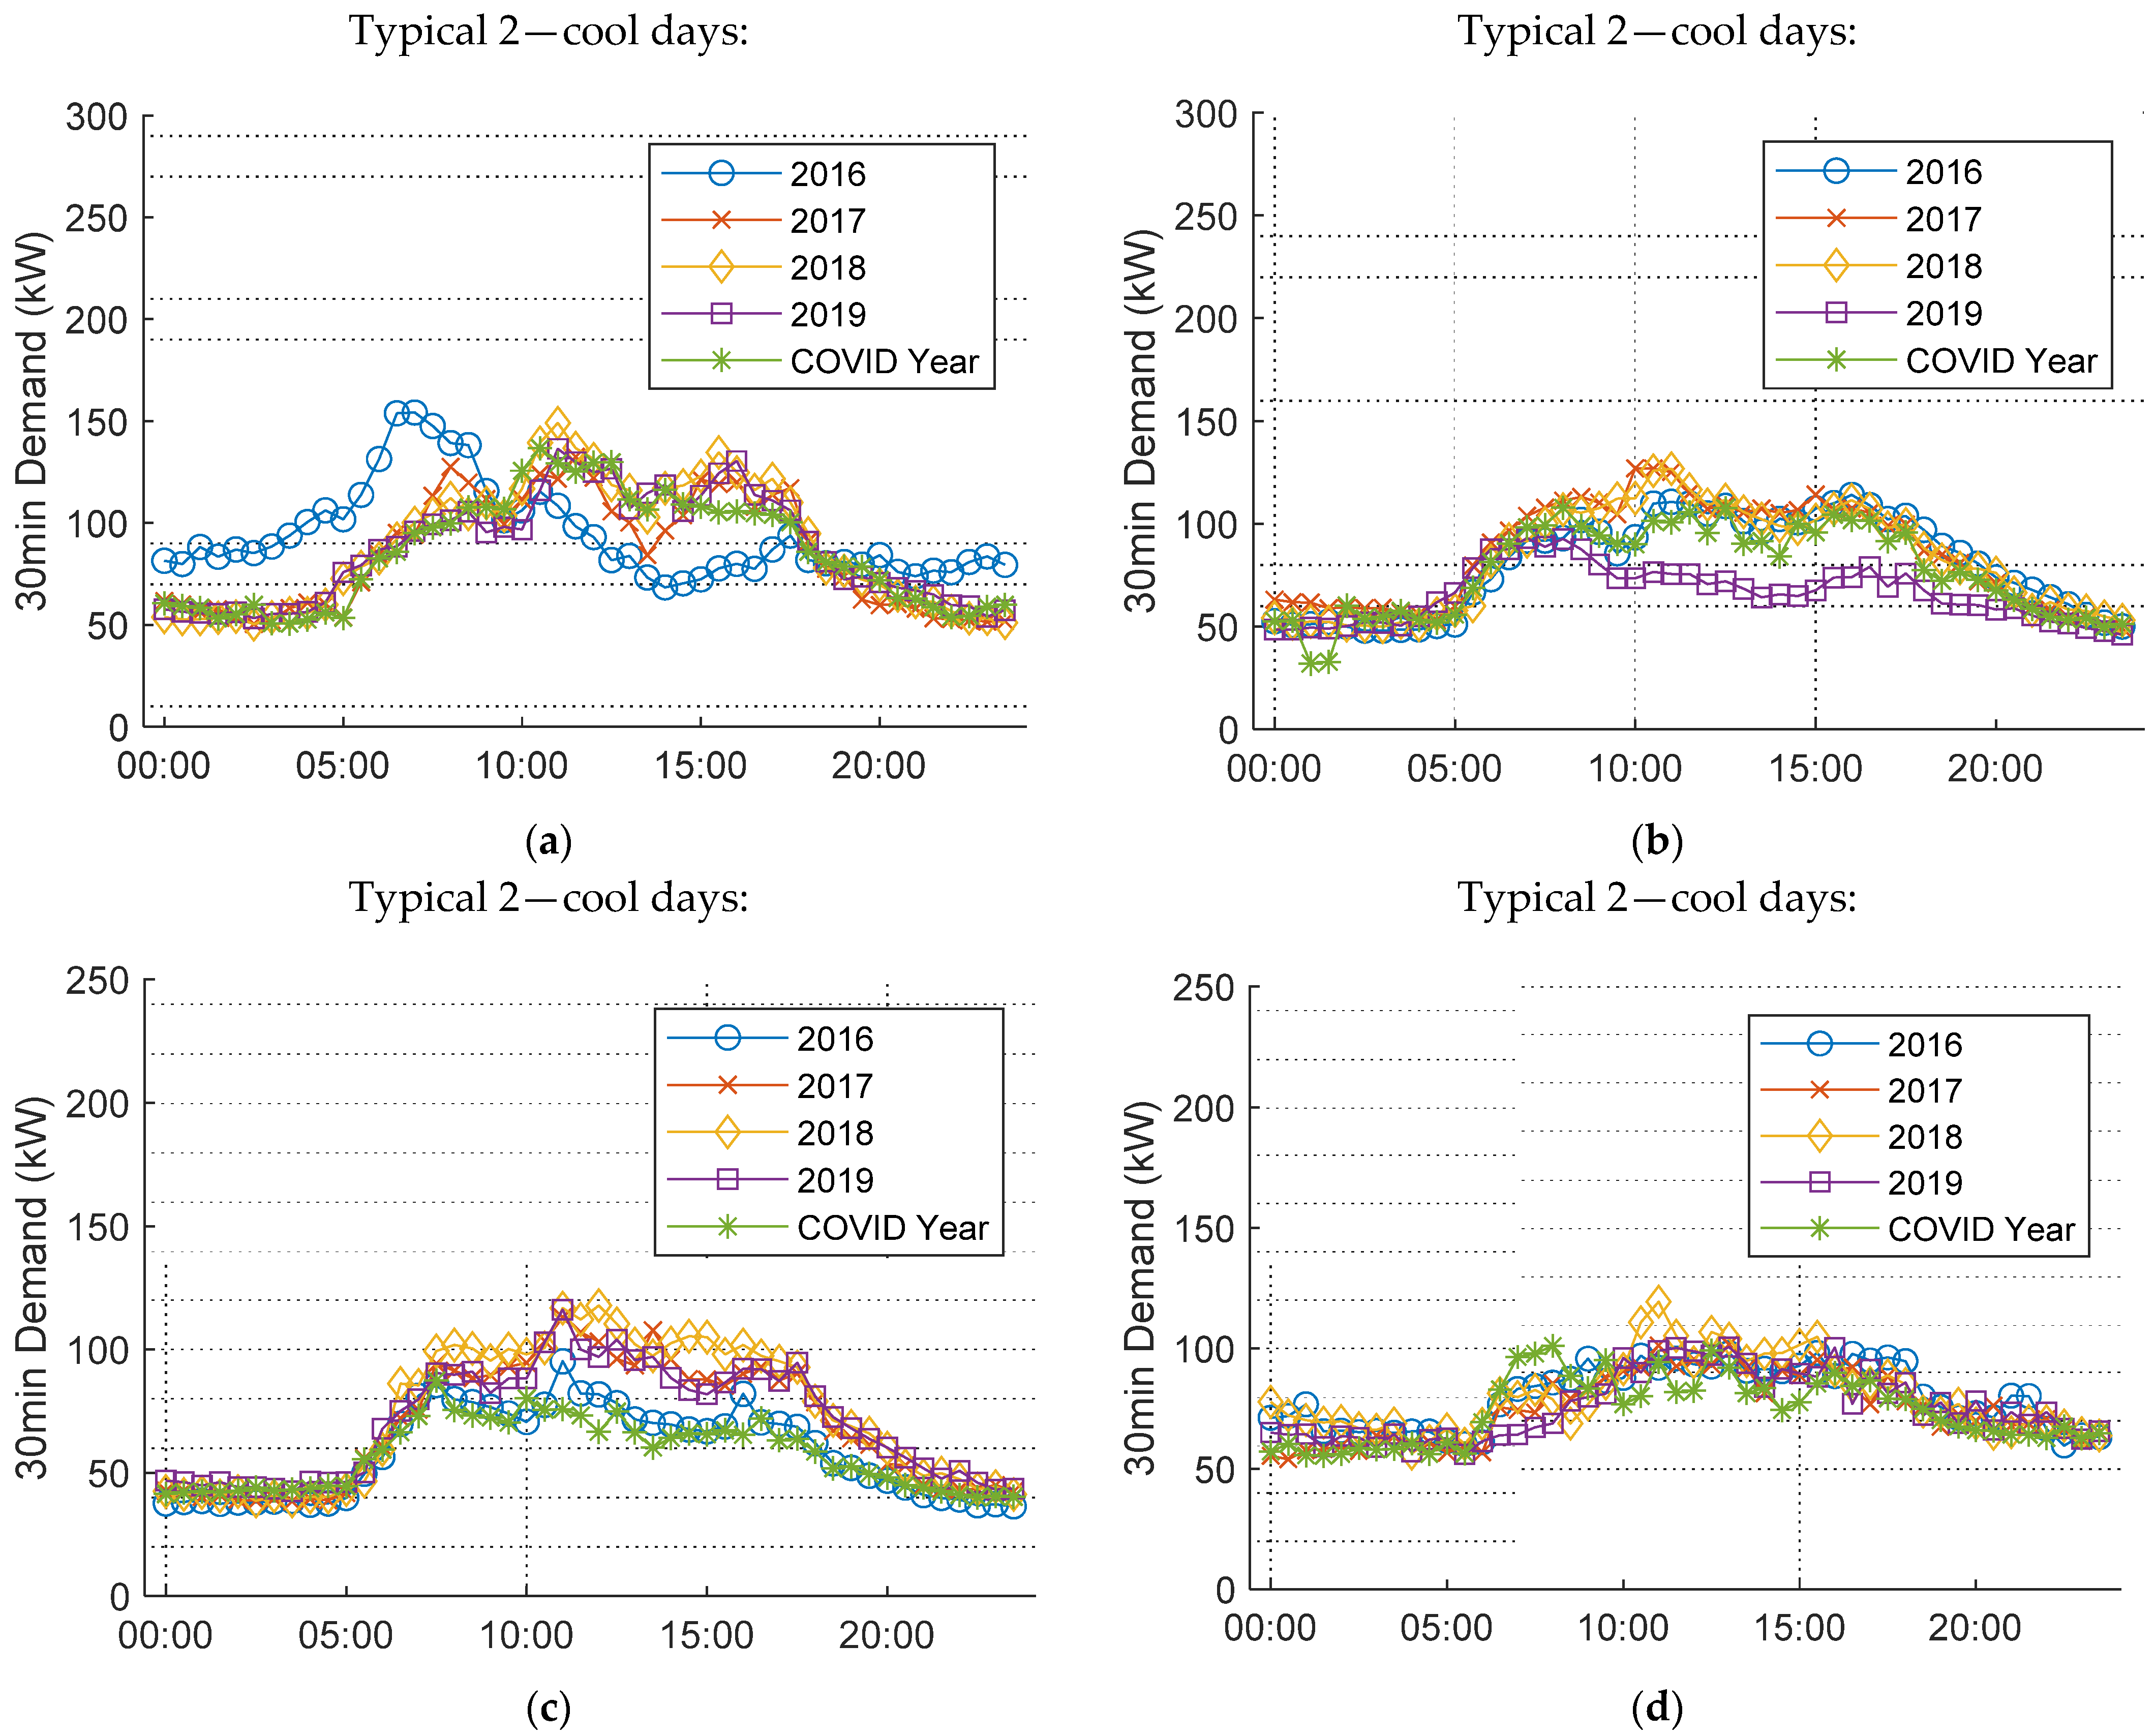
2.3. Typical Demand Profiles

To identify typical demand profiles, Gaussian Mixture Model clustering method (GMM) is used [36,37]. Critical evaluation can be then conducted to examine changes to typical demand profiles, magnitudes of demands and peak demand timing.
GMM clustering process starts with setting up an input matrix. Demand data X = { x 1 , x 2 , ,   x 48 } is the input set to the clustering algorithm. An iterative expectation maximization algorithm (EM) is incorporated in GMM [38,39]. An EM has two steps: expectation step (E step) and maximization step (M step).
In an E step, Equation (1) calculates posterior probabilities γ j k based on ω k (model weights), μ k (mean) and Σ k (covariance). Nomenclature have been included at the end of the paper.
γ j k = ω k ϕ k ( x | μ k , Σ k ) k = 1 K ω k ϕ ( x | μ k , Σ k )
Note ω k ( 0 , 1 ) and k = 1 K ω k = 1 .
In an M step, weights, mean and covariance are updated with the previous E step posterior probabilities using Equations (2) to (4):
ω k = ϕ k N
μ k = 1 ϕ k j = 1 N γ j k x n
Σ k = 1 ϕ k j = 1 N γ j k ( x n μ k ) ( x n μ k ) T
Iteration runs through the E step and the M step until a convergence is obtained without modifications to GMM configurations.
Equations (5) to (7) are GMM clustering results. In the next step, μ k , the mean values are used to find typical profiles.
ψ ( x ) = k = 1 K ω k ϕ k ( x | μ k , Σ k )
ϕ k ( x | μ k , Σ k ) = ( 2 π ) d 2 | Σ k | 1 2 exp { 1 2 ( x μ k ) T Σ k 1 ( x μ k ) }
k = 1 K ω k = 1
Equation (8) is used in identifying typical profiles C k . Cluster k ’s centroid values are μ k . Observations are x j . The percentages of clusters within a dataset are   λ k .
C k = x j , λ k = ω k Subject   to : min ( | x j μ k | ) ,     j   ,   k   ( 1 , K )
C k are identified when a minimum distance exists between x j and μ k . Index j is a positive integer, and its value is between 1 and the size of cluster k. Index k is another positive integer being between 1 and K (the number of clusters).

2.4. Energy Key Performance Indicators

With the knowledge of the previous summary statistics and clustering analysis, a range of energy key performance indicators can be studied for case communities [7,8,27,28], such as site maximum peak demand in a year (kW), site electricity use per bed per day (kWh/bed/day), energy use per bed per cooling degree day (kWh/bed/CDD) and energy use per bed per heating degree day (kWh/bed/HDD).
The selection of energy KPI per CDD or per HDD may depend on seasons or climates. For example, energy KPI per CDD may be meaningful for tropical or sub-tropical regions with dominant cooling needs. When energy use is normalized to a per bed or per degree day level, a fairer energy KPI comparison among sites may become feasible (more details are in Section 3.3).

3. Case Study Results and Discussion
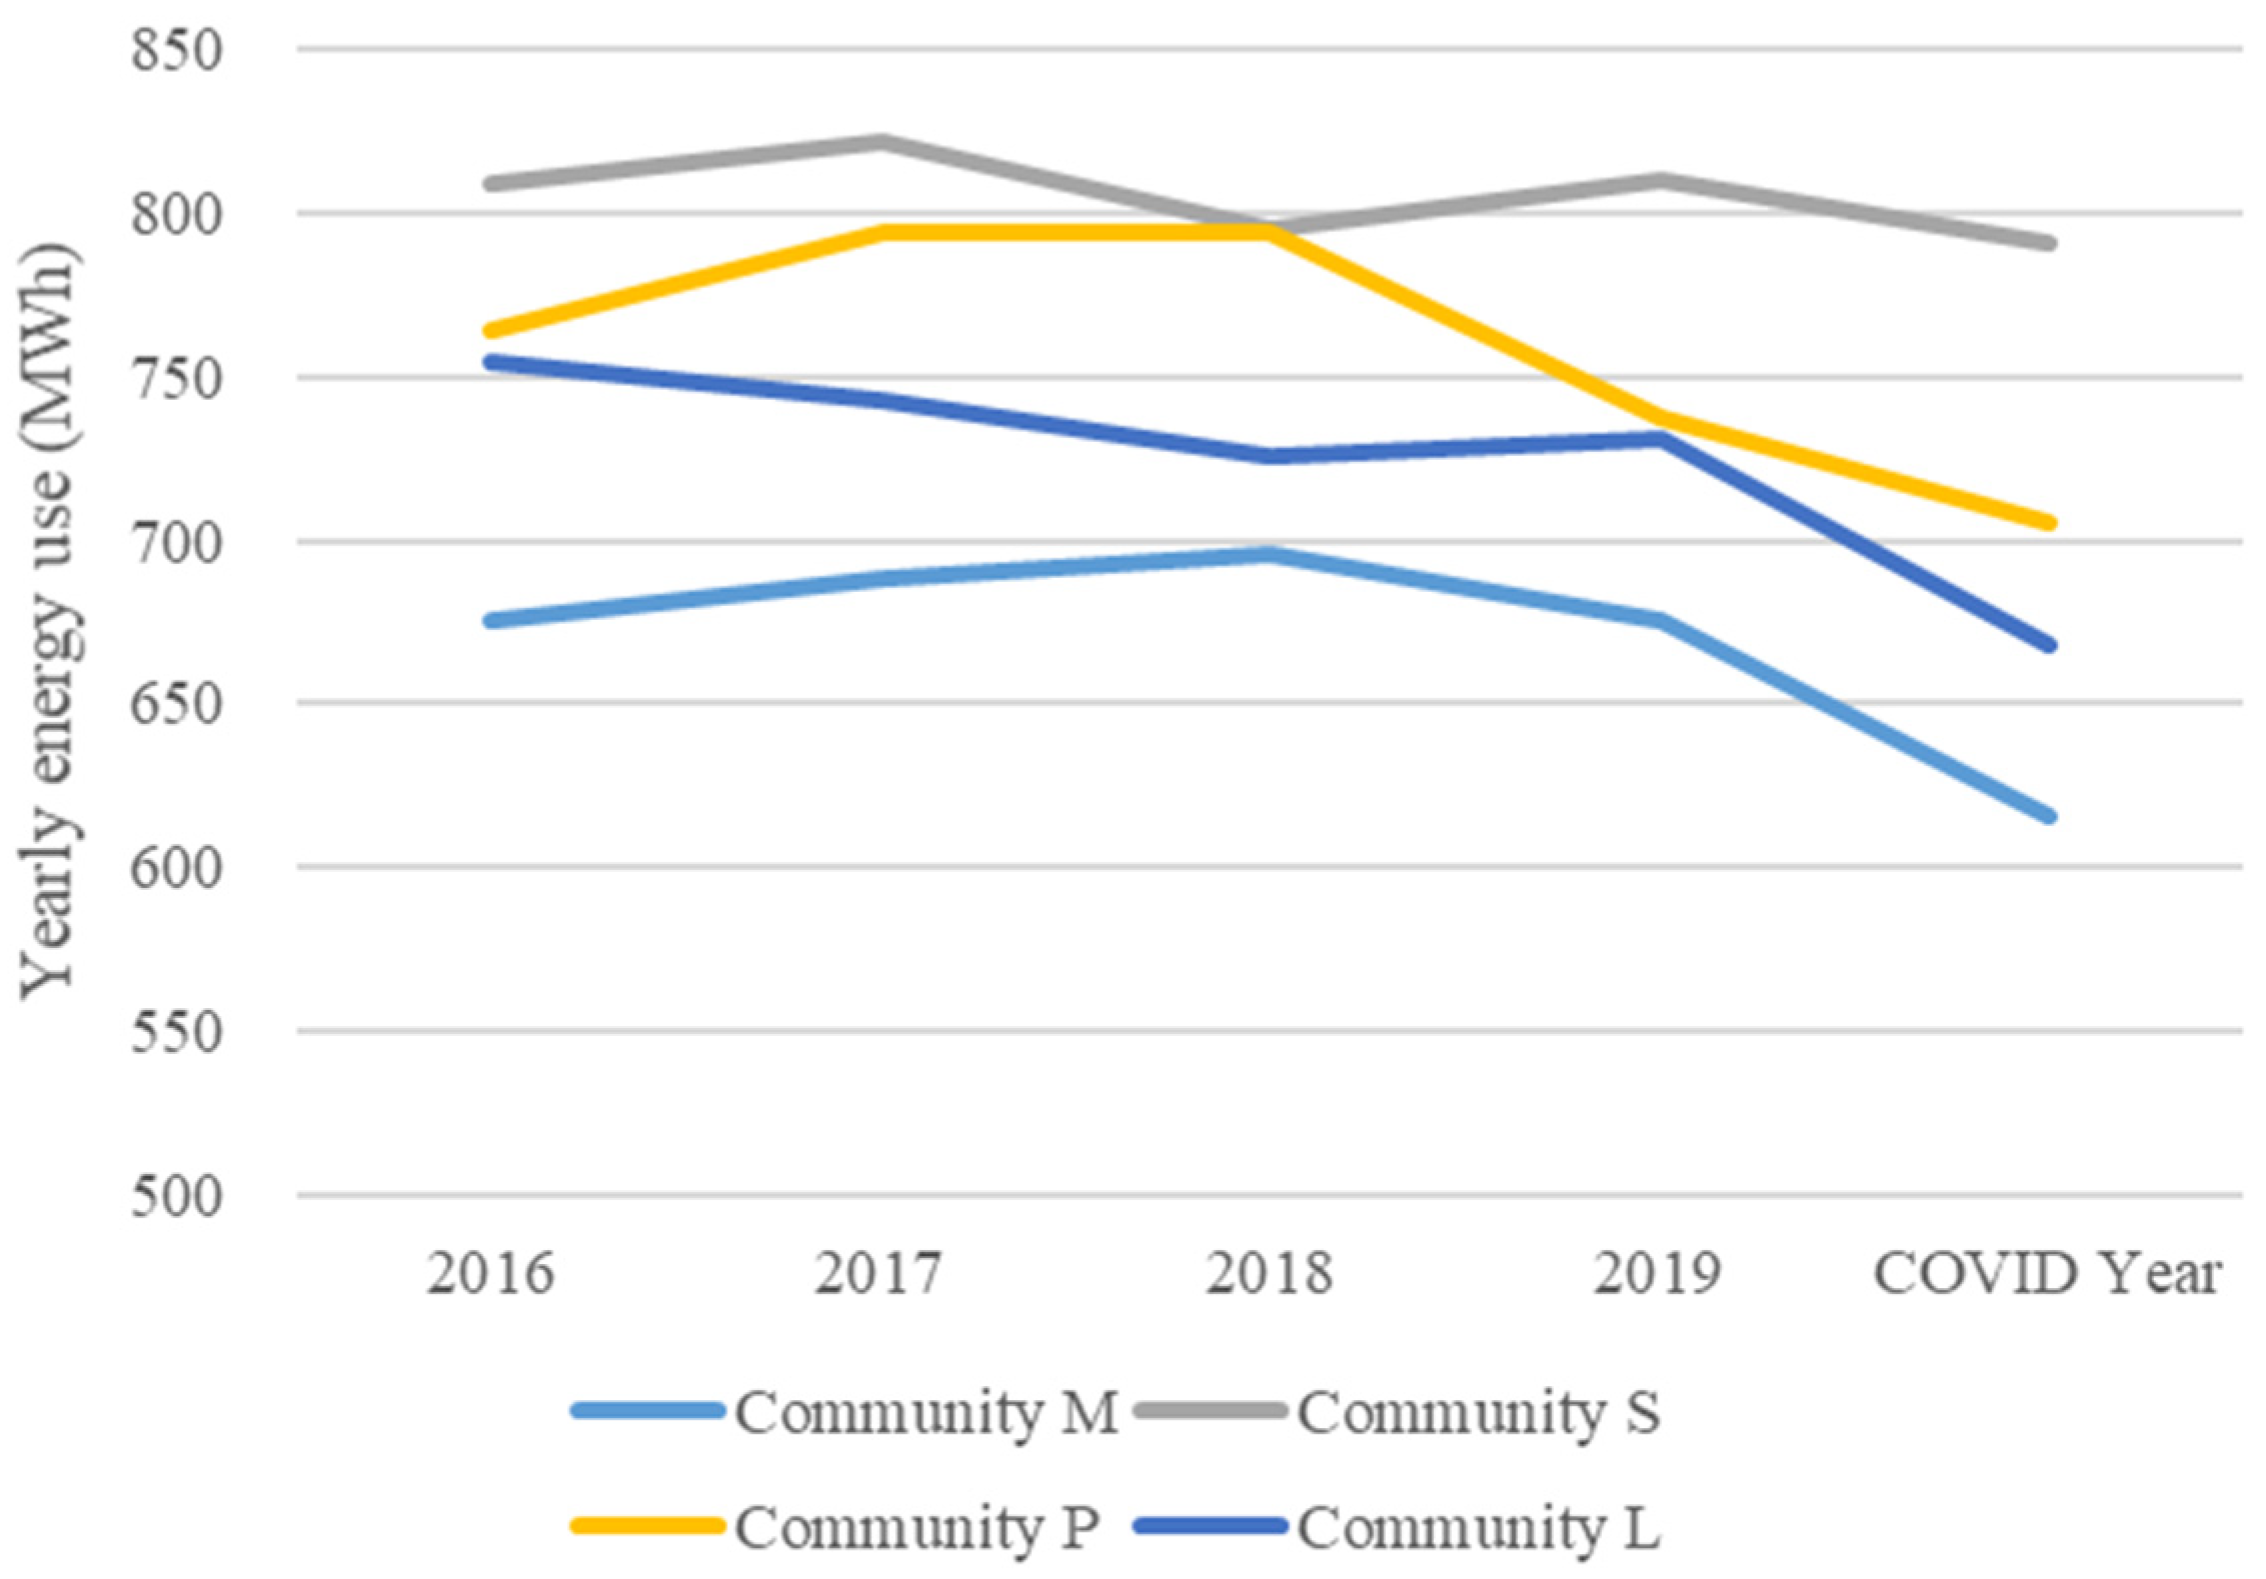
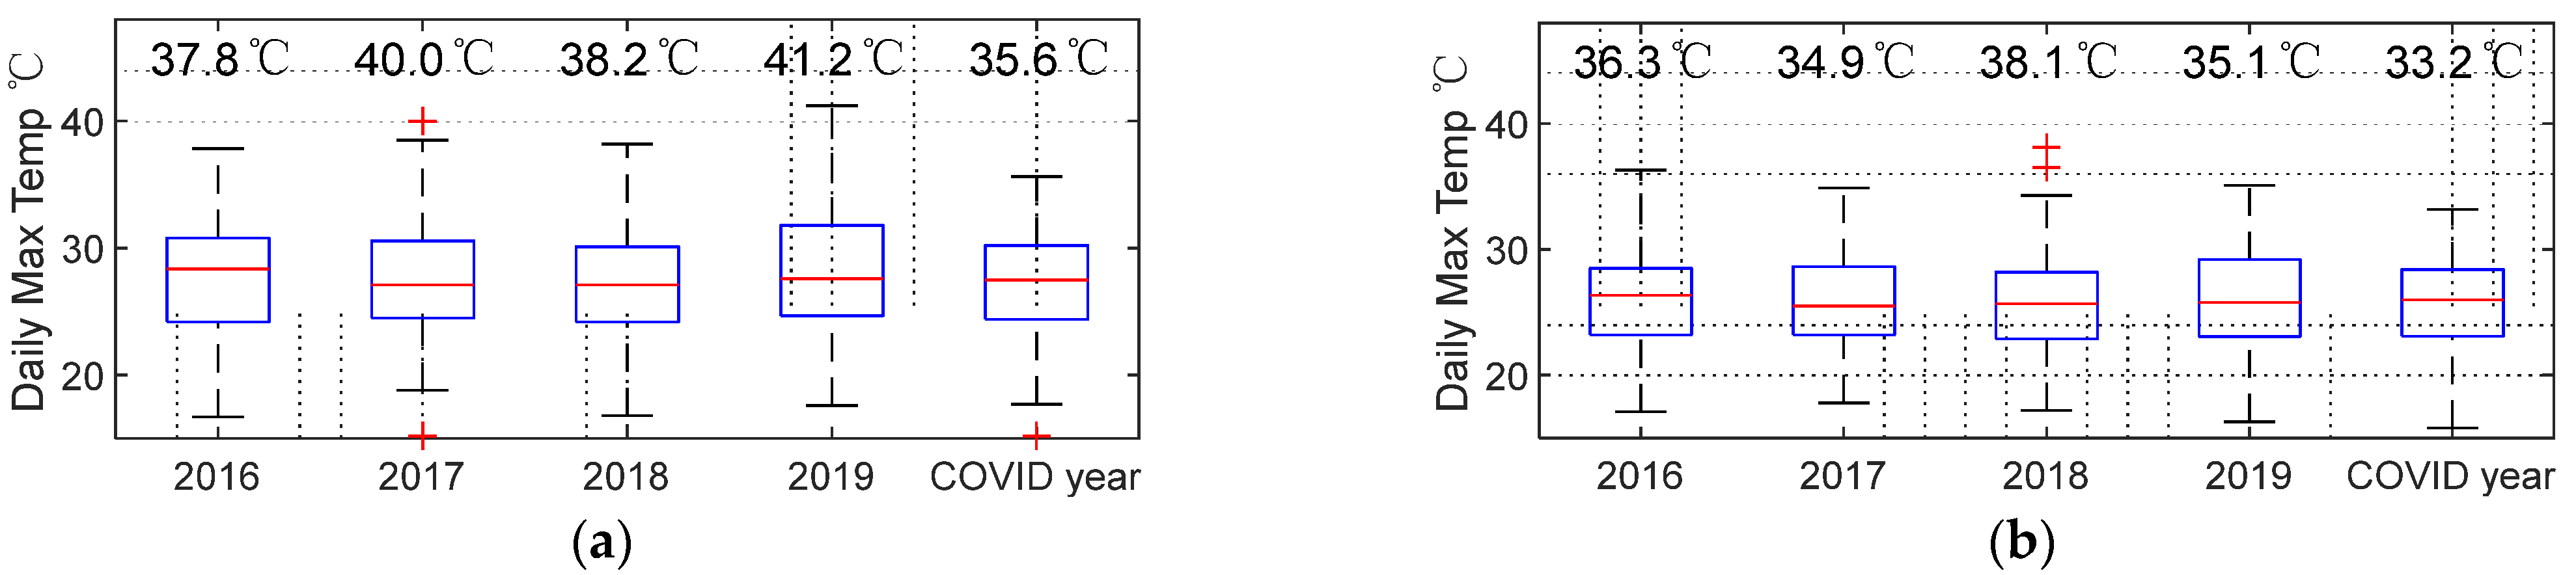
This section presents, in order, the results of the yearly changes, the typical demand profiles and the analysis of energy KPIs.

3.1. Yearly Changes

The yearly energy use of each case study RAC is summarized in Table 2 and depicted in Figure 3. Overall, the total energy use in the COVID-19 year tends to be lower than the previous years, with mean reductions ranging from 2.3% to 10.0%.
Peak demands for those community cases are presented in Table 3, showing peak demand reductions ranging from 3% to 12%. The peak demands measured in the COVID-19 year were the lowest on record for these facilities.
The literature reports that energy use and peak demands are often highly correlated with outdoor ambient temperature [40,41,42]; therefore, the temperature distribution was also studied for the same duration.
Figure 4 shows the ambient daily maximum temperature boxplots for the case studies. All years’ highest daily maximum temperatures are shown on the top of each boxplot. Red crosses above the top whiskers of boxplots or below the bottom whiskers of boxplots are outliers. Red horizontal lines inside boxplots are the medium values.
Community S, P and L share the same temperature observation datasets and Community M uses temperature data from another government observation station [43]. For Community S, P and L, the COVID-19 year’s maximum temperature had been 2.2 to 5.2 ℃ lower than the previous years. For Community M, the COVID-19 year’s maximum temperature had been 1.7 to 4.9 ℃ lower than the previous years. There is also a change of upper end temperature distribution which may be a significant factor for the general downward trend in the COVID-19 year’s energy use (Table 2).
For both temperature plots in Figure 4, 2016 had the highest median daily maximum temperatures (the red line in the middle of each boxplot). From 2017 to the COVID-19 year, the median daily maximum temperatures remained relatively stable.
Another potential reason for the variation in case communities’ yearly energy use and peak demands is occupancy change. Table 4 shows 3 to 9% decreases in occupancy; however, those changes are not in portion with communities’ yearly energy use change (in Table 2). For example, Community S had the highest percentage reduction in occupancy, but the lowest percentage reduction in energy use and peak demand. These results are consistent with another separate analysis into the correlation between occupancy and RACs’ total energy use that revealed that occupancy may not be a significant influencing factor, but that temperature is highly correlated with RACs’ electrical energy use across climate zones [44]. This is likely because space conditioning is typically the highest energy service in these facilities.
Boxplots for daily peak demands and daily energy uses are presented in Figure 5. These boxplots, for each of the four RACs, show that medium peak demand values are relatively stable across all years, but that maximum peak demand values dropped slightly in the COVID-19 year. In terms of daily energy use, all communities, except Community S, had lower maximum daily energy use and smaller energy use variance in the COVID-19 year compared with the previous years.
After getting an overview of how those communities used energy in the COVID-19 year compared with the previous years, the next section presents findings on typical demand profiles across those years.

3.2. Typical Demand Profiles

To show how typically energy use had been changed in the COVID-19 year, a clustering algorithm (Section 2.3) has been applied to the case studies to identify typical demand profiles over these years. Though running the algorithm, two typical profiles have been automatically identified to present daily energy use magnitudes and timing for each year: warm days’ typical demand profiles (Figure 6) and cool days’ typical demand profiles (Figure 7).
For warm days’ typical profiles, the magnitude of the demand profile in the COVID-19 year is lower than previous years for Communities M and L and similar to the 2019 magnitude for Community P. The magnitude of the demand profile for Community S was similar to that of the previous 3 years (2017–2019) but higher than 2016. The timing of the peak demand is similar across all years for each community.
For cool days’ typical profiles, daytime energy use magnitudes were mostly lower for Community M. Similarly, Community P had lower daytime demand on cool days compared with its previous years, except in comparison with 2019. For Community L’s typical demand profile on cool days, the morning peak demands appeared higher than the previous years.

3.3. Energy Key Performance Indicators
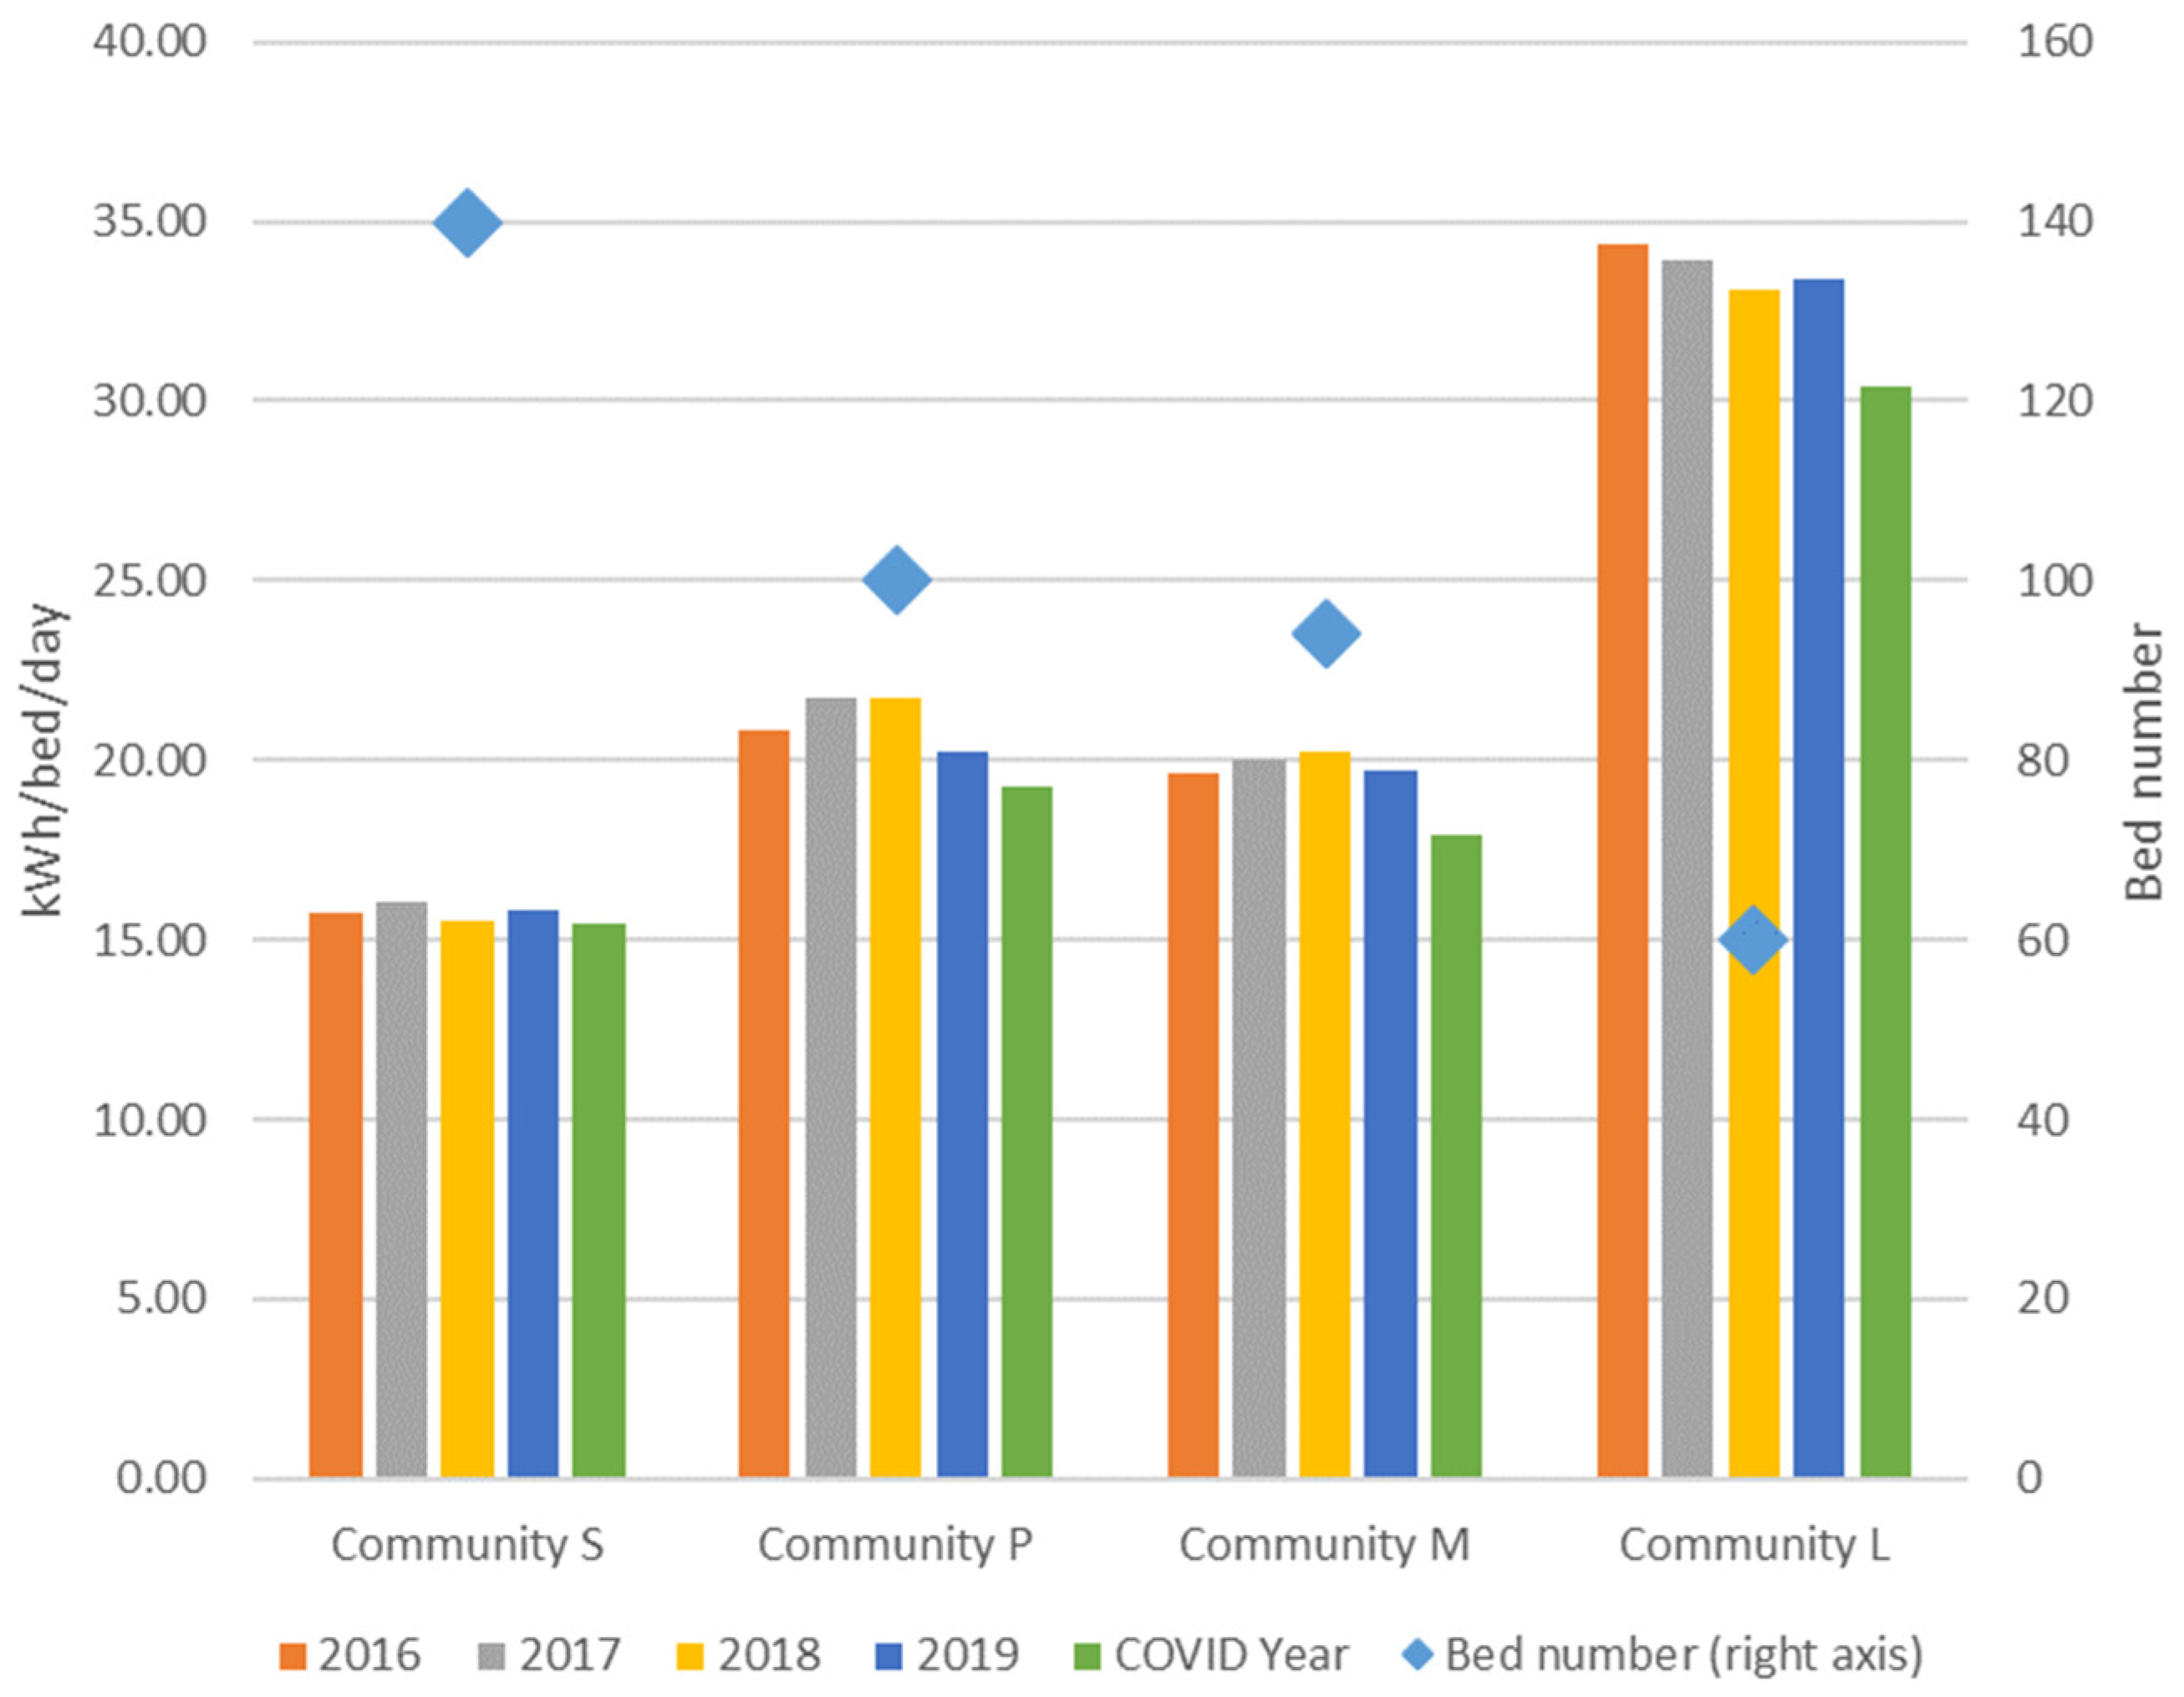
Site total energy use (in kWh) and peak demand (in kW) have been discussed in previous Section 3.1. This section evaluates the benefits and limitations of using more nuanced energy KPIs.

3.3.1. kWh/Bed/Day

Case study RAC electricity use per bed per day is depicted with bar charts in Figure 8. Bed numbers are indicated on the right axis and shown with blue diamond shapes. The graphs clearly show that the COVID-19 year had a lower kWh/bed/year and that the reduction is consistent with the yearly energy use data shown in Table 2 in Section 3.1.
This KPI is beneficial in that it shows the impacts of economy of scale: higher bed numbers seem to indicate lower energy use per bed (each bed means a private bedroom in these communities). It is feasible to assume that this may be because there are a number of shared common spaces within a RAC that are required for operational and care provision purposes, regardless of the total number of beds. Another advantage of this KPI is that it is relatively easy to obtain the data needed to calculate this KPI. For example, aged care and hospitals across all jurisdictions of Australia can provide the bed numbers in a consistent manner.
The limitation of this KPI, however, is that KPI does not enable detailed evaluation of the energy efficiency of the site, its systems and services. It does not allow for “like to like” comparison to enable benchmarking of energy efficiency performance. Another aspect is that this KPI is not relevant to climate conditions and a need may come up to have other KPIs in relation to climate conditions, such as energy use per bed per cooling degree days or heating degree days (kWh/bed/CDD or kWh/bed/HDD).

3.3.2. kWh/Bed/CDD24

A different picture comes up when the KPI energy uses per bed per cooling degree day (kWh/bed/CDD24) is used. Cooling Degree Days (CDD) are examined because cooling is the dominant space conditioning need for the case study’s climate zone (Zone 2—warm, humid summer and mild winter [33]). Heating is rarely needed for the case study, so energy use per bed per heating degree day (HDD) is not provided here. This HDD-related energy use KPI can be a future research topic for studying RACs in cooler climate zones. The base 24 ℃ is used because it is a recommended value by the Australian Bureau of Meteorology [45] and is a more suitable cooling setting for the demographics, rather than commonly used 21 to 23 ℃ space cooling setting in commercial buildings.
Despite the RACs’ yearly energy reduction in the COVID-19 year (Table 2), Table 5 shows that the kWh/bed/CDD24 actually increased (1.03% to 11.39%) for three of the RACs.
To find out why the kWh/bed/CDD24 increased for three communities, further critical analysis is conducted to understand how this KPI is calculated and what are the potential factors for the increase. The KPI is calculated with a site total energy use divided by its bed number and divided by the number of CDD24. An increase in the KPI may be because of an increase in the site total energy use, a decrease in the bed number or a decrease in CDD24 (or a combination of these factors).
There is a decrease in the case communities’ total energy use, and the bed number remained stable for these case RACs. Then, the only possible factor for the increase in kWh/bed/CDD24 is the CDD24 values. CDD24 is calculated based on temperature datasets and 24 °C.
When all years of data are considered as shown in the first and second row of Table 6, Pearson Correlation Coefficients show that the mean daily energy use of these four RACs is highly correlated with mean daily maximum temperature in each month. If the COVID-19 year energy and temperature data are taken out and studied separately, as shown on the third and fourth row of Table 6, temperature remains as a significant factor for energy use.
As such, the reduction of yearly energy use shown in Table 2 is largely correlated with a reduction in temperature (shown in Figure 4) in the COVID summer months that has been attributed to La Niña’s impacts on Eastern Australia from September 2020 to March 2021 [46].
The increase in kWh/bed/CDD24 is most likely because the reduction in RACs’ yearly energy use was less than the reduction in the CDD24 numbers. As shown in Table 7, the CDD24 values dropped over 14% for Community S, P and L and nearly 9% for Community M, compared with reductions in annual energy use ranging between 2.3% and 10% (Table 2).
The benefits of using this KPI include that it contains healthcare service provision in calculation. By using ambient temperature to calculate CDD or HDD, this KPI enables an examination on how healthcare buildings are responding to climate conditions. Then, the KPI can enable a comparison among sites for healthcare energy use in relationship to climate conditions, or a comparison for a community itself over years to see how a community’s energy use changed in different years of varied climate conditions.
The limitation of these KPIs is that it needs more customization when the KPI is applied to specific sites due to climatic differences and needs in space cooling or heating. Furthermore, the base temperature values for CDD or HDD need to be carefully selected to reflect site situation. There are examples or recommended base values from standards or government bodies [45,47,48,49]. Another issue is that the KPI may not be reliable or robust for sites in temperate climate zones or mild seasons [10]. Because CDD (or HDD) values can be small for RACs in temperate climate zones or in mild seasons, a minor change in energy use for RACs in temperate climate zones or mild seasons may lead to significant increase or decrease for the KPI.

3.3.3. Discussion of Energy KPIs

Air conditioning is often the largest energy user and a significant asset for healthcare and commercial or public buildings [50,51,52]. Critical evaluation of the two KPIs (kWh/bed/day and kWh/bed/CDD24) reveals that those healthcare buildings could become more responsive to the reduced needs of space cooling if those buildings are designed with more energy-efficient and resilient features, such as natural ventilation [53] and better operation strategies [54].
Table 8 summarizes the benefits and limitations for the few energy KPIs studied in the previous sections. Easiness in data acquisition can be a quite common advantage for using annual energy use, annual peak demand and daily energy use. However, those KPIs are not related to healthcare service delivery nor related to climate conditions. On the other side, kWh/bed/day and kWh/bed/CDD are related to healthcare service delivery with bed numbers in calculation. kWh/bed/CDD is further dependent on climate conditions and can be more useful in revealing energy efficiency opportunities.
For analyzing energy performance of aged care communities, a combination of these KPIs can be helpful. However, none of these KPIs still allow for comparison to establish healthcare industry benchmarks of best practice, and none relate to the service levels provided or to the healthcare plan for the residents. Further research is planned to fill the gaps.

4. Conclusions

Energy is an essential service for our industries, businesses and societies [55]. Investigation into aged care energy use and peak demand changes during the COVID-19 pandemic, hence, is critical, particularly given the vulnerable groups such as people residing in aged care facilities.
A previous study identified a general downward trend for subtropical aged care communities’ energy use and power demand under the first sCOVID-19 lockdown in 2020 [10]. This research has extended the energy use and peak demand study into a whole COVID-19 year and quantified energy and peak demand differences in comparison with previous years for the aged care cases. Complete yearly datasets contain seasonal and yearly differences. The analysis based on yearly datasets can be more useful in energy management decision making compared to analysis based on short periods of lockdowns.
This research has identified a general trend of reduction in case studies’ annual energy use and peak demands and discovered that the change of energy use and peak demand had been highly correlated with the temperature changes from La Niña’s impact on Eastern Australia from September 2020 to early 2021. Regardless of the pandemic’s impact, climate has been a significant factor in the energy use of aged care facilities.
A limitation of this research is that this research is based on available energy and climate data. There had been no controlled experiment in distinguishing impact from climate conditions and impact from COVID-19-related community operation guidelines.
This study confirms that climate is a significant and high-correlation factor to aged care facilities’ energy use, prior to and during the pandemic. A few key energy performance indicators’ benefits and limitations are summarized in relation to energy management decisions, climate and healthcare operation. KPIs in relation to climate conditions may help review energy efficiency and investment opportunities. Another study is on the way focusing on how energy KPIs and health are linked.

Author Contributions

Conceptualization, A.L. and W.M.; methodology, A.L.; software, W.M.; validation, A.L., W.M. and S.Z.; formal analysis, A.L. and S.Z.; investigation, A.L. and S.Z.; resources, W.M. and J.C.; data curation, J.C.; writing—original draft preparation, A.L.; writing—review and editing, T.Y. and Y.D.; visualization, A.L.; supervision, W.M.; project administration, W.M.; funding acquisition, W.M. All authors have read and agreed to the published version of the manuscript.

Funding

This research was funded by Australian Renewable Energy Agency (ARENA) Affordable Heating and Cooling Innovation Hub Project (i-Hub).

Data Availability Statement

The climate dataset is publicly available on Australian Bureau of Meteorology site: http://www.bom.gov.au/Climate (accessed on 20 June 2021). The raw data related to case study communities are proprietary. If there is an interest in collaboration, please contact the corresponding author.

Conflicts of Interest

The authors declare no conflict of interest.

Abbreviations

Acronyms:
COVID-19
Or COVID
2019 novel coronavirus [56]
CDDCooling degree days
EMExpectation maximization algorithm
EqEquation
HDDHeating degree days
GMMGaussian Mixture Model
RACResidential aged care community
(i.e., care home, nursing home)
KPIKey performance indicators
kWKilowatt
kWhKilowatt-hour
MWhMegawatt-hour
Symbols:
KNumber of clusters
kk-th mixture component
NNumber of samples
jj-th sample
dDimension number
ϕProbability density function of a component
xObservations
ψProbability density function of a mixture model
CCluster centres
λCluster percentages
ωMixture weights
ΣCovariance matrix
γPosteriori probability
μMean

References

  1. Pombo, O.; Rivela, B.; Neila, J. Life cycle thinking toward sustainable development policy-making: The case of energy retrofits. J. Clean. Prod. 2019, 206, 267–281. [Google Scholar] [CrossRef]
  2. Ingrao, C.; Messineo, A.; Beltramo, R.; Yigitcanlar, T.; Ioppolo, G. How can life cycle thinking support sustainability of buildings? Investigating life cycle assessment applications for energy efficiency and environmental performance. J. Clean. Prod. 2018, 201, 556–569. [Google Scholar] [CrossRef]
  3. Gaspari, J.; Fabbri, K.; Gabrielli, L. A study on parametric design application to hospital retrofitting for improving energy savings and comfort conditions. Buildings 2019, 9, 220. [Google Scholar] [CrossRef] [Green Version]
  4. Karliner, J.; Slotterback, S.; Boyd, R.; Ashby, B.; Steele, K. Health Care’s Climate Footprint How the Health Sector Contributes; Health Care without Harm: Reston, VA, USA.
  5. Jain, N.; Burman, E.; Stamp, S.; Shrubsole, C.; Bunn, R.; Oberman, T.; Barrett, E.; Aletta, F.; Kang, J.; Raynham, P.; et al. Building performance evaluation of a new hospital building in the UK: Balancing indoor environmental quality and energy performance. Atmosphere 2021, 12, 115. [Google Scholar] [CrossRef]
  6. Miller, W.F.; Liu, A.; Crompton, G.; Ma, Y. Healthcare Sector Energy Baseline and Key Performance Indicators; Australian Institute of Refrigeration, Air-conditioning and Heating (AIRAH): Brisbane, Australia, 2020. [Google Scholar]
  7. Office of Environment and Heritage. Energy Saver Aged-Care Toolkit; New South Wales Government: Sydney, Australia, 2014; p. 36.
  8. Vikstrom, A.; Boyle, R.; Harkness, S.; Hargraves, J.; McKinnon, A. Summary of Energy Audits (Level 2)—Aged Care Facilities; Tasmania Government: Hobart, Australia, 2015; Volume 7000.
  9. Yigitcanlar, T.; Kankanamge, N.; Inkinen, T.; Butler, L.; Preston, A.; Rezayee, M.; Gill, P.; Ostadnia, M.; Ioppolo, G.; Senevirathne, M. Pandemic vulnerability knowledge visualisation for strategic decision-making: A COVID-19 index for government response in Australia. Manag. Decis. 2021. [Google Scholar] [CrossRef]
  10. Liu, A.; Miller, W.; Crompton, G.; Zedan, S. Has COVID-19 lockdown impacted on aged care energy use and demand? Energy Build. 2021, 235, 110759. [Google Scholar] [CrossRef]
  11. IEA COVID-19 Impact on Electricity. Available online: https://www.iea.org/reports/covid-19-impact-on-electricity (accessed on 20 June 2021).
  12. Ghiani, E.; Galici, M.; Mureddu, M.; Pilo, F. Impact on Electricity Consumption and Market Pricing of Energy and Ancillary Services during Pandemic of COVID-19 in Italy. Energies 2020, 13, 3357. [Google Scholar] [CrossRef]
  13. Zhong, H.; Tan, Z.; He, Y.; Xie, L.; Kang, C. Implications of COVID-19 for the electricity industry: A comprehensive review. CSEE J. Power Energy Syst. 2020, 6, 489–495. [Google Scholar] [CrossRef]
  14. Safari, N.; Price, G.; Chung, C.Y. Comprehensive assessment of COVID-19 impact on Saskatchewan power system operations. IET Gener. Transm. Distrib. 2021, 15, 164–175. [Google Scholar] [CrossRef]
  15. Aruga, K.; Islam, M.M.; Jannat, A. Effects of COVID-19 on Indian energy consumption. Sustainability 2020, 12, 1–16. [Google Scholar] [CrossRef]
  16. Madurai Elavarasan, R.; Shafiullah, G.M.; Raju, K.; Mudgal, V.; Arif, M.T.; Jamal, T.; Subramanian, S.; Sriraja Balaguru, V.S.; Reddy, K.S.; Subramaniam, U. COVID-19: Impact analysis and recommendations for power sector operation. Appl. Energy 2020, 279, 115739. [Google Scholar] [CrossRef] [PubMed]
  17. Energy Networks Australia Commercial Down v Residential Up: COVID-19’s Electricity Impact. Available online: https://www.energynetworks.com.au/news/energy-insider/2020-energy-insider/commercial-down-v-residential-up-covid-19s-electricity-impact/ (accessed on 1 August 2020).
  18. Menneer, T.; Qi, Z.; Taylor, T.; Paterson, C.; Tu, G.; Elliott, L.R.; Morrissey, K.; Mueller, M. Changes in domestic energy and water usage during the UK covid-19 lockdown using high-resolution temporal data. Int. J. Environ. Res. Public Health 2021, 18, 6818. [Google Scholar] [CrossRef] [PubMed]
  19. Rouleau, J.; Gosselin, L. Impacts of the COVID-19 lockdown on energy consumption in a Canadian social housing building. Appl. Energy 2021, 287, 116565. [Google Scholar] [CrossRef] [PubMed]
  20. Krarti, M.; Aldubyan, M. Review analysis of COVID-19 impact on electricity demand for residential buildings. Renew. Sustain. Energy Rev. 2021, 143, 110888. [Google Scholar] [CrossRef]
  21. Wang, L.; Kubichek, R.; Zhou, X. Adaptive learning based data-driven models for predicting hourly building energy use. Energy Build. 2018, 159, 454–461. [Google Scholar] [CrossRef]
  22. Huang, Z.; Yu, H.; Peng, Z.; Zhao, M. Methods and tools for community energy planning: A review. Renew. Sustain. Energy Rev. 2015, 42, 1335–1348. [Google Scholar] [CrossRef]
  23. Gianniou, P.; Liu, X.; Heller, A.; Nielsen, P.S.; Rode, C. Clustering-based analysis for residential district heating data. Energy Convers. Manag. 2018, 165, 840–850. [Google Scholar] [CrossRef]
  24. Liu, L.; Ledwich, G.; Miller, W. Single Household Domestic Water Heater Design and Control Utilising PV Energy: The Untapped Energy Storage Solution. In Proceedings of the IEEE Power Energy Society Asia-Pacific Power and Energy Engineering Conference (APPEEC); Modi, N., Mishra, Y., Eds.; IEEE Xplore: Brisbane, Australia, 2016; pp. 1–5. [Google Scholar]
  25. Liu, A.; Ledwich, G.; Miller, W.; Cholette, M.E. A New Multi-dimension Clustering-based Method for Planning Sustainable Energy Investment. In Proceedings of the 1st Asia Pacific Conference on Sustainable Development of Energy, Water and Environment Systems, Gold Coast, Australia, 6 April 2020; pp. 1–14. [Google Scholar]
  26. Brown, L.H.; Buettner, P.G.; Canyon, D. V The energy burden and environmental impact of health services. Am. J. Public Health 2012, 102, e76–e82. [Google Scholar] [CrossRef]
  27. Liu, A.; Crompton, G.; Miller, W. Principles to Define Energy Key Performance Indicators for the Healthcare Sector. In Proceedings of the Smart Grid and Energy System Conference; Wen, F., Shahnia, F., Eds.; IEEE Xplore: Perth, Australia, 2021. [Google Scholar]
  28. Miller, W.; Vine, D.; Amin, Z. Energy efficiency of housing for older citizens: Does it matter? Energy Policy 2017, 101, 216–224. [Google Scholar] [CrossRef] [Green Version]
  29. Fonseca, P.; Esteves, P.; Marques, L.; Anibal, A. Analysis of Total Energy Consumption in 100 Care Homes for Elderly; University of Coimbra: Coimbra, Portugal, 2011. [Google Scholar]
  30. Li, H.; Hong, T.; Lee, S.; Sofos, M. System-level key performance indicators for building performance evaluation. Energy Build. 2020, 209, 109703. [Google Scholar] [CrossRef] [Green Version]
  31. Xia, B.; Buys, L.; Yigitcanlar, T. Sustainable urban development for older Australians: Understanding the formation of naturally occurring retirement communities in the greater Brisbane region. Sustainability 2021, 13, 9853. [Google Scholar] [CrossRef]
  32. Xia, B.; E, J.; Chen, Q.; Buys, L.; Yigitcanlar, T.; Susilawati, C. Understanding spatial distribution of retirement villages: An analysis of the greater Brisbane region. Urban Sci. 2021, 5, 89. [Google Scholar] [CrossRef]
  33. The Australian Building Codes Board. National Construction Code Volume One (Legislation); The Australian Building Codes Board (ABCB): Canberra, Australia, 2013; p. 616.
  34. Queensland Government Chief Health Officer. Residential Aged care Direction—Department of Health Legislation, Queensland Government; Queensland Government: Brisbane, Australia, 2021.
  35. Wang, Y.; Chen, Q.; Hong, T.; Kang, C. Review of Smart Meter Data Analytics: Applications, Methodologies and Challenges. IEEE Trans. Smart Grid 2018, 10, 3125–3148. [Google Scholar] [CrossRef] [Green Version]
  36. Liu, A.; Miller, W.; Cholette, M.E.; Ledwich, G.; Crompton, G.; Li, Y. A Multi-dimension Clustering-based Method for Renewable Energy Investment Planning. Renew. Energy 2021, 172, 651–666. [Google Scholar] [CrossRef]
  37. Li, K.; Ma, Z.; Robinson, D.; Ma, J. Identification of typical building daily electricity usage profiles using Gaussian mixture model-based clustering and hierarchical clustering. Appl. Energy 2018, 231, 331–342. [Google Scholar] [CrossRef]
  38. Lu, Y.; Tian, Z.; Peng, P.; Niu, J.; Li, W.; Zhang, H. GMM clustering for heating load patterns in-depth identification and prediction model accuracy improvement of district heating system. Energy Build. 2019, 190, 49–60. [Google Scholar] [CrossRef]
  39. McLachlan, G.J.; Peel, D. Finite Mixture Models; John Wiley & Sons: Hoboken, NJ, USA, 2004. [Google Scholar]
  40. Huang, Y.; Niu, J.L.; Chung, T.M. Study on performance of energy-efficient retrofitting measures on commercial building external walls in cooling-dominant cities. Appl. Energy 2013, 103, 97–108. [Google Scholar] [CrossRef]
  41. Chen, X.; Yang, H.; Wang, T. Developing a robust assessment system for the passive design approach in the green building rating scheme of Hong Kong. J. Clean. Prod. 2017, 153, 176–194. [Google Scholar] [CrossRef]
  42. Mihalakakou, G.; Santamouris, M.; Tsangrassoulis, A. On the energy consumption in residential buildings. Energy Build. 2002, 34, 727–736. [Google Scholar] [CrossRef]
  43. Bureau of Meterology Climate Data Online. Available online: http://www.bom.gov.au/climate/data/ (accessed on 15 June 2021).
  44. Liu, A.; Miller, W.; Chiou, J.; Zedan, S.; Chen, X.; Susilawati, C. How is occupancy related to energy use in healthcare buildings? In Proceedings of the 10th IEEE PES Innovative Smart Grid Technologies Conference—Asia; Saha, T.K., Ed.; IEEE: Brisbane, Australia, 2021. [Google Scholar]
  45. Australian Bureau of Meteorology Heating and Cooling Degree Days Documentation. Available online: http://www.bom.gov.au/climate/map/heating-cooling-degree-days/documentation.shtml (accessed on 1 August 2020).
  46. Bureau of Meteorology ENSO Outlook—LA NIÑA Likely to Peak during Summer 2020–2021. Available online: http://www.bom.gov.au/climate/enso/outlook/archive/20201208.archive.shtml#tabs=Outlook (accessed on 25 June 2021).
  47. ASHRAE Standard 90.1 Energy Standard for Buildings Except Low-Rise Residential Buildings; American Society of Heating, Refrigerating and Air-Conditioning Engineers (ASHRAE): Chicago, IL, USA, 2019.
  48. Ma, Y.; Miller, W.; Saha, S.; Guan, L. Comparison of building energy codes in Australia, United States and China for Australian commercial building energy conservation. Ecolibrium 2018, 17, 80–88. [Google Scholar]
  49. Laustsen, J. Energy Efficiency Requirements in Building Codes, Energy Efficiency Policies for New Buildings; International Energy Agency (IEA): Paris, France, 2008; pp. 66–69. [Google Scholar]
  50. Liu, L.; Miller, W.; Ledwich, G.; Liu, A.; Miller, W.; Ledwich, G. Community Centre Improvement to Reduce Air Conditioning Peak Demand. In Proceedings of the 7th International Conference on Energy and Environment of Residential Buildings; Miller, W., Connie, S., Manley, K., Eds.; QUT: Brisbane, Australia, 2016; pp. 279–288. [Google Scholar]
  51. Miller, W.; Machard, A.A.; Bozonnet, E.; Yoon, N.; Qi, D.; Zhang, C.; Liu, A.; Sengupta, A.; Akander, J.; Hayati, A.; et al. Conceptualising a resilient cooling system: A socio-technical approach. City Environ. Interact. 2021, 11, 100065. [Google Scholar] [CrossRef]
  52. Zheng, W.; Hu, J.; Wang, Z.; Li, J.; Fu, Z.; Li, H.; Jurasz, J.; Chou, S.K.; Yan, J. COVID-19 Impact on Operation and Energy Consumption of Heating, Ventilation and Air-Conditioning (HVAC) Systems. Adv. Appl. Energy 2021, 3, 100040. [Google Scholar] [CrossRef]
  53. Sun, K.; Specian, M.; Hong, T. Nexus of thermal resilience and energy efficiency in buildings: A case study of a nursing home. Build. Environ. 2020, 177, 106842. [Google Scholar] [CrossRef]
  54. Li, Y.; Vilathgamuwa, D.M.; Choi, S.S.; Farrell, T.W.; Tran, N.T.; Teague, J. Nonlinear Model Predictive Control of Photovoltaic-Battery System for Short-Term Power Dispatch. In Proceedings of the IECON 2018—44th Annual Conference of the IEEE Industrial Electronics Society; Manic, M., Al-Haddad, K., Chow, M.-Y., Eds.; IEEE Xplore: Washington, DC, USA, 2018; pp. 1884–1889. [Google Scholar]
  55. Lantz, T.L.; Ioppolo, G.; Yigitcanlar, T.; Arbolino, R. Understanding the correlation between energy transition and urbanization. Environ. Innov. Soc. Transit. 2021, 40, 73–86. [Google Scholar] [CrossRef]
  56. Bender, L. UNICEF WHO IFRC Key Messages and Actions for Prevention and Control in Schools; World Health Organisation: New York, NY, USA, 2020. [Google Scholar]
Figure 1. Research method flow chart.
Buildings 11 00570 g001
Figure 2. Timing of lockdowns and restriction levels. Level 0: pre-COVID-19; 1: caution; 2: intermediate; 3: lockdown.
Buildings 11 00570 g002
Figure 3. Four communities’ yearly energy use in MWh.
Buildings 11 00570 g003
Figure 4. Daily maximum temperature distribution across sites and years. (a) Temperature for Community S, P, L; (b) Temperature for Community M.
Buildings 11 00570 g004
Figure 5. Daily energy use and peak demands comparisons across 5 years; (a) Community S; (b) Community P; (c) Community M; (d) Community L.
Buildings 11 00570 g005
Figure 6. Warm days’ typical demand profiles. (a) Community S; (b) Community P; (c) Community M; (d) Community L.
Buildings 11 00570 g006
Figure 7. Cool days’ typical demand profiles. (a) Community S; (b) Community P; (c) Community M; (d) Community L.
Buildings 11 00570 g007
Figure 8. Energy KPI: kWh/bed/day comparisons.
Buildings 11 00570 g008
Table 1. RAC community case studies.
No.CommunitiesClimateNumber of Beds
(2020)
BuildingDemographics
1Community S
  • Warm humid summer, mild winter (Zone 2)
  • In Southeast Queensland region
  • From 3 local government areas (18,821 km2 area with 3.07 million people)
140
  • Single-floor buildings
  • Private en suites
  • Central air conditioning for shared spaces
  • Similar medical/support equipment
  • Similar demographic
  • Typical mean age of residents is 75 and above
2Community P100
3Community L94
4Community M60
Table 2. Yearly energy use in MWh.
YearCommunity SCommunity PCommunity LCommunity M
2016 (MWh)809764755676
2017 (MWh)821794743688
2018 (MWh)795794725695
2019 (MWh)810738731676
COVID-19 year (MWh)791705668615
COVID-19 year vs previous 4-year mean−2.26%−8.70%−9.55%−9.97%
Table 3. Maximum peak demands over years (kW).
Yearly Peak DemandCommunity SCommunity PCommunity LCommunity M
2016 (kW)252254206213
2017 (kW)244289201210
2018 (kW)246263196215
2019 (kW)244246195199
COVID-19 year (kW)239232186194
COVID-19 year vs previous 4-year mean−3.20%−11.68%−6.78%−7.52%
Table 4. Mean monthly occupancy.
YearCommunity SCommunity PCommunity LCommunity M
2016–2019 mean occupancy98.62%97.37%99.36%97.39%
COVID-19 year occupancy89.49%94.38%95.95%89.30%
% changes−9.13%−2.99%−3.41%−8.09%
Table 5. Energy use intensity per degree day.
KPIYearCommunity SCommunity PCommunity LCommunity M
kWh/bed/CDD24
in warm months
(Nov. first year to March next year)
2016–2019 mean11.2014.9123.9820.67
COVID-19 year12.4815.0624.5519.72
COVID-19 year vs. previous 4-year mean+11.39%+1.03%+2.37%−4.57%
Table 6. Pearson correlation coefficients (temperature and monthly energy use).
No.DescriptionCommunity SCommunity PCommunity LCommunity M
1Correlation
(all years data)
0.840.740.850.91
2p-values
(all years data)
4.67 × 10−171.35 × 10−111.22 × 10−174.32 × 10⁻²⁴
3Correlation
(COVID-19 year)
0.790.570.720.85
4p-values
(COVID-19 year)
2.35 × 10−30.058.59 × 10−35.30 × 10⁻⁴
Table 7. Degree days calculation.
IndicatorYearCommunity S, P, LCommunity M
CDD242016–2019 mean262.62182.78
COVID-19 year224.35
(−14.57%)
166.55
(−8.88%)
Table 8. Summary of benefits and limitations.
KPIBenefitsLimitations
Annual energy use
(total MWh in a year)
-
Easiness in data acquisition for generating the KPI
-
Provides a yearly overview
-
Relevant to site energy bills and carbon footprint
-
Not related to healthcare service delivery
-
Not relevant to climate conditions
-
No seasonal/monthly variation
-
No detailed evaluation of site’s systems or services
Annual peak demand
(the highest kW in a year)
-
Easiness in data acquisition for generating the KPI
-
Reveals the most significant impact to grid infrastructure
-
Relevant to peak demand charge if demand tariff is applicable [36]
Daily energy use
(kWh/day)
-
Easiness in data acquisition for generating the KPI
kWh/bed/day
-
Relates to healthcare service delivery
-
Enables a comparison among sites or a site itself over years
-
Relatively easy for data acquisition to calculate the KPI
-
Not relevant to climate conditions
-
No detailed evaluation of site’s systems or services
-
No comparison for benchmarking energy efficiency
kWh/bed/CDD
-
Relates to healthcare service delivery
-
Enables a comparison among sites or a comparison of a site itself over years in relation to varied climate conditions
-
Highly relevant to air conditioning needs
-
May reveal opportunities for better building design or operational improvement
-
Need customization and careful selection of base temperature values for each site
-
May not be suitable for sites in temperate climate or mild seasons
-
Need more data than other KPIs, e.g., weather observations
Publisher’s Note: MDPI stays neutral with regard to jurisdictional claims in published maps and institutional affiliations.

