1. Introduction
Buildings have a particular place in people’s lives and society. People spend most of their lives in closed spaces; thus, comfort control is a long-term concern for humans [
1,
2]. However, the energy crisis and global climate change lead engineers and architects to seek energy efficiency for buildings and intelligent techniques [
2,
3]. Yet, a large number of old constructions need to be renovated or improved with modern technologies. Today, buildings are one of the key contributors to the final energy consumption and one of the most significant CO
2 emitters in Europe [
4]. To deliver the social, environmental, and economic benefits of a green transition, buildings have a pivotal role to play; nonetheless, this is challenging and complex. In 2019, EU registered the dominant categories of the final end use of energy: transport (30.9%), households (26.3%), and industry (25.6%) [
5].
Two main factors are responsible for the increase in household energy consumption [
6]:
A growing number of dwellings, explained by population growth and, in some countries, an increasing number of one-person households;
An increasing demand for comfort (“lifestyle effect”) characterized by an increasing number of domestic appliances and larger dwellings.
With the European Green Deal [
7], the EU is boosting climate-neutral strategies by 2050 and revised the Energy Efficiency Directive [
1] together with other regulations to ensure a reduction in GHG emissions by 50%. The European Commission has therefore revised the Energy Efficiency Directive, together with other EU energy and climate rules, to ensure that the new 2030 target of reducing GHG emissions will be met [
8].
The EU energy efficiency building directive describes building renovation and the application of ICT as two main elements to achieving energy savings in buildings [
1]. On the contrary to renovating buildings, the implementation of ICT techniques plays a significant role in improving the energy efficiency in buildings in a short period of time [
9]. In this direction, advanced artificial intelligence (AI) algorithms and techniques developed for energy savings in buildings, building automation, occupancy prediction, etc., have been widely used in research papers [
10,
11]. Recently, the application of AI algorithms in developed building energy management systems (BEMS) have been tested in several studies with similar achievements in research papers [
12,
13]. In addition, the uncertainties in using data-driven models for buildings are still an open research challenge as long as some physical parameters are not interpretable [
14].
Specifically, the performance gap between a machine learning model and the in situ measurements of a building to make a reliable prediction using advanced algorithms was studied in [
15]. The authors of [
16] described the differences in energy performance quantification and categorized the energy performance gap as a distinction between compliance and performance modeling with measured energy use. Still, all uncertainties in the simulation of energy performance in buildings are conditioned to occupancy profile that makes the problem more difficult [
17].
Among the developed applications for buildings, it is assumed that the established BEMS system is already available and AI algorithms are used to improve the functionality of these systems [
18,
19]. Nonetheless, in small–medium range buildings that have neither an established BEMS nor a heating, ventilation, and air conditioning (HVAC) system, the implementation of ICT is typically inefficient and costly [
20]. For such a problem, the application of cloud computing can bring added value, where a large number of small buildings share the computational power of a cloud platform to use advanced AI algorithms for energy efficiency without the need for investment in a local BEMS or other relevant energy management systems. In this context, cloud servers for energy management purposes in buildings have been developed and proposed in the literature [
20,
21].
At the same time, AI overcomes the challenges of developing energy efficiency by facilitating the processes of on-site generation, detecting and minimizing the operational failures as well as monitoring and ensuring energy savings with multiple benefits [
22]. Therefore, adopting digital transformations and AI solutions will lower the costs, while in parallel, maximizing the overall energy performance in buildings, for instance, as in the case studies in [
23] that underline the role of AI in ventilation control strategies, leading to more than 25% energy savings in commercial buildings in the US.
A number of research works use AI as solutions for energy issues. The authors in [
24] propose automatic rule-based generation using the combinatorial method of Mamdani FIS and Sugeno FIS within a flexible and energy-efficient decision-making system that maintains the user’s thermal comfort with the help of intelligent sensors. The authors in [
25] developed an optimization algorithm for performing dynamic simulations of a single detached building, concluding that the occupants’ thermal comfort in a transitional climate may improve significantly owing to mechanical ventilation controlled by the suggested fuzzy logic controller. Another important contribution to the field is proposed in [
26] by introducing a gamification approach for supporting user engagement and integration in a human-centric cyber–physical system with the goal of improving the energy efficiency of a building through the utilization of cutting-edge sensors and cyber–physical system sensing/actuation platforms.
The authors in [
27] compared the performance of the widely used feed-forward back-propagation artificial neural network with random forest, an ensemble-based method gaining popularity in prediction, for example, the hourly HVAC energy consumption of a hotel in Madrid, Spain, incorporating social parameters into the work, such as the number of guests, which marginally increased the prediction accuracy in both cases. The authors in [
28] contributed to the literature in the field with the development of regression models for the prediction of the monthly heating demand in the single-family residential sector in temperate climates. Another interesting way to use such simplified models is to make it possible to conduct a very quick parametric study in order to optimize a building’s structure versus environmental or economic criteria. All of the energy prediction models were based on an extended database obtained by dynamic simulations for 16 major cities in France. Validation is probably the most important aspect of determining prediction models; thus, 270 different scenarios were analyzed in this research work for different inputs of the models.
This paper examined the application of AI algorithms installed on a corporate computer server to monitor and optimize the energy consumption of heating systems in three different buildings, representing three case studies in two European cities with different climate conditions. The selected buildings had different functionalities, operations, uses, and performance. In addition, these buildings did not have a complicated network of sensors and controllers; therefore, the necessary devices (i.e., sensing units) had to be installed to achieve the zonal thermal control desired. Moreover, the buildings were equipped with various types of heating systems that required the computing platform to be responsive to this diversity of systems and occupancy performances. Finally, the goal of the application of the system was to improve the energy saving rates in the buildings with the implementation of advanced AI algorithms, while the buildings were controlled in a unified energy-saving service, where the computational power and data storage were shared among the buildings. In this context, the key contribution of this work is the experimental validation of the high energy-savings potential of AI algorithms deployed on a shared computing platform in three case studies representing different building typologies, building functionalities, and types of heating systems located in different climate conditions and having both standard and high-level ventilation requirements due to the COVID-19 measures applied.
The rest of the paper is structured as follows:
Section 2 presents an overview of the methods employed in this work, provides the necessary definitions, and introduces the scenarios analyzed.
Section 3 describes the three selected case studies in terms of the characteristics and properties of the buildings and their heating systems.
Section 4 presents the results,
Section 5 discusses the main findings, while
Section 6 concludes the main points of this work and indicates possible directions of future work. Last,
Section 7 details the information of the patent application for the proposed system that was employed to obtain the results presented in this work.
2. Materials and Methods
In modern control systems for buildings, dynamic indoor temperature is an accepted approach to optimizing the performance of a heating system and reducing energy consumption in buildings. Techniques, such as programming a weekly scheduled thermostat, are a common approach in buildings with BEMS or programmable thermostats. However, using advanced modeling approaches, such as AI algorithms, data-driven models, and sophisticated control strategies can provide higher comfort levels and/or energy savings in comparison to weekly or daily schedules [
10].
In this study, Inteligg’s computing platform was the calculation engine, where several smart control strategies were deployed for energy optimization and temperature and humidity control in the buildings. Before introducing the platform in this work, it is necessary to define the following concepts:
- (a)
UA value: The heat transfer equation for a building includes several terms, such as the heat transfer rate from the envelope, ventilation, and infiltration, as shown in Equation (1), where Htr is the overall heat transfer coefficient for transmission, and Hve is the overall heat transfer coefficient for ventilation and infiltration. Given that separate measurements for ventilation, infiltration, etc., are not available in this work, the overall heat transfer coefficient UA was employed to represent the different heat transfer coefficients from envelope, ventilation, infiltration, etc. Specifically, Equation (1) can be rewritten as represented in Equation (2). Therefore, UA is an indicator for heat transfer between the building and outdoor temperature for a 1 °C difference between indoor, Tin, and ambient temperature, Tout. The UA value can be determined from a building’s material properties (not available in this study) or from measured data by means of Equation (3), where is the heating power that is extracted from the nominal power of the heating system.
- (b)
Degree days: This method is a well-known approach to determining the total heating/cooling consumption in a building for a constant indoor temperature with various reference outdoor temperatures. For instance, the calculated energy consumption for degree day 15.5 refers to the required heating load to keep the comfort level in a building when the average outdoor temperature drops below 15.5 °C. The heating demand according to this approach can be determined from Equation (4), where DD stands for degree days.
- (c)
Dynamic indoor temperature: In contrast to the degree days method, which assumes a constant indoor temperature, the dynamic indoor temperature inside a building refers to a control strategy that adjusts the optimal indoor temperature according to various factors such as the occupancy, outdoor conditions, preheating, etc.
- (d)
Heating demand: The amount of energy that is inserted inside a building to provide a comfortable indoor temperature. Due to the lack of measurement devices to calculate the heating power of the system, the working hours and the nominal power of the heating system were considered as the indicators to approximate the heating demand.
- (e)
Energy saving: The amount of the energy demand reduction in comparison to the degree days method. In Equation (5), heating demand refers to the energy consumption in the building according to the actual performance of the heating system (kWh), heating DD refers to the calculated heating demand according to the degree days approach (kWh), and energy saving is the percentage of energy savings in a building.
According to the abovementioned information, the thermal performance in various buildings is studied under the different scenarios described below:
Scenario 1: Heating degree days 17.5 is the required heating demand in a building for the times of the day that the balance temperature for a building is below 17.5 °C. This indicator is employed to compare the situation when the COVID-19 measures are applied in a building, requiring a higher ventilation rate;
Scenario 2: Heating degree days 15.5 is a standard reference to calculate total heating demand in building according to the ASHRAE standard [
29];
Scenario 3: Represents the actual performance of the heating system according to its working hours and nominal power. This scenario refers to a building that AI algorithms and advanced control strategies are deployed to optimize the thermal performance of the system.
To collect the necessary input data for the advanced energy-savings algorithms, Inteligg´s devices (i.e., sensing units and controllers) were installed in different locations of the buildings to obtain measurements of environmental variables from the different heating zones therein and to control the operation of the heating system accordingly. Specifically:
A smart sensor module including three sensors for measuring temperature (°C), relative humidity (%), and movement detection (binary signal);
A smart thermostat module including the sensors of a sensor module along with an LCD screen and 4 buttons allowing for manual settings (if necessary);
A smart control module featuring a number relays to control the operation of the HVAC systems.
Data acquisition from Inteligg’s smart thermostat and smart sensors included in situ data filtering and data cleaning on the server side. Data filtering omitted a sequence of measured data with a difference within the sensors’ accuracy. In other words, if the variation in the measured data was as low as the sensors’ accuracy, the data would not be transmitted to the server. On the other hand, in order to clean the data set for the AI algorithms, the averaged value for each hour was calculated on the server.
This data set was continuously updated for each hour, and the last 720 rows of this data set were used as the training data for the AI algorithms. The generated data set included at least indoor temperature, indoor relative humidity, occupancy, energy consumption, outdoor temperature, and outdoor humidity. Using the gathered information, the building thermal model was trained, and considering weather forecasts, occupancy, and indoor temperature prediction, the optimized performance for the heating system was predicted. Due to the sufficient storage and processing power of the server, this procedure was continuously updated without imposing limitations on the system’s performance.
The necessary data from sensor measurements were sent to the Inteligg’s server, where AI algorithms for occupancy prediction, building thermal model development, and advanced control strategies were continuously running in order to generate the commands in real-time for the building’s HVAC and transmit them to the latter via the Inteligg’s control modules installed in the building. It is noted that the indoor temperature and the start and stop time of the heating system was determined by means of the AI algorithms. In addition, the Inteligg’s server was connected to online weather APIs to receive current weather conditions as well as weather forecasts for energy demand optimization. At this point, it is also important to note that the system’s architecture, design, and configuration along with the modeling techniques and energy-savings algorithms deployed on the computing platform are subject to intellectual property protection as indicated in
Section 7. To this end, the focus of this work was on the results obtained by applying the aforementioned integrated system (Inteligg’s energy-savings service with locally installed sensing and controller devices) to three different case studies and their analysis, rather than on the description of the system and the algorithms implemented. Moreover, it is noted that in each case study the meta-analysis of the energy-saving data was performed over a period of three months after the installation of Inteligg’s smart thermostat system, which provided a sufficiently long-term horizon for experimenting with the proposed system and unlocking its energy-savings potential. Importantly, the case studies were conducted in the wintertime to showcase the energy-savings capability of the system during the heating season, which is of primary concern in most western and northern European countries.
3. Case Studies
In this paper, three buildings with different functionalities, operations, and typologies were studied to examine how effectively advanced control strategies can help to reduce energy consumption in these buildings. From a geographic point of view, one building was located in Luxembourg in Western Europe, where cold winters and mild summers are expected. The other two buildings were located in Greece, which has a Mediterranean climate. On the other hand, the first building (i.e., in Luxembourg) was a church that was mainly occupied during the weekends, the second one was a municipality office building that was open five days per week, and the last building was an apartment that was occupied mainly during the night. Different and scattered building occupancy profiles helped to provide a clearer view of the performance of the advanced control techniques for energy savings under the different situations of the buildings.
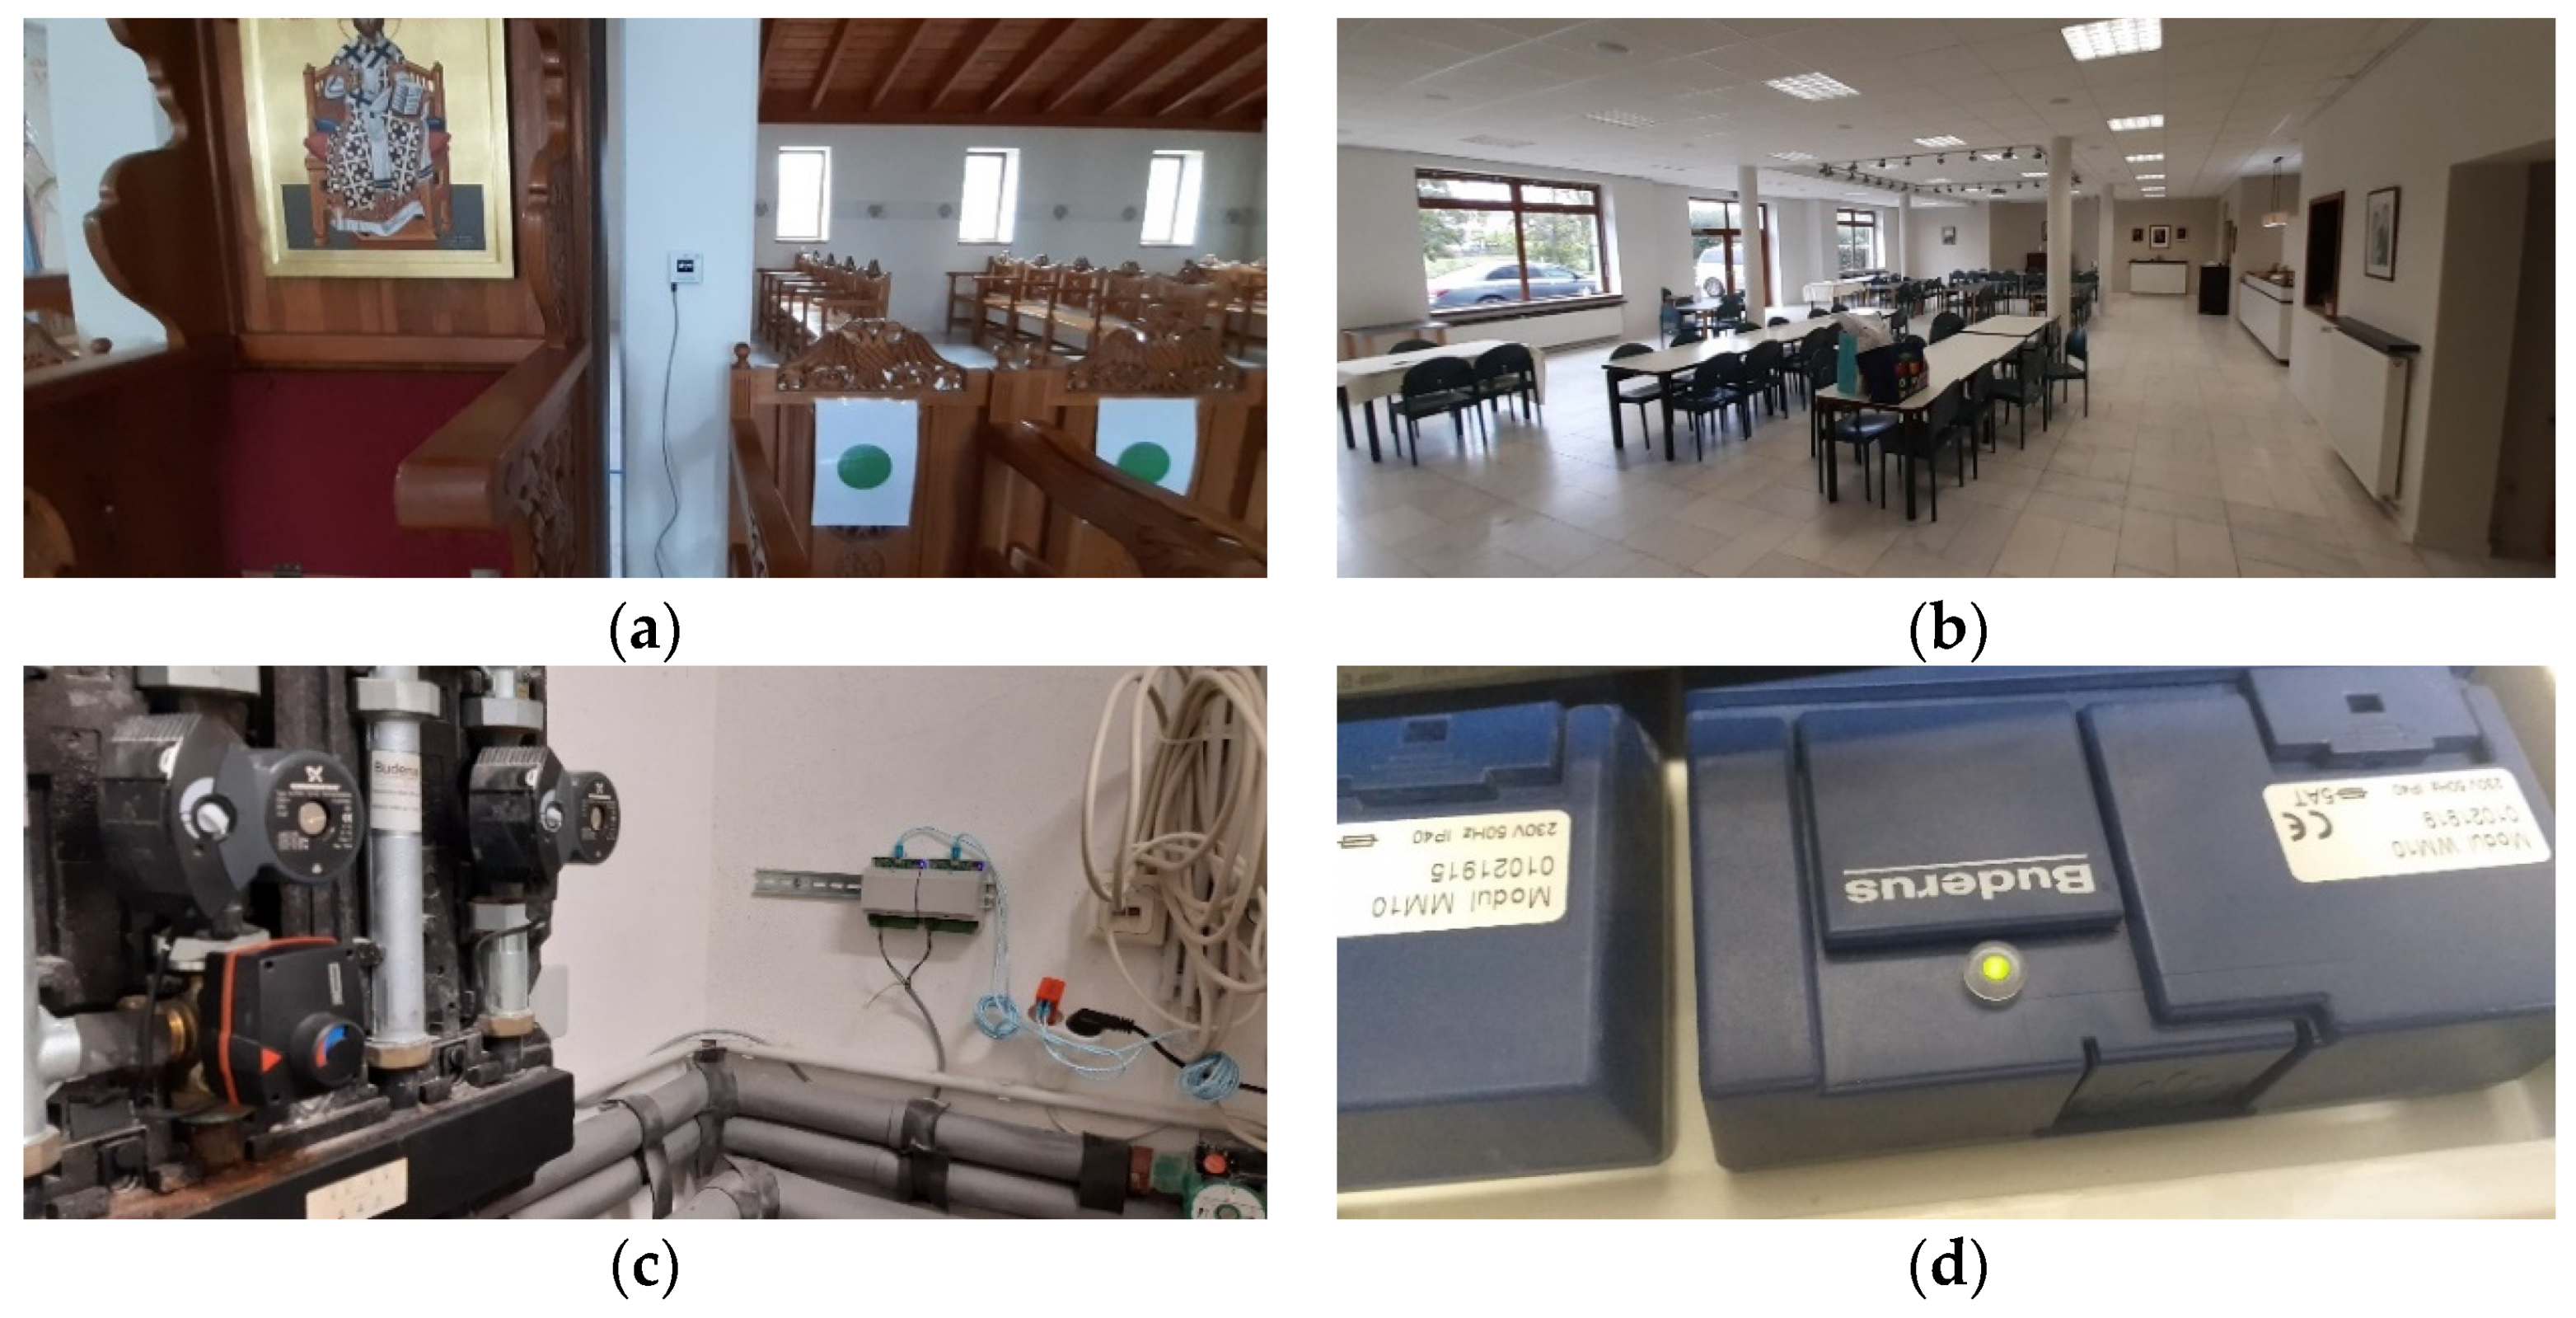
Saint Nicolas Church: This church is a detached building located in Weiler-La-Tour, Luxembourg. It is a two-floor building, where the ground floor is a reception area for events to serve guests and the first floor is the temple. There is a centralized hot water production system for heating the floors. The radiators were on the ground floor, which did not have any control system, and the occupants controlled the hot water circulation in the radiators manually. On the other hand, an under-floor heating system was installed on the first floor. A simple temperature control thermostat was installed on this floor to control the circulation of the hot water in the pipes according to the set temperatures. The thermostat was allowed to be controlled in the building during working hours. Due to the long response time of the under-floor heating system, the desired comfort conditions in the temple were rarely met, and most of the time it felt cold inside. An Inteligg’s smart thermostat module, a smart sensor module, and two smart control modules were set-up in this building, as shown in
Figure 1, to allow for the implementation of the advanced control strategies.
The building was under experiment for three consecutive months in the winter of 2020–2021. The building was mainly occupied over the weekends, and due to coronavirus, crisis doors and windows remained open during occupied hours. Accordingly, the calculated heating degree days are presented in
Table 1.
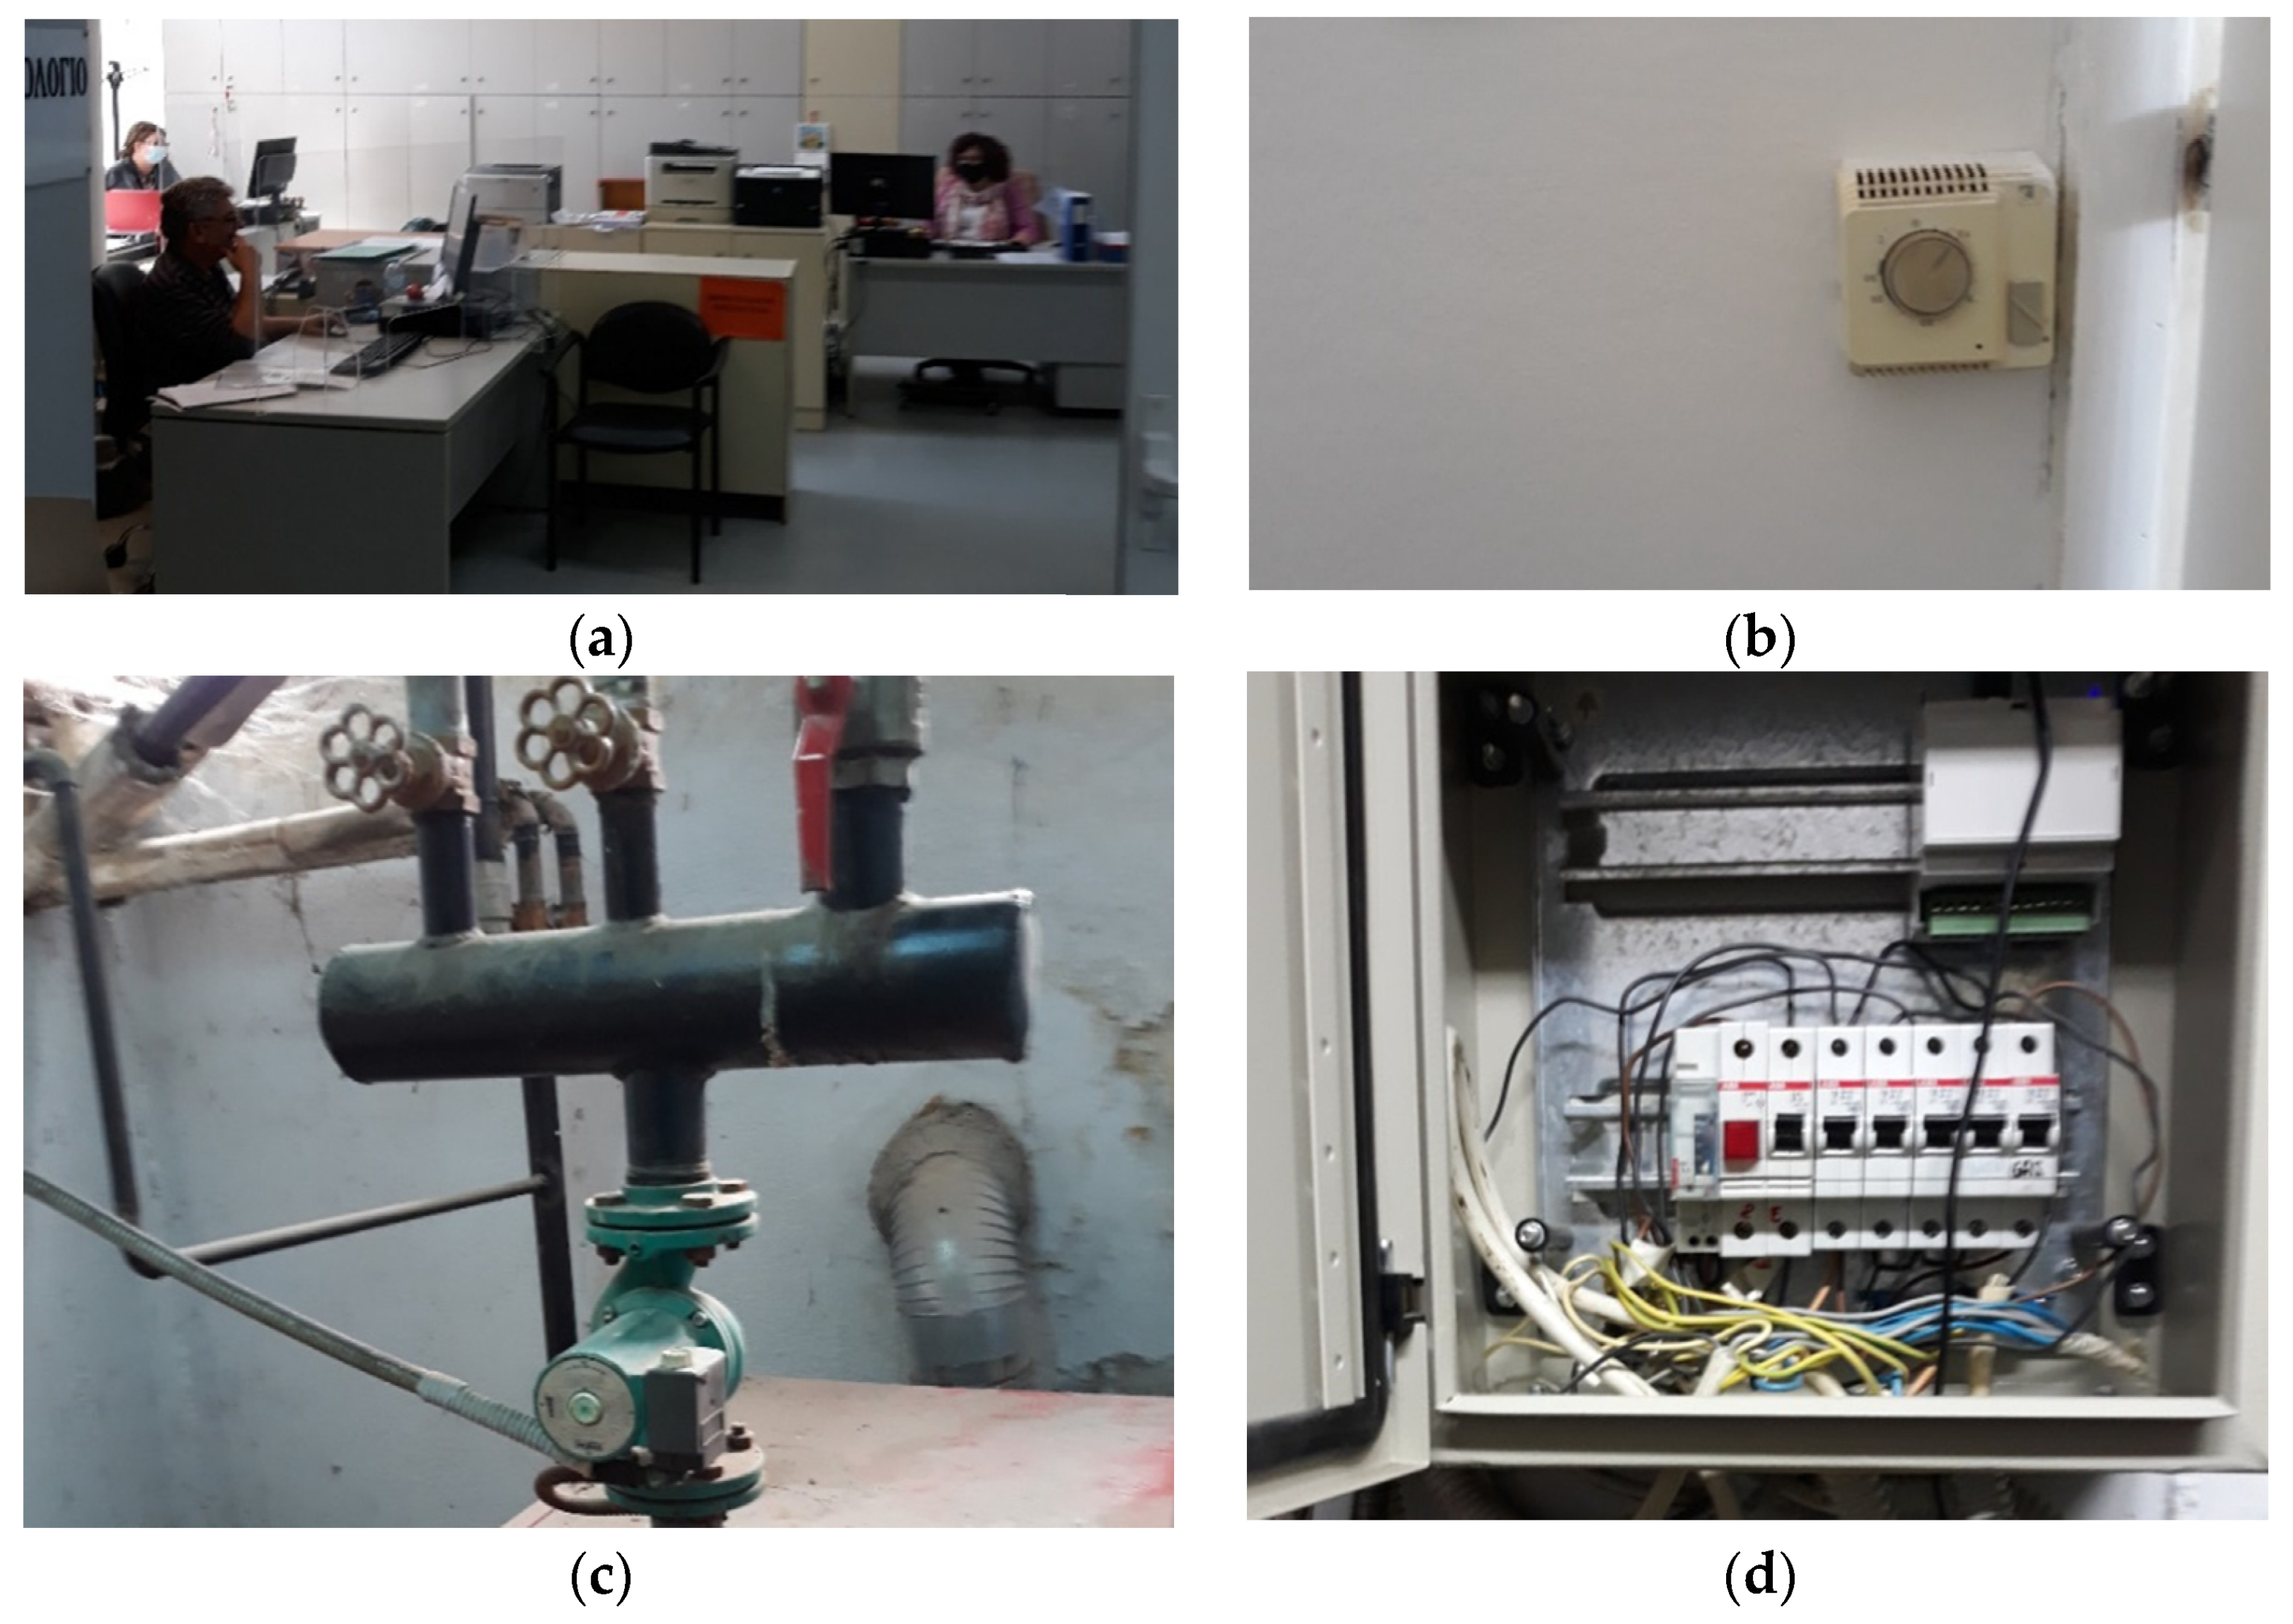
Townhall of Thermi: The townhall of Thermi is a three-floor terraced building in Greece. This building has a gas furnace to produce hot water to circulate in radiators. The whole building is controlled by a thermostat installed in the Mayor’s office on the second floor. The offices, which are accessible to the public, are on the ground floor. The gas furnace is turned on during working hours and is turned off for the rest of the day. To allow for better control of the building, Inteligg’s smart sensor modules were installed on all floors. One observation was that the comfort control on the ground floor, which was accessible to both staff and the public, was the biggest challenge for this project. Therefore, the control of hot water circulation in the building was conditioned to the measured data from the ground floor instead of the Mayor’s office. In order to avoid overheating problems on the upper floor, the flow rate control valves of the radiators were adjusted accordingly. The townhall of Thermi was monitored and controlled for three months. The corresponding heating degree days for this building are presented in
Table 2. Moreover, the offices in the townhall of Thermi, the old thermostat, the heating system, and the electric board are shown in
Figure 2.
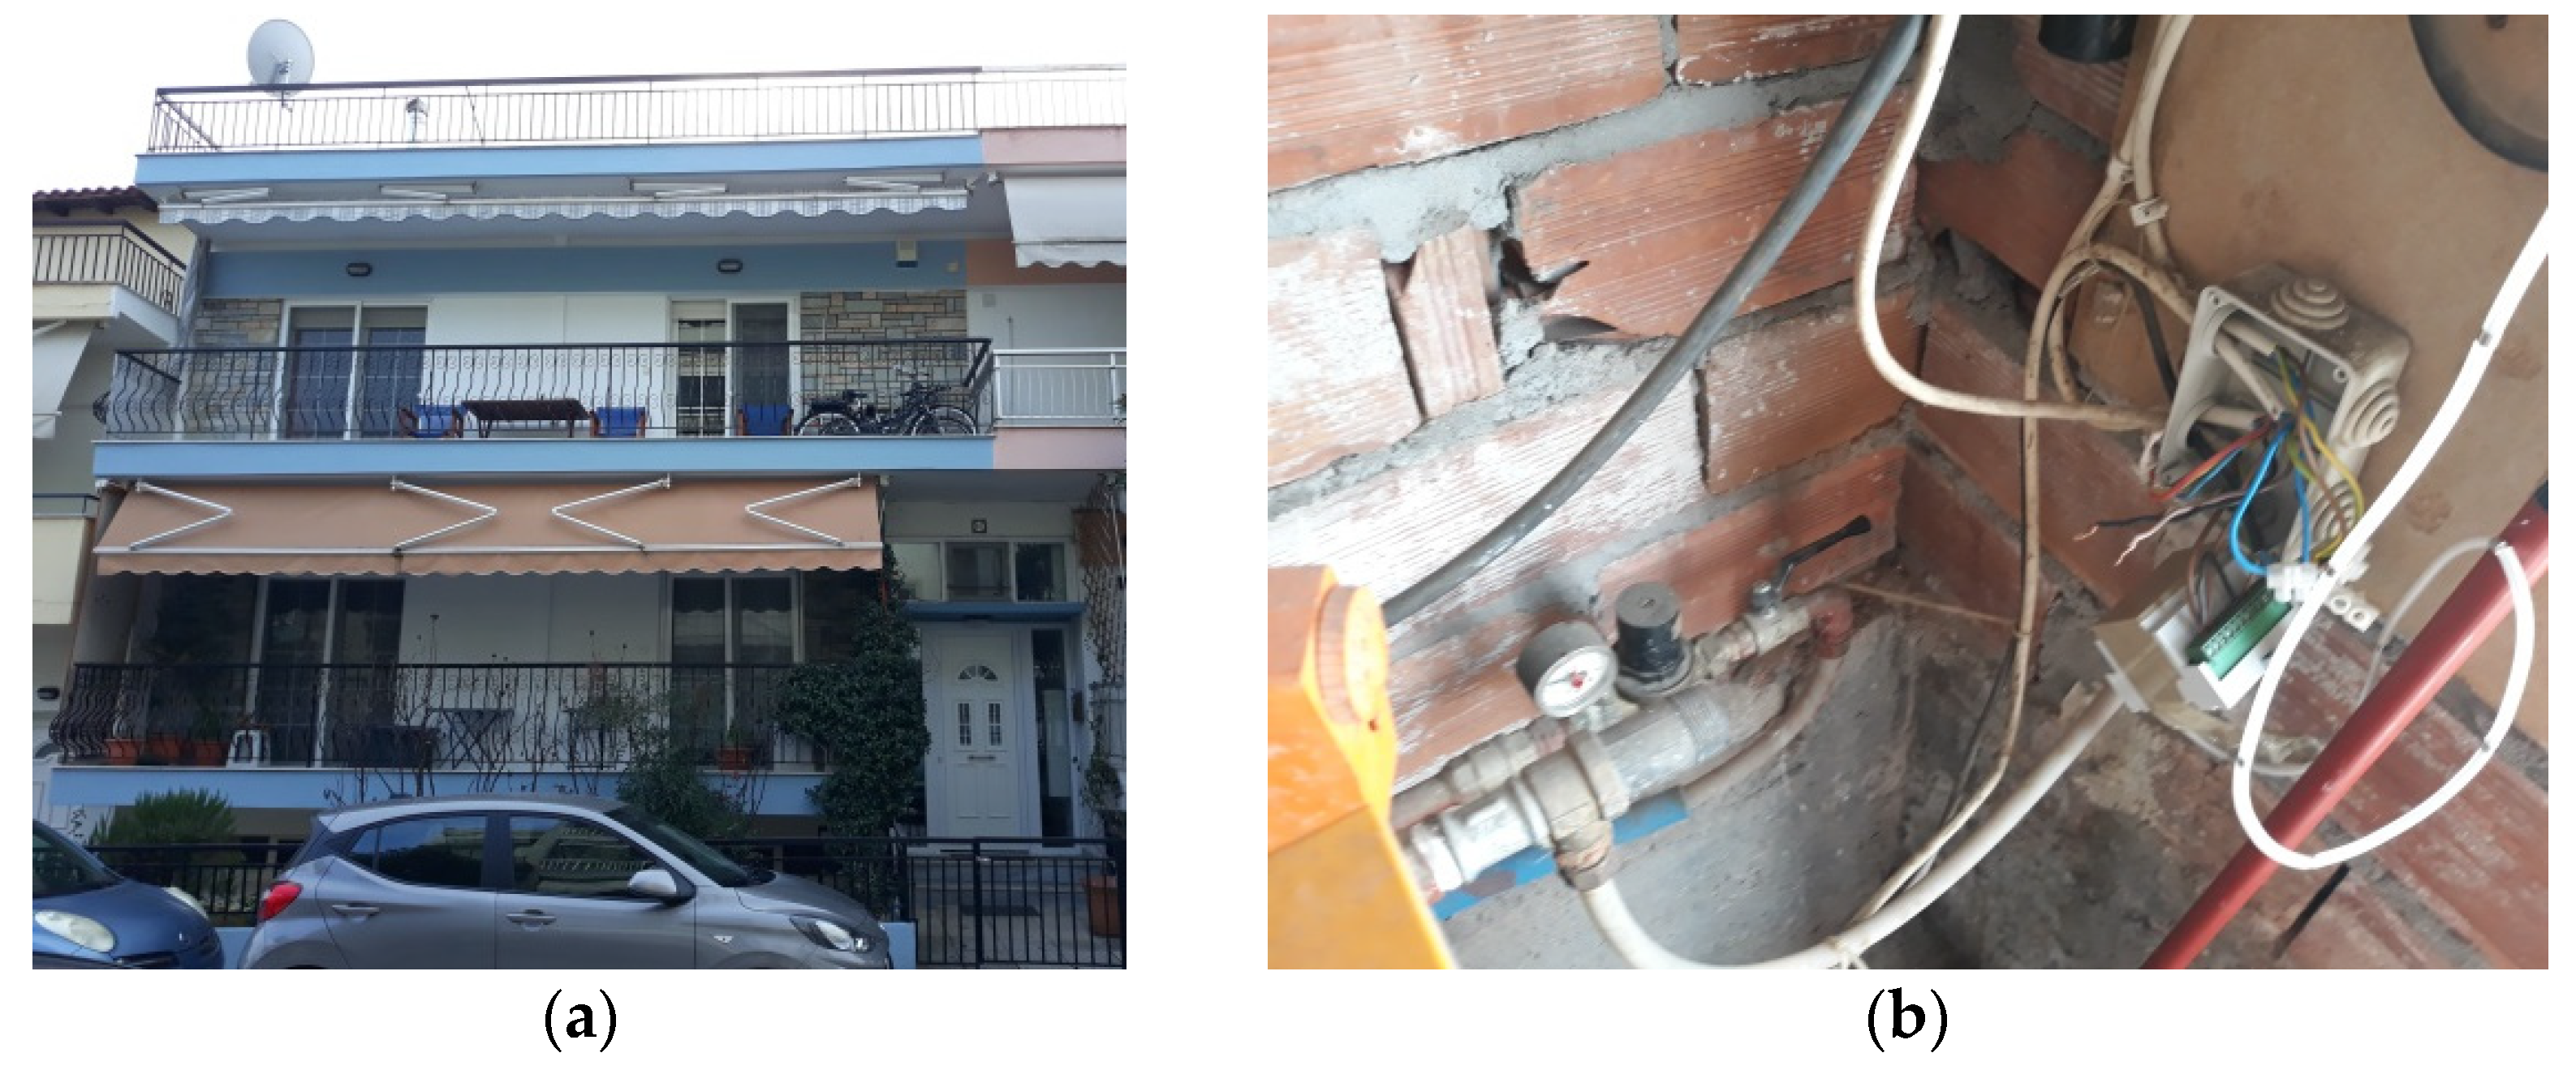
Residential Apartment: The third case study was a residential apartment in Thessaloniki, Greece. A gas furnace was coupled with solar collectors to generate hot water for the building. In this building, a solar collector generates hot water for daily consumption and the furnace generates hot water for space heating. The apartment has a kitchen, two bedrooms, a living room, and a bathroom. Similarly, a manual thermostat was used to control the temperature inside the building. The occupants need to adjust the temperature whenever they leave or return to the building. In this case, an Inteligg’s smart thermostat module was installed inside the living room to control the performance of the heating system. Degree days for the months March and April of 2021 for two reference temperatures in Thessaloniki are calculated in
Table 3. In addition,
Figure 3 shows the installation of Inteligg’s smart control module to the heating system in this apartment.
4. Results
Having described the methodology employed and the server-based energy-saving services deployed to the three case studies, this section presents the results obtained from the application of the said system in order to examine how the advanced AI algorithms can improve the energy efficiency in buildings regardless of buildings’ typologies and functionalities.
It is noted that each building had various zones; thus, each zone was analyzed separately. Despite the fact that each zone was separately monitored and controlled with AI algorithms deployed on the corporate server, the average result for each building is represented, given that the focus of this paper was to describe the performance of AI algorithms on a series of buildings.
4.1. Saint Nicolas Church
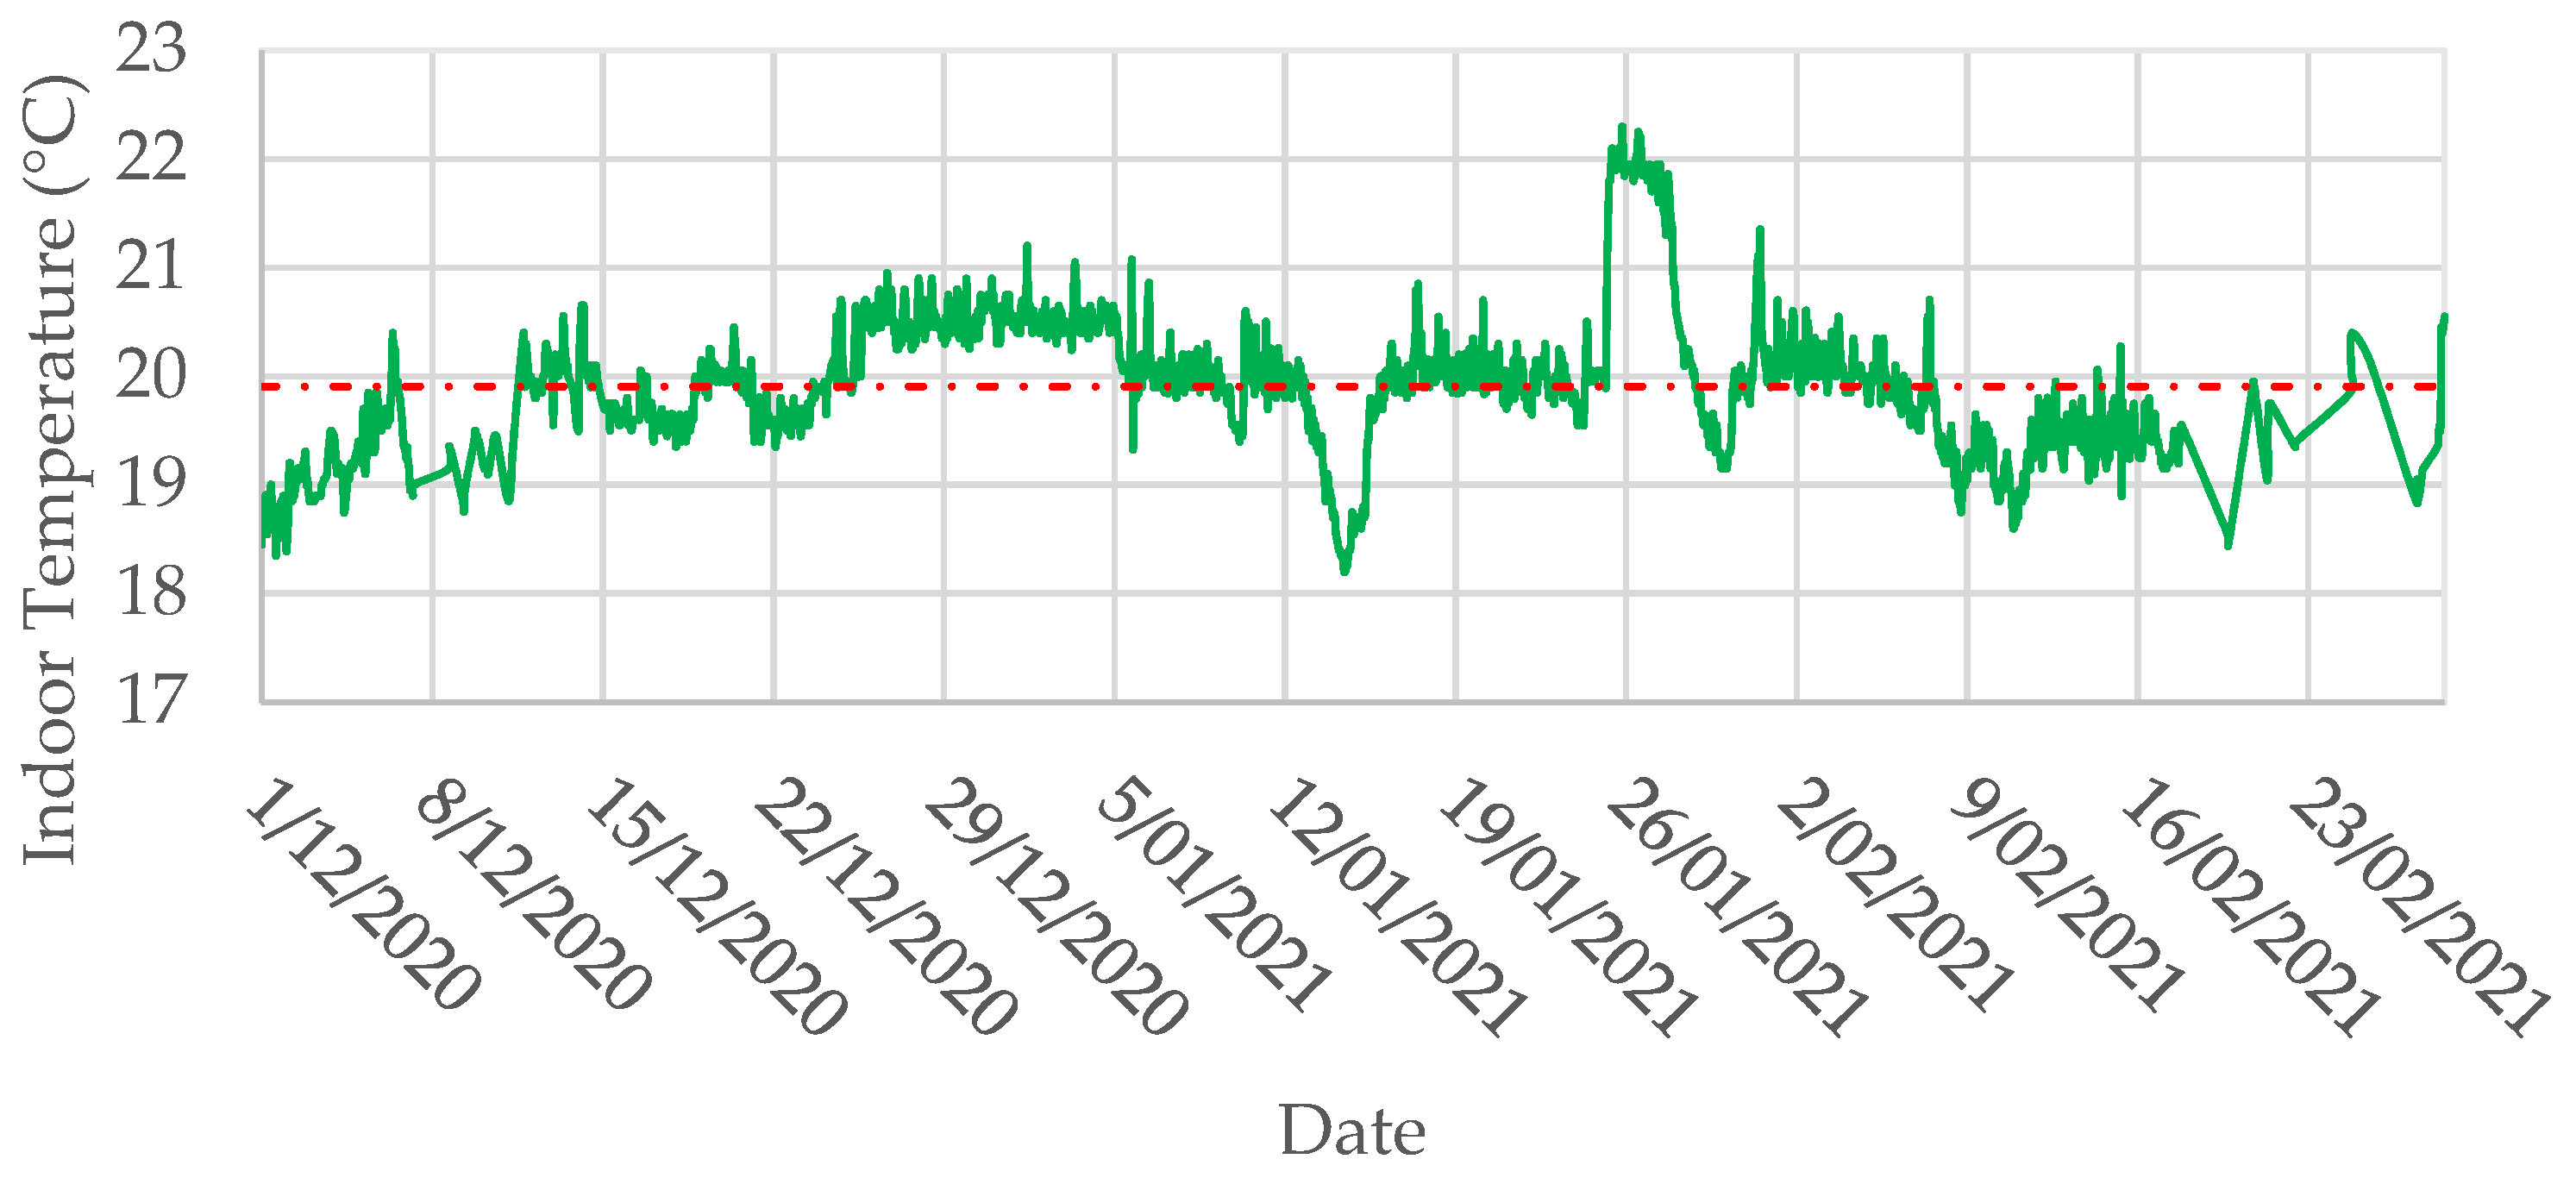
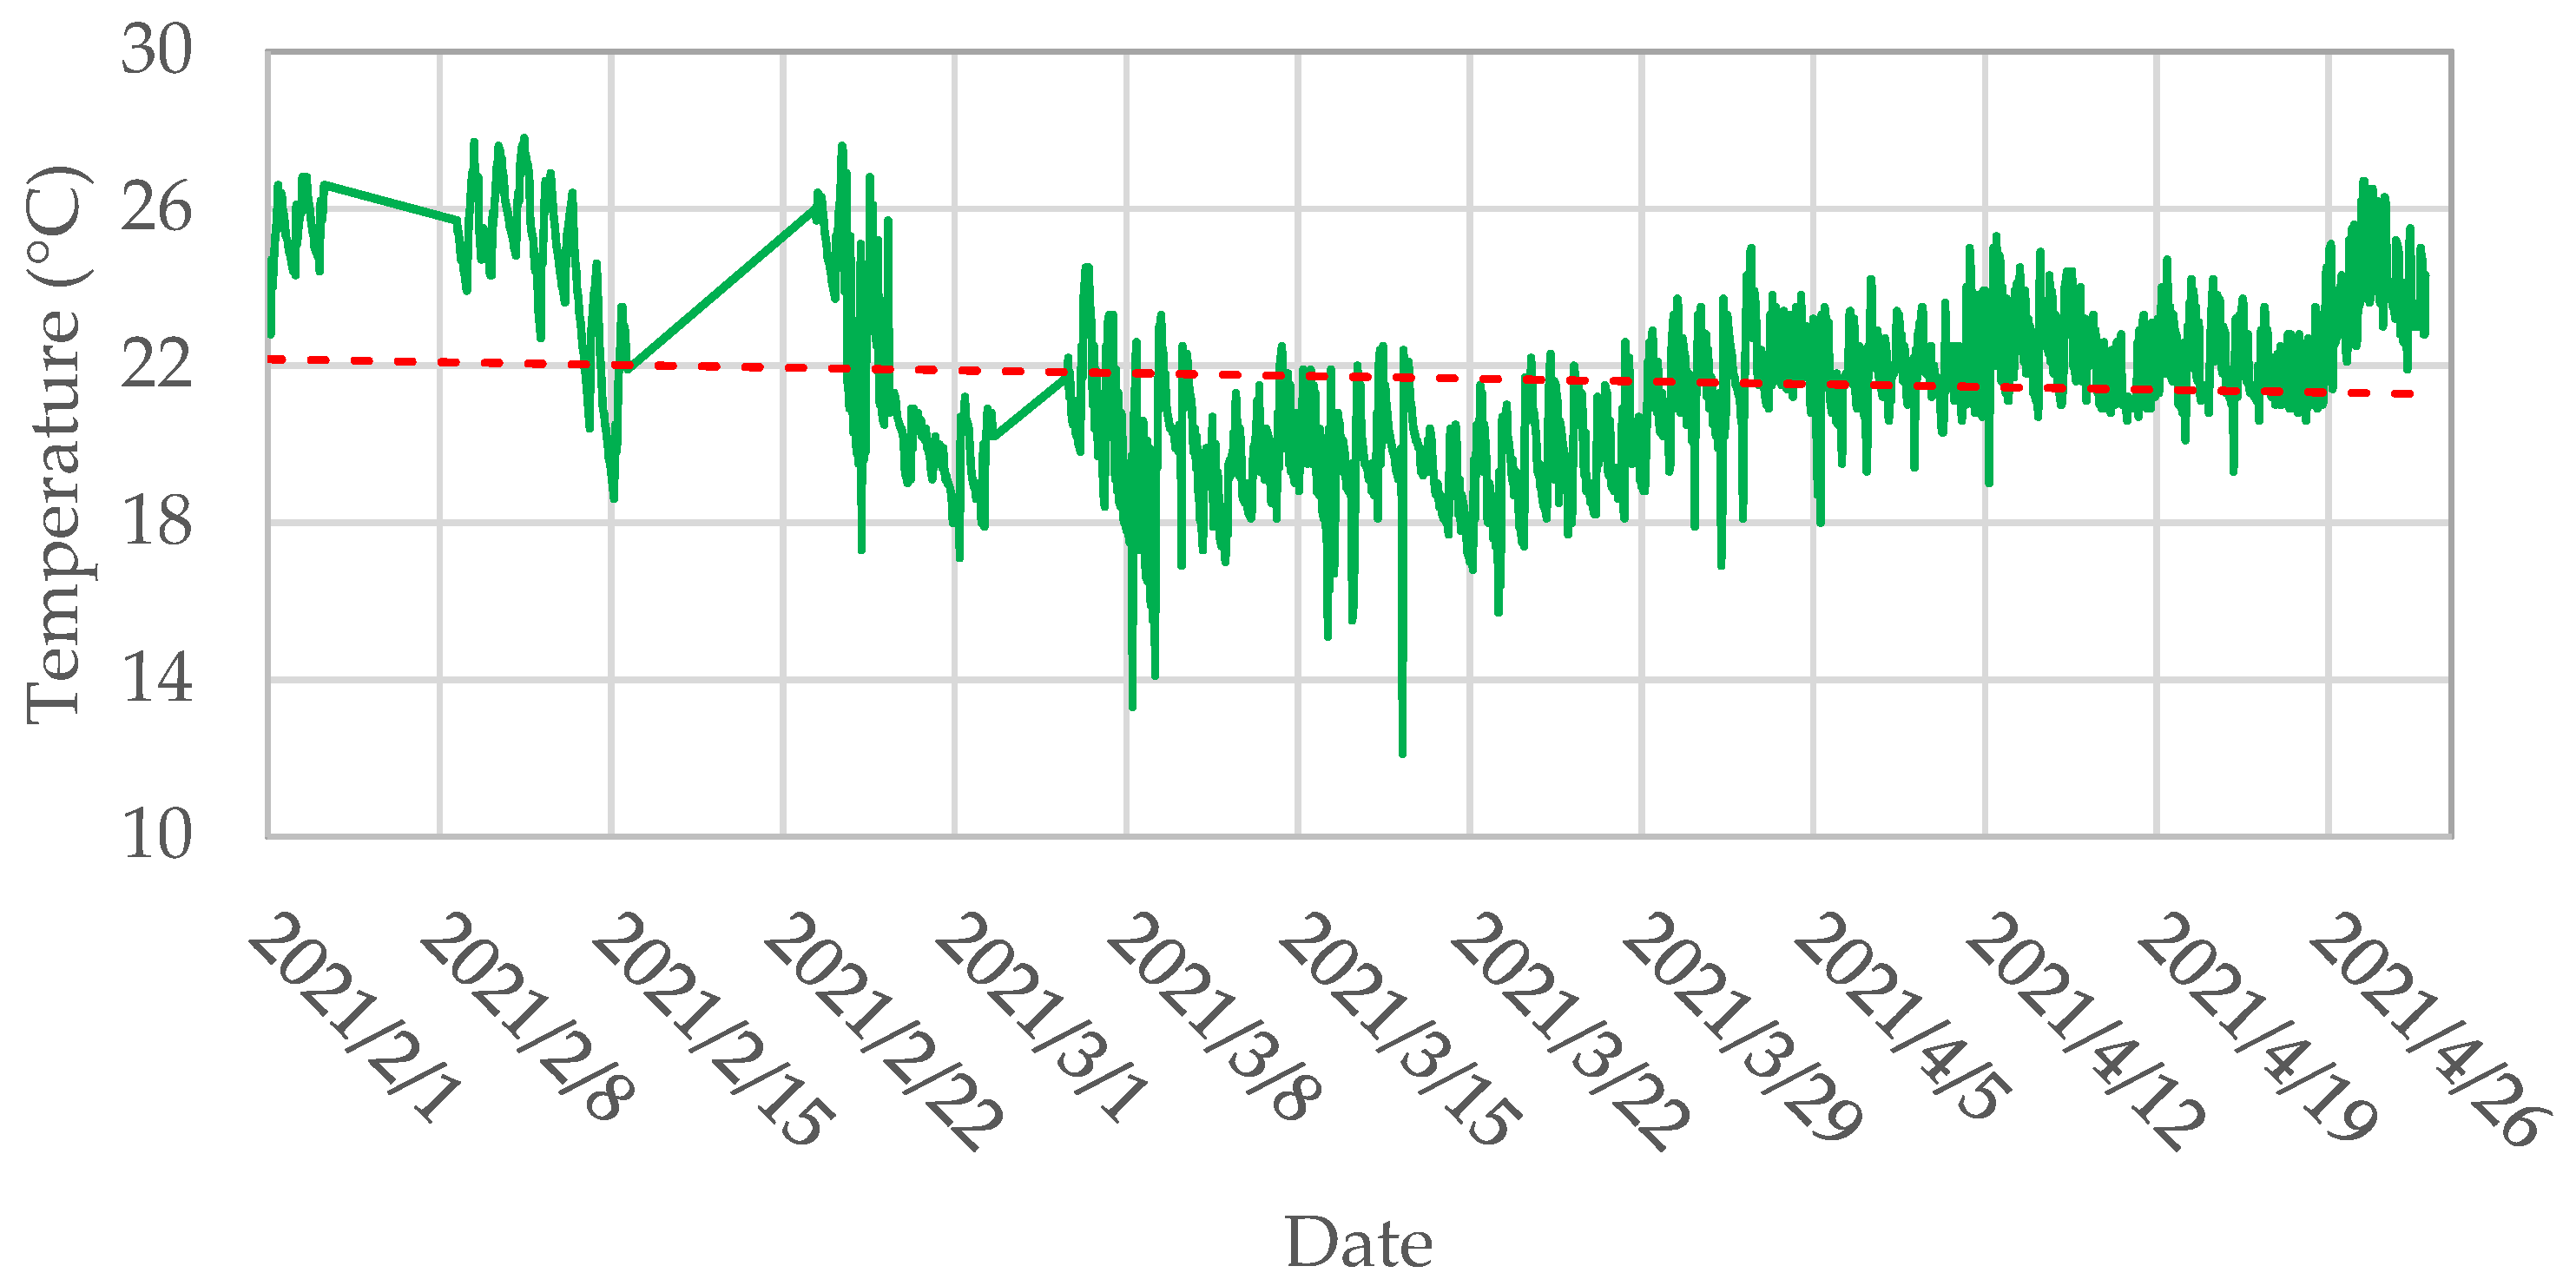
The analysis of the two-floor building is presented based on the average indoor conditions in the temple and the reception area for events. Both floors have the same surface area; therefore, the average indoor temperature was calculated as the mean temperature of both floors. As shown in
Figure 4, despite the large temperature fluctuations in the building from the beginning of December till the end of February, the average temperature was above 18 °C and it did not exceed 23 °C. The trendline shows that it corresponded to a constant indoor temperature of 20 °C.
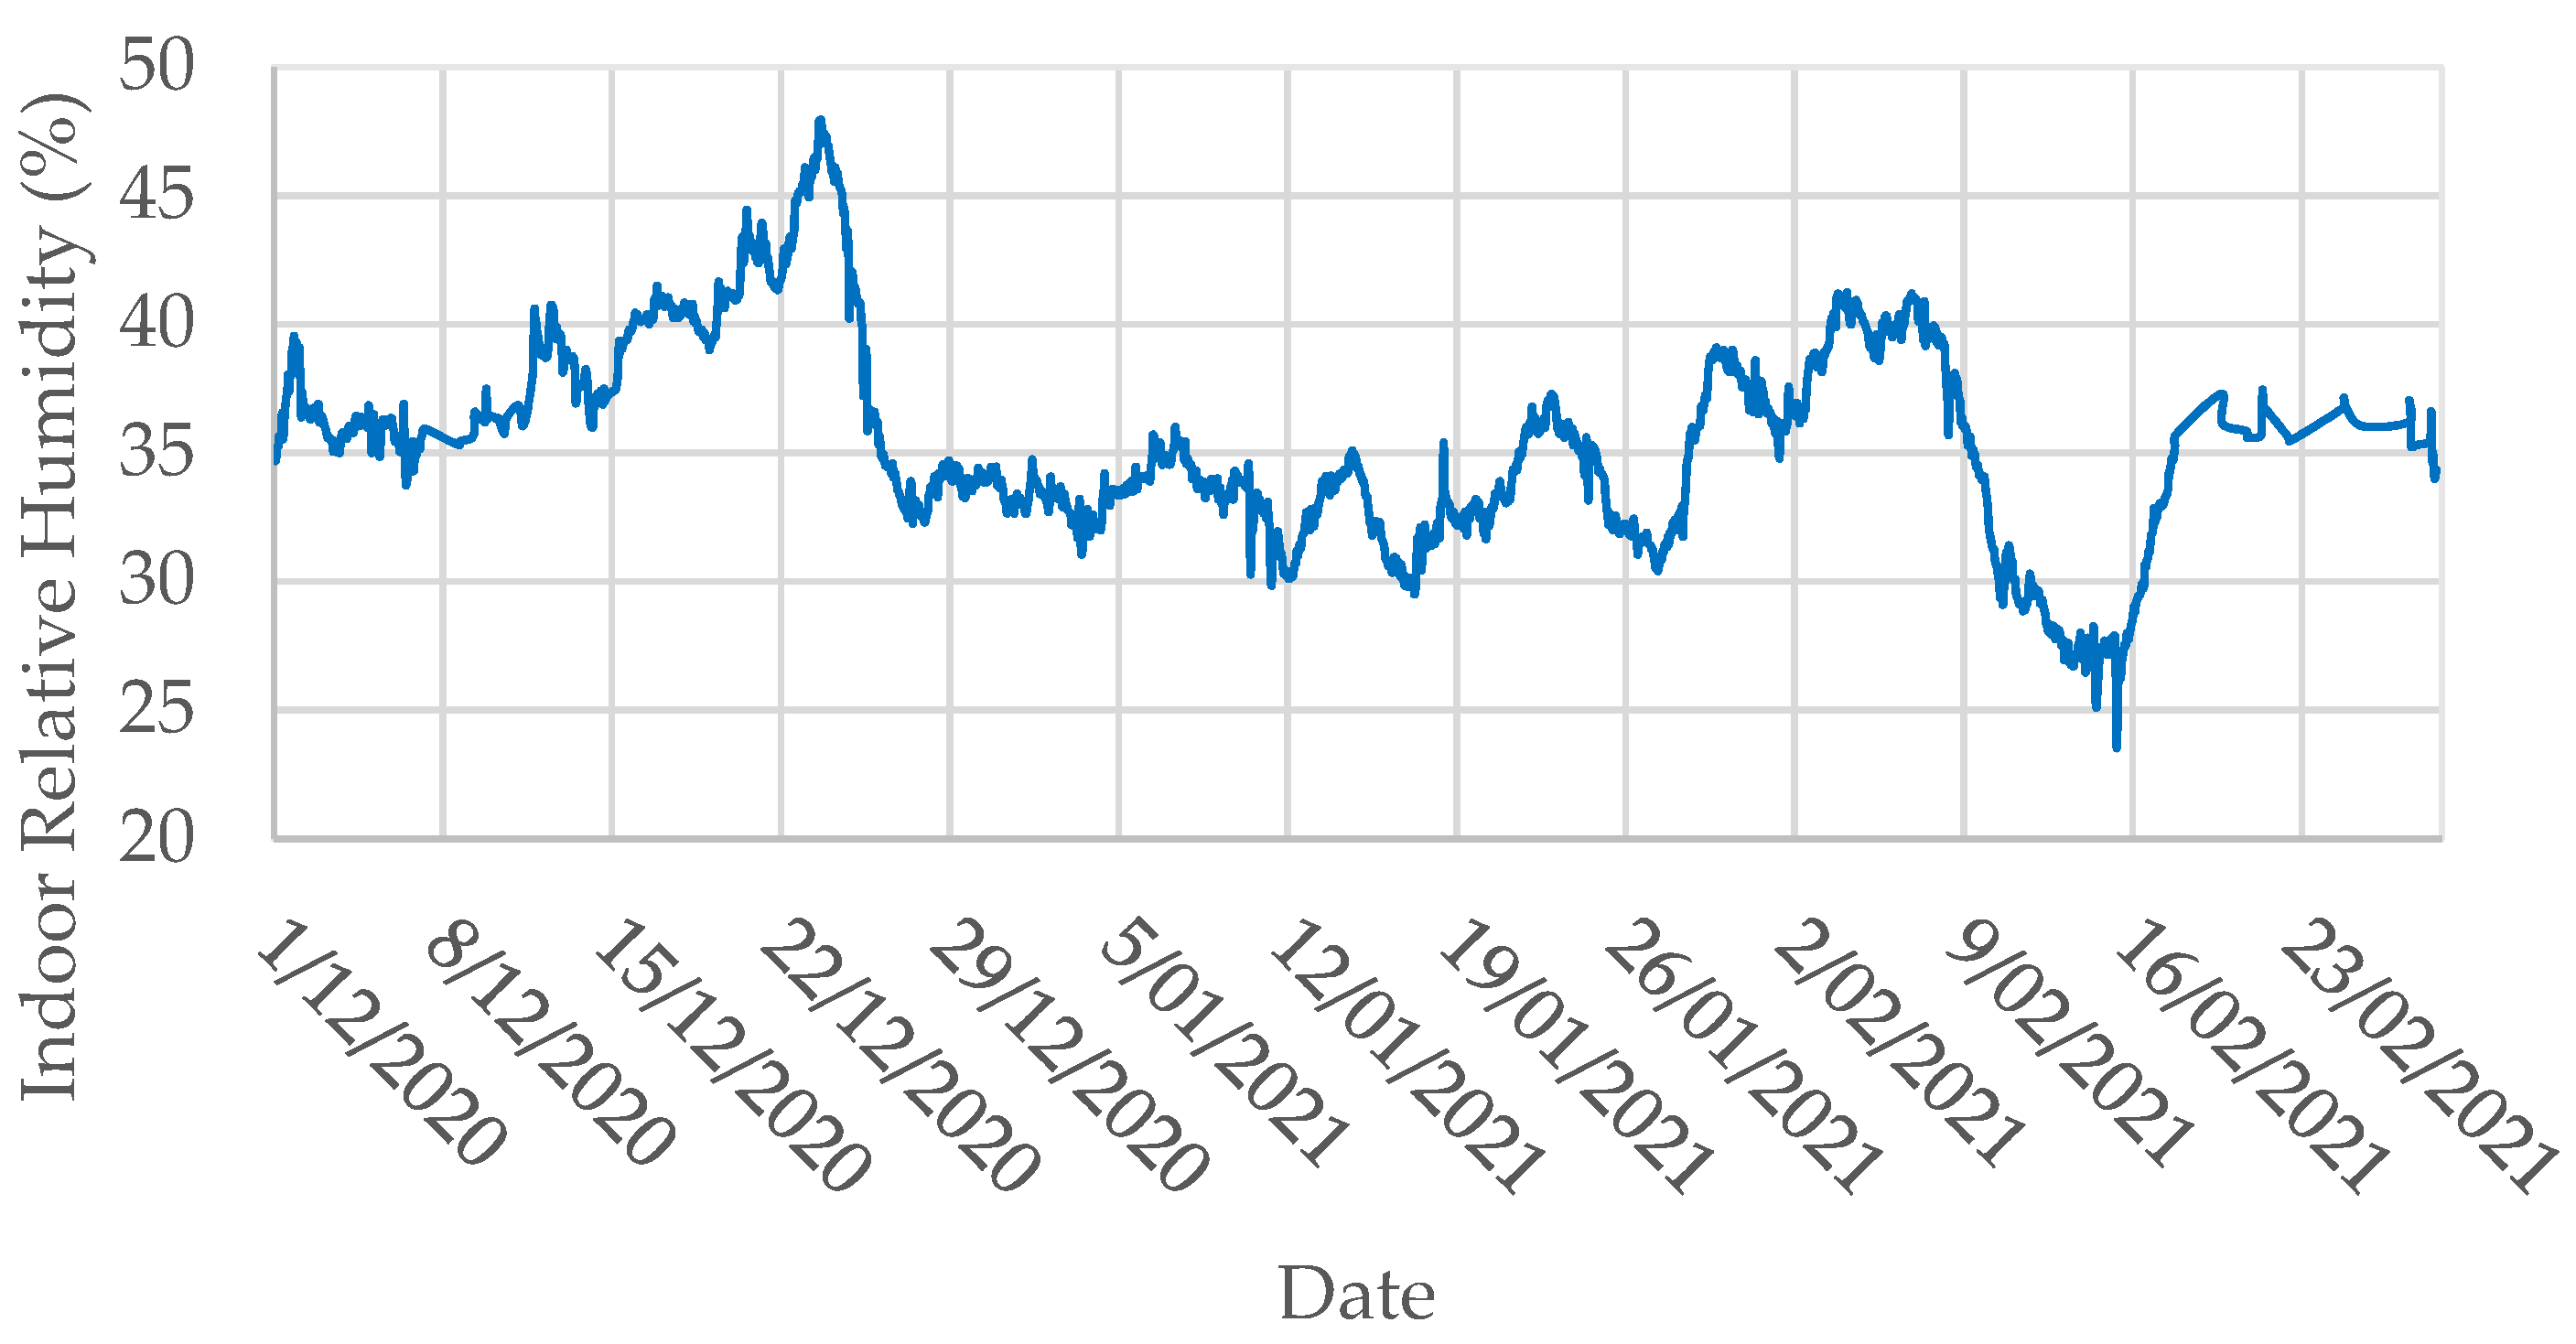
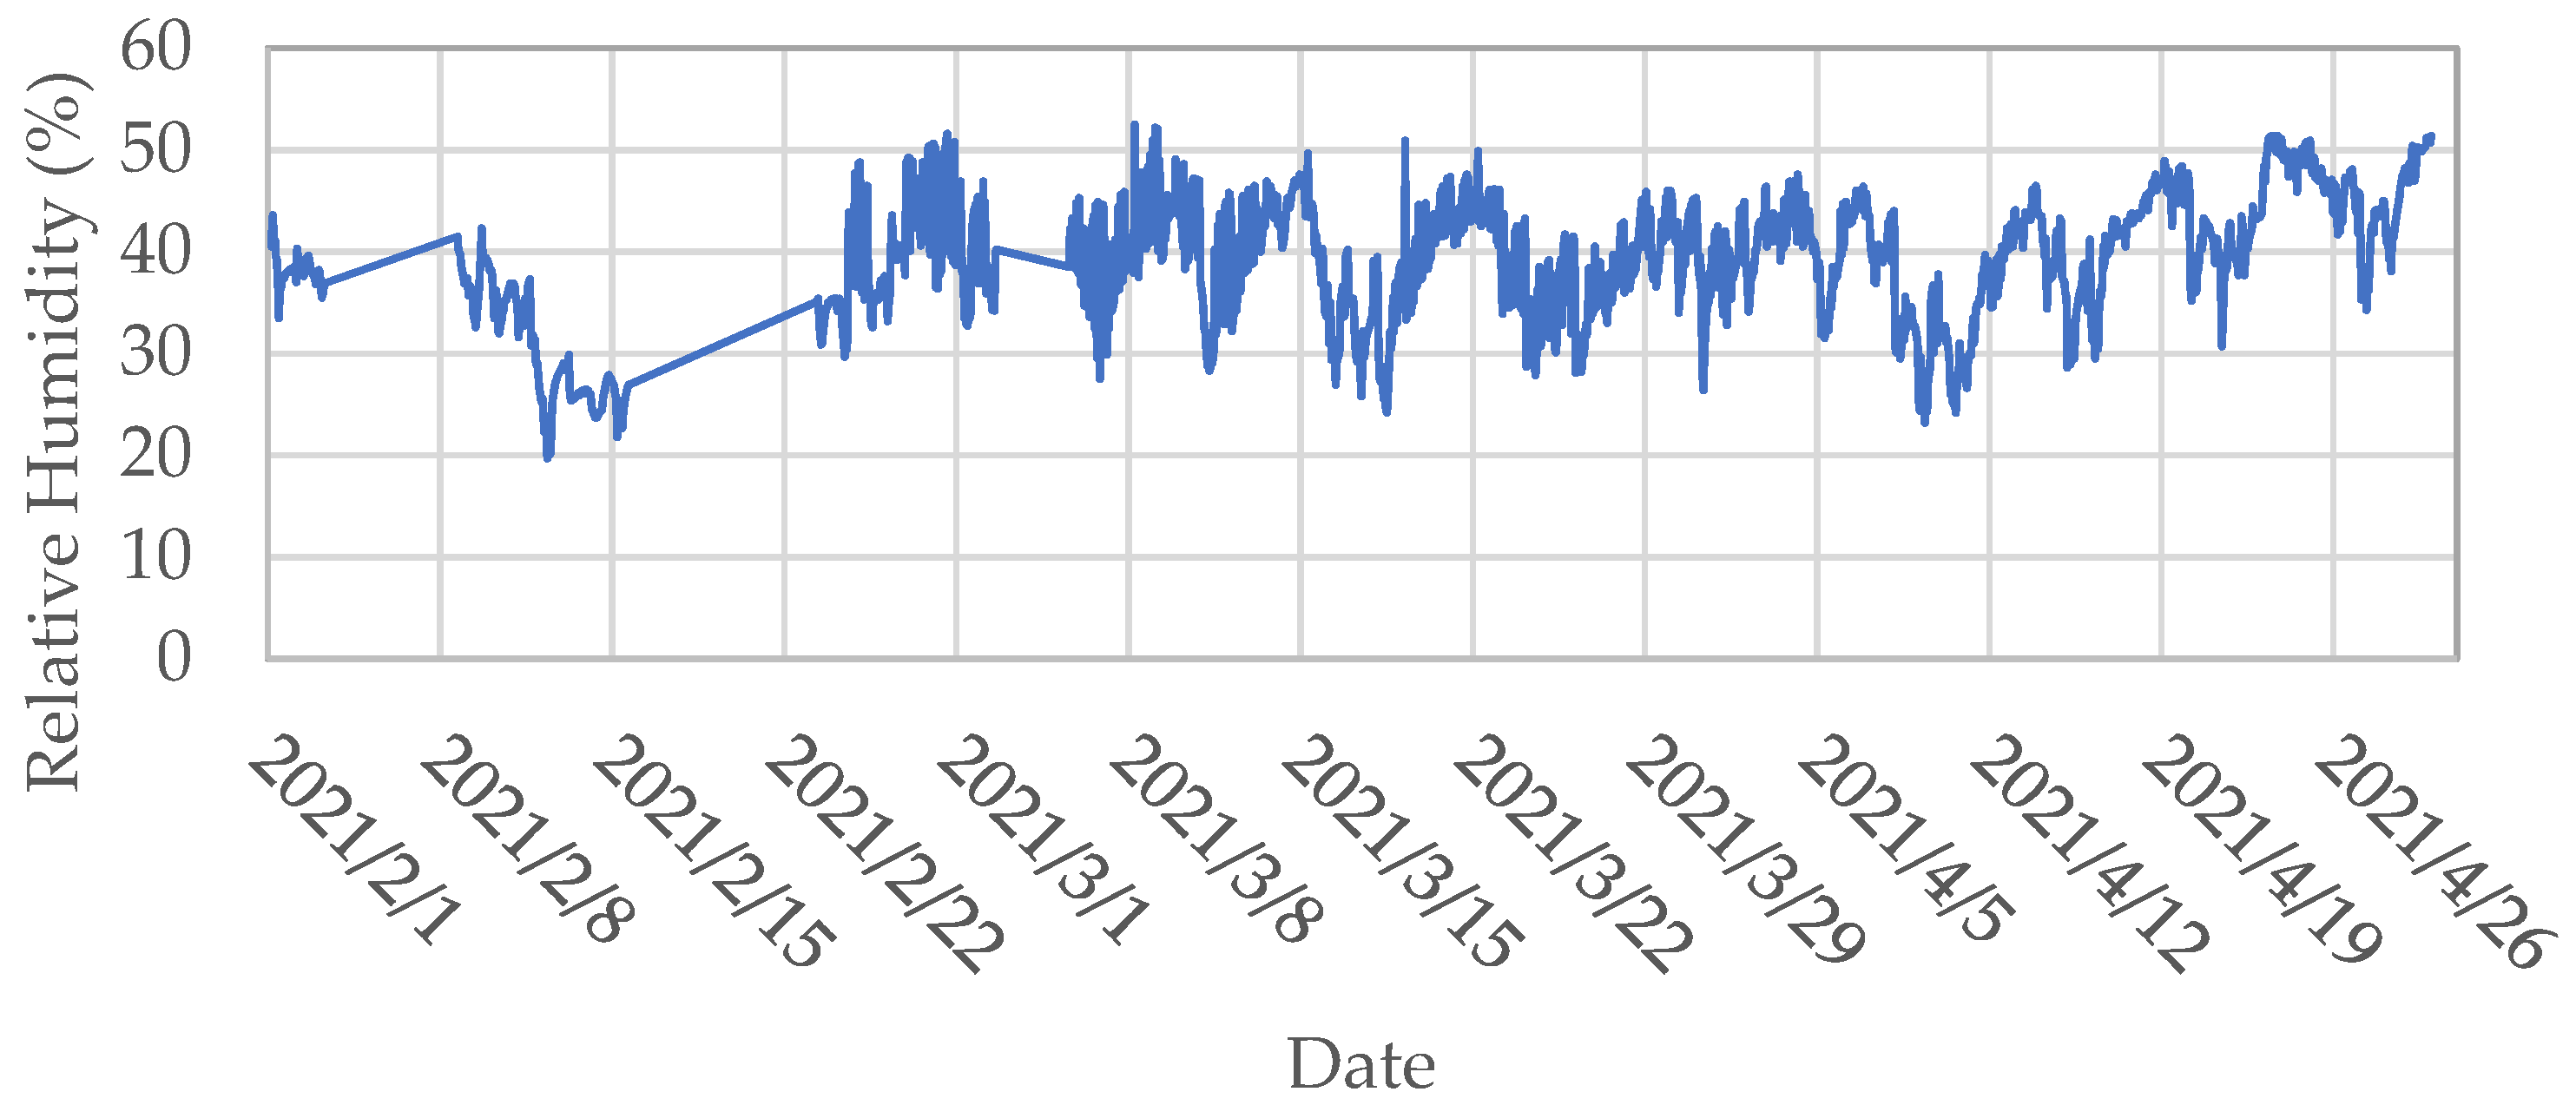
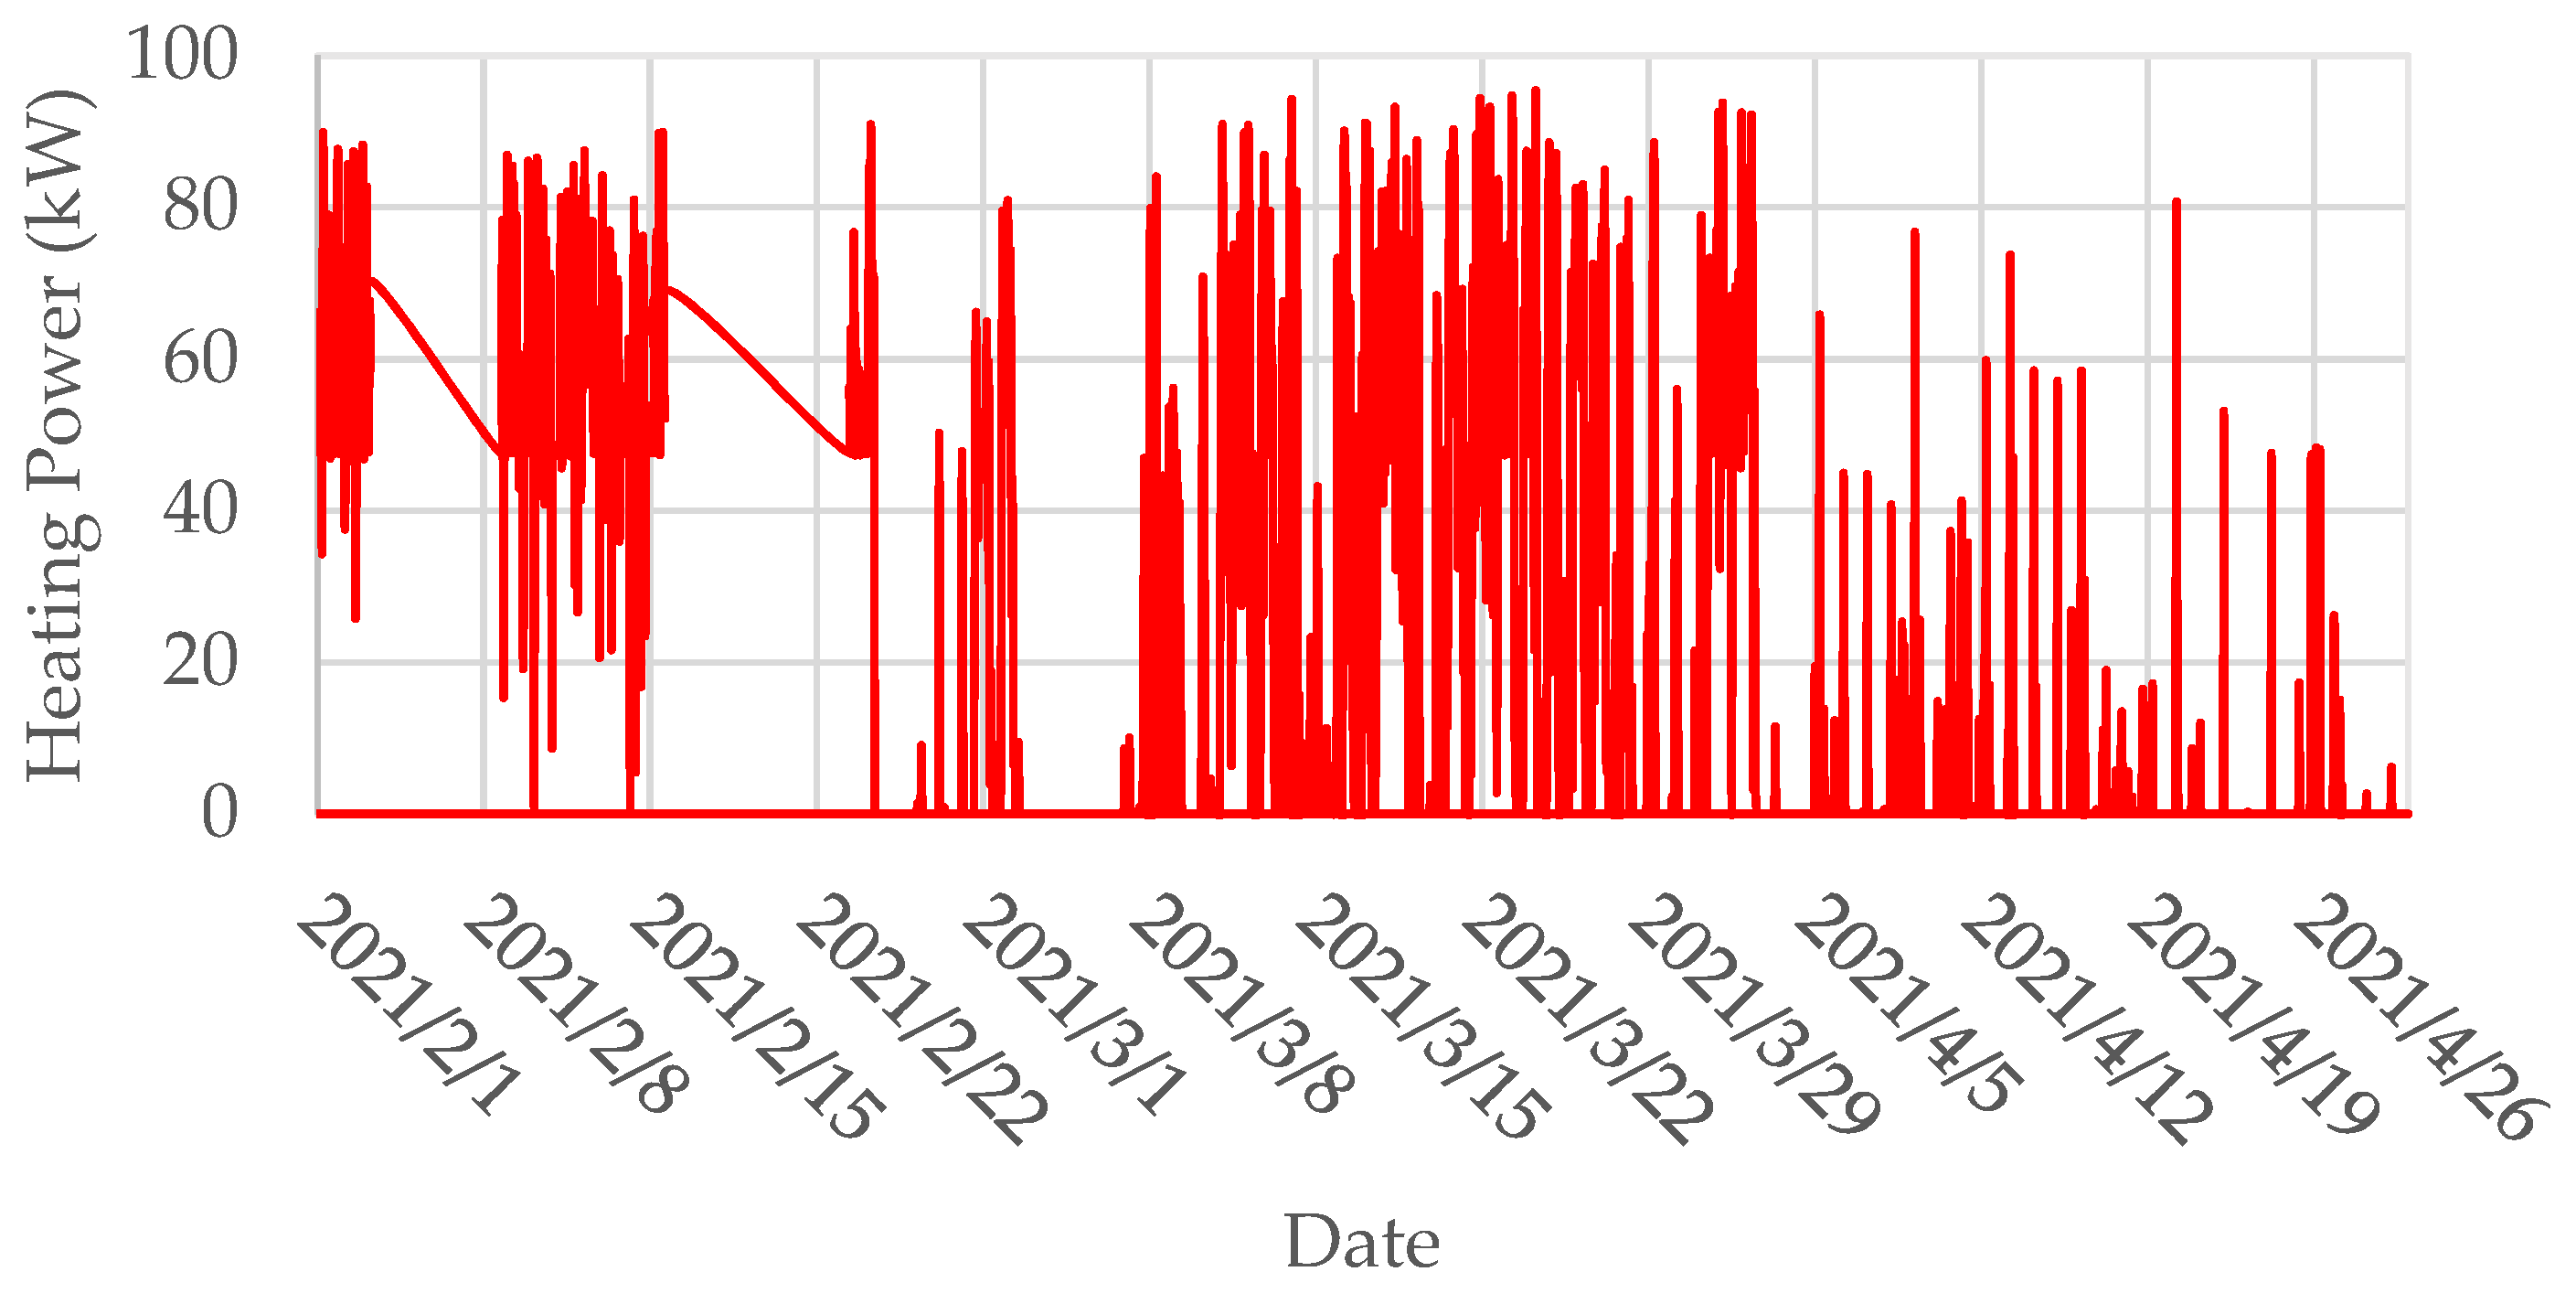
Figure 5 presents the indoor relative humidity in the church, clearly showing that its level was low and hardly exceeded 40%. This condition confirms the high ventilation rate inside the building, even during the occupancy hours of the church. On the other hand,
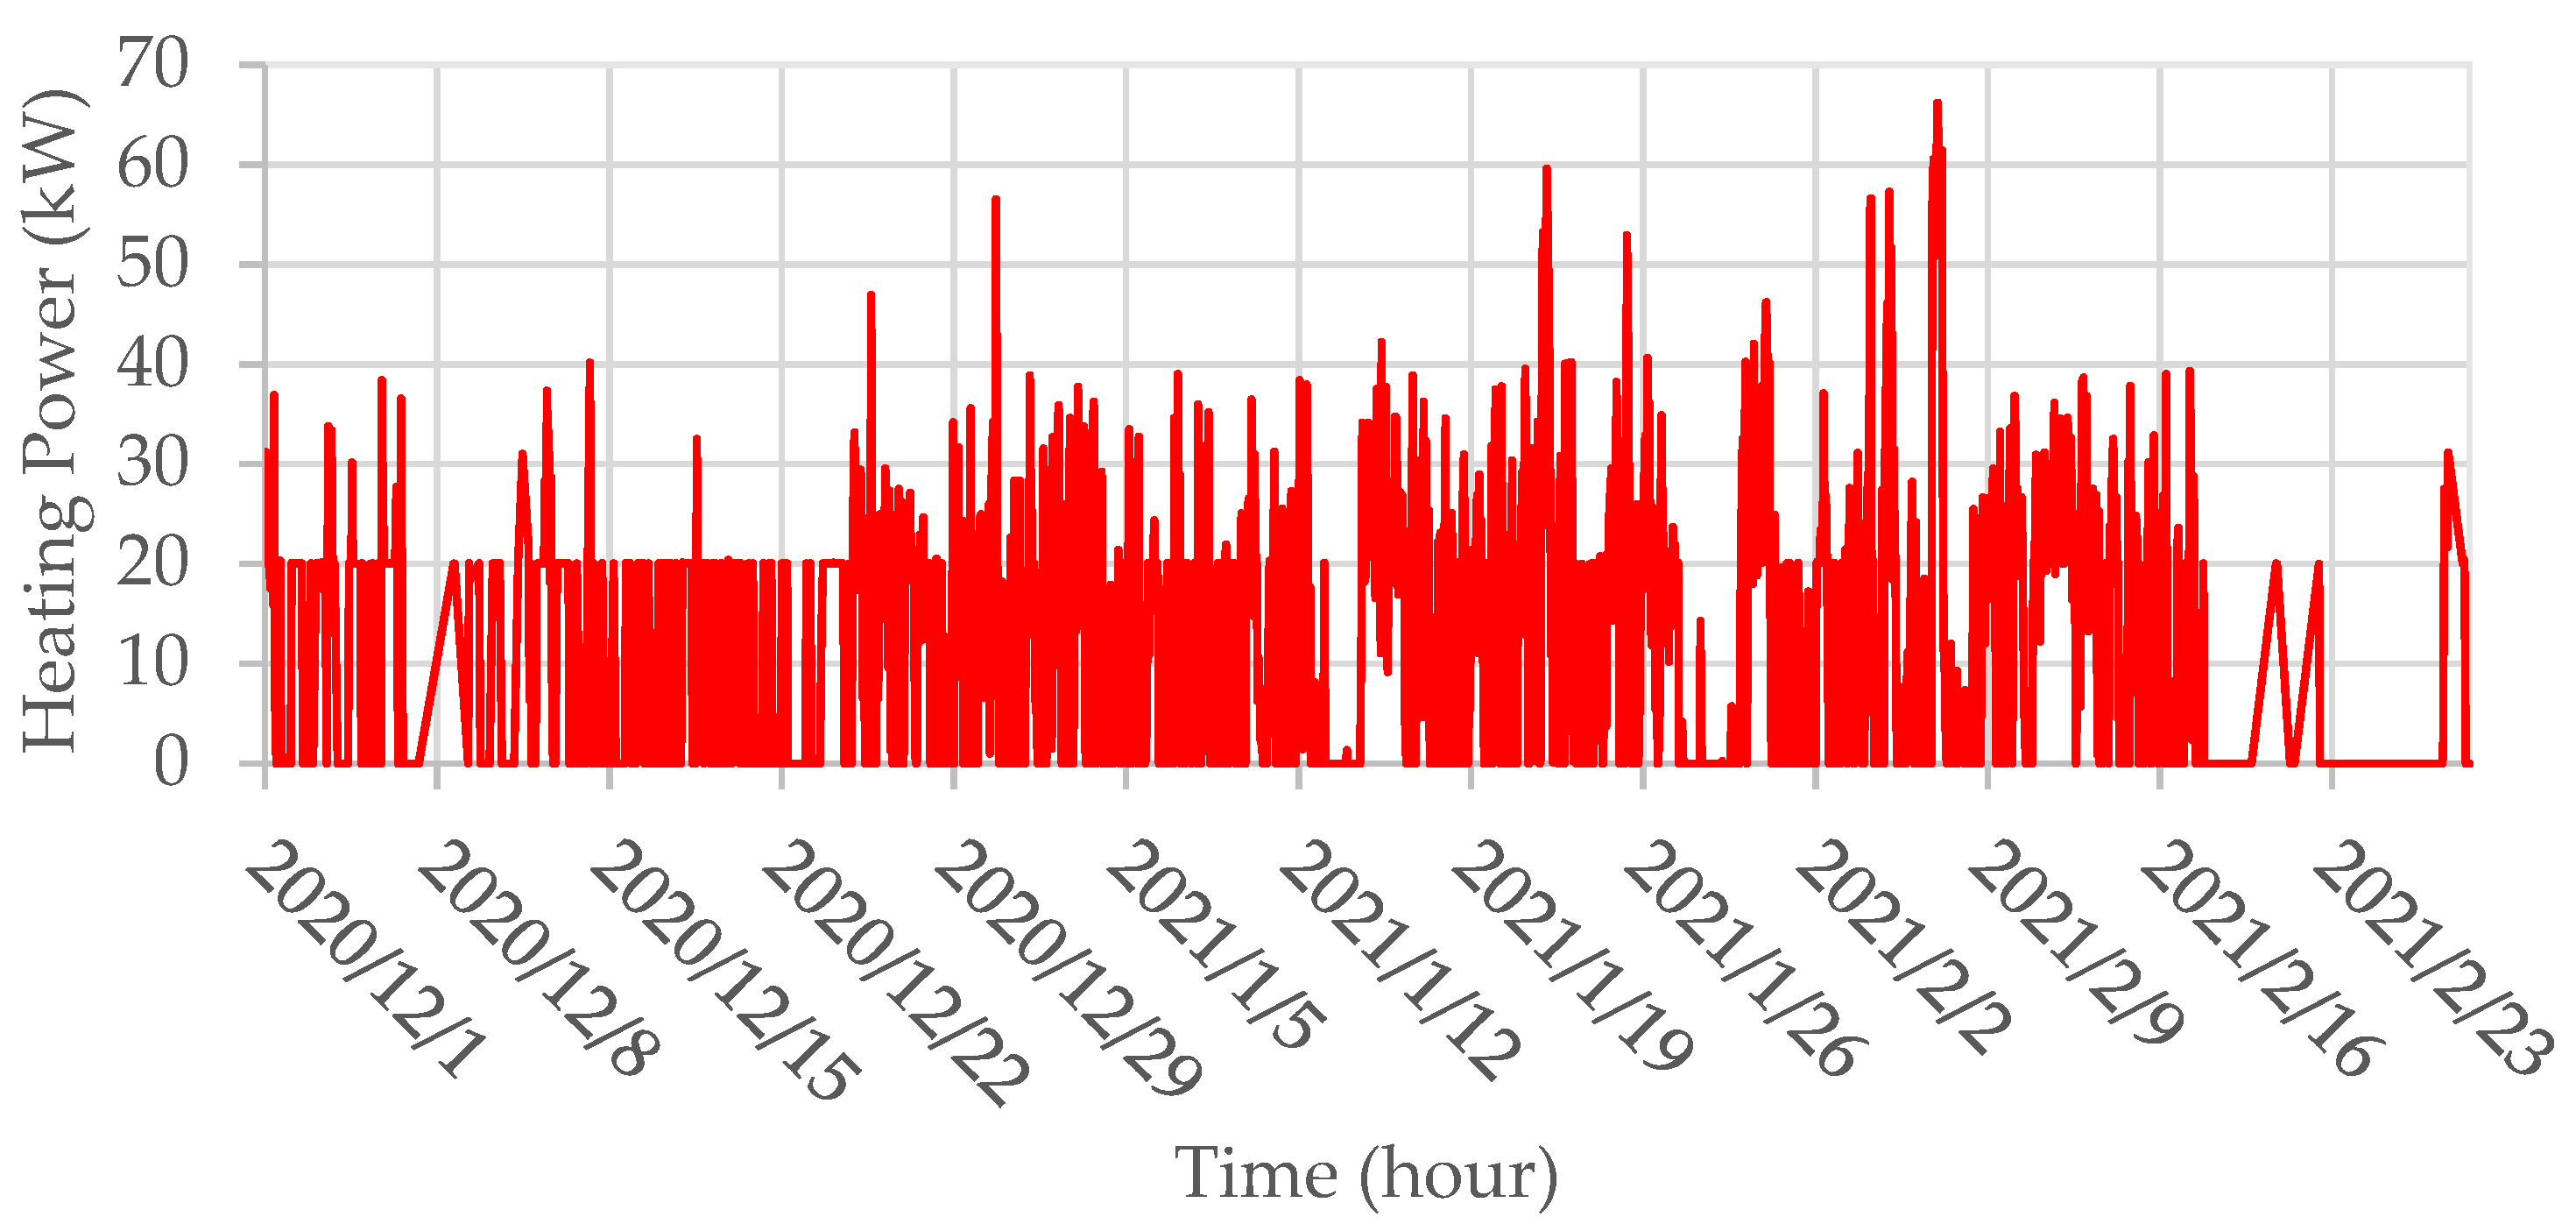
Figure 6 depicts the provided heating energy to the system which was determined according to the power and operating hours of the heating system.
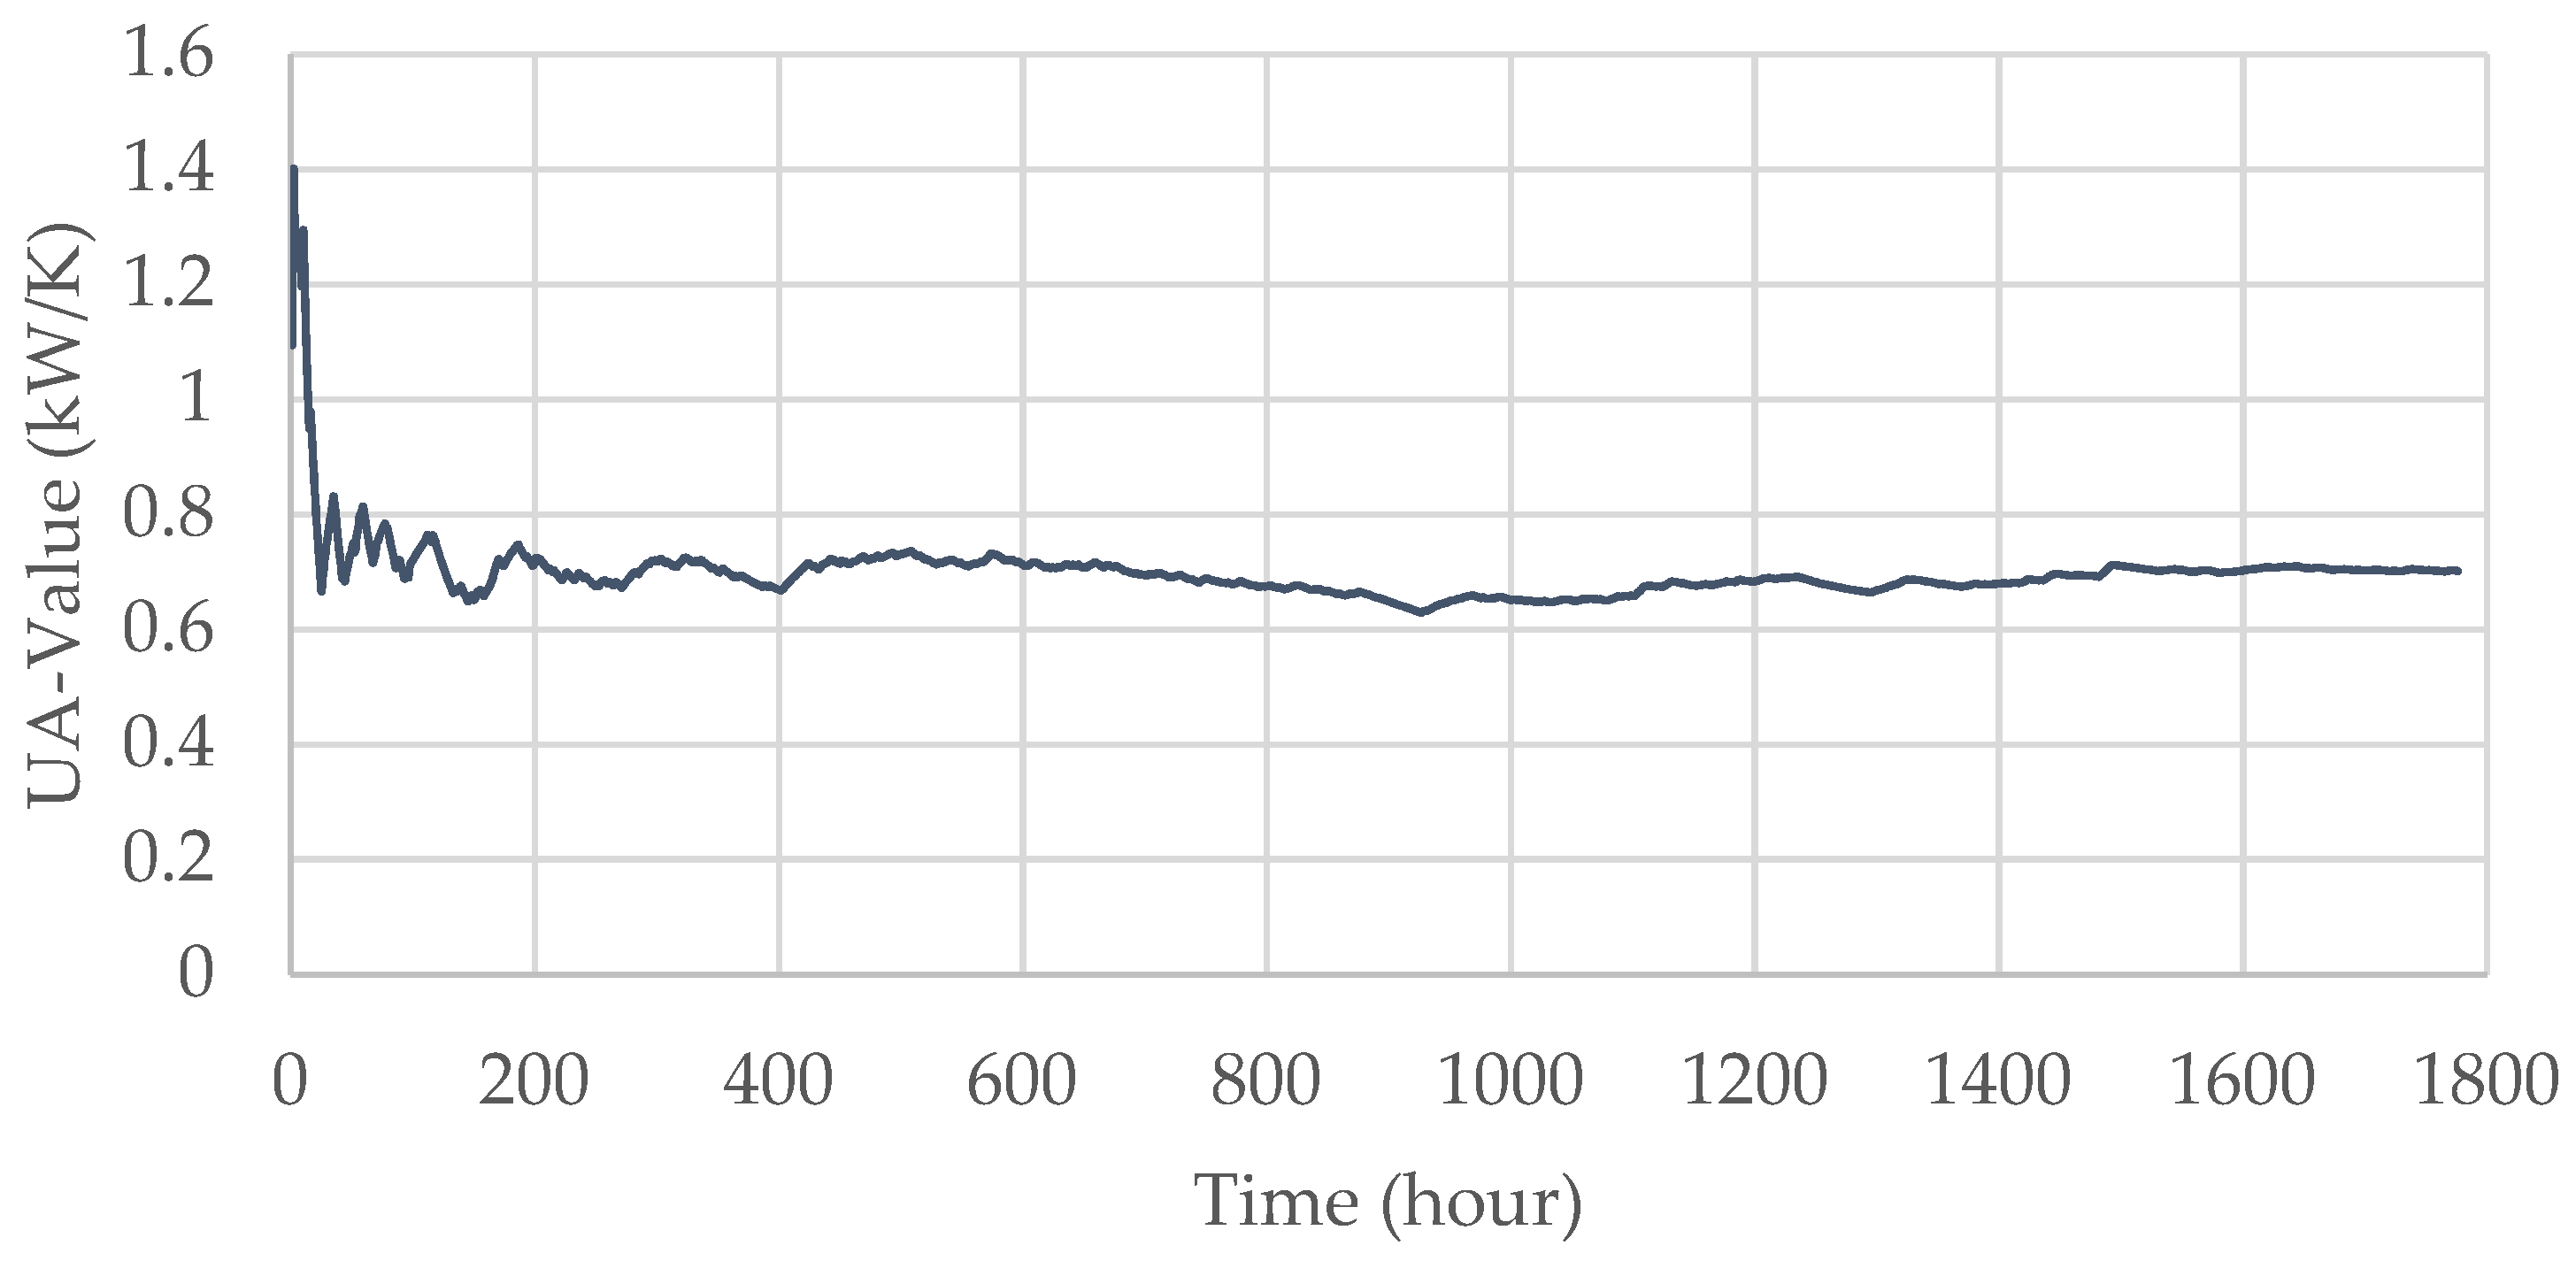
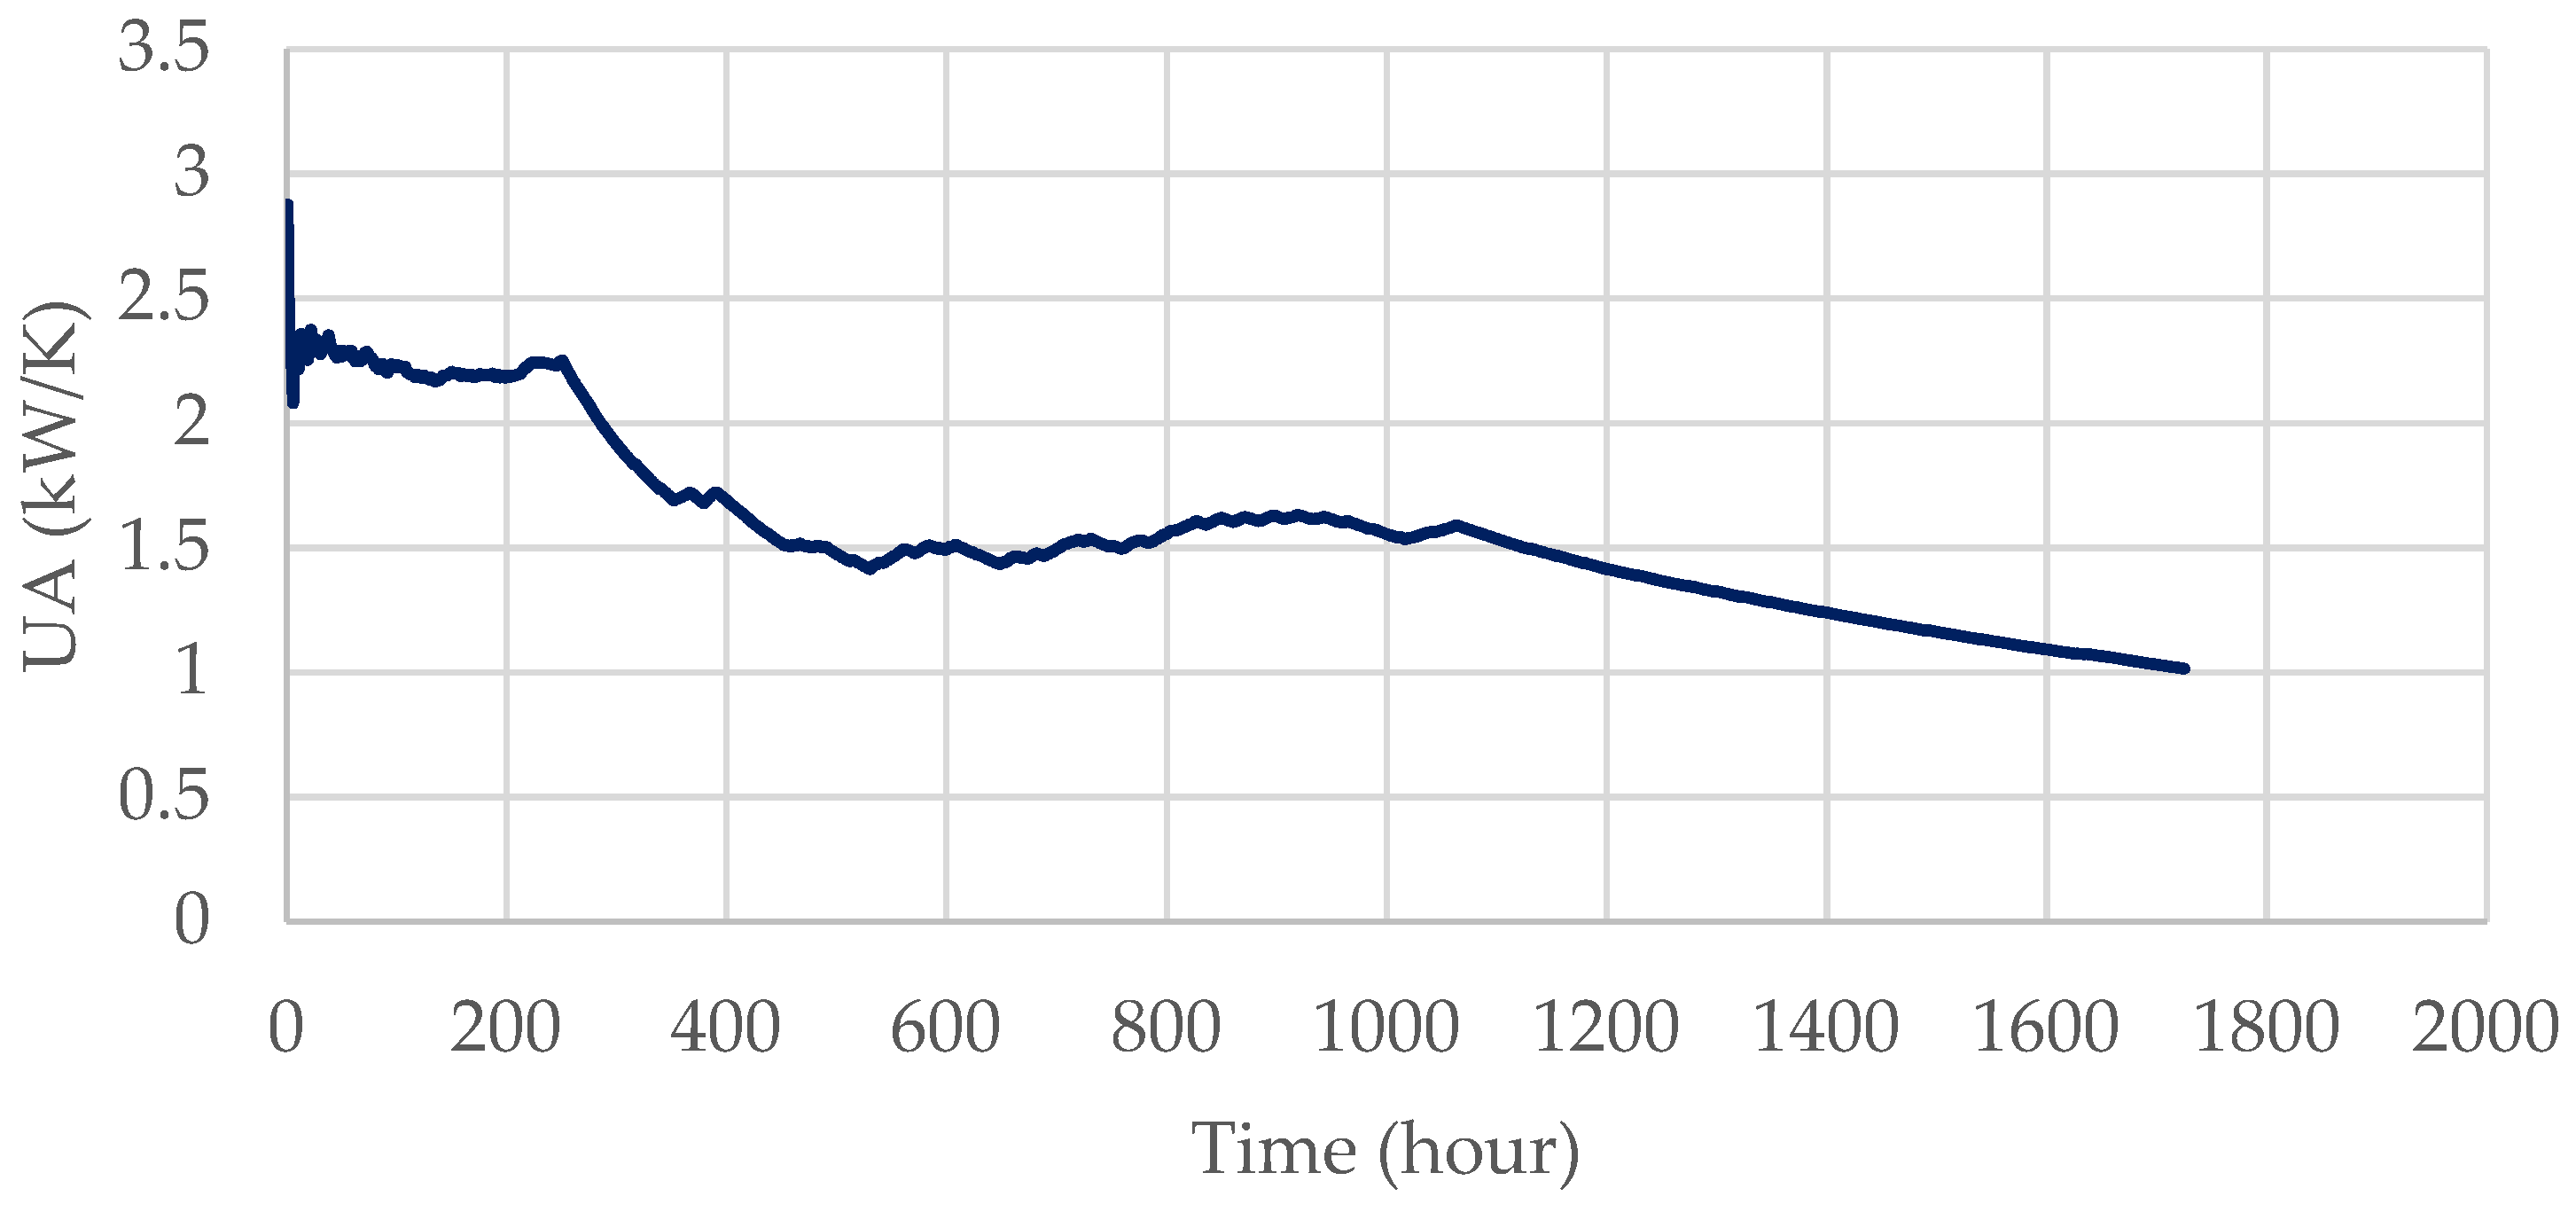
Using the indoor temperature data, outdoor temperature, the consumed heating energy for the whole building, and Equation (3), the
UA value could be drawn as shown in
Figure 7. At the beginning, there were large fluctuations in the calculated
UA value of the building. Over time, the calculated
UA value converged to a specific value, which was approximately 0.7 kW/K as shown in
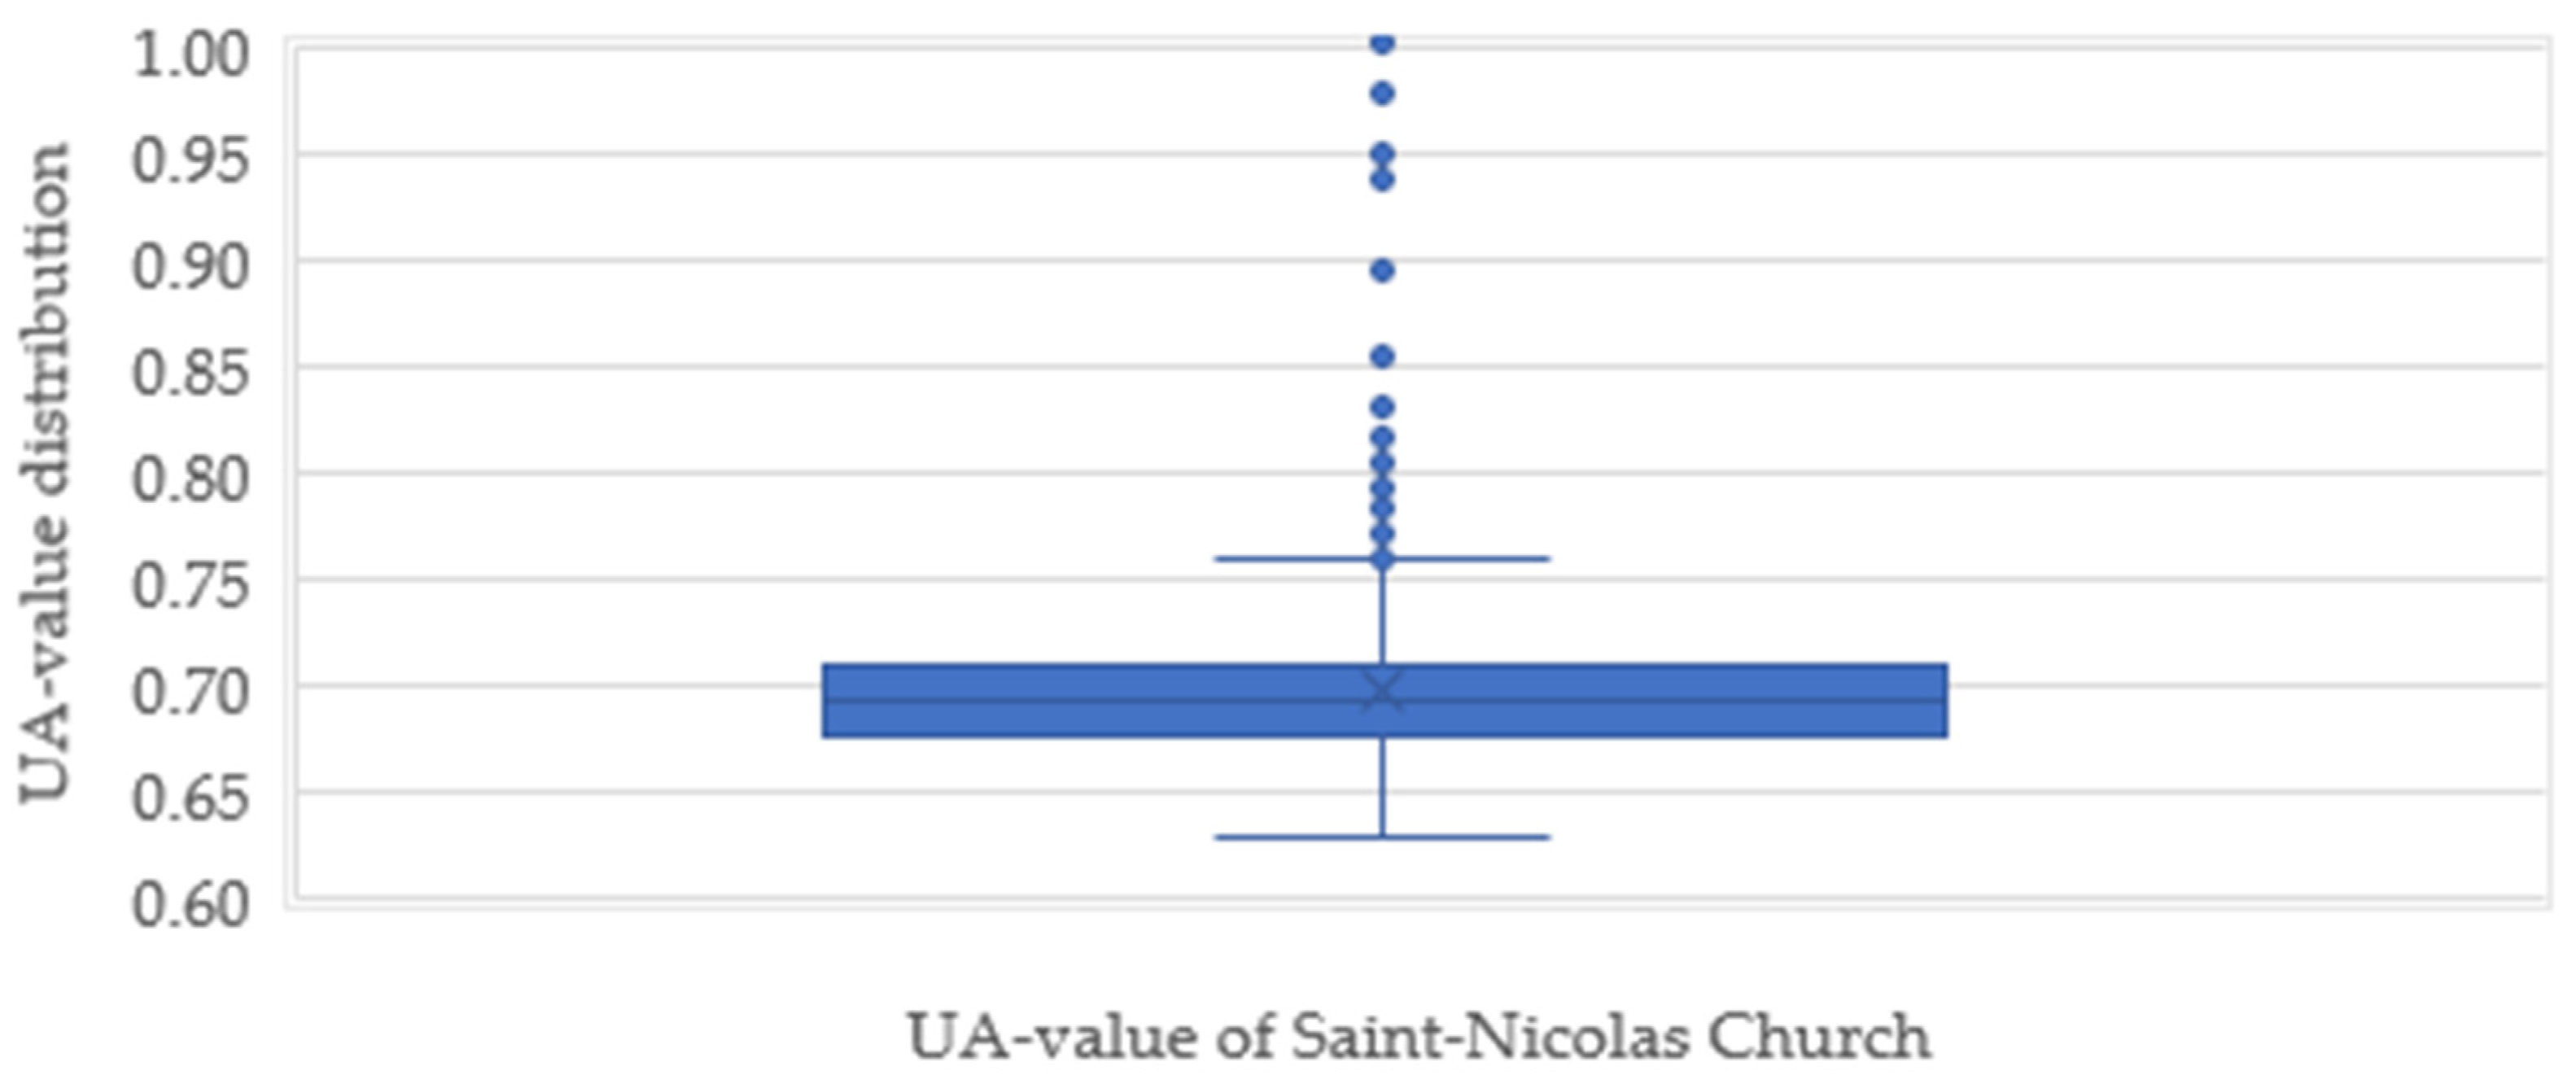
Figure 7. For a better assessment of the
UA value, the distribution of the
UA values is presented in
Figure 8, which shows that most of the calculated
UA values ranged between 0.63 and 0.71 kW/K, while more than 95% of the calculated
UA values were between 0.63 and 0.78 kW/K. In
Figure 8, values larger than one were filtered. Accordingly, the
UA value of the building was assumed to be 0.68 kW/K, which is the median of the calculated
UA values. This value was used to determine the heating demand in the building according to the degree day values by means of Equation (4) and the data in
Table 1.
Having plotted the indoor temperature conditions and the performance of the heating system in the building, the extent to which the Inteligg’s energy-saving service effectively reduced the energy consumption in the building was analyzed. According to
Table 4 and
Table 5, the actual performance of the heating system effectively reduced the energy consumption of heating for three consecutive months by 44%, 55%, and 38%, respectively in comparison to the degree days method with the reference temperature of 15.5 °C, while even higher energy savings were achieved compared to the case of the reference temperature of 17.5 °C. According to the degree days method for January and February with a base temperature of 15.5 °C, the Saint Nicolas Church required 10.6–14.6 MWh, while these values increased to 12.4–16.6 MWh for a base temperature of 17.5 °C. Using Inteligg’s energy-saving service, however, the building consumed only 5.9–9.4 MWh to maintain the comfort temperature inside the building. The comparison between the results of the degree days method and the AI algorithms in the Inteligg’s energy-saving service clearly confirmed the remarkably high energy saving rates that can be achieved when AI algorithms are used to control the indoor conditions in the building.
4.2. Townhall of Thermi
The three-floor building of the townhall of Thermi has a central heating system. In the precedent setup, the heating system’s performance was conditioned to the Mayor’s office’s indoor temperature. Data monitoring of the building after the installation of Inteligg’s smart thermostat and sensor modules suggested that the ground floor was the most critical space in the building. Thus, if the comfort level could be achieved there, it could be guaranteed that the first and second floors would be in the comfort zone as well.
As shown in
Figure 9, despite the temperature fluctuations in the building from February till the middle of March, the average temperature on the ground floor remained at approximately 22 °C.
Figure 10 presents the indoor relative humidity in the townhall of Thermi, indicating its low level that hardly surpassed 50%. This condition confirmed the high ventilation rate inside the building, even during working hours.
On the other hand,
Figure 11 depicts the heating consumption in the building according to the heating power and operating hours of the system. Because of security issues, a thermostat was installed on the hot water tank, so that the burner stopped working when the boiler temperature reached 60 °C.
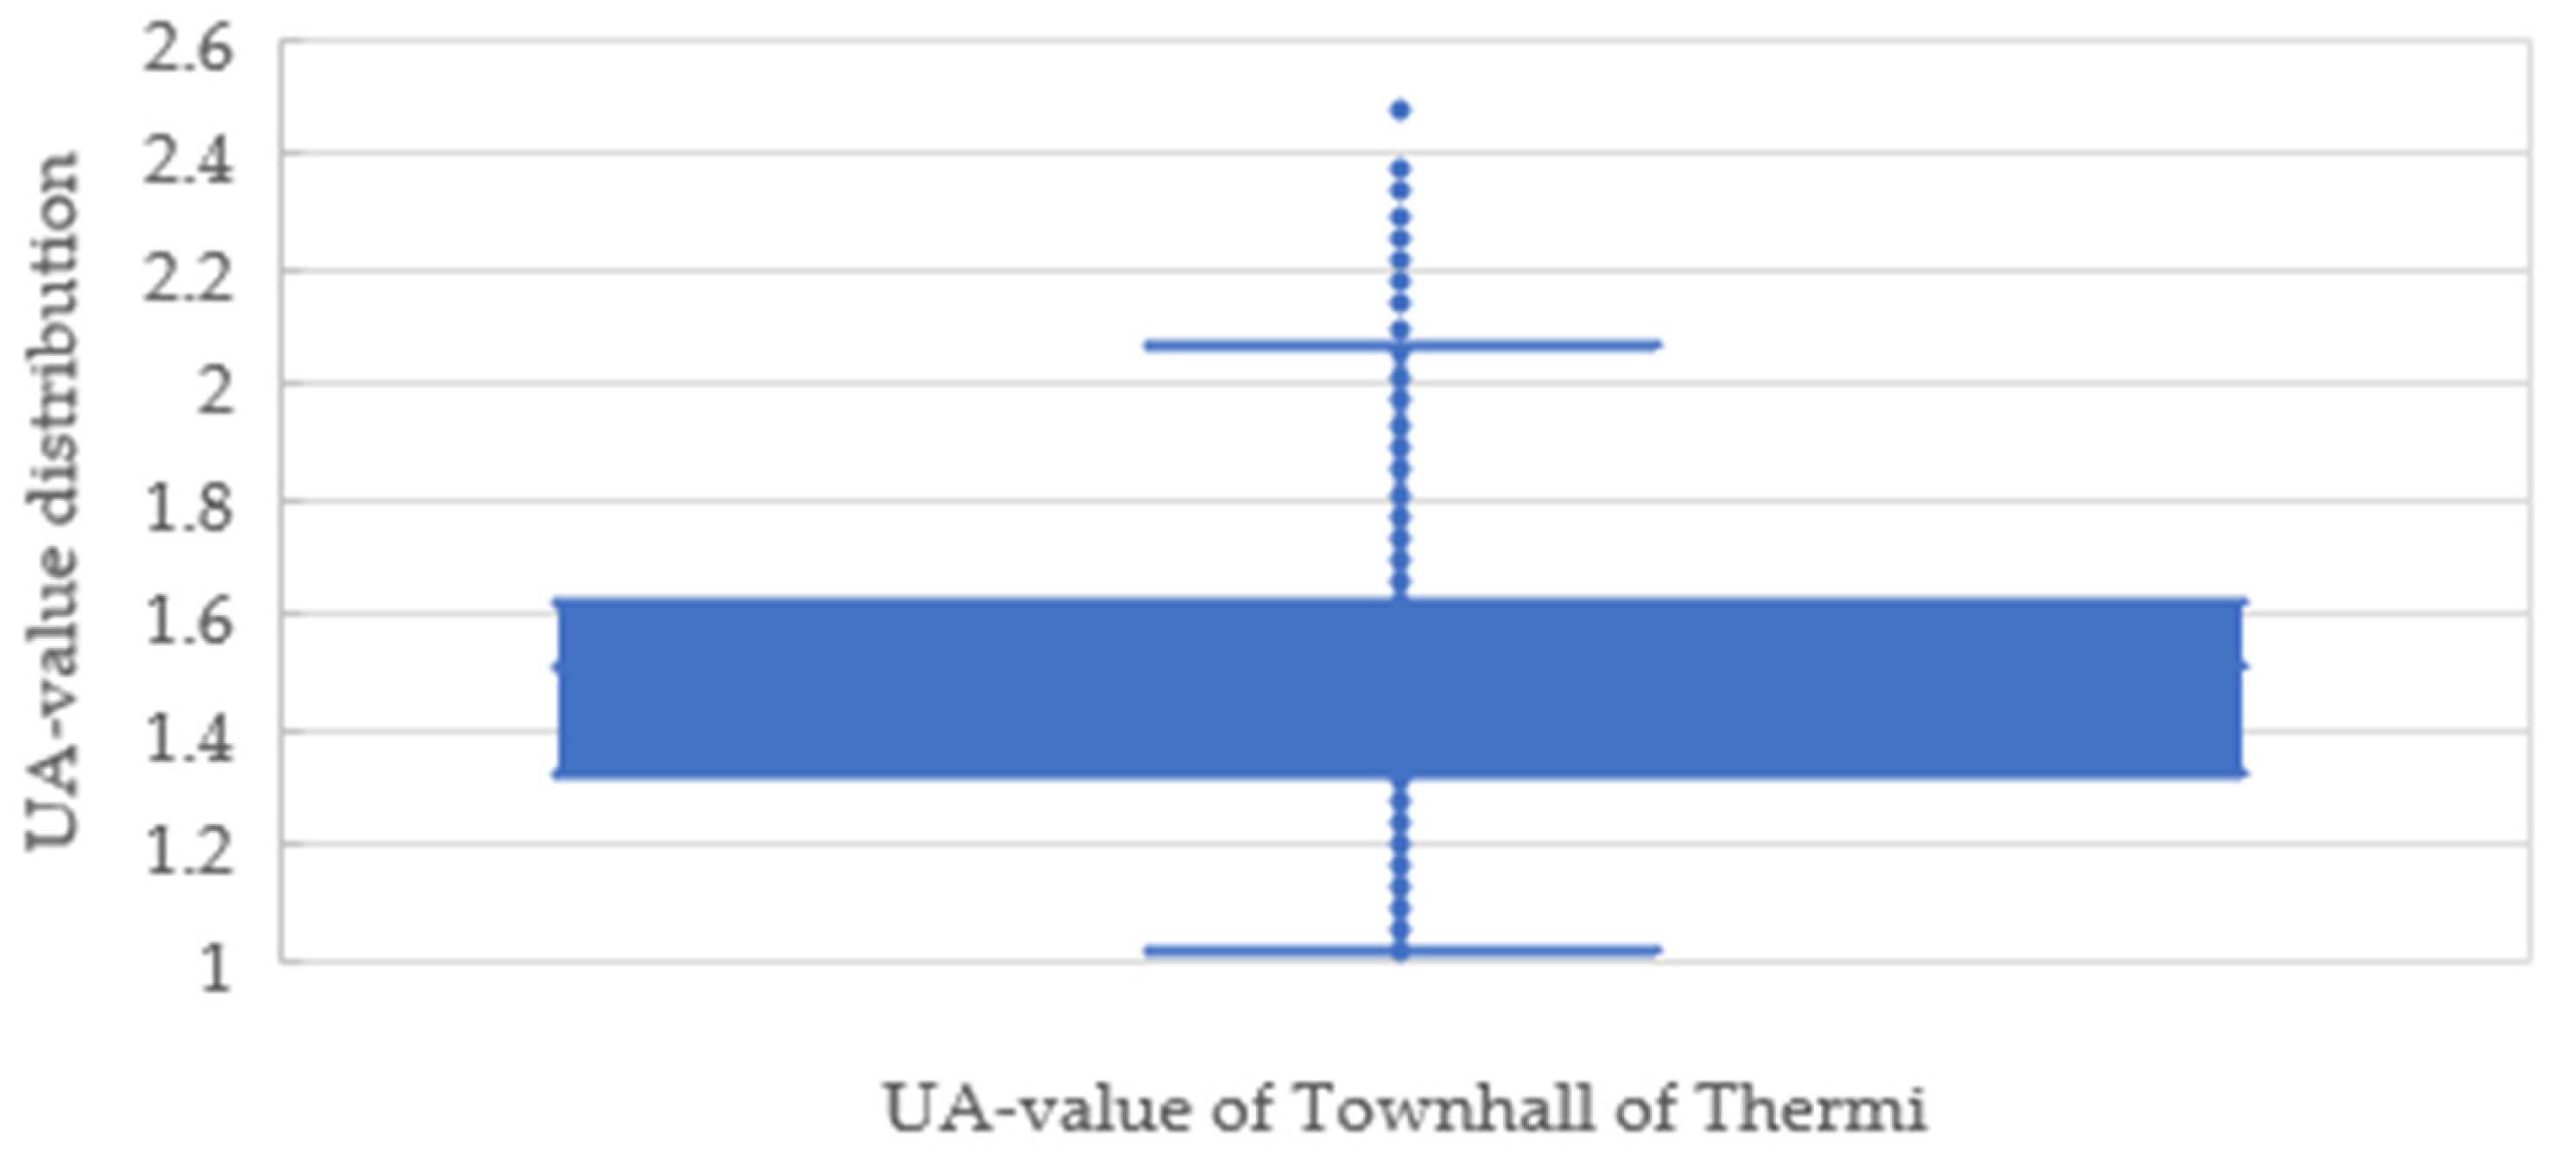
Using the indoor temperature data, outdoor temperature, operating hours of the heating system, and Equation (3), the UA value can be drawn as shown in
Figure 12. The UA value of the building converged to a specific value, as observed in the case study of the Saint Nicolas Church; however, the rate of convergence was lower in the present case study. This can be explained by the different occupancy profile of the building, combined with the COVID-19 measures required for higher ventilation rates inside the building that made the calculations more complex. The distribution of
UA values in
Figure 13 shows that most of the calculated
UA values ranged between 0.22 and 0.37 kW/K. Accordingly, the
UA value of the building was presumed to be 0.33 kW/K, which is the median of the determined values. This value was used to determine the heating consumption in the building according to the degree days method, and the data are presented in
Table 2 and by means of Equation (3).
Having plotted the indoor temperature and performance of the heating system in the building, the analysis focused on how effectively the Inteligg’s energy-saving service contributed to saving energy in the building under study.
Table 6 summarizes the energy consumption in the three scenarios considered in this work in order to quantitatively assess the energy savings achieved by the proposed energy-saving service. At this point, it is noted that no energy savings were observed in March due to two factors: (i) some improvements in system performance were needed to obtain the full control of the heating system, and (ii) there was a significant drop in the indoor temperature in March, as shown in
Figure 9, forcing the algorithms to update the building model and predictions. The benefit of this update was clearly observed in April, where the Inteligg’s energy-saving service significantly reduced energy consumption for heating in the building, and more than a 50% energy savings was recorded.
According to
Table 6, the actual performance of the heating system worsened in March compared to February, and approximately 2 MWh more energy was consumed for heating the building due to technical issues confronted during the experiment. However, when the system was fully deployed in April and training data were used to put the system’s performance under the Model Predictive mode, energy consumption for heating of the building dropped by more than 29% in comparison to the degree days method with a reference temperature of 15.5 °C. Under this condition, the building consumed only 1.6 MWh during April in contrast to the consumption of 3.7–5.4 MWh required to maintain thermal comfort in the building during April according to the degree days method. As shown in
Table 7, this represents an energy savings of 29–43% for the month of April. For an extreme ventilation rate for deploying COVID-19 measures in a building, Inteligg’s energy-saving service reduced the thermal energy consumption of the building by more than 42%.
4.3. Residential Apartment
The apartment under study in this paper uses a gas burner to produce hot water for heating the building. In the preceding setup, the heating system’s performance was conditioned to the manual thermostat inside the building. Similar figures to the ones presented for the case of the Saint Nicolas Church and the townhall in Thermi can also be illustrated for the residential apartment; however, these are omitted for the sake of economy of space. For the residential apartment, despite the temperature fluctuations in the building from March to the end of April, the average temperature in the apartment remained between 21 and 23 °C. The relative humidity varied between 45% and 60%, which is a normal condition in homes and residential spaces. The distribution of UA values can be determined similarly to the case of the previous buildings. Accordingly, most of the calculated UA values ranged between 0.01 and 0.02 kW/K. The UA value of the building was presumed to be 0.017 kW/K, and this value was used to determine the energy consumption according to the degree days approach.
According to
Table 8, the actual performance of the heating system during March and April improved significantly for the residential apartment as well. In March, the Inteligg’s energy-saving service was working in the energy-saving mode, and the main goal was to acquire training data to be used for the system to work under the Model Predictive mode in April. The operating hours of the heating system dropped by almost 67% in comparison to the degree days method with a reference temperature of 15.5 °C, which is equivalent to an almost 0.6 MWh savings. For an extreme ventilation rate, Inteligg’s smart thermostat system reduced the thermal energy consumption of the building by more than 75%, as shown in
Table 9.
5. Discussion
Saint Nicolas Church: According to the results presented in this paper, the UA value in this building was determined according to the indoor and outdoor temperatures and heating consumption of the buildings. Accordingly, energy savings of the heating system in comparison with two different scenarios were calculated. For the whole building in total, between 38% and 44% energy savings can be reported under various scenarios; specifically, 38% was the lowest energy savings rate in comparison with the degree days method with a reference temperature of 15.5 °C, while a 47–62% energy savings rate can be achieved under critical conditions for locations where COVID-19 measures need to be deployed for higher air circulation in buildings.
Townhall in Thermi: It was shown, after the full implementation of the Inteligg’s energy-saving service in the building, that up to a 30% energy savings was achievable, which increased to 43% under extreme ventilation conditions for deploying COVID-19 measures inside the building. The results demonstrate the particularly high energy-savings potential of AI algorithms in existing buildings without advanced automation controls for the heating system, even in cases of buildings constructed under less restrictive regulations on the specifications and materials for insulation. Specifically, between 23% and 43% overall energy savings were reported under various scenarios in this case.
Residential apartment: In this case, higher energy savings rates were achieved. More specifically, using AI algorithms can increase energy savings rates to at least 67%. However, it is noted that the experiment in the apartment was executed during March and April, when, in general, buildings consume less energy for heating. Importantly, the use of the Model Predictive mode resulted in higher savings rates. During April, the system was fully deployed, and the Model Predictive algorithms were employed to control the thermal performance of the heating system. The results obtained also confirm that a considerable energy savings rate was achieved when the building did not have a previously installed control system for heating.


 ,
, 


