Article

Two-Stage Lifecycle Energy Optimization of Mid-Rise Residential Buildings with Building-Integrated Photovoltaic and Alternative Composite Façade Materials

1
Research Institute for Sustainable Urban Development, The Hong Kong Polytechnic University, Hong Kong, China
2
Department of Mechanical and Automation Engineering, The Chinese University of Hong Kong, Hong Kong, China
*
Authors to whom correspondence should be addressed.
Buildings 2021, 11(12), 642; https://doi.org/10.3390/buildings11120642
Submission received: 28 October 2021 / Revised: 29 November 2021 / Accepted: 10 December 2021 / Published: 12 December 2021
(This article belongs to the Collection Low-Carbon Buildings and Urban Energy Systems)

Abstract

:
Reducing the lifecycle energy use of buildings with renewable energy applications has become critical given the urgent need to decarbonize the building sector. Multi-objective optimizations have been widely applied to reduce the operational energy use of buildings, but limited studies concern the embodied or whole lifecycle energy use. Consequently, there are issues such as sub-optimal design solutions and unclear correlation between embodied and operational energy in the current building energy assessment. To address these gaps, this study integrates a multi-objective optimization method with building energy simulation and lifecycle assessment (LCA) to explore the optimal configuration of different building envelopes from a lifecycle perspective. Major contributions of the study include the integrated optimization which reflects the dynamics of the whole lifecycle energy use. Insights from the study reveal the optimal configuration of PV and composite building façades for different regions in sub-Saharan Africa. The lifecycle energy use for the optimized building design resulted in 24.59, 33.33, and 36.93% energy savings in Ghana, Burkina Faso, and Nigeria, respectively. Additionally, PV power generation can efficiently cover over 90% of the total building energy demand. This study provides valuable insights for building designers in sub-Saharan Africa and similar areas that minimize lifecycle energy demand.

1. Introduction

1.1. Study Background

The increasing consumption of natural resources and primary energy and its accompanying greenhouse gas (GHG) emissions is considered a threat to environmental sustainability [1]. It is widely recognized that the building sector is a major culprit of materials and energy consumption and therefore possess huge potentials to reduce global emissions through energy efficiency improvement and renewable energy applications [2,3,4]. Particularly, the building sector consumes about 30% of primary energy globally and 40% in Europe and the United States with an equivalent share of GHG emitted [5,6]. In 2014, the Paris Agreement sought a global effort to reduce global warming to 1.5 degrees Celsius, compared to pre-industrial levels [7]. Participating countries were required to submit nationally determined contributions and long-term low greenhouse gas emission development strategies in 2020. For instance, the European Union has set goals to increase energy efficiency to at least 32.5% and the share of renewable energy by at least 32% by 2030 [8]. In Asia, Hong Kong has also set an ambitious carbon reduction of 26 to 36% by 2030 using 2005 as the baseline [9]. These targets have expedited the exploitation of energy-efficient building design and technologies in such developed countries. However, it is not prevalent in developing countries such as those in sub-Saharan Africa.
In order to accelerate global carbon emission reduction, the UN has emphasized the need for ambitious plans to drastically improve energy efficiency and increase the share of renewable energy sources in the latter region [10]. Various targets encompassing final energy generation mix, heating and cooling requirement, and transportation are being introduced at various levels of governance. Comparatively, renewable power has received the vast majority of attention whereas targets for energy-efficient cooling and heating of buildings has been introduced to a lesser degree [10]. It is well known that drastic improvement in building designs is a critical pathway to achieving these targets. Although practical, it is presently less feasible due to the lack of localized energy efficiency building codes and standards in the sub-Saharan Africa region [11]. In Ghana, the residential sector consumed about 46% of electricity generated in 2019 [12]. This demand is projected to increase by 5.8% annually due to the increasing population coupled with poorly designed buildings [12]. Presently, frequent power outages underscore the inefficiencies in supply-side management. Although demand-side management possesses huge potentials to resolve this energy deficit, the Energy Commission of Ghana has focused on increasing the generation capacity. However, this has been evidently futile as a result of persistent load shedding and power outages in the region. Moreover, the current supply-side management is expensive and unsustainable due to the increasing use of thermal sources (62.7%) [12]. These prevailing conditions therefore necessitate studies which investigate strategies to reduce building energy consumption in the sub-Saharan Africa region.

1.2. Literature Review

Successful efforts to reduce building energy demand in developed countries have been mainly driven by passive and active design strategies. Typical passive design strategies explored include the shape of the building, the orientation of the building, construction materials, window-to-wall ratio, and ceiling height whereas active strategies include efficient energy systems and renewable energy generation. The integration of parametric design through building information modelling (BIM), building energy simulation and optimization methods enable the transformation of building design problems into an optimization problem in order to explore the aforementioned strategies [13]. For instance, Al-Saadi and Al-Jabri [14] employed a computational approach to optimize the envelope design of buildings in hot climates. The study evaluated envelope design strategies including envelope airtightness, roof, and wall insulation, thermal mass, window area, window glazing and window shading. The results showed that the window shading is thermally and economically beneficial in the studied hot climates while insulation of 2–5 cm is cost-optimal. Saroglou et al. [15] explored the impact of three single-skin façades and ventilated double skin façade on the energy performance of low carbon high-rise buildings. The study further explored the interaction between façade types, orientation, and height which showed varying energy demand reduction at different floors within the building. Additionally, the ventilated double skin façade design with low glazing can reduce cooling loads by 15%. Another study proposed a building design optimization process to evaluate daylighting and energy performance of multiple design options in order to generate an optimized design [16]. Design parameters included building depth, roof ridge location, skylight width, height, and orientation, windows, and shading. An office building was optimized which revealed the trade-off between daylighting and energy performance. Ilbeigi et al. [17] developed a method to optimize building energy consumption using artificial neural network and a genetic algorithm. The proposed method was applied to a case building in Iran by exploring the thermophysical properties of walls, floor, roofs, and windows which reduced energy demand by 35%.
A study developed an integrated decision-making strategy to optimize energy demand, energy production, and adaptive thermal comfort towards a zero-energy high-rise building [18]. Their approach involved a two-stage optimization of design parameters including window-to-wall ratio (WWR), wall u-value, glazing construction, airtightness of the façade, cooling setpoint and photovoltaic (PV) surface area which reduced building energy demand by 33%. Cuce et al. [19] evaluated natural ventilation as a passive cooling strategy for educational buildings by exploring design strategies such as the depth of the room, atrium, solar chimney and orientation. The results indicated that proper design of single-sided and cross-ventilation can ensure cooling and improve the air quality in the case study building. Acar et al. [20] focused on optimizing building envelope parameters to reduce the energy use and cost of residential buildings in Turkey. The design variables investigated include wall material types and thickness, external wall, roof, and floor insulation, glazing types, and window dimensions. The results indicated that the most energy-efficient solutions also led to the lowest lifecycle cost. Cuce and Riffat [21] also validated the thermal performance of a commercially available vacuum glazing using CFD-based simulation. The study also explored the application of translucent aerogel support pillars in vacuum glazing which showed an improvement of the U-value by up to 67%. Cuce et al. investigated the thermal, energy, and optical performance of heat insulation glass under different cooling and heating season through laboratory and in situ tests [22]. The results indicated that in comparison to conventional single glazing, the heat insulation glass provides energy savings of about 48% and 38% during cooling and heating seasons respectively. Furthermore, a 16% higher generation can be achieved due to its nanolayer reflective film. In another study [23], the thermal performance of a novel vacuum tube window was investigated through numerical and experimental investigations which showed a higher thermal resistance in comparison to other commercialized windows.
With regards to integrated photovoltaic applications, Chen et al. [24] optimized the thermal and optical properties of photovoltaic façades and conventional passive parameters for a high-rise building in Hong Kong. The results showed that the window geometry, thermal, and optical properties were the most important parameters and a net energy demand reduction of about 49% was achieved. Chen et al. [25] also developed a holistic design optimization process to investigate the interactions between photovoltaic façades and traditional passive design parameters. A case study in Hong Kong revealed that a net energy demand reduction of about 71% could be achieved with the optimum design configuration. Another study optimized the performance of a dynamic photovoltaic system for adaptive shading which showed a net energy saving of up to 80% [26]. Skandalos and Karamanis [27] also explored the optimal configuration of different building-integrated photovoltaics under different climatic zones. The optimal building integrated photovoltaic (BIPV) configuration achieved energy savings of up to 43%.
It is clear from the foregoing that huge energy savings can be achieved during the operational stages through passive and active strategies. However, the increasing use of low energy materials especially within the building envelope may have a counteracting effect on energy savings since such materials have high embodied energy [28]. Some studies suggest a point after which further operational energy saving leads to exponential increases in embodied energy [29]. In fact, concerning low-energy buildings, over 45% of the lifecycle energy could be due to the embodied energy use, thus from a lifecycle perspective, the embodied energy could override the operational energy savings [30]. It is therefore crucial to minimize operational energy use without compromising the embodied energy performance. Thus, a properly optimized building envelope must ensure an improved energy performance from a whole lifecycle perspective. The development of low-energy buildings from a lifecycle perspective is becoming an intense research topic [31]. Tushar et al. [32] developed an evidence-based integrated framework to optimize the energy and environmental performance of a residential building from a lifecycle perspective. The study first developed scenarios to optimize passive design parameters including building orientation, shading, infiltration rate and window glazing. Following this, the optimized building designs were developed in Autodesk Revit BIM tool and connected with Tally (a BIM-enabled lifecycle assessment (LCA) tool) to evaluate the environmental impacts of the alternative designs. The results of a case study in Melbourne showed that only a moderate level of insulation was required to achieve optimal energy efficiency and also revealed the best insulation materials for minimal environmental impacts. In these studies, the embodied energy is estimated separately and its confounding effects on the operational energy is not explored.
A few studies have focused on joint optimization of the operational and embodied energy of building from a lifecycle perspective. For instance, Lin et al. [33] developed a multi-objective optimal building envelope model to design the optimal configuration of building envelopes and air conditioning systems in Taiwan. The model explored design variables such as windows, sunshade, glazing, wall and roof materials, and air conditioning systems to reduce the construction cost and the environmental impact of material manufacture. The optimized case reduced carbon emissions by 58.3% while increasing cost by only 5.3%. Kiss and Szalay [34] developed a modular parametric lifecycle optimization framework for a multi-apartment house in Hungry. The study evaluated design strategies including building geometry, envelope, fixtures, and heating energy source which produced up to an 80% reduction in environmental impacts. The result also showed that optimizing the operational or embodied impacts alone leads to a sub-optimal design. Shadram and Mukkavaara [35] integrated BIM with a multi-objective optimization approach to explore the trade-off between embodied and operational energy uses of new building projects. The method was tested on a low energy dwelling in Sweden which showed that small operational energy savings could lead to larger increases in embodied energy. Shadram et al. [29] also developed a multi-objective optimization approach to explore a wide range of retrofitting solutions for a Swedish multi-family residence from a lifecycle energy perspective. The study investigated retrofitting measures including material types, materials quantities, window types, and HVAC systems to optimize building design solutions that satisfy the Swedish energy-efficient building codes by exploring a trade-off between embodied and operational energy uses. Abbasi and Noorzai [36] combined a multi-objective optimization method with BIM and LCA to determine the optimal trade-off between embodied energy and operational energy of a residential building in Iran. The results showed that up to 65% of energy savings can be achieved through renewable energy.

1.3. Objectives and Novelty of Study

The literature review shows that there is a limited number of studies that jointly optimize the embodied impacts of buildings from a lifecycle perspective. Most studies focus on design parameters for the operational stage or perform a stepped assessment in which the operational stage is solely optimized, followed by a simplified estimation of the embodied impacts of the building. In doing so, the impacts of confounding parameters in a joint optimization remain unexplored. The integration of building information modelling and optimization methods provides promising prospects to extensively explore the trade-off between operational and embodied impacts. Moreover, there are no identified studies to optimize indigenous façade types and buildings archetypes in sub-Saharan Africa, where poor envelope designs lead to large heat gains through the building envelope. Due to the extremely hot weather conditions in these areas, sustainably designed envelopes are critical to reducing overall lifecycle energy consumption. It is therefore necessary to understand how envelope design strategies affect the overall lifecycle energy performance of the building.
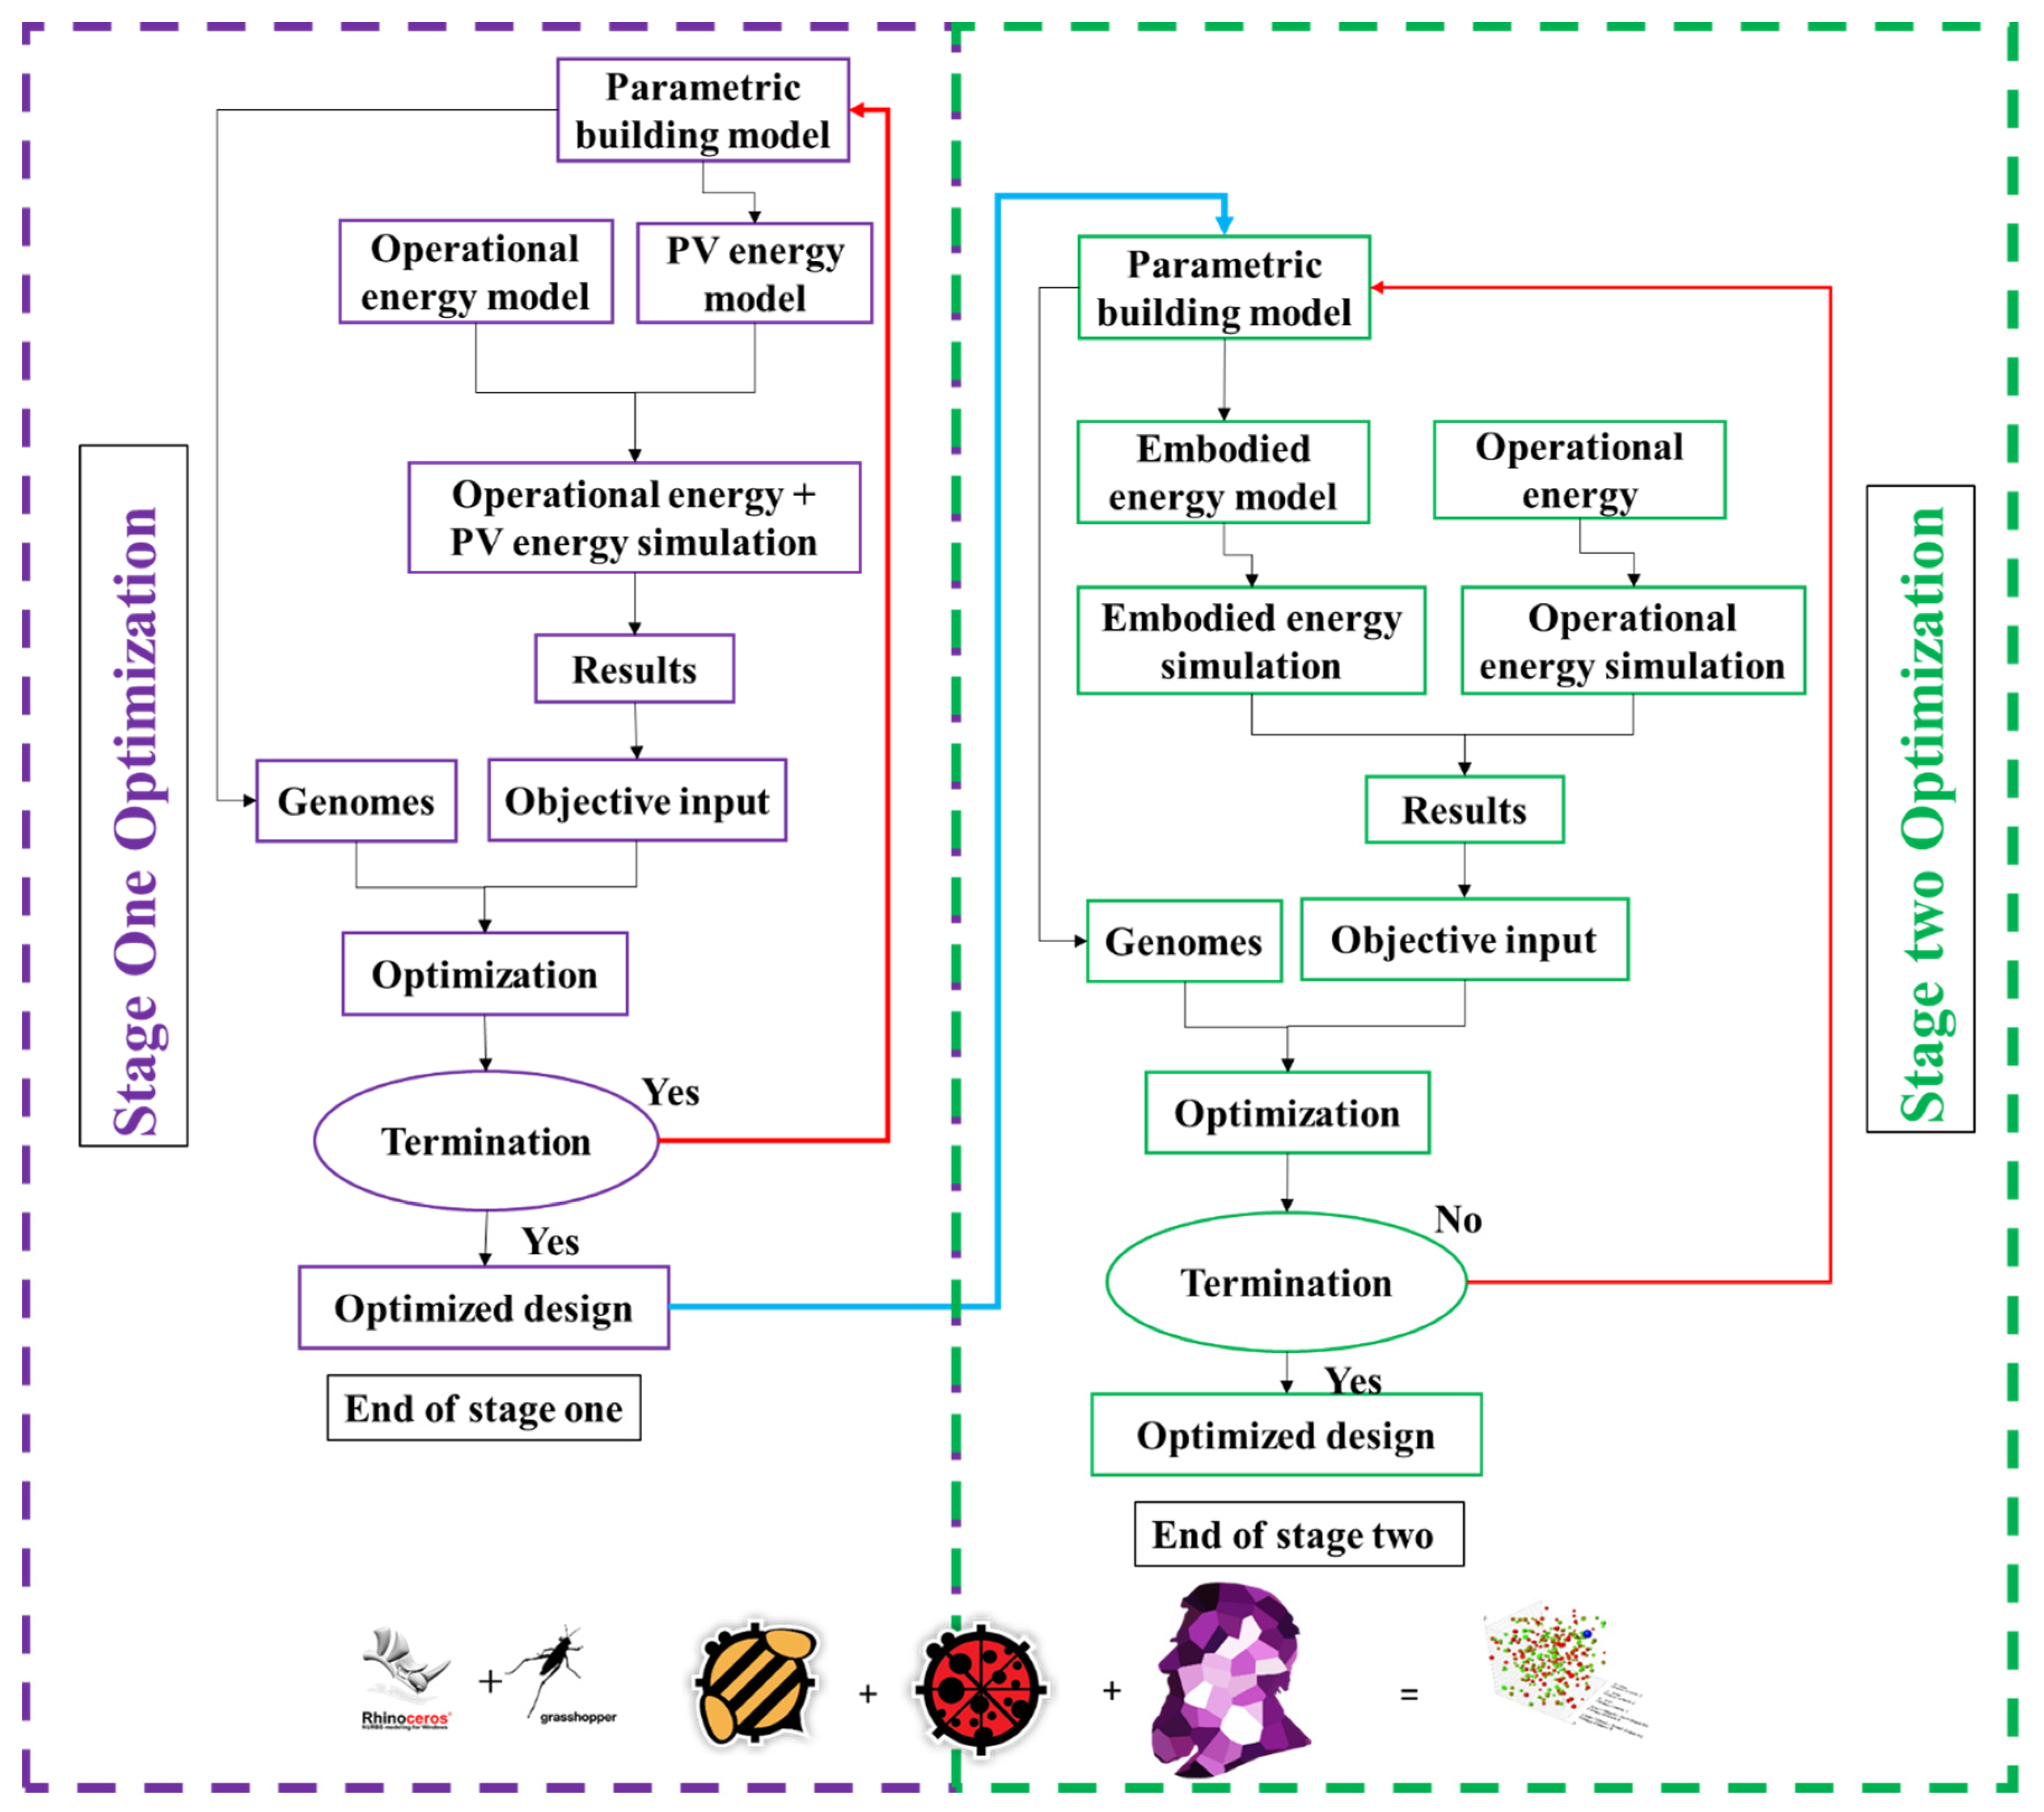
The aim of this study is to determine the optimal configuration of different building envelopes with local materials that are representative of the climatic conditions sub-Saharan region of Africa from a whole lifecycle perspective. A genetic algorithm is coupled with building energy simulation and LCA to explore the optimal performance of different building envelopes and design variables under different climatic conditions in the sub-Saharan Africa Region. Major contributions of the study include an integrated optimization that reflects the whole lifecycle performance of buildings. The optimization model is properly defined to include and solve the counteracting effects of building materials on the trade-off between operational and embodied energy in the lifecycle of buildings. Additionally, a comprehensive exploitation of the performance of local building envelope materials under the diverse climate of sub-Saharan Africa can facilitate the adoption of energy-efficient building envelopes. Buildings contribute over one-third of the energy use in these regions, therefore improvement in energy efficiency is crucial to reduce the overall energy consumption. Furthermore, the introduction of building-integrated photovoltaics will increase the share of renewables in the total electricity mix.
The remaining content of this paper is divided into three sections. 
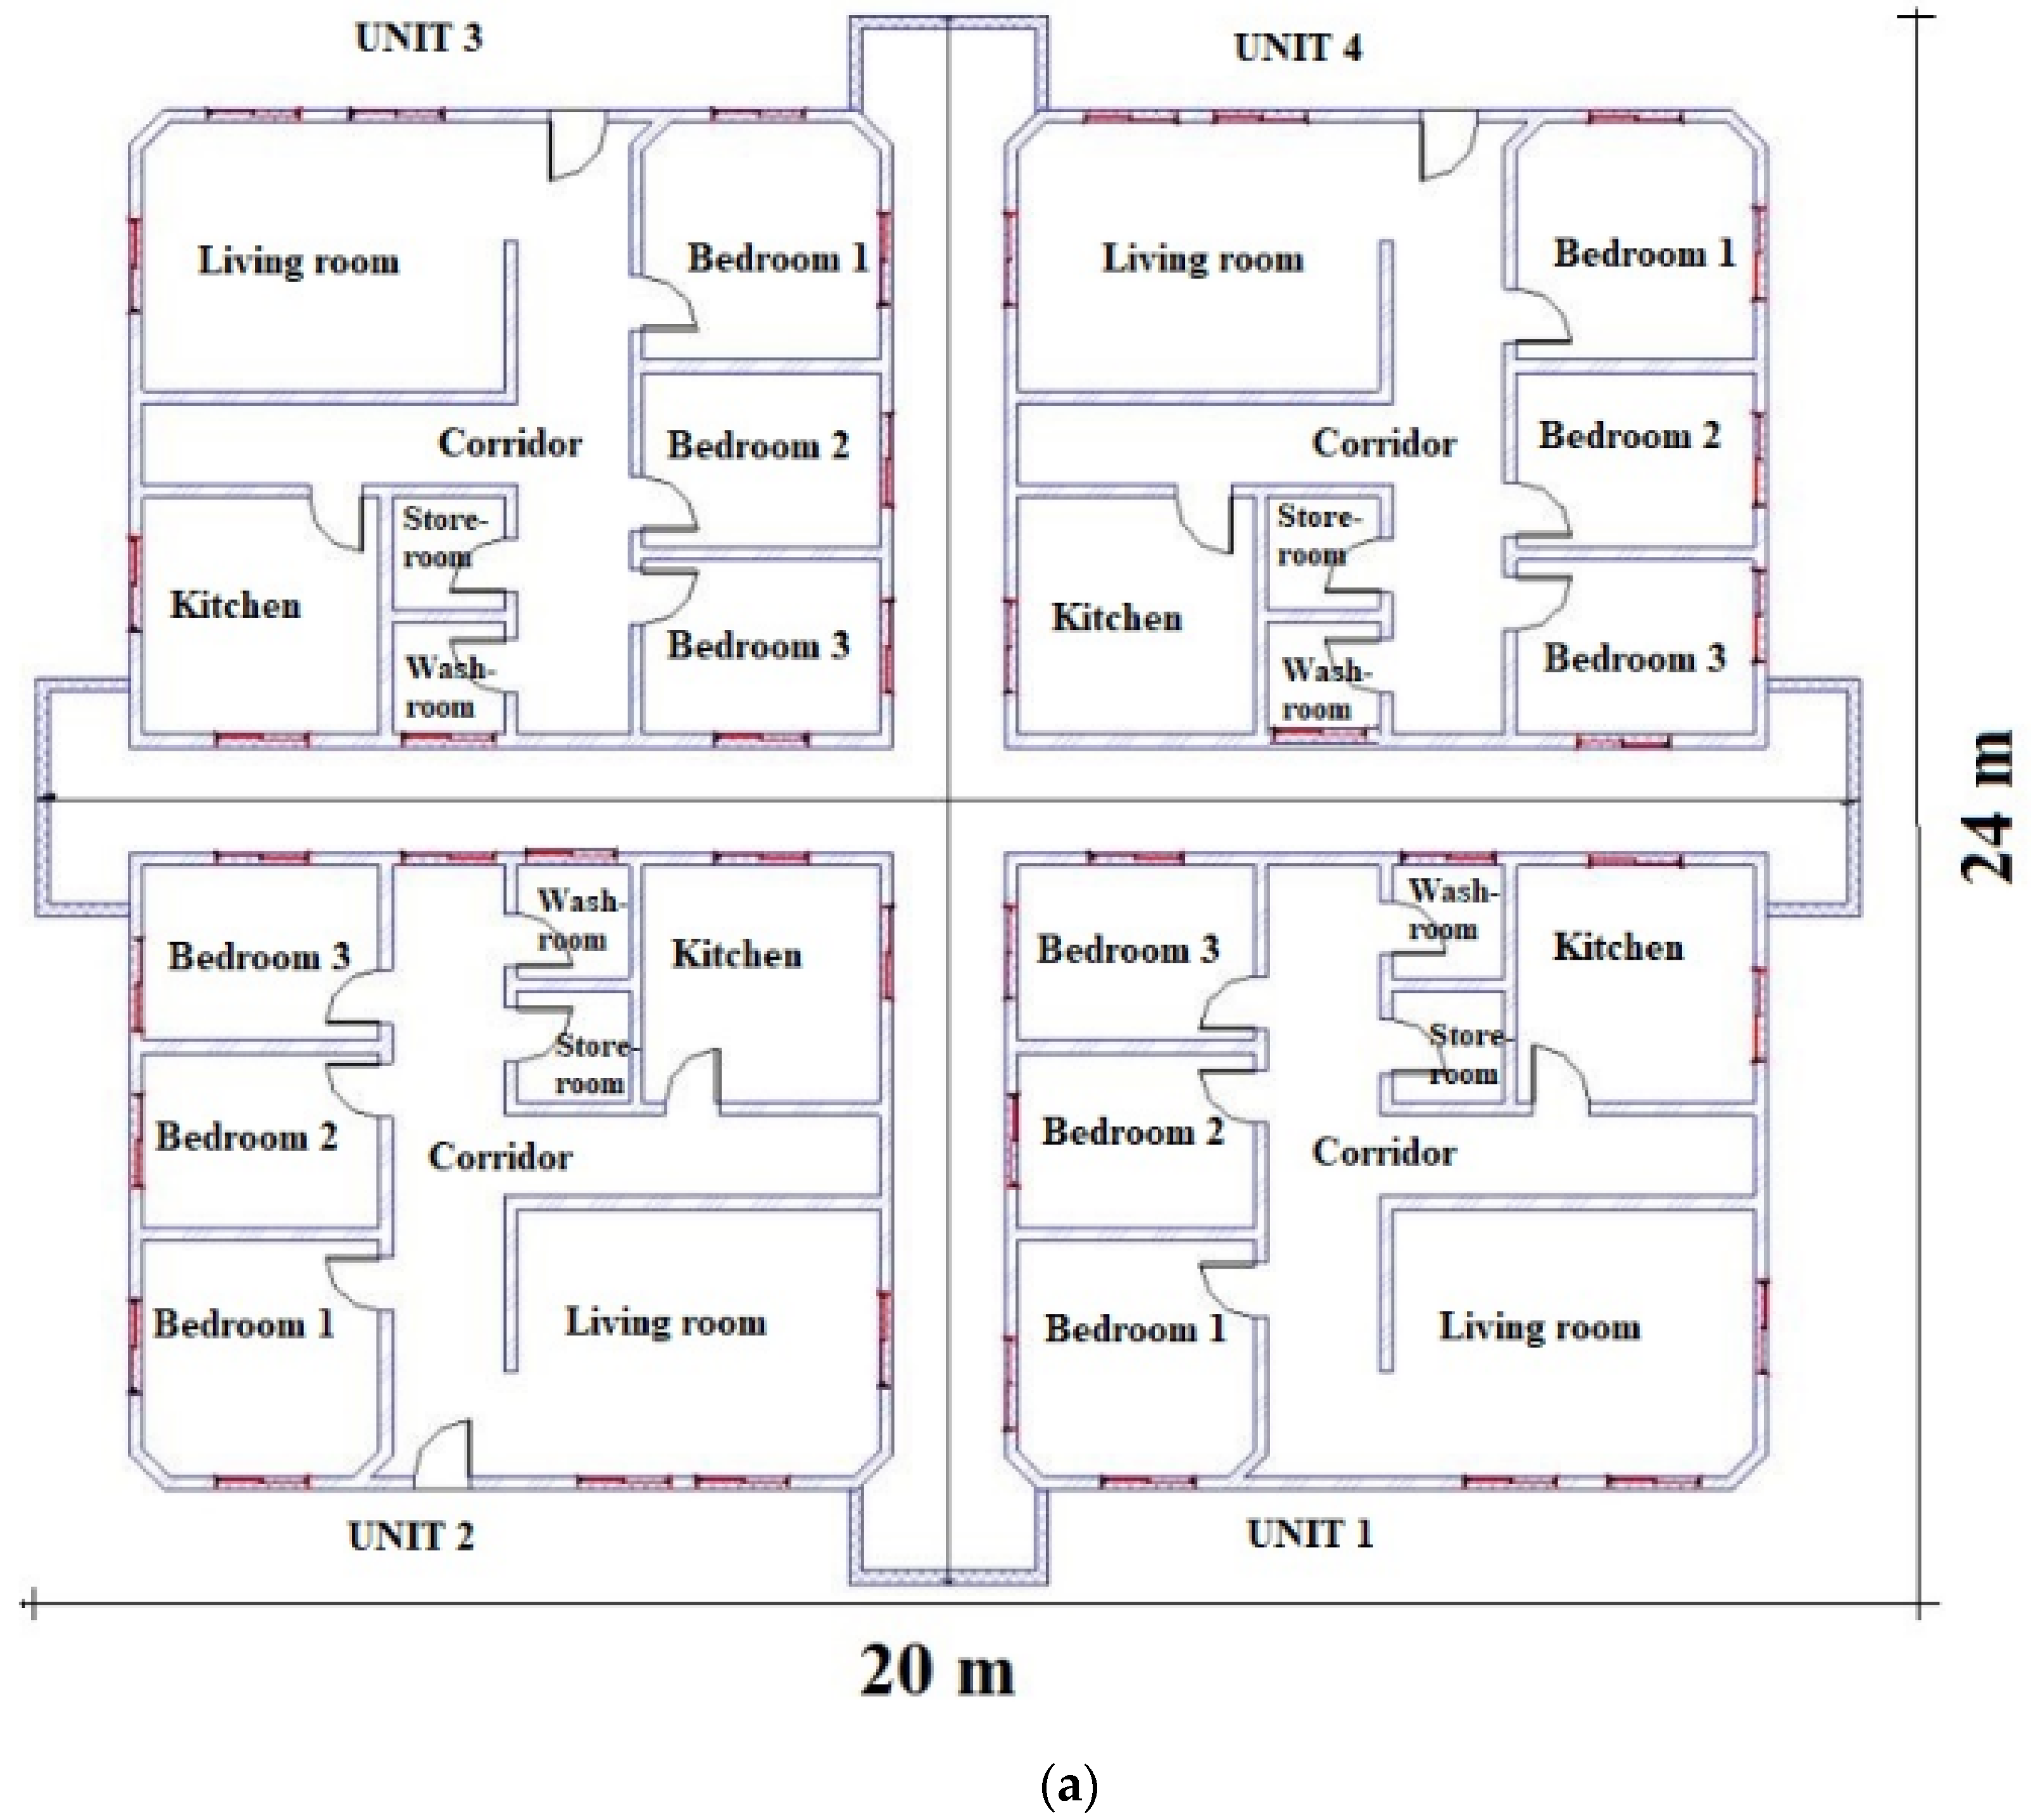
Section 2 presents the modelling of building energy use based on different design variables and façade configurations before the optimization method. Section 3 shows the performance of each building façade and the interaction between design variables through a case study. Finally, conclusions and recommendations are given for the sub-Saharan African region in Section 4.

2. Methodology

The systematic approach to achieve the research objective is illustrated in Figure 1. First, a base model was designed parametrically with reference to local data on residential buildings. Then, an embodied and operational energy use model is then designed to perform a two-staged optimization process. The design of the energy simulation models, optimization models, weather data and design variables are illustrated in detail in the sections below.

2.1. Case Study Building Model

The case study model is a mid-rise residential building located in Accra, Ghana. Such buildings are classified as mid-income dwellings. The building was designed with reference to as-built drawings retrieved from the owner and a field survey and is representative of a typical residential building in sub-Saharan Africa. The building is a 10-floor apartment block with a total area and height of 30 m. The floor plan and 3D model are shown in Figure 2. Each floor has four units, a stair, an elevator, and a corridor that leads to the four units. Additionally, each unit consists of a living room, kitchen, washroom, storeroom and three bedrooms with a total surface area of 480 sq m. The envelope of the base case consists of a 150 mm sandcrete block wall with a 15 mm thick cement sand render on both sides, a 100 mm reinforced concrete floor, with 25 mm thick cement sand mortar and ceramic tiles, an Aluzinc metal roofing sheet with timber carcassing, and 6 mm clear single glazed aluminium windows. A parametric model of the case building is built in McNeel Rhinoceros/Grasshopper which is a valid modelling platform with plugins for numerous analyses including the energy simulation using Ladybug and Honeybee [37].
Regarding the thermal zones, each space within the units, the connecting corridor and stairs are considered as separate thermal zones. The building schedules illustrated in Figure 3 and Figure 4 were defined through a survey with the building occupants. The figures illustrate a daily profile that is composed of hourly values. Each hourly value represents a fraction of the occupancy, HVAC, lighting, or equipment uses in relation to the peak values (i.e., 1.0). All living spaces are occupied during non-working hours whereas corridors and stairs are occupied before and after non-working hours. All spaces are equipped with a split-type air conditioner (COP of 2.6) except the connecting corridors, stairs, storerooms, and washrooms which are naturally ventilated. The building requires only cooling and a cooling setpoint of 24 °C is defined.

2.2. Low-Energy Design Measures

The study explores a number of passive and active design strategies related to building geometry, renewable energy application and the thermophysical properties of façades used within the region of the case study building [11]. The strategies related to building geometry and renewable energy systems were selected with reference to the reviewed studies and summarized in Figure 5. For the thermophysical properties of the façades, a field survey was conducted in order to identify different local façade types and materials used within the region. Detailed descriptions of the survey on different local façade types are provided in [11]. Through the survey, four local façades including that of the base case model were identified. In addition, a BIPV window is also investigated in this study. The passive strategies and active strategies investigated include window-to-wall ratio, building orientation, external wall material type and external wall material thickness, HVAC system, rooftop photovoltaic system, and the BIPV window. Particularly, the façade materials are defined according to commercially available prototypes in order to provide a realistic result that is practically applicable to the region. Opaque mono-crystalline silicon modules with an average conversion efficiency of 15% are used for the rooftop PV whereas semitransparent amorphous silicon modules with a conversion efficiency of 6.3% are used in the windows of the BIPV window [24]. The rooftop PV is assumed to cover 90% of the roof space in order to ensure roof accessibility. Various orientations of the solar panel were investigated to maximize the PV electricity generation. The range of the design parameters investigated, and the construction detail of the studied façades are illustrated in Table 1.

2.3. Climate Data

The case study building is located in Accra with a Tropical Savanna Climate (Aw) under the Koppen–Geiger climate classification. The dominant characteristics are prolonged hot summers with moderate rainfalls from March to mid-November. The monthly average outdoor temperature range is between 23 °C and 34 °C whereas the daily outdoor average temperature ranges from 24 °C during the night to 30 °C during the day. According to the climatic data, the climatic condition in the northern areas of Ghana and other regions of sub-Saharan Africa vary significantly. Bearing in mind that climate is a critical determinant of building energy consumption, two other zones/countries are selected across sub-Saharan Africa to explore the impact of climate on the building cooling load. In particular, a capital city is identified in each zone/country to set a specific weather file: Nigeria (Abuja) and Burkina Faso (Ouagadougou). An hourly weather file for each city is retrieved for the energy simulation model. The weather file for each city is retrieved from Climate Analytics in the EPW format for Energy Plus which is a widely used energy simulation program. These weather files are typical meteorological year (TMY) weather data which represent the long-term mean weather conditions of the selected locations [39,40].

2.4. Energy Analysis

First, the energy analysis is implemented in two stages simultaneously: operational energy analysis and embodied energy analysis. The operational energy simulation includes the net impact of building energy use (annual cooling, lighting, and equipment load) and PV energy generation. The parametric building model is connected to Honeybee plugin components which provide the function of energy simulation. Honeybee is utilized to assign constructions, internal loads, lighting, HVAC (ideal load) and occupancy schedules, and weather files. Hereafter, an IDF file is generated and run in EnergyPlus which produces the simulation output. The values for infiltration rate are preset in the Honeybee plugin which represents a passive house, tight building, ASHRAE 90. 1-2013, average building, and leaky building [41,42]. The simulation output includes annual cooling, lighting, occupancy, and equipment loads. Similarly, Honeybee is used to parametrically define PV surfaces (including rooftop PV and semitransparent vertical BIPV façades) which are coupled with a generator module. Weather data are then assigned to simulate the PV electricity generation. The total building energy use and PV electricity generation are both expressed in kWh/m2/yr. The building space load and physical characteristics are illustrated in Table 2.
Embodied energy is defined as the energy required for material manufacturing, transportation, construction, maintenance and repairs, and the end-of-life cycle processes of the building. LCA is performed in this study to measure the embodied energy of different construction sets and also to evaluate the trade-off between operational and embodied energy. The LCA is performed with Grasshopper modelling tools. After assigning constructions to the building model, additional parameters are created using the native Grasshopper components to define the needed input parameters. The quantity of materials is extracted from the model and matched with embodied coefficient in Grasshopper. The embodied energy is then evaluated by multiplying the material quantities by their embodied coefficient. The system boundary is set for the material production stage to the construction stage and the building lifespan is defined as 60 years. The impact of PV is calculated is also estimated per unit area and with a lifespan of 25 years so that the PV modules are replaced once in their lifetime. The embodied coefficient is sourced from Bath ICE since no country in sub-Saharan Africa has an LCA database. Similarly, the embodied energy of the building is expressed in terms of kWh/m2/yr.

2.5. Optimization

A staged multi-objective optimization is performed by incorporating energy simulation and embodied impacts assessments tools with a multi-objective optimization algorithm to find the optimal building design from a lifecycle perspective. This approach allows the iteration of design parameters in the search for a solution that corresponds with the optimal design goals. The optimization is performed in Wallacei, an optimization plugin for Rhino/Grasshopper. The Wallacei plugin is driven by a genetic algorithm and allows users to define iteration loops for different applications. Its analytical tools also allow for different evaluations and visualizations of the optimization results. The workflow of Wallacei involved optimization design by defining inputs and output, setting (genetic algorithm parameters) and analytics (evaluation of results). The main inputs include genes (design parameters) and the design objectives (building energy demand, PV energy generation and embodied energy). Likewise, the corresponding output includes genomes (combination of input parameters for each simulation run) and fitness values (design objectives). Furthermore, other data and phenotypes may be included as inputs and outputs of Wallacei.
In this study, the optimization is performed in two stages. In order to design the optimization problem, the dependent and independent variables are identified for each stage. The main goal of the first stage is to optimize PV power generation. The independent parameters for the first stage of the optimization include PV (rooftop and BIPV windows), window-to-wall ratio, building orientation, and window types. Two dependent variables are defined to determine the optimal configuration for the independent variables:
Energy use intensity (kWh/m2/yr): the annual energy demand for cooling, lighting and equipment for all conditioned areas of the building.
PV energy supply (kWh/m2/yr): the total power generated from rooftop PV and BIPV windows.
Since the goal of this stage was to optimize the PV power generation, the inclusion of alternative façades was less significant at this stage as it does not influence the PV energy supply. The rooftop PV is designed to cover 90% of the rooftop area whereas the window BIPV capacity is driven by the window-to-wall ratio parameter. Furthermore, operable windows account for 10% of the window-to-wall ratio. Considering the above independent and dependent parameters, the optimization problem for stage 1 is designed to maximize PV energy supply and minimize building energy use in Equation (1) with reference to [24] as follows:
min { f 1 ( ) }   m a x   { f 2 ( ) } , = [ x 1 ,   x 2 ,   x m ]
where f1 is the first objective function which minimizes the operational energy use; f2 is the second objective function which maximizes PV energy supply; is a combination of any design variables x1, x2, and xm.
The second stage is performed to explore façade types and strategies towards a low whole lifecycle energy use which includes both the embodied and operational energy. Thus, this stage is performed to jointly minimize both embodied energy and operational energy. The building model is set up using optimal configuration from the first stage of the optimization. The independent variables for this stage include four façades (including the base model) used within the sub-Saharan Africa region. The description of various layers and characteristics of these façades are presented in Table 1. Likewise, the dependent variables include:
Operational energy use (kWh/m2/yr): the annual energy demand for cooling, lighting and equipment for all conditioned areas of the building.
Embodied energy use (kWh/m2/yr): the total energy for manufacturing of building materials, transportation, construction, and maintenance during the service life of the building. Considering the above dependent and independent variables, the optimization problem for stage two which minimizes both embodied and operational energy is defined in Equation (2) with reference to [28] as follows:
min { f 1 ( ) ,   f 2 ( ) } , = [ x 1 ,   x 2 ,   x m ]
where f1 is the first objective function which minimizes the operational energy use; f2 is the second objective function which minimizes the embodied energy; is a combination of any design variables x1, x2, and xm.
Since the aim of this stage is to minimize the whole lifecycle energy use of the building, the joint optimization of both operational energy and embodied energy will ensure realistic design solutions that optimally reduce both objectives. Thus, the trade-off between the conflicting embodied and operational aspects are explored.
The optimization is driven by the NSGA-2 algorithm as the primary evolutionary algorithm and was run on an Intel Core i7 desktop with 16 GB of RAM. The average evaluation time for each design simulation was 39” and 18” for stages one and two respectively. The genetic algorithm parameters were set as follows: population size: 50; generation: 100; crossover probability: 0.8; mutation probability: 0.1; crossover distribution index: 20; mutation distribution index: 20 [43,44]. The termination criterion used for this study is the maximum generation since a test indicated convergence after the 90th generation. In this case, each optimization ends with the 99th generation since the first generation is counted as 0. The Pareto front with the non-dominated solutions (i.e., no single objective can be improved without sacrificing another one) is used to select the optimal design solutions).

3. Results and Discussion

For validation purposes, the simulation model is calibrated by varying certain parameters for the simulation model to fit metered data retrieved from the building management. The American Society of Heating, Refrigerating and Air Conditioning Engineers (ASHRAE) specify a method for validating the whole building energy simulation by evaluating the error between real metered data and simulated results [45]. For energy use, the ASHRAE guideline specifies thresholds for the Coefficient of Variation of Root Mean Square Error (CV(RMSE)) and Normalized Mean Bias Error (NMBE) as 15% and ±5%, respectively. It is recommended that the base model is calibrated with a minimum of continuous annual metered data. The calibration follows the process of designing the baseline model, analysis of primary results, calibration against monthly metered data and validation using the CV(RMSE) and NMBE.
CV(RMSE) is illustrated in Equation (3) as follows:
C V ( R M S E ) = 1 m   i n   ( m i s i ) 2 n p × 100   ( % )
NMBE is illustrated in Equation (4) as shown below:
N M B E = 1 m   ·   i = 1 n ( m i s i ) n p × 100   ( % )
where m is the mean of measured values; p is the number of adjustable parameters; n is the number of measured data plots; mi is the measured values; si is the simulated values.
The main parameters for calibrating the building model include the building plan and zone layout, utility data, and operation schedules. For the building plan and zone layout, contextual details are evaluated to identify the real condition of the various zones including storerooms, bathrooms, living rooms, bedrooms, and corridors. Hence, the simulation is performed on a zone-to-zone basis rather than aggregating all zones. Furthermore, the as-built properties of windows and glazing are also taken into consideration in order to improve the simulation results. Lighting and equipment density and schedules are calibrated by varying the number of lamps and equipment as well as their schedules. In terms of occupancy, density is calibrated by modulating the ratio of working to non-working occupants. The usage of equipment is also calibrated in relation to the occupancy density.
Table 3 shows the results of the calibration process in comparison to the threshold specified by ASHRAE 14. It can be observed that the model accuracy in terms of monthly CV(RMSE) and NMBE are consistent with the criteria of the ASHRAE 14 guidelines.
Figure 6 shows the monthly energy use of the building including lighting, cooling, equipment, and occupancy gains plotted against the metered data retrieved. It can be observed that the monthly variation between the simulated data and the actual building energy use is less than 5%. Cumulatively, the simulated annual energy use intensity is expressed as 135 kWh/m2/yr while the actual value is 128.76 kWh/m2/yr. This is relatively high when compared with the energy use intensity of a low-income dwelling house evaluated in [11]. The main reason for this high deviation is the different energy use profiles between the different two groups of income earners. From the field survey, it was observed that the equipment density per building area of the mid-income earners (present study) is much higher compared to the low-income earners in the previous study. Additionally, the low-income earners mainly adopt heat extraction fans whereas the mid-income earners largely rely on mechanical cooling. As observed the lighting energy use is also much higher due to the use of efficient lighting systems and design in the mid-income dwelling in this study. From Figure 6, it can be observed that the cooling energy required is much lower in the months of June to September, which is due to lower outdoor temperatures during this period. The lower temperature can be attributed to higher rainfalls during this period. Given the minimal difference between the simulated and metered data, the building energy model is suitable for the subsequent optimization process.

3.1. Stage-One Optimization

The results of the first-stage optimization are used to develop scatterplots as expressed in Figure 7. This plot shows the relationship between the building energy use and the PV power supply using the results of 5000 simulations. Figure 7a illustrates the entire solution space whereas Figure 7b shows the Pareto front. In the figure, each dot corresponds to a set of variables (WWR, rooftop PV, BIPV window, infiltration rate, and orientation) selected by the optimization algorithm for each simulation run. The results of the design solutions that cannot be improved without compromising the other objectives are Pareto front solutions. In this study, the solutions that minimize the operational energy use but maximize the PV energy supply are selected as the Pareto solution. Specifically, the optimal solution corresponds to a south-oriented building (180°). The window-to-wall ratio and PV window-to-wall ratio are 0.55 and 0.495, respectively. Additionally, the infiltration is 0.000071 m3/s/m2 which underscores the essence of an airtight façade. This optimal solution result reduces the operational energy use by 26.78% when compared with the energy of the base case model. Figure 8 illustrates the monthly energy consumption and PV power supply of the optimal solution. It can be observed that except March, April, May, September, and October, the PV power supply exceed the energy use requirement throughout the year. Nonetheless, the energy deficit is less than 10% in these periods. About 80% of the PV energy supply is generated by the rooftop PV while the remaining 20% is generated by the BIPV window.
Table 4 provides a detailed configuration of the Pareto optimal for the first stage optimization. The table shows the list of Pareto front, the specific design parameters, PV power generation, operational energy uses, and the frequency of occurrence in a design solution in series. The variables (genomes) for the Pareto front are summarized. It can be observed that all solutions are characterized by a south-facing building and almost all by an orientation of 180°. Furthermore, it is observed that the optimal solutions are spread uniformly across the WWR ratio. Since 90% of the windows are replaced with BIPV, the variation in WWR results in less significant changes in operational energy use. It can be observed that the choice of the best performing design solution is highly related to the WWR rather than the orientation and infiltration rate. The results favour the exploitation of window and BIPV design in other to select design solutions that best fit. Figure 9 further illustrates the performance of design variables against the energy use intensity for the optimized solution.

3.2. Stage-Two Optimization

The results of the first stage of the optimization form the basis for stage two of the optimization process. In order to incorporate the optimal design solution from the first stage to the second stage of the optimization, parameters (genomes) of the optimal solution are used to remodel the base case design. The remodelled case building is a south-oriented building with a 0.55 and 0.495 WWR ratio and BIPV window ratio respectively, has 90% rooftop PV coverage and a façade infiltration rate of 0.000071 m3/s/m2. Furthermore, the same solar cells and conversion efficiencies are maintained for the rooftop PV and BIPV windows. The second stage of the optimization is performed to demonstrate the trade-off between embodied and operational energy of the building. The different layers of four façade types are varied to explore their performance on both embodied energy and operational energy. In order to extend the boundaries of the study beyond Ghana, the optimization is performed for two other regions, Abuja, Nigeria and, Ouagadougou, Burkina Faso.
The results from the second stage of the optimization are presented in Figure 10, Figure 11, Figure 12. The figures show the variations in operational and embodied energy and each dot in the scatterplot represent a unique combination of different variables that control the types and thickness of materials for a façade type. Here, the goal is to minimize the whole lifecycle energy use of the building (both embodied and operational energy); therefore, the Pareto fronts are those solutions that minimize both objectives in a manner that there is no possibility of decreasing one objective without compromising another objective. From Figure 10, it can be observed that the design solutions for Ghana are clustered almost horizontally. This indicated that around these points, the operational energy is relatively steady whereas the embodied energy fluctuates significantly. Particularly it is observed that around the operational energy value of 87–89 kWh/m2/yr, the embodied energy fluctuates with a difference as high as 15 kWh/m2/yr. This indicates that any further decrease in the operational energy will result in an exponential increase in the embodied energy. A more precise representation of the Pareto front is illustrated in Figure 10b. Similarly, it is observed that a minimal reduction in operational energy use leads to an exponential increase in embodied energy use. It is revealed that the distribution of the Pareto optimal solutions are more concentrated and less distributed which confirm that significant embodied energy saving can be around similar levels of operational energy. The configuration of the Pareto optimal solutions are presented in Table 4. Considering the optimal design solution for the BWMF façade, the selected genes centre around a 150 mm thick block wall and a 10 mm thick render. Although some optimal solutions increase the thickness of the render to 12 mm, the corresponding increase in embodied energy is much higher than the decrease in operational energy. Therefore, the net benefit from this solution is less desirable. All three thicknesses of the CMBF resulted in similar operational energy. However, the embodied energy increased significantly with the increase in thickness. For the shotcrete ICF, an insulation thickness of 78 mm is most representative of the optimal solutions and the most desirable shotcrete thickness is 12 or 15 mm. An increase of the insulation thickness to 100 mm leads to an increase in the embodied energy which is not proportional to the decrease in the operational energy. Unlike the foregoing, the thickness of the insulation layer for the optimal GS ICF has a uniformly spread insulation thickness which proportional reductions in the operational energy use. However, an increase of the insulation thickness to 100 mm yields an exponential increase in the embodied energy. Cumulatively, the net energy use of the optimal solution reduces yields an energy reduction of about 24.59% in comparison with the initial base case model.
The optimization is performed for two other regions in sub-Saharan Africa: Abuja, Nigeria and Ouagadougou, Burkina Faso, and the results are detailed in Figure 11 and Figure 12, respectively. It can be observed that the distribution of the entire solution is similar. However, operational energy was much lower in these two regions compared to Ghana. This is mainly attributed to the weather data thus the prevailing climatic conditions in the area. Likewise, slight variations are observed in the embodied energy values due to the differences in transportation distances and materials manufacturing processes. For instance, Nigeria is a major manufacturer and distributor of cement in Africa, hence the impacts of transportation are slightly lower in Nigeria when compared with Ghana. Specifically, the optimal solution for Abuja Nigeria and Ouagadougou, Burkina Faso after the second stage of the optimization reduces the energy use by 36.93% and 33.33%, respectively.
Table 5 provides a detailed configuration of the Pareto optimal for the second stage optimization. The table shows the list of Pareto front, the specific design parameters, embodied energy, operational energy uses and the frequency of occurrence in a design solution in series.

4. Conclusions

This study evaluated the optimal configuration of different building envelopes with local materials representative of climatic conditions in the sub-Saharan region of Africa. An evolutionary algorithm is coupled with the building energy simulation and LCA to explore the optimal energy performance of different building envelopes and design variables under different climatic conditions. A case study was performed on a typical residential building in Ghana using a two-stage optimization approach which can be adopted by designers in similar regions. In this approach, the building geometry and renewable energy are first optimized and adopted as the basis to configure the building model for evaluating the trade-off between embodied and operational energy with alternative façades in the second stage. Consequently, the arbitrary selection of optimal building designs solely from the perspective of operational energy can be avoided.
It has been proved that the proposed joint optimization approach considering the whole lifecycle of buildings (including both operational and embodied energy) can improve the modelling accuracy and reduce the lifecycle energy use. Such an approach is more favourable as the optimization of operational energy alone may lead to a sub-optimal design from a lifecycle perspective. Furthermore, the study illustrates the trade-off between embodied and operational energy through the multi-objective optimization approach.
The main findings from the two-staged optimizations are summarized as follows:
  • Based on the stage-one optimization, the optimal design solution which maximizes PV energy generation and minimizes operational energy use is mainly south oriented. The coupling of WWR and prefabricated BIPV window is identified to have a much higher influence on the power supply than operational energy. The increase in the BIPV window area leads to a corresponding increase in the PV power supply but a low window u-value which increases the cooling load in return. Notwithstanding, the rooftop PV alone contributes to nearly 80% of the PV energy supply while the prefabricated BIPV window contributes to about 20% of the PV power supply.
  • The joint optimization of operational and embodied energy is proven a more efficient method to reduce the whole lifecycle energy use. Specifically, the different façade types with a wide range of embodied energy values are capable of achieving very similar optimal operational energy. Therefore, a sub-optimal design solution may be selected if not considered from a lifecycle perspective. From the perspective of the different façades explored, it is realized that a slight reduction in the thickness of cementitious materials can reduce the embodied energy without significantly affecting the thermal mass and therefore operational energy. Similarly, an increase in the thicknesses does not necessarily guarantee a decrease in operational energy but increases the embodied energy. Regarding the composite façades with insulation materials, an increase in the insulation thickness significantly reduces operational energy. However, this could also have a counteracting impact on the whole lifecycle energy due to the exponential increase in embodied energy.
  • The lifecycle energy performance of the explored façade is found to vary significantly among the three regions explored with increased performance in the order of Ghana, Burkina Faso, and Nigeria. Particularly their performance at the operational stage varies significantly due to the variation in weather conditions. Additionally, the different modes of material production, transportation, and construction processes impact embodied energy. Hence it is necessary to pay attention to the specificities of the evaluated region. Overall, the first stage of the optimization reduced the total lifecycle building energy use by 26.78%. Cumulatively, over 24.59, 33.33, and 36.93% energy reduction are achieved for Ghana, Burkina Faso, and Nigeria, respectively.
In summary, this study has provided insights into the optimal configuration of building envelopes with different façade materials representative of the sub-Saharan Africa region from a whole lifecycle perspective using a multi-objective optimization approach. In the future, the range of design variables will be expanded and coupled with economic and environmental indicators. Additionally, other envelope elements than façades and building archetypes will be explored in detail.

Author Contributions

Conceptualization, M.K.A., X.C. and H.Y.; methodology, M.K.A. and X.C. and H.Y.; software, M.K.A. and X.C.; validation, M.K.A. and X.C.; formal analysis, M.K.A. and X.C.; investigation, M.K.A. and X.C.; resources, M.K.A., X.C. and H.Y.; data curation, M.K.A. and X.C.; writing—original draft preparation, M.K.A.; writing—review and editing, X.C. and H.Y.; visualization, M.K.A. and X.C.; supervision, H.Y.; project administration, H.Y. All authors have read and agreed to the published version of the manuscript.

Funding

This research received no external funding.

Data Availability Statement

The data presented in this study are available on request from the corresponding author. The data are not publicly available due to confidentiality.

Acknowledgments

The work described in this paper was supported by the PhD studentship from the Research Institute for Sustainable Urban Development (RISUD) of The Hong Kong Polytechnic University. Appreciation is also given to the Hong Kong Metropolitan University Research Grant (No. 2020/1.3).

Conflicts of Interest

The authors declare that they have no known competing financial interests or personal relationships that could have appeared to influence the work reported in this paper.

Abbreviations

ASHRAEAmerican Society of Heating, Refrigerating and Air Conditioning Engineers
BIPVBuilding-integrated photovoltaics
PVPhotovoltaics
WWRWindow-to-wall ratio
CMBFCompressed mud block façade
CV(RMSE)Coefficient of variation of root mean square error
BWMFBlock wall and mortar façade
GS. ICFGalvanized steel insulated composite façade
Shotcrete ICFShotcrete insulated composite façade
GHGGreenhouse gases
LCALifecycle assessment
NMBENormalized mean bias error

References

  1. Emami, N.; Heinonen, J.; Marteinsson, B.; Säynäjoki, A.; Junnonen, J.-M.; Laine, J.; Junnila, S. A Life Cycle Assessment of Two Residential Buildings Using Two Different LCA Database-Software Combinations: Recognizing Uniformities and Inconsistencies. Buildings 2019, 9, 20. [Google Scholar] [CrossRef] [Green Version]
  2. Kim, S.; Van Quy, H.; Bark, C.W. Photovoltaic technologies for flexible solar cells: Beyond silicon. Mater. Today Energy 2021, 19, 100583. [Google Scholar] [CrossRef]
  3. Salehian, S.; Ismail, M.A.; Ariffin, A.R.M. Assessment on Embodied Energy of Non-Load Bearing Walls for Office Buildings. Buildings 2020, 10, 79. [Google Scholar] [CrossRef] [Green Version]
  4. Vieira, F.; Sarmento, B.; Reis-Machado, A.S.; Facão, J.; Carvalho, M.J.; Mendes, M.J.; Fortunato, E.; Martins, R. Prediction of sunlight-driven CO2 conversion: Producing methane from photovoltaics, and full system design for single-house application. Mater. Today Energy 2019, 14, 100333. [Google Scholar] [CrossRef] [Green Version]
  5. International Energy Agency. Buildings—A Source of Enormous Untapped Efficiency Potential. 2021. Available online: https://www.iea.org/topics/buildings (accessed on 25 July 2021).
  6. European Commission. Energy Efficient Buildings. 2020. Available online: https://ec.europa.eu/energy/topics/energy-efficiency/energy-efficient-buildings_en (accessed on 25 August 2021).
  7. United Nations. The Paris Agreement | UNFCCC. 2021. Available online: https://unfccc.int/process-and-meetings/the-paris-agreement/the-paris-agreement (accessed on 14 September 2021).
  8. European Union. 2030 Climate & Energy Framework—Greenhouse Gas Emissions—Raising the Ambition. 2021. Available online: https://ec.europa.eu/clima/policies/strategies/2030_en (accessed on 27 October 2021).
  9. Hong Kong Government. GovHK: Climate Change—Carbon Emissions and Hong Kong. 2021. Available online: https://www.gov.hk/en/residents/environment/global/climate.htm (accessed on 15 August 2021).
  10. Renewable Energy and Energy Efficiency in Developing Countries: Contributions to Reducing Global Emissions; United Nations Environment Programme: Nairobi, Kenya, 2017; ISBN 9789291426515.
  11. Ansah, M.K.; Chen, X.; Yang, H.; Lu, L.; Lam, P.T.I. An integrated life cycle assessment of different façade systems for a typical residential building in Ghana. Sustain. Cities Soc. 2019, 53, 101974. [Google Scholar] [CrossRef]
  12. Ghana Energy Commission. Energy Statistics. 2021. Available online: http://energycom.gov.gh/planning/energy-statistics (accessed on 17 July 2021).
  13. Tian, Z.; Zhang, X.; Jin, X.; Zhou, X.; Si, B.; Shi, X. Towards adoption of building energy simulation and optimization for passive building design: A survey and a review. Energy Build. 2018, 158, 1306–1316. [Google Scholar] [CrossRef]
  14. Al-Saadi, S.N.; Al-Jabri, K.S. Optimization of envelope design for housing in hot climates using a genetic algorithm (GA) computational approach. J. Build. Eng. 2020, 32, 101712. [Google Scholar] [CrossRef]
  15. Saroglou, T.; Theodosiou, T.; Givoni, B.; Meir, I.A. A study of different envelope scenarios towards low carbon high-rise buildings in the Mediterranean climate—Can DSF be part of the solution? Renew. Sustain. Energy Rev. 2019, 113, 109237. [Google Scholar] [CrossRef]
  16. Fang, Y.; Cho, S. Design optimization of building geometry and fenestration for daylighting and energy performance. Sol. Energy 2019, 191, 7–18. [Google Scholar] [CrossRef]
  17. Ilbeigi, M.; Ghomeishi, M.; Dehghanbanadaki, A. Prediction and optimization of energy consumption in an office building using artificial neural network and a genetic algorithm. Sustain. Cities Soc. 2020, 61, 102325. [Google Scholar] [CrossRef]
  18. Giouri, E.D.; Tenpierik, M.; Turrin, M. Zero energy potential of a high-rise office building in a Mediterranean climate: Using multi-objective optimization to understand the impact of design decisions towards zero-energy high-rise buildings. Energy Build. 2020, 209, 109666. [Google Scholar] [CrossRef]
  19. Cuce, E.; Sher, F.; Sadiq, H.; Cuce, P.M.; Guclu, T.; Besir, A.B. Sustainable ventilation strategies in buildings: CFD research. Sustain. Energy Technol. Assess. 2019, 36, 100540. [Google Scholar] [CrossRef]
  20. Acar, U.; Kaska, O.; Tokgoz, N. Multi-objective optimization of building envelope components at the preliminary design stage for residential buildings in Turkey. J. Build. Eng. 2021, 42, 102499. [Google Scholar] [CrossRef]
  21. Cuce, E.; Riffat, S.B. Aerogel-Assisted Support Pillars for Thermal Performance Enhancement of Vacuum Glazing: A CFD Research for a Commercial Product. Arab. J. Sci. Eng. 2015, 40, 2233–2238. [Google Scholar] [CrossRef]
  22. Cuce, E.; Cuce, P.M.; Young, C.H. Energy saving potential of heat insulation solar glass: Key results from laboratory and in-situ testing. Energy 2016, 97, 369–380. [Google Scholar] [CrossRef]
  23. Cuce, E.; Riffat, S.B. Vacuum tube window technology for highly insulating building fabric: An experimental and numerical investigation. Vacuum 2015, 111, 83–91. [Google Scholar] [CrossRef] [Green Version]
  24. Chen, X.; Yang, H.; Peng, J. Energy optimization of high-rise commercial buildings integrated with photovoltaic facades in urban context. Energy 2019, 172, 1–17. [Google Scholar] [CrossRef]
  25. Chen, X.; Huang, J.; Yang, H.; Peng, J. Approaching low-energy high-rise building by integrating passive architectural design with photovoltaic application. J. Clean. Prod. 2019, 220, 313–330. [Google Scholar] [CrossRef]
  26. Jayathissa, P.; Luzzatto, M.; Schmidli, J.; Hofer, J.; Nagy, Z.; Schlueter, A. Optimising building net energy demand with dynamic BIPV shading. Appl. Energy 2017, 202, 726–735. [Google Scholar] [CrossRef]
  27. Skandalos, N.; Karamanis, D. An optimization approach to photovoltaic building integration towards low energy buildings in different climate zones. Appl. Energy 2021, 295, 117017. [Google Scholar] [CrossRef]
  28. Shadram, F.; Bhattacharjee, S.; Lidelöw, S.; Mukkavaara, J.; Olofsson, T. Exploring the trade-off in life cycle energy of building retrofit through optimization. Appl. Energy 2020, 269, 115083. [Google Scholar] [CrossRef]
  29. Satola, D.; Röck, M.; Houlihan-Wiberg, A.; Gustavsen, A. Life Cycle GHG Emissions of Residential Buildings in Humid Subtropical and Tropical Climates: Systematic Review and Analysis. Buildings 2021, 11, 6. [Google Scholar] [CrossRef]
  30. Takano, A.; Pal, S.K.; Kuittinen, M.; Alanne, K. Life cycle energy balance of residential buildings: A case study on hypothetical building models in Finland. Energy Build. 2015, 105, 154–164. [Google Scholar] [CrossRef]
  31. Omrany, H.; Soebarto, V.; Zuo, J.; Chang, R. A Comprehensive Framework for Standardising System Boundary Definition in Life Cycle Energy Assessments. Buildings 2021, 11, 230. [Google Scholar] [CrossRef]
  32. Tushar, Q.; Bhuiyan, M.A.; Zhang, G.; Maqsood, T. An integrated approach of BIM-enabled LCA and energy simulation: The optimized solution towards sustainable development. J. Clean. Prod. 2021, 289, 125622. [Google Scholar] [CrossRef]
  33. Lin, Y.H.; Lin, M.D.; Tsai, K.T.; Deng, M.J.; Ishii, H. Multi-objective optimization design of green building envelopes and air conditioning systems for energy conservation and CO2 emission reduction. Sustain. Cities Soc. 2021, 64, 102555. [Google Scholar] [CrossRef]
  34. Kiss, B.; Szalay, Z. Modular approach to multi-objective environmental optimization of buildings. Autom. Constr. 2020, 111, 103044. [Google Scholar] [CrossRef]
  35. Shadram, F.; Mukkavaara, J. An integrated BIM-based framework for the optimization of the trade-off between embodied and operational energy. Energy Build. 2018, 158, 1189–1205. [Google Scholar] [CrossRef]
  36. Abbasi, S.; Noorzai, E. The BIM-Based multi-optimization approach in order to determine the trade-off between embodied and operation energy focused on renewable energy use. J. Clean. Prod. 2021, 281, 125359. [Google Scholar] [CrossRef]
  37. Roudsari, M.; Pak, M.; Lyon, A.S.-I. Conference Held in France; 2013, U. Ladybug: A Parametric Environmental Plugin for Grasshopper to Help Designers Create an Environmentally-Conscious Design. ibpsa.org. 2013. Available online: https://www.ibpsa.org/proceedings/bs2013/p_2499.pdf (accessed on 26 November 2021).
  38. Ghana Standards Authority. 2018 Ghana Building Code Building and Construction | ICC Digital Codes. 2018. Available online: https://codes.iccsafe.org/content/GHBCBC2018 (accessed on 26 November 2021).
  39. Marion, W.; Urban, K. User’ s Manual for Radiation Data Base. 1995. Available online: https://www.osti.gov/biblio/87130 (accessed on 3 September 2021).
  40. Siu, C.Y.; Liao, Z. Is building energy simulation based on TMY representative: A comparative simulation study on doe reference buildings in Toronto with typical year and historical year type weather files. Energy Build. 2020, 211, 109760. [Google Scholar] [CrossRef]
  41. Halverson, R.; Hart, R.; Athalye, W. ANSI/ASHRAE/IES Standard 90.1-2013 Determination of Energy Savings: Qualitative Analysis. 2014. Available online: https://www.osti.gov/biblio/1734447 (accessed on 26 November 2021).
  42. Wolfgang, F. What Is a Passive House. proyectocasapasiva.com. 2007. Available online: http://proyectocasapasiva.com/wp-content/uploads/2014/11/CERTIFICADO-PASSIVHAUS-HERRERA-2017-1.pdf (accessed on 26 November 2021).
  43. Vukadinović, A.; Radosavljević, J.; Đorđević, A.; Protić, M.; Petrović, N. Multi-objective optimization of energy performance for a detached residential building with a sunspace using the NSGA-II genetic algorithm. Sol. Energy 2021, 224, 1426–1444. [Google Scholar] [CrossRef]
  44. Deb, K.; Pratap, A.; Agarwal, S.; Meyarivan, T. A fast and elitist multiobjective genetic algorithm: NSGA-II. IEEE Trans. Evol. Comput. 2002, 6, 182–197. [Google Scholar] [CrossRef] [Green Version]
  45. ASHRAE. ASHRAE Guideline 14-2002 Measurement of Energy and Demand Savings. Ashrae 2002, 8400, 170. [Google Scholar]
Figure 1. Methodological framework of the study.
Buildings 11 00642 g001
Figure 2. Floor plan and 3D BIM model of the case study building. (a) Floor plan, (b) floor plan.
Buildings 11 00642 g002aBuildings 11 00642 g002b
Figure 3. Weekday building schedules. (a) Occupancy schedule, (b) lighting schedule, (c) HVAC schedule, (d) equipment schedule.
Buildings 11 00642 g003aBuildings 11 00642 g003b
Figure 4. Weekend building schedules. (a) Occupancy schedule, (b) lighting schedule, (c) HVAC schedule, (d) equipment schedule.
Buildings 11 00642 g004aBuildings 11 00642 g004b
Figure 5. Illustration of passive and active parameters two-stage optimization [11,38].
Buildings 11 00642 g005
Figure 6. Validation of base model building loads.
Buildings 11 00642 g006
Figure 7. Scatterplot of energy use intensity against PV energy supply. (a) Entire solution space, (b) Pareto optimal solutions.
Buildings 11 00642 g007
Figure 8. Total operational energy use against PV energy supply.
Buildings 11 00642 g008
Figure 9. Scatterplot of WWR, infiltration rate, orientation, and BIPV window ratio against energy use intensity. (a) Orientation vs. energy use intensity, (b) BIPV windows ratio vs. energy use intensity, (c) WWR vs. energy use intensity, (d) Infiltration rate vs. energy use intensity.
Buildings 11 00642 g009
Figure 10. Scatterplot of operational energy use against embodied energy use (Accra, Ghana). (a) Entire solution space, (b) Pareto optimal solutions.
Buildings 11 00642 g010
Figure 11. Scatterplot of operational energy use against embodied energy use (Abuja, Nigeria). (a) Entire solution space, (b) Pareto optimal solutions.
Buildings 11 00642 g011
Figure 12. Scatterplot of operational energy use against embodied energy use (Ouagadougou, Burkina Faso). (a) Entire solution space, (b) Pareto optimal solutions.
Buildings 11 00642 g012
Table 1. Variable for the two-staged optimizations [11,24,25].
VariableValues (Unit)Range (Unit)Notes
Building orientation0 (°)0 (°)–180 (°).15° interval
Window-to-wall ratio0.350.15–0.800.05 interval
Façade infiltration rate0.0003 (m3/s/m2)0.0001, 0.000071, 0.000285, 0.0003, 0.0006 (m3/s/m2)Represent tight building, passive house, ASHRAE 90.1-2013, Average leaky building and leaky building, respectively.
Rooftop PV90 (% of roof area) Mono-Si cells with 15% conversion efficiency
BIPV Windows90 (% window area) Driven by WWR variable; a-Si cells with 6.3% conversion efficiency
Block wall and Mortar façade (BWMF)Ext. render12 (mm)10 (mm), 12 (mm), 15 (mm)
Block wall150 (mm)100 (mm), 150 (mm), 200 (mm)
Internal render12 (mm)10 (mm), 12 (mm), 15 (mm)
Shotcrete Insulated composite façade (SICF)Ext. shotcrete15 (mm)10 (mm), 12 (mm), 15 (mm)
Mesh reinforcement
EPS insulation78 (mm)50 (mm), 78 (mm), 100 (mm)
Mesh reinforcement
Int. shotcrete15 (mm)10 (mm), 12 (mm), 15 (mm)
Galvanized steel Insulated composite façade (GS. ICF)Int. galvanized steel plate0.6 (mm)-
EPS insulation78 (mm)50 (mm), 78 (mm), 100 (mm)
Ext. galvanized steel plate0.6 (mm)-
Compressed mud block façade (CMBF)200 (mm)150 (mm), 200 (mm), 250 (mm)
The layers of the façade are presented from the outer to inner layer.
Table 2. Building parameter settings.
VariableValue (Unit)
Occupancy activity level2 (person/room) 120 (W/person)
Lighting gain12 (W/m2)
Equipment gain10 (W/m2)
HVAC systemIdeaLoadAirSystem
Cooling setpoint24 (°C)
Roof U-value0.35 (W/m2 °C)
Floor U-value1.5 (W/m2 °C)
Window U-value5.69 (W/m2 k)
Table 3. Estimated CV(RMSE) and NMBE of the calibrated simulation model for operational energy uses.
IndexASHRAE CriteriaBaseline ModelCalibrated Model
CV(RMSE)1532.58%14.56%
NMBE±5%24.43%−4.79%
Table 4. Configuration of Pareto optimal solutions of stage one.
Building Orientation (°)Window-to-Wall RatioFaçade Infiltration Rate (m3/s/m2)Rooftop PV (% of Roof Area)BIPV Windows-to-Wall RatioEnergy Use Intensity (kWh/m2/yr)PV Energy Supply (kWh/m2/yr)Number of Pareto Solutions in Series
1650.150.000071900.135102.761684.97314115
1650.30.000071900.27102.673289.8462992
1800.450.000071900.405102.640391.47067161
1800.350.000071900.315102.613993.09505115
1800.550.000071900.495102.588294.71943138
1800.50.000071900.45102.554596.34381161
1800.40.000071900.36102.524897.96819115
1800.650.000071900.585102.498399.59257115
1800.70.000071900.63102.4748101.217138
Table 5. Configuration of Pareto optimal solutions of stage two.
Materials Thickness (mm)Pareto Solutions
CMBFBWMFShotcrete ICFGS. ICFOperation Energy (kWh/m2/yr)Embodied Energy (kWh/m2/yr)Number of Pareto Solutions in Series
Ext. RenderBlock WallInt. RenderExt. ShotcreteEPS InsulationInt. ShotcreteEPS Insulation
150 92.639.2492
200 91.8512.22115
250 91.2315.18138
1010010 91.2221.8692
1015010 91.0823.96161
1215012 91.1124.3669
157812 87.8024.06115
157815 87.7924.4592
5087.6125.3869
5087.0925.8292
1520015 87.8025.06115
1510015 86.5929.3369
127812 87.8024.33115
1220012 87.8024.3669
1520012 87.8024.98115
10086.7830.00161
1210010 86.5928.93138
1210012 86.5929.3369
Publisher’s Note: MDPI stays neutral with regard to jurisdictional claims in published maps and institutional affiliations.

