1. Introduction
Algarve is a Portuguese earthquake prone region that has been affected by several destructive earthquakes in the past [
1]. Recent studies show that Algarve is the region where the maximum seismic intensities (
I max = X) were observed in known history [
2], namely due to high magnitude offshore earthquakes; such was the case of the 1 November 1755 earthquake, which is normally referred to as the “Great Lisbon Earthquake”. This worldwide known catastrophic seismic event, whose effects were observed in many regions of Europe and North Africa [
3], should highlight the capacity of destruction of such earthquakes and emphasize the importance of carrying out accurate seismic analysis of existing buildings to better understand what the seismic risk of this region is.
The seismic safety of school buildings is a quite important issue, namely because this type of construction normally presents a high concentration of young students, which increases the seismic risk due to the increase of the exposure, which is one of the reasons why modern codes such as the Part 1 of Eurocode 8 (EC8-1) [
4] establish an importance factor (
γI) for this type of buildings, which multiplies the reference acceleration (
agR). An increase of the importance factor causes an increase of the return period (
TR) of the seismic action, and, consequently, an increase of the vibration level that the buildings should be able to resist. Unfortunately, many school buildings are still collapsing or being severely damaged after the occurrence of worldwide destructive earthquakes [
5,
6,
7,
8,
9], including reinforced concrete (RC) constructions; such was the case of the School “Enrique Rebsamen” in Mexico [
10].
Modern studies usually adopt seismic nonlinear static analysis methods to assess the vulnerability of school buildings, namely for seismic retrofitting purposes [
11]. However, most of the large-scale seismic assessment studies that have been carried out worldwide normally still adopt simplified empirical methods of analysis, mainly due to the complexity of the task. This type of method has been used to carry out seismic assessment studies in the Algarve region [
12]. However, it is still difficult to correlate the results of these more simplified empirical approaches with the results of nonlinear structural analysis [
13], which are normally established in modern seismic codes. Such is the case of Part 3 of the Eurocode 8 (EC8-3) [
14], which has recently become the new Portuguese seismic code for the assessment of existing buildings [
15].
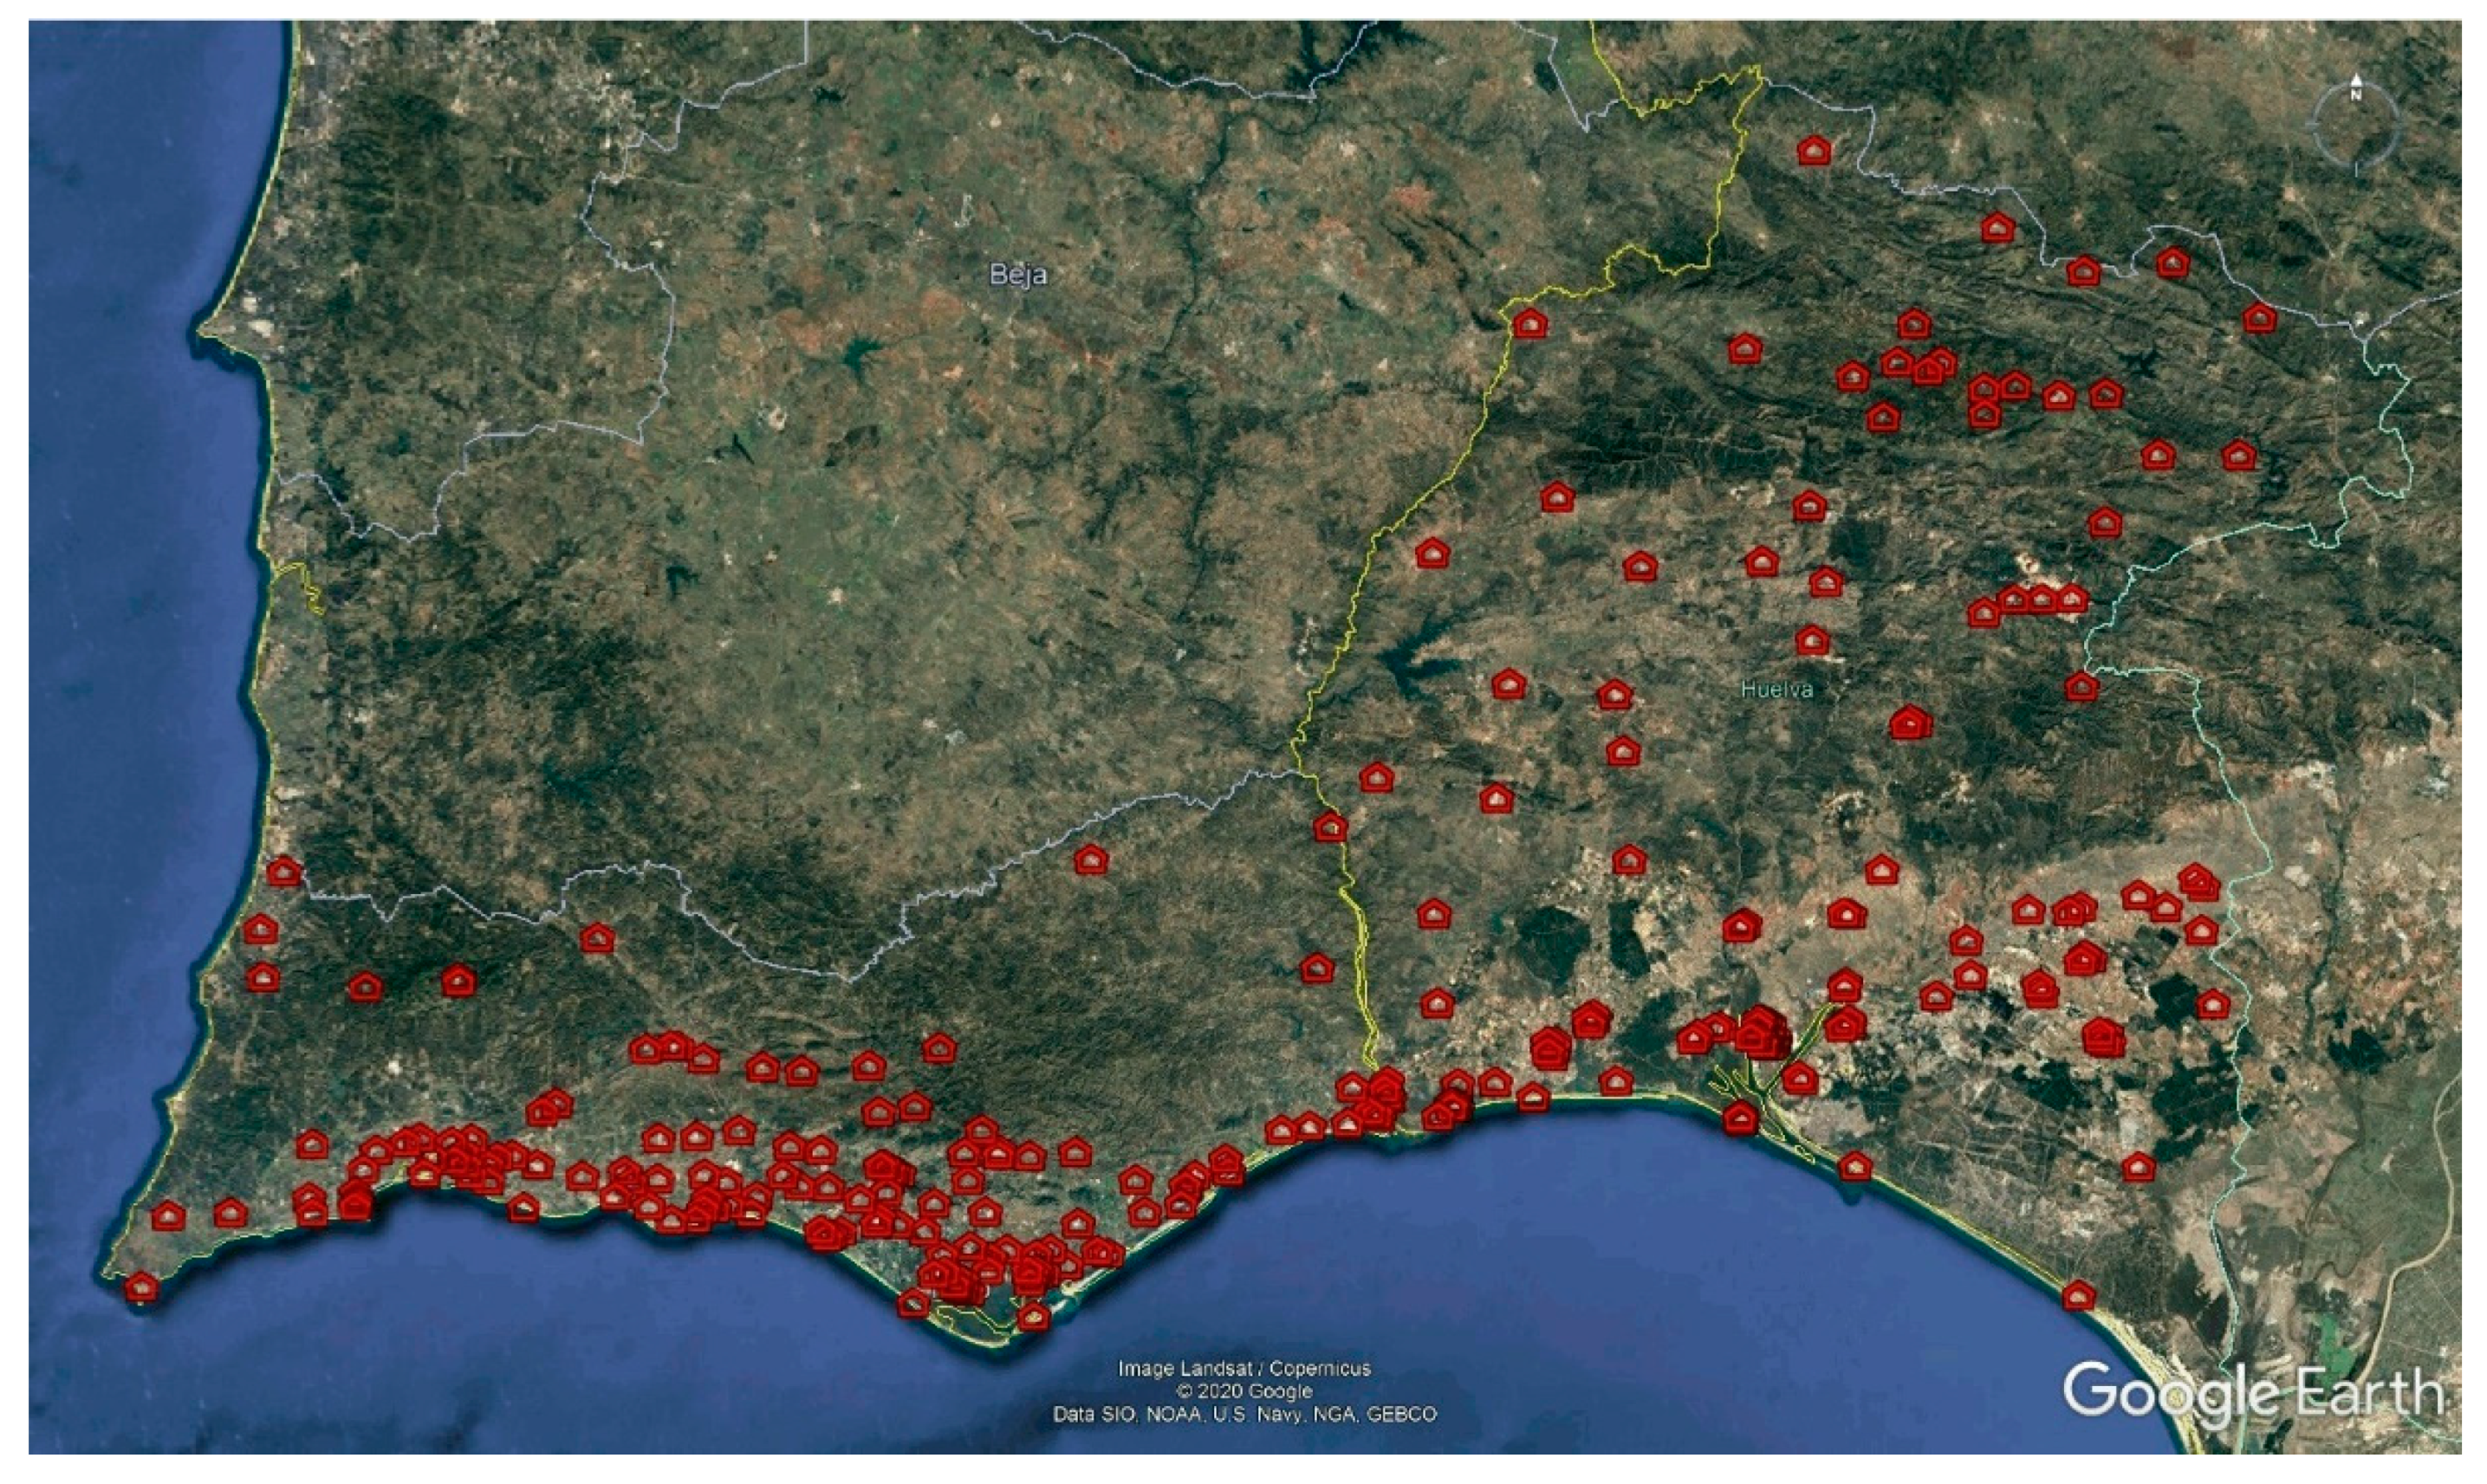
In this context, one of the main goals of the PERSISTAH project was to evaluate the seismic safety of the primary school buildings (
Figure 1) that exist in the neighbouring regions of Algarve (Portugal) and Huelva (Spain). To accomplish such a demanding goal, software for the evaluation of the seismic safety of several individual school buildings was developed [
16], not only for ranking their seismic vulnerability for retrofitting purposes, using the new concept of performance curve, but also for the evaluation of the damage level resulting from a given earthquake scenario, mainly for civil protection purposes, because schools are often used as emergency centres and for sheltering the populations after the occurrence of a destructive earthquake.
This work is about the use of this new ranking approach for studying the seismic safety of the so-called “P3” school, which is an RC school typology that began construction in the Algarve before the existence of more demanding seismic codes. Nevertheless, the adopted approach can also be used in any type of RC building, and all over the world.
2. The “P3” School Typology
In the 1970s, a new concept of school architectural typology arose in Portugal, which was the Open Plan Schools, the “P3” school buildings being an example of this typology. This typology was supported in two main issues: pedagogical (creating open spaces, which allowed different teaching possibilities) and constructive (creating buildings composed by structurally independent modules, which were combined in different ways to create different schools with different shapes and sizes, easily adaptable to the site conditions). However, this open space concept was not well received by the schoolteachers [
17]. The first change in this type of buildings was the addition of partitioning walls to create more traditional classrooms, as it was possible to see into the schools that were inspected in the Algarve region.
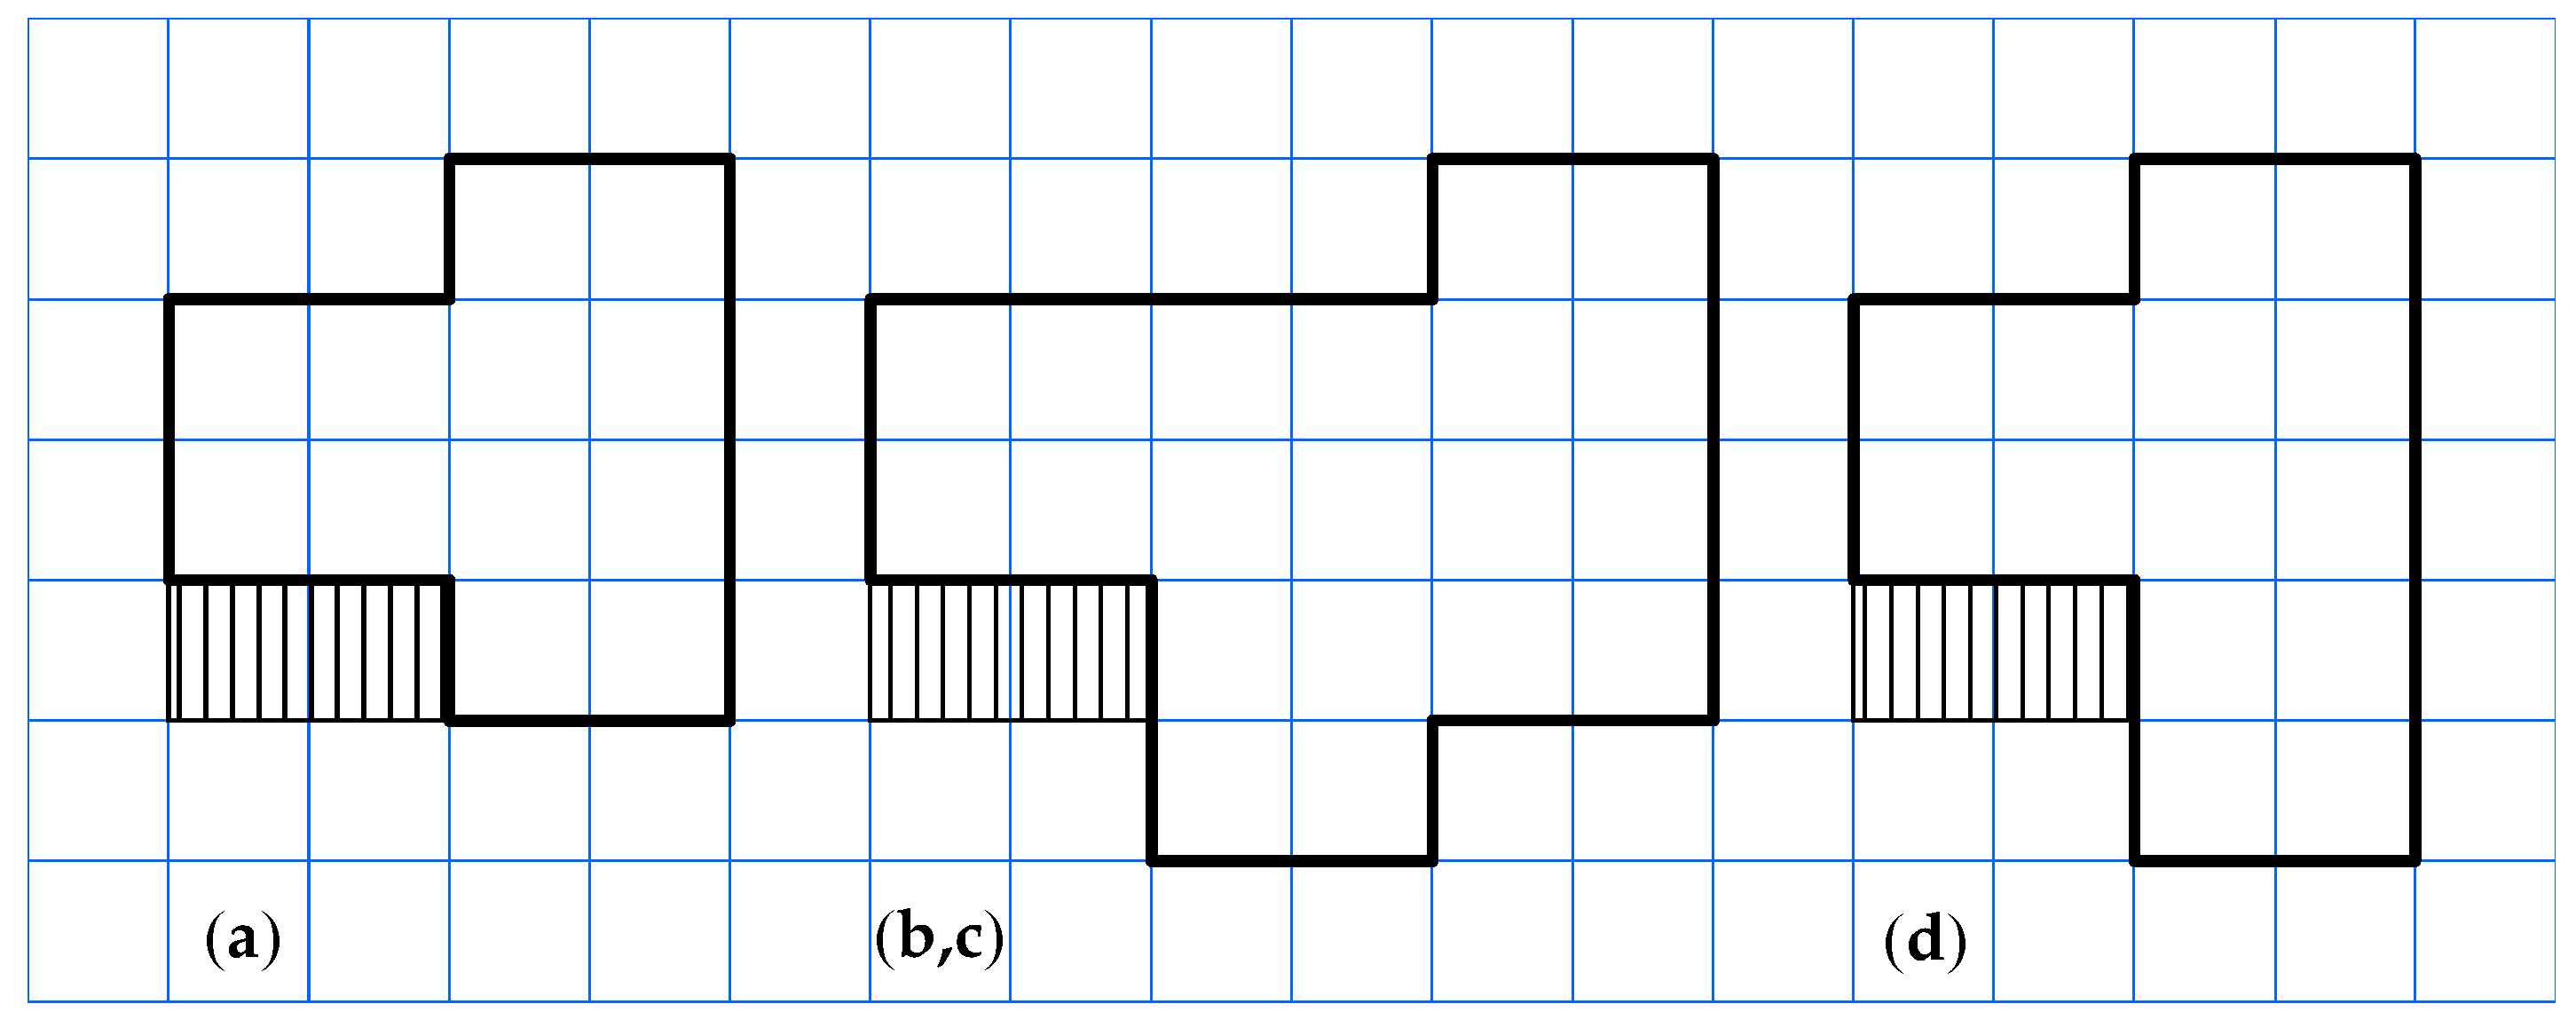
These schools are composed of central modules and by classroom modules that were created over an equally spaced grid (
Figure 2), which could be rotated and/or mirrored, allowing several possible orientations for each module depending on the site characteristics and the relative position of the school entrance. Based on the architectural standardised designs that were possible to find, there are at least four types of classroom modules, corresponding to two, three, four, or six classrooms (
Figure 2), and there are also at least three types of central modules: one for schools with capacity for 160 to 240 students, another between 240 and 400 students, and finally a third one for 400 to 480 students.
Many “P3” schools were built in Portugal. There were at least 371 schools in July 1985, just more than a decade after the first one was built, according to a map of the General-Directorate of Basic Education [
17]. Some of these schools were built in the Algarve region; the first one started in 1974 in Quarteira [
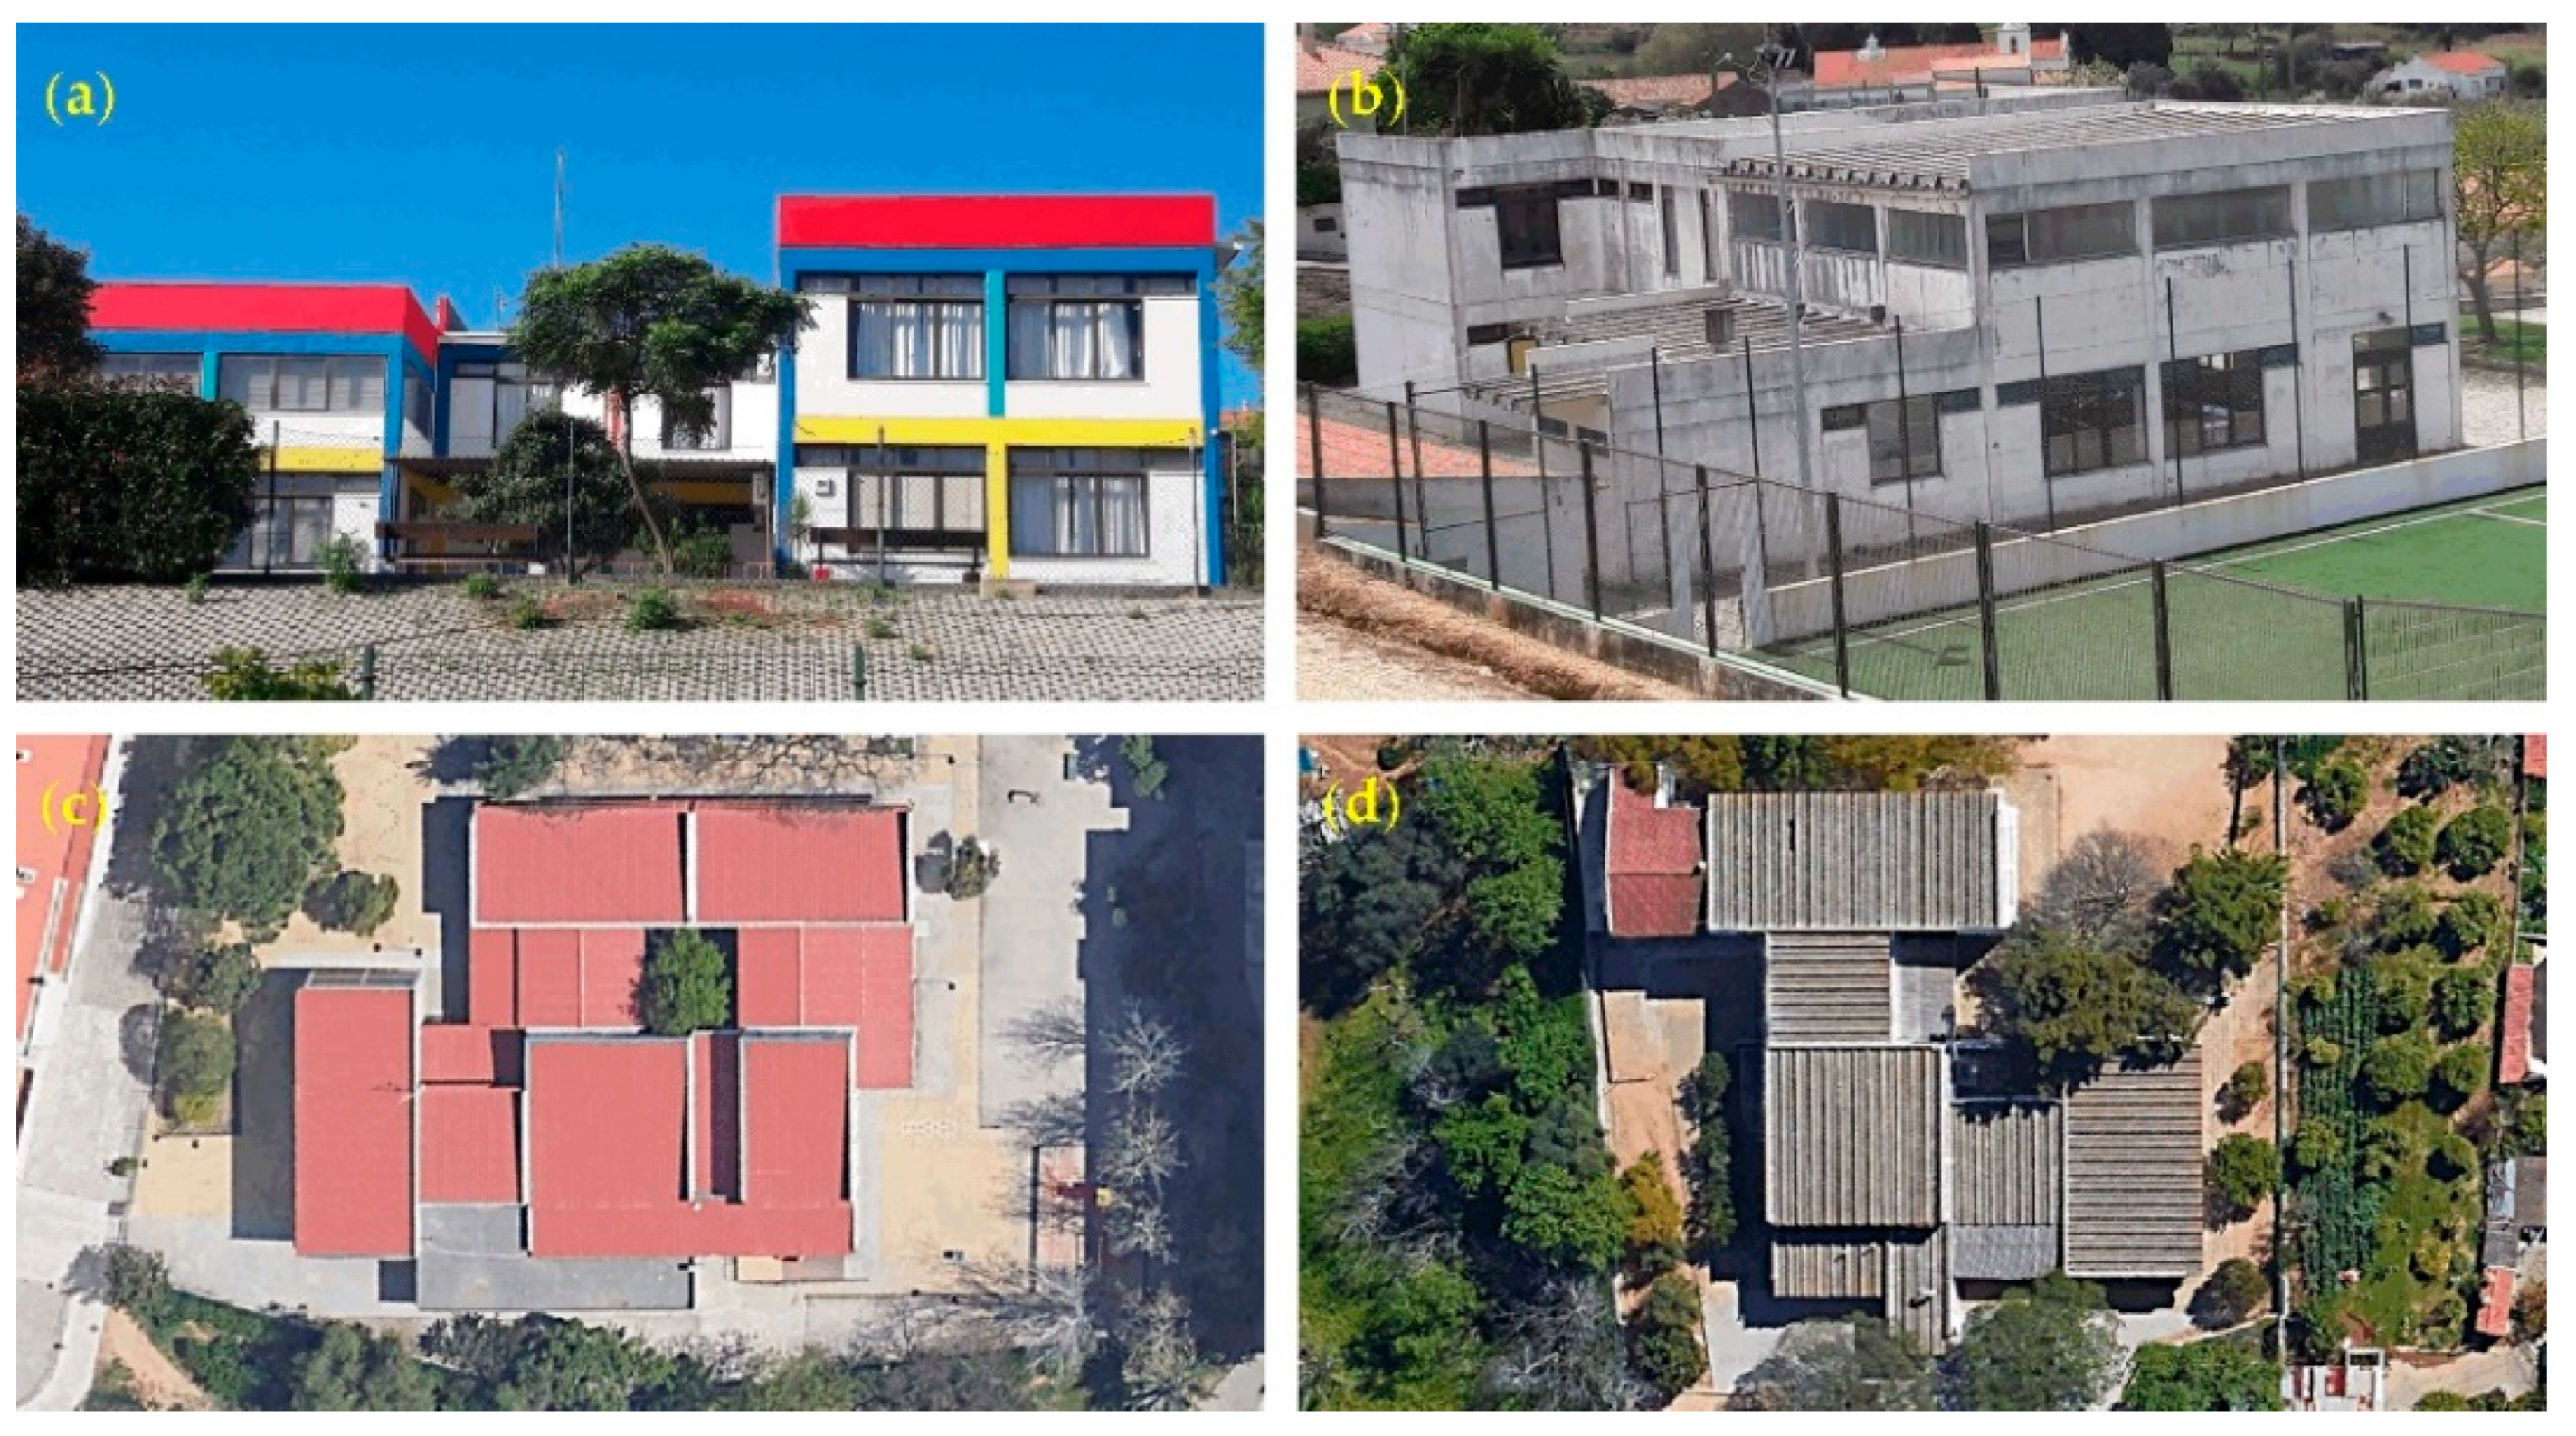
17] until the end of the 1980s. At the present time, it is possible to find “P3” schools still in use as primary schools in several municipalities all over the Algarve region, namely in: Faro (3); Lagos (1); Loulé (1); Monchique (1); Portimão (3); São Brás de Alportel (2); Silves (2); and Vila do Bispo (1). These schools present different module combinations and level of conservation (
Figure 3). It was also possible to identify some changes to the original designs, because sometimes new rooms were added after the initial construction.
3. Nonlinear Static Analysis
Since the beginning of the PERSISTAH project, the adoption of simplified empirical methods to assess the seismic vulnerability of individual school buildings was avoided despite the high number of school buildings involved in the task. Instead, the structural analysis methods that are proposed in the EC8-3 were adopted as much as possible to better understand what the real structural behaviour of this type of constructions would be and what should be expected in terms of damage in case of the occurrence of a destructive earthquake that might affect the Algarve region, as has already happened in the past. With this approach, it was also possible to figure out what the seismic safety level of the studied school buildings was according to national standards.
The EC8-3 presents the possibility of adopting two types of structural behaviour: linear and nonlinear. One the other hand, according to the EC8-3, it is also possible to adopt either static or dynamic analysis. Nonlinear time-history analysis (NTHA) is probably the most accurate method for seismic analysis of individual buildings. An alternative to NTHA is to adopt nonlinear static analysis (NSA), which is a less computer demanding alternative, often used for seismic assessment of school buildings [
9,
18,
19,
20]. Moreover, the validation tests that were carried out upon the development of a dedicated seismic assessment software show a good agreement between NTHA and NSA [
16].
According to the EC8-3, the adoption of NSA methods is dependent on the knowledge level (KL) of the structure, which also depends on several factors, such as the knowledge about the geometrical properties of the structural system, about the details of the structural elements, and about the mechanical properties of the constituent materials. KL also influences the value of the confidence factor (CF), which is then used to minimize the adopted values of the capacity of the structure. The KL of the structure should be KL2 (the normal knowledge), at least, to be possible to adopt an NSA. Unfortunately, only incomplete design drawings of the “P3” schools were found, and it was impossible to carry out any destructive or semi-destructive in situ tests, because the school buildings were all in use.
This study is about the primary school EB1 n.5 of Faro (Algarve), which is a “P3” school built in 1987, having a maximum capacity of about 250 students.
3.1. The Characteristics of the Structural Elements
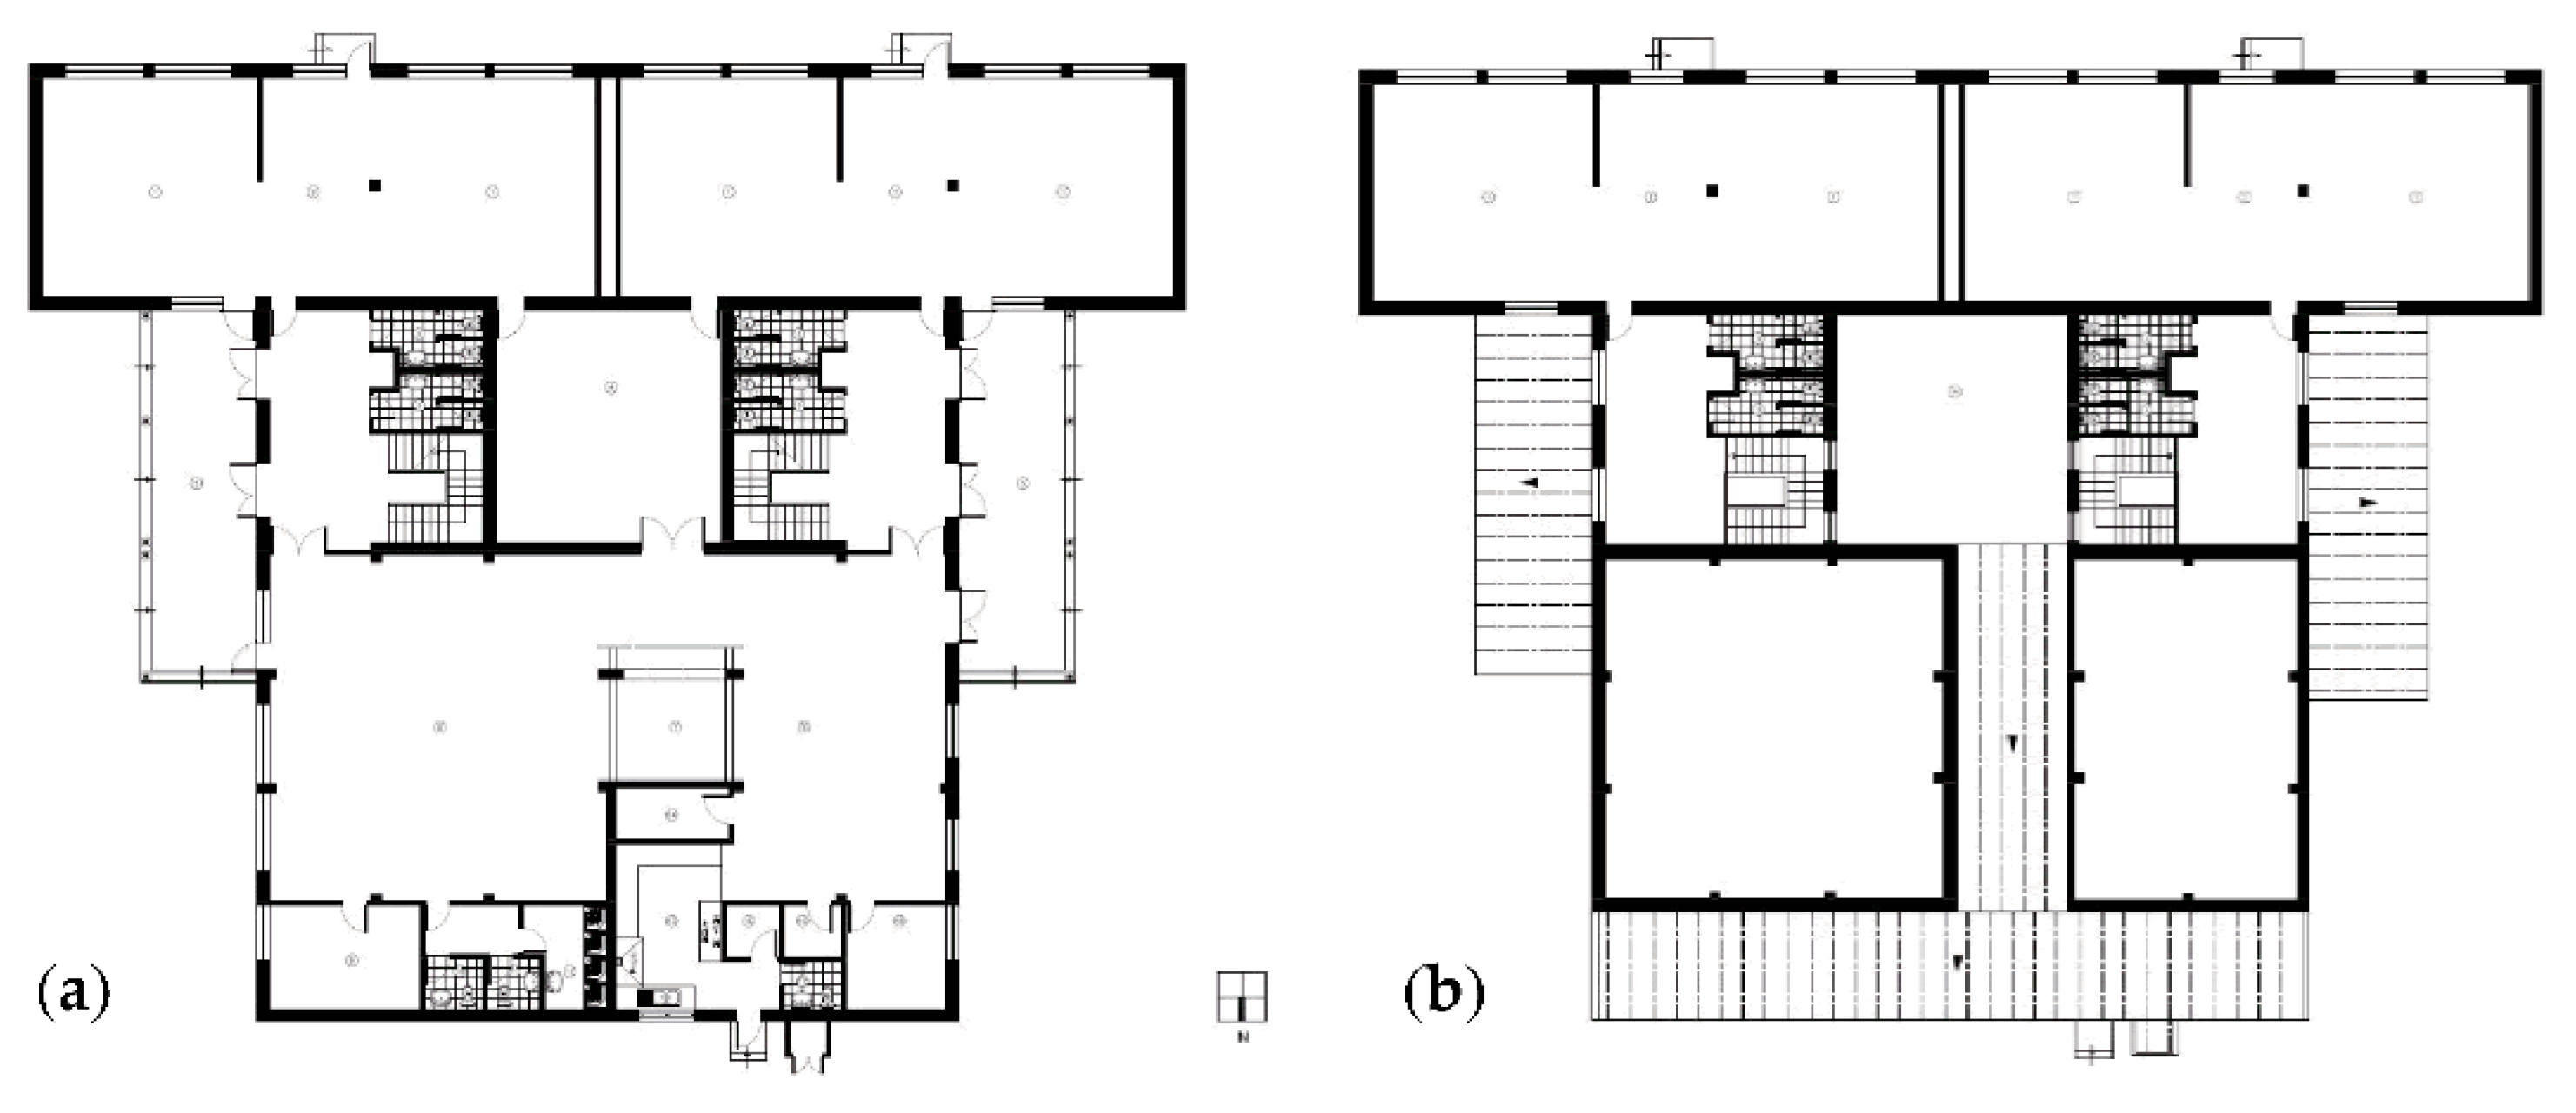
It was possible to find the architectural plans of this school (
Figure 4) with the location of the RC columns, but unfortunately no structural design details were found whatsoever. The school is divided in four structurally independent modules: two classroom modules of type (d) of
Figure 2, and two central modules with different sizes (a multipurpose room and a school cafeteria). Fortunately, the architecture of the “P3” schools exhibits apparent RC columns and beams, as can be observed in
Figure 3, which made it possible to carry out a detailed survey of the school without damaging the buildings in order to obtain the location and the dimensions of the RC structural elements [
21], as presented in
Figure 5 and
Figure 6.
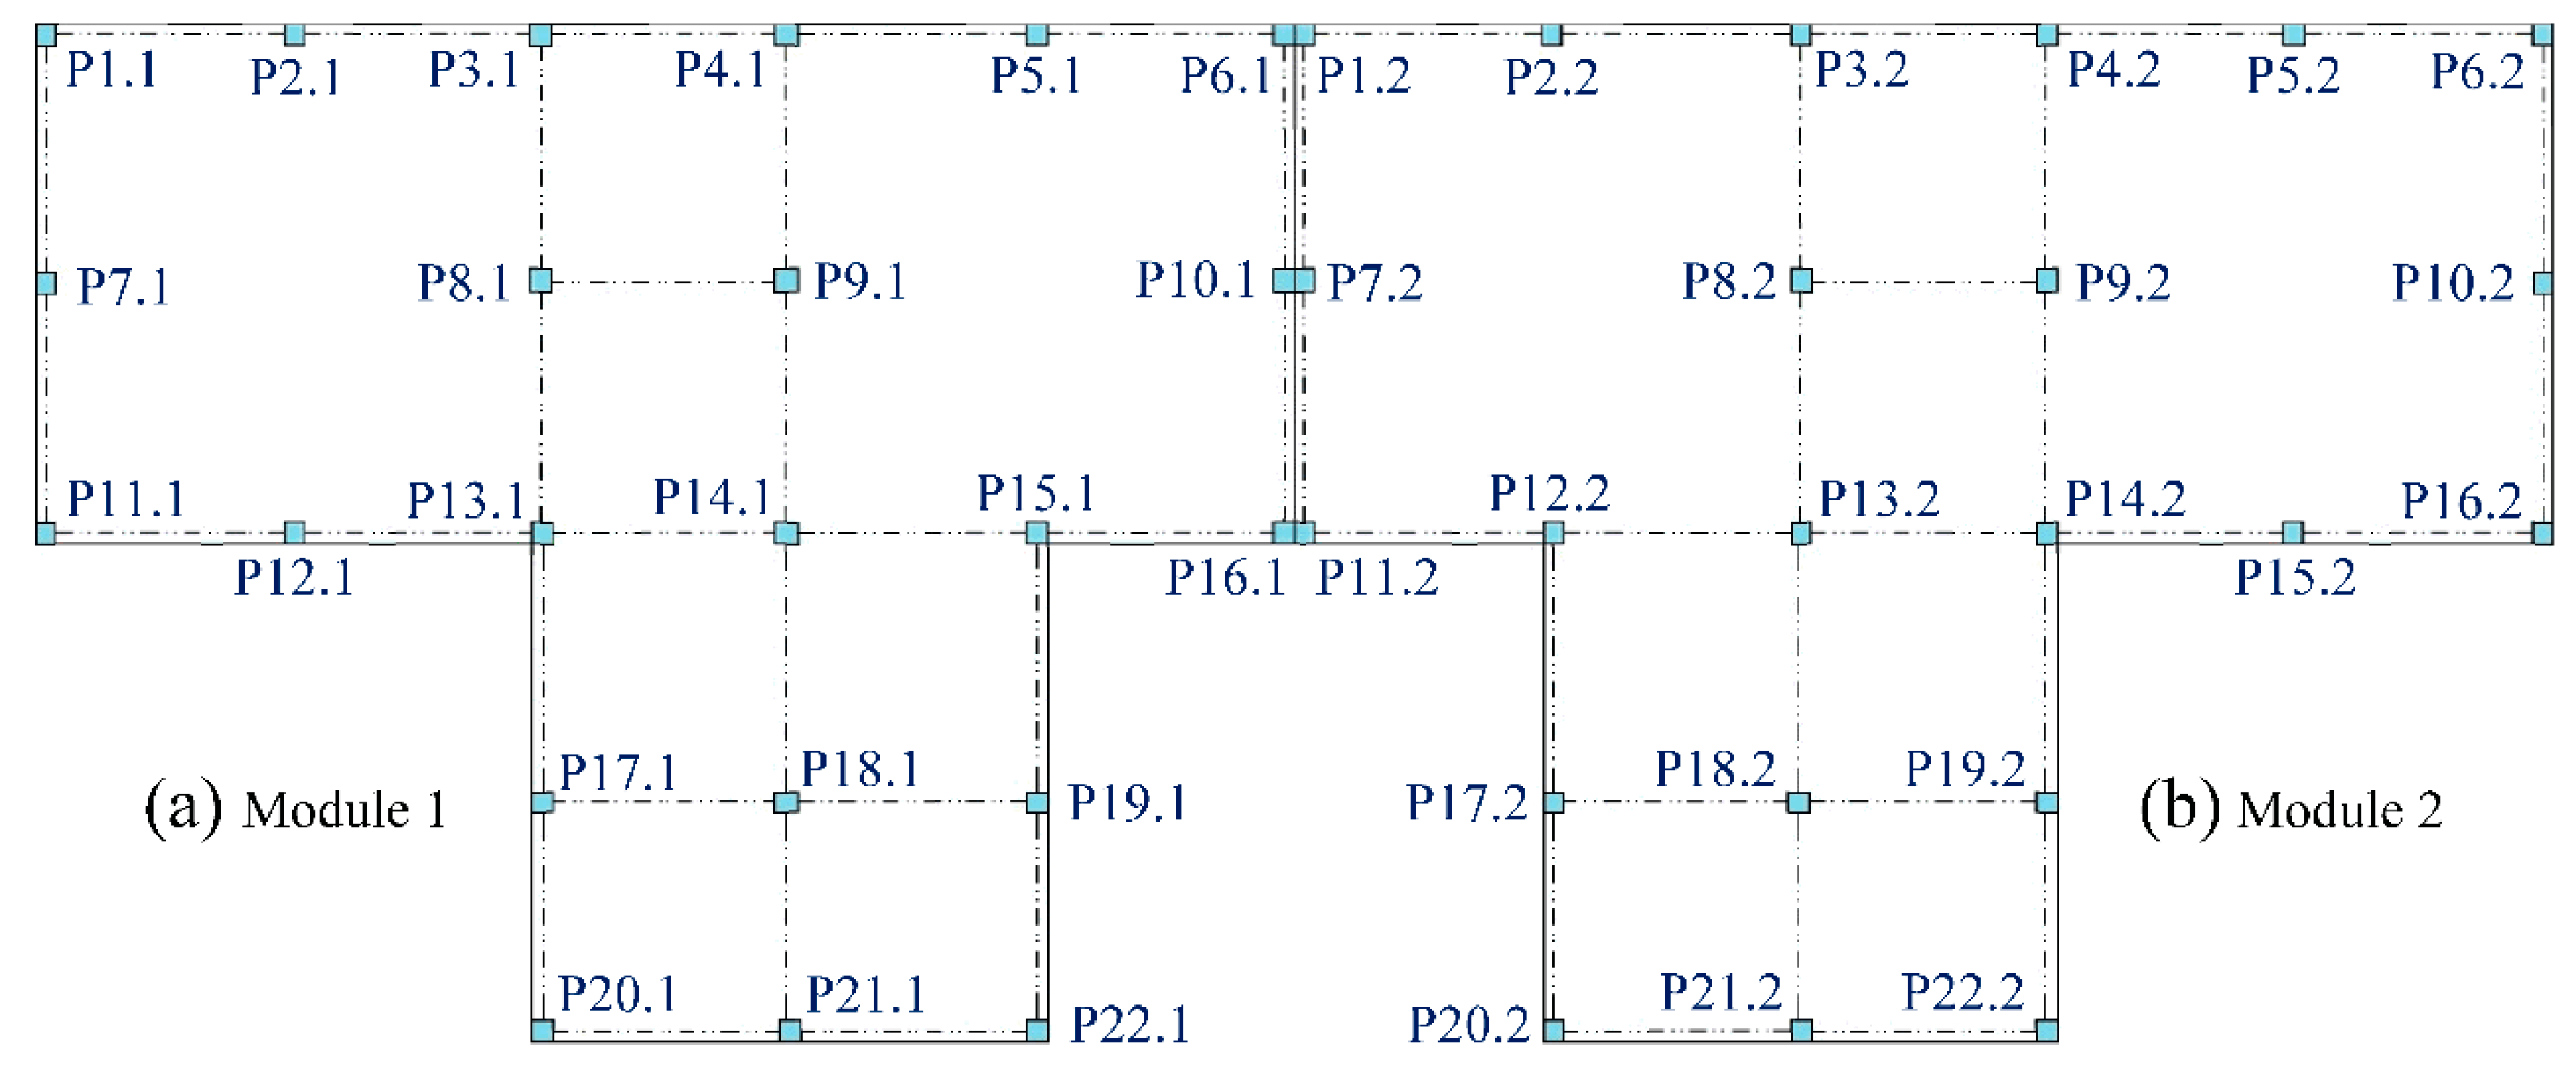
The structural system of modules 1 and 2 is symmetrical, composed of a frame system and presenting beams with a rectangular cross-section of 0.30 × 0.50 m and columns with a squared cross-section of 0.30 × 0.30 m, equally spaced with an interval of about 3.60 m (
Figure 5).
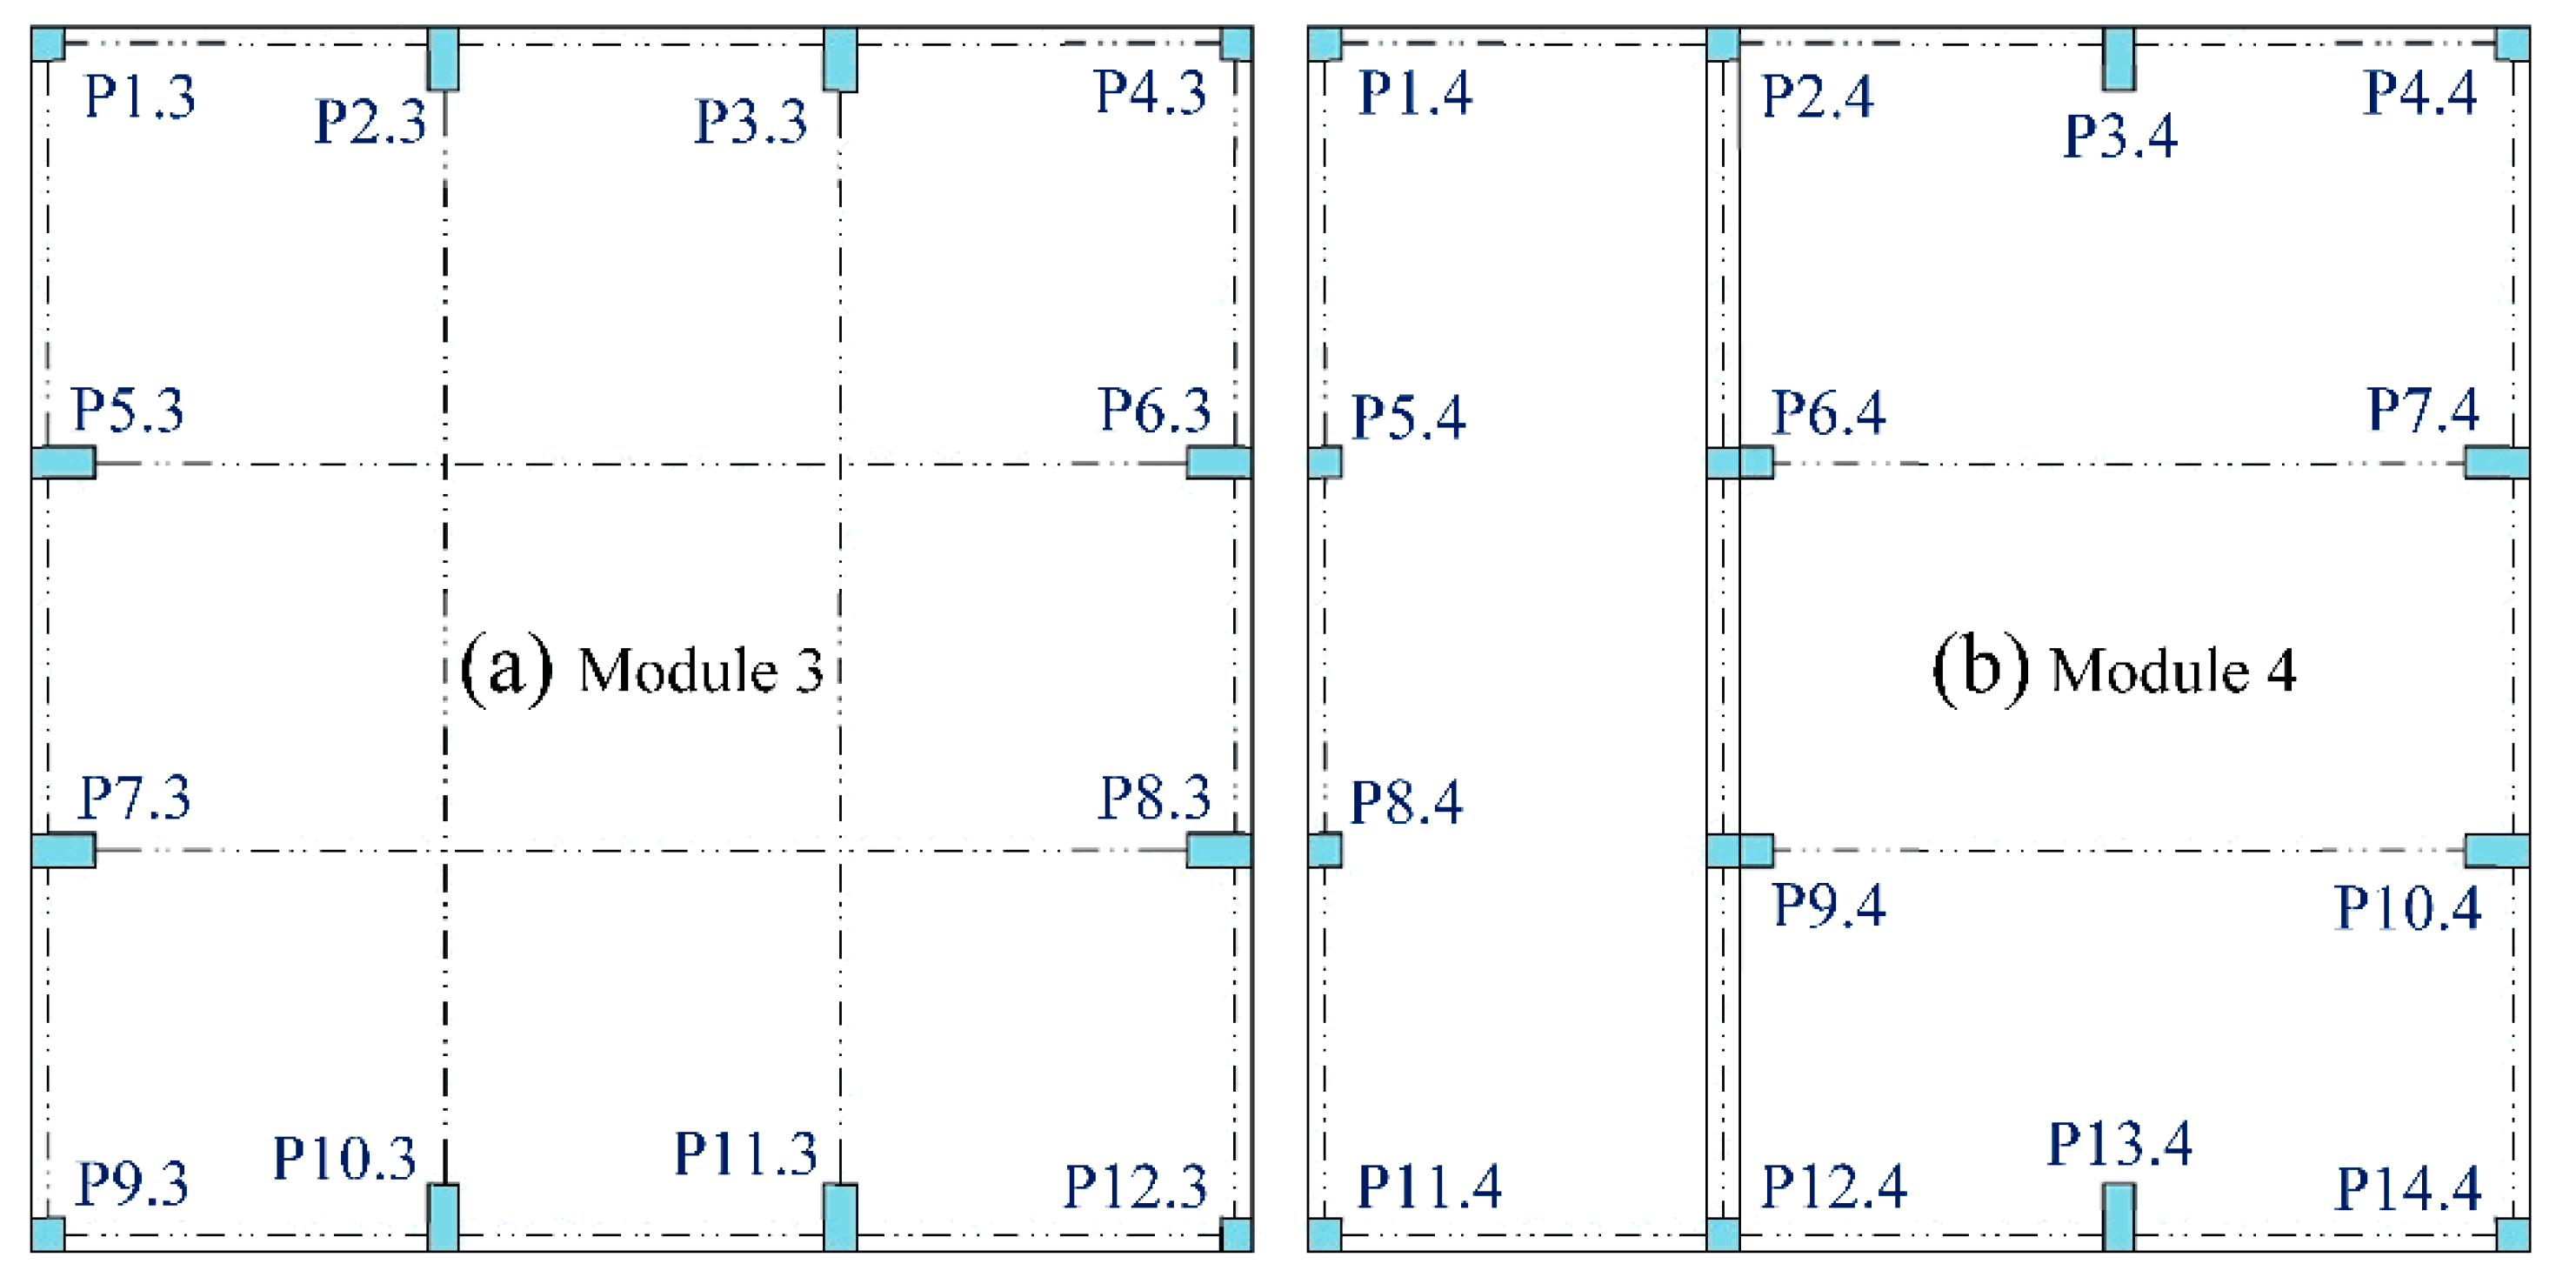
Modules 3 and 4 present different structural systems when compared with each other. Both are double-height ceiling modules of about 5.80 m high. The cross-sections of the columns of these modules are squared (0.30 × 0.30 m) or present rectangular shapes (0.30 × 0.60 m), as shown in
Figure 6. They are also equally spaced with an interval of about 3.60 m. Modules 3 and 4 also present beams with rectangular cross-section (0.30 × 0.50 m) at half height in the perimeter of the modules.
A set of non-destructive in situ tests was also carried out [
21]. A pachometer was used to measure the concrete cover and to detect the diameters and the positions of the rebars in the cross sections of the RC structural elements. Other non-destructive in situ tests were also carried out, namely the Schmidt hammer test procedure and the Ultrasonic Pulse Velocity test procedure, which allowed us to obtain an estimative of the concrete strength [
21].
Based on what is established in the EC8-3, it is possible to consider that the KL of the structure is KL2 for the columns (normal knowledge) and KL1 (limited knowledge) for the beams. This means that only linear analysis should be carried out, according to the EC8-3. Nevertheless, because it was necessary to rank the seismic safety of the school buildings in the context of the PERSISTAH project, both linear and nonlinear analysis were adopted.
3.2. Simulated Design of RC Beams
The survey that was carried out allowed us to obtain the details of all the RC columns of the modules but not of the RC beams. For this reason, the structural details of the RC beams were based on simulated design in accordance with usual practice at the time of construction, as indicated in the EC8-3. For that purpose, the structural analysis and design of the RC beams were carried out using the seismic action and the design rules that were established in the Portuguese codes that were mandatory at the time of the construction [
22,
23].
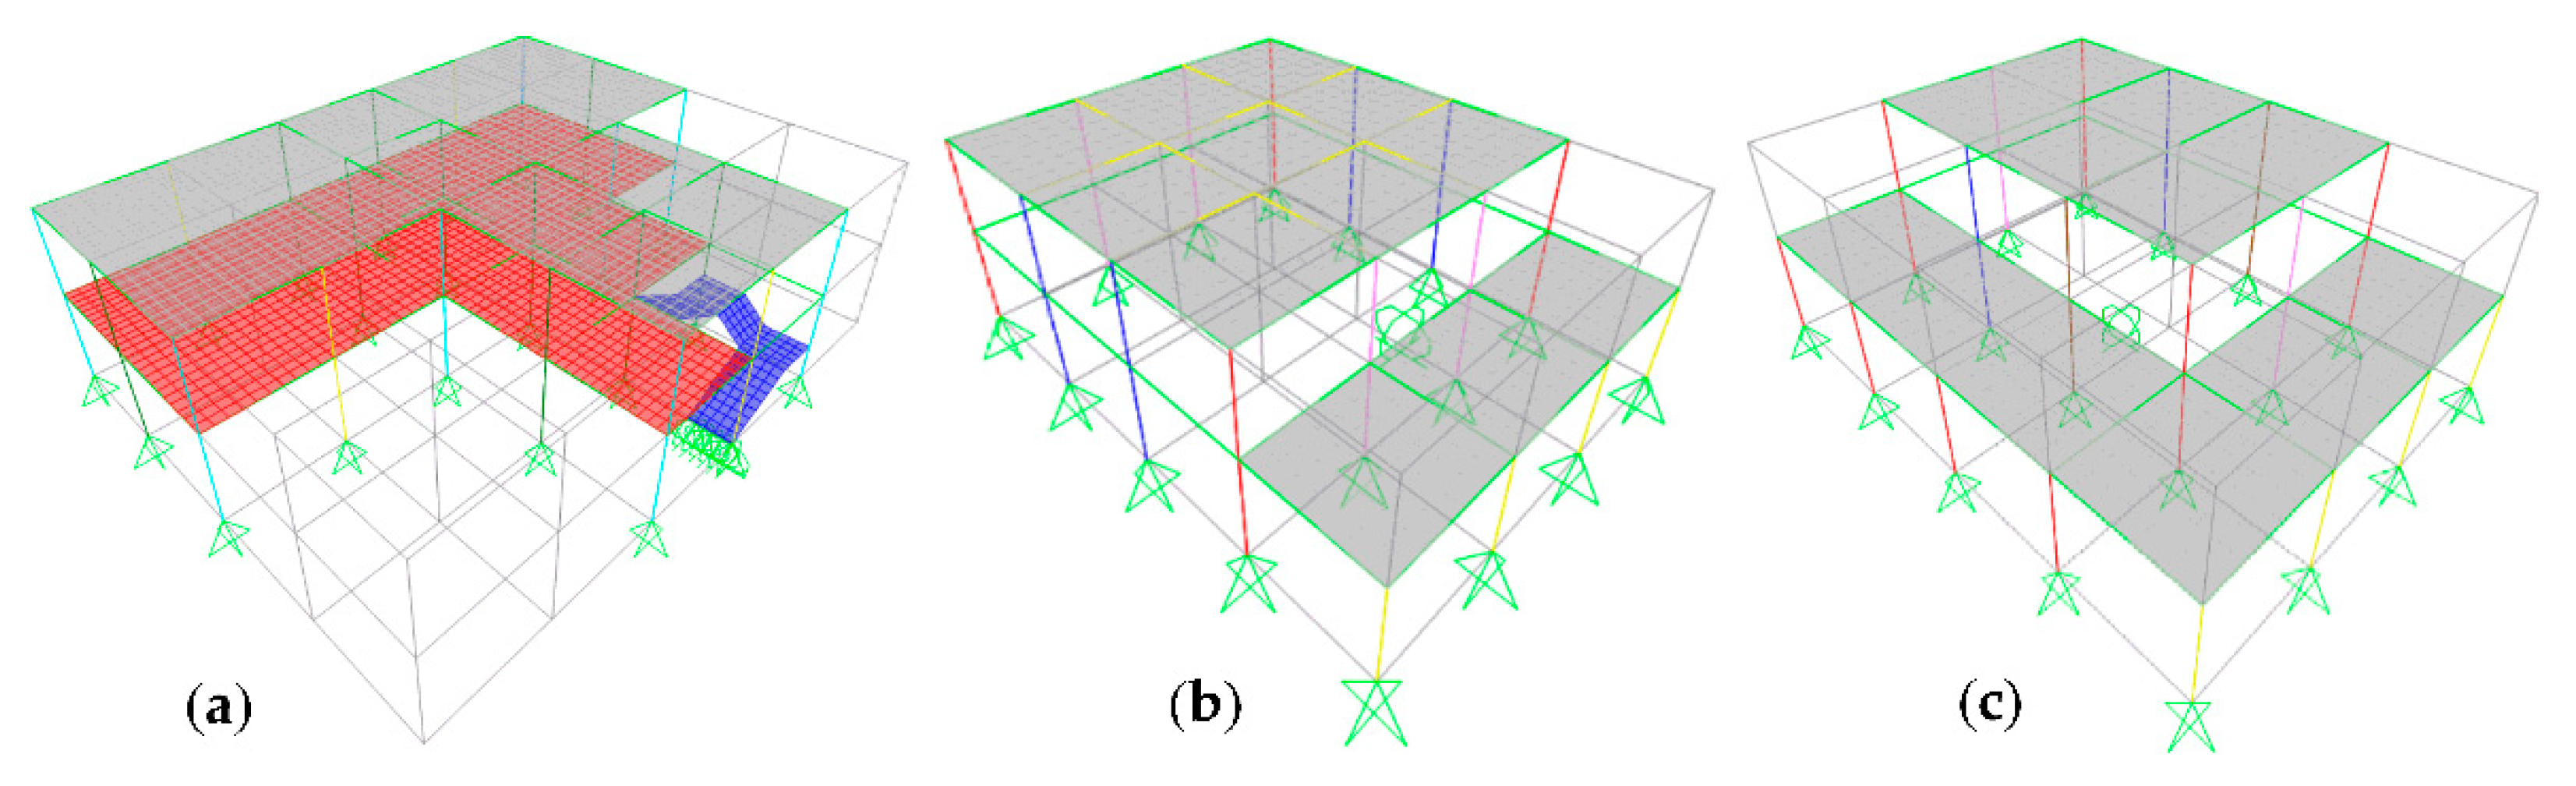
The software SAP2000 [
24] was used to carry out the simulated design of the RC beams and the stairs (no infill masonry walls were included in the model, because there are not enough laboratory tests about the mechanical characteristics of the masonry walls that are presented in the “P3” schools). The adopted structural models are presented in
Figure 7.
3.3. The Obtained Capacity Curves
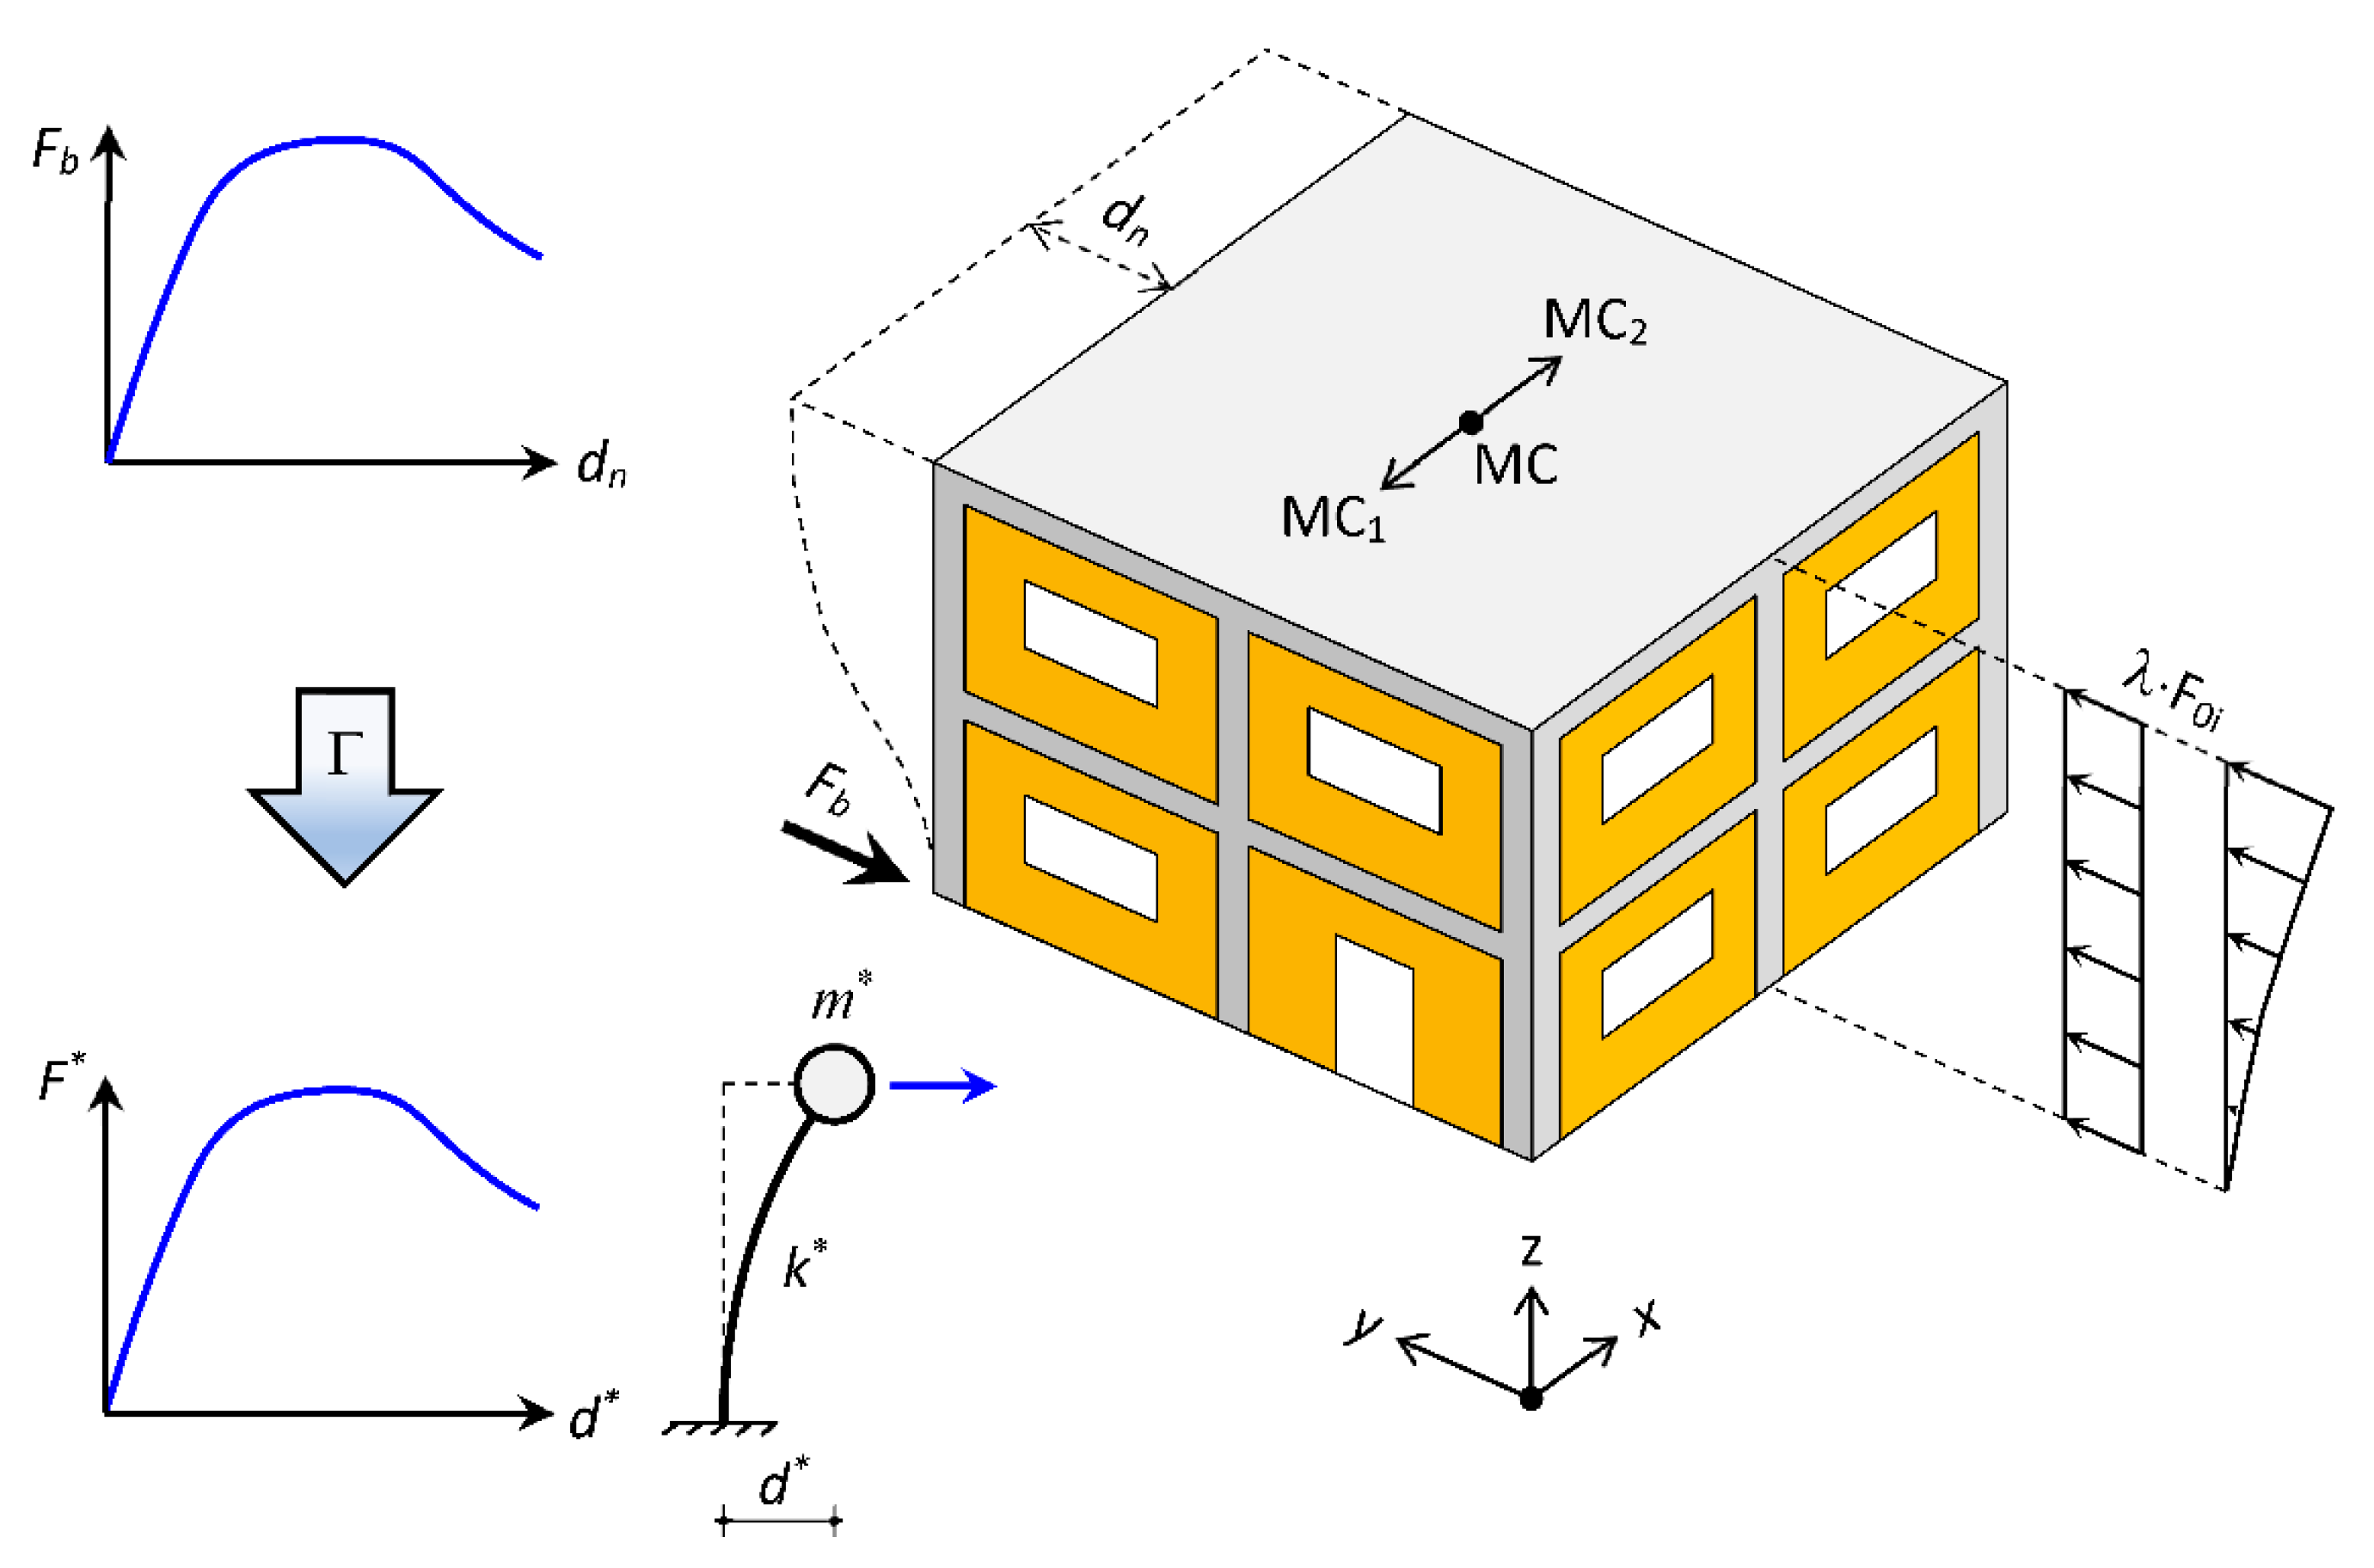
After performing the simulated design of the RC beams, it was then possible to determine the capacity curves of the structure of each school independent module, which are the relations between the base shear forces (Fb) and the displacements of the control node (dn), normally being the mass centre (MC) of the roof top.
According to the EC8-1, the first step of a nonlinear (pushover) static analysis is to transform the initial multiple degree of freedom (MDOF) problem (with mass mi associated to each degree of freedom i) in an equivalent single degree of freedom problem (SDOF), with stiffness k* and mass m*, by using a transformation coefficient (Γ).
The coefficient Γ is a function of an adopted deformed shape configuration (
ϕi), which then is normalized so that the value
ϕn of the control node is unitary, being
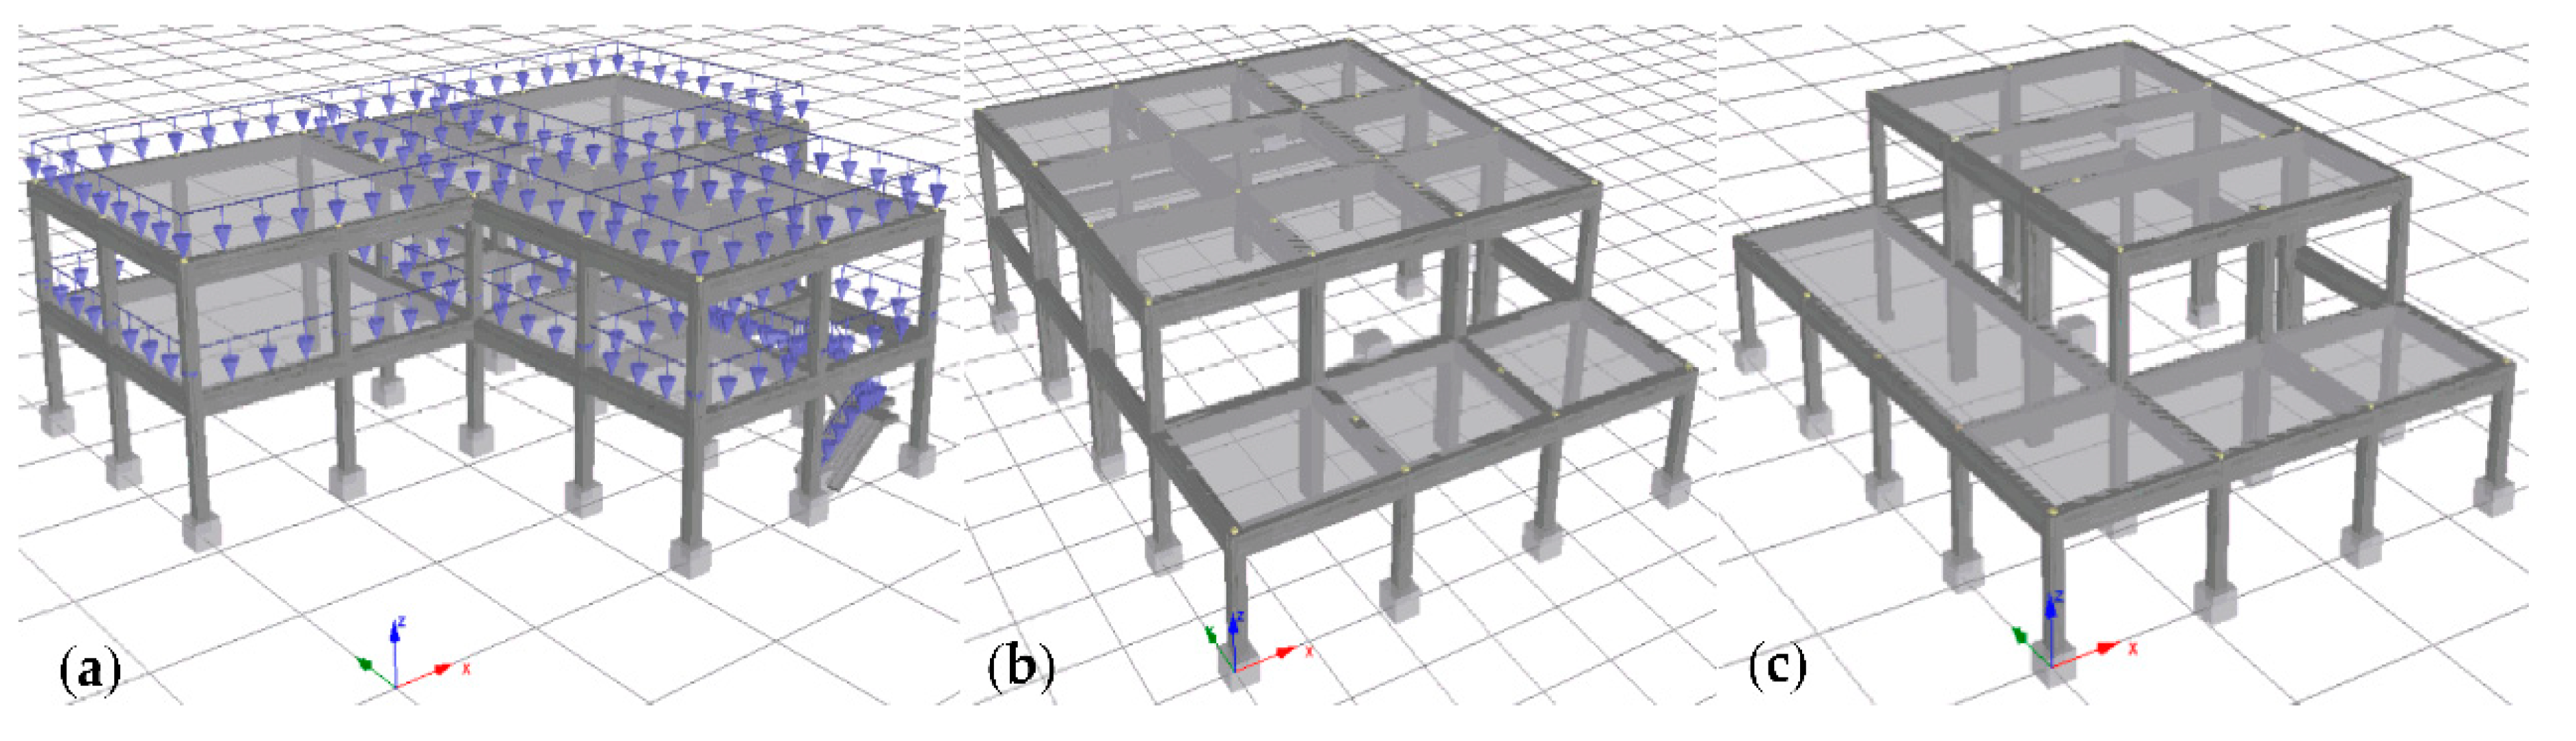
Software SeismoStruct [
25] was used to obtain the capacity curves. The structural model of each school module was created by introducing all the structural elements in the SeismoStruct (
Figure 8) and all the steel rebars. An inelastic force-based frame finite-element type was used to model beams and columns, which is capable of capturing the inelastic behaviour along the entire length of a structural member, allowing very high accuracy in the analytical results. Cross-sections were divided in small fibres. The sectional stress–strain state of this type of elements was obtained through the integration of the nonlinear uniaxial material response of each fibre. To carry out the seismic analysis, an eigenvalue analysis was carried out at first, and then a set of static horizontal forces (
F0i) was applied to the
N degrees of freedom of each structural school module. These forces were determined so that the sum of those forces was equal to the unity, being
Adopting this strategy, Fb was equal to the load parameter (λ) computed by the SeismoStruct during the nonlinear structural analysis.
A displacement control scheme was selected to perform the pushover analysis. Each nonlinear structural analysis was carried out by incrementing the horizontal forces until one of the following options were verified: if the formation of the collapse mechanism was achieved; if the EC8-3 near collapse (NC) limit state was reached for the chord rotation capacity (Equation (1) of the EC8-3); or if the convergence of the iterative process was not achieved.
Because the capacity curves are also used for civil protection purposes, namely for assessing the degree of damage associated with any given earthquake scenario [
16], and not only for assessing the seismic safety level that is established in the EC3-3, a different approach was adopted in the context of the PERSISTAH project, which was already used in past seismic assessment studies [
26], namely: if the NC shear capacity limit was reached during the iterative process, which corresponds to the shear capacity that is given by Equation (2) of EC8-3, then the shear strength was reduced to a value corresponding to 20% of the initial shear strength without stopping the pushover analysis. This value is the SeismoStruct default option, which agrees with results obtained from some laboratorial tests results [
27].
The EC8-1 establishes that it is necessary to consider three positions of the MC (to account for the accidental eccentricity) for each horizontal direction and two different patterns of force distribution (an “uniform” distribution, which is obtained by considering
ϕi = 1, and a “modal” distribution, which in the present study was considered equal to shape deformation associated with the vibration mode with the highest participation factor in each direction), as schematized in
Figure 9.
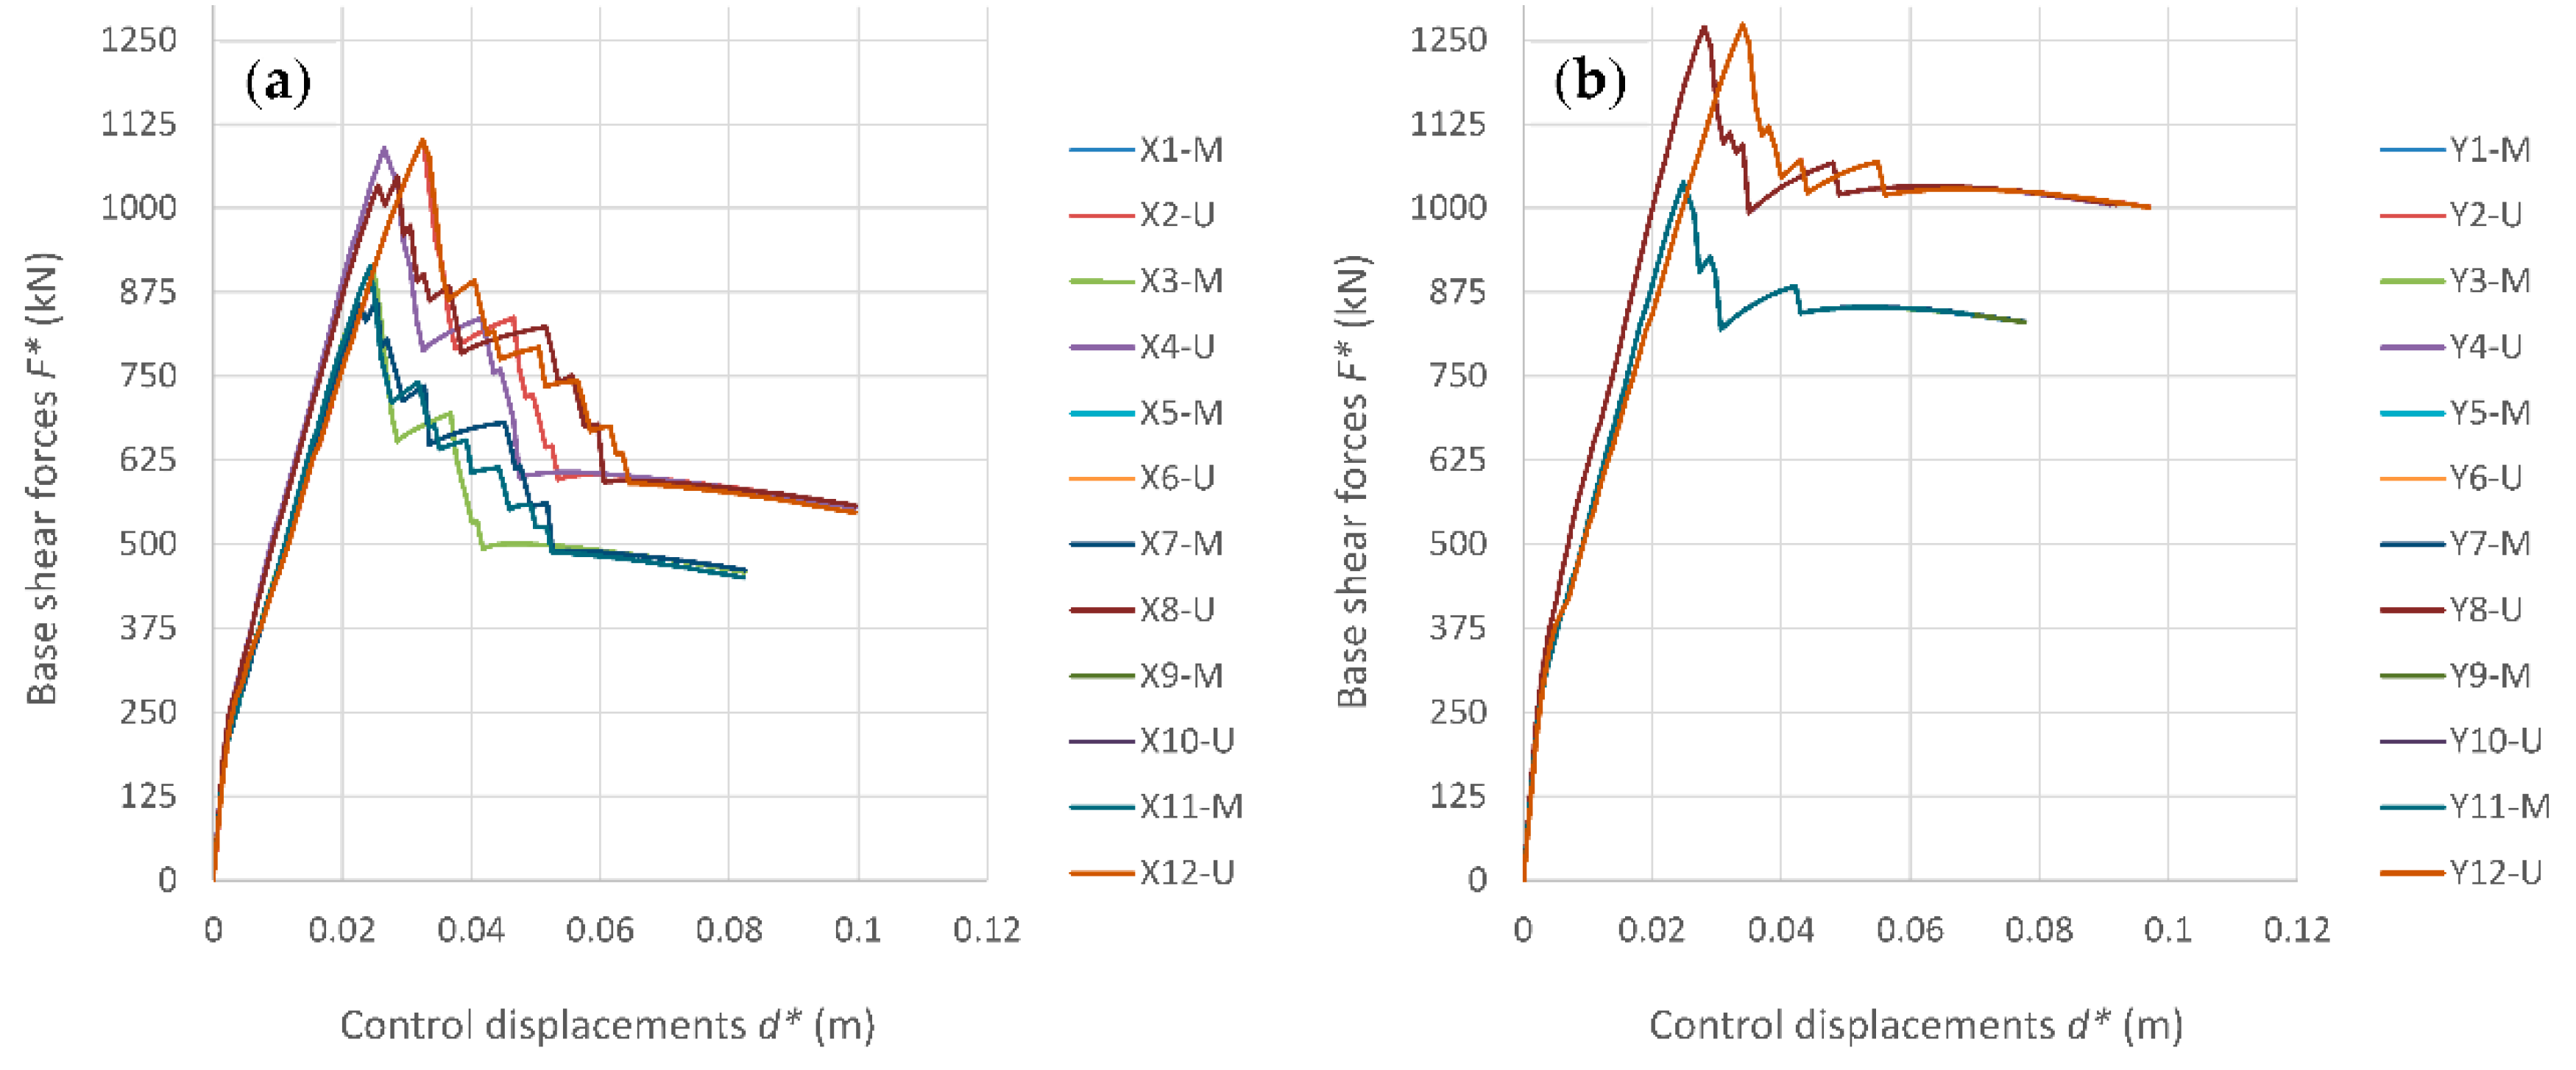
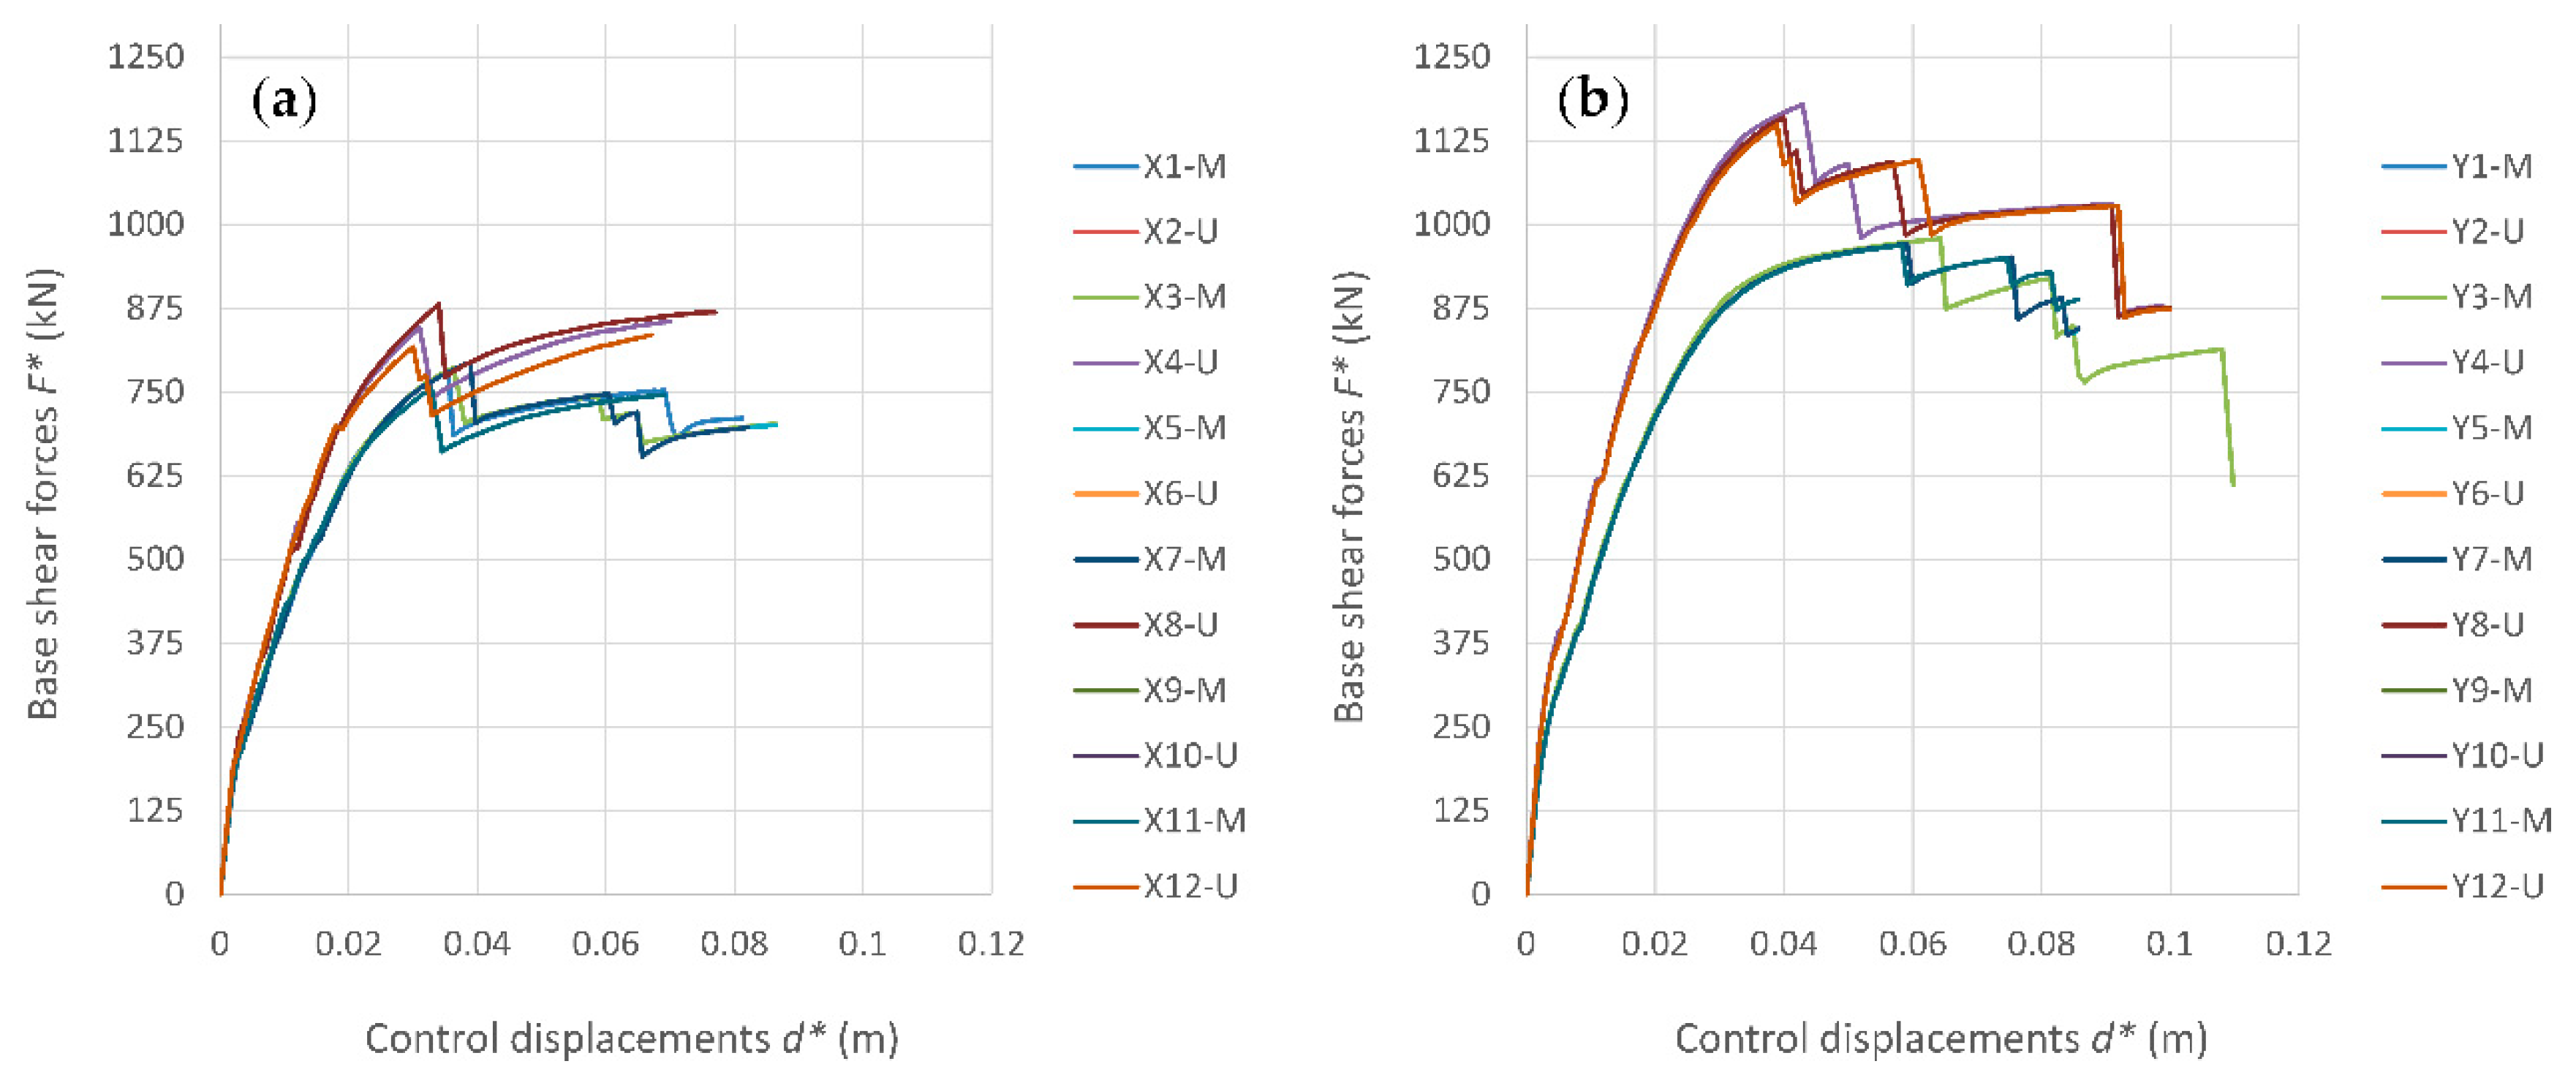
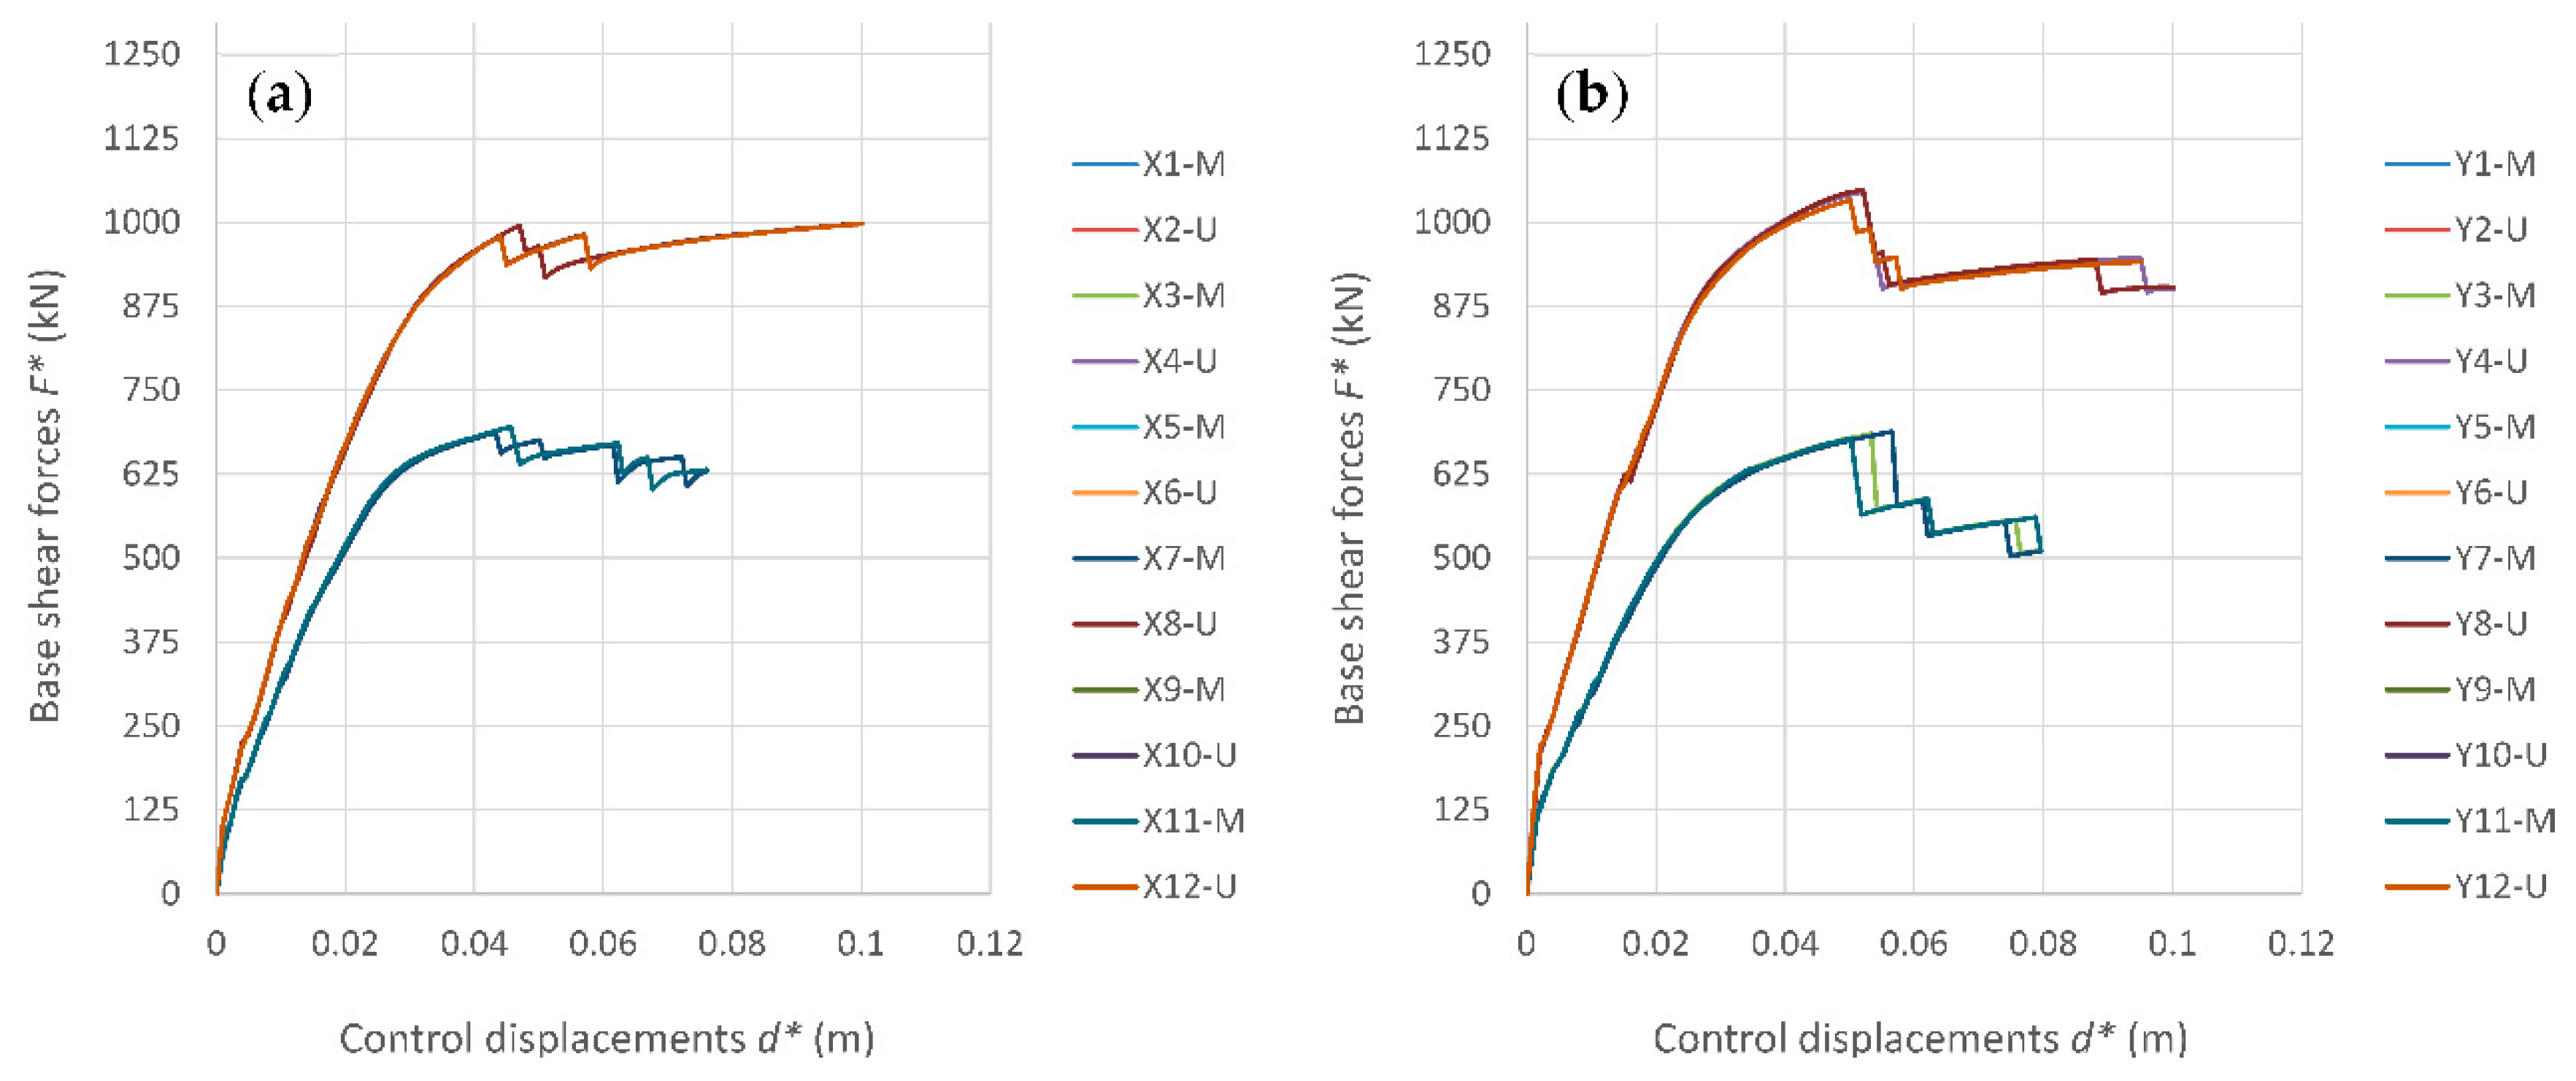
For each school module, 12 capacity curves were computed for each direction (resulting from the product of two force patterns × two force directions × three MC positions), leading to a total of 24 capacity curves. A total of 72 capacity curves were computed for all the different modules of the studied “P3” school. Many of those capacity curves are almost coincidental, namely due to symmetry issues, as presented in
Figure 10,
Figure 11 and
Figure 12.
4. Seismic Safety Evaluation
As was already mentioned, the adopted strategy for the seismic assessment of existing school buildings was to use the methods that are established in the EC8-3 as much as possible, despite being stated in that code that it is not meant to be used for the vulnerability assessment of groups of buildings (in the context of the PERSISTAH project, a total of more than 160 independent structural modules were studied both in Portugal and in Spain). Nevertheless, structural analyses were carried out for buildings according to the EC8-3, namely the N2 method [
28] was adopted, as it is presented in the Annex B of the EC8-1 (using the iterative approach).
The Portuguese National Annex of Eurocode 8, NP EN 1998-1:2010 [
29] became the new national seismic code in 2019. This new code presents an increase of the seismic action for the Algarve region, namely for the design of new school buildings, when comparing to the RSAEEP [
23] (
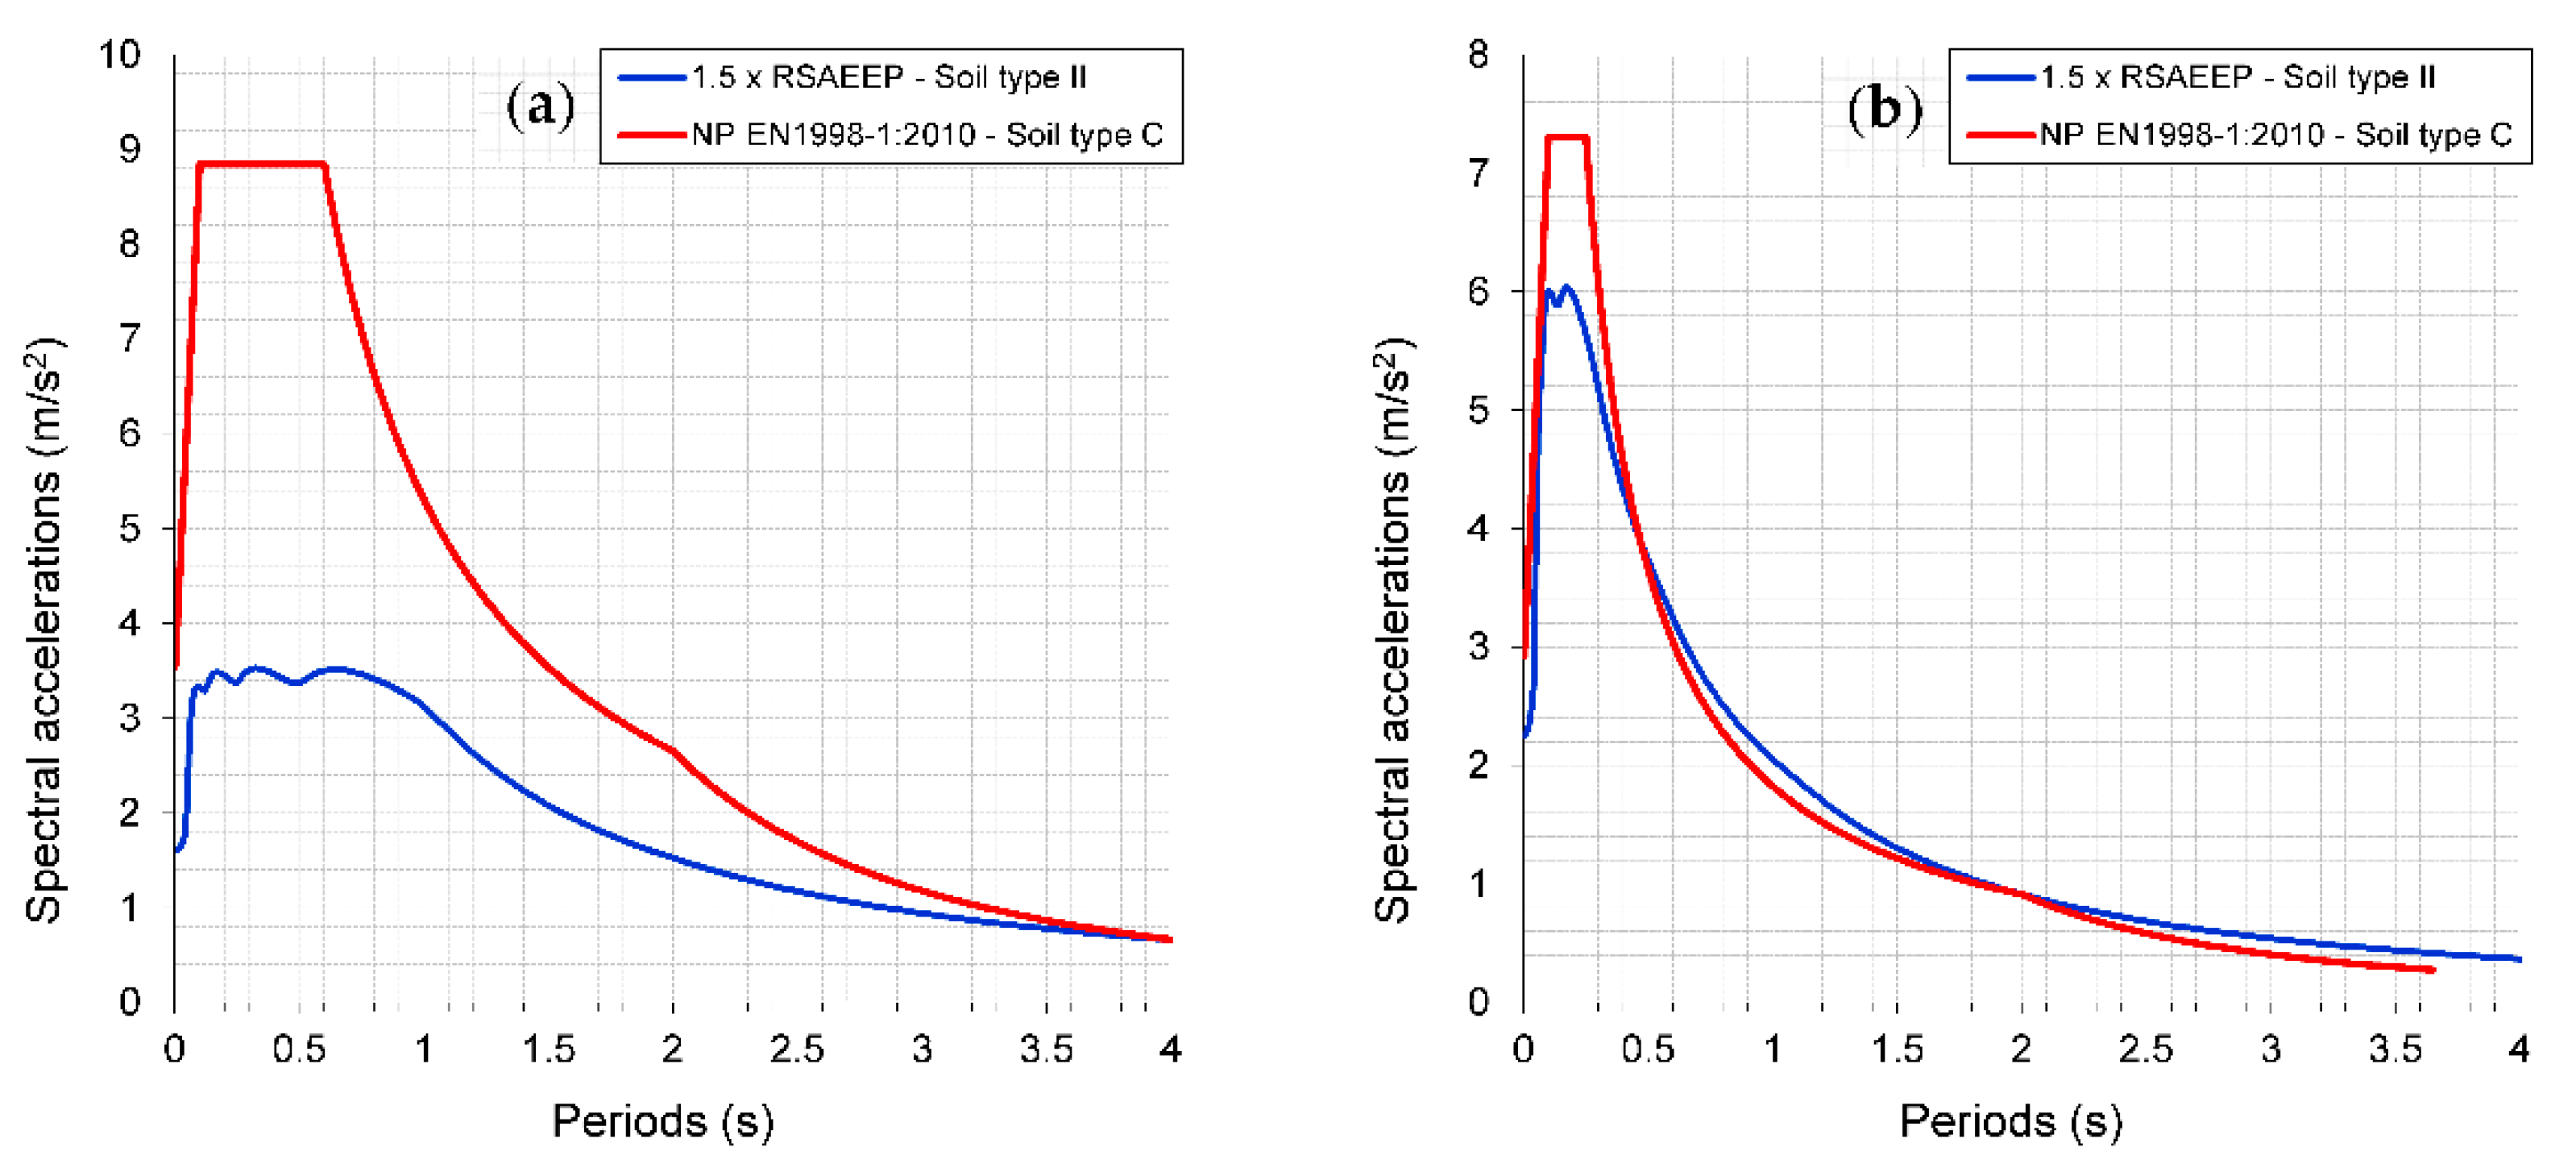
Figure 13), which was the former seismic code. One of the reasons for this increase is related to the importance factor, which is a value higher than one for school buildings in the new code. The other reason is related to a revision of the seismic hazard of the region [
30], which led to an increase of the spectral ordinates due to a combination of the change of the
agR that is established for the municipalities of the Algarve region, the increase of the soil factor (
S), and because the period
TC presents high values, increasing the plateau of the maximum spectral acceleration despite the design seismic action of the RSAEEP being multiplied by a factor of 1.5 (as defined in the code), which can be observed in
Figure 13 for the two earthquake types that are established in both seismic codes.
When comparing the seismic actions presented in
Figure 13, it becomes quite obvious that it will be challenging to assure the seismic safety of existing school buildings that are placed in the different municipalities of the Algarve region when considering the response spectra established in the National Annex of the EC8-1, the most problematic earthquake type being the one that corresponds to the far-field offshore case scenario.
In modern codes such as the EC8-1, any seismic action that is established for the design of new buildings is associated with a return period (
TLR), which is 475 years in the NP EN 1998-1:2010. However, the damage evaluation of the existing school buildings was carried out considering the philosophy that is presented in the EC8-3, where the seismic safety is evaluated based on several limit states (LS), which are associated with different return periods for the seismic action. Moreover, EC8-1 indicates a simplified expression for the determination of a factor (
γL), which can be used to quantify the reference acceleration associated with any other return period (
agRL):
The parameter k should be supported by probabilistic seismic hazard analysis studies. For the Algarve region, the NP EN 1998-1:2010 establishes that k = 1.5 for the far-field offshore earthquake scenario (earthquake type 1) and k = 2.5 for the near-source earthquake scenario (earthquake type 2), which means that the return period established for school buildings in that code is of about 821 years, which is much higher than the 475 years that is established for an ordinary building. Substituting these parameters in Equation (4), it is possible to determine new values for the reference acceleration associated with different return periods (agRL) by using Equation (5) for all the LS that are established in the EC8-3.
4.1. Limit States
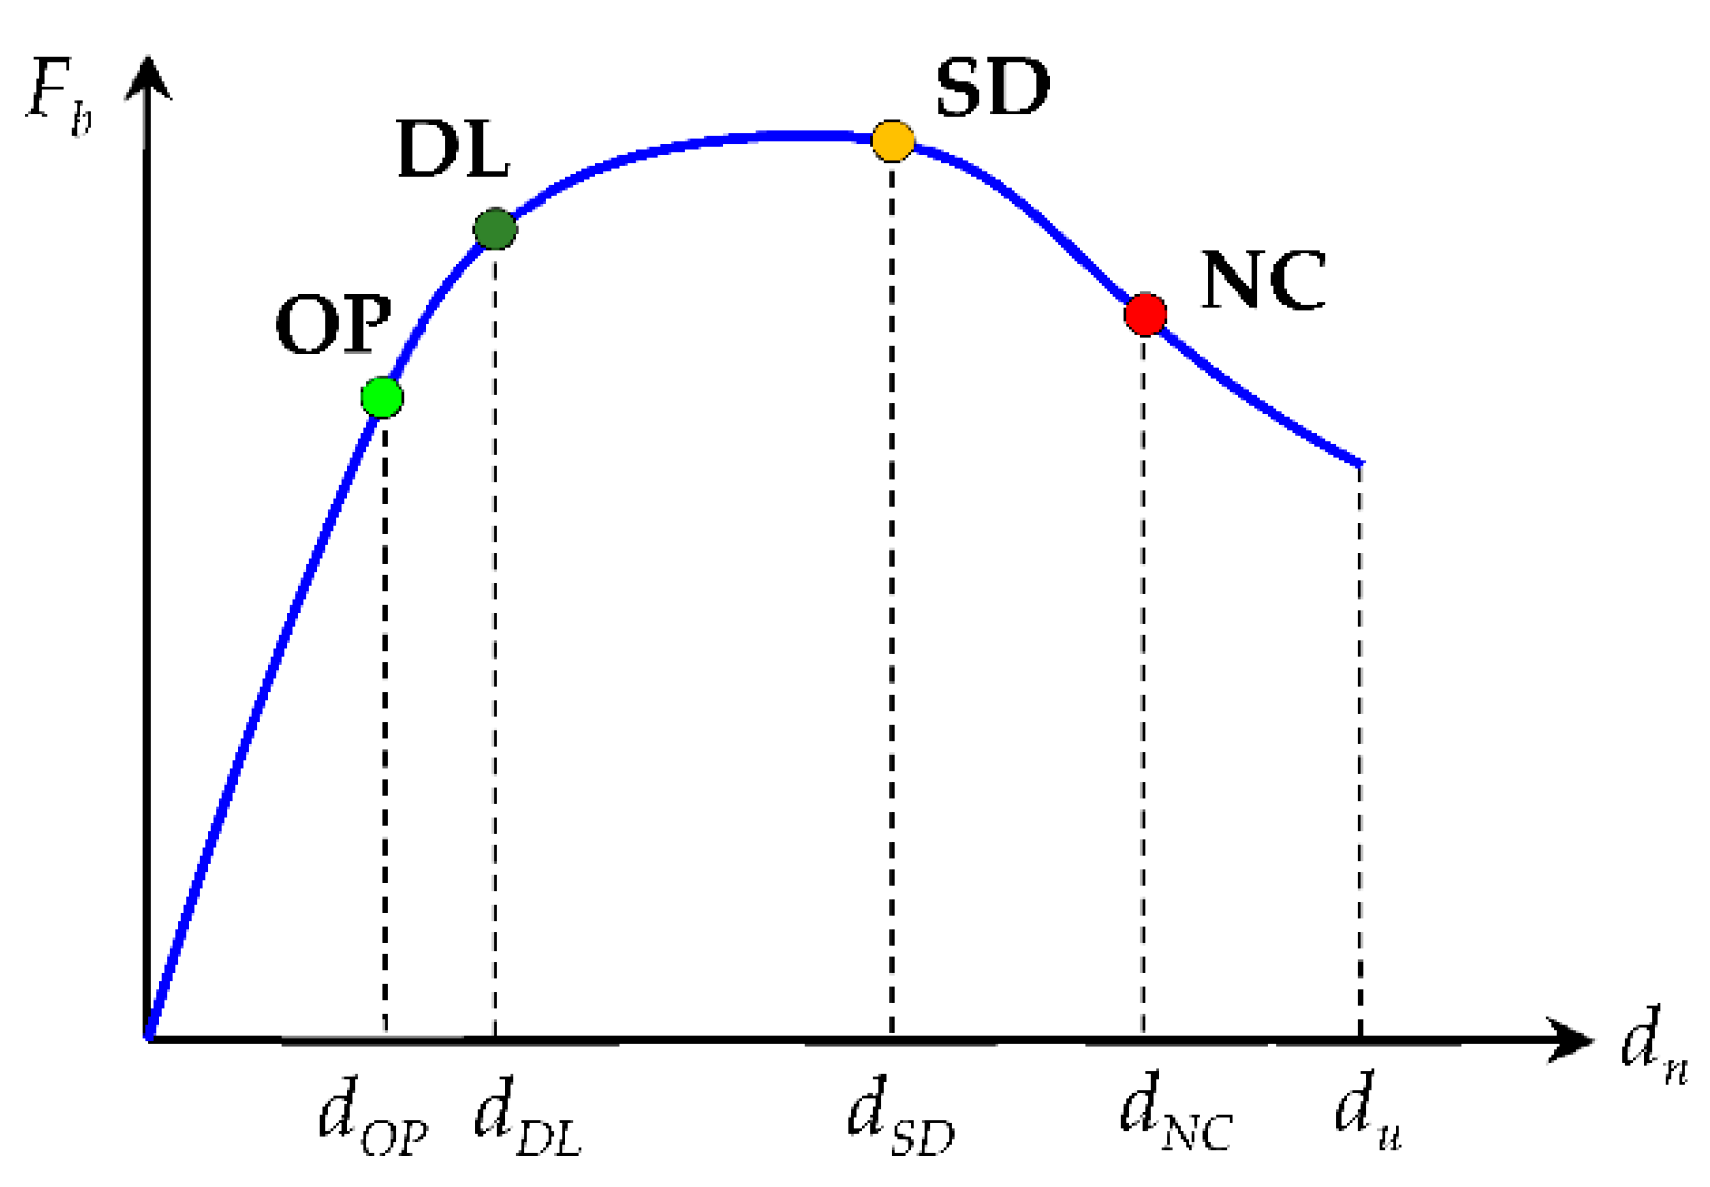
The EC8-3 only establishes three LS to be checked, namely: Damage Limitation (DL), Significant Damage (SD), and Near Collapse (NC). However, in the context of the PERSISTAH project, a fourth LS was also established (
Figure 14): Fully Operational (OP). This LS will also probably be presented in the next generation of the Eurocode 8 [
31,
32], as it is already presented in the newest Italian seismic code, the NTC 2018 [
33,
34].
4.2. Performance Points and Performance Curves
The software developed in the context of the PERSISTAH project [
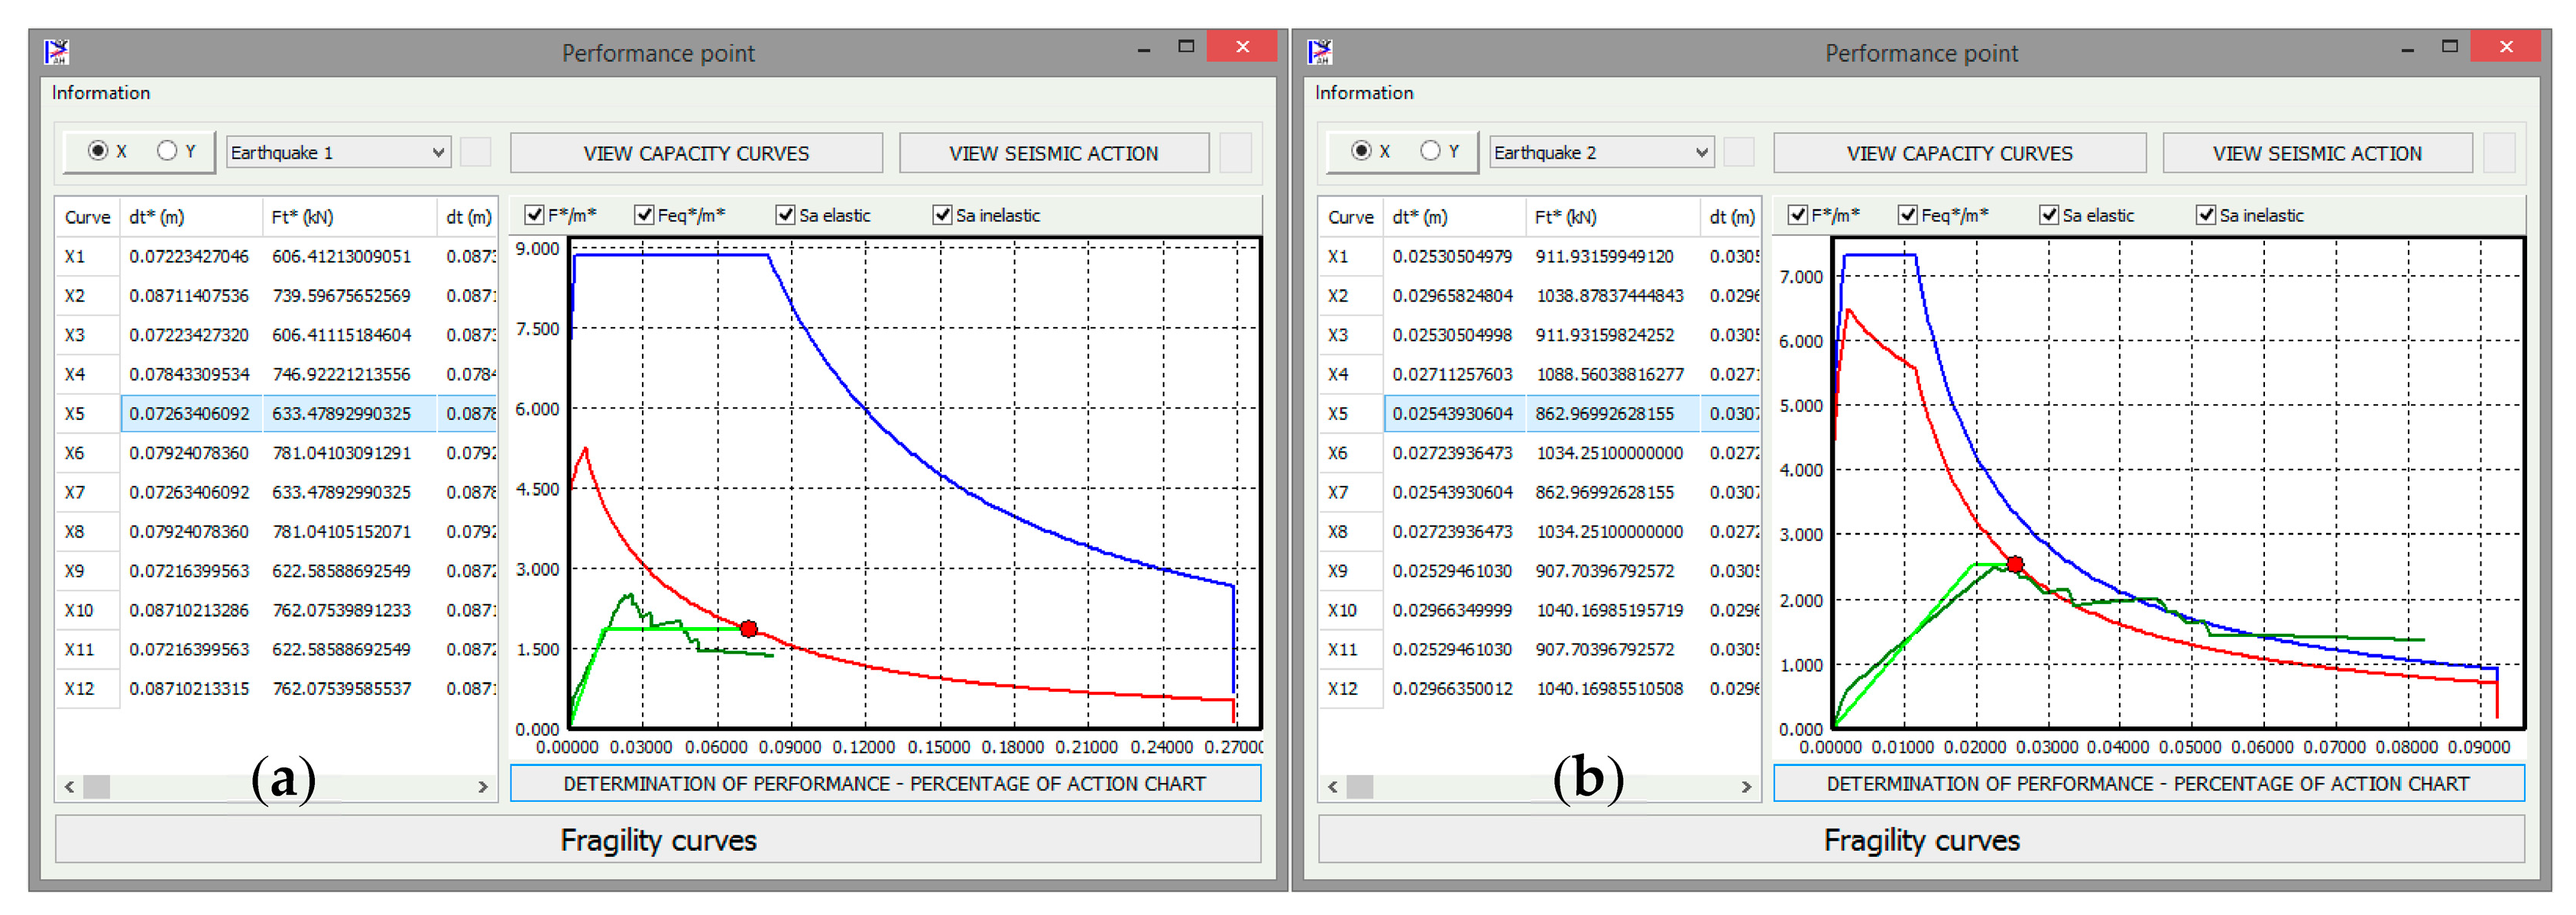
16], was used to compute the performance points for all the capacity curves, and considering the two earthquake types, using the iterative approach of the N2 method presented in the Annex B of the EC8-1 (
Figure 15).
The worst results were obtained for the earthquake type 1 (corresponding to a far-field offshore earthquake scenario), as it can be observed in
Figure 15, because the displacements that were computed with 100% of the seismic action (
TR = 475 years), which are associated to the performance points, even exceeded the values corresponding to the NC limit state.
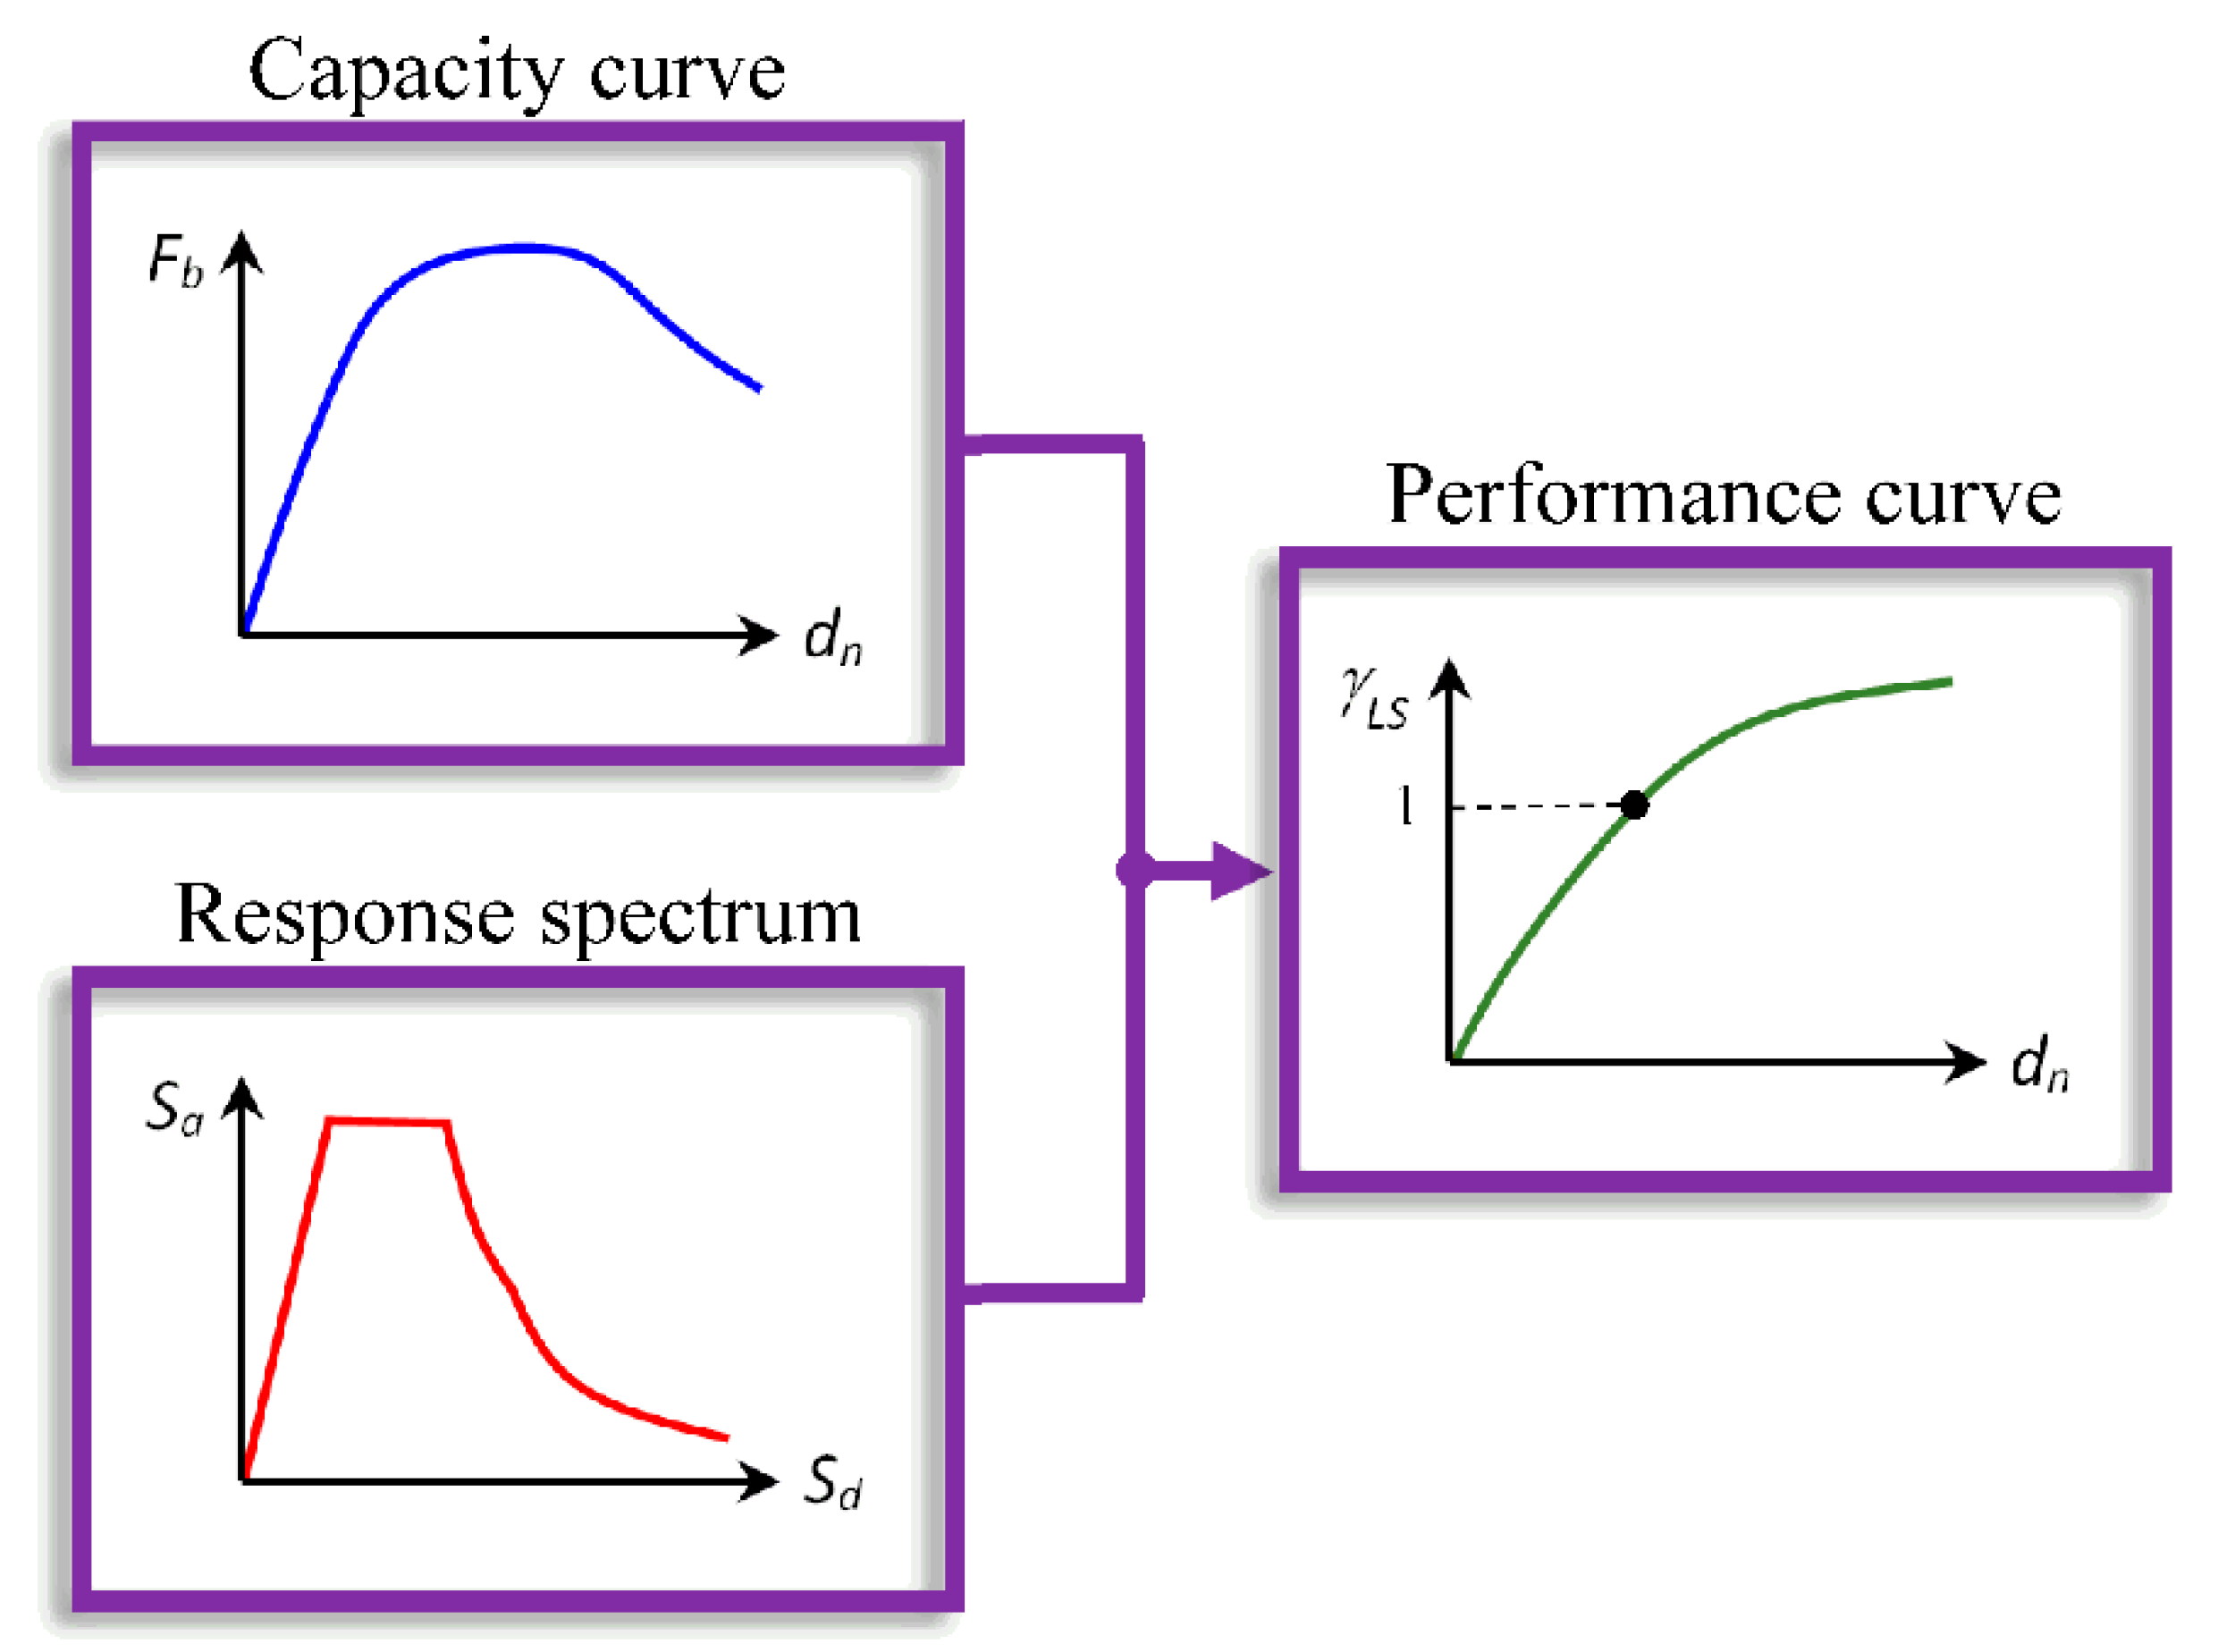
To better compare the performance of all the different structural modules of the studied “P3” school, the concept of performance curve was adopted [
16], which corresponds to a curve representing all the performance points that are associated to a given capacity curve (
), for different levels of the reference value of the seismic action, that is obtained by multiplying the
agR by a coefficient (
γLS), between 0 and 1 (
Figure 16), which is computed using the expression (6).
is the spectral acceleration for the natural period of the equivalent nonlinear SDOF system (T *), which is equal to
As proposed in previous studies [
16], the procedure that is normally adopted in the N2 method is inverted to compute the spectral acceleration
Sa* in a fast way, for all the displacements until collapse, without any iterative procedure. For that purpose, the period
T* is first compared with the period
TC, that is established in the EC8-1 for each type of seismic action and ground type, in order to define which mathematical expression must be used to compute
Sa*.
If
T* <
TC, then
and if
, then
.
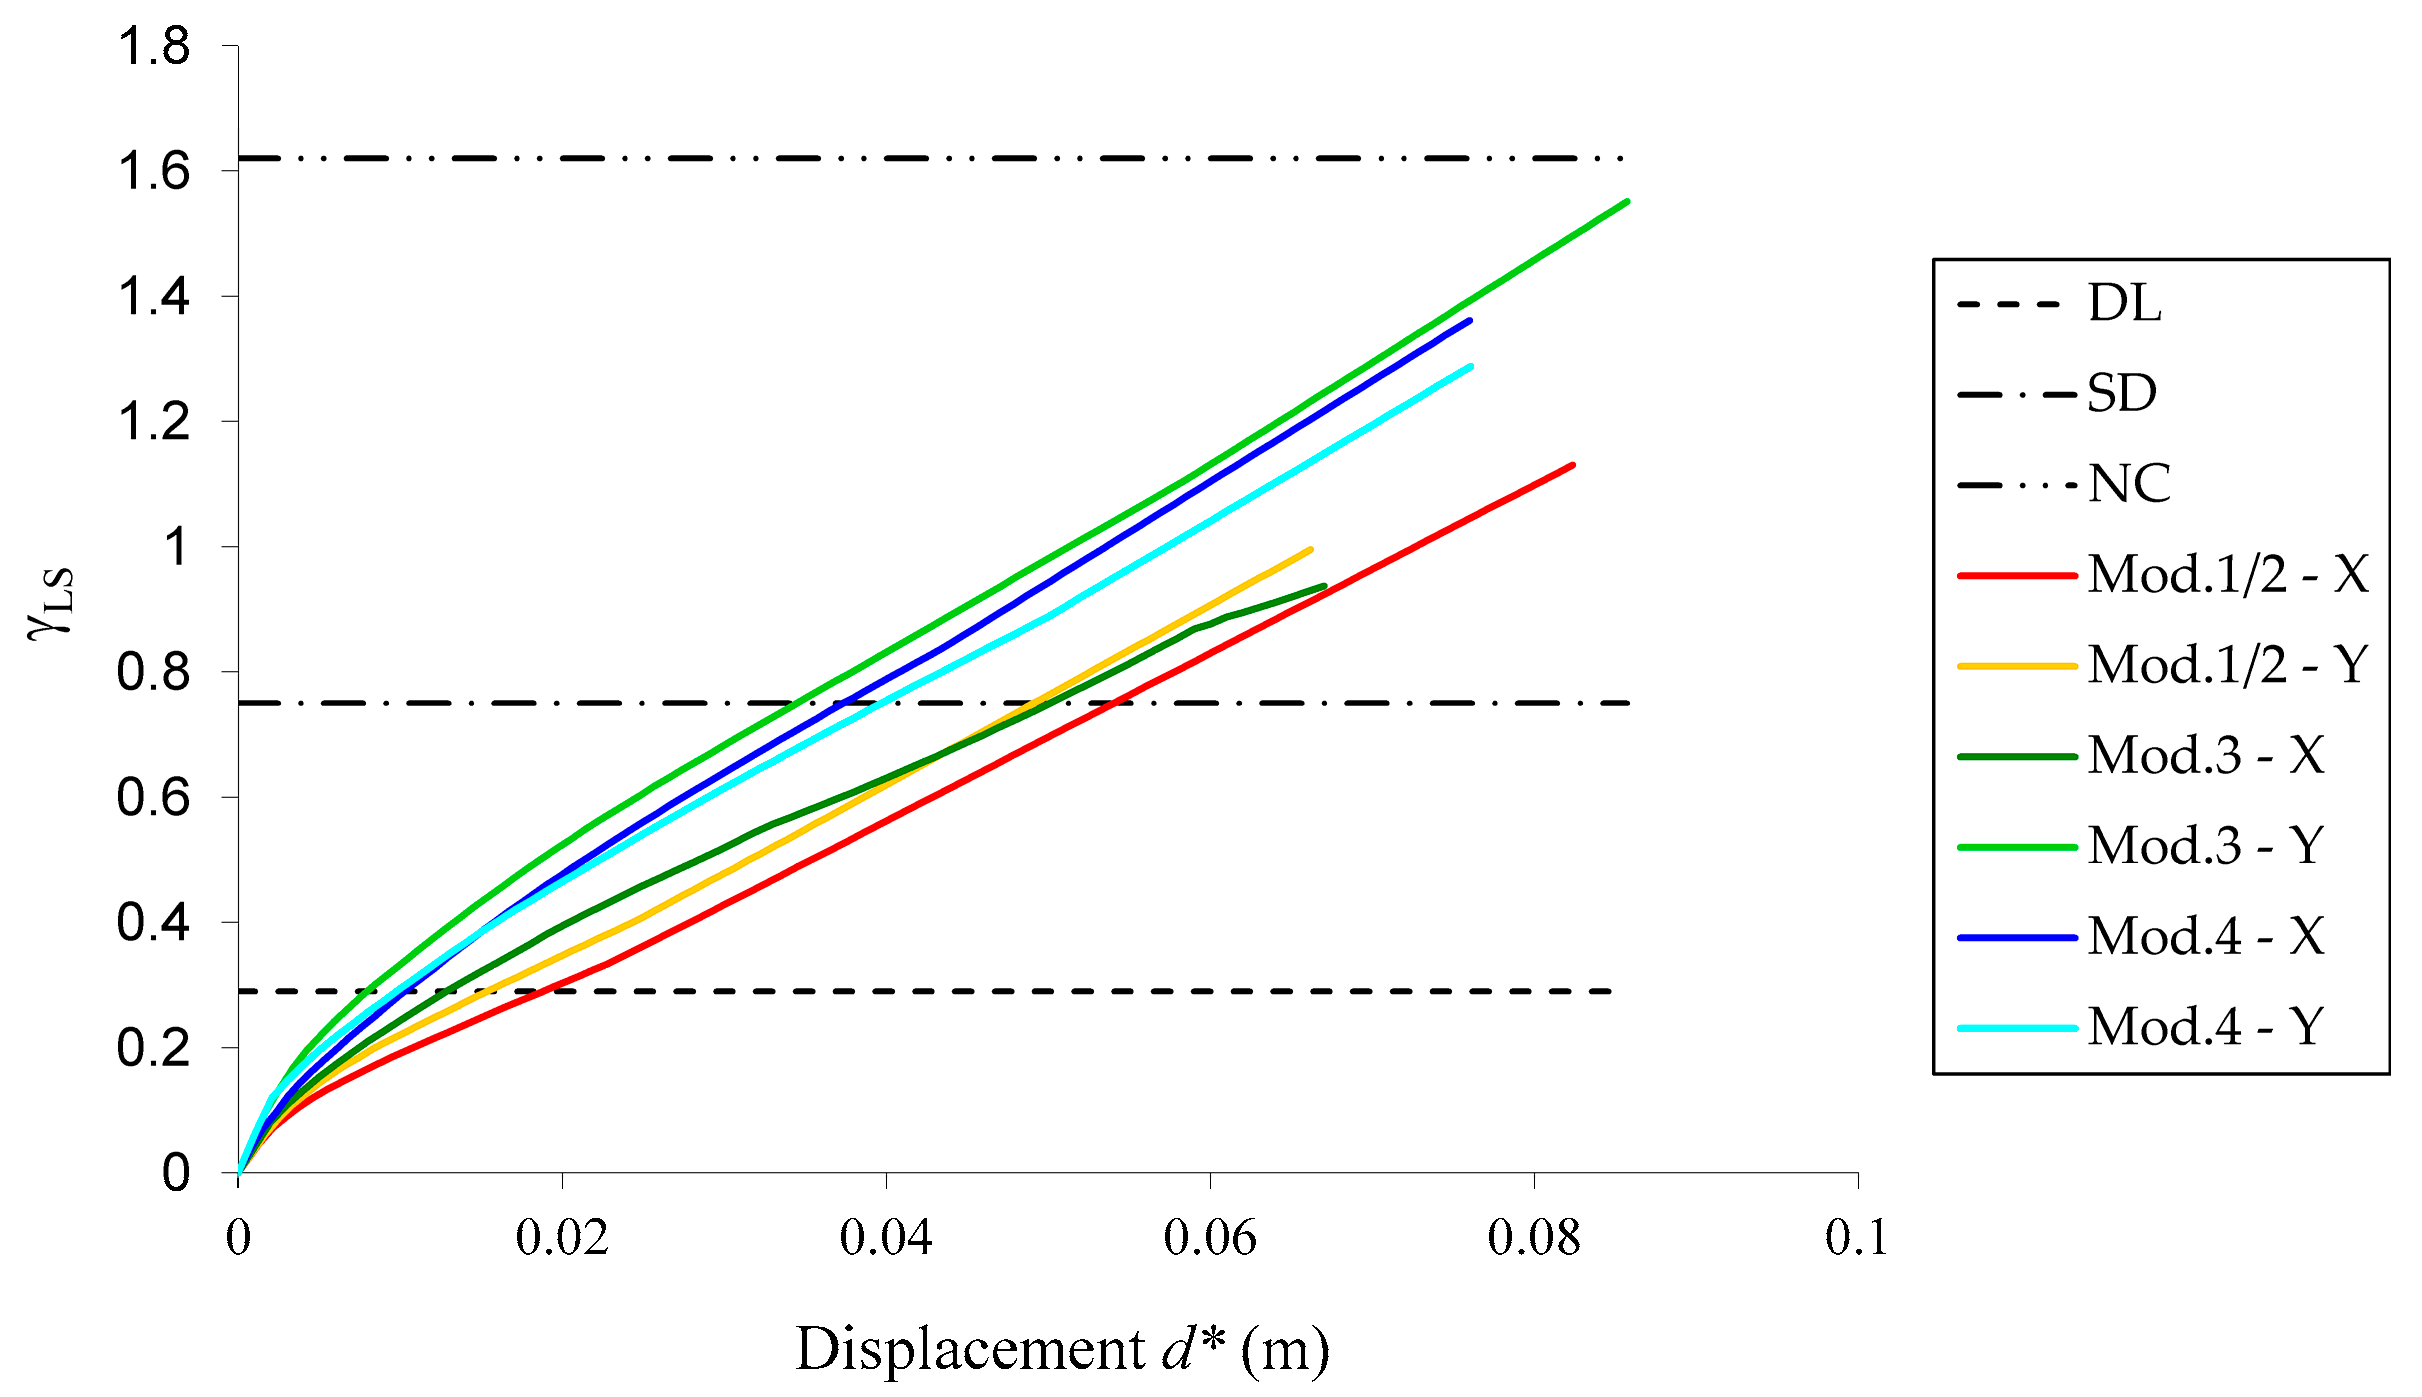
This approach was used to compare the seismic performance of the several modules of the studied “P3” school, and to rank the seismic risk of the school buildings. With that purpose, the worst-case performance curve of each module and direction (X or Y) was selected (
Figure 17).
5. Discussion
Several buildings of the “P3” school typology identified in the Algarve region are still functioning as primary schools, exhibiting at least one of the three modules that were analysed in the present study (a total of 17 modules of type 1/2, 14 modules of type 3, and 7 modules of type 4). These numbers show the importance of studying this RC school typology in detail, given the number of teachers and young students whose lives might be at risk in case of the occurrence of a destructive earthquake affecting the region. Moreover, valuable lessons were taken during the detailed seismic assessment of existing buildings that are still functioning, and for which no destructive in situ tests were allowed. Despite the collaboration of local and national authorities, the difficulties of obtaining the structural designs of older school buildings were a surprise, which highlights the type of problems that structural designers might face in daily practice. If this type of problem was experienced with public buildings, it is most likely also to happen with old ordinary RC buildings. Because no destructive tests were allowed, it was only possible to identify the amount of reinforcing existing in the RC columns, and the adopted concrete resistance was based on the results of in situ tests [
21]. For the RC beams, a simulated design procedure was adopted, using the RSAEEP response spectra that are presented in
Figure 13, in order to quantify a possible configuration of steel reinforcements, which is obviously a very simplified procedure, yet it was the only possible option that was allowed, whatsoever. Despite this necessary simplification, probably the uncertainty related to the reinforcement details of the beam elements will not have much influence in the accuracy of the results, because the obtained damage was mostly concentrated in the columns.
The studied “P3” school buildings were designed in according to the old Portuguese seismic codes [
22,
23]. A modal response spectrum analysis showed that the amount of reinforcement existing in the RC columns is enough to verify the seismic safety level that is established in those old codes. However, the nonlinear structural analyses that were carried out showed a disturbing situation, dealing with the shear capacity of the RC columns, because the old seismic codes could lead to low amounts of shear reinforcement in the RC columns (diameters of 6 mm, equally spaced with an interval of about 0.20 m, were identified in the studied “P3” school [
21]). Old Portuguese design codes allowed substantial distances between shear reinforcements in RC columns, which was usually a function of the diameter of the longitudinal rebars. This leads to low seismic shear resistance, in according to the EC8-3, as depicted in
Figure 10 for modules 1 and 2. In this context, the NC limit state associated to the shear resistance can be even more limitative than the DL limit state, because no flexure cracks were formed before the seismic shear resistance was overpassed. This problem might be aggravated due to the existence of openings in the masonry infill walls, creating what it is usually called as short columns, which probably will increase the risk of occurring brittle failures due to shear, as it was possible to observe in school buildings placed in several countries that were affected by the occurrence of earthquakes [
5,
7,
9]. Moreover, rupture modes that are usually presented in infill masonry walls, namely when subjected to high acceleration levels, might also influence the overall nonlinear structural response. Hence, further studies are still needed to better figure out the importance of this issue for the seismic safety of existing RC buildings, namely to better understand if the observed low safety level of “P3” schools are due to the increase of the seismic action that is established in the National Annex [
29] of the EC8-1, when compared with older seismic codes (
Figure 13), if it is mostly related to the seismic shear resistance that is established in the EC8-3, or if it is the result of the combination of these two factors, simultaneously.
Observing the values of the displacements presented in
Figure 17, it is also important to highlight that pounding between structural modules might occur for high levels of seismic action, which probably will increase the vulnerability of this type of school buildings.
6. Conclusions
The assessment of the seismic vulnerability of many school buildings existing in the Algarve (Portugal) region, was carried out in the context of the PERSISTAH project. One of the studied school typologies was the so called “P3” typology. It was possible to identify many buildings belonging to this typology that are still functioning as primary schools in the Algarve region, which are composed by several reinforced concrete structural independent modules that are combined with each other in different ways, depending on the dimension of each school.
The NP EN 1998-1:2010, which is the seismic code that is now mandatory in Portugal, has increased the seismic action for the design of school buildings. Because of this fact, it is important to know what can be expected about the level of seismic safety of the existing old school buildings, namely for civil protection purposes.
The results of the seismic assessment of several modules of a “P3” school show that they do not comply with the safety level that is currently established in the Portuguese National Annex of the EC8-3, mostly due to low shear resistance of the RC columns. The NC limit state is very difficult to comply for these old school buildings. Modules 1/2 are the ones where this problem is more evident.
Results also show that the use of the concept of performance curves is a valid strategy to rank the seismic safety level of different buildings, when using nonlinear structural static analysis procedures.
Author Contributions
Conceptualization, methodology, software, writing and editing, supervision, project administration and funding acquisition, J.M.C.E.; collection and interpretation of data, visualization, structural analysis, C.E. All authors have read and agreed to the published version of the manuscript.
Funding
This research was funded by INTERREG-POCTEP España-Portugal program and the European Regional Development Fund, grant number 0313_PERSISTAH_5_P.
Acknowledgments
A especial thank to the Municipality of Faro and the Portuguese General Secretariat of the Ministry of Education and Science of Lisbon, for providing information and architectural drawings about some “P3” school buildings.
Conflicts of Interest
The authors declare no conflict of interest. The funders had no role in the design of the study; in the collection, analyses, or interpretation of data; in the writing of the manuscript, or in the decision to publish the results.
References
- Chester, D.K.; Chester, O.K. The impact of eighteenth century earthquakes on the Algarve region, southern Portugal. Geogr. J. 2010, 176, 350–370. [Google Scholar] [CrossRef]
- Teves-Costa, P.; Batlló, J.; Matias, L.; Catita, C.; Jiménez, M.J.; García-Fernández, M. Maximum intensity maps (MIM) for Portugal mainland. J. Seismol. 2019, 23, 417–440. [Google Scholar] [CrossRef]
- Molesky, M. This Gulf of Fire: The Great Lisbon Earthquake, or Apocalypse in the Age of Science and Reason; Alfred A. Knopf: New York, NY, USA, 2015. [Google Scholar]
- CEN. EN 1998-1:2004. Eurocode 8, Design of Structures for Earthquake Resistance—Part 1: General Rules, Seismic Actions and Rules for Buildings; Comité Européen de Normalisation: Brussels, Belgium, 2004; p. 229. [Google Scholar]
- Kabeyasawa, T. Damages to RC school buildings and lessons from the 2011 East Japan earthquake. Bull. Earthq. Eng. 2017, 15, 535–553. [Google Scholar] [CrossRef]
- Bal, İ.E.; Smyrou, E. Simulation of the earthquake-induced collapse of a school building in Turkey in 2011 Van Earthquake. Bull. Earthq. Eng. 2016, 14, 3509–3528. [Google Scholar] [CrossRef]
- Chen, H.; Xie, Q.; Lan, R.; Li, Z.; Xu, C.; Yu, S. Seismic damage to schools subjected to Nepal earthquakes, 2015. Nat. Hazards 2017, 88, 247–284. [Google Scholar] [CrossRef] [Green Version]
- Di Ludovico, M.; Digrisolo, A.; Moroni, C.; Graziotti, F.; Manfredi, V.; Prota, A.; Dolce, M.; Manfredi, G. Remarks on damage and response of school buildings after the Central Italy earthquake sequence. Bull. Earthq. Eng. 2019, 17, 5679–5700. [Google Scholar] [CrossRef]
- Oyguc, R. Seismic performance of RC school buildings after 2011 Van earthquakes. Bull. Earthq. Eng. 2016, 14, 821–847. [Google Scholar] [CrossRef]
- Alberto, Y.; Otsubo, M.; Kyokawa, H.; Kiyota, T.; Towhata, I. Reconnaissance of the 2017 Puebla, Mexico earthquake. Soils Found. 2018, 58, 1073–1092. [Google Scholar] [CrossRef]
- Anelli, A.; Vona, M.; Santa-Cruz Hidalgo, S. Comparison of Different Intervention Options for Massive Seismic Upgrading of Essential Facilities. Buildings 2020, 10, 125. [Google Scholar] [CrossRef]
- Fazendeiro Sá, L.; Morales-Esteban, A.; Durand Neyra, P. A Seismic Risk Simulator for Iberia. Bull. Seismol. Soc. Am. 2016, 106, 1198–1209. [Google Scholar] [CrossRef]
- Maio, R.; Estêvão, J.M.C.; Ferreira, T.M.; Vicente, R. Casting a new light on the seismic risk assessment of stone masonry buildings located within historic centres. Structures 2020, 25, 578–592. [Google Scholar] [CrossRef]
- CEN. EN 1998-3: 2005. Eurocode 8, Design of Structures for Earthquake Resistance—Part 3: Assessment and Retrofitting of Buildings; Comité Européen de Normalisation: Brussels, Belgium, 2005; p. 89. [Google Scholar]
- Portaria n. °302/2019 de 12 de setembro. In Diário da República, 1. a Série, n° 175; XXI Governo Constitucional: Lisboa, Portugal, 2019; p. 134. (In Portuguese)
- Estêvão, J.M.C. An integrated computational approach for seismic risk assessment of individual buildings. Appl. Sci. 2019, 9, 5088. [Google Scholar] [CrossRef] [Green Version]
- Martinho, M.; da Silva, J.F. Open Plan Schools in Portugal: Failure or Innovation? In PEB Exchange, Programme on Educational Building; OECD Publishing: Paris, France, 2008; pp. 1–9. [Google Scholar] [CrossRef]
- El-Betar, S.A. Seismic vulnerability evaluation of existing R.C. buildings. HBRC J. 2018, 14, 189–197. [Google Scholar] [CrossRef] [Green Version]
- O’1Reilly, G.J.; Perrone, D.; Fox, M.; Monteiro, R.; Filiatrault, A. Seismic assessment and loss estimation of existing school buildings in Italy. Eng. Struct. 2018, 168, 142–162. [Google Scholar] [CrossRef]
- Korkmaz, M.; Ozdemir, M.A.; Kavali, E.; Cakir, F. Performance-based assessment of multi-story unreinforced masonry buildings: The case of historical Khatib School in Erzurum, Turkey. Eng. Fail. Anal. 2018, 94, 195–213. [Google Scholar] [CrossRef]
- Braga, A.; Carreira, A.; Estêvão, J.M.C. Using Non-destructive Testing for the Determination of Mechanical Properties in RC Structures: A Case Study. In INCREaSE 2019; Springer: Cham, Switzerland, 2020; pp. 1067–1076. [Google Scholar] [CrossRef]
- REBAPE. Regulamento de Estruturas de Betão Armado e Pré-Esforçado. Decreto-Lei n° 349-C/83, de 30 de Julho; Imprensa Nacional-Casa da Moeda, E.P.: Lisboa, Portugal, 1983; p. 214. (In Portuguese) [Google Scholar]
- RSAEEP. Regulamento de Segurança e Acções Para Estruturas de Edifícios e Pontes. Decreto-Lei n° 235/83, de 31 de Maio; Imprensa Nacional-Casa da Moeda, E.P.: Lisboa, Portugal, 1983; p. 114. (In Portuguese) [Google Scholar]
- Computers & Structures, Inc. SAP 2000—Structural Software for Analysis and Design; Version 18; CSI Inc.: Walnut Creek, CA, USA, 2015. [Google Scholar]
- Seismosoft. SeismoStruct 2016 Release-1—A Computer Program for Static and Dynamic Nonlinear Analysis of Framed Structures. Available online: http://www.seismosoft.com (accessed on 29 July 2017).
- Estêvão, J.M.C. Feasibility of using neural networks to obtain simplified capacity curves for seismic assessment. Buildings 2018, 8, 151. [Google Scholar] [CrossRef] [Green Version]
- Boulifa, R.; Samai, M.L.; Benhassine, M.T. A new technique for studying the behaviour of concrete in shear. J. King Saud Univ.-Eng. Sci. 2013, 25, 149–159. [Google Scholar] [CrossRef] [Green Version]
- Fajfar, P.; GaŠPerŠIČ, P. The N2 method for the seismic damage analysis of RC buildings. Earthquake Eng. Struct. Dyn. 1996, 25, 31–46. [Google Scholar] [CrossRef]
- IPQ. NP EN 1998-1. Eurocódigo 8: Projecto de Estruturas Para Resistência Aos Sismos. Parte 1: Regras Gerais, Acções Sísmicas e Regras Para Edifícios; Instituto Português da Qualidade: Caparica, Portugal, 2010; p. 230. (In Portuguese) [Google Scholar]
- Sousa, M.L.; Campos Costa, A. Ground motion scenarios consistent with probabilistic seismic hazard disaggregation analysis. Application to Mainland Portugal. Bull. Earthq. Eng. 2009, 7, 127–147. [Google Scholar] [CrossRef]
- Bisch, P. Eurocode 8. Evolution or Revolution? In Recent Advances in Earthquake Engineering in Europe: 16th European Conference on Earthquake Engineering-Thessaloniki 2018; Pitilakis, K., Ed.; Springer International Publishing: Cham, Switzerland, 2018; pp. 639–660. [Google Scholar] [CrossRef]
- Labbé, P. Outlines of the revision of the Eurocode 8, Part 1, generic sections. In Proceedings of the 16th European Conference on Earthquake Engineering (16ECEE), Thessaloniki, Greece, 18–21 June 2018; pp. 1–12. [Google Scholar]
- NTC. Aggiornamento delle «Norme tecniche per le costruzioni» (in Italian); Ministero Delle Infrastrutture e Dei Trasporti: Roma, Itaily, 2018.
- NTC. Istruzioni per L’applicazione Dell’«Aggiornamento Delle “Norme Tecniche per le Costruzioni”» di cui al Decreto Ministeriale 17 Gennaio 2018; Ministero delle infrastrutture e dei trasporti: Roma, Itaily, 2019. (In Italian)
- IPQ. NP EN 1998-3. Eurocódigo 8: Projecto de Estruturas Para Resistência Aos Sismos. Parte 3: Avaliação e Reabilitação de Edifícios; Instituto Português da Qualidade: Caparica, Portugal, 2017; p. 230. (In Portuguese) [Google Scholar]
Figure 1.
Primary school buildings existing in the regions of Algarve (Portugal) and Huelva (Spain).
Figure 1.
Primary school buildings existing in the regions of Algarve (Portugal) and Huelva (Spain).
Figure 2.
Scheme of the classroom modules of the “P3” schools: (a) two classrooms placed in one floor; (b) three classrooms placed in one floor; (c) six classrooms placed in two floors; (d) four classrooms placed in two floors.
Figure 2.
Scheme of the classroom modules of the “P3” schools: (a) two classrooms placed in one floor; (b) three classrooms placed in one floor; (c) six classrooms placed in two floors; (d) four classrooms placed in two floors.
Figure 3.
Example of different module combinations presented in some “P3” schools that are still functioning as primary schools in the Algarve region in: (a) Silves; (b) Marmelete, Monchique; (c) Faro; and (d) Portimão.
Figure 3.
Example of different module combinations presented in some “P3” schools that are still functioning as primary schools in the Algarve region in: (a) Silves; (b) Marmelete, Monchique; (c) Faro; and (d) Portimão.
Figure 4.
Architectural plans of the primary school EB1 n.5 of Faro, with the location of the reinforced concrete (RC) columns: (a) ground floor; (b) first floor.
Figure 4.
Architectural plans of the primary school EB1 n.5 of Faro, with the location of the reinforced concrete (RC) columns: (a) ground floor; (b) first floor.
Figure 5.
Structural plans of the classroom modules: (a) module 1; (b) module 2.
Figure 5.
Structural plans of the classroom modules: (a) module 1; (b) module 2.
Figure 6.
Structural plans of the central modules: (a) module 3; (b) module 4.
Figure 6.
Structural plans of the central modules: (a) module 3; (b) module 4.
Figure 7.
SAP2000 structural models adopted for the simulated design of the RC beams and stairs: (a) modules 1 and 2; (b) module 3; (c) module 4.
Figure 7.
SAP2000 structural models adopted for the simulated design of the RC beams and stairs: (a) modules 1 and 2; (b) module 3; (c) module 4.
Figure 8.
SeismoStruct structural models adopted for obtaining the capacity curves: (a) modules 1 and 2; (b) module 3; (c) module 4.
Figure 8.
SeismoStruct structural models adopted for obtaining the capacity curves: (a) modules 1 and 2; (b) module 3; (c) module 4.
Figure 9.
Adopted scheme for obtaining the structural capacity curves in each direction.
Figure 9.
Adopted scheme for obtaining the structural capacity curves in each direction.
Figure 10.
Capacity curves determined for the school modules 1 and 2 (M—modal; U—uniform force pattern): (a) X direction; (b) Y direction.
Figure 10.
Capacity curves determined for the school modules 1 and 2 (M—modal; U—uniform force pattern): (a) X direction; (b) Y direction.
Figure 11.
Capacity curves determined for the school module 3 (M—modal; U—uniform force pattern): (a) X direction; (b) Y direction.
Figure 11.
Capacity curves determined for the school module 3 (M—modal; U—uniform force pattern): (a) X direction; (b) Y direction.
Figure 12.
Capacity curves determined for the school module 4 (M—modal; U—uniform force pattern): (a) X direction; (b) Y direction.
Figure 12.
Capacity curves determined for the school module 4 (M—modal; U—uniform force pattern): (a) X direction; (b) Y direction.
Figure 13.
Response spectra for the seismic actions that are now established in the Portuguese National Annex of the EC8-1, for school buildings placed in Faro on a ground type C, and the corresponding seismic actions that were established in the national seismic code (RSAEEP) that was mandatory when the studied “P3” school was built: (a) far-field offshore earthquake scenario (type 1); (b) near-source earthquake scenario (type 2).
Figure 14.
Adopted limit states for damage evaluation.
Figure 14.
Adopted limit states for damage evaluation.
Figure 15.
Example of the output of the developed software that computes the performance points for: (a) earthquake type 1; (b) earthquake type 2.
Figure 15.
Example of the output of the developed software that computes the performance points for: (a) earthquake type 1; (b) earthquake type 2.
Figure 16.
Flowchart of the adopted process for obtaining a performance curve for a given capacity curve and response spectrum.
Figure 16.
Flowchart of the adopted process for obtaining a performance curve for a given capacity curve and response spectrum.
Figure 17.
Worst-case performance curves determined for each direction of the structural independent modules of the studied “P3” school, and the seismic action levels that are established in the Portuguese National Annex [
35] of the EC8-3 for DL, SD and NC limit states.
Figure 17.
Worst-case performance curves determined for each direction of the structural independent modules of the studied “P3” school, and the seismic action levels that are established in the Portuguese National Annex [
35] of the EC8-3 for DL, SD and NC limit states.
| Publisher’s Note: MDPI stays neutral with regard to jurisdictional claims in published maps and institutional affiliations. |
© 2020 by the authors. Licensee MDPI, Basel, Switzerland. This article is an open access article distributed under the terms and conditions of the Creative Commons Attribution (CC BY) license (http://creativecommons.org/licenses/by/4.0/).


