Article

Rapid Fatigue Limit Estimation of Metallic Materials Using Thermography-Based Approach

School of Materials Science and Engineering, Liaoning University of Technology, Jinzhou 121001, China
*
Author to whom correspondence should be addressed.
Metals 2023, 13(6), 1147; https://doi.org/10.3390/met13061147
Submission received: 24 May 2023 / Revised: 18 June 2023 / Accepted: 18 June 2023 / Published: 20 June 2023
(This article belongs to the Special Issue Fatigue Design of Steel and Composite Structures)

Abstract

:
This work attempts to develop a theoretical model in combination with the representative volume element (RVE) theory for realizing rapid fatigue limit prediction. Within the thermodynamic framework, it is believed that two components, namely anelastic and microplastic behaviors, which correspond to recoverable and non-recoverable microstructural motions, contribute to temperature variation during high-cycle fatigue. Based on this, the constitutive equation of the response relationship between the temperature rise evolution and the stress amplitude of metallic materials can be deduced in combination with the heat balance equation. Meanwhile, a determination approach for the thermographic experimental data for accurate fatigue limit estimation is developed by combining it with a statistical method. Finally, the experimental data of metallic specimens and welded joints were utilized to validate the proposed model, and the results demonstrated great agreement between experimental and predicted data.

1. Introduction

The fatigue resistance performance, which is correlated to the reliability of the service life of mechanical structures subject to cyclic loadings, is one of the most crucial properties in the field of the safety design of structures [1]. Conventional fatigue tests, such as the staircase method or S–N curve method, not only take several or many more days to complete, but are also more expensive to perform. Particularly for the high-cycle fatigue (HCF) and very high-cycle fatigue (VHCF) regimes, the high-cost problem will become increasingly apparent. Therefore, the development of a method for the quick assessment of fatigue qualities has become crucial in recent years.
The self-heating method, which has gained much popularity in recent years, is seen as a promising strategy for measuring fatigue [2,3,4,5,6,7,8,9,10,11,12,13]. This method was initially proposed by Luong et al. [14] and Risitano et al. [15,16,17,18], and it has gradually been confirmed by the pertinent research results of scholars. Mostofizadeh et al. [2] evaluated the fatigue performance of shape memory alloy (SMA) based on the temperature-based method, and the results showed that this model has an ideal prediction capacity for SMA’s fatigue properties. Guo et al. [3,11,19] measured the self-heating curve of the AZ31B magnesium alloy under different loading levels and obtained an obvious turning point of the self-heating versus loading level curve by a statistical method. Finally, the fatigue limit of the experimental materials was well-identified on this basis. Huang et al. [4] carried out the fatigue properties of Carbon Fiber Reinforced Plastics (CFRP) laminates under shear stress conditions, and the fatigue damage of this material was evaluated using the obtained heat generation data. The self-heating process of CFRP laminates under cyclic loading conditions is also reported by Li et al. [12]. Wei et al. [5] measured the self-heating curve of Q460 welded joints under different stress amplitudes and predicted their fatigue S–N curves on this basis. Corigliano et al. [13] determined the fatigue limit of TI6AL4V/INCONEL 625 dissimilar welded joints using the self-heating method. In addition to these abovementioned works, other applications based on the self-heating curve, such as in the fatigue performance prediction of additively manufactured materials [6,9], stainless steel [7], and high-strength steel [8,20], have also been recently reported. This method allows one specimen test to quickly estimate the fatigue endurance limit within a designated cycle [13,20,21,22,23,24], which lays a solid research foundation for reducing fatigue testing costs. However, despite the remarkable success that has been achieved by the previous works, the physical mechanism behind these temperature-based methods is still not clear. As a result, many researchers have gradually studied fatigue issues from the perspective of energy dissipation.
The essential point of the energy-based method is to construct a model so that one can connect the microstructural response with the irreversible dissipated energy. Numerous studies have been conducted for this aim throughout the years, many of which are compiled in the literature [25,26,27,28,29,30,31,32,33,34,35,36,37,38,39,40,41]. In these models, Guo and his co-workers made a pioneering contribution to energy dissipation theory [25,35,38,39]. It is pointed out that energy dissipation consists of two components, namely anelastic dissipation and inelastic dissipation, wherein anelastic dissipation relates to non-damaging mechanical behaviors and inelastic dissipation corresponds to the damage accumulation during the fatigue process. More recently, Mahmoudi et al. [41] determined the fatigue limit of the CS 1018 and SS 304 specimens by using the linear fitting of the energy dissipation vs. stress amplitude data. These studies provided a clear explanation of the link between energy dissipation and the mechanism of microstructural change. Thereafter, the relationship between inelastic dissipated energy and damage accumulation in many materials, including metallic materials [20], welded joints [37], and composite materials [4,33], under high-cycle fatigue was well-correlated.
However, even though these studies have advanced our knowledge of the underlying damage mechanism, the energy dissipation estimation is still quite complicated since it involves too many theoretical deductions from the heat balance equation. This may increase the time cost of fatigue endurance determination, thus limiting its further application in the field of fatigue assessment. Furthermore, although the typical bilinear method (see Figure 1), which was proposed by Luong et al. [14] and Risitano et al. [15,16,17], is currently used for the rapid estimation of the fatigue endurance limit, this approach is not well-related to the microstructural evolution mechanism under the high-cycle fatigue regime. In addition, although the latest work by Zhao et al. [20] has offered a self-heating model and clarified the microstructure movement mechanism in detail, the fatigue endurance limit is still not considered in this model, making it difficult to determine the fatigue limit based on this self-heating model. Therefore, it is vital to develop a simpler constitutive self-heating model that not only provides a clear explanation of the two microstructural motion mechanisms behind the self-heating behaviors, but also enables a quick prediction of the fatigue limit of high-cycle fatigue experiments.
In this study, we attempt to derive a simplified constitutive self-heating model in combination with the theory of energy dissipation. The representative volume element (RVE) model, which includes anelastic matrix and elastoplastic inclusion regions, is employed to characterize the microstructural motions under different loading levels. The dissipated energy generated within the two regions is related to the corresponding microstructural motions. Based on this, a constitutive model, in which one can extract the temperature increase response induced by two microstructure mechanisms, can be developed by combining the thermal balance equation. Finally, the generated model is validated using the data from the literature.

2. Two-Scale Energy Dissipation Model

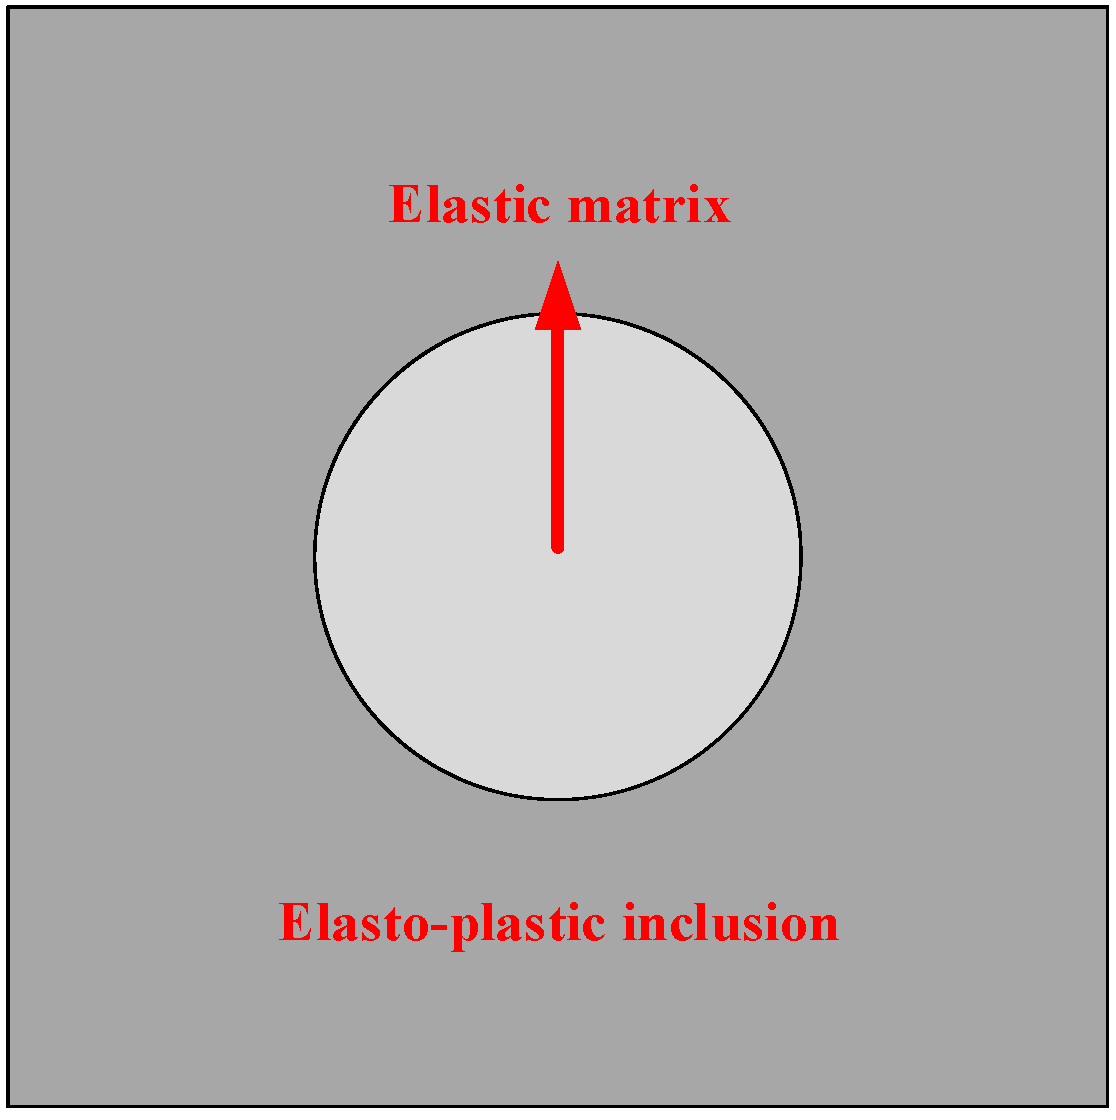
2.1. Representative Volume Element (RVE) Model

The materials during the fabrication process will inevitably generate some voids or defects at the microscale. The microstructure of materials generally has a major influence on fatigue properties [20], and the continuous evolution of the microstructure thereby leads to the formation of fatigue cracks. However, these defects are difficult to characterize since they are not only varied in shape, but are also not evenly distributed in the matrix. Therefore, the representative volume element (RVE) model, which consists of the elastic matrix and elastoplastic inclusion, is introduced in this work for describing the mechanical behaviors within the framework of high-cycle fatigue, as illustrated in Figure 2 [42]. When the macro-stress amplitude is lower than the fatigue endurance limit, the microstructural motions within both the elastic matrix and the elastoplastic inclusion ultimately remain elastic and recoverable; however, for the stress amplitude beyond the fatigue limit, some defects, dislocations, or voids within the elastoplastic inclusion will be triggered in turn, resulting in a damage accumulation in materials.
As is well known, according to ref. [20,35,39], the microstructure change has an intrinsic relationship with irreversible energy dissipation. The dissipated energy can be used as a basic index to evaluate the corresponding microscale fatigue behavior once the self-heating effect can be measured at the macroscale level. Thus, to build a relationship between the two-scale RVE model and energy dissipation theory, some assumptions are as follows:
  • The elastoplastic inclusion has the same elastic behavior as the elastic region. However, some voids and defects in the elastoplastic region start to cause irreversible plastic deformation when the microscopic stress level is above the micro-yield stress, where the elastic region continues to maintain elasticity. The elastic matrix and elastoplastic inclusion are independent.
  • The distribution of micro-defects and micro-voids within the matrix exhibits a sparse situation.
  • The RVE model has a distinct physical meaning, but is not necessarily linked to corresponding compounds.
  • The RVE model is homogeneous and isotropic within the framework of statistics.

2.2. Anelastic Dissipation in the Matrix

The increase in self-heating temperature exhibits the accompanied energy dissipation during the fatigue process. The energy dissipation is considered to have a close relationship with the increasing stress level. For the stress at a higher level, the dissipative mechanism is responsible for the non-recoverable microstructural movement, i.e., persistent slip band (PSB). However, irreversible but recoverable motions, such as anelastic behaviors, dominate the heat dissipation output when the stress level is in a small range. In this situation, the heat dissipation caused by anelasticity does no damage to the applied materials; on the contrary, with a larger stress level, the irreversible inelastic motion is gradually triggered, thus inducing a damage accumulation in the materials.
As stated in ref. [43], the stress within a sinusoid cycle can be expressed as:
= Σ m + Σ a sin 2 π t T l
where Σ m and Σ a show the mean stress and stress amplitude, respectively, and Tl is the experimental frequency. Corresponding to the applied loading, the strain rate during the fatigue process is seen as contained by two components, i.e., the elastic strain rate and the viscous strain rate.
E ˙ = E ˙ e + E ˙ v
Considering that if the stress is in a small range, the viscous strain is purely recoverable and does not cause damage to the materials. Thus, we herein consider the viscous strain as an anelastic strain, and the energy dissipation density induced by anelastic behavior in one cycle can consequently be given by:
d an = 1 T l t t + T l Σ v E ˙ a n d t
where dan represents the anelastic dissipated energy and Σ v shows the viscous stress. Simplifying Equation (3), we can obtain:
d an = a Σ a 2
where a is a coefficient related to materials.

2.3. Microplastic Dissipation in the Inclusion

As mentioned above, the microstructure remains anelastic within a lower stress amplitude. While the stress level continues to rise, some permanent PSBs will gradually form due to some voids or dislocations that have been activated. The stress under this condition has actually exceeded the microscale yield stress, which increases the accumulation of material damage. Therefore, for high-cycle fatigue, two dissipated energy mechanisms are considered, and the corresponding energy dissipation under different stress amplitudes can be written as:
d total = d an + d in
where dan and din denote the anelastic and inelastic dissipated energies, respectively, and din can be given by [42]:
d in = 4 Σ f h Σ a Σ f
where h is a material-related coefficient and ∑f shows the fatigue limit.
In a high-cycle fatigue regime, we can consider the microscale yield stress corresponding to the activated process of irreversible microstructure as a probabilistic variable. When a given stress is higher than the microscale yield stress, the distribution of activated atoms with the inclusion is considered to follow a Poisson point process [42]. Thus, the intensity density function can be written as:
λ = 1 V 0 Σ S 0 m
where V0, S0, and m are the material-dependent parameters. Based on Equation (7), the activated atoms within a certain domain are given by:
N a ( Ω ) = λ V Ω
where Na(Ω) is the activated atom within a certain domain. Based on Equation (8), we can consider an infinitesimal increment of the activated atoms within a certain domain, that is:
d N a ( Σ ) = V Ω λ ( Σ + d Σ ) ) λ ( Σ ) = V Ω d λ d Σ d Σ
where VΩ d λ d Σ dΣ represents the average atom numbers that have been activated with an infinitesimal equivalent stress increment dΣ, and the average fatigue limit of the inclusion is between Σ and Σ+ dΣ. Therefore, the inelastic dissipated energy corresponding to the inclusion region can be defined as:
d in = 4 Σ h Σ a Σ
where Σa’ = Σa − Σf. Combining Equation (4) with Equation (10), the dissipated energy density per unit time containing the matrix and inclusion can be defined as:
d total = a Σ a 2 + 0 Σ a d in ( Σ ) V s V Ω d N a ( Σ ) d Σ
By integrating the second part of the right side of Equation (11), we can obtain:
d total = a Σ a 2 + 4 h V s m V 0 S 0 m Σ a Σ f m + 2 m + 1 m + 2
Let 4 V s m h V 0 S 0 m ( m + 1 ) ( m + 2 ) as b, and b is a material constant once m is acquired.
d in = b Σ a Σ f ( m + 2 )

2.4. Characterization of the Self-Heating Curve

In accordance with the first law of thermodynamics, the thermal balance equation within one dimension can be written as [4,25,35]:
ρ c θ t + θ τ e q k div ( grad T ) = d
where ρ denotes the density of experimental materials, c represents the specific heat, and k is the thermal conductivity corresponding to the materials. For the temperature, the value tends to be stable in phase II, d θ d t , which is equal to 0. Moreover, the heat loss caused by heat conduction can be negligible due to only a few degree temperature increments in high-cycle fatigue. Thus, Equation (14) transforms into Equation (15):
d = ρ C θ f l τ e q
According to Equation (15), the steady temperature increment can be expressed as:
θ = f l τ e q ρ C d
Given that energy dissipation contains two parts, i.e., anelastic dissipation and inelastic dissipation, as stated in Section 2.1 and Section 2.2, the response relationship between steady temperature increment and stress amplitude levels can be deduced as:
θ = a Σ a 2 + b Σ a Σ f ( m + 2 )
where a′ and b′ are the material-related parameters.
This model in Equation (17) is proposed to estimate the self-heating data under different stress amplitude levels. The fatigue performance determination of this model allows the identification of the parameters a′, b′, and m. Thus, the main objective of our method is to predict the fatigue endurance limit based on the self-heating constitutive model.

3. Fatigue Endurance Limit Estimation Model Based on Self-Heating Curve

Generally speaking, it is inevitable for some micro defects to occur during the manufacturing process of materials, which may result in stress concentration even at relatively small macroscopic stress levels. These defects will cause energy dissipation and a rise in thermodynamic entropy if they continue to grow in an irreversible way. As a result, energy dissipation is largely dependent on microstructural evolution. It should be emphasized that, however, energy dissipation is divided into two parts: one is connected to irreversible microplasticity, which causes cumulative damage, and the other is related to recoverable anelasticity, which does not lead to cumulative damage, as presented in Section 2 [26]. On this basis, the constitutive model, which describes the relationship between self-heating and stress amplitude level, is derived by combining the energy dissipation theory with the heat balance equation. The schematic diagram of the response relationship between stress amplitude and temperature increment is illustrated in Figure 3.
As can be seen in Figure 3, the response to the increase in temperature is quite small in a small range of stresses due to the recovery anelasticity, while the temperature increases rapidly when the stress level exceeds the fatigue limit, some atoms or vaccines with obvious stress concentration has been activated (see red dash box in Figure 3).
For a stress amplitude level lower than the fatigue limit, the temperature elevation is deemed to be caused by recoverable microstructure evolution, and the corresponding fatigue life is infinite in this case. When the varying stress with a constant amplitude value is higher than the fatigue limit, some stress concentration locations, such as micro-defects, voids, and grain boundaries, are then gradually triggered, inducing damage accumulation in materials. Moreover, at high stress levels, both anelasticity and inelasticity contribute to the rise in temperature, although inelasticity’s effect is more pronounced. As a result, the fatigue limit is considered to be determined when the critical value between small and higher stress amplitudes is obtained.
To achieve this aim, this section is working to develop a fatigue limit determination approach that can be used to identify the self-heating characterization induced by two mechanical mechanisms. The correlation coefficient optimization method is introduced to determine the self-heating effect under different stress amplitudes, and the corresponding measurement steps are summarized as follows:
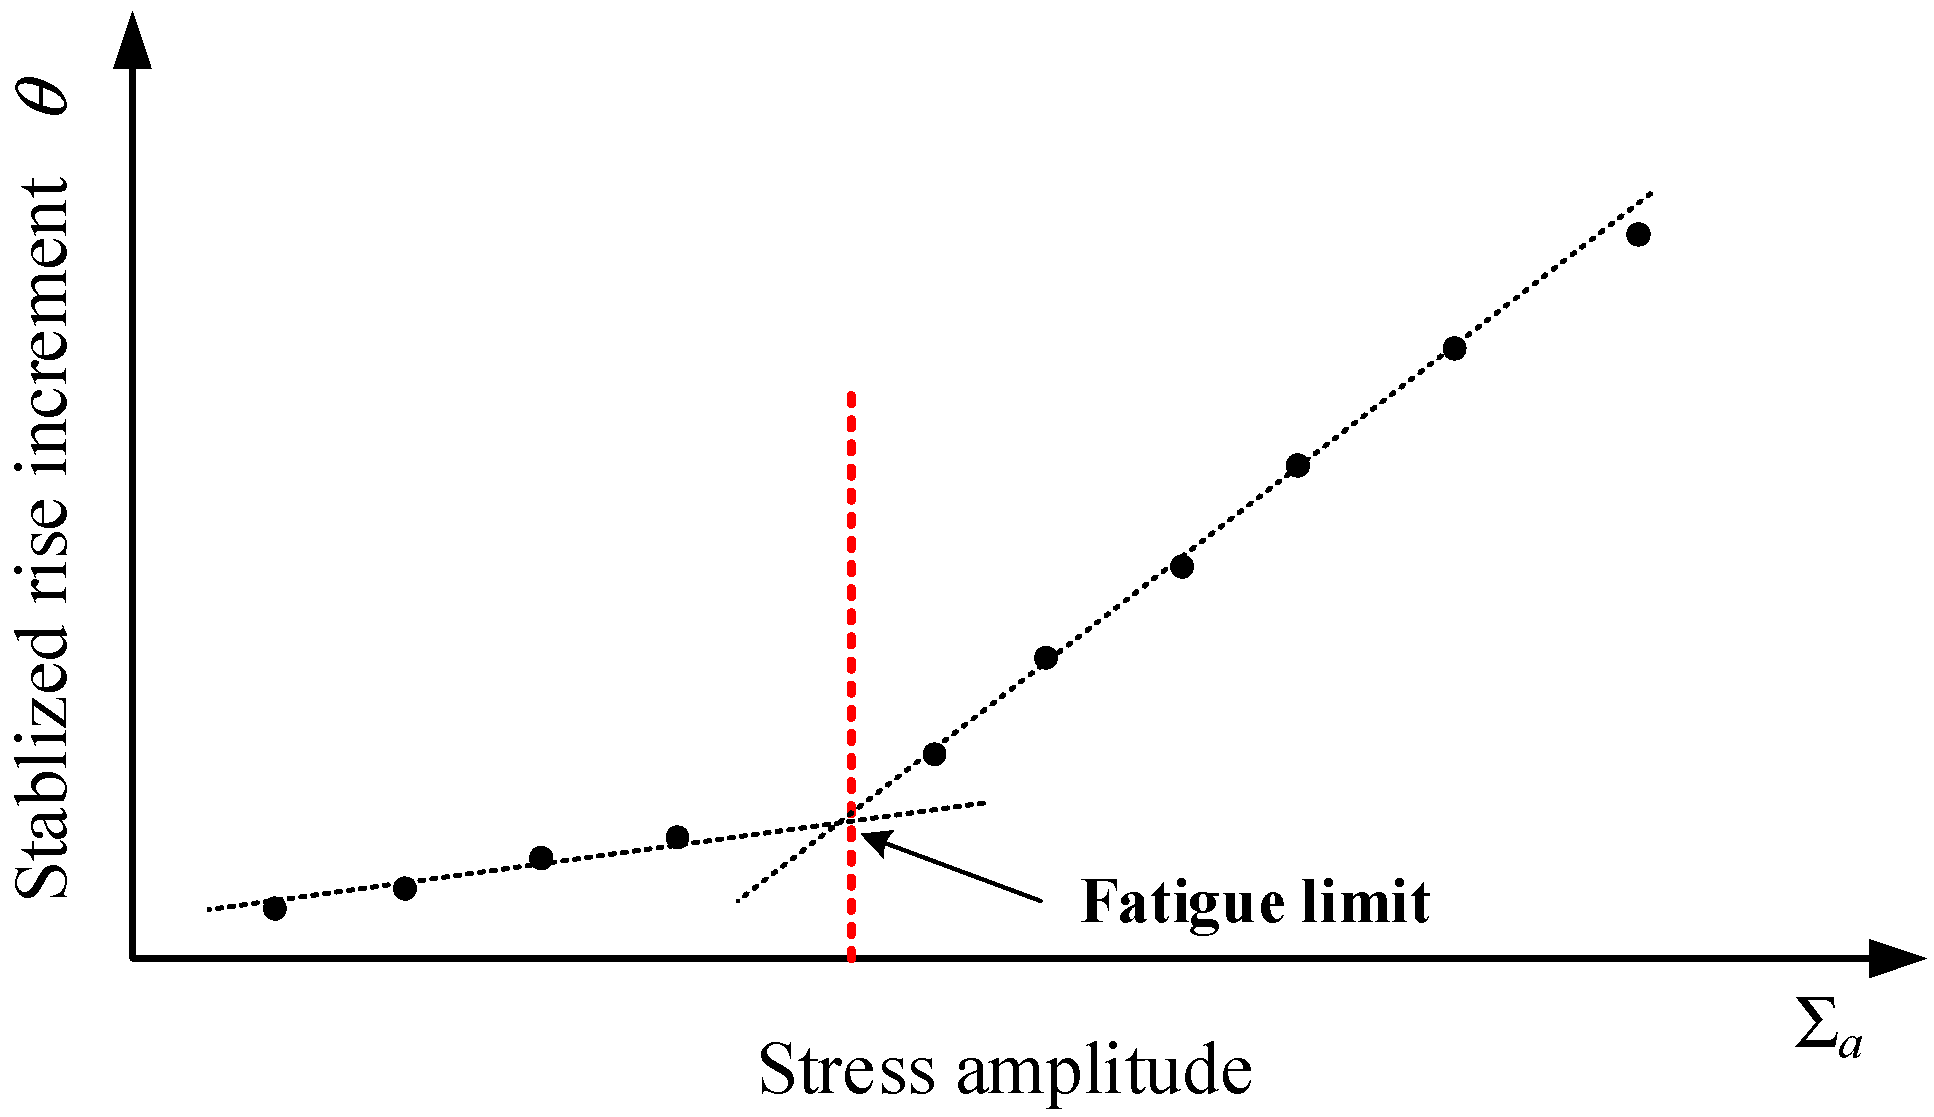
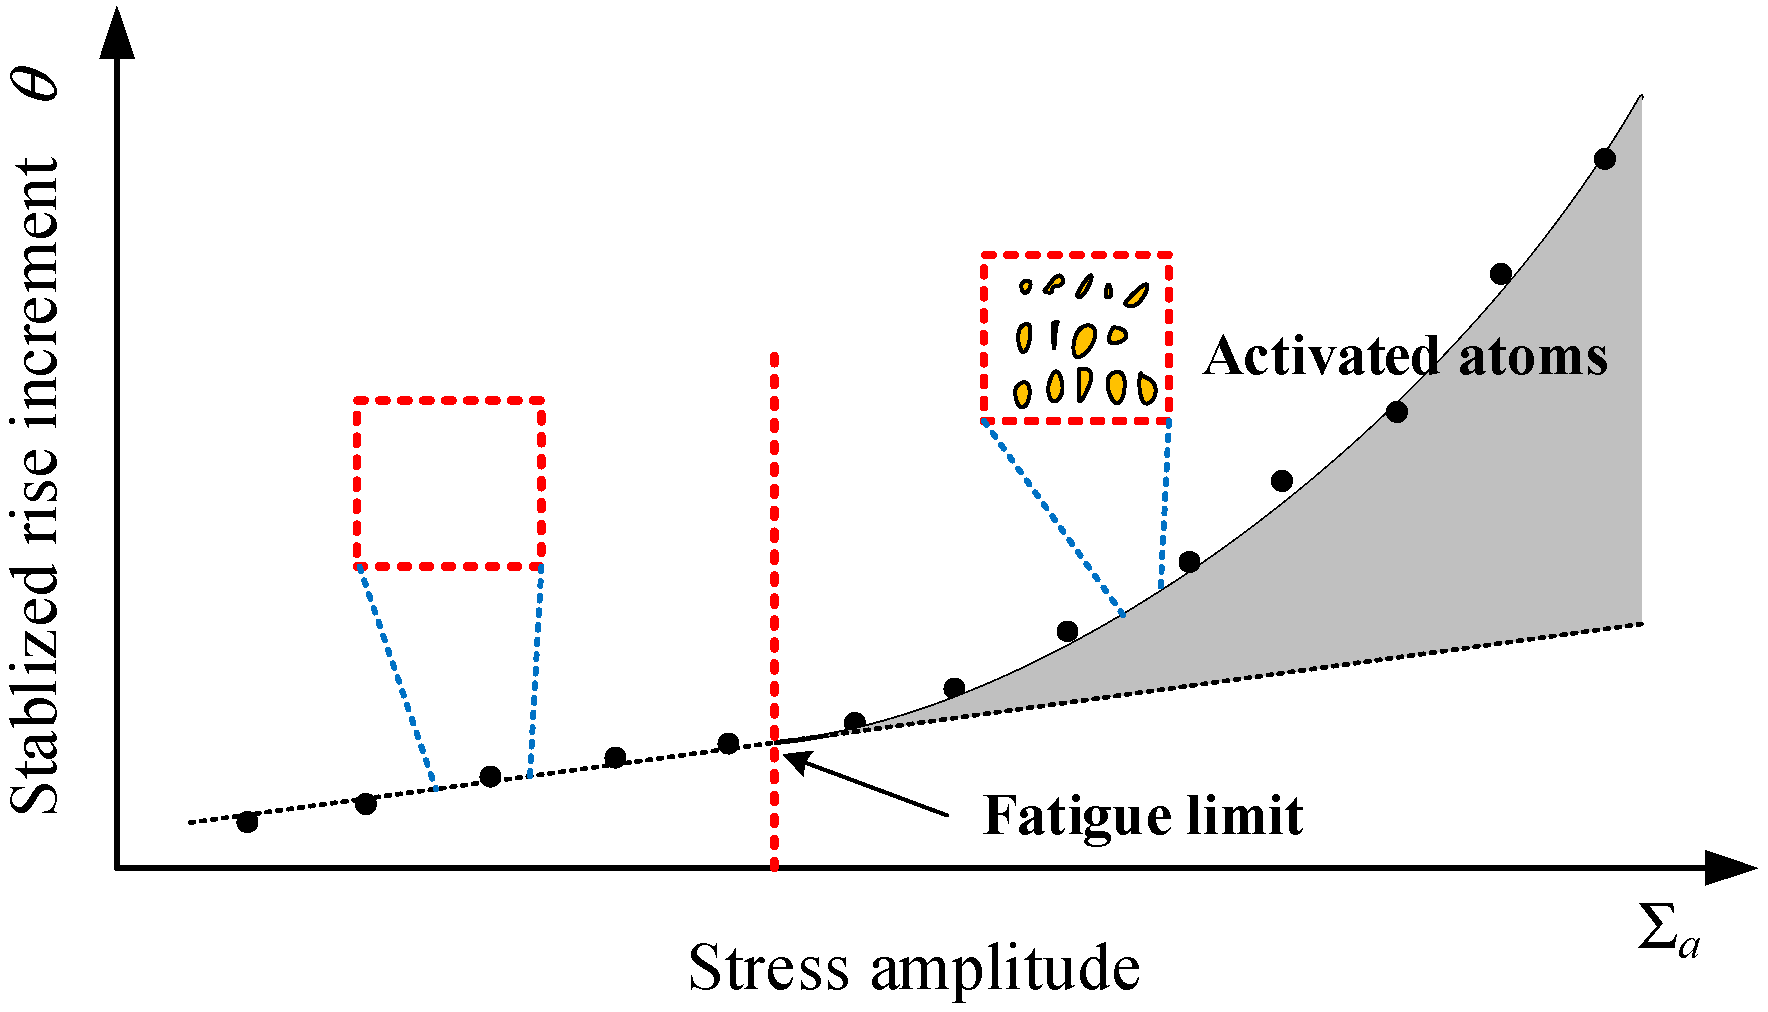
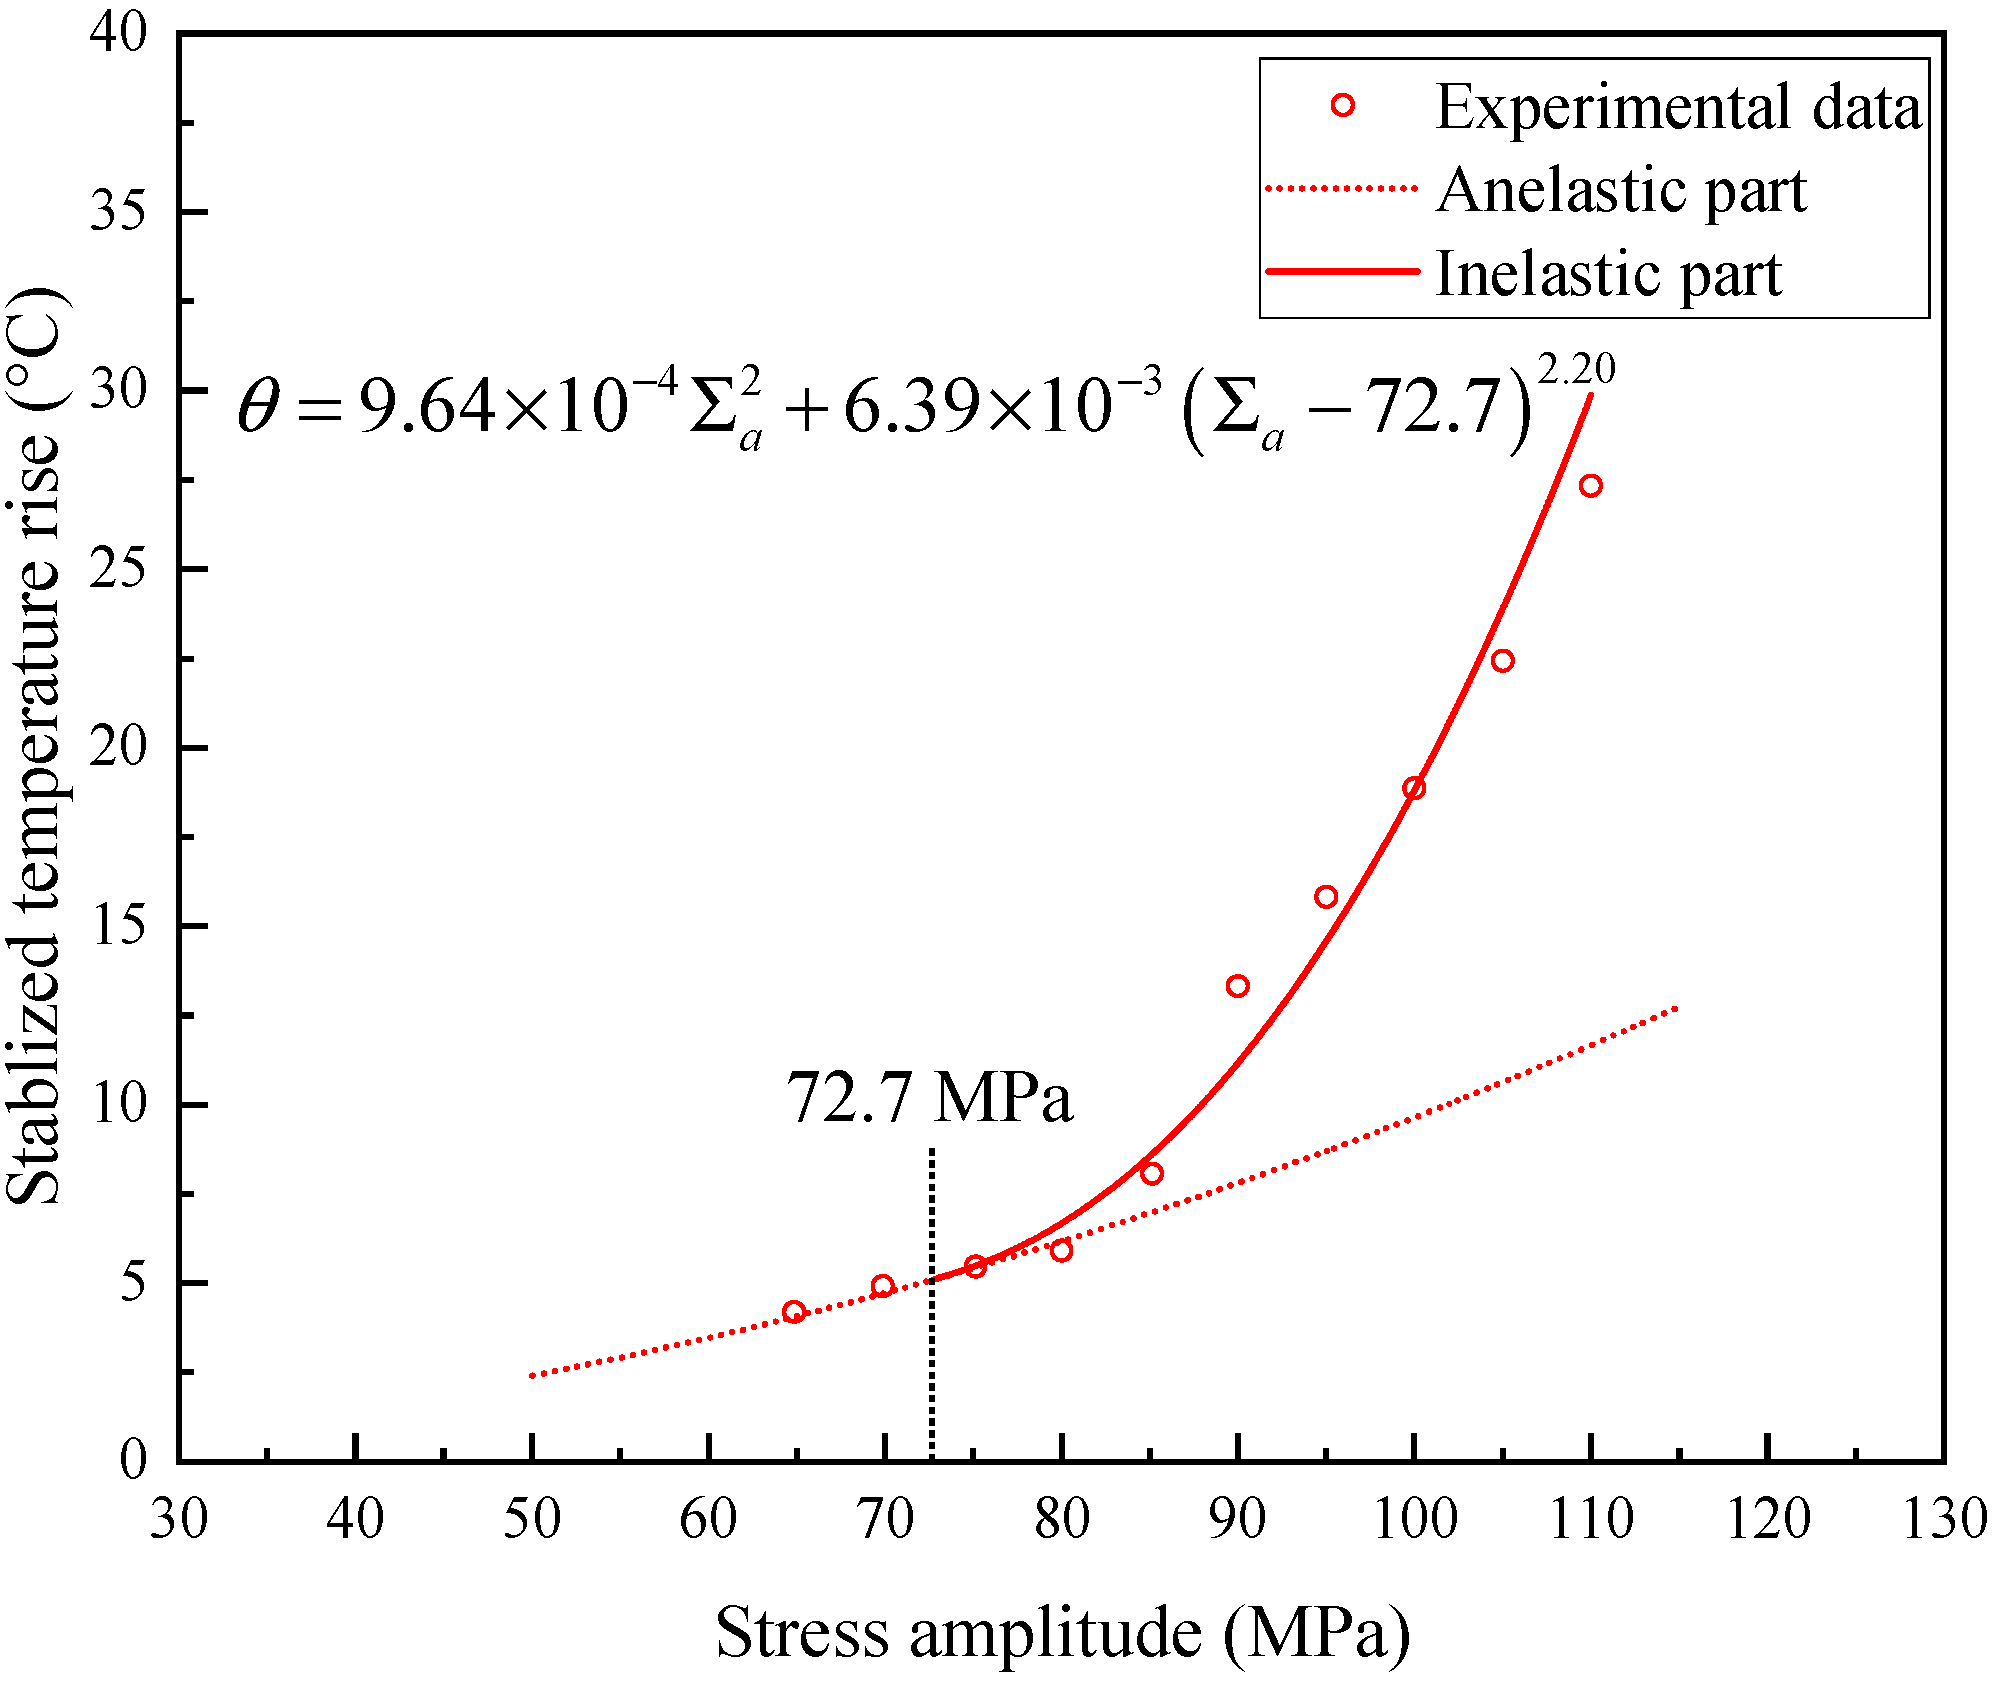
  • Combined with Equation (17), the data with a small stress amplitude, as shown in Figure 3, can be fitted by a a 2 . Thus, the temperature variation related to anelastic mechanical behavior, such as internal friction, is obtained.
  • After obtaining the expression a a 2 corresponding to internal friction, we can consider the temperature increment related to inelastic behavior.
For the ith stress amplitude level (in), which is higher than the fatigue limit, the corresponding temperature increment induced by microplasticity is written as:
θ i n ( i ) = θ ( i ) a Σ a 2 ( i ) = b Σ a ( i ) Σ f ( m + 2 )
To obtain the values of b′ and m, we take the logarithm of the two sides of Equation (18) in accordance with the correlation coefficient optimization approach, thus yielding:
log θ i n ( i ) = log b + m + 2 log Σ a ( i ) Σ f
Define log(θin(i)) and log Σ a ( i ) Σ f as x and y; let A = logb′, B = m + 2; and Equation (19) transforms as:
x = A + B y
where x and y follow a linear relationship. By using the correlation coefficient optimization approach, A and B can be calculated as:
A = x ¯ B y ¯ , B = L Y X L Y Y , r = L Y X L Y Y L X X
where x ¯ = 1 n i = 1 n xi, y ¯ = 1 n i = 1 n yi, LXX = i = 1 n xi2 1 n ( i = 1 n xi)2, LYY = i = 1 n yi2 1 n ( i = 1 n yi)2, LYX = i = 1 n yixi 1 n ( i = 1 n yi)( i = 1 n xi); and r denotes the correlation coefficient. Consider that A, B, and r are the functions of ∑f, and the ideal value of Σ f can be determined when r obtains its maximum value, namely:
d r 2 ( Σ f ) d Σ f = d r 2 ( Σ f ) 1 L YX d L YX d Σ f 1 2 L YY d L YY d Σ f = 0
Due to dr2(∑f) ≥ 0, and thus we have:
1 L Y X d L Y X d Σ f 1 2 L Y Y d L Y Y d Σ f = 0
where d L Y X d Σ f = L X 0 In 10 , d L Y Y d Σ f = 2 L X 0 In 10 , and LX0, LY0 are given by:
L X 0 = i = 1 n x i Σ a ( i ) Σ f 1 n i = 1 n x i i = 1 n 1 Σ a ( i ) Σ f L Y 0 = i = 1 n y i Σ a ( i ) Σ f 1 n i = 1 n y i i = 1 n 1 Σ a ( i ) Σ f
Then, Equation (23) can be rewritten as:
L X 0 L YX L Y 0 L YY = 0
Let F(∑f) be equal to L X 0 L YX L Y 0 L YY , and we have:
F ( Σ f ) = L X 0 L YX L Y 0 L YY
Thus, the estimated value of ∑f can be identified by the iteration approach when an ideal iteration accuracy is reached.

4. Results and Discussion

4.1. Identification of the Parameters of the Proposed Model

In this study, experimental data from the literature are used to validate the proposed model. The specimens of AZ31B magnesium alloy welded joints, AISI 422 stainless steel, GCr15 steel, and 304L stainless steel are applied in this work. The dimensions of specimens from the literature are shown in Figure 4. Fatigue tests of AZ31B magnesium alloy welded joint, AISI 422 stainless steel, GCr15 steel, and 304L stainless steel were performed under a constant sinusoidal load. The stress ratio of the four types of specimens is 0.1, 0.5, −1, and −1. During the fatigue experiments, the real-time temperature field of the surface of four types of specimens was monitored with a thermal camera, and the steady temperature increment of the center point of the gauge part is used to establish the self-heating curves. Furthermore, a layer of black matte paint is painted on the sample’s surface in order to obtain a precise temperature measurement.
By taking full advantage of Equation (17) and Section 3, the experimental data from the literature are used to fit the self-heat curve under constant cyclic stress amplitude. The fitted self-heating curves have been shown in Figure 5, Figure 6, Figure 7 and Figure 8. As we can observe in these figures, a good agreement has been reached between the experimental data and the proposed model, indicating that the self-heating constitutive model possesses an ideal prediction ability of the response relationship between temperature rise and stress amplitude level.

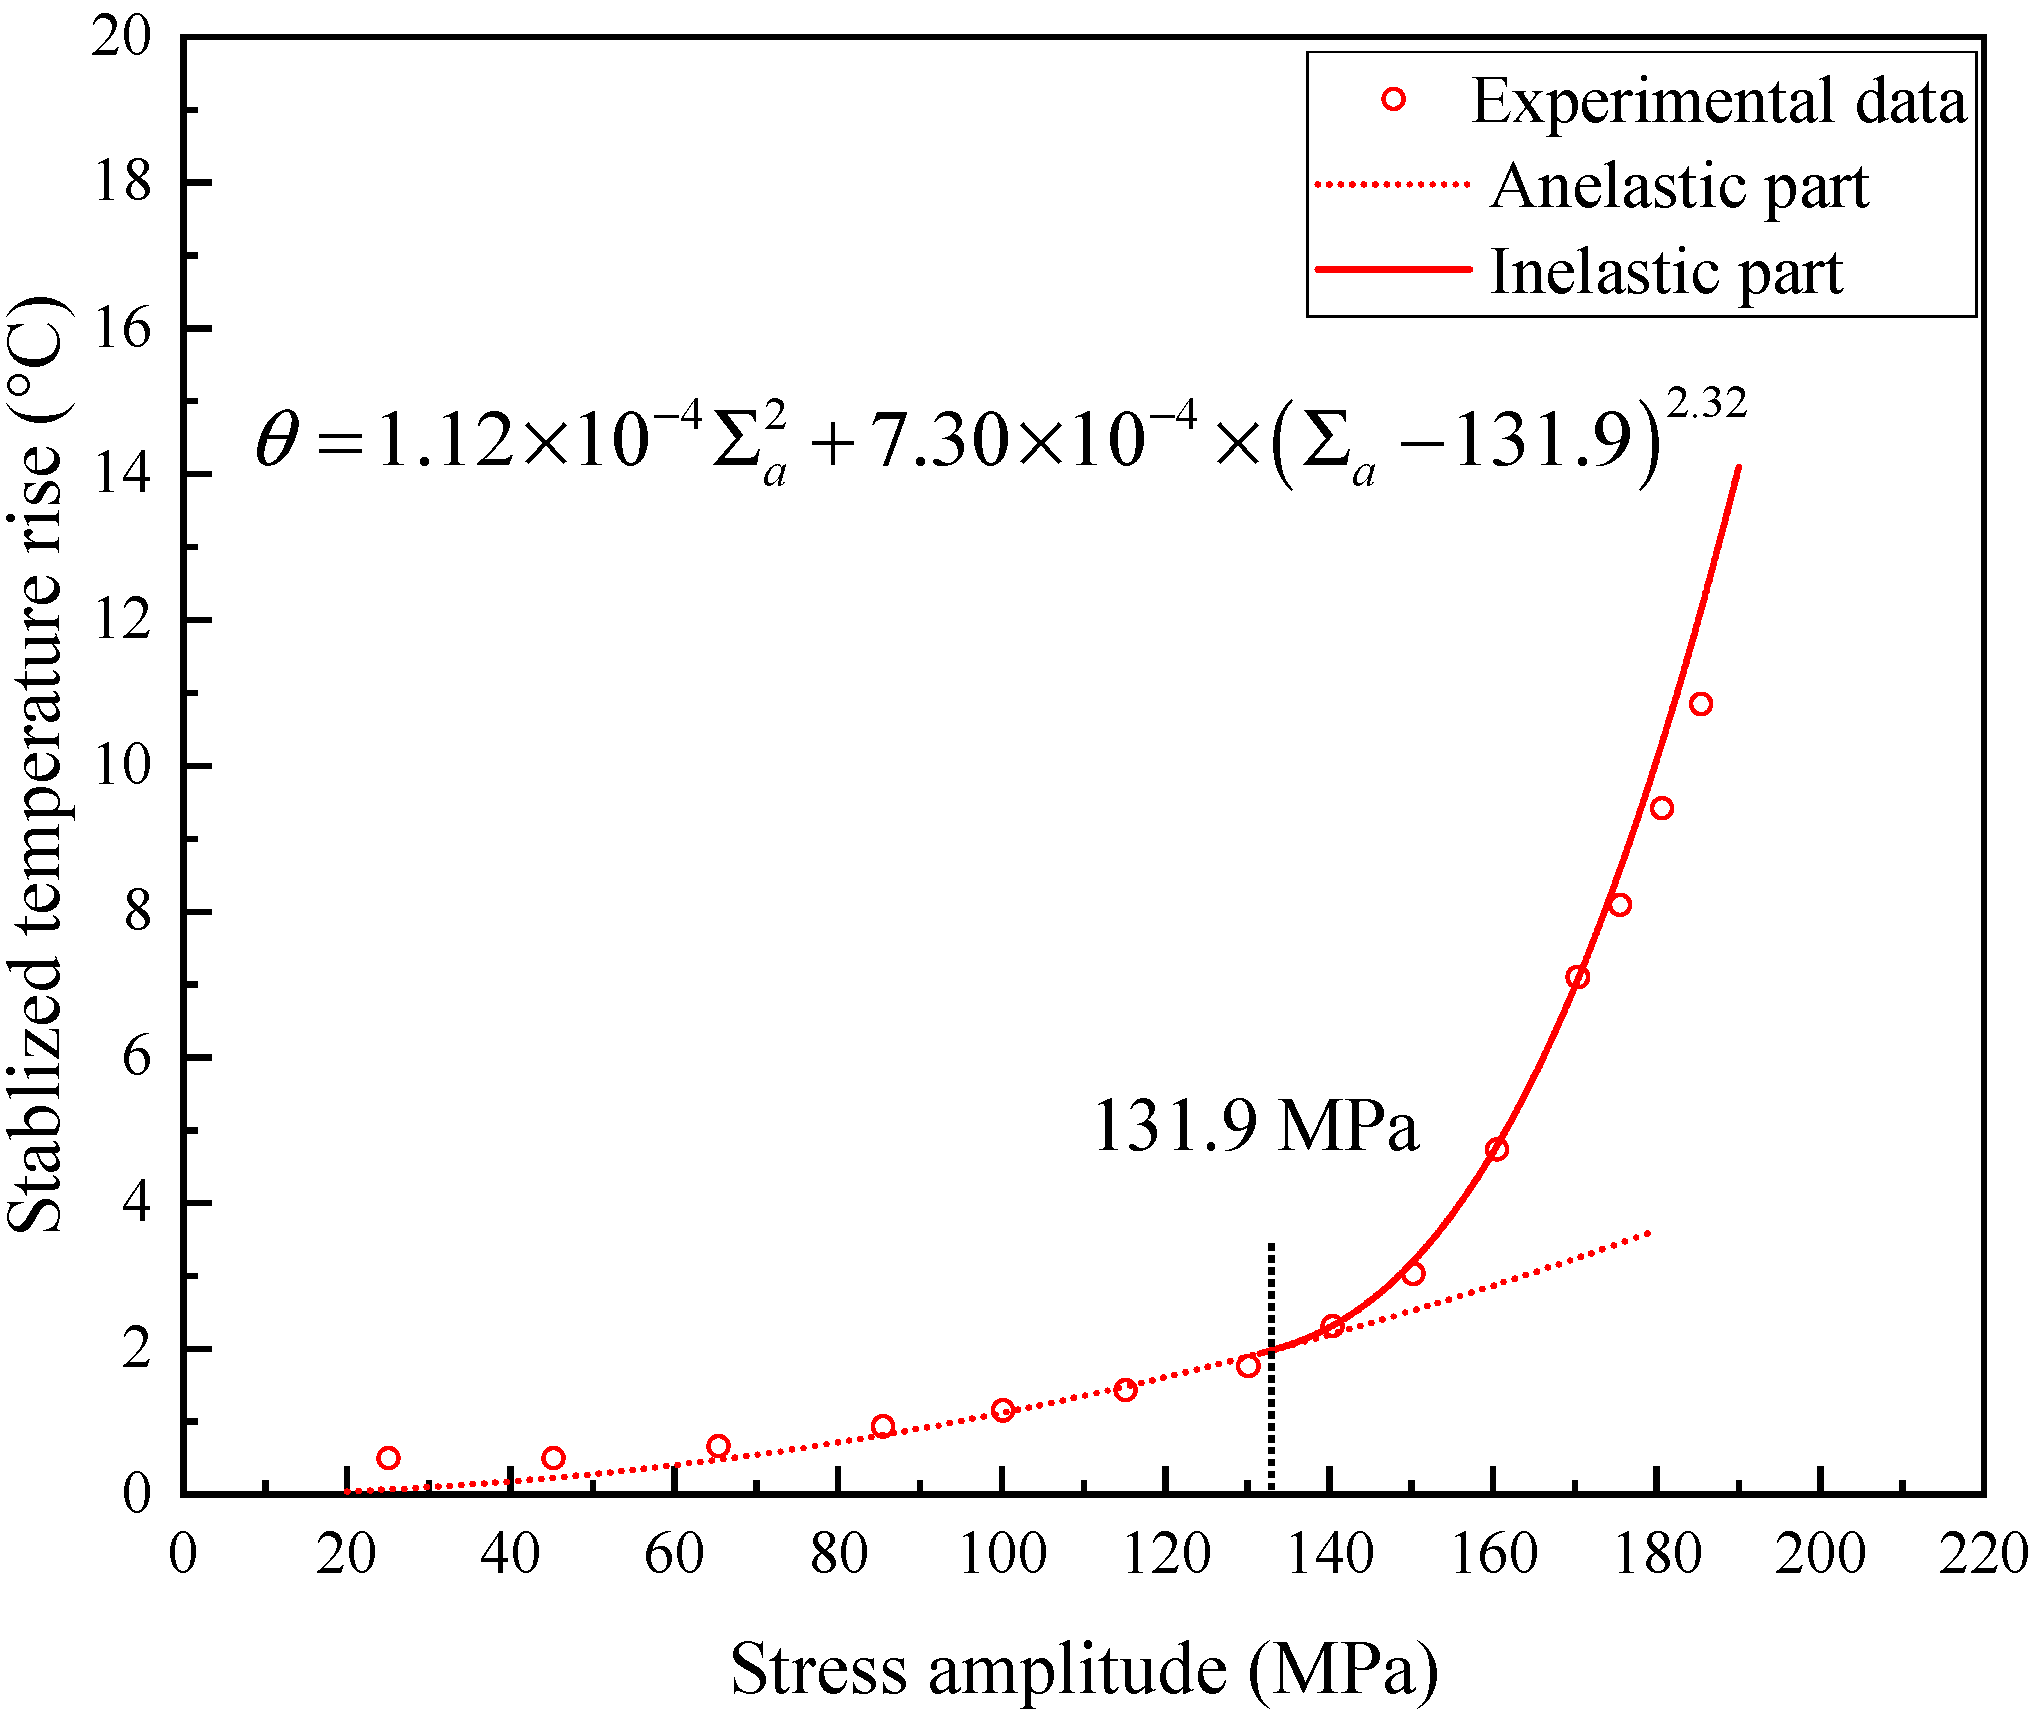
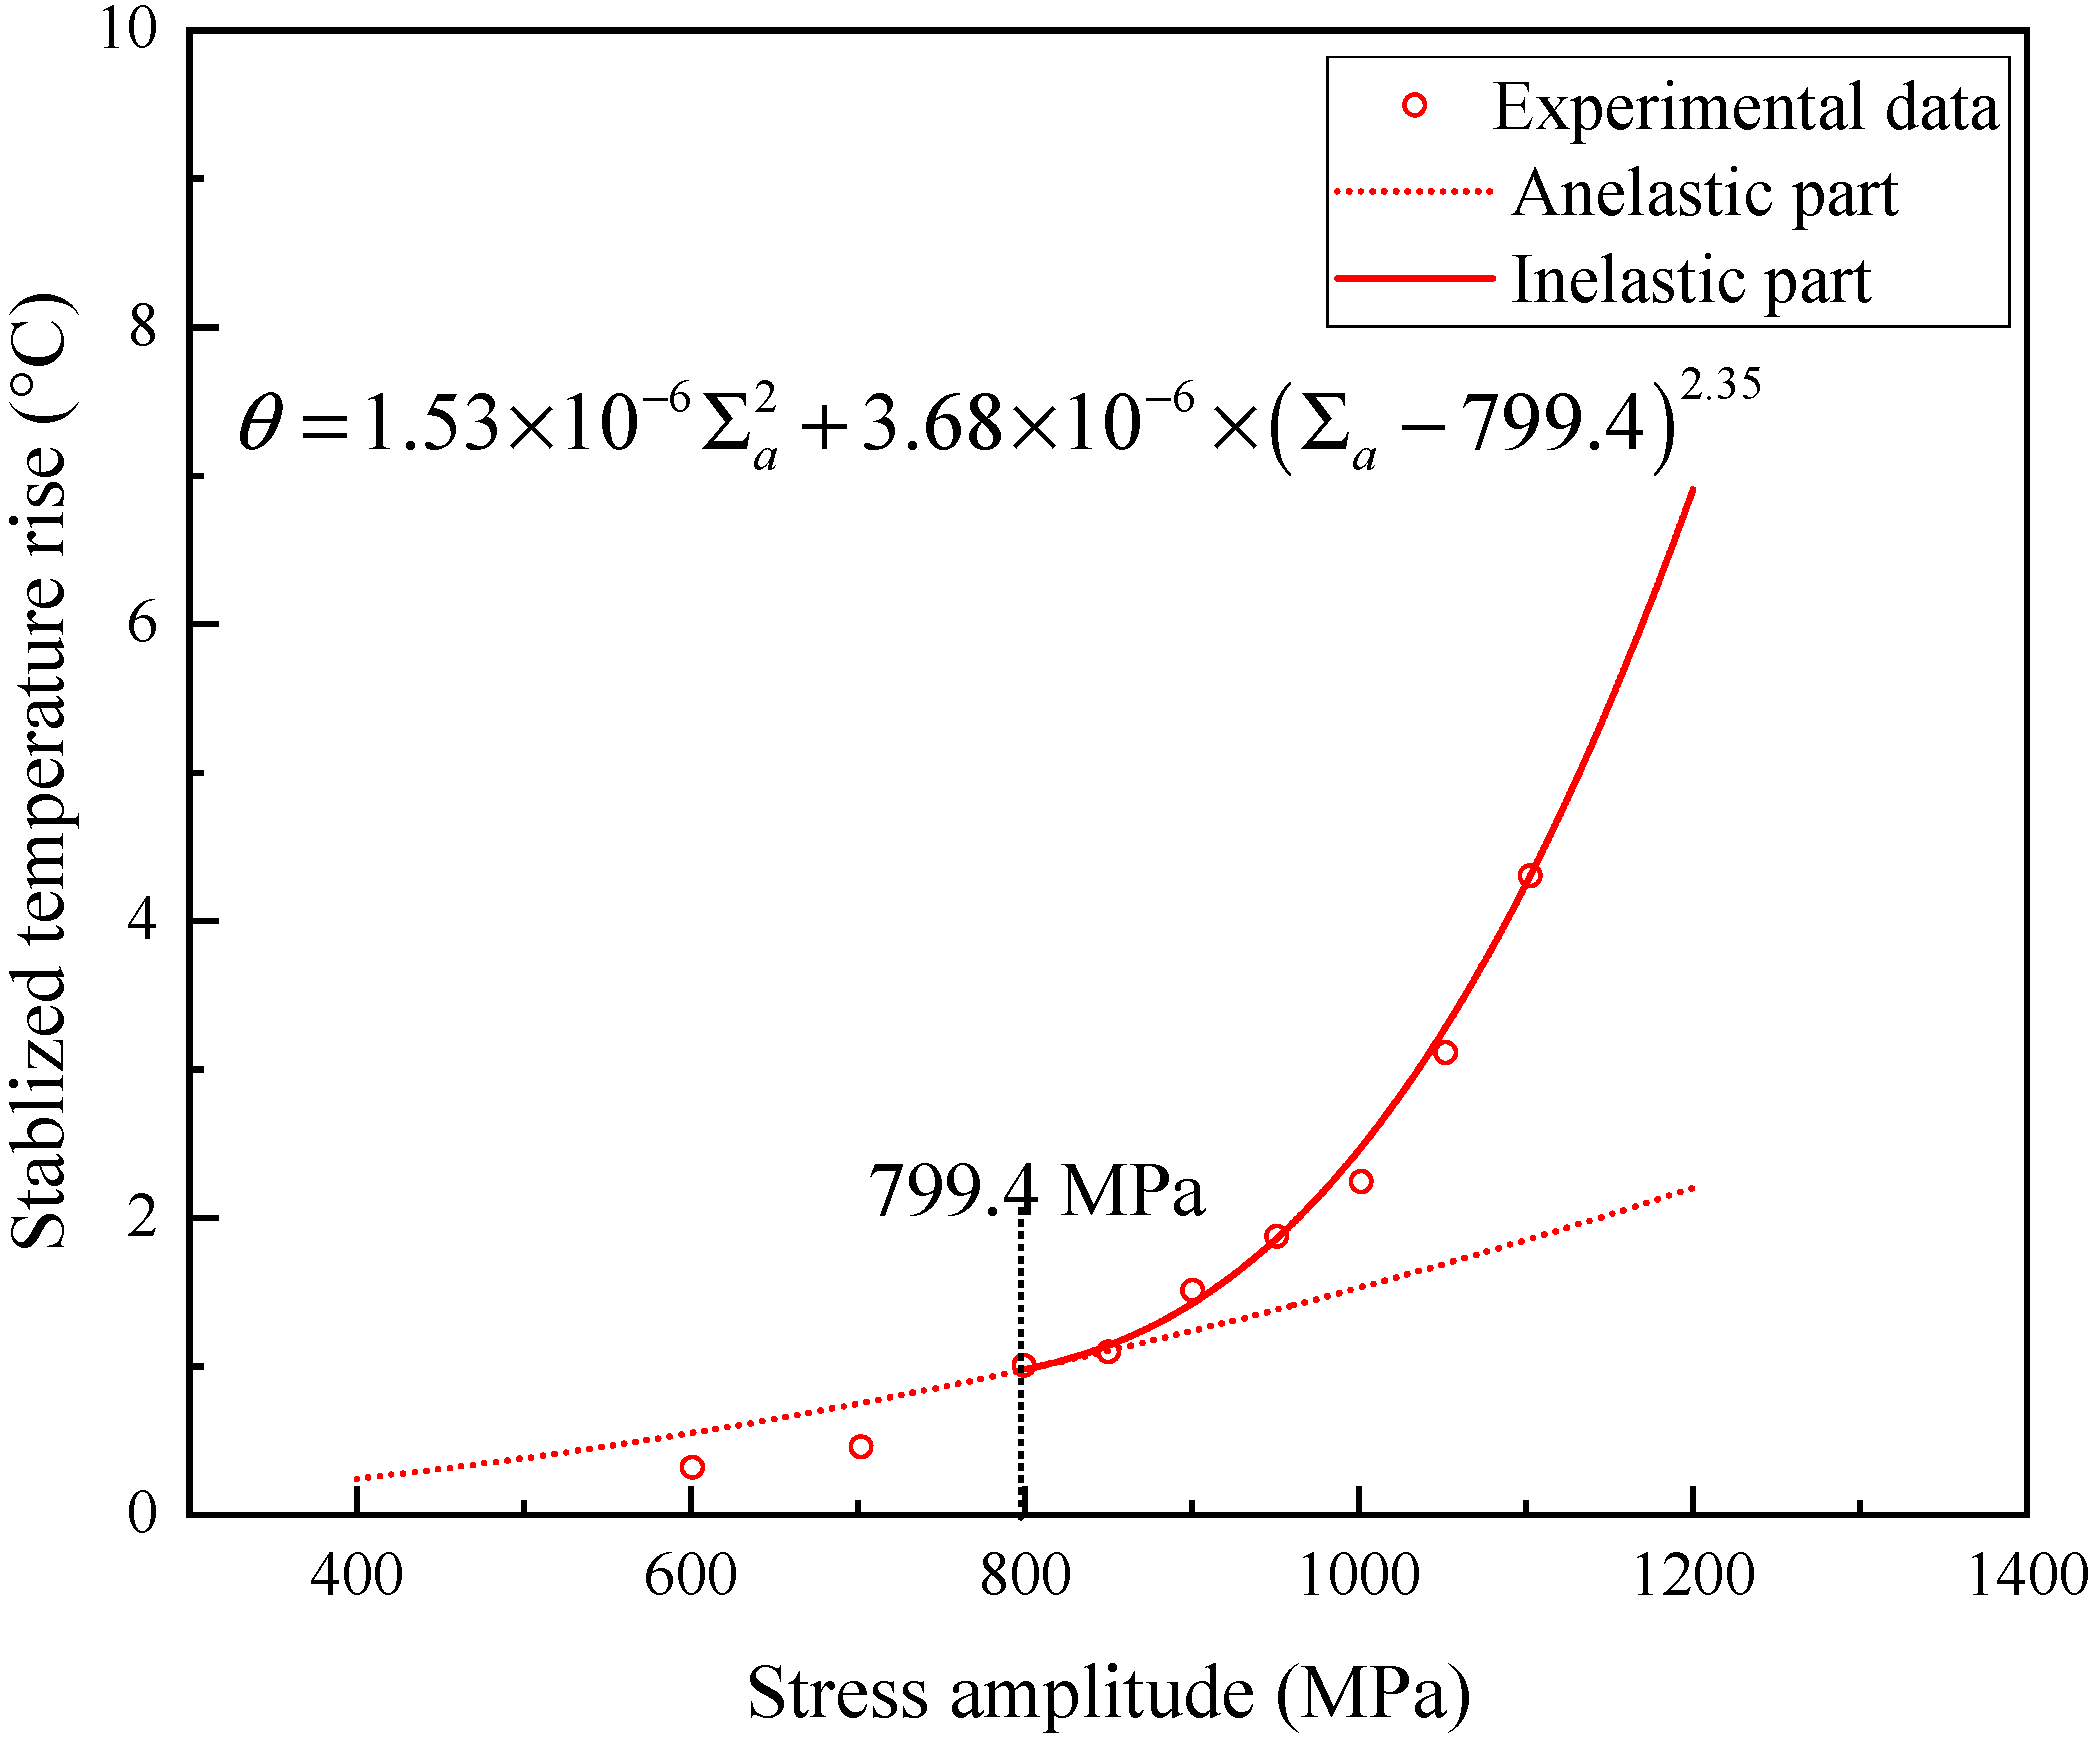
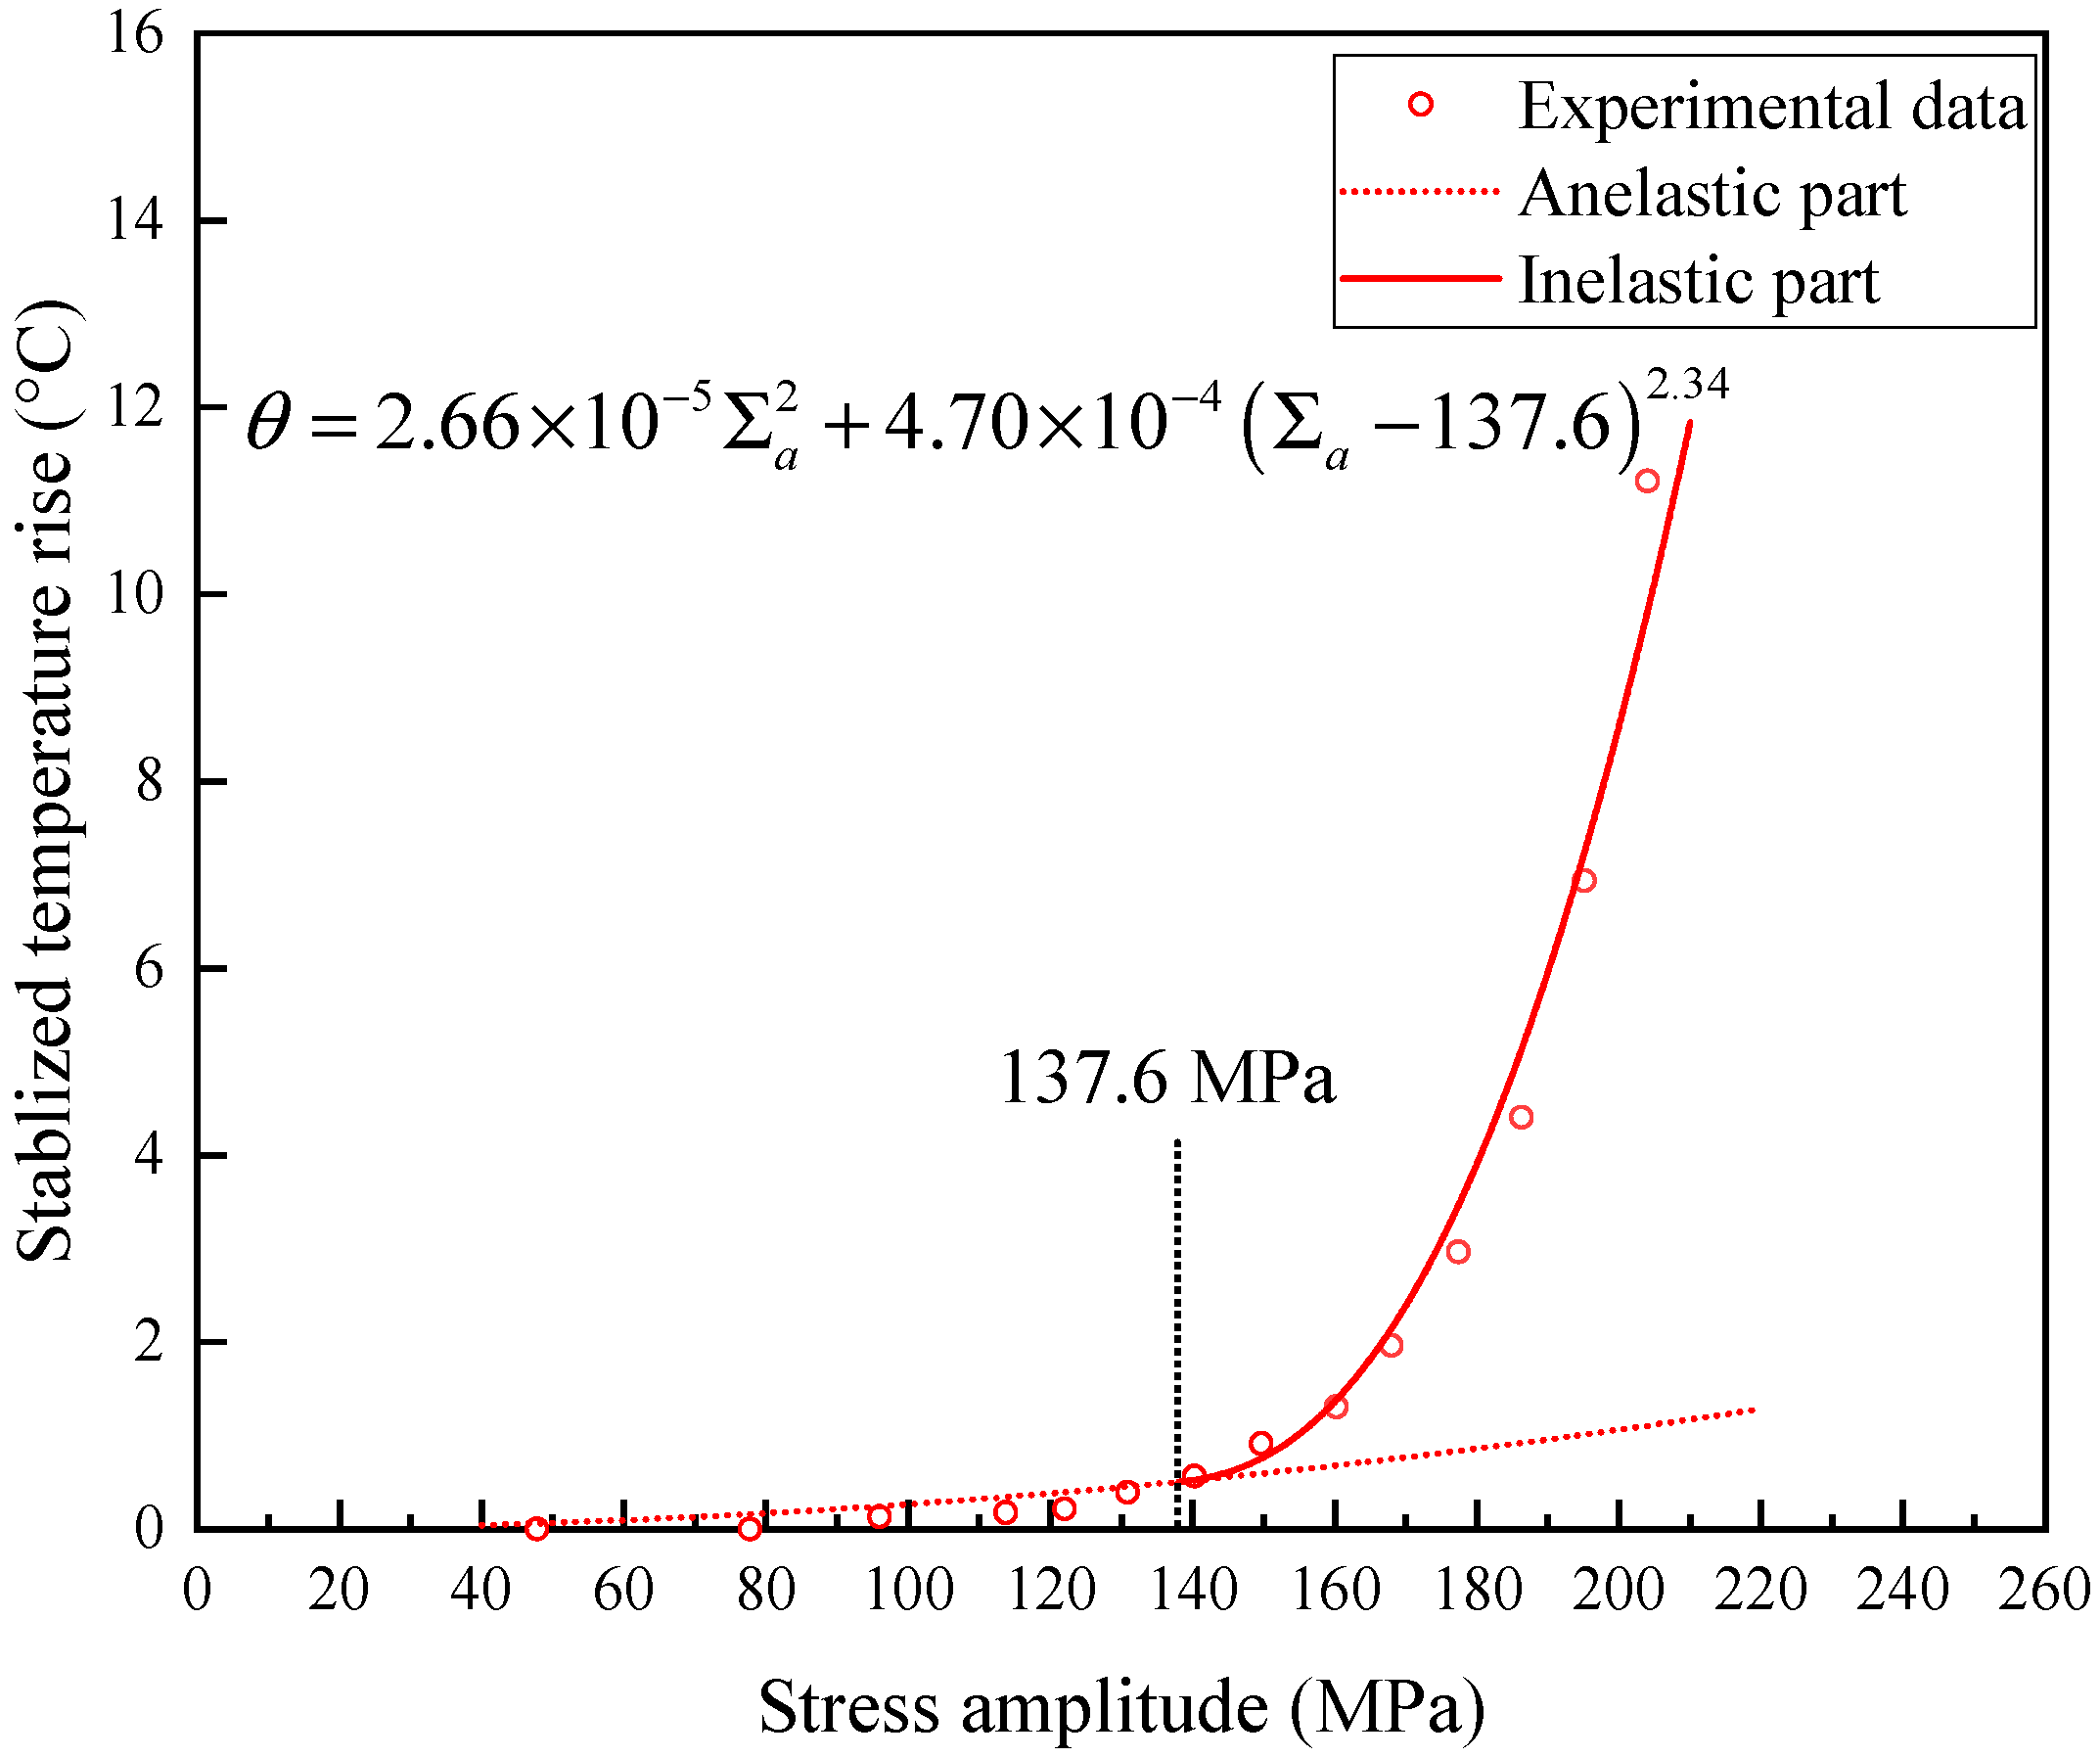
4.2. Fatigue Limit Estimation

As presented in Section 4.1, the experimental data of four materials, namely the AZ31B welded joint, AISI 422, GCr15, and 304L, are employed to identify the model’s parameters. The determined results from four materials are shown in Table 1. As can be seen in Table 1, the values of m from four types of specimens nearly remain constant, and this may hint that m is a constant independent of materials and the self-heating curve has a similar non-linear trend within the range of higher stress amplitudes. As for a’ and b’, the values of four materials are different or not in the same order of magnitude, and this is due to the different temperature increments with corresponding materials.
Based on this, the constitutive equation that describes the response between temperature rise and stress amplitude is shown in Figure 5, Figure 6, Figure 7 and Figure 8. As shown in Figure 5, Figure 6, Figure 7 and Figure 8, the red dash–dot line shows the temperature increment sourced from anelastic behavior, while the red solid line denotes the temperature increment contributed by inelastic mechanical behaviors. As we can observe in Figure 5, Figure 6, Figure 7 and Figure 8, the self-heating temperature increases steadily at a relatively slow rate within a small stress range, while it sharply changes at a higher stress level. The different temperature rise mechanisms can be attributed to the recoverable and non-recoverable microstructure motions, i.e., anelastic and inelastic behaviors.
By using the correlation coefficient optimization method, as stated in Section 3, the fatigue endurance limit of four types of materials is identified when the iteration accuracy of Equation (26) is reached. The estimated value of the fatigue limit is shown in Table 2. As shown in Table 2, compared with the traditional bilinear method (proposed by Luong and Ristiano), the error between the two approaches is within 15%, which may indicate a relatively ideal accuracy of the proposed method. Nevertheless, it should be noted that the fatigue limit determined by the developed method tends to be more conservative, which may be due to the non-linear temperature rise response under different stress amplitude levels. Specifically, the temperature rise response under different stress amplitudes exhibits a clear non-linear trend, that is, at low stress levels, due to the recoverable anelastic response, it exhibits a quadratic relationship with stress amplitude level. However, when the stress amplitude is above the stress amplitude, some irreversible plastic strains are gradually formed, thus displaying a sudden increase in temperature. Combined with the fitted results in Figure 5, Figure 6, Figure 7 and Figure 8, and Table 1, the sudden rise in temperature is related to the inelastic mechanical behaviors.
Nevertheless, although four different metallic materials are utilized to determine the constitutive self-heating model, it is still necessary to note that more tests are needed to confirm the effectiveness of this model. Furthermore, more investigations are needed to determine whether the m value stays constant for additional materials in future studies, even though it is practically constant for these four materials.

5. Conclusions

This study is devoted to proposing a self-heating constitutive model within a thermo-mechanical framework. Four types of metallic materials from the literature are used to verify the proposed model, and two types of microstructure motion mechanisms, namely anelasticity and microplasticity, are underlined. Some concluding remarks are as follows:
  • By taking full advantage of the experimental data, the self-heating curves under different stress amplitudes are well fitted in combination with the proposed model.
  • The fatigue endurance limit is identified by employing the correlation coefficient optimization method, and the errors between the predicted value by the proposed method and the conventional method are within 15%, which demonstrates that a relatively ideal estimation capacity is enabled.
  • The m value of the self-heating constitutive model remains constant for these four materials, indicating that m is a constant independent of materials.
  • The proposed method allows a rapid determination of the metallic materials that exist in the non-linear self-heating trend.

Author Contributions

Conceptualization, Z.L. and W.W.; methodology, Z.L. and W.W.; software, H.W.; validation, X.C.; formal analysis, H.W. and X.C.; investigation, Z.L.; resources, W.W.; data curation, W.W.; writing—original draft preparation, Z.L. and W.W.; writing—review and editing, Z.L. and W.W.; visualization, X.C.; supervision, W.W.; funding acquisition, Z.L., X.C. and W.W. All authors have read and agreed to the published version of the manuscript.

Funding

This research was funded by the Doctoral Start-up Foundation of Liaoning Province (grant number: 2023-BS-195), Ph.D. research startup foundation of Liaoning University of Technology (grant number: XB2022001), and the Basic Scientific Research Project of Liaoning Provincial Department of Education (grant number: LJKQZ20222271, LJKMZ20220960, and LJKMZ20220962).

Data Availability Statement

Data are unavailable in this study.

Conflicts of Interest

The authors declare no conflict of interest.

References

  1. Xiong, J.; Shenoi, R. Fatigue and Fracture Reliability Engineering; Springer: Berlin/Heidelberg, Germany, 2011. [Google Scholar]
  2. Mostofizadeh, P.; Kadkhodaei, M.; Arbab Chirani, S.; Saint-Sulpice, L.; Rokbani, M.; Bouraoui, T.; Calloch, S. Fatigue analysis of shape memory alloys by self-heating method. Int. J. Mech. Sci. 2019, 156, 329–341. [Google Scholar] [CrossRef]
  3. Guo, S.; Liu, X.; Zhang, H.; Yan, Z.; Fang, H. Fatigue Performance Evaluation of AZ31B Magnesium Alloy Based on Statistical Analysis of Self-Heating. Materials 2021, 14, 2251. [Google Scholar] [CrossRef] [PubMed]
  4. Huang, J.; Garnier, C.; Pastor, M.; Gong, X. Investigation of self-heating and life prediction in CFRP laminates under cyclic shear loading condition based on the infrared thermographic data. Eng. Fract. Mech. 2020, 229, 106971. [Google Scholar] [CrossRef]
  5. Wei, W.; Li, C.; Sun, Y.; Xu, H.; Yang, X. Investigation of the Self-Heating of Q460 Butt Joints and an S-N Curve Modeling Method Based on Infrared Thermographic Data for High-Cycle Fatigue. Metals 2021, 11, 232. [Google Scholar] [CrossRef]
  6. Balit, Y.; Joly, L.-R.; Szmytka, F.; Durbecq, S.; Charkaluk, E.; Constantinescu, A. Self-heating behavior during cyclic loadings of 316L stainless steel specimens manufactured or repaired by Directed Energy Deposition. Mater. Sci. Eng. A 2020, 786, 139476. [Google Scholar] [CrossRef]
  7. Amini, B.; Demmouche, Y.; Barati, M.; Helbert, G.; Chirani, S.A.; Calloch, S. Self-heating of metasTable 304L austenitic stainless steel under cyclic loading: Influence of initial martensite volume fraction, testing temperature and pre-strain. Mech. Mater. 2020, 151, 103596. [Google Scholar] [CrossRef]
  8. Louge, J.; Moyne, S.; Doudard, C.; Calloch, S.; Weber, B.; Munier, R. Self-heating measurements under cyclic loading to identify history effects on HCF properties of high-strength low-alloy steel: Part II—Modeling. Fatigue Fract. Eng. M 2022, 45, 3524–3534. [Google Scholar] [CrossRef]
  9. Bayati, P.; Jahadakbar, A.; Barati, M.; Nematollahi, M.; Saint-Sulpice, L.; Haghshenas, M.; Chirani, S.A.; Mahtabi, M.J.; Elahinia, M. Toward low and high cycle fatigue behavior of SLM-fabricated NiTi: Considering the effect of build orientation and employing a self-heating approach. Int. J. Mech. Sci. 2020, 185, 105878. [Google Scholar] [CrossRef]
  10. Cao, Y.; Moumni, Z.; Zhu, J.; Zhang, Y.; Zhang, W. Comparative investigation of the fatigue limit of additive-manufactured and rolled 316 steel based on self-heating approach. Eng. Fract. Mech. 2020, 23, 106746. [Google Scholar] [CrossRef]
  11. Guo, S.; Liu, X.; Zhang, H.; Yan, Z.; Zhang, Z.; Fang, H. Thermographic Study of AZ31B Magnesium Alloy under Cyclic Loading: Temperature Evolution Analysis and Fatigue Limit Estimation. Materials 2020, 13, 5029. [Google Scholar] [CrossRef]
  12. Li, Y.; Zhang, R.; Li, L.; Bao, P.; Zhang, W.; Yang, Z.; Tian, G.; Ming, A. Temperature variation and damage characteristic of impacted CFRP laminate using infrared thermography: Experimental investigation. Int. J. Fatigue 2018, 112, 130–137. [Google Scholar] [CrossRef]
  13. Corigliano, P.; Crupi, V. Fatigue analysis of TI6AL4V/INCONEL 625 dissimilar welded joints. Ocean Eng. 2021, 221, 108582. [Google Scholar] [CrossRef]
  14. Luong, M. Fatigue limit evaluation of metals using an infrared thermographic technique. Mech. Mater. 1998, 28, 155–163. [Google Scholar] [CrossRef]
  15. La Rosa, G.; Risitano, A. Thermographic methodology for rapid determination of the fatigue limit of materials and mechanical components. Int. J. Fatigue 2000, 22, 65–73. [Google Scholar] [CrossRef]
  16. Risitano, A.; Risitano, G. Cumulative damage evaluation of steel using infrared thermography. Theor. Appl. Fract. Mec. 2010, 54, 82–90. [Google Scholar] [CrossRef]
  17. Risitano, A.; Risitano, G. Cumulative damage evaluation in multiple cycle fatigue tests taking into account energy parameters. Int. J. Fatigue 2013, 48, 214–222. [Google Scholar] [CrossRef]
  18. Colombo, C.; Vergani, L. Thermographic applications for the rapid estimation of fatigue limit. Procedia Struct. Integr. 2019, 24, 658–666. [Google Scholar] [CrossRef]
  19. Guo, S.; Liu, X.; Zhang, H.; Yan, Z.; Fang, H. Fatigue Limit Evaluation of AZ31B Magnesium Alloy Based on Temperature Distribution Analysis. Metals 2020, 10, 1331. [Google Scholar] [CrossRef]
  20. Zhao, A.; Xie, J.; Zhao, Y.; Liu, C.; Zhu, J.; Qian, G.; Wang, S.; Hong, Y. Fatigue limit evaluation via infrared thermography for a high strength steel with two strength levels. Eng. Fract. Mech. 2022, 268, 108460. [Google Scholar] [CrossRef]
  21. Huang, J.; Pastor, M.; Garnier, C.; Gong, X. Rapid evaluation of fatigue limit on thermographic data analysis. Int. J. Fatigue 2017, 104, 293–301. [Google Scholar] [CrossRef] [Green Version]
  22. Schaefer, F.; Rosar, J.; Wu, H.; Starke, P.; Marx, M. Obtaining a lower estimate of the fatigue limit of metals by a simplified quantitative thermometric approach in a low-cost one-specimen test. Int. J. Fatigue 2022, 159, 106729. [Google Scholar] [CrossRef]
  23. Yang, H.; Cui, Z.; Wang, W.; Xu, B.; Xu, H. Fatigue behavior of AZ31B magnesium alloy electron beam welded joint based on infrared thermography. T. Nonferr. Metal. Soc. 2016, 26, 2595–2602. [Google Scholar] [CrossRef]
  24. De Finis, R.; Palumbo, D.; Ancona, F.; Galietti, U. Fatigue limit evaluation of various martensitic stainless steels with new robust thermographic data analysis. Int. J. Fatigue 2015, 74, 88–96. [Google Scholar] [CrossRef]
  25. Guo, Q.; Guo, X. Research on high-cycle fatigue behavior of FV520B stainless steel based on intrinsic dissipation. Mater. Design 2016, 90, 248–255. [Google Scholar] [CrossRef]
  26. Guo, Q.; Guo, X.; Fan, J.; Syed, R.; Wu, C. An energy method for rapid evaluation of high-cycle fatigue parameters based on intrinsic dissipation. Int. J. Fatigue 2015, 80, 136–144. [Google Scholar] [CrossRef]
  27. Liu, Y.; Sun, Y.; Sun, Y.; Xu, H.; Yang, X. Rapid fatigue life prediction for spot-welded joint of SUS301 L-DLT stainless steel and Q235B carbon steel based on energy dissipation. Adv. Mech. Eng. 2018, 10, 1–11. [Google Scholar] [CrossRef]
  28. Feng, E.; Wang, X.; Jiang, C. A new multiaxial fatigue model for life prediction based on energy dissipation evaluation. Int. J. Fatigue 2019, 122, 1–8. [Google Scholar] [CrossRef]
  29. Teng, Z.; Wu, H.; Boiler, C.; Starke, P. A unified fatigue life calculation based on intrinsic thermal dissipation and microplasticity evolution. Int. J. Fatigue 2020, 131, 105370. [Google Scholar] [CrossRef]
  30. Yang, W.; Guo, X.; Guo, Q. A high-cycle fatigue energy dissipation accurate estimation method considering natural convection and radiation heat transfer. Int. J. Fatigue 2020, 138, 105717. [Google Scholar] [CrossRef]
  31. Haghshenas, A.; Jang, J.; Khonsari, M. On the intrinsic dissipation and fracture fatigue entropy of metals. Mech. Mater. 2021, 155, 103734. [Google Scholar] [CrossRef]
  32. Seelan, P.; Dulieu-Barton, J.; Pierron, F. Microstructural Assessment of 316L Stainless Steel Using Infrared Thermography Based Measurement of Energy Dissipation Arising from Cyclic Loading. Mech. Mater. 2020, 148, 103455. [Google Scholar] [CrossRef]
  33. Li, A.; Huang, J.; Zhang, C. Enabling rapid fatigue life prediction of short carbon fiber reinforced polyether-ether-ketone using a novel energy dissipation–based model. Compos. Struct. 2021, 272, 114227. [Google Scholar] [CrossRef]
  34. Rigon, D.; Berto, F.; Meneghetti, G. Estimating the multiaxial fatigue behaviour of C45 steel specimens by using the energy dissipation. Int. J. Fatigue 2021, 151, 106381. [Google Scholar] [CrossRef]
  35. Guo, Q.; Zaïri, F.; Yang, W. Evaluation of intrinsic dissipation based on self-heating effect in high-cycle metal fatigue. Int. J. Fatigue 2020, 139, 105653. [Google Scholar] [CrossRef]
  36. Cappello, R.; Meneghetti, G.; Ricotta, M.; Pitarresi, G. On the correlation of temperature harmonic content with energy dissipation in C45 steel samples under fatigue loading. Mech. Mater. 2022, 168, 104271. [Google Scholar] [CrossRef]
  37. Fan, J.; Zhao, Y. Quantitative thermography for fatigue damage assessment and life prediction of welded components. Mech. Mater. 2022, 164, 104120. [Google Scholar] [CrossRef]
  38. Yang, W.; Guo, Q.; Fan, J.; Guo, X.; Zhao, Y. Effect of aging temperature on energy dissipation and high-cycle fatigue properties of FV520B stainless steel. Eng. Fract. Mech. 2021, 242, 107464. [Google Scholar] [CrossRef]
  39. Fan, J.; Zhao, Y.; Guo, X. A unifying energy approach for high cycle fatigue behavior evaluation. Mech. Mater. 2018, 120, 15–25. [Google Scholar] [CrossRef]
  40. Wang, X.; Crupi, V.; Jiang, C.; Feng, E.S.; Guglielmino, E.; Wang, C.S. Energy-based approach for fatigue life prediction of pure copper. Int. J. Fatigue 2017, 104, 243–250. [Google Scholar] [CrossRef]
  41. Mahmoudi, A.; Khonsari, M.M. Rapid evaluation of fatigue limit using energy dissipation. Fatigue Fract. Eng. M 2023, 46, 2156–2167. [Google Scholar] [CrossRef]
  42. Doudard, C.; Calloch, S.; Cugy, P.; Galtier, A.; Hild, F. A probabilistic two-scale model for high-cycle fatigue life predictions. Fatigue Fract. Eng. M. 2005, 28, 279–288. [Google Scholar] [CrossRef] [Green Version]
  43. Mareau, C.; Favier, V.; Weber, B.; Galtier, A. Influence of the free surface and the mean stress on the heat dissipation in steels under cyclic loading. Int. J. Fatigue 2009, 31, 1407–1412. [Google Scholar] [CrossRef]
Figure 1. The schematic of fatigue limit determination based on the bilinear method.
Metals 13 01147 g001
Figure 2. The schematic diagram of the representative volume element (RVE) model.
Metals 13 01147 g002
Figure 3. The schematic of the fatigue limit determination model is based on the self-heating approach.
Metals 13 01147 g003
Figure 4. The dimension of the specimen from the literature (unit: mm): (a) AZ31B welded joints adapted from [23]; (b) AISI 422 specimen adapted from [24]; (c) CGr15 specimen adapted from [20]; (d) 304L specimen adapted from [7].
Metals 13 01147 g004
Figure 5. The fitted self-heating curve of the AZ31B welded joints using Equation (17).
Metals 13 01147 g005
Figure 6. The fitted self-heating curve of the AISI 422 specimen using Equation (17).
Metals 13 01147 g006
Figure 7. The fitted self-heating curve of the CGr15 specimen using Equation (17).
Metals 13 01147 g007
Figure 8. The fitted self-heating curve of the SUS301L specimen using Equation (17).
Metals 13 01147 g008
Table 1. The parameters of the developed model are verified by different materials.
Materialsabm
AZ31B welded joint9.64 × 10−46.39 × 10−32.20
AISI 4221.12 × 10−47.30 × 10−42.32
GCr151.53 × 10−63.68 × 10−62.35
304L2.66 × 10−54.70 × 10−42.34
Table 2. The results of the estimated fatigue limit by the proposed method and the error between the proposed method and the bilinear method.
SpecimenTypeUnitRProposed MethodBilinear MethodRelative Error
AZ31B welded jointflatMPa0.172.78312.41%
GCr15 specimenround barMPa0.5799.493814.78%
AISI 422 specimenround barMPa−1131.9142.57.44%
304L specimenround barMPa−1137.6149.938.22%
Disclaimer/Publisher’s Note: The statements, opinions and data contained in all publications are solely those of the individual author(s) and contributor(s) and not of MDPI and/or the editor(s). MDPI and/or the editor(s) disclaim responsibility for any injury to people or property resulting from any ideas, methods, instructions or products referred to in the content.

