Article

The Influence of Foaming Agents on Aluminium Foam Cell Morphology

Department of Materials, Faculty of Mechanical Engineering and Naval Architecture, University of Zagreb, Ivana Lučića 5, 10000 Zagreb, Croatia
*
Author to whom correspondence should be addressed.
Metals 2023, 13(6), 1146; https://doi.org/10.3390/met13061146
Submission received: 17 May 2023 / Revised: 14 June 2023 / Accepted: 19 June 2023 / Published: 20 June 2023
(This article belongs to the Special Issue Structure and Application of Porous Metallic Materials)

Abstract

:
The choice of foaming agent and its mass fraction significantly affect the size and number of metal foam cells. The powder metallurgy process was used to produce aluminium foams with the addition of various foaming agents: titanium hydride (TiH2) and calcium carbonate (CaCO3). TiH2 was added in an amount of 0.4 wt.%, while the quantity of CaCO3 varied between 3 and 5 wt.%. The produced foams, with approximately the same degree of porosity, were scanned using a non-destructive computed tomography method. The number, size, equivalent diameter, sphericity, and compactness of cells were analysed on the obtained three-dimensional models. The results showed that foams foamed with TiH2 have much larger cells compared to CaCO3 agent. By considering the influence of CaCO3 fraction on the morphology of aluminium foam, it follows that a smaller quantity of CaCO3 (3 wt.%) provides a macrostructure with smaller cells. Samples with five wt.% CaCO3 contain slightly larger cells but are still much smaller than foams with TiH2 foaming agent at the same degree of porosity. The sphericity and compactness indicate that TiH2 foaming agent forms cells of a more regular shape compared to CaCO3 agent.

1. Introduction

Metal foams, which are porous metals, are a relatively new material and are increasingly being used in various industries. The most common material for the production of metal foams is aluminium due to its low density, relatively low melting temperature, and good specific strength. To further reduce the aluminium density, the porous structure is obtained by different methods and agents depending on whether an open or closed cell structure is required. A porous structure is an imitation of natural materials such as bones, leaves, rocks, or trees, which have optimal properties for a certain structural or functional purpose [1]. By choosing the material and varying the volume fraction and type of cells, it is possible to achieve the required properties for a specific application.
Compared with ordered porous metals, such as honeycomb materials and three-dimensional (3D) lattice materials, the cell distribution of metal foam prepared by the melt foaming method shows a high degree of randomness. The advantage of ordered porous metal materials is that the arrangement is well periodic, and it is easy to calculate the mechanical properties, but the production cost is relatively high. The melt foaming method is a simple and cost-effective technique for preparing metal foams, but it is difficult to accurately know the mechanical properties of a foam that mainly depend on factors such as porosity, cell size, and distribution, as well as cell wall morphology [2].
The great potential of using foams for structural purposes is in the automotive, railway, and aerospace industries, where they can be used as load-bearing parts, most often in the form of sandwich composites with metallic sheets as outer layers and a foamed matrix. In these cases, the foam core slightly increases the weight of a specific part but considerably increases its stiffness. The use of metal foams in these industries is very important nowadays as there is more and more talk about environmental pollution from internal combustion engines (ICEs), so the use of these materials reduces the mass of various road and rail vehicles, as well as airplanes and spacecraft. With the reduced weight, the fuel consumption is lower and there is less environmental pollution. Unlike vehicles with ICEs, electric vehicles do not have problems in terms of exhaust gases, but even with those vehicles, the lowest possible mass is desirable so that it can travel as far as possible on one charge. Due to their good energy absorption, foams can also be used for crash-boxes in road and railway vehicles and as supports for engine blocks or bases of various machines to reduce vibrations [3,4,5,6]. Energy absorption is also an important property for applications in war-torn areas, where the use of metal foam core sandwich panels can reduce the number of casualties and property damage in the event of an artillery or firearm attack. The same principle is applicable to the protection of spacecraft, where even small orbital debris travelling at very high speeds can cause significant damage [7]. A very promising area for the application of metal foams is the medical industry, provided that the foam material is biocompatible or biodegradable. By using such foamed metals for making implants or prostheses, which are harmless to the human body, it is possible for the tissue to grow into the foam cells resulting in a better connection between the natural and the implanted material. Furthermore, by varying the degree of porosity, it is possible to achieve an elastic modulus as similar as possible to the modulus of the bone [4,5,8,9].
One of the most promising functional applications is in the thermal industry, where metal foams can have different applications such as heat sinks [10,11] or for thermal energy storage systems [12]. One of the goals of the European Union, nearly zero-energy buildings, can also incorporate metal foams. To reduce energy consumption in such buildings, metal foam panels can be used in heating and cooling systems by using thermo-active aluminium foam roofing, which has efficient heat exchange between the environment and the medium for heating or cooling the interior. In the interior, foamed ceiling panels for heating/cooling impregnated by low thermal conductivity phase change materials can be installed [13,14]. Open-cell foams can also be used as filters for fluid purification, so by choosing the foam with a certain pore size, it is possible to separate particles of a different size from polluted fluids [15,16].
For the melt foaming method, the most frequently used agent is titanium hydride (TiH2) [17,18,19], which dissolves into titanium (Ti) and hydrogen (H2) when heated to temperatures above 465 °C. At that temperature, H2 is released from solid material and creates cells in aluminium. However, TiH2 has disadvantages, and one of them is that its density (3.75 g/cm3) is significantly higher than the density of aluminium (2.7 g/cm3). During its application and under the influence of gravity, TiH2 particles can accumulate in the lower part of the mold which results in a non-uniform distribution of cell sizes and shapes. The disadvantage of TiH2 is also the relatively low dissolution temperature, significantly below the solidus temperature of commercial Al alloys [20]. Alternatives to TiH2 are carbonate-based foaming agents, such as calcium carbonate (CaCO3), magnesium carbonate (MgCO3), dolomite (CaMg(CO3)2), and similar carbonates [18,21,22,23,24]. Unlike TiH2, which dissolves into Ti and gaseous H2 and does not increase the stability of the aluminium foam, dissolving carbonates creates solid particles, such as calcium oxide (CaO), aluminium oxide (Al2O3), and aluminium carbide (Al4C3), that increase the stability of the foam [25]. Kevorkijan [26] represented the disintegration of CaCO3:
CaCO3(S) → CaO(S) + CO2(G)
Therefore, the gas responsible for the foaming process when using CaCO3 is carbon dioxide (CO2). Additional reactions which occur during CaCO3 decomposition are as follows:
2Al(L) + 3CO2(G) → Al2O3(S) + 3CO(G)
8Al(L) + 3CO2(G) → 2Al2O3(S) + Al4C3(S)
This forms an oxide layer on the cell walls, which results in a finer morphological structure of the foam [27]. In the same paper it was evaluated that when hydrides were used as foaming agents, brittle intermetallic phases were formed which interfered with the ductility of the material. For example, TiH2 forms Al3Ti, which is a brittle compound, and due to this, the energy absorption capability is lower than that of the foams produced by CaCO3. By differential thermal analysis (DTA) and thermogravimetric analysis (TGA) of CaCO3 powder, it can be confirmed that its decomposition begins at a temperature of 650 °C and ends at around 900 °C [28]. As a result of that, foaming of CaCO3 foams needs to be performed at slightly higher temperatures compared to TiH2 foams. Since the decomposition of TiH2 begins at much lower temperatures [20], by the time aluminium is in a molten state, a large amount of the agent has been converted into H2 [29]. With higher quantities of gas produced, small cells merge into larger ones. To move the decomposition temperature of TiH2 closer to the aluminium melting point, the foaming agent can be pre-heat treated. The result of the later formation of H2 is a lower number of merged cells, so the final morphology consists of a larger number of smaller cells [30,31]. Compared with CaCO3 at the same temperature and pressure, TiH2 releases approximately twice the amount of gas [32]; therefore, for the same foam porosity a larger quantity of CaCO3 should be added. In addition to the quantity of foaming agent, attention should also be paid to the size of these particles [25,33]. Larger CaCO3 powder particles contribute to higher porosity, but the density, relative density, and compressive strength decrease [34,35]. The advantage of CaCO3 foaming agent compared to TiH2 is also the much lower price, which significantly reduces the production costs of aluminium foams [20,36,37].
To get an insight into the structure of the foam, i.e., the size, arrangement, and number of cells, the sample needs to be cut, which eliminates the possibility of subsequent examinations. For non-destructive testing of the foam macrostructure, it is possible to use computed tomography (CT). X-ray CT analysis allows for the observation and study of the microstructure of foams and their virtual 3D representation, which has been the focus of recent available studies. However, its application combined with finite element analysis (FEA) brings great potential and has been documented by some authors in varying degrees [38,39,40,41,42]. Through CT scans, 2D projection images are obtained in which each pixel represents the level of attenuation of X-rays during scanning on an eight-bit gray scale, i.e., from 0–255 or 256 different values of gray (28 = 256). Afterwards, they are used to mathematically reconstruct a 3D volume that represents the real foam specimen. On the obtained 3D models, any cross-section of the sample can be analysed [43,44,45]. Subsequently, those samples can be subjected to mechanical testing or exploitation since they were not destroyed during testing. Recently, with the improvement of experimental devices for in situ mechanical tests within the CT device itself, the digital volume correlation (DVC) method was developed [46,47]. By using the standard digital image correlation (DIC) deformation measurement method, information is obtained only on the deformation of the sample surface. By applying the DVC method, the internal structure behavioral data are also obtained, since CT scanning of the sample is performed during the entire loading process. By applying such a method during compression or tensile testing, it is possible to gain an insight into the deterioration of the internal cell walls of the porous sample [48,49,50,51].
Focusing on closed-cell aluminium foams, the aim of this article is to investigate the influence of different foaming agents on the morphology of cellular structures. Along with different foaming agents (CaCO3 and TiH2), the amount of CaCO3 powders was also varied. After compacting into precursors and foaming, the samples were scanned on a CT device and the scanned models were analysed in appropriate software.

2. Materials and Methods

Aluminium powder (99.7 wt.% purity, Mepura, Renshofen, Austria) with the average grain size of 37 μm and CaCO3 powder (98.5 wt.% purity, Gram-Mol, Zagreb, Croatia) as a foaming agent in quantities of 3 and 5 wt.% were used to make the precursor. Two mixtures with different quantities of CaCO3 powder were mixed in a Turbula type T2F shaker mixer (WAB, Basel, Switzerland) for 60 min to achieve a homogeneous mixture. After mixing, the powders were compacted by cold isostatic pressing (CIP) at 150 MPa (room temperature) and were subsequently hot extruded at a temperature of 400 °C with the ram speed of 0.4 mm/s to achieve a high density. The extruded precursors had a rectangular cross-section with dimensions 5 mm × 20 mm, Figure 1.
The same mass of precursor materials was placed in the molds to obtain foams of approximately the same density. To compare the cell size and its number with the samples foamed with TiH2, equal quantities of commercially available AlMgSi0.6 alloy precursor with 0.4 wt.% TiH2 were used. The closed molds were placed in an electric furnace preheated to 750 °C for approximately 10 min until the end of the foaming process. After the molds were taken out of the furnace they were cooled with compressed air. The mass and volume of the foamed samples were measured to determine the degree of porosity, density, and relative density (ρrel) in relation to a monolithic (non-porous) aluminium.
The prepared samples were then scanned by a computed tomography (CT) method on a Nikon XT H 225 (Nikon, Tokyo, Japan) with a voxel resolution of 62 μm that ensures the detection of the thinnest cell walls. The voxel size of CT scans generally depends on the sample size, its location between the X-ray source and its detector, and the size of the detector. The sample must remain within the complete view of the detector and conical X-ray beam. For scanning the samples, a voltage of 180 kV and a current of 100 μA was applied. The obtained models were processed in the VGSTUDIO MAX 2022.4.1 software (Volume Graphics GmbH, Heidelberg, Germany) with the foam/powder analysis additional module.
With the aim of researching the cell morphology, properties such as volume, sphericity, compactness, and equivalent diameter were analysed and compared for all 3 types of samples. All tests were performed on 2 samples from each group.
Sphericity indicates the ratio between the surface of a sphere with the same volume as the cell (Asphere) and the surface of the cell (Acell) [52]:
S p h e r i c i t y = A s p h e r e A c e l l
Equivalent diameter (deq) is the diameter of a sphere that has the same volume as the cell.
Compactness can be expressed as a ratio between the volume of the cell (Vcell) and the volume of the circumscribed sphere (Vsphere) [52]:
C o m p a c t n e s s = V c e l l V s p h e r e
Both the surface and the volume of cells were analysed in the software, the volume being calculated based on the number and the size of voxels within each individual cell. The surface of the cell is defined by the outward-facing surfaces of these voxels. The cells with more regular shapes will have a sphericity and compactness closer to 1. Value 1 indicates a cell with an ideal circular shape.

3. Results and Discussion

3.1. Precursor Density

To determine whether the produced precursors are sufficiently compacted so that there is no release of CO2 gas outside the material during the foaming process without successful foaming, the density of compacted precursors with 3 and 5 wt.% CaCO3 was measured using the Archimedes principle on an analytical balance type JP703C (Mettler Toledo, Zürich, Switzerland). Relative density of the precursor (ρrel,prec) was calculated using the equation:
ρ r e l , p r e c = ρ m e a s u r e d ρ t h e o ,   %
where ρtheo is the theoretically calculated density based on Al and CaCO3 density values of 2.7 g/cm3 and 2.71 g/cm3, respectively. Measured, theoretical, and relative density values of compacted precursors with 3 and 5 wt.% CaCO3 are shown in Table 1.
For successful foaming of samples, it is necessary to achieve a relative density of the precursor higher than 98% [53] so that the gas does not escape outside the sample during foaming but remains trapped inside the aluminium matrix. Since relative precursor densities of more than 99% were achieved, the precursors were successfully compacted.

3.2. Foam Properties

For determining the sample density, relative density, and porosity, the mass was weighted on a precision balance type WLC 1/A2/C/2 (Radwag, Radom, Poland), and volume was calculated from sample dimensions, as shown in Table 2. The foam density (ρf) was calculated as a mass (mf) and volume (Vf) ratio. Relative density (ρrel) of samples was determined by the equation:
ρ r e l = ρ f ρ A l
where ρAl is the Al density (2.7 g/cm3). Porosity of the samples, expressed as a percentage, follows from the Equation (8):
P o r o s i t y = 1 ρ r e l · 100 ,     % .
The produced samples of aluminium foams with 3 and 5 wt.% CaCO3 and 0.4 wt.% TiH2 are shown in Figure 2 and their properties are presented in Table 2.
Table 2 shows that samples foamed with different amounts of CaCO3 have approximately the same degree of porosity, cca. 80%, while samples foamed with TiH2 have slightly higher porosity, cca. 84.5%.

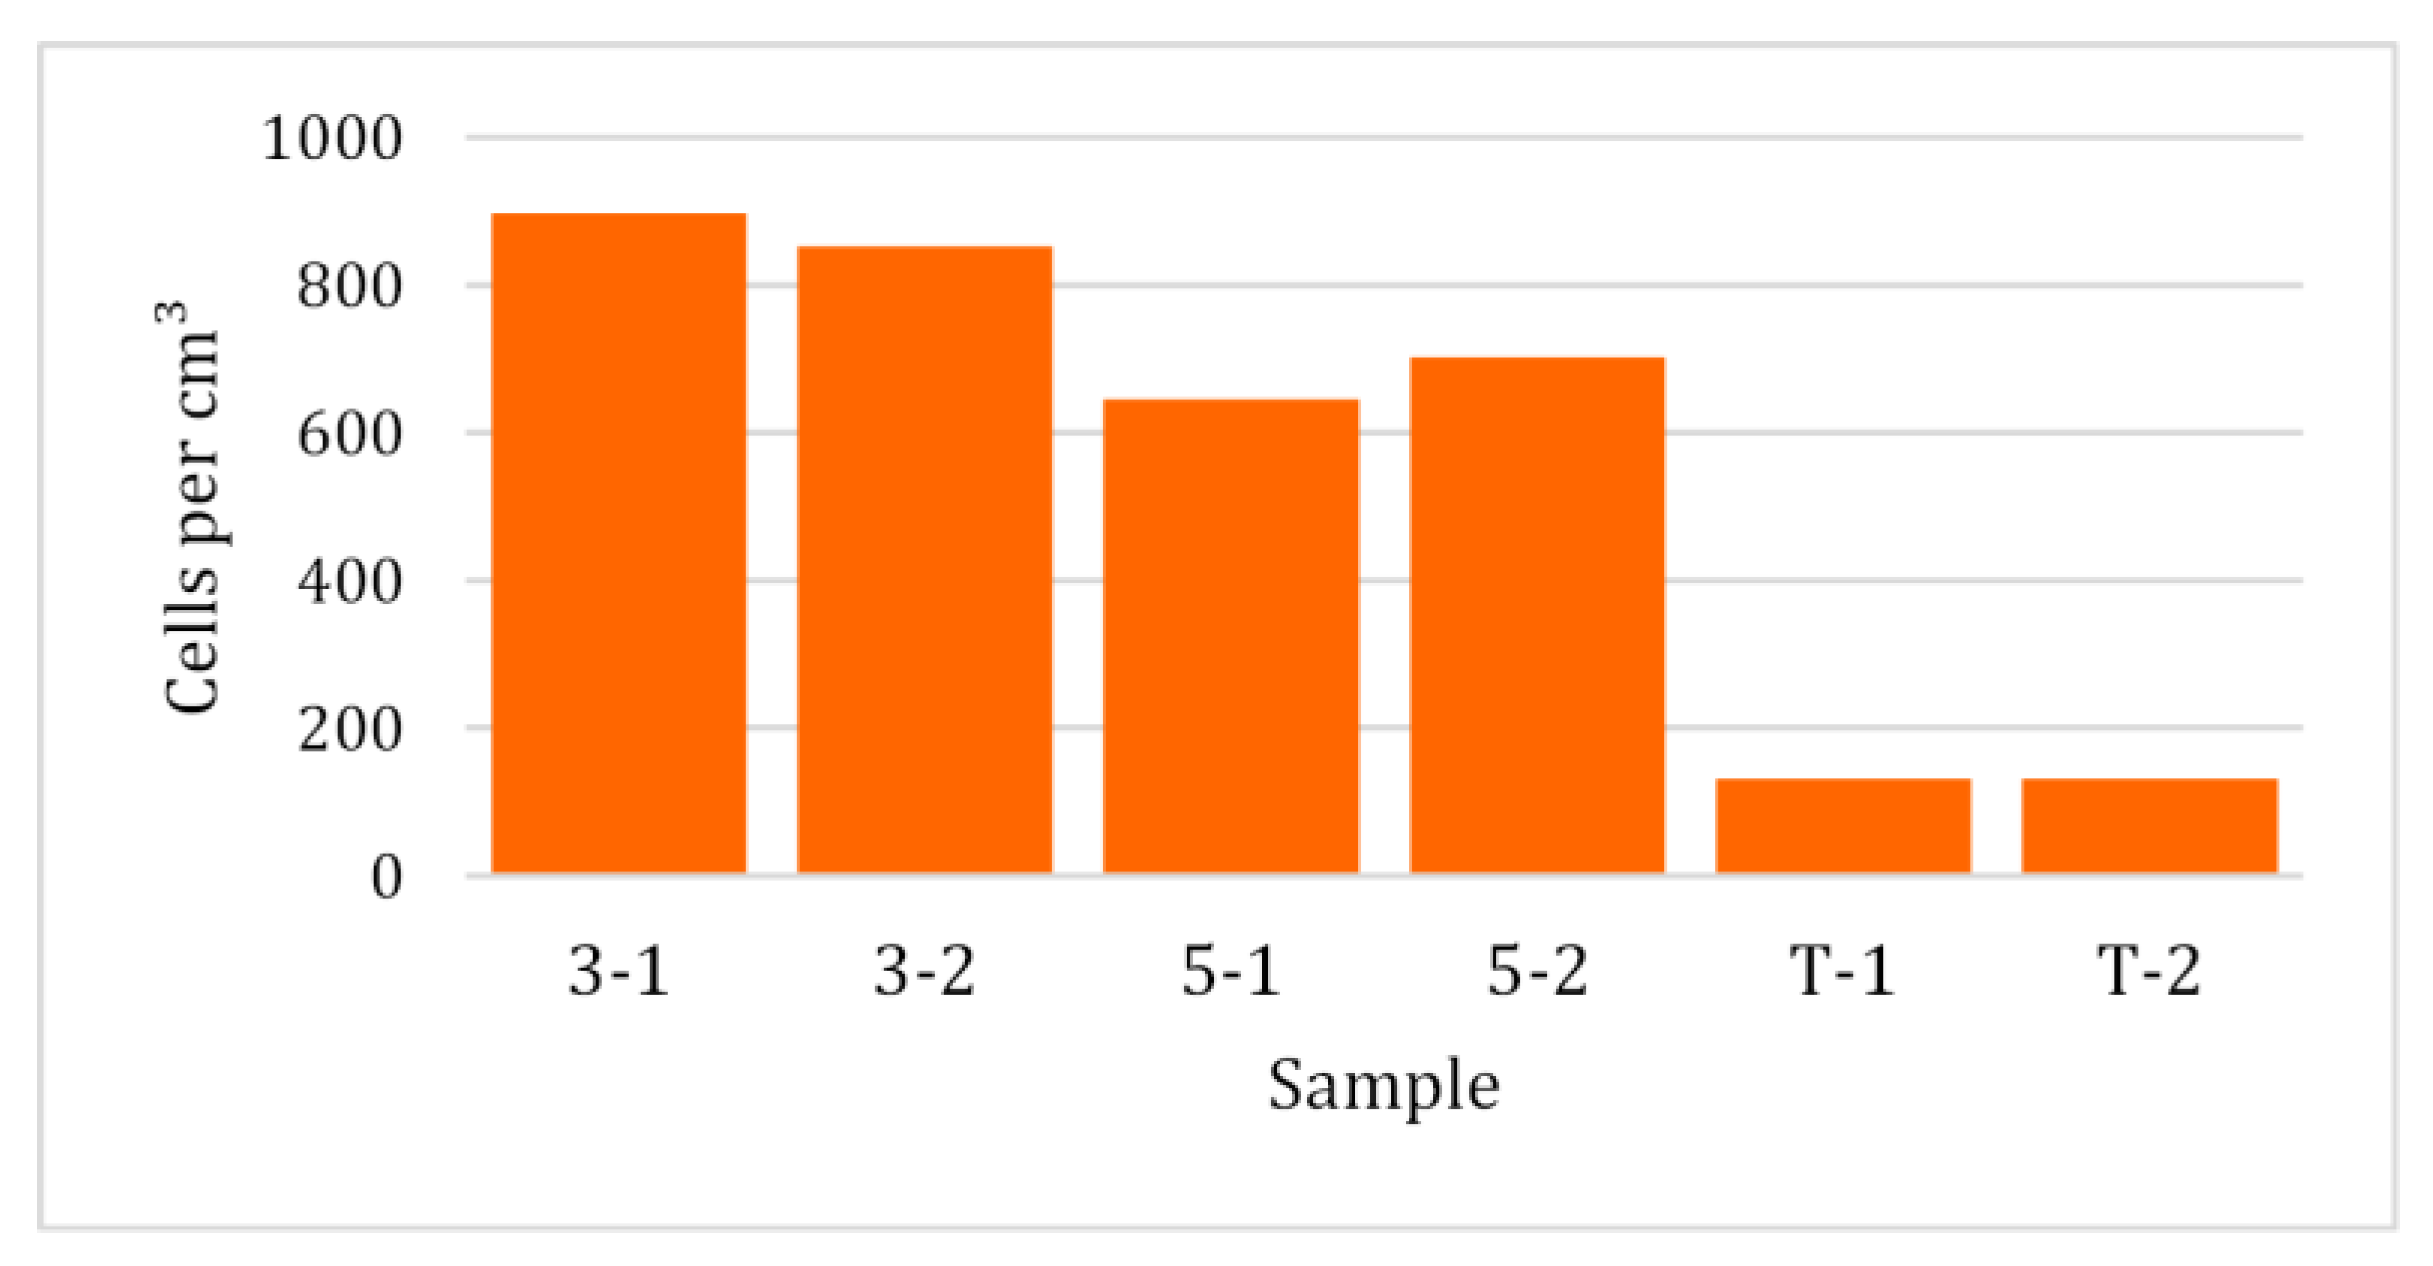
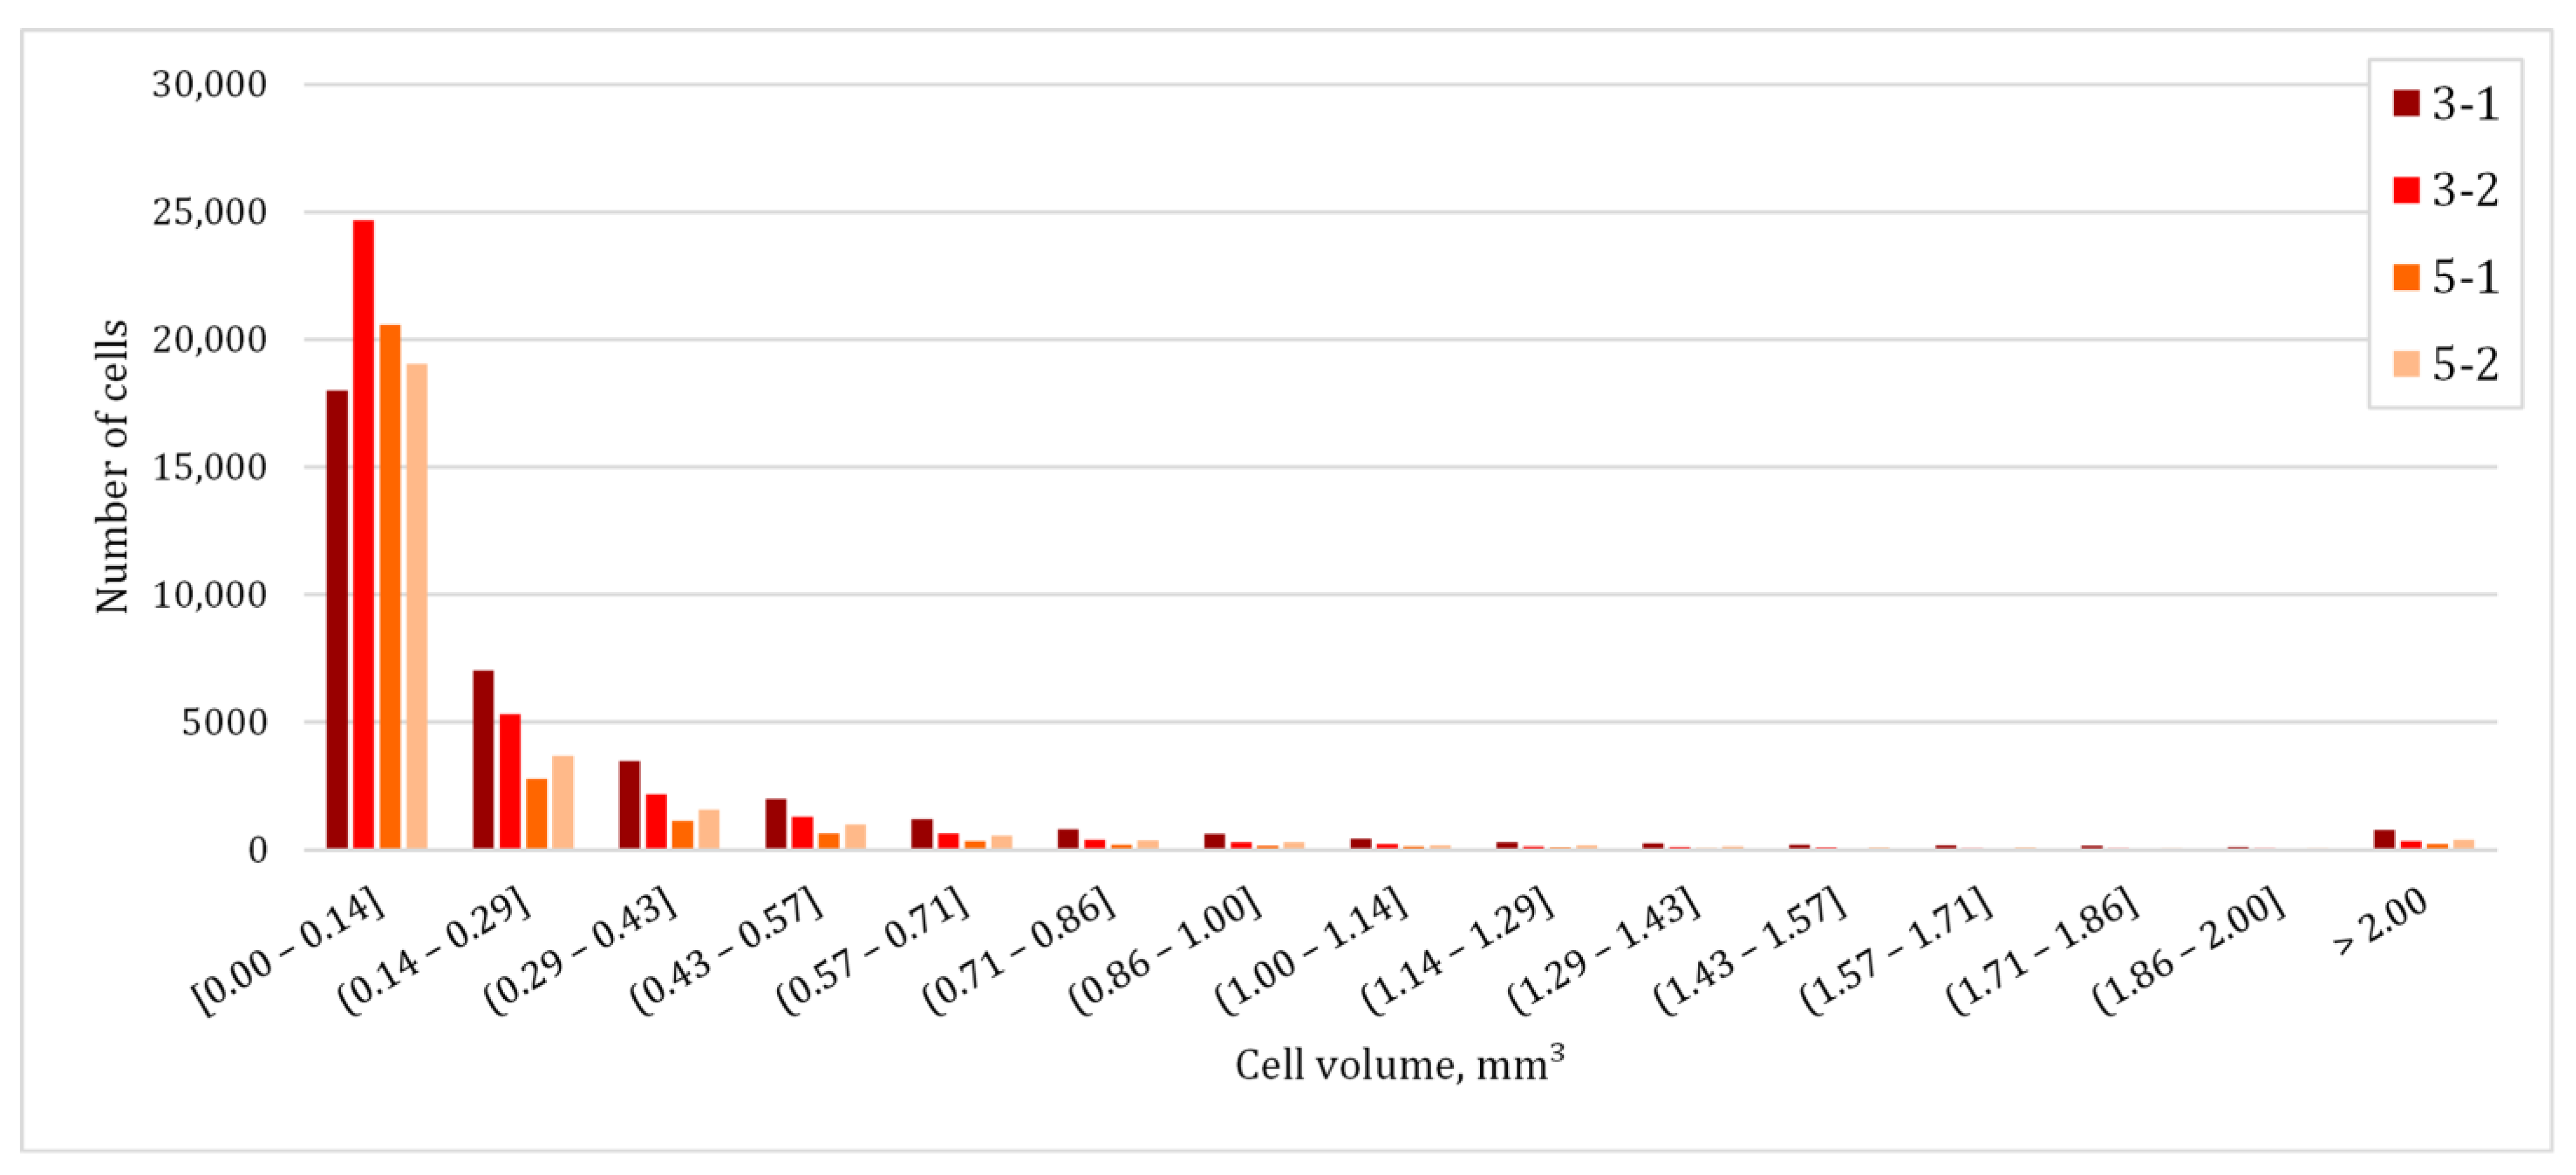
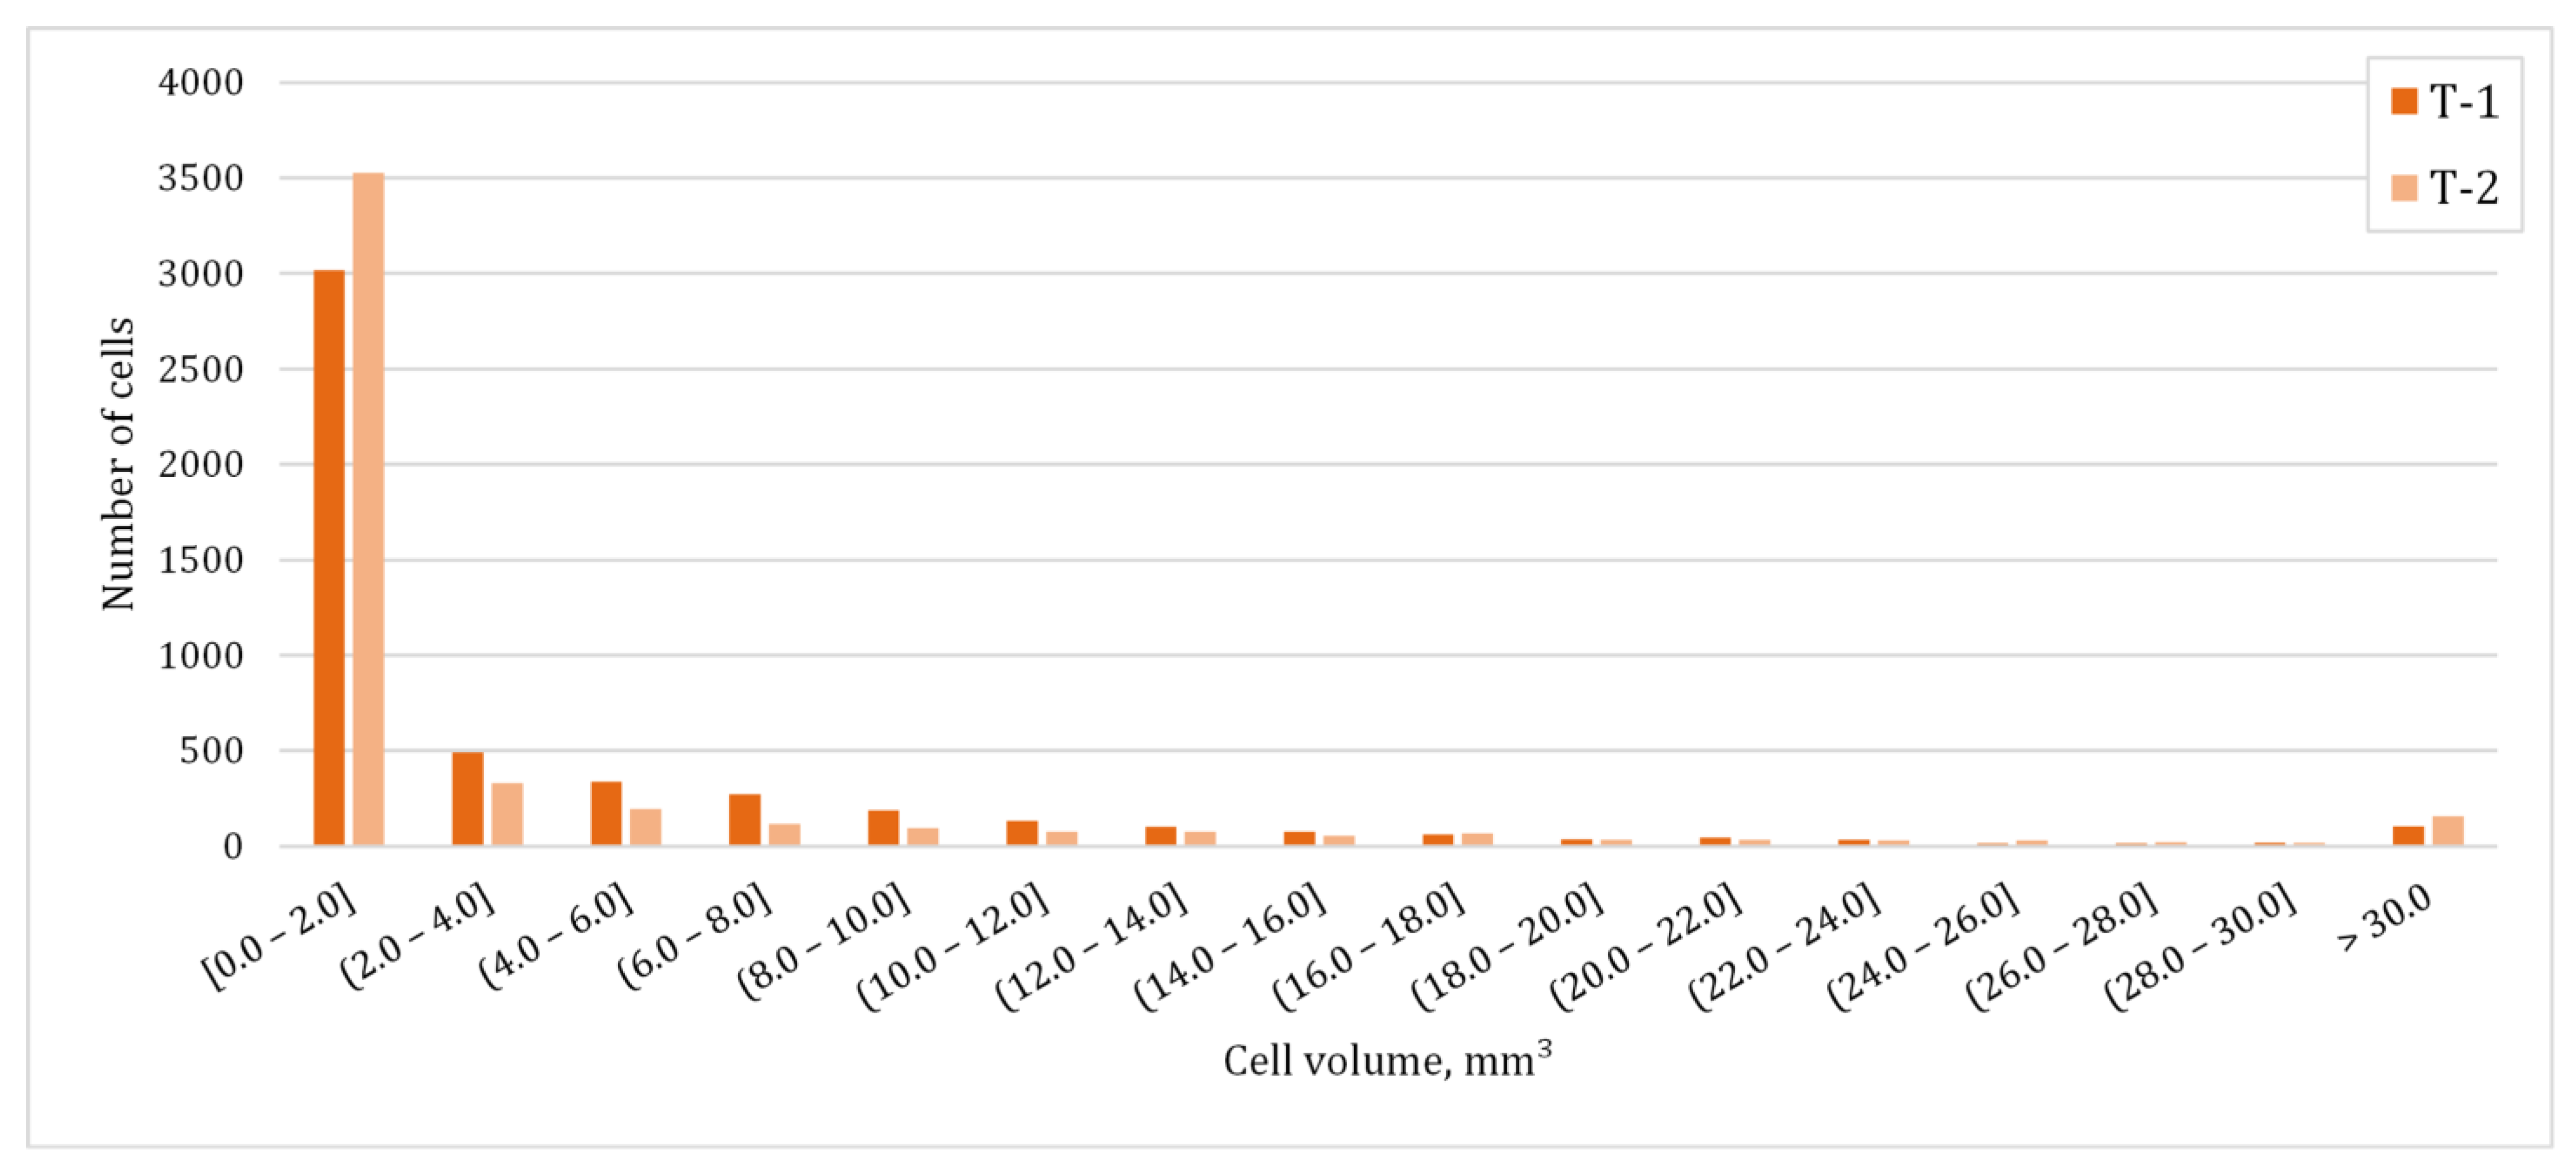
3.3. Number and Volume of Cells

After foaming, the samples were scanned in a CT device which enabled non-destructive analysation of cell morphology. Figure 3 shows CT scans of samples foamed with different quantities of CaCO3 and TiH2 agents.
By analysing the models of scanned samples in the VGSTUDIO MAX software, shown in Figure 4, an insight into the cell sizes and their number was obtained, as shown in Table 3. To determine the boundaries between the foam walls and cells, a threshold was adjusted from the obtained histogram. The largest cell volume in foams with 3 and 5 wt.% CaCO3 is 34.49 mm3 and 38.50 mm3, respectively, while in foams with 0.4 wt.% TiH2, this volume even exceeds 420 mm3.
Table 3 shows that samples made with CaCO3 have a much higher overall number of cells compared with samples T-1 and T-2. The average cell volume in foams with CaCO3 is very small (cca. 0.23 mm3), and its value in foams with TiH2 is several times higher (cca. 4.45 mm3).
Due to different numbers of cells and a certain deviation in the sample volume, distribution of cell number per volume unit gives a clearer insight into foam morphology (Figure 5). The samples with 3 wt.% CaCO3 have the largest number of cells per volume unit, while in samples foamed with TiH2 this number is significantly lower. Since the decomposition of TiH2 begins at temperatures around 430 °C [36], and the foaming temperature was 750 °C, the release of H2 started much earlier and a larger amount of gas was created. As a large amount of H2 was released while the aluminium matrix was still in a solid state, the gas broke the boundaries of the extruded aluminium powder and the cells merged and grew [36]. Unlike TiH2, the decomposition of CaCO3 starts at higher temperatures [20], so most of the cells were created in a molten state. The high number of small cells in CaCO3 foams is also a result of the release of CO2 which enables the formation of the Al2O3 layer on the inner cell walls and prevents the growth, merging, and spheroidisation of cells. Due to the larger amount of H2 formed, the degree of porosity of TiH2 foams is slightly higher compared to the porosity of CaCO3 foams (Table 2).
Figure 6 and Figure 7 show the cell volume distributions for samples with 3 wt.% CaCO3, 5 wt.% CaCO3, and 0.4 wt.% TiH2. It is evident that in sample 3-1, approximately 50% of all cells have a volume of up to 0.14 mm3, while in sample 3-2 this percentage is even slightly higher (68.8%). An extremely small number of cells have volumes larger than 2.00 mm3 (2.2% for sample 3-1), and only 0.9% in the sample 3-2. In samples with 5 wt.% CaCO3, the total number of cells is slightly lower (Table 3) but their percentage with a volume of up to 0.14 mm3 is larger; 77.7% for sample 5-1 and 68.9% for 5-2. There are also several cells formed with a volume that exceeds 2.00 mm3; in sample 5-1 this percentage is only 0.9%, and in sample 5-2 it is 1.4%.
Unlike the previous samples, those that are made with TiH2 as a foaming agent have much larger cells (Table 3). Cell volume distributions for samples T-1 and T-2 are shown in Figure 7. While in the foams with CaCO3 more than 97% of the cells have a volume smaller than 2.00 mm3, in foams T-1 and T-2 this percentage is 61.0% and 72.6%, respectively. In these foams, there are several cells that have a volume larger than 30 mm3, up to approximately 420 mm3.

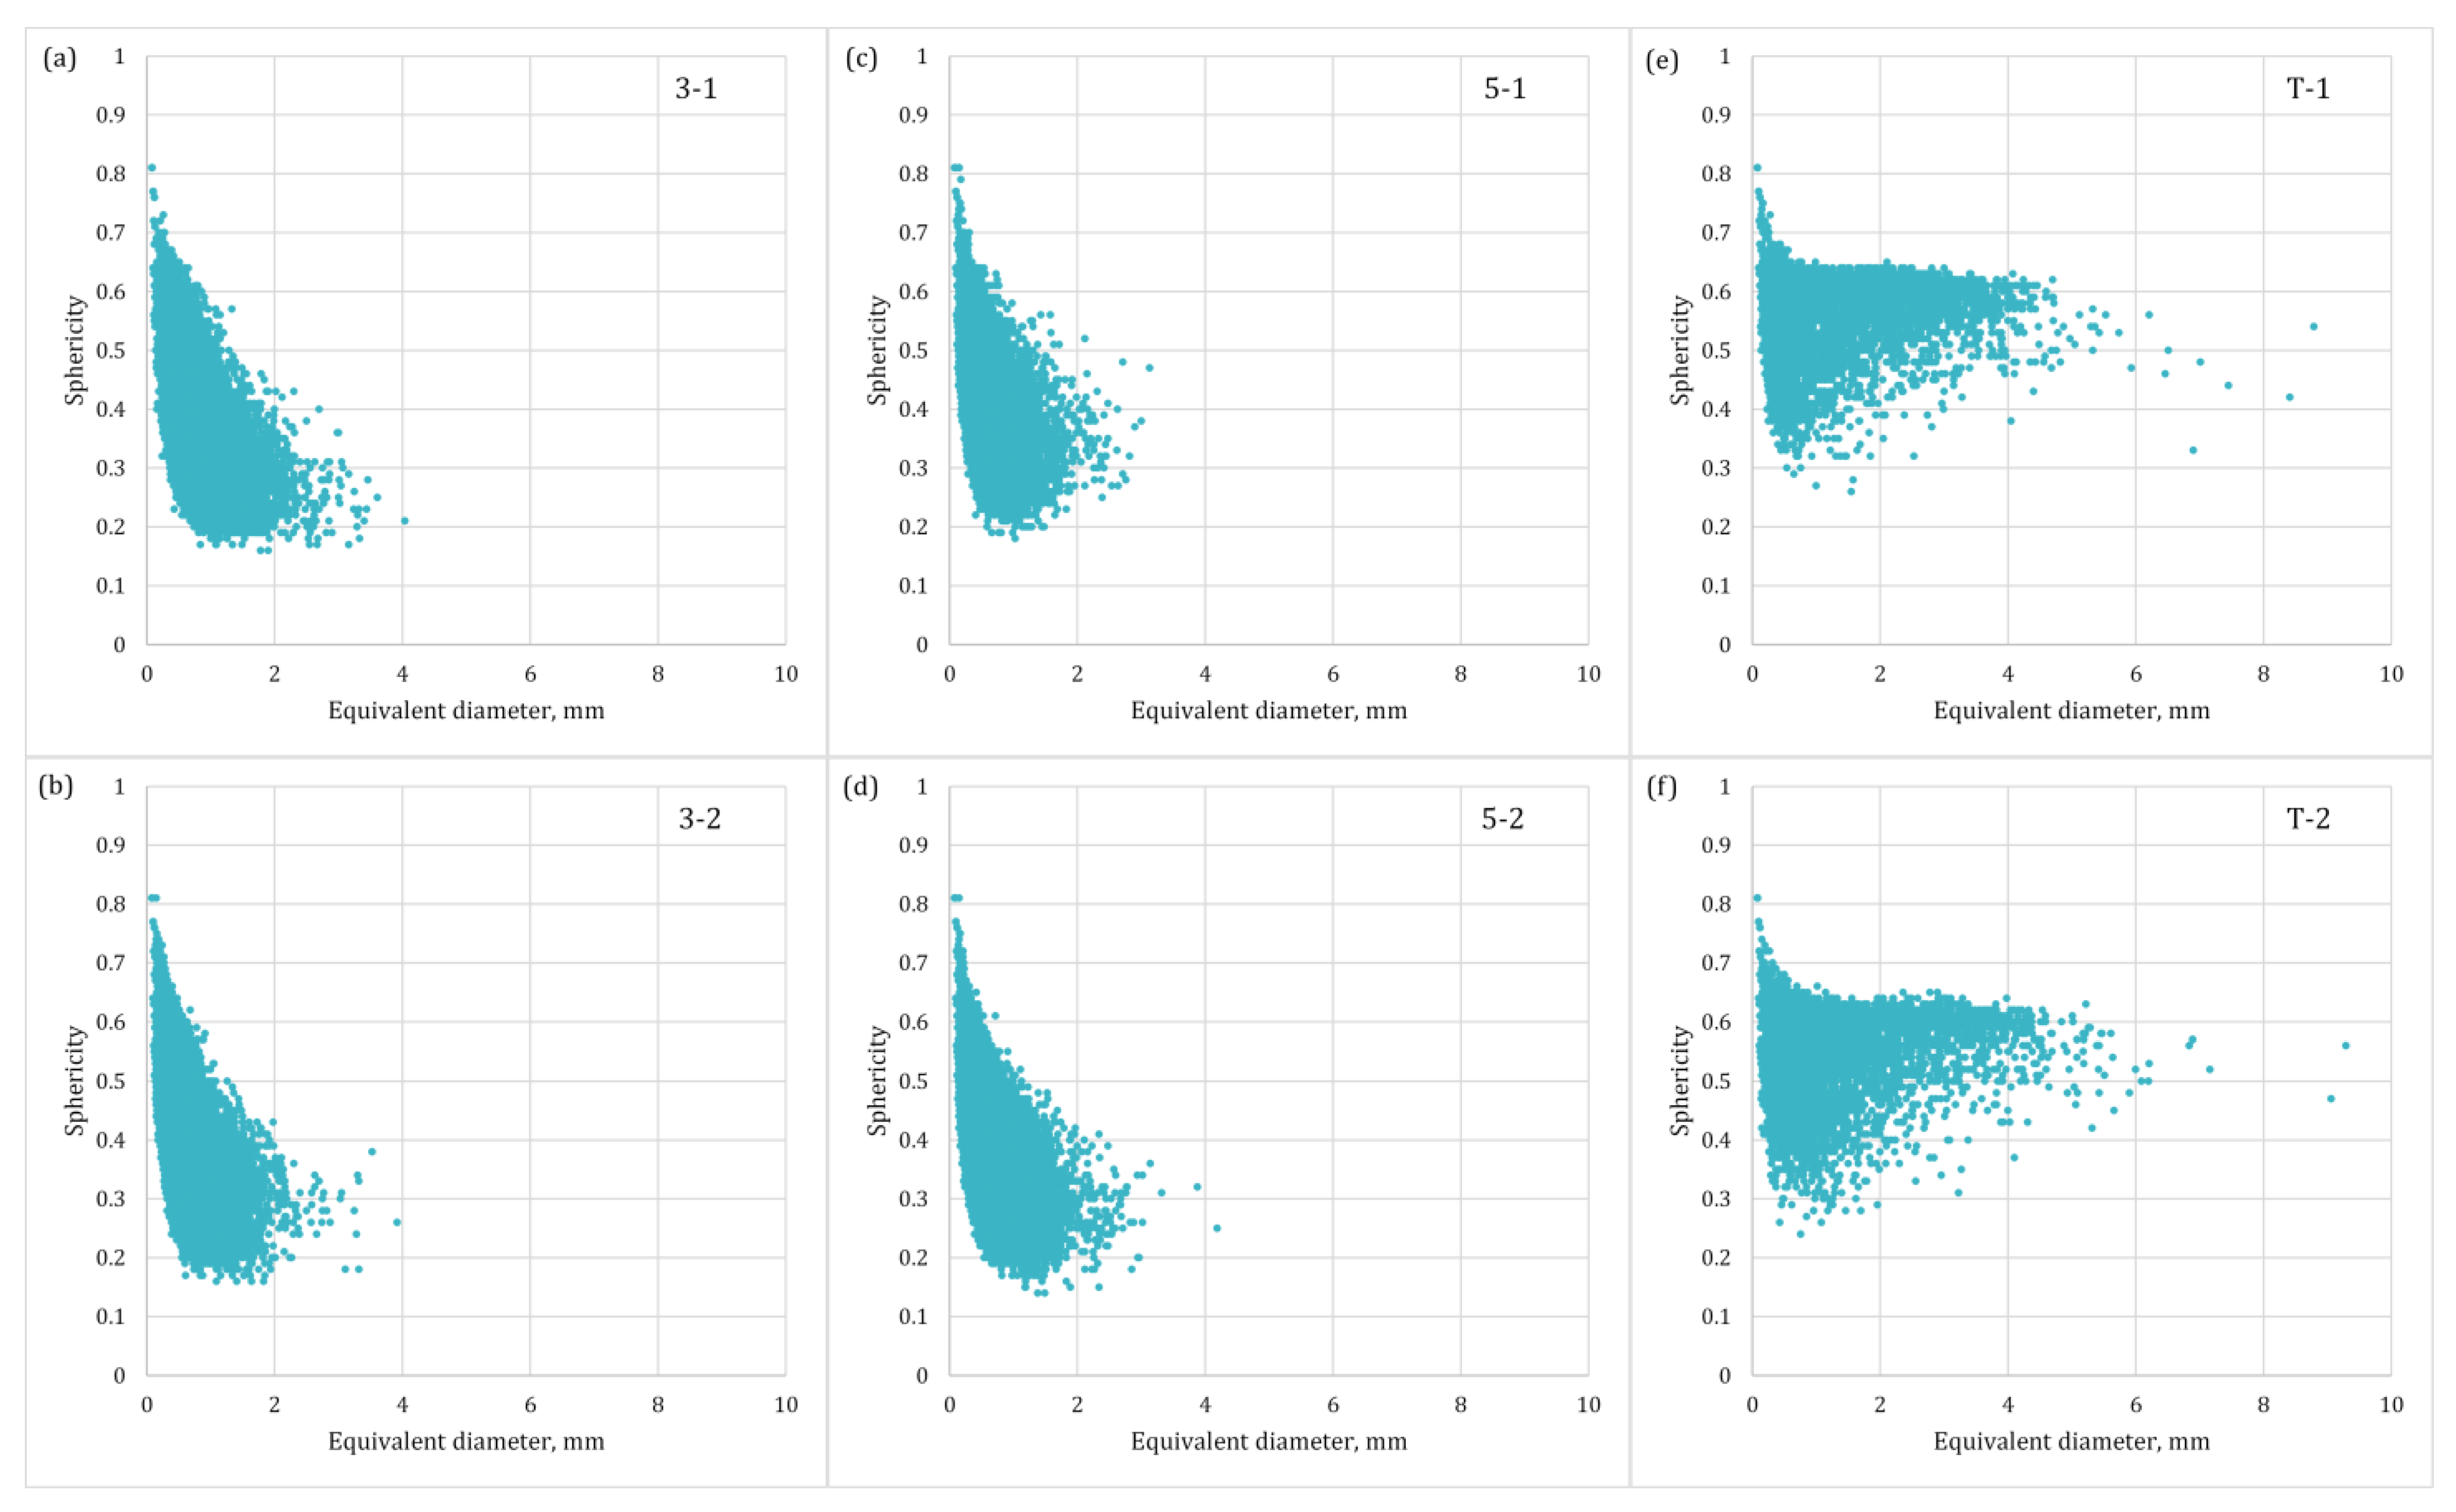
3.4. Cell Sphericity and Equivalent Diameter

To consider the regularity of cell shape, sphericity and equivalent diameter were determined and their relation is shown in Figure 8.
In the case of samples foamed with CaCO3 (Figure 8a–d), the largest equivalent diameters reach up to 4 mm, and their mean value is 0.70 mm for sample 3-1 and 0.54 mm for sample 3-2, and for samples 5-1 and 5-2 the average diameter is 0.43 mm and 0.52, respectively. The mean value of sphericity of these foams is from 0.4 to 0.49. Conversely, in foams T-1 and T-2 (Figure 8e,f), the largest equivalent diameters reach up to 9 mm, and their mean values are 1.36 mm and 1.17 mm, respectively. The sphericity mean value is also higher (0.57 for T-1 and 0.55 for T-2). It is evident from Figure 8 that the samples with CaCO3 have some cells with a sphericity even lower than 0.2, while this is not the case with foams T-1 and T-2 with cells of a more regular circular shape. It follows that CaCO3 foaming agent produces cells of a more irregular, elongated shape, and this is why their mean sphericity has lower values. It can also be observed that smaller cells, i.e., the ones with a smaller equivalent diameter, have a more regular shape (the sphericity value is closer to one).

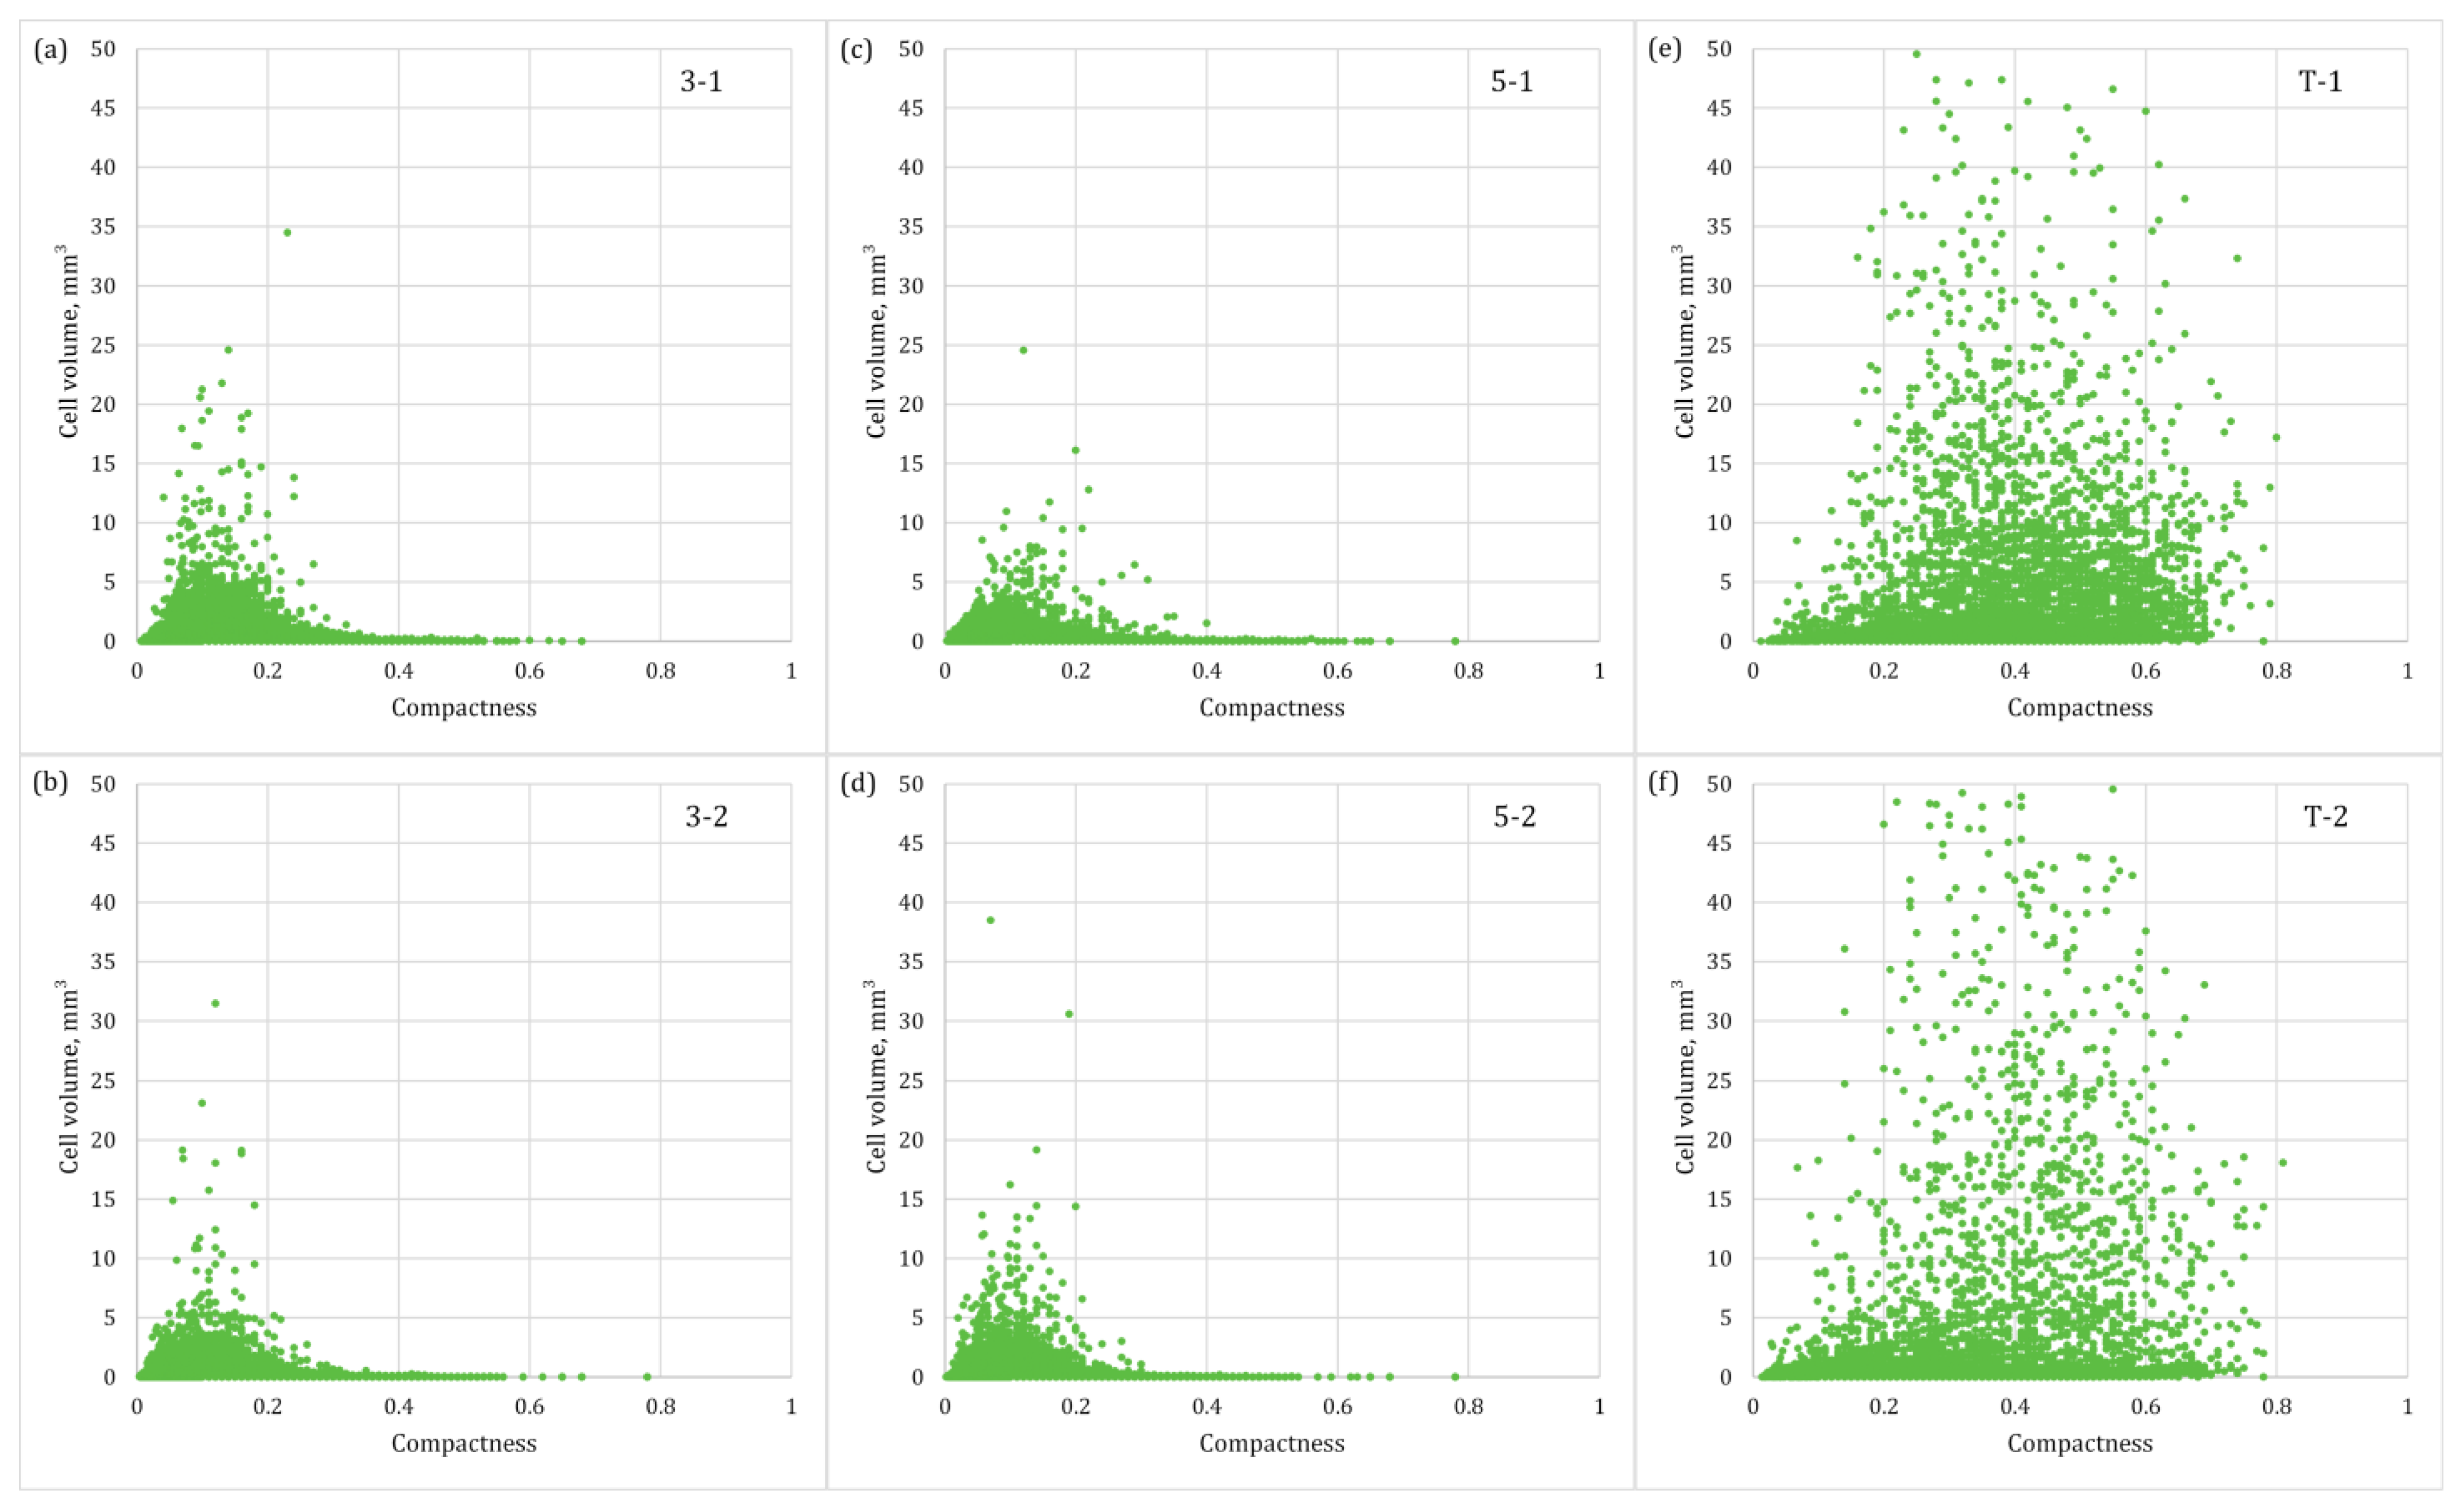
3.5. Cell Volume and Compactness

As already mentioned in Section 3.3, foams produced with CaCO3 have much smaller cell volumes compared to samples foamed with TiH2. Their volume as a function of compactness of cells is shown in Figure 9.
The diagrams show only cells with a volume of up to 50 mm3 (there are no cells with a larger volume in the CaCO3 samples, and only a few in TiH2 samples) to clearly compare the distribution of compactness for the different samples. The cell compactness average value of samples with 3 and 5 wt.% CaCO3 is very low at 0.12 and 0.14, respectively, as well as the average cell volume. The morphology of TiH2 foams is quite different. Their compactness value is 3 times larger (average value: 0.35 for T-1 and 0.38 for T-2) while the average cell volume is even 30 times larger. It is evident from Figure 9e,f that cell volume values in TiH2 foams are more scattered across the diagram (wide variety of volumes), which is not the case with CaCO3 foams (Figure 9a–d) with mean volumes of 0.15–0.34 mm3. In all samples there are several cells with volumes much larger than the average value; in CaCO3 foams, the largest cell has a volume of 38.50 mm3, while in TiH2 foams the largest volume achieves even 420.33 mm3. This is the result of earlier decomposition of foaming agents and the creation of larger amounts of gas. It implies that in TiH2 foams there are large localities without cell walls which are important for taking over mechanical stresses during loading. These localities will be characterised by weaker mechanical resistance, and they are susceptible to wall deformation and cell deterioration under stress.

4. Conclusions

In this article, the X-ray-computed tomography method was used to analyse the morphology of aluminium foams. The method is non-destructive and consists of three-dimensional scanning of the samples and subsequent analysis of the obtained models. Since the samples in this process are not destroyed, it is possible to use them for further mechanical examinations or for industrial applications.
Aluminium precursors with CaCO3 (3 and 5 wt.%) and TiH2 (0.4 wt.%) were produced by the powder metallurgy process using the cold isostatic pressing and hot extrusion which resulted in a highly compacted material with a porosity smaller than 1%. Molds were filled with the same quantity of precursors and then foamed in an electric furnace to obtain the samples with similar density and porosity. Based on the analysis of the influence of different foaming agents on the cell morphology, the following can be concluded:
  • CaCO3 foaming agent causes the formation of a larger number of smaller cells compared to TiH2 agent. This can be attributed to the higher temperatures needed for its decomposition into gas and formation of an oxide layer on the inner cell walls, which prevents cell growth and their fusion during foaming. Thus, CaCO3 agent enables the formation of structures with a larger total length of cell walls.
  • An increase in the wt.% of CaCO3 results in somewhat larger cells for the same degree of porosity.
  • The cell sphericity in foams made with CaCO3 increases by reducing the equivalent cell diameter, which is not the case for samples foamed with TiH2.
  • Materials foamed with TiH2 have 7% higher porosity because the decomposition started at lower temperatures, thus enabling more gas to be released, and contains cells of more regular circular shape, as indicated by the values of sphericity and compactness closer to one.

Author Contributions

Conceptualisation, T.R. and D.Ć.; methodology, T.R. and D.Ć.; software, T.R.; validation, T.R., D.Ć. and Ž.A.; formal analysis, T.R.; investigation, T.R.; resources, T.R., D.Ć. and Ž.A.; writing—original draft preparation, T.R.; writing—review and editing, D.Ć.; visualisation, T.R.; supervision, D.Ć.; funding acquisition, D.Ć. and Ž.A. All authors have read and agreed to the published version of the manuscript.

Funding

This research received no external funding.

Data Availability Statement

The data presented in this study are available upon request from the corresponding author.

Acknowledgments

The authors would like to thank Volume Graphics GmbH for providing the VGSTUDIO MAX license.

Conflicts of Interest

The authors declare no conflict of interest.

References

  1. Banhart, J. Manufacture, Characterisation and Application of Cellular Metals and Metal Foams. Prog. Mater. Sci. 2001, 46, 559–632. [Google Scholar] [CrossRef]
  2. Wang, L.; Jiang, K.; Yang, D. Compression Behavior of Metal Foams with Real Pore Structures Through CT Scan Images. J. Iron Steel Res. Int. 2022, 29, 1886–1897. [Google Scholar] [CrossRef]
  3. Hanssen, A.G.; Stöbener, K.; Rausch, G.; Langseth, M.; Keller, H. Optimisation of Energy Absorption of an A-Pillar by Metal Foam Insert. Int. J. Crashworthiness 2006, 11, 231–242. [Google Scholar] [CrossRef]
  4. Lefebvre, L.-P.; Banhart, J.; Dunand, D.C. Porous Metals and Metallic Foams: Current Status and Recent Developments. Adv. Eng. Mater. 2008, 10, 775–787. [Google Scholar] [CrossRef] [Green Version]
  5. García-Moreno, F. Commercial Applications of Metal Foams: Their Properties and Production. Materials 2016, 9, 85. [Google Scholar] [CrossRef]
  6. Parveez, B.; Jamal, N.A.; Maleque, A.; Yusof, F.; Jamadon, N.H.; Adzila, S. Review on Advances in Porous Al Composites and the Possible Way Forward. J. Mater. Res. Technol. 2021, 14, 2017–2038. [Google Scholar] [CrossRef]
  7. Cherniaev, A. Modeling of Hypervelocity Impact on Open Cell Foam Core Sandwich Panels. Int. J. Impact. Eng. 2021, 155, 103901. [Google Scholar] [CrossRef]
  8. Singh, R.; Lee, P.D.; Jones, J.R.; Poologasundarampillai, G.; Post, T.; Lindley, T.C.; Dashwood, R.J. Hierarchically Structured Titanium Foams for Tissue Scaffold Applications. Acta Biomater. 2010, 6, 4596–4604. [Google Scholar] [CrossRef]
  9. Demir, G.; Akyurek, D.; Hassoun, A.; Mutlu, I. Production of Biodegradable Metal Foams by Powder Metallurgy Method. Phys. Mesomech. 2023, 26, 196–208. [Google Scholar] [CrossRef]
  10. Andreozzi, A.; Bianco, N.; Iasiello, M.; Naso, V. Natural Convection in a Vertical Channel with Open-Cell Foams. J. Phys. Conf. Ser. 2020, 1599, 012013. [Google Scholar] [CrossRef]
  11. Mauro, G.M.; Iasiello, M.; Bianco, N.; Chiu, W.K.S.; Naso, V. Mono- and Multi-Objective CFD Optimization of Graded Foam-Filled Channels. Materials 2022, 15, 968. [Google Scholar] [CrossRef]
  12. Chen, J.; Yang, D.; Jiang, J.; Ma, A.; Song, D. Research Progress of Phase Change Materials (PCMs) Embedded with Metal Foam (A Review). Procedia Mater. Sci. 2014, 4, 389–394. [Google Scholar] [CrossRef] [Green Version]
  13. Jerz, J.; Simančík, F.; Španielka, J.; Šebek, J.; Kováčik, J.; Tobolka, P.; Dvorák, T.; Orovčík, Ľ. Energy Demand Reduction in Nearly Zero-Energy Buildings by Highly Efficient Aluminium Foam Heat Exchangers. Mater. Sci. Forum 2018, 919, 236–245. [Google Scholar] [CrossRef]
  14. Gopinathan, A.; Jerz, J.; Kováčik, J.; Dvorák, T. Investigation of the Relationship Between Morphology and Thermal Conductivity of Powder Metallurgically Prepared Aluminium Foams. Materials 2021, 14, 3623. [Google Scholar] [CrossRef] [PubMed]
  15. Tian, E.; Mo, J.; Li, X. Electrostatically Assisted Metal Foam Coarse Filter with Small Pressure Drop for Efficient Removal of Fine Particles: Effect of Filter Medium. Build Env. 2018, 144, 419–426. [Google Scholar] [CrossRef]
  16. Lee, J.M.; Sung, N.W.; Cho, G.B.; Oh, K.O. Performance of Radial-Type Metal Foam Diesel Particulate Filters. Int. J. Automot. Technol. 2010, 11, 307–316. [Google Scholar] [CrossRef]
  17. Gergely, V.; Curran, D.C.; Clyne, T.W. The FOAMCARP Process: Foaming of Aluminium MMCs by the Chalk-Aluminium Reaction in Precursors. Compos. Sci. Technol. 2003, 63, 2301–2310. [Google Scholar] [CrossRef]
  18. Haesche, M.; Lehmhus, D.; Weise, J.; Wichmann, M.; Magnabosco Mocellin, I.C. Carbonates as Foaming Agent in Chip-Based Aluminium Foam Precursor. J. Mater. Sci. Technol. 2010, 26, 845–850. [Google Scholar] [CrossRef]
  19. Bunjan, I.; Grilec, K.; Ćorić, D. Investigation and Statistical Evaluation of Reinforced Aluminum Foams. Processes 2021, 9, 315. [Google Scholar] [CrossRef]
  20. Paulin, I. Synthesis and Characterization of Al Foams Produced by Powder Metallurgy Route Using Dolomite and Titanium Hydride as a Foaming Agents. Mater. Tehnol. 2014, 48, 943–947. [Google Scholar]
  21. Cambronero, L.E.G.; Ruiz-Roman, J.M.; Corpas, F.A.; Ruiz Prieto, J.M. Manufacturing of Al–Mg–Si Alloy Foam Using Calcium Carbonate as Foaming Agent. J. Mater. Process. Technol. 2009, 209, 1803–1809. [Google Scholar] [CrossRef]
  22. Koizumi, T.; Kido, K.; Kita, K.; Mikado, K.; Gnyloskurenko, S.; Nakamura, T. Method of Preventing Shrinkage of Aluminum Foam Using Carbonates. Metals 2012, 2, 1–9. [Google Scholar] [CrossRef] [Green Version]
  23. Soloki, A.; Esmailian, M. Carbonate-Foaming Agents in Aluminum Foams: Advantages and Perspectives. Metall. Mater. Trans. B 2015, 46, 1052–1057. [Google Scholar] [CrossRef]
  24. Wang, X.; Meng, Q.; Wang, T.; Chu, X.; Fan, A.; Wang, H. New Insights into Fabrication of Al-Based Foam with Homogeneous Small Pore-Structure Using MgCO3/Zn Composite Powder as a Foaming Agent. Metals 2022, 12, 786. [Google Scholar] [CrossRef]
  25. Jaafar, A.H.; Al-Ethari, H.; Farhan, K. Modelling and Optimization of Manufacturing Calcium Carbonate-Based Aluminum Foam. Mater. Res. Express 2019, 6, 0865g1. [Google Scholar] [CrossRef]
  26. Kevorkijan, V. Low Cost Aluminium Foams Made by CaCO3 Particulates. Metal. J. Metall. 2010, 16, 205–219. [Google Scholar]
  27. Byakova, A.; Gnyloskurenko, S.; Vlasov, A.; Yevych, Y.; Semenov, N. The Mechanical Performance of Aluminum Foam Fabricated by Melt Processing with Different Foaming Agents: A Comparative Analysis. Metals 2022, 12, 1384. [Google Scholar] [CrossRef]
  28. Singh, R.; Arora, R.; Sharma, J.D. Effect of Viscosity Enhancing Agents on Quasi-Static Compression Behavior of Aluminum Foams. Mater. Today Proc. 2021, 39, 1661–1666. [Google Scholar] [CrossRef]
  29. Yang, D.; Chen, J.; Wang, H.; Jiang, J.; Ma, A.; Lu, Z.P. Effect of Decomposition Kinetics of Titanium Hydride on the Al Alloy Melt Foaming Process. J. Mater. Sci. Technol. 2015, 31, 361–368. [Google Scholar] [CrossRef]
  30. Matijasevic-Lux, B.; Banhart, J.; Fiechter, S.; Görke, O.; Wanderka, N. Modification of Titanium Hydride for Improved Aluminium Foam Manufacture. Acta Mater. 2006, 54, 1887–1900. [Google Scholar] [CrossRef] [Green Version]
  31. Cheng, Y.; Li, Y.; Chen, X.; Shi, T.; Liu, Z.; Wang, N. Fabrication of Aluminum Foams with Small Pore Size by Melt Foaming Method. Metall. Mater. Trans. B 2017, 48, 754–762. [Google Scholar] [CrossRef] [Green Version]
  32. Paulin, I. Stability of Close-Cell Al Foams Depending on the Usage of Different Foaming Agents. Mater. Tehnol. 2015, 49, 983–988. [Google Scholar] [CrossRef]
  33. Mirzaei-Solhi, A.; Khalil-Allafi, J.; Yusefi, M.; Yazdani, M.; Mohammadzadeh, A. Fabrication of Aluminum Foams by Using CaCO3 Foaming Agent. Mater. Res. Express 2018, 5, 096526. [Google Scholar] [CrossRef]
  34. Bisht, A.; Gangil, B.; Patel, V.K. Selection of Blowing Agent for Metal Foam Production: A Review. J. Met. Mater. Miner. 2020, 30, 1–10. [Google Scholar] [CrossRef]
  35. Heidari Ghaleh, M.; Ehsani, N.; Baharvandi, H.R. Compressive Properties of A356 Closed-Cell Aluminum Foamed with a CaCO3 Foaming Agent Without Stabilizer Particles. Met. Mater. Int. 2021, 27, 3856–3861. [Google Scholar] [CrossRef]
  36. Koizumi, T.; Kido, K.; Kita, K.; Mikado, K.; Gnyloskurenko, S.; Nakamura, T. Foaming Agents for Powder Metallurgy Production of Aluminum Foam. Mater. Trans. 2011, 52, 728–733. [Google Scholar] [CrossRef] [Green Version]
  37. Geramipour, T.; Oveisi, H. Effects of Foaming Parameters on Microstructure and Compressive Properties of Aluminum Foams Produced by Powder Metallurgy Method. Trans. Nonferrous Met. Soc. China 2017, 27, 1569–1579. [Google Scholar] [CrossRef]
  38. Sharma, V.; Živić, F.; Grujović, N.; Babcsan, N.; Babcsan, J. Numerical Modeling and Experimental Behavior of Closed-Cell Aluminum Foam Fabricated by the Gas Blowing Method Under Compressive Loading. Materials 2019, 12, 1582. [Google Scholar] [CrossRef] [PubMed] [Green Version]
  39. Chaturvedi, A.; Bhatkar, S.; Sarkar, P.S.; Chaturvedi, S.; Kumar Gupta, M. 3D Geometric Modeling of Aluminum Based Foam Using Micro Computed Tomography Technique. Mater. Today Proc. 2019, 18, 4151–4156. [Google Scholar] [CrossRef]
  40. Hangai, Y.; Yamaguchi, R.; Takahashi, S.; Utsunomiya, T.; Kuwazuru, O.; Yoshikawa, N. Deformation Behavior Estimation of Aluminum Foam by X-ray CT Image-Based Finite Element Analysis. Metall. Mater. Trans. A 2013, 44, 1880–1886. [Google Scholar] [CrossRef]
  41. Ghazi, A.; Berke, P.; Tiago, C.; Massart, T.J. Computed Tomography Based Modelling of the Behaviour of Closed Cell Metallic Foams Using a Shell Approximation. Mater. Des. 2020, 194, 108866. [Google Scholar] [CrossRef]
  42. Kozma, I.; Zsoldos, I. CT-Based Tests and Finite Element Simulation for Failure Analysis of Syntactic Foams. Eng. Fail. Anal. 2019, 104, 371–378. [Google Scholar] [CrossRef]
  43. Duarte, I.; Fiedler, T.; Krstulović-Opara, L.; Vesenjak, M. Brief Review on Experimental and Computational Techniques for Characterization of Cellular Metals. Metals 2020, 10, 726. [Google Scholar] [CrossRef]
  44. Wang, N.; Maire, E.; Cheng, Y.; Amani, Y.; Li, Y.; Adrien, J.; Chen, X. Comparison of Aluminium Foams Prepared by Different Methods Using X-ray Tomography. Mater. Charact. 2018, 138, 296–307. [Google Scholar] [CrossRef]
  45. Varga, T.A.; Mankovits, T. Metal Foam Analysis Based on CT Layers. Acta Mater. Transilv. 2018, 1, 57–60. [Google Scholar] [CrossRef] [Green Version]
  46. Buljac, A.; Jailin, C.; Mendoza, A.; Neggers, J.; Taillandier-Thomas, T.; Bouterf, A.; Smaniotto, B.; Hild, F.; Roux, S. Digital Volume Correlation: Review of Progress and Challenges. Exp. Mech. 2018, 58, 661–708. [Google Scholar] [CrossRef] [Green Version]
  47. Vrgoč, A.; Tomičević, Z.; Smaniotto, B.; Hild, F. Characterization of Glass Fiber Reinforced Polymer via Digital Volume Correlation: Quantification of Strain Activity and Damage Growth. Compos. Sci. Technol. 2023, 234, 109932. [Google Scholar] [CrossRef]
  48. Borovinšek, M.; Koudelka, P.; Sleichrt, J.; Vopalensky, M.; Kumpova, I.; Vesenjak, M.; Kytyr, D. Analysis of Advanced Pore Morphology (APM) Foam Elements Using Compressive Testing and Time-Lapse Computed Microtomography. Materials 2021, 14, 5897. [Google Scholar] [CrossRef]
  49. Luksch, J.; Bleistein, T.; Koenig, K.; Adrien, J.; Maire, É.; Jung, A. Microstructural Damage Behaviour of Al Foams. Acta Mater. 2021, 208, 116739. [Google Scholar] [CrossRef]
  50. Vopalensky, M.; Koudelka, P.; Sleichrt, J.; Kumpova, I.; Borovinšek, M.; Vesenjak, M.; Kytyr, D. Fast 4D On-the-Fly Tomography for Observation of Advanced Pore Morphology (APM) Foam Elements Subjected to Compressive Loading. Materials 2021, 14, 7256. [Google Scholar] [CrossRef]
  51. Costanza, G.; Giudice, F.; Sili, A.; Tata, M.E. Correlation Modeling Between Morphology and Compression Behavior of Closed-Cell Al Foams Based on X-ray Computed Tomography Observations. Metals 2021, 11, 1370. [Google Scholar] [CrossRef]
  52. Volume Graphics GmbH. VGSTUDIO MAX 2022.4 Reference Manual; Volume Graphics GmbH: Heidelberg, Germany, 2022. [Google Scholar]
  53. Paulin, I.; Šuštaršič, B.; Kevorkijan, V.; Škapin, S.D.; Jenko, M. Synthesis of Aluminium Foams by the Powder-Metallurgy Process: Compacting of Precursors. Mater. Tehnol. 2011, 45, 13–19. [Google Scholar]
Figure 1. Compacted precursors with 3 and 5 wt.% CaCO3.
Metals 13 01146 g001
Figure 2. Aluminium samples foamed with different foaming agents: 3 wt.% CaCO3 (a), 5 wt.% CaCO3 (b), and 0.4 wt.% TiH2 (c).
Metals 13 01146 g002
Figure 3. Three-dimensional models of scanned samples foamed with 3 wt.% CaCO3 (a), 5 wt.% CaCO3 (b), and 0.4 wt.% TiH2 (c).
Metals 13 01146 g003
Figure 4. Cell volume analysis of samples with 3 wt.% CaCO3 (a), 5 wt.% CaCO3 (b), and 0.4 wt.% TiH2 (c).
Metals 13 01146 g004
Figure 5. Number of cells per unit volume.
Metals 13 01146 g005
Figure 6. Cell volume distribution of samples with 3 and 5 wt.% CaCO3.
Metals 13 01146 g006
Figure 7. Cell volume distribution of samples with 0.4 wt.% TiH2.
Metals 13 01146 g007
Figure 8. Sphericity versus equivalent diameter for samples 3-1 (a), 3-2 (b), 5-1 (c), 5-2 (d), T-1 (e), T-2 (f).
Metals 13 01146 g008
Figure 9. Cell volume versus compactness for samples: 3-1 (a), 3-2 (b), 5-1 (c), 5-2 (d), T-1 (e), T-2 (f).
Metals 13 01146 g009
Table 1. Measured, theoretical, and relative densities of compacted precursors.
Chemical Compositionρmeasured, g/cm3ρtheo, g/cm3ρrel,prec, %
Al + 3 wt.% CaCO32.6782.700399.17
Al + 5 wt.% CaCO32.6752.700599.06
Table 2. Mass, volume, density, relative density, and porosity of foam samples.
SampleChemical Compositionmf, gVf, cm3ρf, g/cm3ρrelPorosity, %
3-1Al + 3 wt.% CaCO321.3739.580.539920.2080.00
3-2Al + 3 wt.% CaCO323.4642.100.557240.206479.36
5-1Al + 5 wt.% CaCO325.3441.050.617300.228677.14
5-2Al + 5 wt.% CaCO319.5839.420.496700.184081.60
T-1AlMgSi0.6 + 0.4 wt.% TiH216.1637.610.429670.159184.09
T-2AlMgSi0.6 + 0.4 wt.% TiH214.9437.050.403240.149385.07
Table 3. Number and volume of cells.
SampleNumber of CellsAverage Cell Volume,
mm3
St. Deviation,
mm3
3-135,5080.340.80
3-235,8670.200.55
5-126,4720.150.46
5-227,6670.230.68
T-149424.5511.93
T-248614.3613.85
Disclaimer/Publisher’s Note: The statements, opinions and data contained in all publications are solely those of the individual author(s) and contributor(s) and not of MDPI and/or the editor(s). MDPI and/or the editor(s) disclaim responsibility for any injury to people or property resulting from any ideas, methods, instructions or products referred to in the content.

