Article

Experimental and Analytical Investigation of the Re-Melting Effect in the Manufacturing of 316L by Direct Energy Deposition (DED) Method

1
Department of Manufacturing Engineering, Defense Industries Research and Development Institute, The Scientific and Technological Research Council of Turkey, Ankara 06261, Turkey
2
Department of Manufacturing Engineering, Gazi University, Ankara 06500, Turkey
3
Department of Mechanical Engineering, Gazi University, Ankara 06500, Turkey
*
Author to whom correspondence should be addressed.
Metals 2023, 13(6), 1144; https://doi.org/10.3390/met13061144
Submission received: 29 April 2023 / Revised: 12 June 2023 / Accepted: 14 June 2023 / Published: 20 June 2023

Abstract

:
In this study, the effects of the laser power (2000 W, 2250 W, 2500 W), scanning speed (0.6, 0.8, 1 m/min), and powder feed rate (10, 12.5, 15 g/min) on material structures and their mechanical properties were investigated in the production of 316L stainless steels through Direct Energy Deposition (DED). In addition, changes in the microstructure caused by the re-melting process were also investigated. Optimized process parameters were modeled using the CFD software (FLOW 3D V3.0). In order to see the effects on the density and mechanical properties, the sample production was repeated as a build and by applying the re-melting process between the layers. When the energy density and powder feed rate are considered together, it has been determined that the deposition rate increases in direct proportion to the energy density and tends to decrease inversely with the powder feed rate. When the experimental and analysis results of the single clad height are compared, it is seen that the values obtained are very approximate. It has been observed that the most important parameters affecting the formation of porosity are the energy density and powder feed density. Re-melting slightly affects the microstructure of the material and causes grain growth. Changes in the impact strength of the re-melted samples were observed depending on the energy density.

1. Introduction

Direct Energy Deposition (DED), which is one of the laser-based additive manufacturing processes, is an additive manufacturing method in which a metal melt pool is created by stacking a metal melt pool layer by layer, which is created by simultaneously feeding a heat source (laser or electron beam) with powder or wire feeding (WAM). This method has been used in the production of functional quality metal parts or prototypes in various engineering applications in recent years. The most important features that distinguish the process from other additive manufacturing methods are the high material deposition rate and dimensionally flexible production capability. However, a secondary process (machining) is needed for parts produced with DED due to the high heat input and the production of deposition parts compared to traditional production methods. In addition, determining the correct process parameters is essential for defect-free part production. The most important challenge encountered in producing defect-free parts is providing the desired grain structure and good mechanical properties.
The microstructural properties of DED parts (e.g., morphology and grain size) are strongly sensitive to high heating/cooling rates, significant thermal gradients, and thermal effects during deposition. As many process parameters affect the thermal gradient, determining the microstructural properties of DED parts and their relationship to the process parameters is still a significant challenge. However, it is necessary to establish effective control mechanisms to understand the complex effects mentioned above and manufacture DED parts with superior mechanical properties. Therefore, many researchers have investigated the effects of the process parameters on the microstructural and mechanical properties of parts produced with DED [1,2,3,4,5,6,7].
Huang et al. found that combining a high scanning speed with a lower laser power resulted in a finer microstructure. However, they concluded that the combinations must be kept at the melt pool temperature thresholds for effective deposition. In addition, it was observed that the microstructures were in harmony in different regions of the SS 316L and Inconel 625 deposition profiles at the scanning rates used [3]. Amine et al. found that the scanning speed and laser power in general significantly affect the microstructure [5]. In Wang’s study, with the high cooling rate of the samples produced by DED, the microstructure was regular and the grain size (5 um) was approximate to that of the samples produced using conventional methods. In addition, it has been observed that the energy density affects the quality of the part, and low porosity parts are produced at an energy density of 41.8 J mm−2 [6]. Zhang et al. show that the Columnar to Equiaxed Transition (CET) was improved by lowering the laser energy density and increasing the dust deposition rate as un-melted powders behave similarly to heterogeneous grains [8].
316L stainless steel is extensively used in the DED process, as well as in many industries. Moreover, its impressive performance at high temperatures, high corrosion resistance, and easy fabrication make 316L stainless steel superior to other stainless steels. In addition, the cost of 316L stainless steel is relatively low. These properties make 316L stainless steel one of the most popular and widely requested materials for fabricating different metallic structures [9].
In light of the literature research, different microstructure regions have different hardness values for AISI 316L stainless steel. The micro-hardness values for stainless steels are known to be low in the first deposition layer but increase towards the upper layers [10]. This inhomogeneity is due to the time-dependent cooling rate of the melt pool and the slower cooling of the deposition in the middle regions. The middle zones are also subject to periodic heating (depending on the deposition rate) and are heat affected for longer. For this reason, the micro-hardness values also change as a result of microstructure changes. In the study of Tan et al., the difference in the micro-hardness measurement values was attributed to the grain sizes formed in the fusion line during each lateral slip (overlap) during the deposition process [10].
The re-melting process is carried out with the same laser source for re-melting the layer, with no particle, just laser power. This method can help improve surface irregularities and significantly reduce pores. It is expected that it can improve the microstructure and have a positive effect on the mechanical properties [11].
Numerous studies have focused on the characterization of 316L material produced through AM processes. Most of these studies have tried to establish a link between the fabrication parameters of selective laser melting (SLM), laser-engineered mesh forming (LENS), and DED and the mechanical properties of building materials [7,10]. In some studies, it has been reported that the microstructure regularity and the increase in the time interval between successive layers positively affect the mechanical properties due to an increase in the cooling rate [6,12]. However, very little work has been conducted on the effects of the re-melting process during the production of 316L material through the DED method [13,14,15].
Many DED process parameters affect the thermal history of the part (microstructure and residual stress, etc.), such as the powder feed rate, laser power, laser scanning speed, and scanning strategy. These parameters affect the shape of the melt pool, its internal energy, and, consequently, the cooling rate. As the laser scanning speed increases, the clad geometry’s dimensional limit values (width, height, and depth) decrease. In addition, the laser power and scanning speed significantly affect the flatness, distortion, and surface irregularities of the clad geometry [16]. In the study of Parekh et al., it has been reported that as the laser scanning speed increases, the deposition height, penetration, temperature, and thermal stress decrease. It is seen that the laser power is the most important parameter affecting the clad geometry. The deposition height, penetration, temperature, and thermal stress increase with the increase in laser power. However, increasing the laser spot size increases the clad height and decreases the temperature and thermal stress [17].
Regarding the powder feed rate, the volume of powder entering the melt pool affects the density. Thus, it affects the clad height and microstructure. Increasing the powder feed rate causes an increase in the deposition height and penetration and a decrease in the temperature and internal stresses [17]. According to Kovalev et al., an increase in the powder feed rate (maximum 40 g/min) significantly changes the clad geometry [18]. Alvarez et al. investigated the effects of the clad height and width on the powder feed rate in their study on 316L samples [19].
In the literature, 3D finite element models have also been developed to investigate the thermal behavior of the molten pool during the DED process [17,20,21,22]. By controlling the melt pool width, it was found that the fusion depth and average temperature were effectively regulated, and the cooling rate was mainly affected by the scan rate. However, there are some differences between the experimental and simulation results as the clad geometry was previously defined as a regular rectangle in finite element analysis models. For these reasons, with the help of the FLOW 3D Weld module, a real-time flow analysis model has been used in our study. All welding phonemes that may occur during deposition have been analyzed, and an analysis model that is approximate to reality has been prepared.
Due to the complexity of the DED process, few quantitative studies suggest optimal control parameters such as the powder feed rate and laser scanning speed. Therefore, any control scheme or process optimization should be designed in a time-varying manner, depending on the height of the clad geometry. In addition, despite numerous studies, 316L samples produced using the DED process have not been thoroughly investigated regarding the changes in the mechanical properties after as-build and re-melting.
This study evaluates the mechanical properties, microstructure, etc., of samples produced through DED by applying re-melting as built and comparing them with 316L steel produced using the conventional methods. In addition, it aims to compare the relationship between the model in the flow analysis performed with Flow 3D and the experimentally produced samples.

2. Materials and Methods

Generally, larger powders are used in the DED method, in contrast to Selective Laser Melting (SLM) processes. The dimensions of 316L powders produced using the gas atomization method are between 50 µm and 120 µm on average, as seen in Figure 1. The average powder size was calculated to be 82.47 µm with the measurements made using SEM (Figure 2). The chemical composition of the powder used is given in Table 1.
Regarding each process parameter, the thermal properties of the 316L material, such as the energy density and thermal history formed during the process, were calculated with the help of Flow 3D. Then, using the computational fluid dynamics (CFD) model, the single-line deposition process was modelled in the FLOW 3D V3.0 software (Flow Science, Inc., Santa Fe, New Mexico) using the finite element volumetric method (FVM). This model can present the dynamics of the free surface to be deposited and the melt pool dynamics in real time [23].
The FVM model was used to examine the effect of each input parameter (power, scanning speed, powder feed rate) on the outputs (e.g., clad height, melt pool temperature, etc.). This analysis examined the thermo-physical properties of the clad heights on the 2D cross-section, which are formed during the clad in 3D. Real-time deposition analysis of three different physics was conducted, including: heat transfer, structural mechanics, and mathematical modeling. The modeling was first started by creating a 50 × 50 × 160 mm rectangular substrate plate. The created geometry has 0.5 × 0.5 × 0.5 mm mesh structures. Then, the laser’s position, direction, and focal distance parameters are defined. Finally, a thermo-physical analysis estimates the clad geometry and population based on the temperature field obtained from the thermal analysis during the cladding process.
The temperature-dependent material properties for modelling and the process parameters used in the study are given in Table 2 and Table 3, respectively. The input parameters given in the simulation will be compared with the experimental process conditions to investigate their effects on the final clad geometry. The simulation outputs made with the same parameters as the experimental parameters are given in Figure 3.
E v J m m - 2 = P V r × D s
The Flow 3D and experimental outputs were used to measure each layer’s thickness (Figure 3). As a result of the experimental outputs, the actual clad heights for each parameter were calculated, and the distances between the layers were determined by taking this height into account while creating the other layers. The DED method manufactured the specimens according to the parameter set, which is specified in Table 3. Three specimens were manufactured for each parameter value. Two sets of work were carried out, one of which was standard cladding and the other was re-melting between layers. In total, 54 specimens were manufactured. As it was seen that the heat penetrated up to 4 times the layer thickness within the results obtained from Flow 3D, a re-melting application was performed for every 3 layers (Figure 4). As thermal history is an important parameter in the DED process, the effect of re-melting on both the porosity and mechanical properties has been investigated.
All samples were produced at TUBITAK SAGE using the DED system (6 Axis Robot, IPG Laser 10 kW, Cladding Head, Powder Feeder) (Figure 5). Images of single-line productions are shown in Figure 6.
Single-line clad thickness measurements were performed with optical scanning and compared with the analysis studies. Charpy specimens (according to ASTM E23-07a Type A) were obtained from the sample produced as a plate (14 × 14 × 210 mm, Figure 6a). A total of 54 specimens were manufactured according to the parameter sets given in Table 3. Charpy tests were performed for all the specimens using the Instron MPX test device (High Wycombe, UK). Density and microanalysis samples were produced according to ASTM B962-082. For the density measurement, the samples were first examined with 3D tomography with the help of X-ray CT. This imaging method confirms the results of other destructive or non-destructive tests. Next, the samples were prepared for microanalysis and micro-hardness by cutting perpendicular to the deposition direction (Figure 6b). Micro-hardness was measured at 3 points on each sample on a micro-Vickers hardness tester with a 100 g load for 15 s, and average values were determined. Micro-hardness tests were performed using the DuroScan G5 test device (Kuchl, Austria). Micro-analysis specimens of 316L were prepared for each parameter set. In addition, a total of 18 specimens were prepared for as-build and re-melting tests. The specimens were ground, polished, and etched following the standard metallographic procedures. Metkon Ecopress 100 (Bursa, Turkey), Metkon Gripo 2 V grinder (Bursa, Turkey), and Mecapol P 230 polishers (Eybens, France) were used for grinding and polishing. In polishing, 6 μm and 1 μm of diapat-P water-based polycrystalline diamond suspensions were used. For microstructural observation, the samples were etched with a 2% nital solution. Optical examinations were conducted using a Zeiss Axio Scope (Jena, Germany). Moreover, volumetric porosity measurements were taken on the polished samples. The Hitachi FlexSem II (Tokyo, Japan) device was used in the analysis of fracture surfaces.
Experimental studies were carried out on the samples with standard DED production and re-melting. The effects of the process parameters on the microstructure and mechanical properties were investigated in the samples obtained.

3. Results and Discussions

It should be considered that many factors are simultaneously effective in determining the process parameters used in additive manufacturing applications. In this study, the effect of the process parameters on the mechanical properties was investigated experimentally and through simulation by using tests and inspection methods such as porosity, tomography (CT), Charpy, and micro-hardness in the samples produced with DED. In terms of the deposition heights in the analysis studies, it was observed that the most effective parameters affecting the clad height (deposition rate) were the change in the amount of powder feed, depending on the scanning speed. The experimental studies confirmed this hypothesis. In terms of the energy density, it is seen that when Ev > 62.03 J mm−2, single-line clad heights can be achieved at 0.7 mm and above. In the study, the single-line clad heights were between 0.5 and 0.9 mm, and these height values were produced with energy densities between 45.36 and 80.65 J mm−2. When the energy density and powder feed rate are considered together, the clad height is directly affected by the energy density and is inversely proportional to the powder feed rate. Greater clad heights are achieved as the energy density levels increase and the powder feed decreases (Figure 7).
In the samples produced with 2500 W laser power, the increase in the powder feed rate together with the increase in the scanning speed causes a decrease in the single-line clad height. As a result, the clad heights converge to each other at a high rate, as shown in Figure 7, in terms of the differences between the experimental studies and analysis studies.
The porosity is the number of voids in the internal structure that form spherical or linear pores in the final material, caused by various factors, including gas trapped in the powders fed during the process or external effects. It was observed that the porosity of the produced samples was affected by the mechanical properties. As a result of the studies, it has been seen that the most important process parameters affecting the formation of porosity are the energy density and powder feed rate. Its porosity increases directly with the energy density and inversely with the powder feed rate. In the samples produced under as-build conditions, 1.2–1.3 porosity occurs at 64.52–72.58 J mm−2, respectively (Figure 8). The increase in the amount of porosity at these energy density levels is directly related to the increase in the amount of powder feed. In addition, the imbalance of the energy density and powder feed rates (low or very high values) causes keyholes and a lack of fusion during stacking [17].
When the re-melting-applied samples were examined in terms of their porosity compared to the as-build condition, it was observed that the amount of porosity in some samples increased, and in others, did not change (Figure 9). The gas voids in the as-build samples were quite small. The fact that the porosity voids that formed in the microstructure after the re-melting process are larger than those formed in the as-build samples can be explained by the formation of gas voids. Lack of melting (lack of fusion) is when un-melted powders hold onto something and appear as rectangular shapes lying perpendicular to the stacking direction in the tomography results. Processing parameters such as the scanning speed and power of the energy source can affect the development of voids of various shapes and sizes due to insufficient melt flow and/or particle ejection and evaporation [28,29]. In addition, most of the spherical porosities may be due to the evaporation of NiTi components caused by excessive heat buildup during the re-accumulation strategy [20]. No fusion deficiency—which can occur as a result of the process—was observed in the porosity measurements and optical microscopy examinations performed as a result of all the sample productions (Figure 9 and Figure 10).
With the energy density equation (Equation (1)), the effect of the process parameters on each other becomes better explained in terms of porosity. As shown in Figure 10, low energy levels cause an increase in the amount of porosity, depending on the parameters in the energy density formula. The increase in the porosity rate occurs due to the increase in the powder feed rate and the laser power. Therefore, although the number of particles sent to the melt pool per unit of time increases, the melt pool temperature is not effective in keeping these particles.
As with the re-melting samples, the porosity change in the samples produced can be explained as follows:
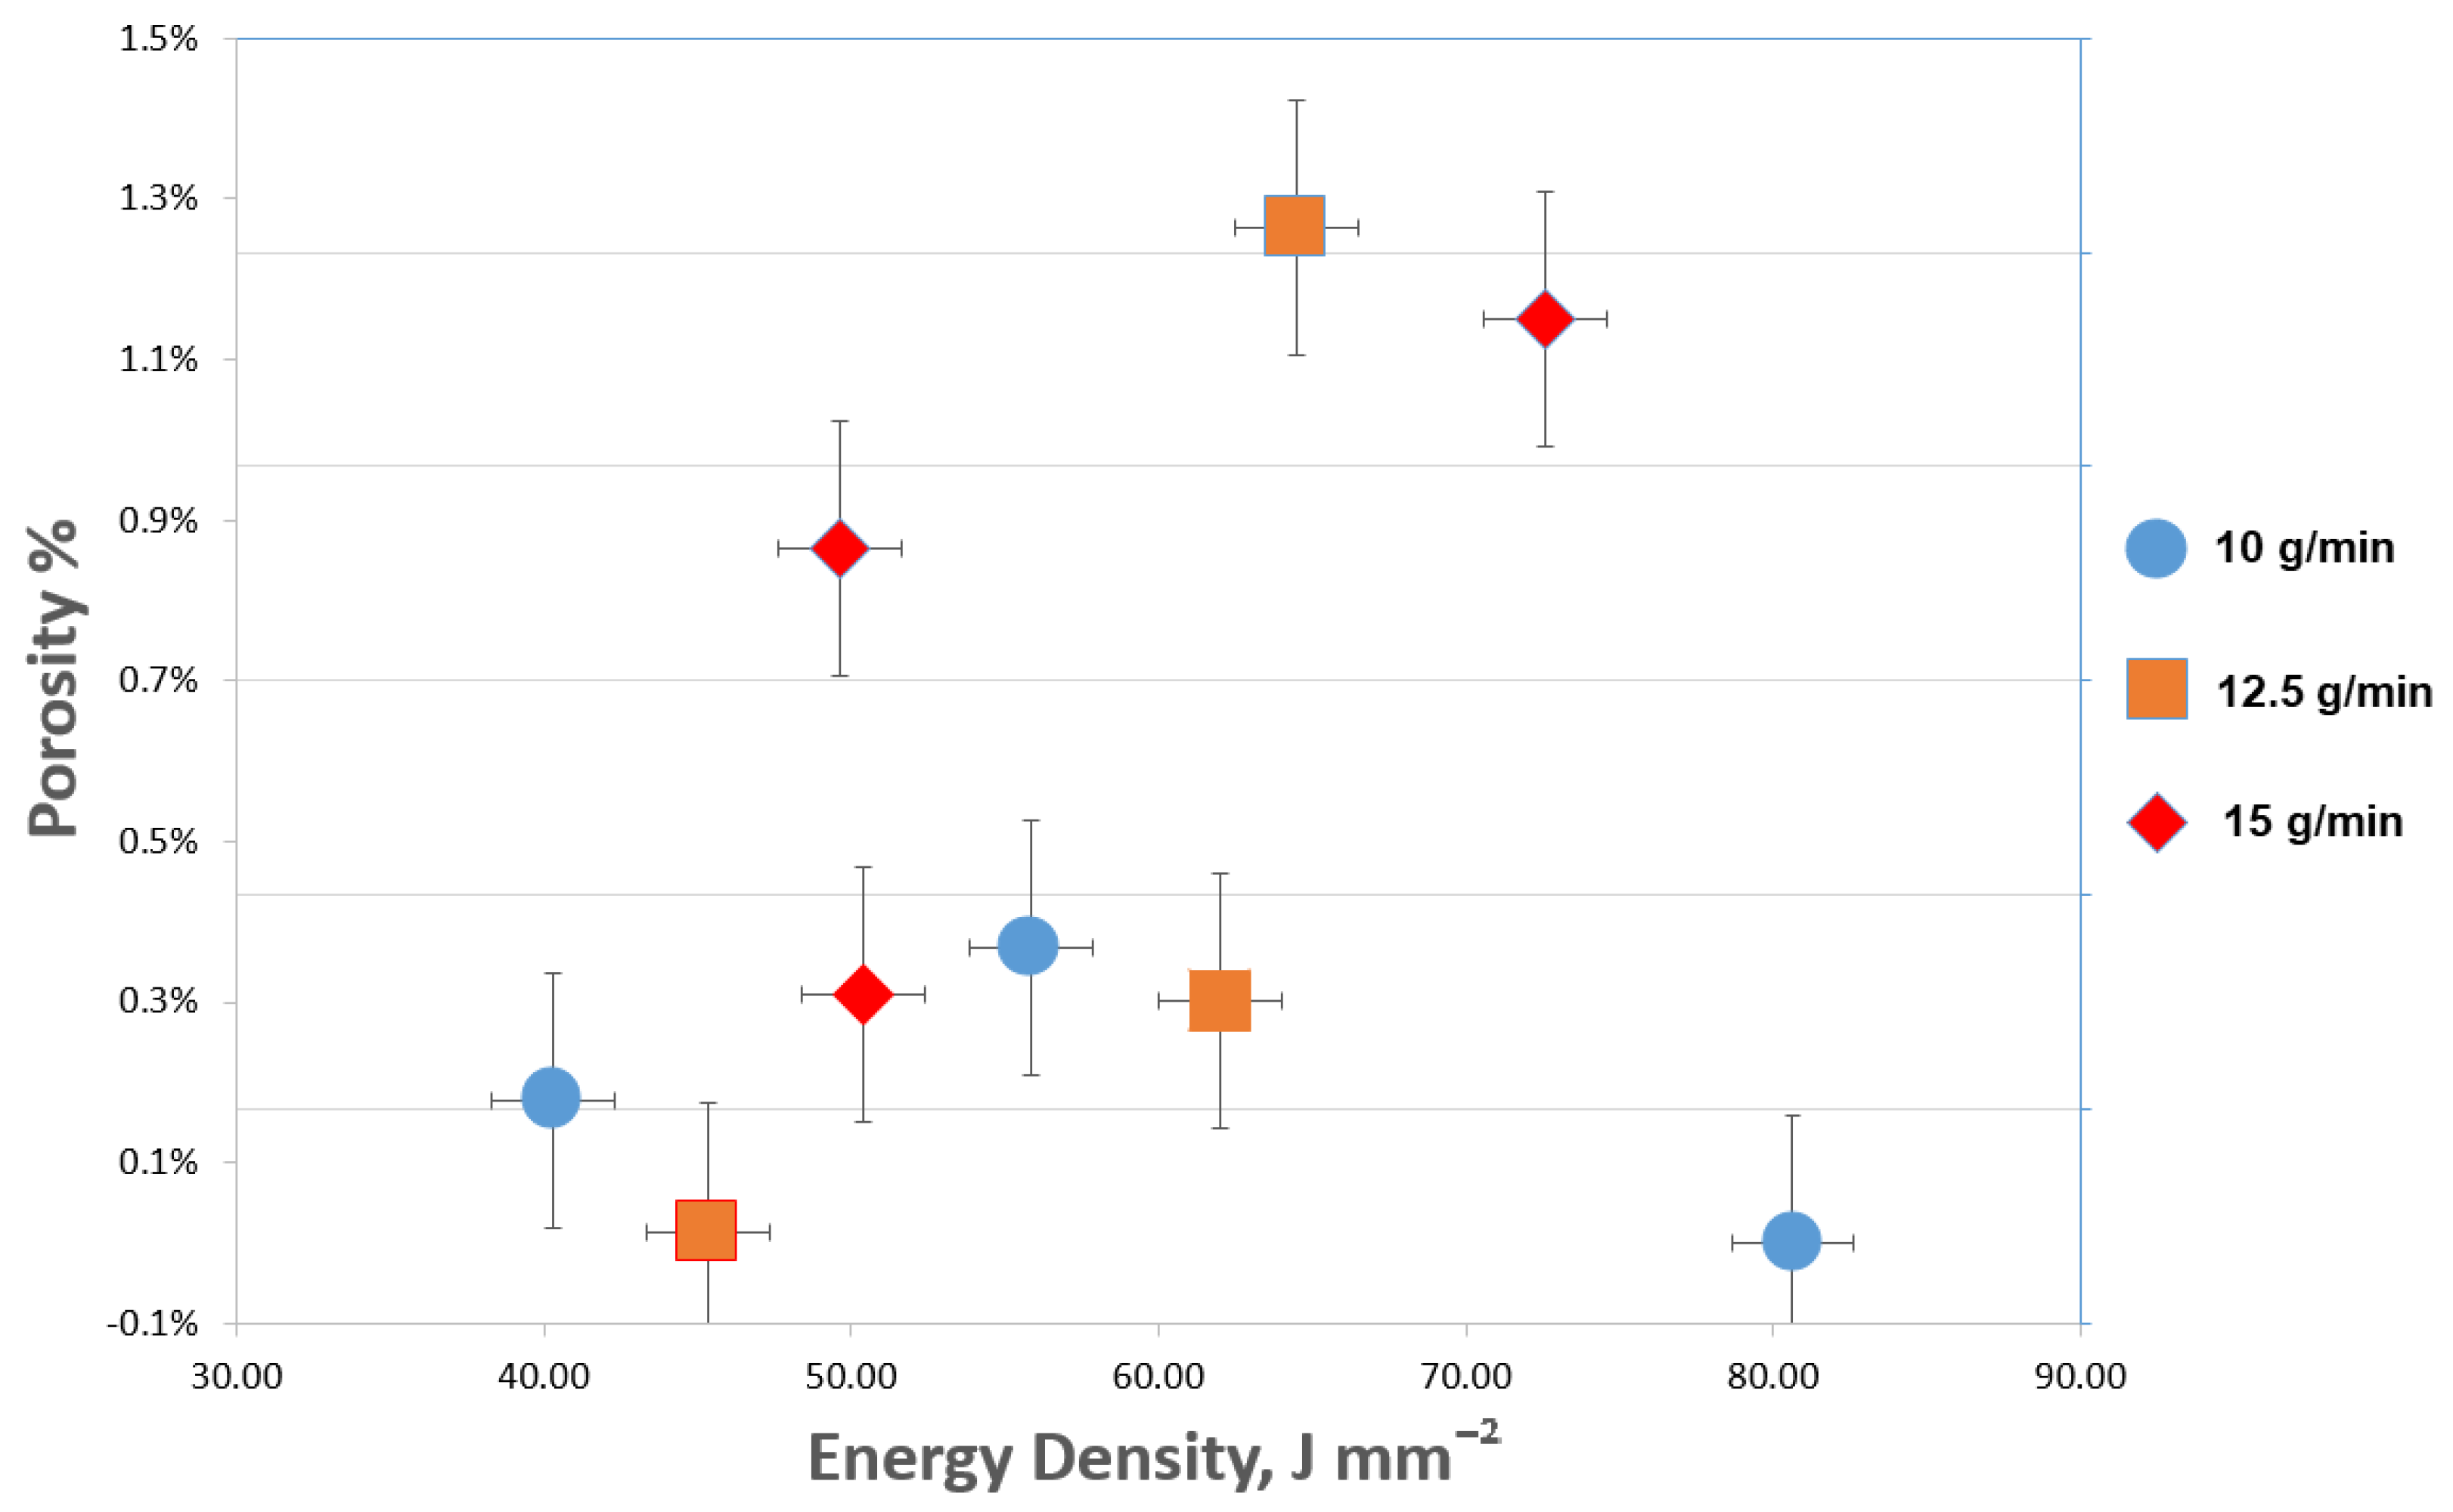
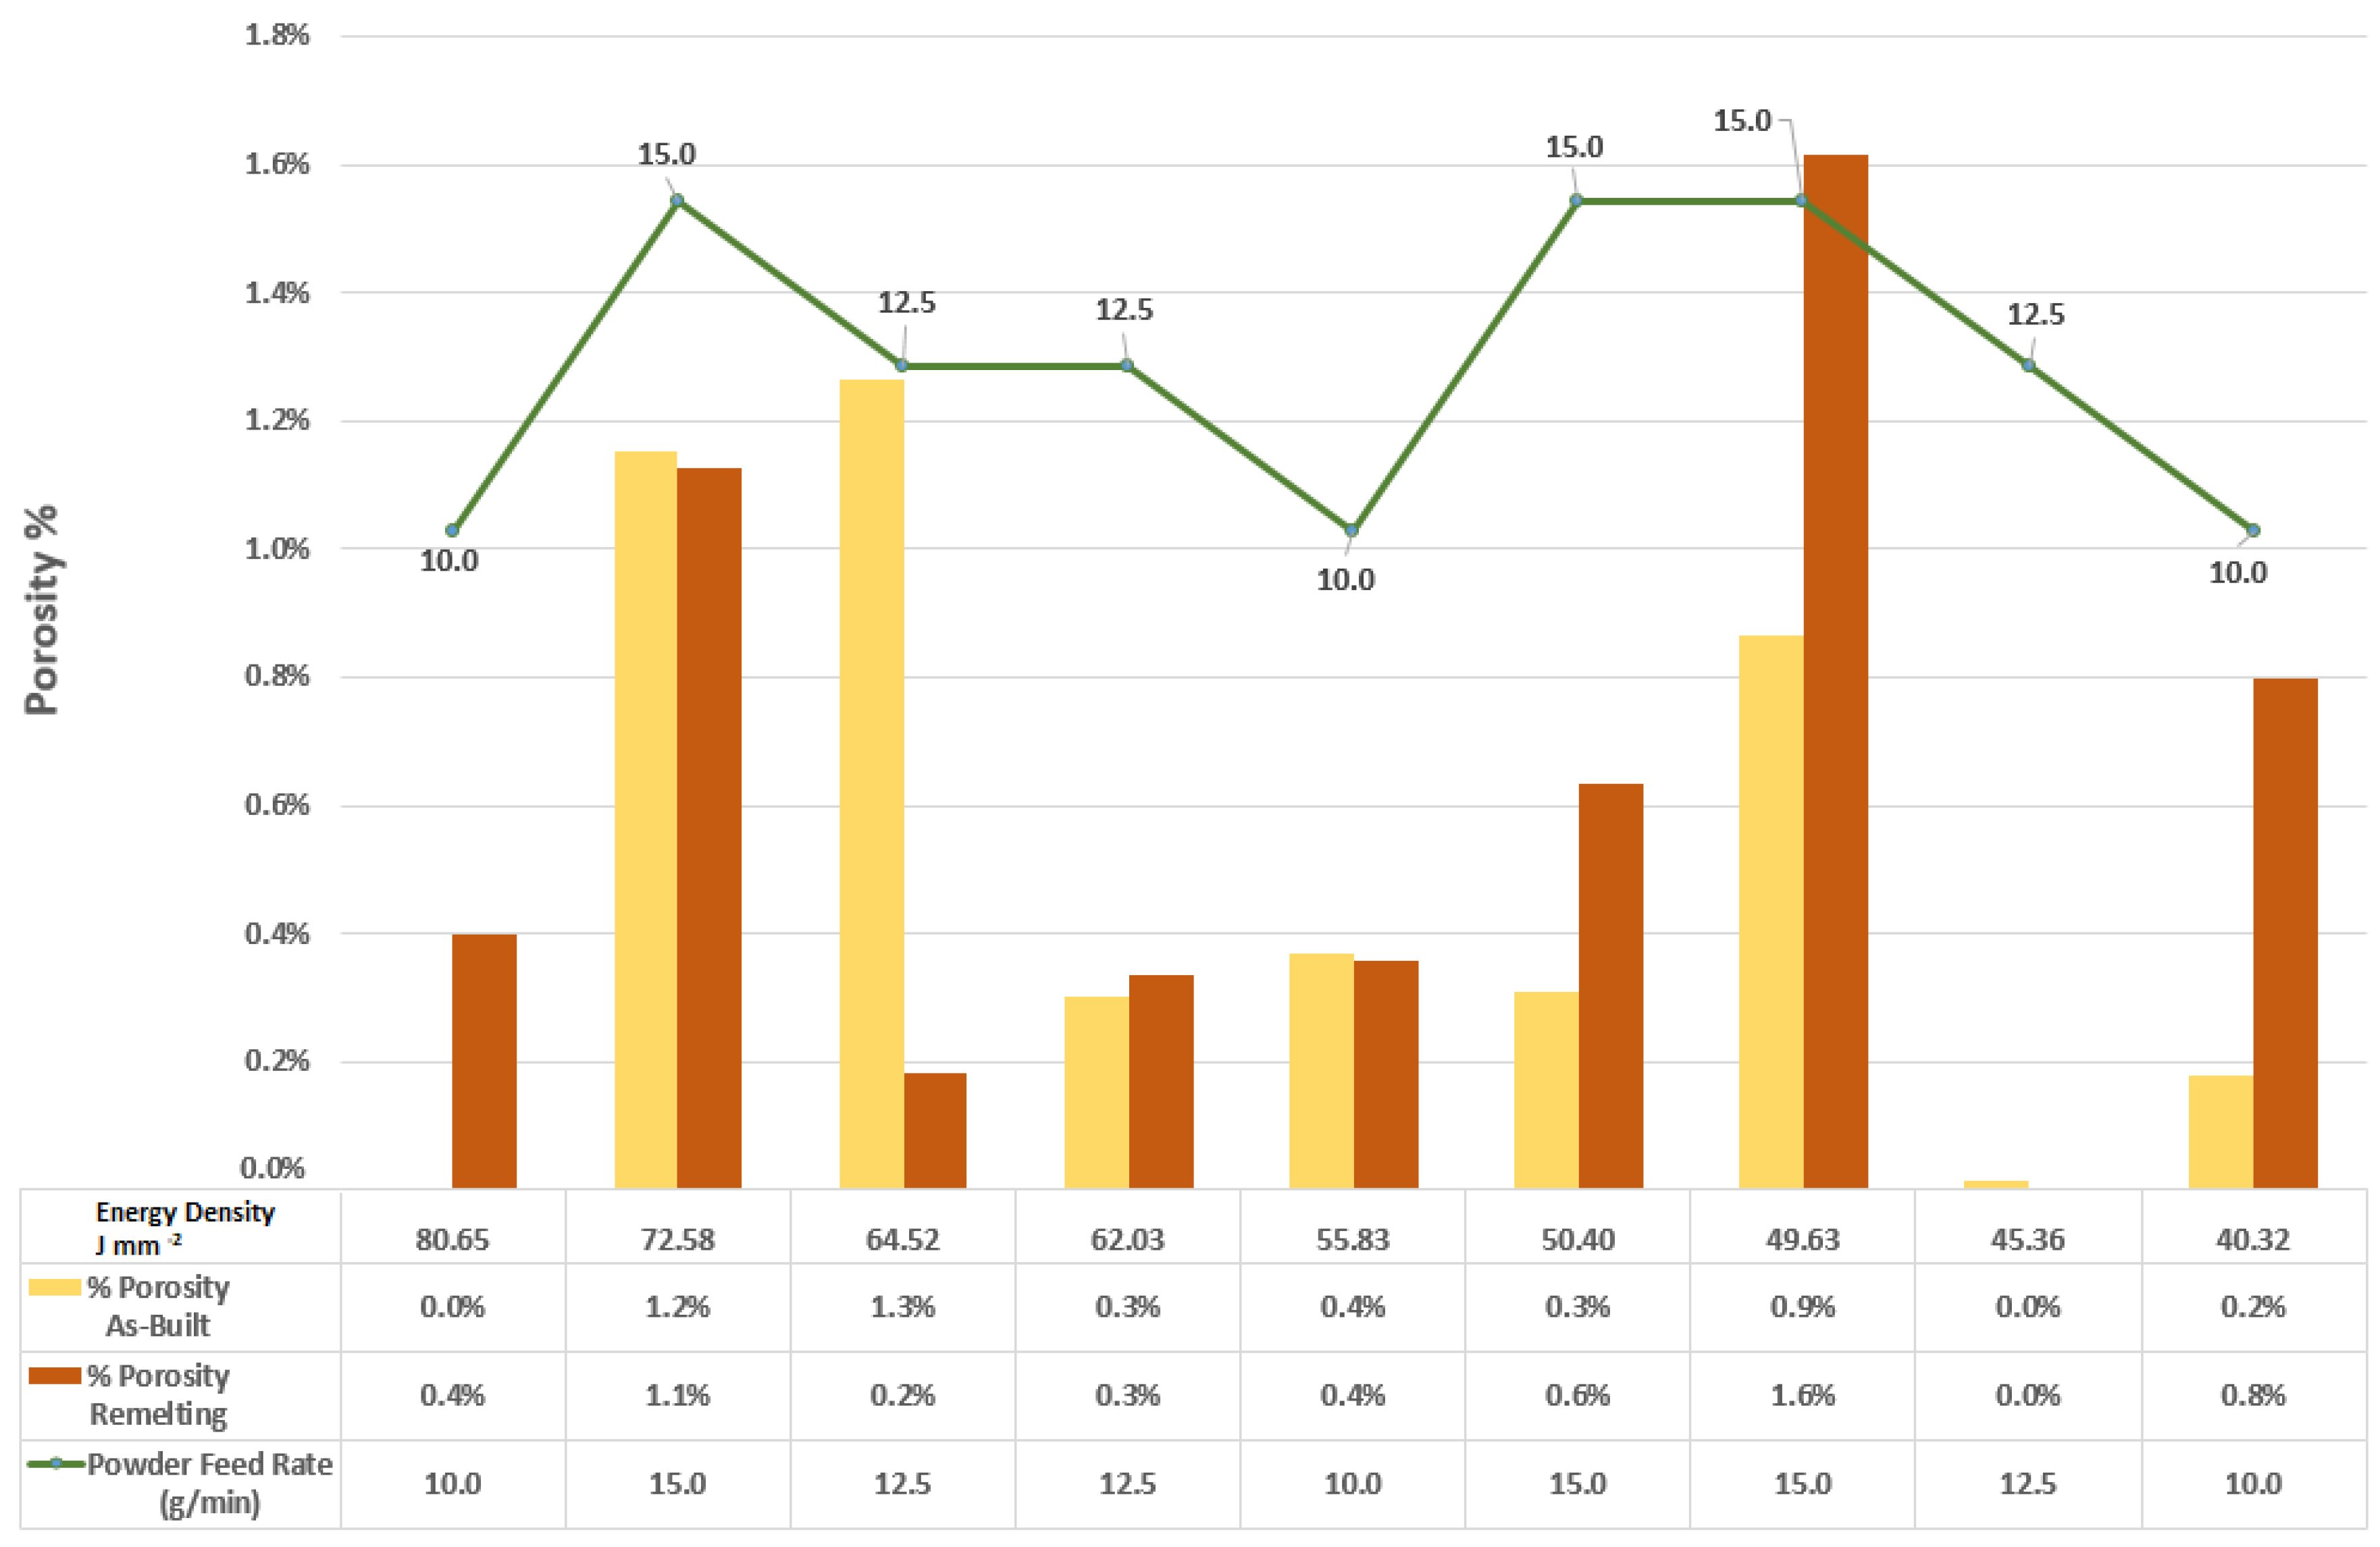
  • It decreased slightly at high powder feed (15 g/min) values and high energy density, and it tended to increase the re-melting porosity in these samples as the energy density decreased. It is seen that the formation of porosity doubles at low energy levels and high powder feed values (15 g/min) as it is difficult to dissolve the powder and keep it in the pool effectively.
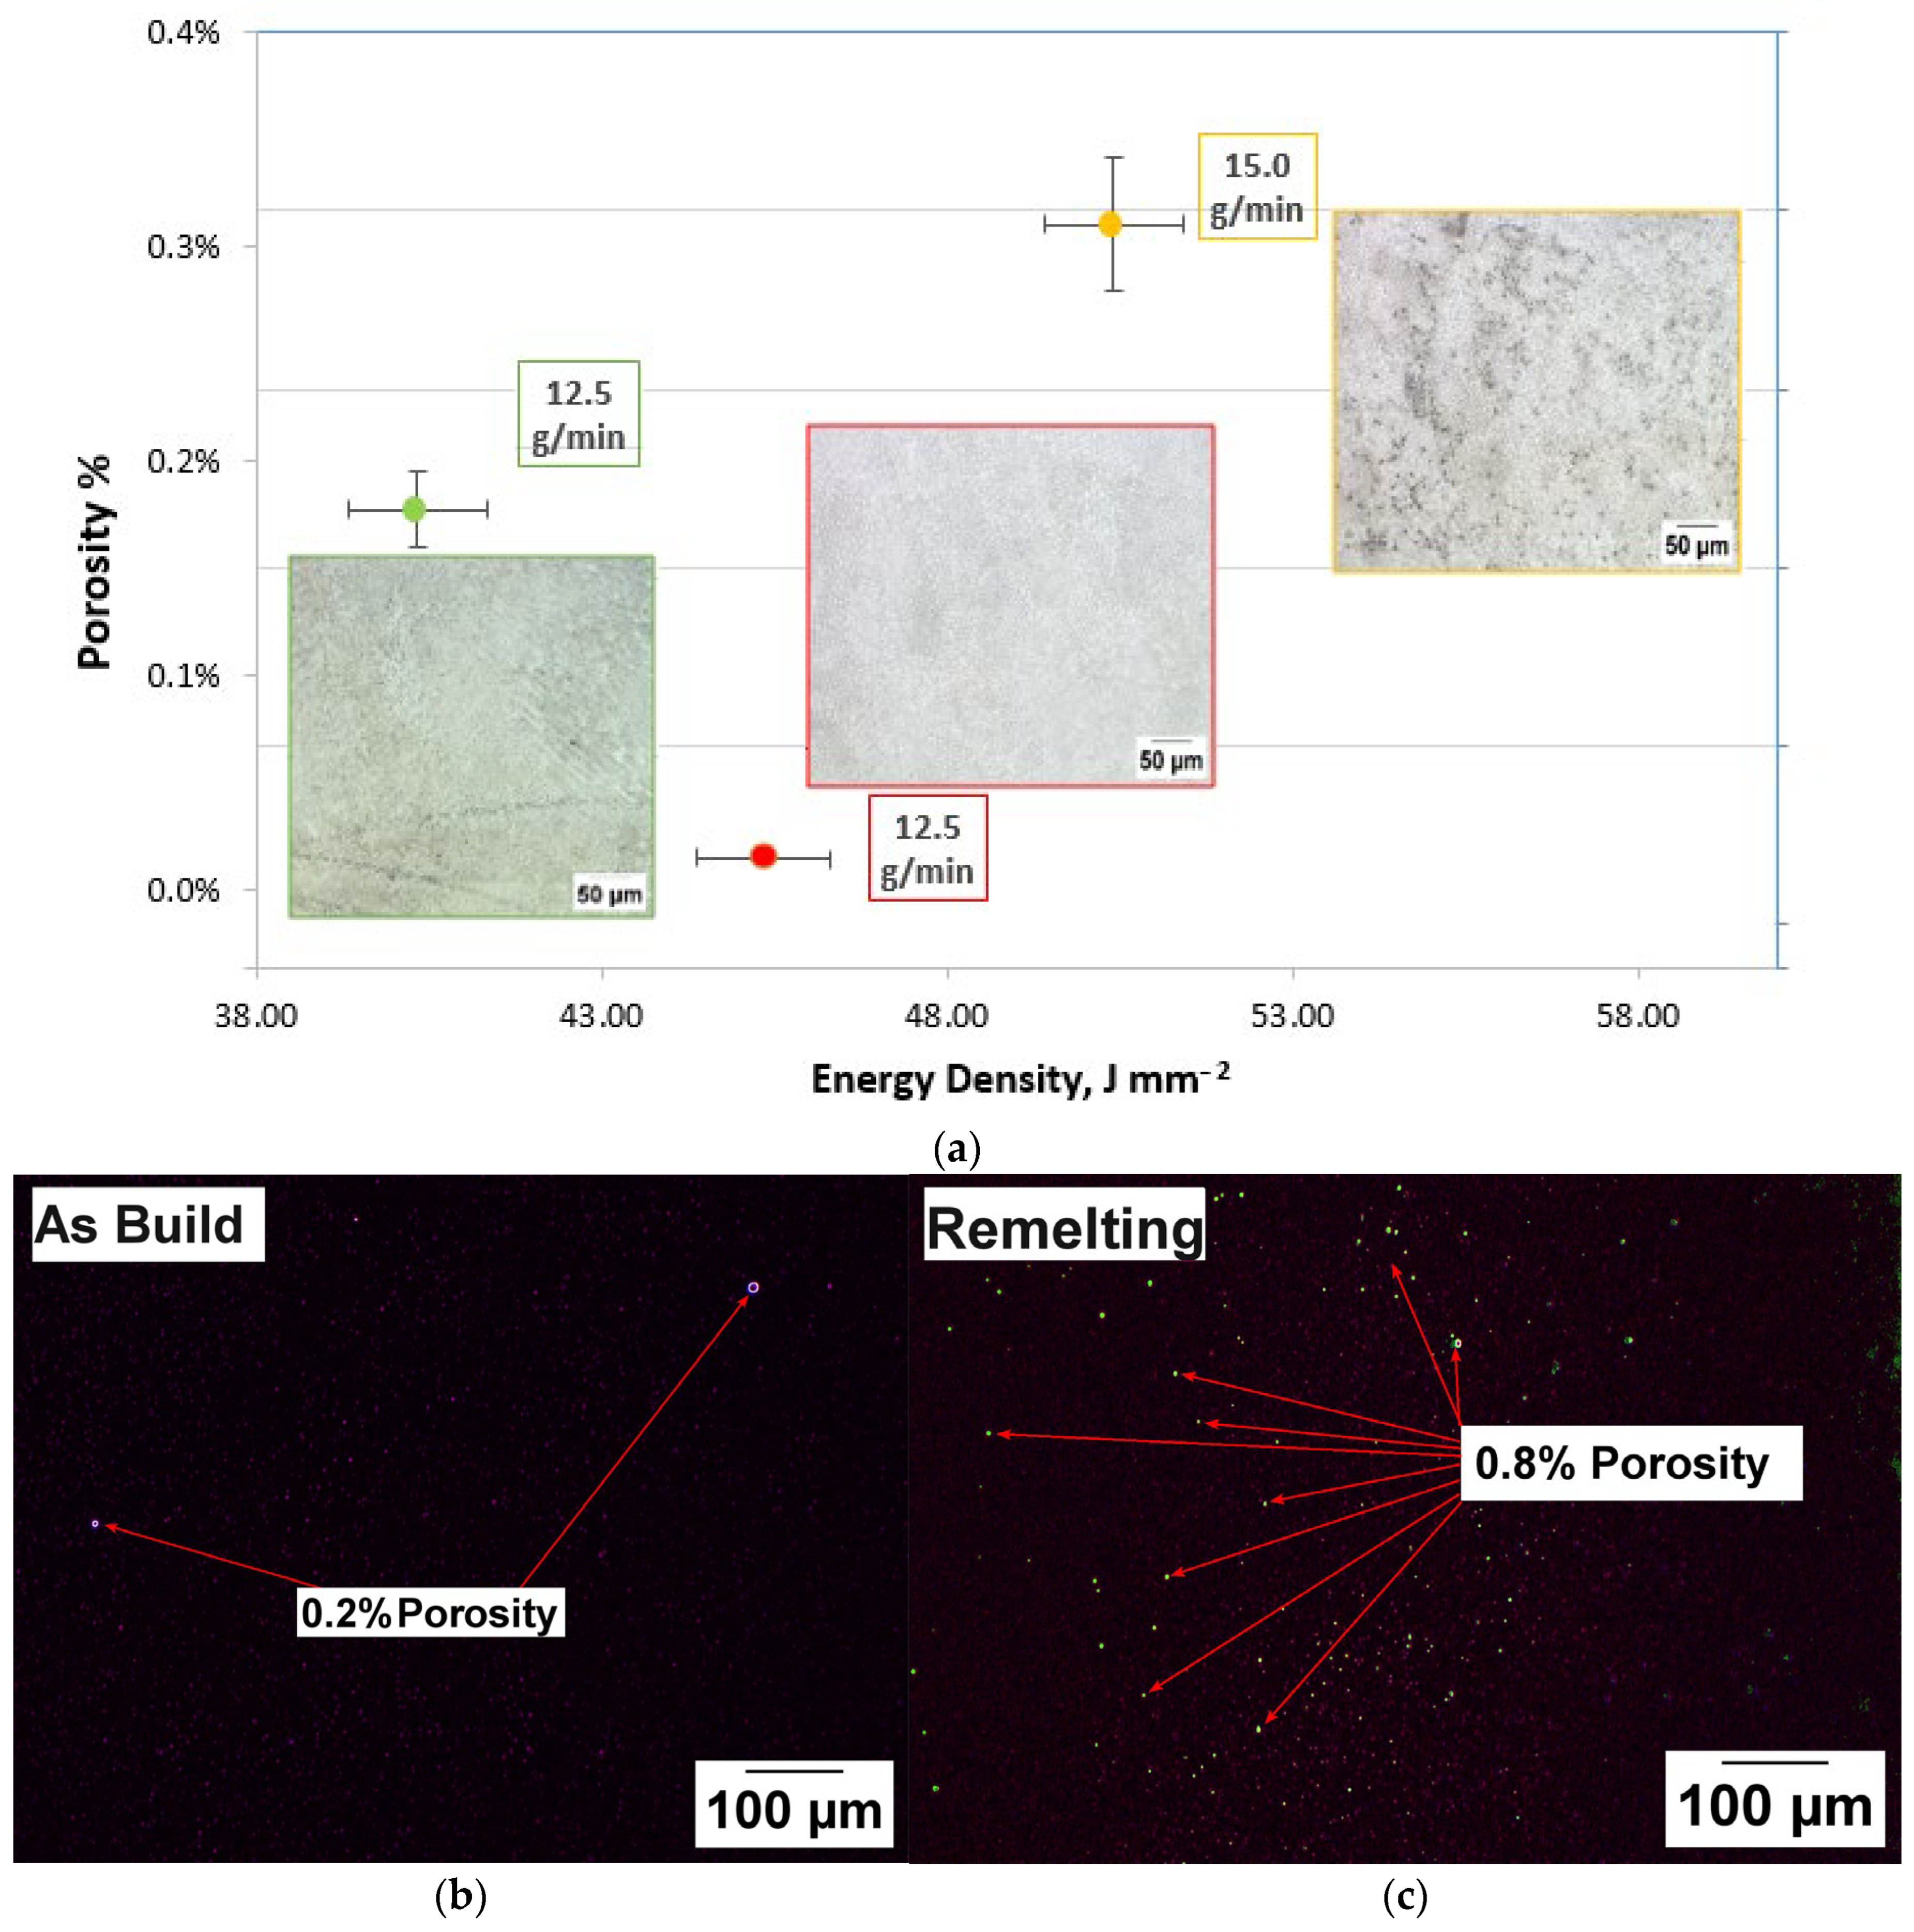
  • The energy density at the powder feed (12.5 g/min) value was 64.52 J mm−2 and showed good improvement after re-melting the porosity, reaching 0.2%. By applying re-melting at these energy and powder-feeding values, the parts to be produced will be produced almost without porosity. Furthermore, it is seen that the amount of porosity does not change in both cases as the energy density decreases at the same powder feed rates.
  • In terms of powder feeding (10 g/min), it is observed that the high energy at 80 J mm−2 values increases the amount of interlayer porosity, while the energy density remains neutral at 55.83 J mm−2 levels. At 40.32 J mm−2 levels, the powders cannot be effectively melted and the amount of porosity for the process increases.
In addition, the formation of porosity may be caused by the pores in the powders used during cladding, gas compression in the upper parts of the melt pool, and a lack of fusion. In light of the reasons mentioned above, there is a correlation between the energy density and powder feed rates to create an effective deposition. In the samples subjected to re-melting, the amount of porosity increased at high energy and low powder feed rates, and it was found that there was no improvement in the porosity ratios at energy densities of 72.58 and 64.52 J mm−2, as in the values of 62.03 and 55.83 J mm−2, and there was no improvement between re-melting. It was concluded that the re-melting process porosity was increased at energy density values of 50.4 J mm−2 and below (Figure 11). A distinct fusion line is formed between the re-melted layers and the previous layers, and this fusion line causes additional porosity formation.
Porosity may occur in the internal structure due to the process parameters (laser power, powder feed rate, and scanning speed) used during DED. The computed tomography method detects the porosities that may occur in the internal structure. Computed tomography (CT) is a radiography technique primarily used in a research context to obtain comprehensive 3D scans of metal parts. In addition, CT is often used to validate the results of other destructive and non-destructive testing methods [21,24,25]. CT can provide detailed visualizations, accurate modeling, and control of the internal and external features. However, it cannot detect cracks and is suitable for large, thick, or radiating stainless steel, etc., with reduced precision in parts. Nevertheless, CT imaging can give reliable results in detecting 1% volumetric porosity in the internal structure due to the high deposition rate of DED, repetitive and high heat input, and steady microstructure. When the CT images obtained within the scope of the study are examined, it is seen that an almost error-free stacking process is performed in terms of porosity in both the as-build samples and re-melting samples (Figure 12).
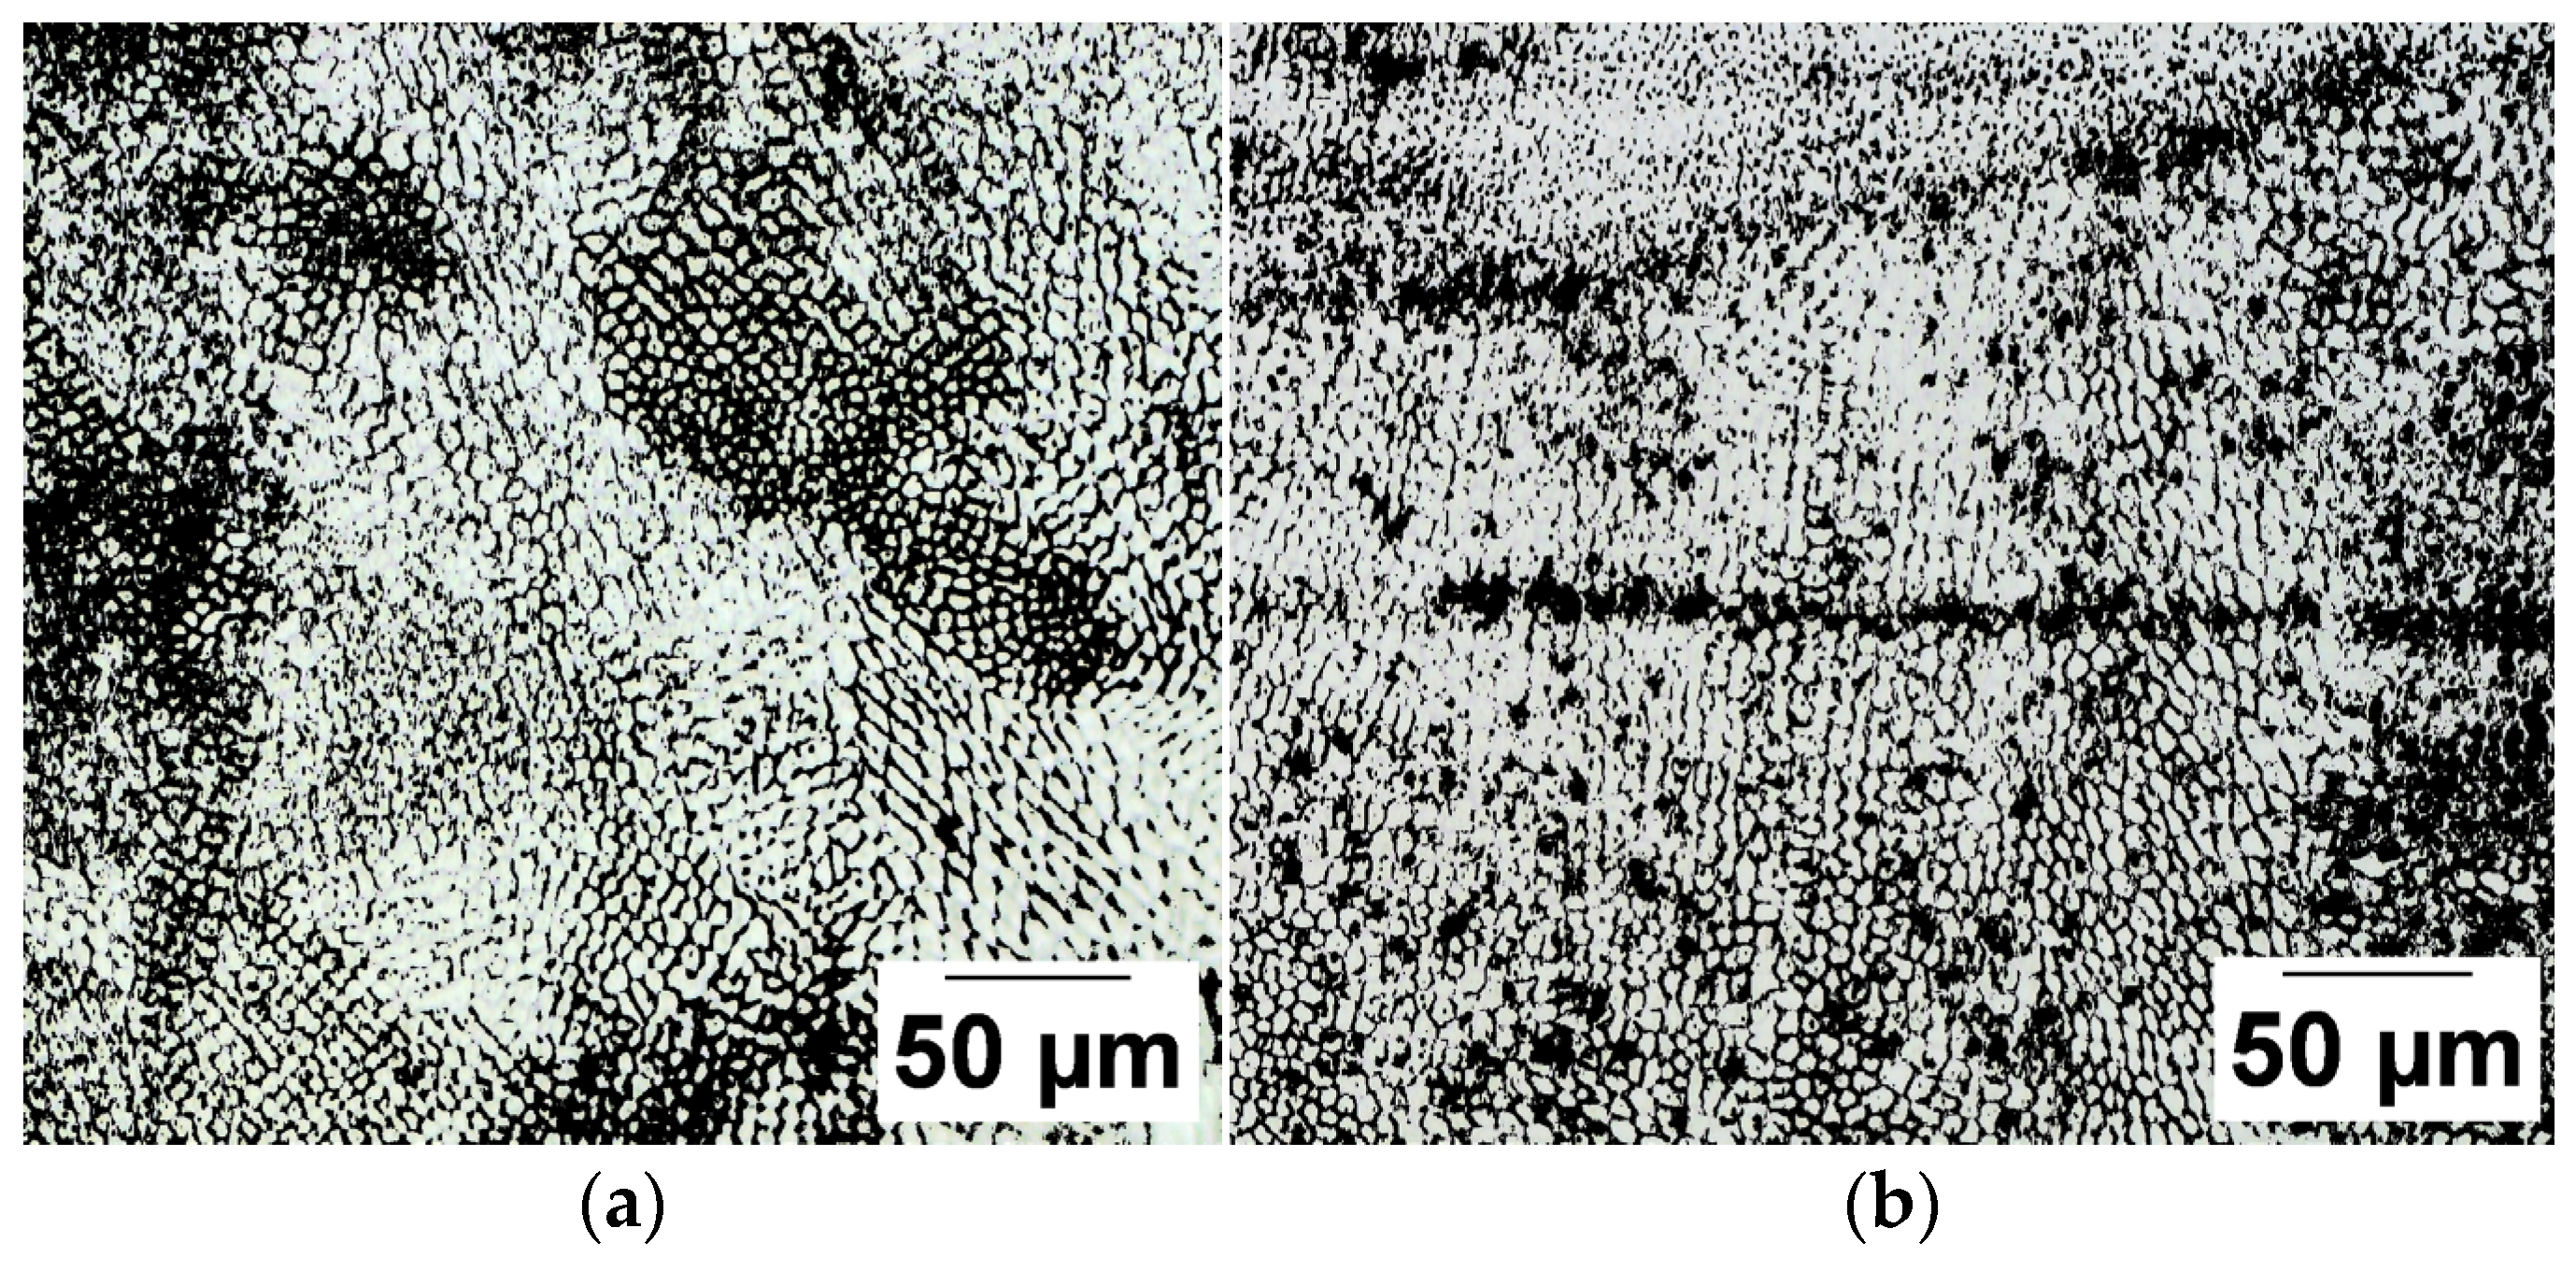
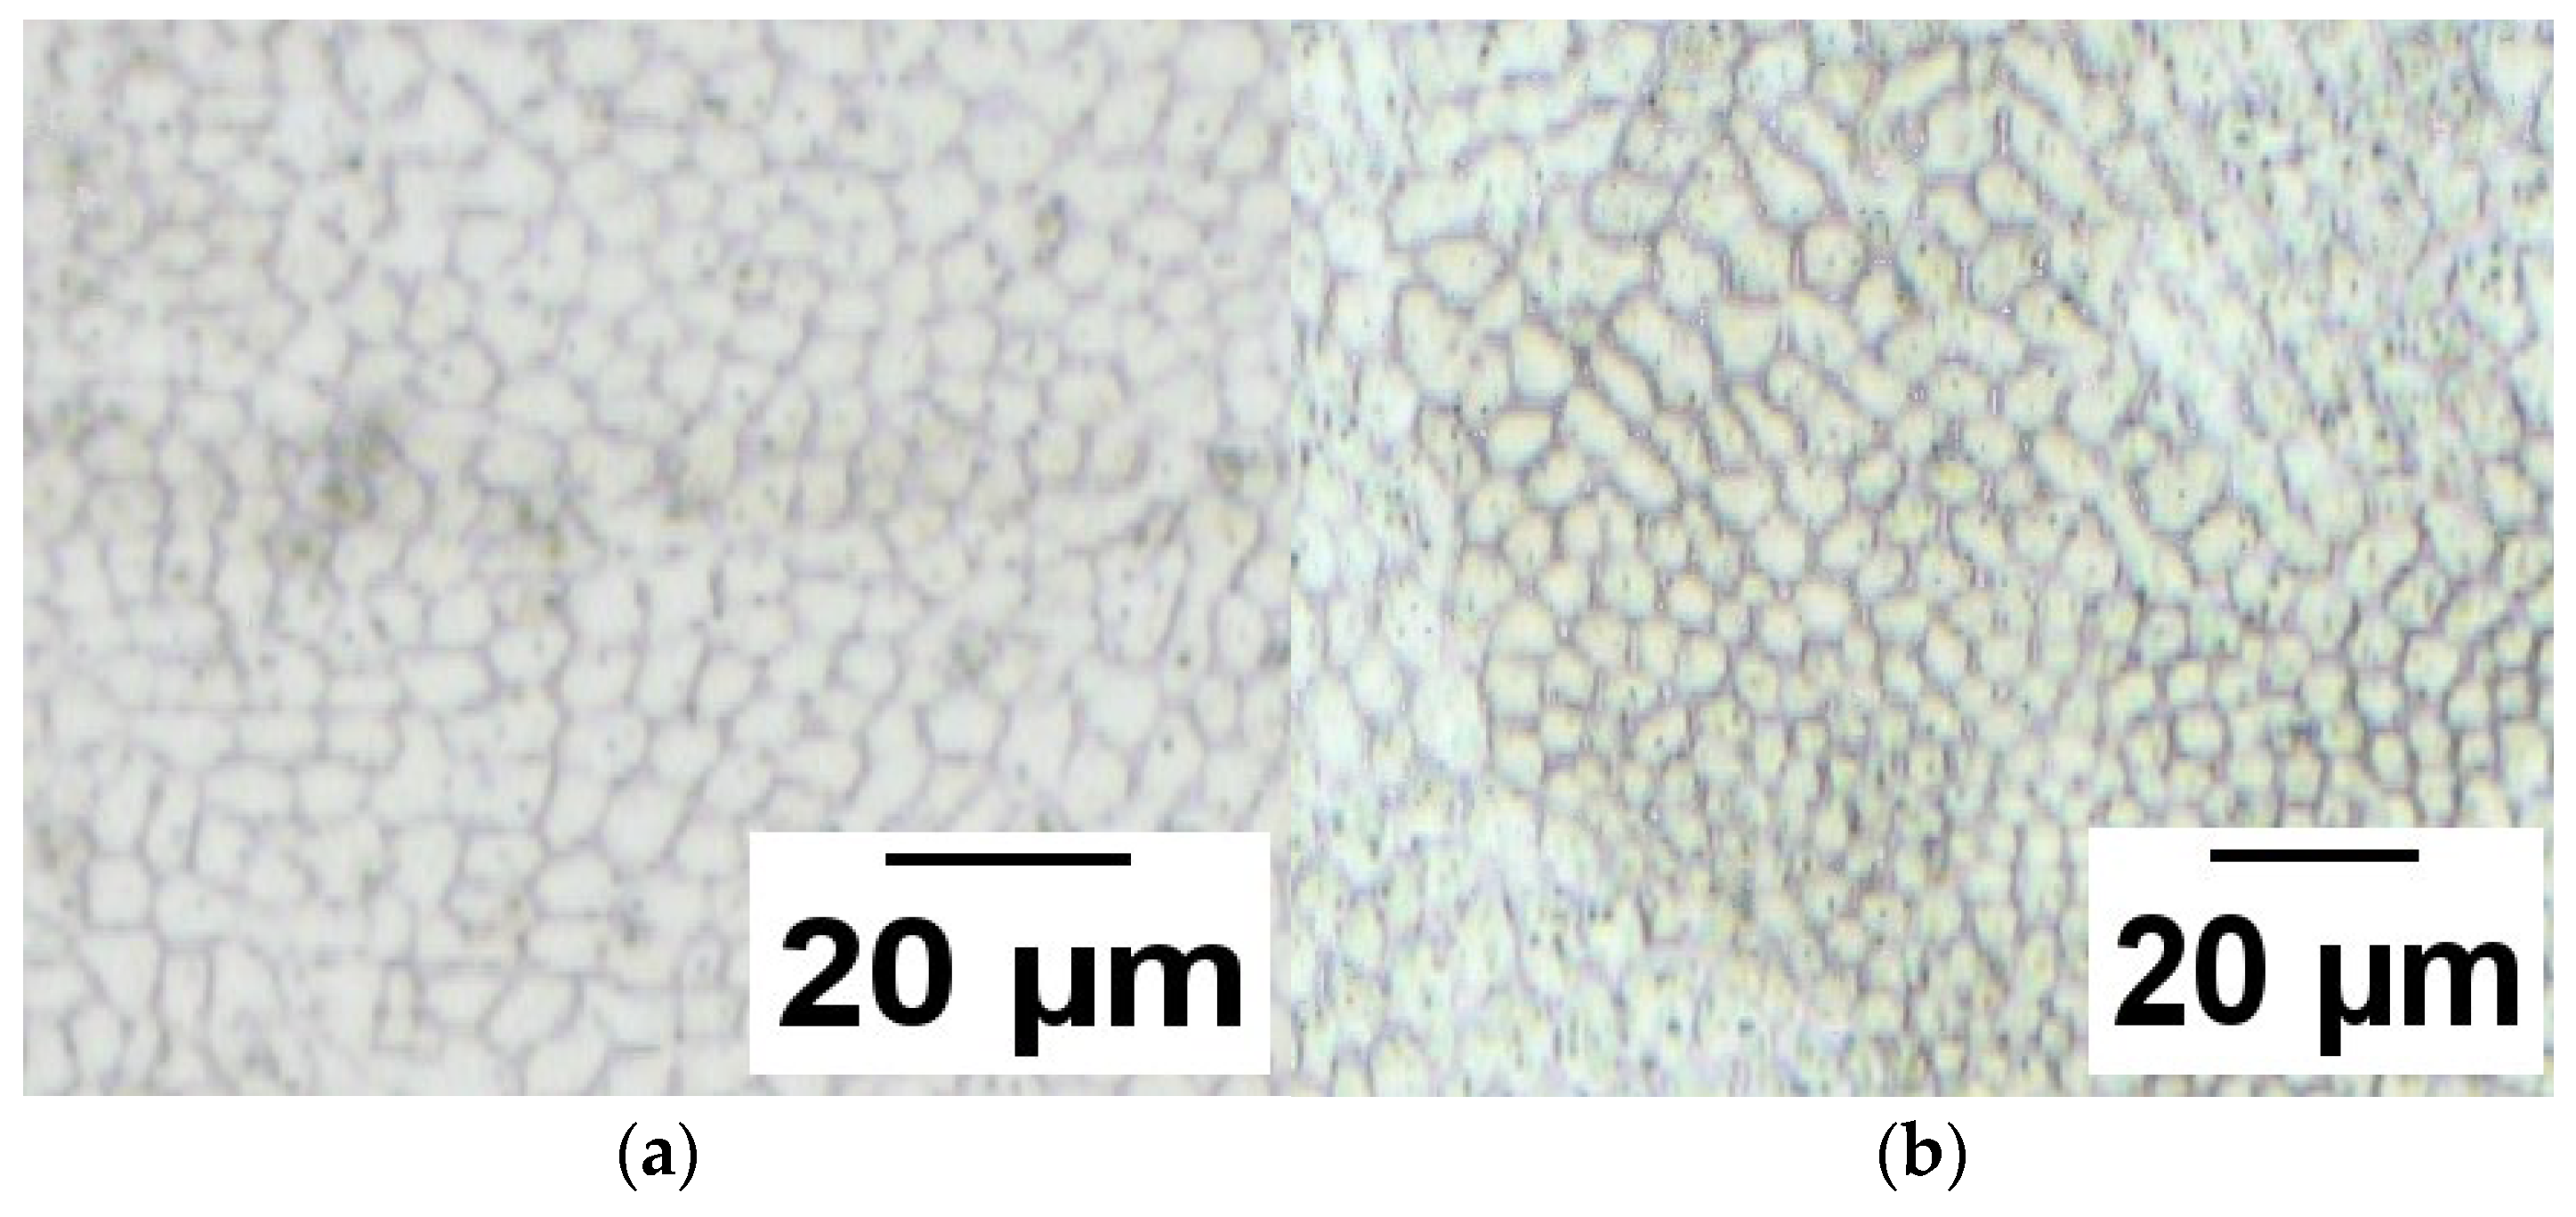
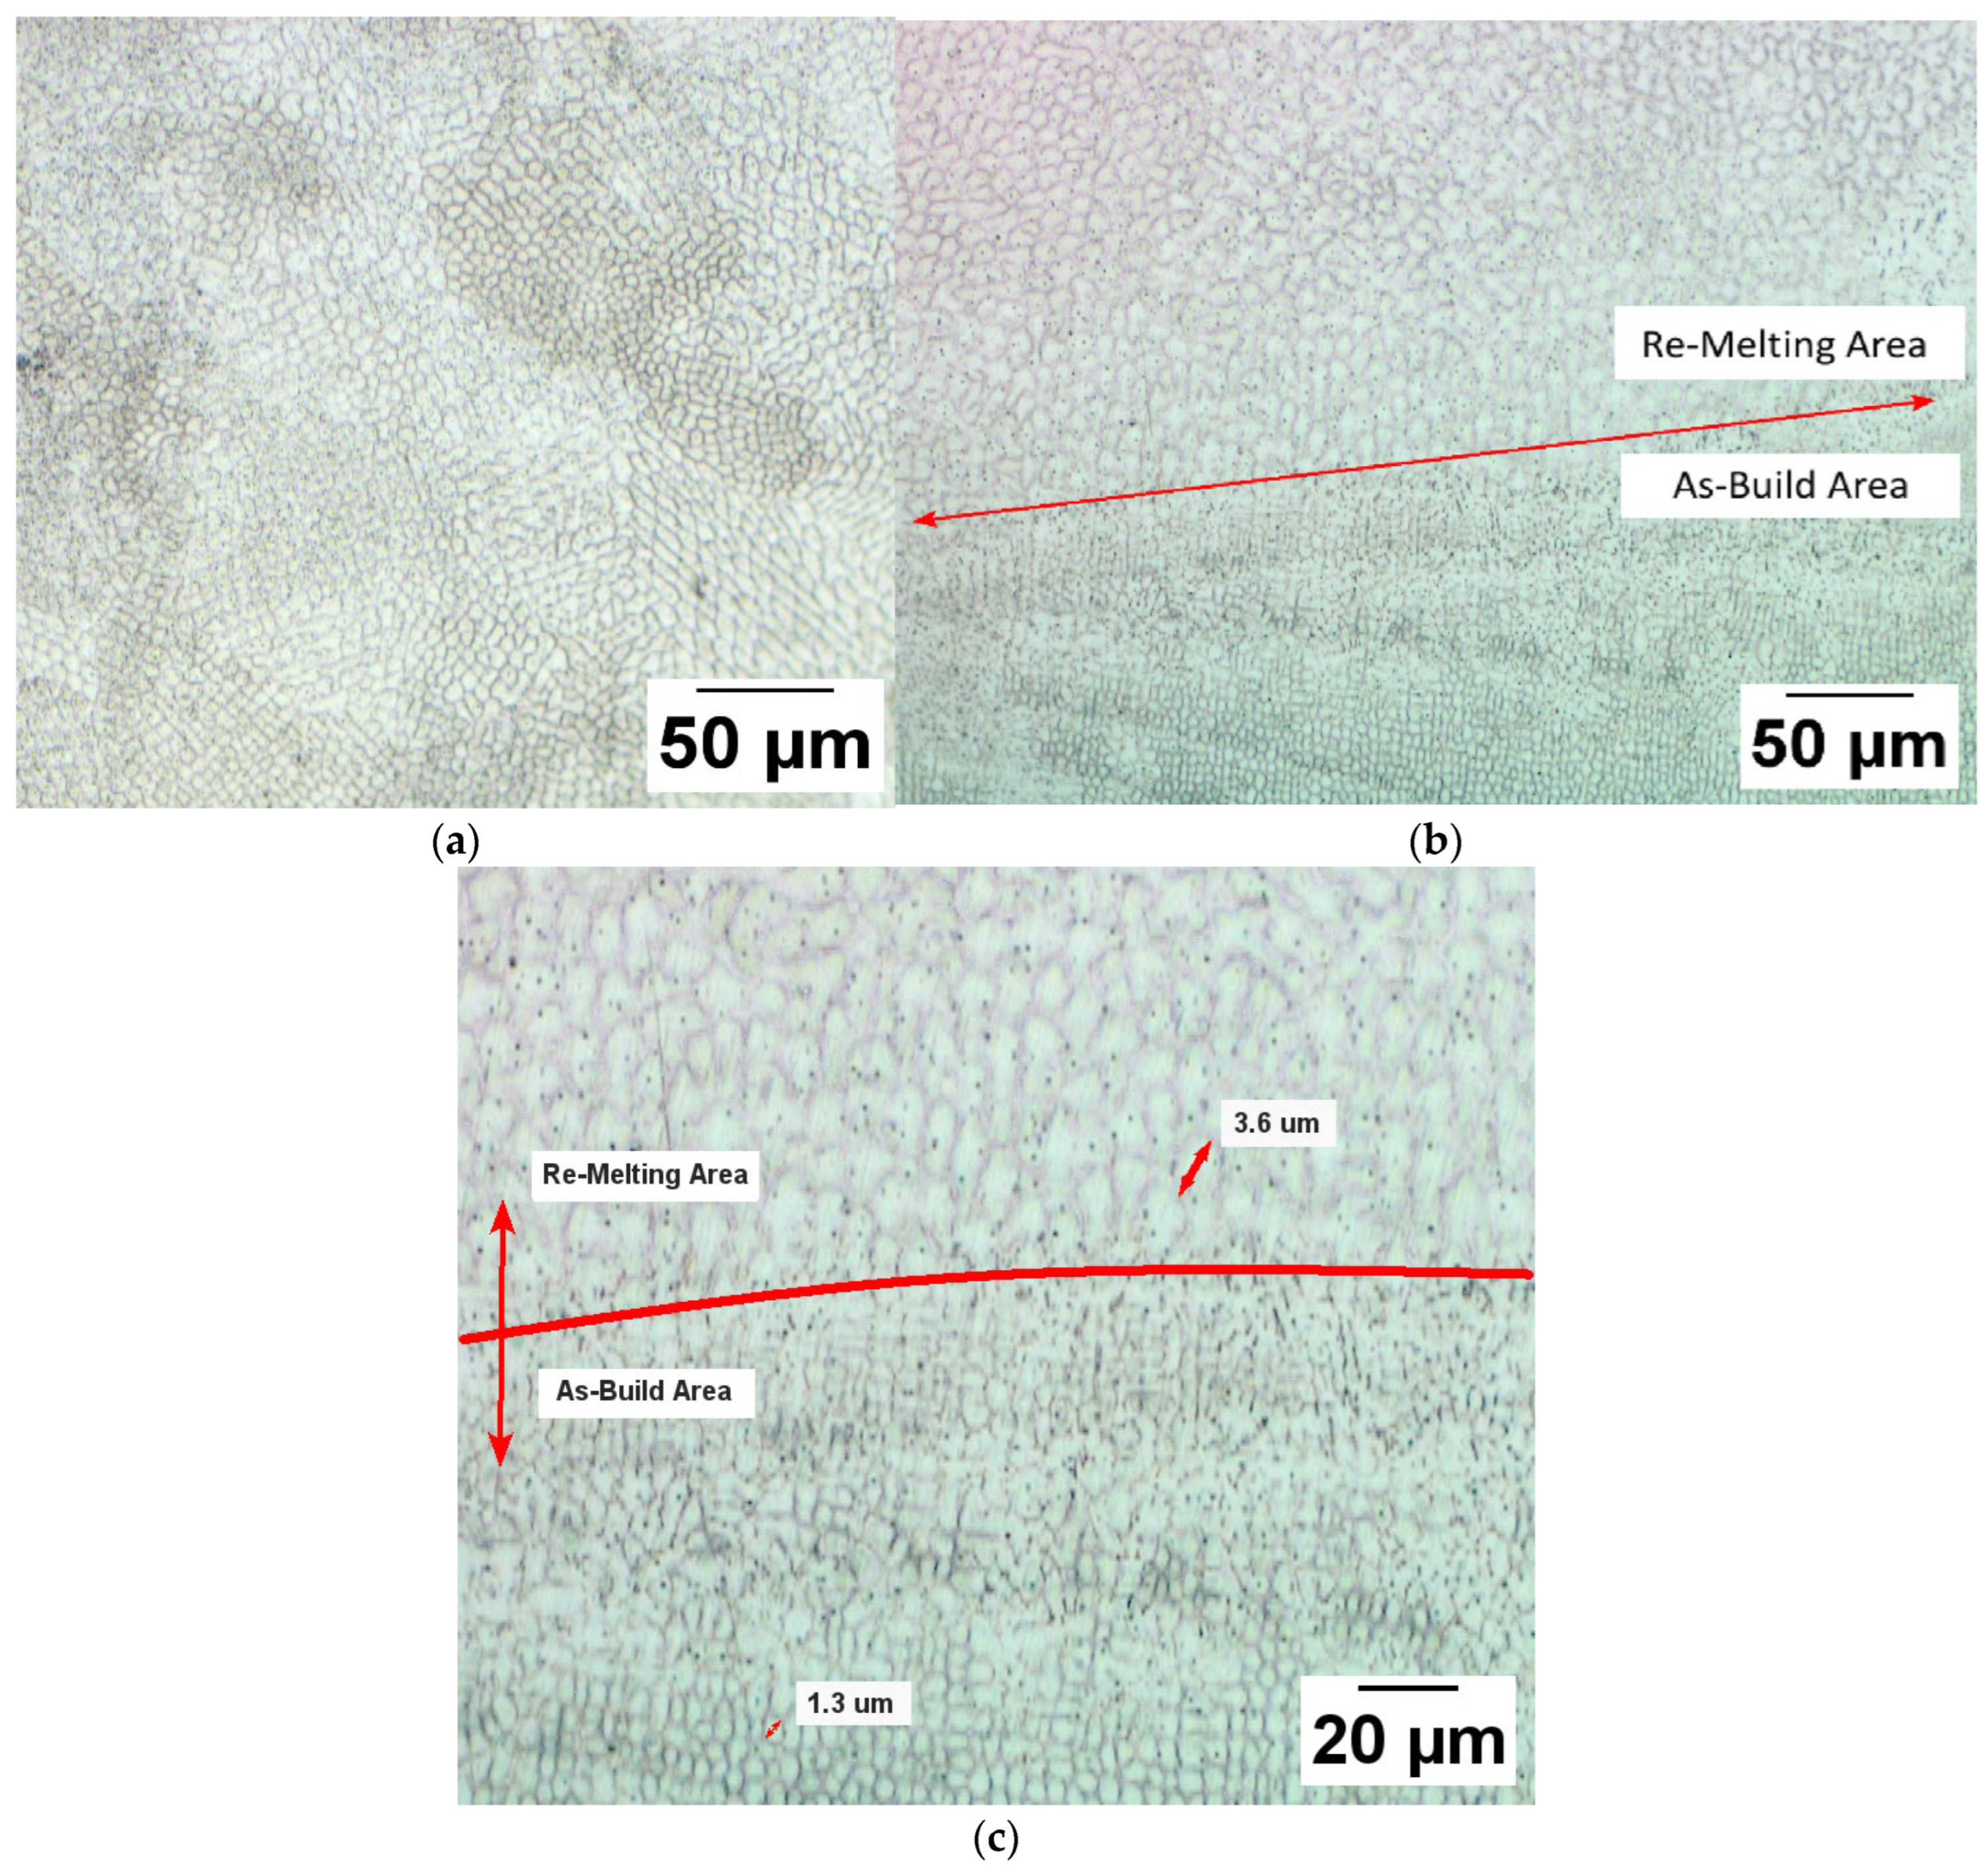
  • Microstructure analysis of 316L SS material: Optical Microscopy (OM) images on the samples produced using the DED method were obtained by cutting the samples perpendicular to the deposition axis. The grain sizes of the parts produced as built-in are between 5 and 10 um and are seen in equiaxed form. The equiaxed shapes depend on the process parameters and rapid cooling to produce 316L material. In addition, the merger between the layers is visible on the line. It is seen that the energy density in the fluid pool during the production process affects the development of the microstructure (Figure 13).
Different grain orientations were observed in all of the samples produced with DED compared to conventional methods. Due to the complex thermal history, an equiaxial, columnar structure and regular transitions can be seen in Figure 13. This microstructure describes microstructure changes such as high solidification rates, thermal histories, and high deposition temperatures of alloys produced through additive manufacturing [30]. Depending on the thermal history, many homogeneous and equiaxed structure formations can be seen in Figure 11. Such structures comply with the literature on producing 316L steel with DED [31].
Re-melting slightly affects the material’s microstructure and causes a small amount of grain growth [32]. As can be seen in Figure 14c, the grain growth observed in the re-melting layers was approximately three times larger compared to the base regions. In addition, small increases in the porosity and some decreases in the impact strength are observed in the samples after re-melting due to grain growth. Finally, the relationship between the grain size and solidification properties was theoretically predicted, and grain growth’s effect on the mechanical properties was superficially explained by examining the deposition geometry on the grain size of different layers.
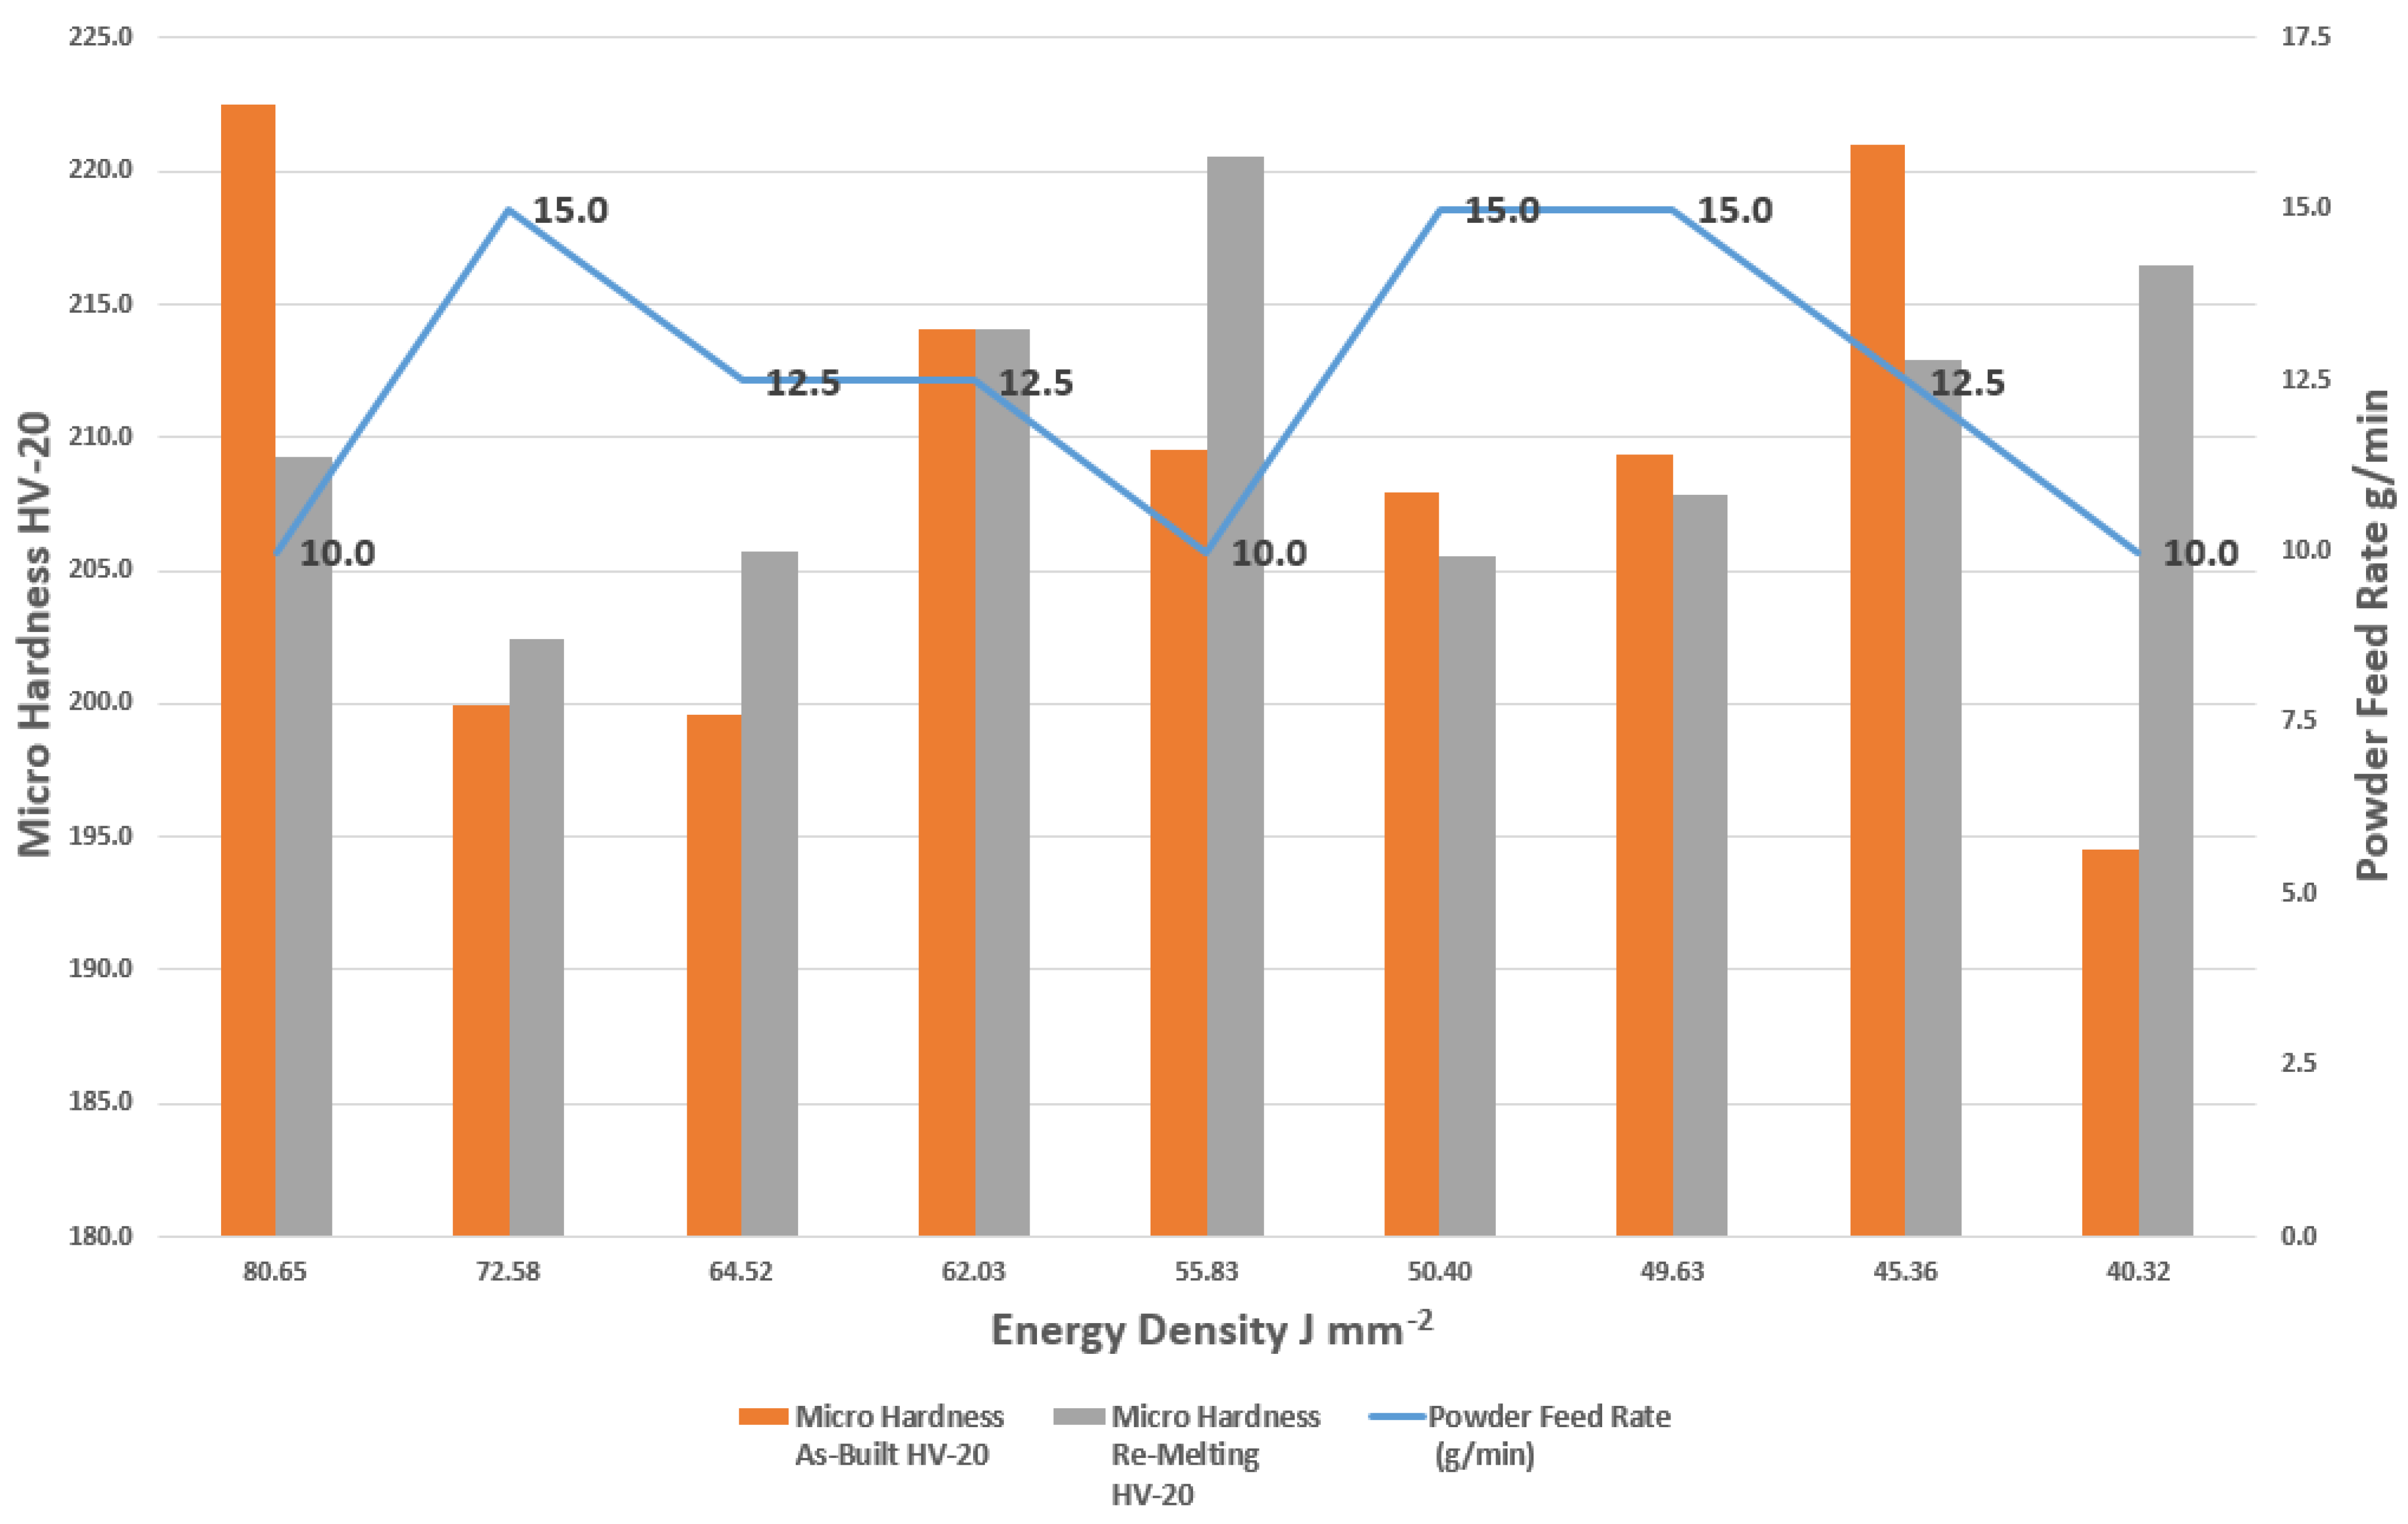
  • Micro-hardness: Although continuity was observed in the grain structures of all the samples, different micro-hardness values were measured depending on some of the powder feeding rates and energy densities. The decrease in the energy density and the increase in the powder feed cause the micro-hardness values of the samples to decrease, even if only slightly. On the other hand, although the energy density decreases in the re-melted samples, it is seen that the additional laser applied between the layers slightly enlarges the grain structure, which causes a slight increase in the micro-hardness (Figure 15). When compared with the literature, it was observed that the micro-hardness values of the produced samples were as low as about 15%.
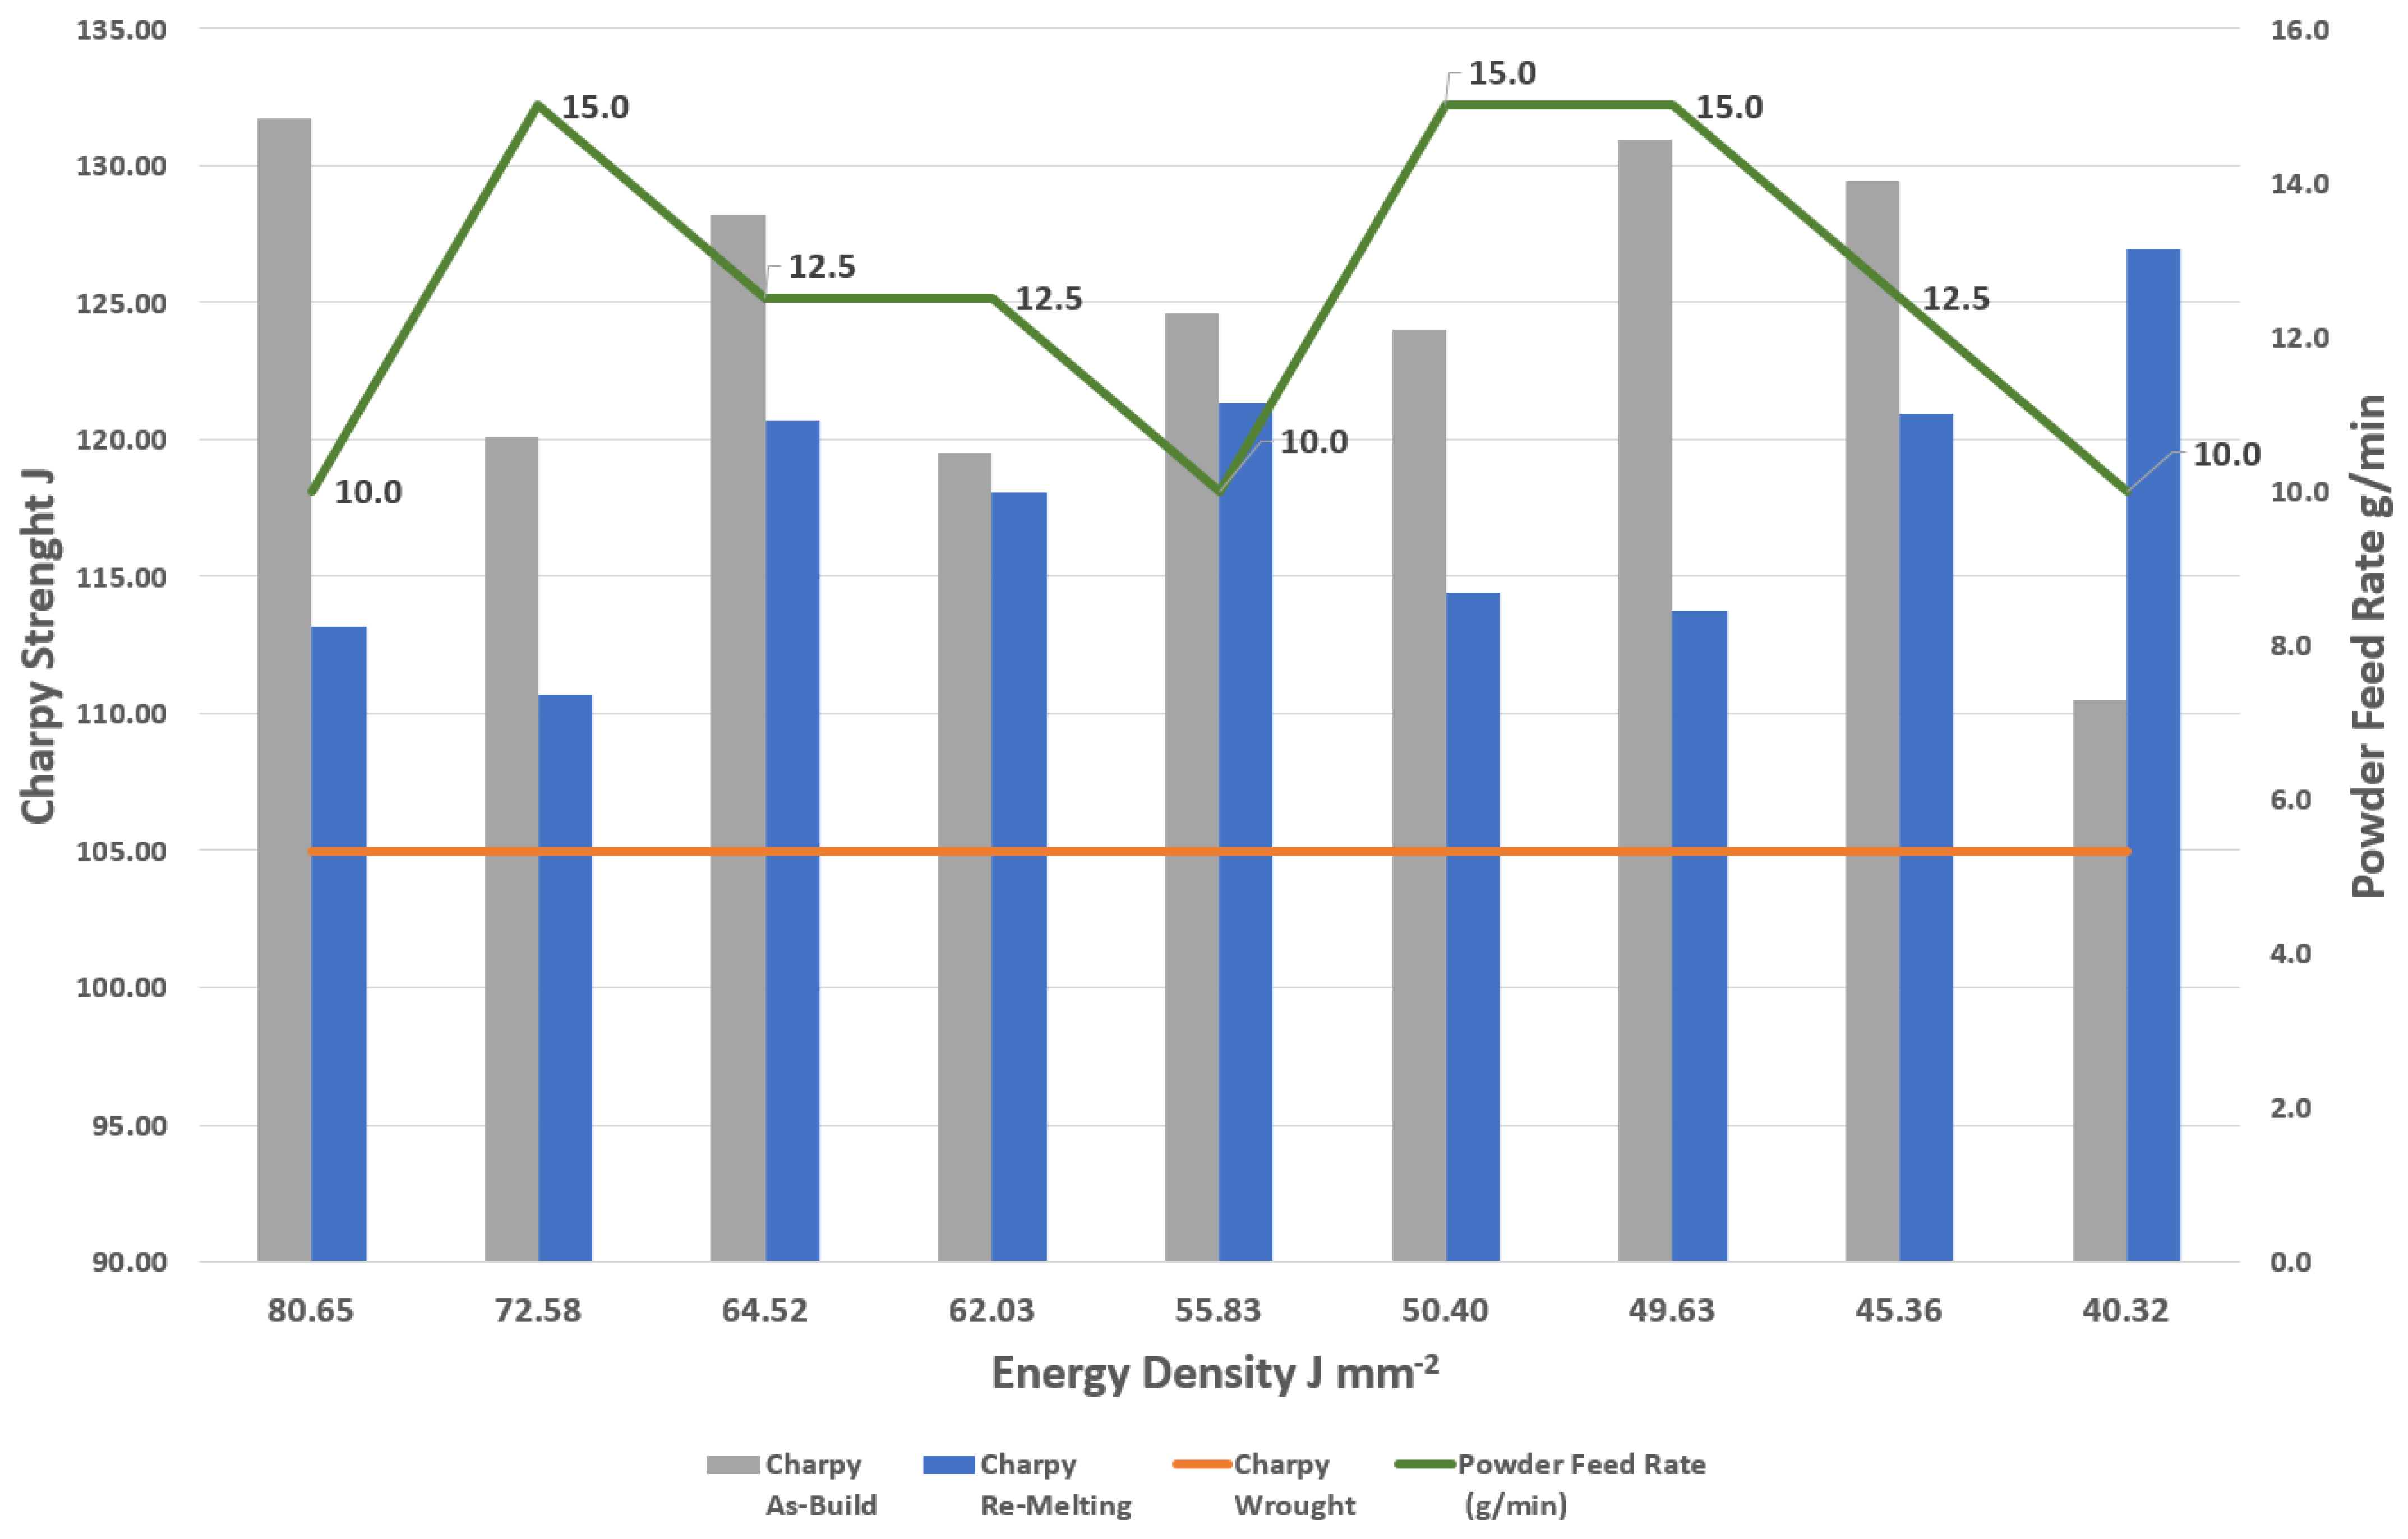
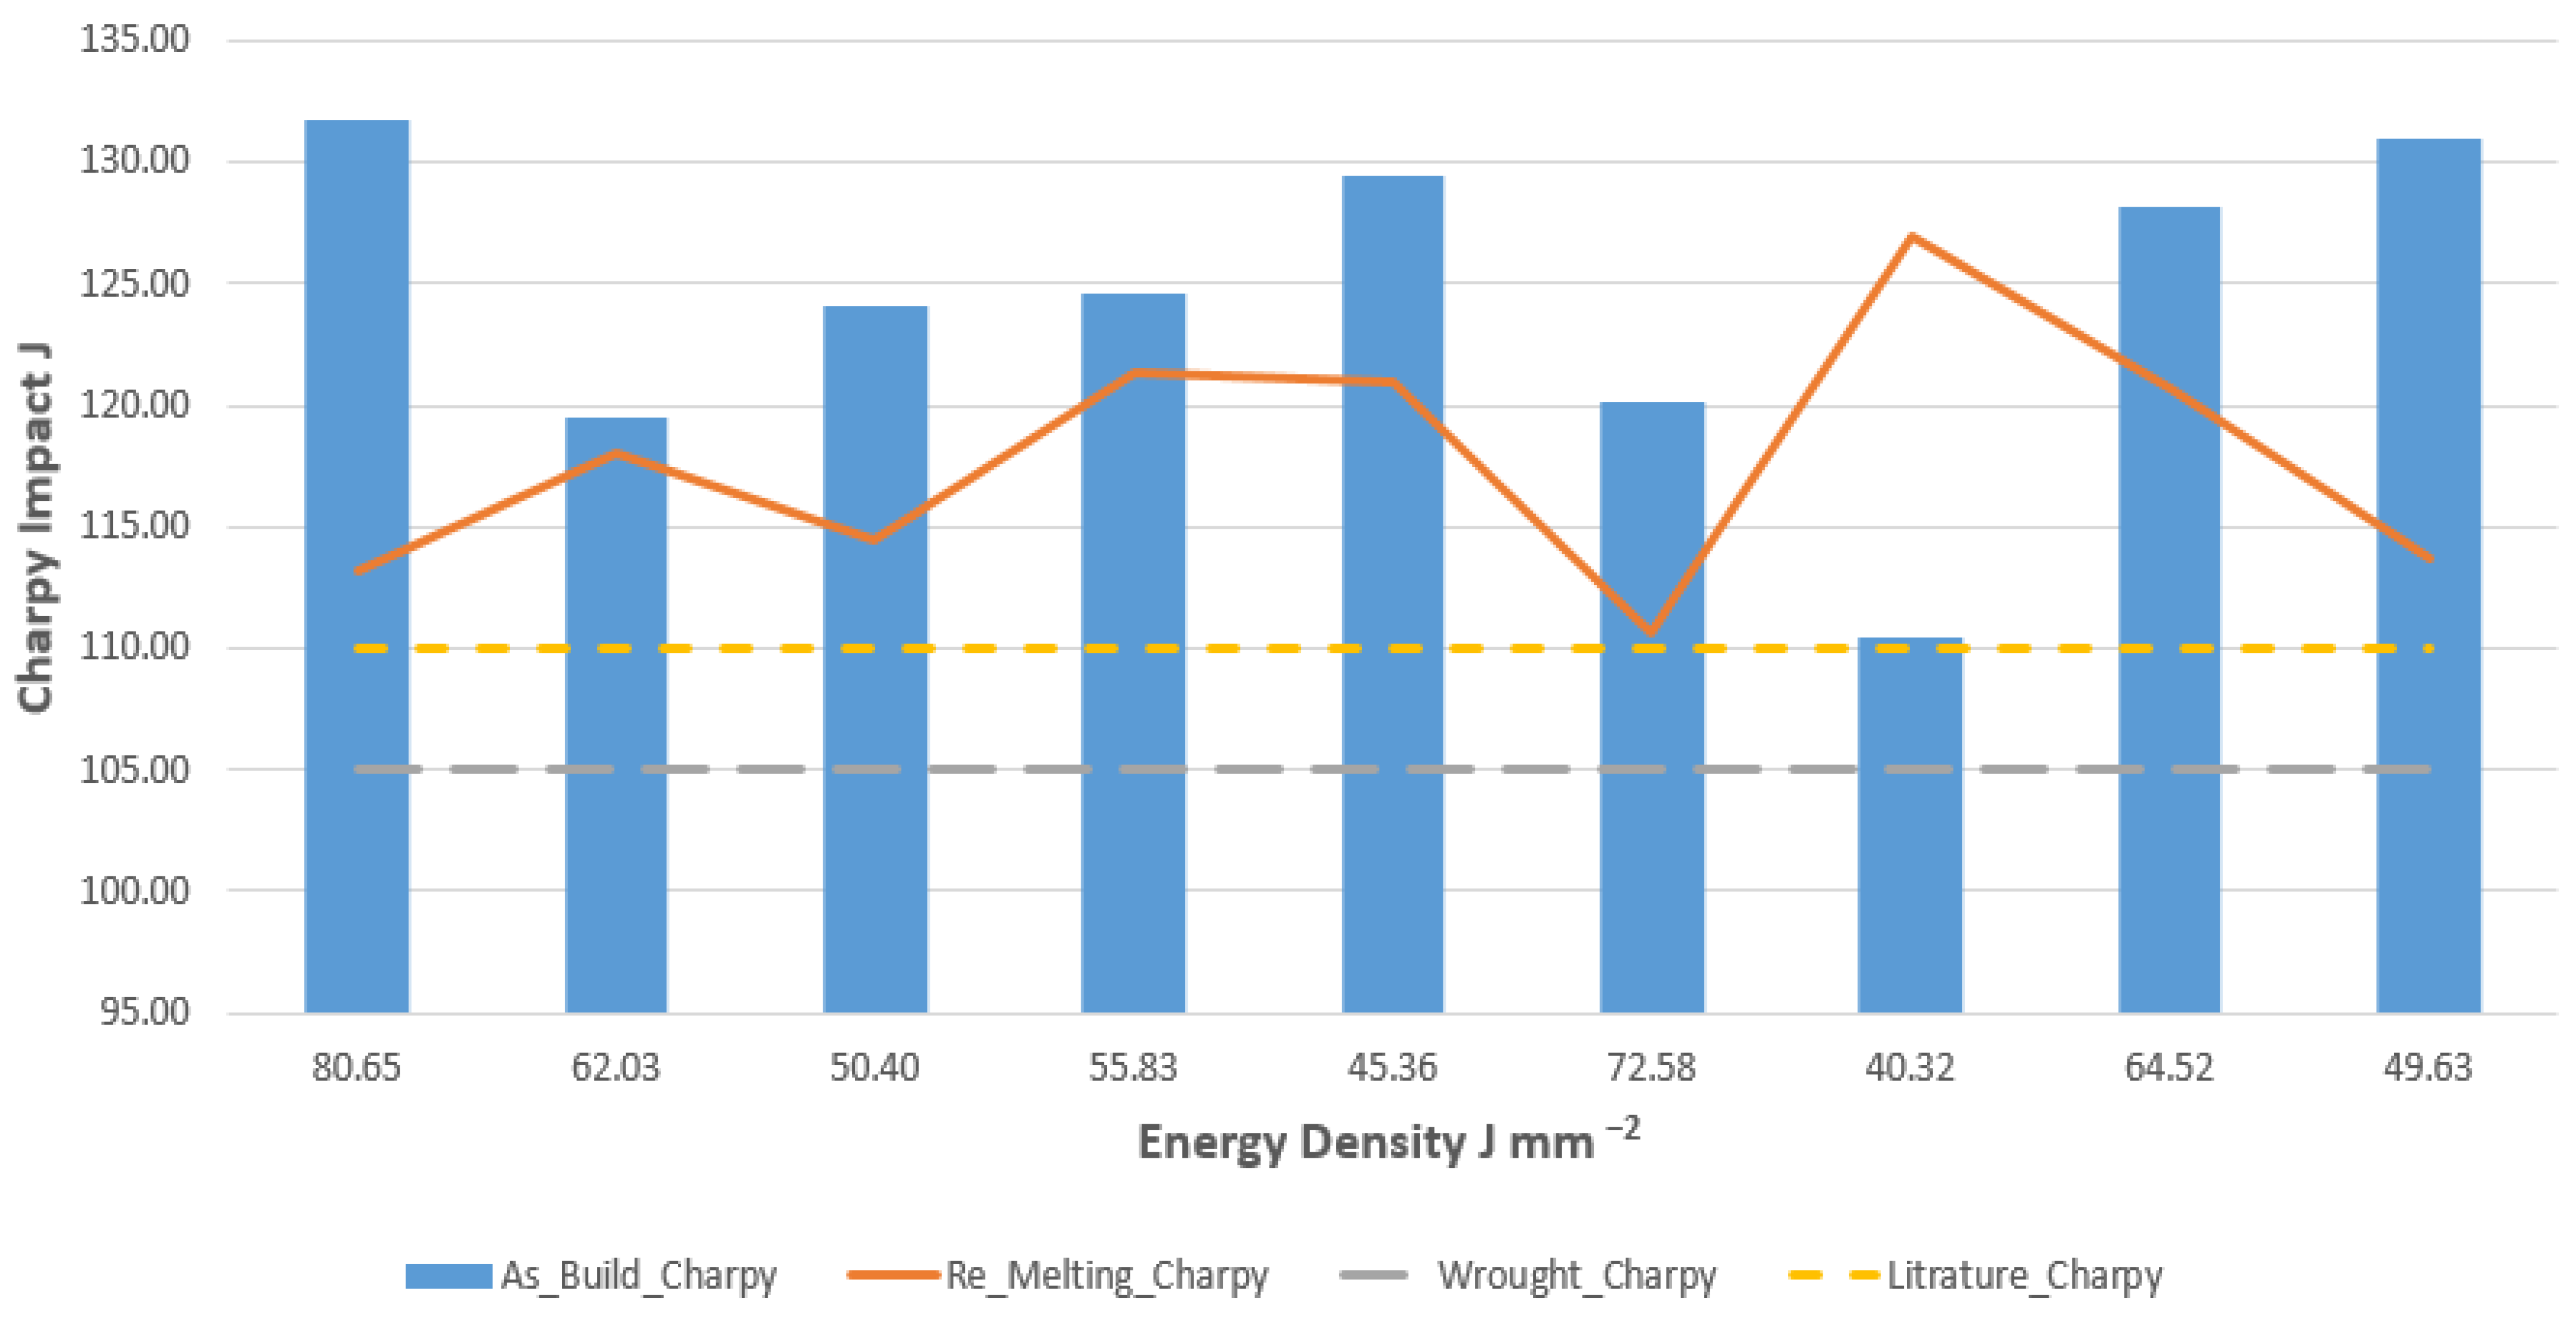
  • Charpy impact: It expresses the resistance of the material against the propagation of the crack that may occur through impact and measures the impact resistance of the material against the stress concentration. The energy densities of the samples with the highest Charpy impact in the as-build samples are 80.65, 49.63, and 45.36 J mm−2, respectively (Figure 16). The Charpy impact ranges are between 110 J and 131.70 J. The Charpy impact varies depending on parameters such as the energy density, porosity, and differences in the microstructure. When evaluated in terms of dynamic loads, it is seen that the obtained impact strengths are higher than those of the wrought materials produced by traditional methods.
The Charpy test results of the samples produced through re-melting show slightly lower values compared to the as-build samples. Although there is no change in the energy densities, this decrease in value can be explained by considering a secondary laser application, the amount of porosity, and changes in the microstructure. In addition, the time-dependent thermal gradient (re-melting) in the parts produced through additive manufacturing negatively affects the impact strength and fatigue life and increases the stress intensity and crack growth [33,34,35]. The Charpy strengths of the re-melted samples vary between 110 J and 126.93 J. The difference in the Charpy strengths between the samples with increased porosity after re-melting and the as-build samples is shown in Figure 16. The porosity values increased in some samples after re-melting, and it is known that this value increase reduces the strengths by 10%. It is predicted that these changes in the impact strengths may be caused by new micro-fracture formations that can occur in the microstructure during re-melting [36].
The impact strength values of the as-build samples obtained in this study are higher than those of the 316L parts produced through DED (average 90–110 J mm−2) in the literature. The impact strength of the 316L materials produced through conventional manufacturing is 105 J mm−2 [37]. In addition, as there is no study on re-melting in DED in the literature, a comparison cannot be made. More research can be conducted by changing the re-melting strategy. All of the values obtained by the Charpy test (absorbed energy) in this study show higher values than those found in the literature for the 316L SLM (Figure 17).
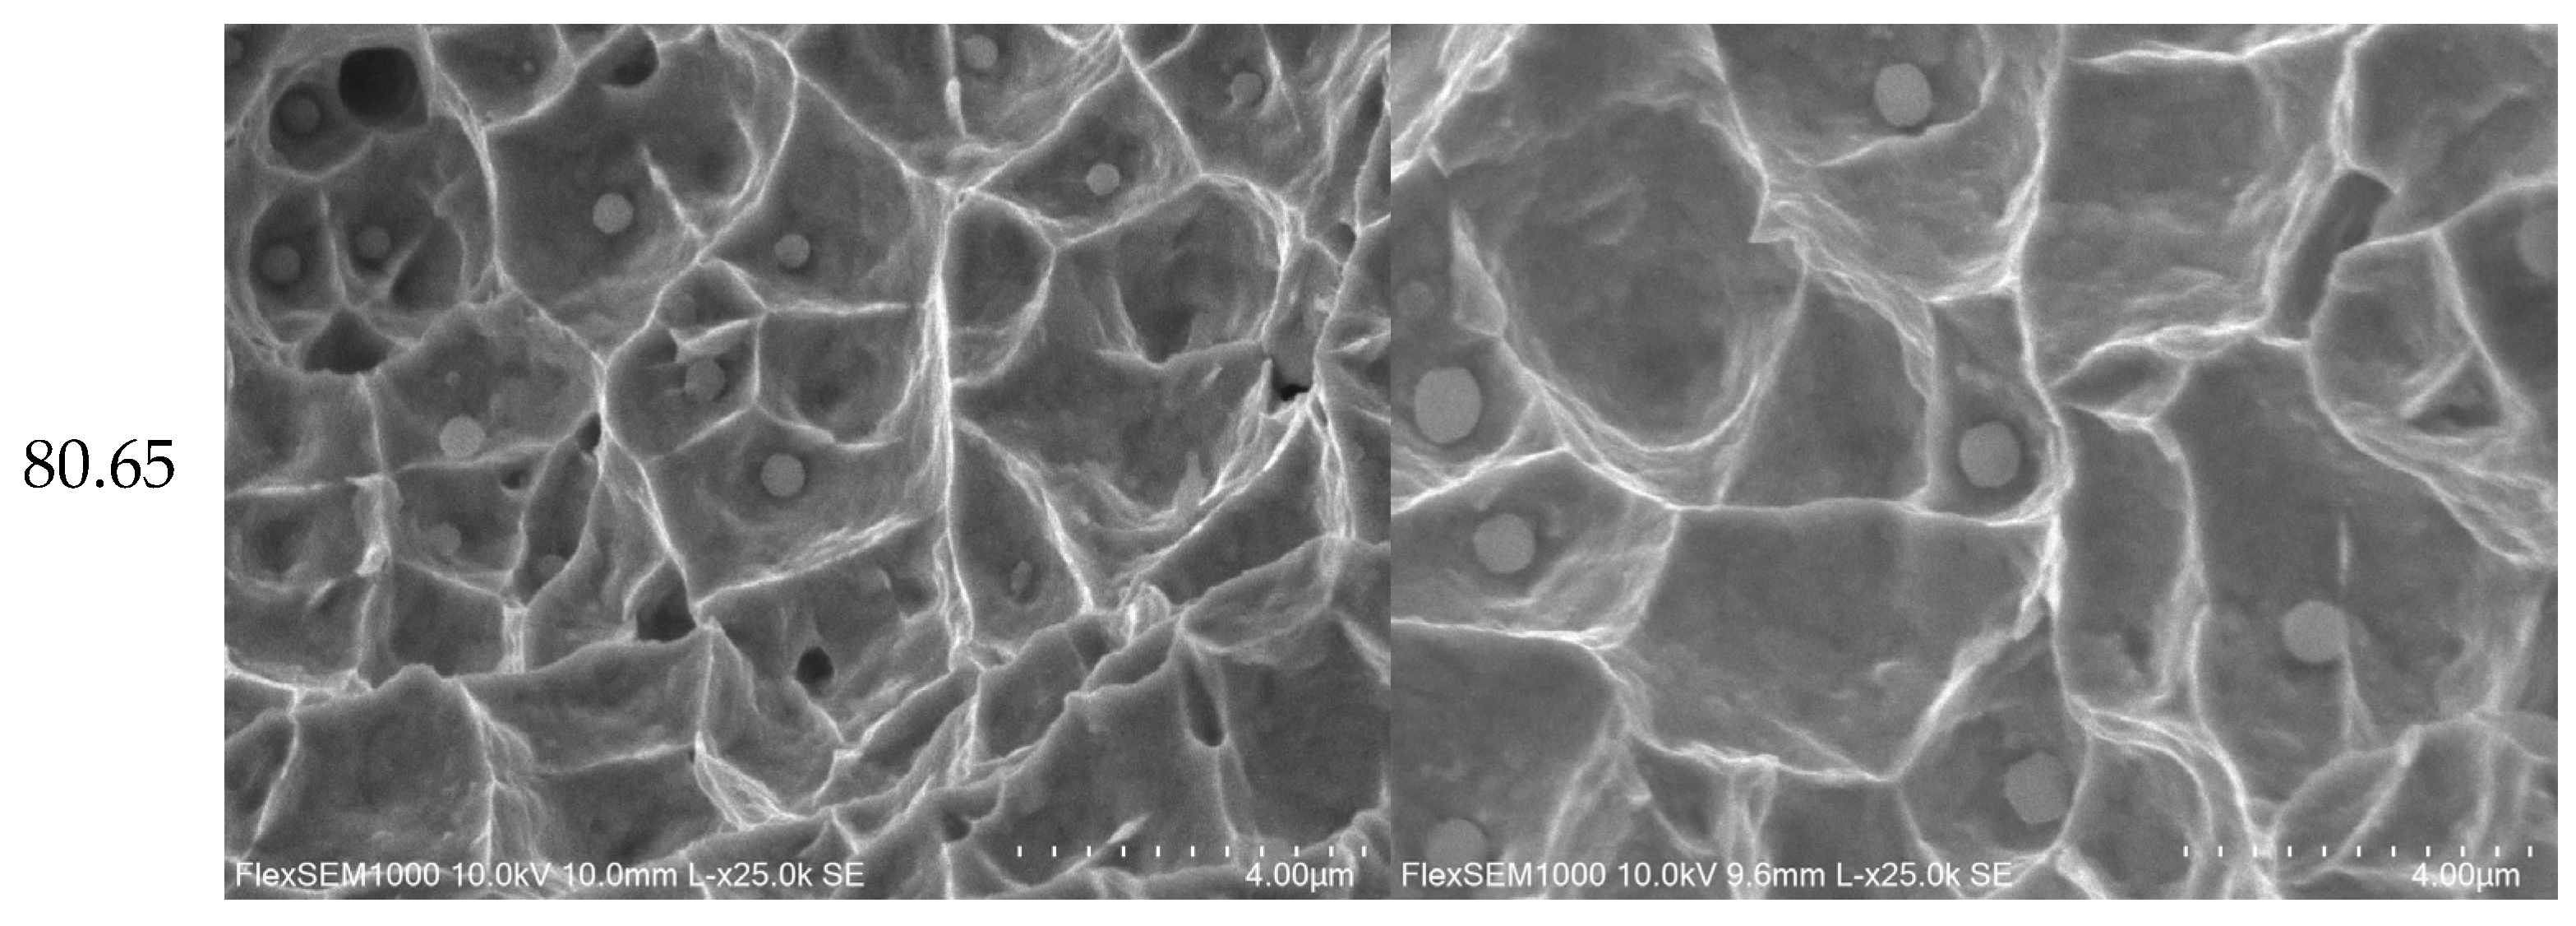
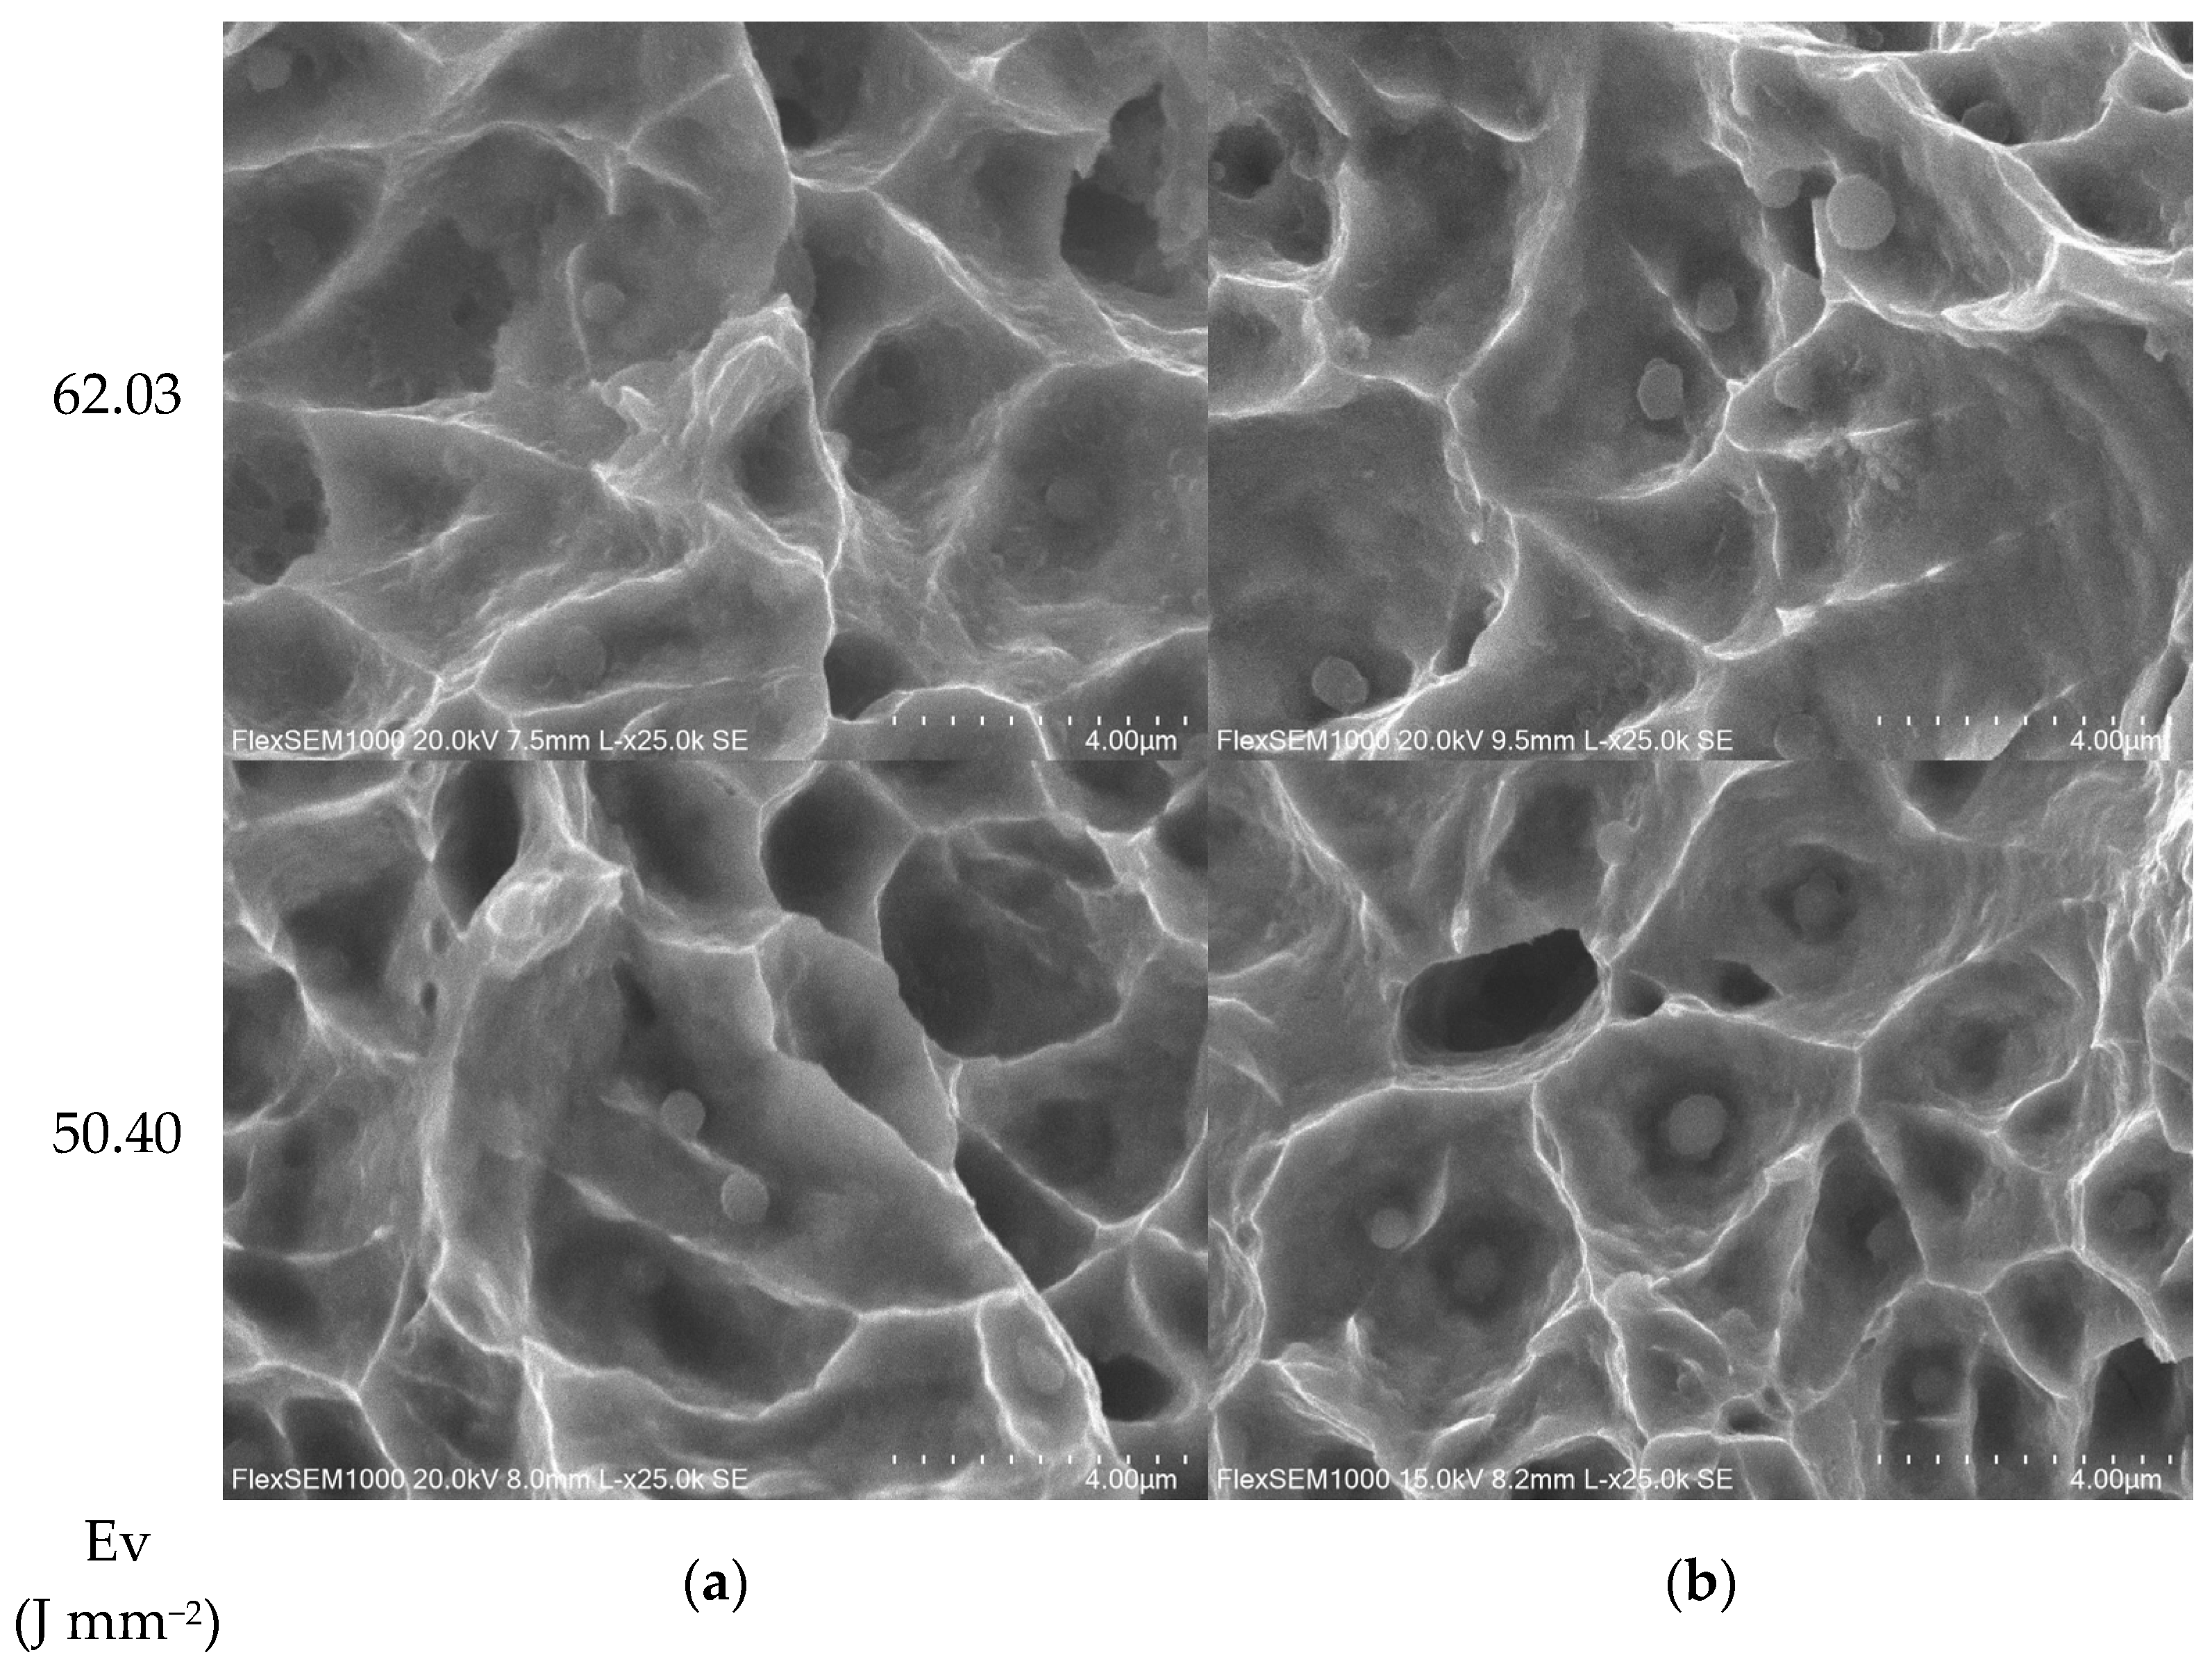
  • Fracture surface analysis: The fracture surfaces of the Charpy samples were investigated under SEM to understand the changes in their mechanical properties after the as-build and re-melting processes. As seen in Figure 18, complex shapes such as dimples and divisions are shown on the fracture surfaces of the samples.
While a ductile fracture is seen in the as-build samples, for the re-melting samples, lower impact strength results were seen in the samples with good ductility. In addition, these wider and shallower dimple pores can explain the low impact resistance between as-build and re-melting. When the dimensions of the pores are compared, the dimple pores, which are approximately 0.5 µm in the samples, show a size of 1 µm in the samples that are re-melted.
In Figure 18, classical hollow, porous structures can be seen when examined through SEM. In addition, Fe-Cr-O-based oxide particles of a few hundred nm in size and Cr-rich carbide particles with a very coarse diameter of a few µm were partially observed in the center of the pit, although the samples were very small. No un-melted particles were observed.

4. Conclusions

In this study, the optimization of the process parameters affecting the mechanical properties of the parts produced through the DED method has been analyzed analytically and experimentally. It has been observed that the effects of the process parameters on the mechanical properties of the samples to be produced are quite high. The effects of the laser power, powder feed rate, scanning speed, as-is, and re-melting processes were analyzed to improve the mechanical properties. The method’s most significant advantage was the very small microstructure defects and parameters affecting the mechanical properties due to the high deposition rate and rapid cooling. As a result of the experiments, the following findings were discussed for effective cladding and suitable mechanical properties:
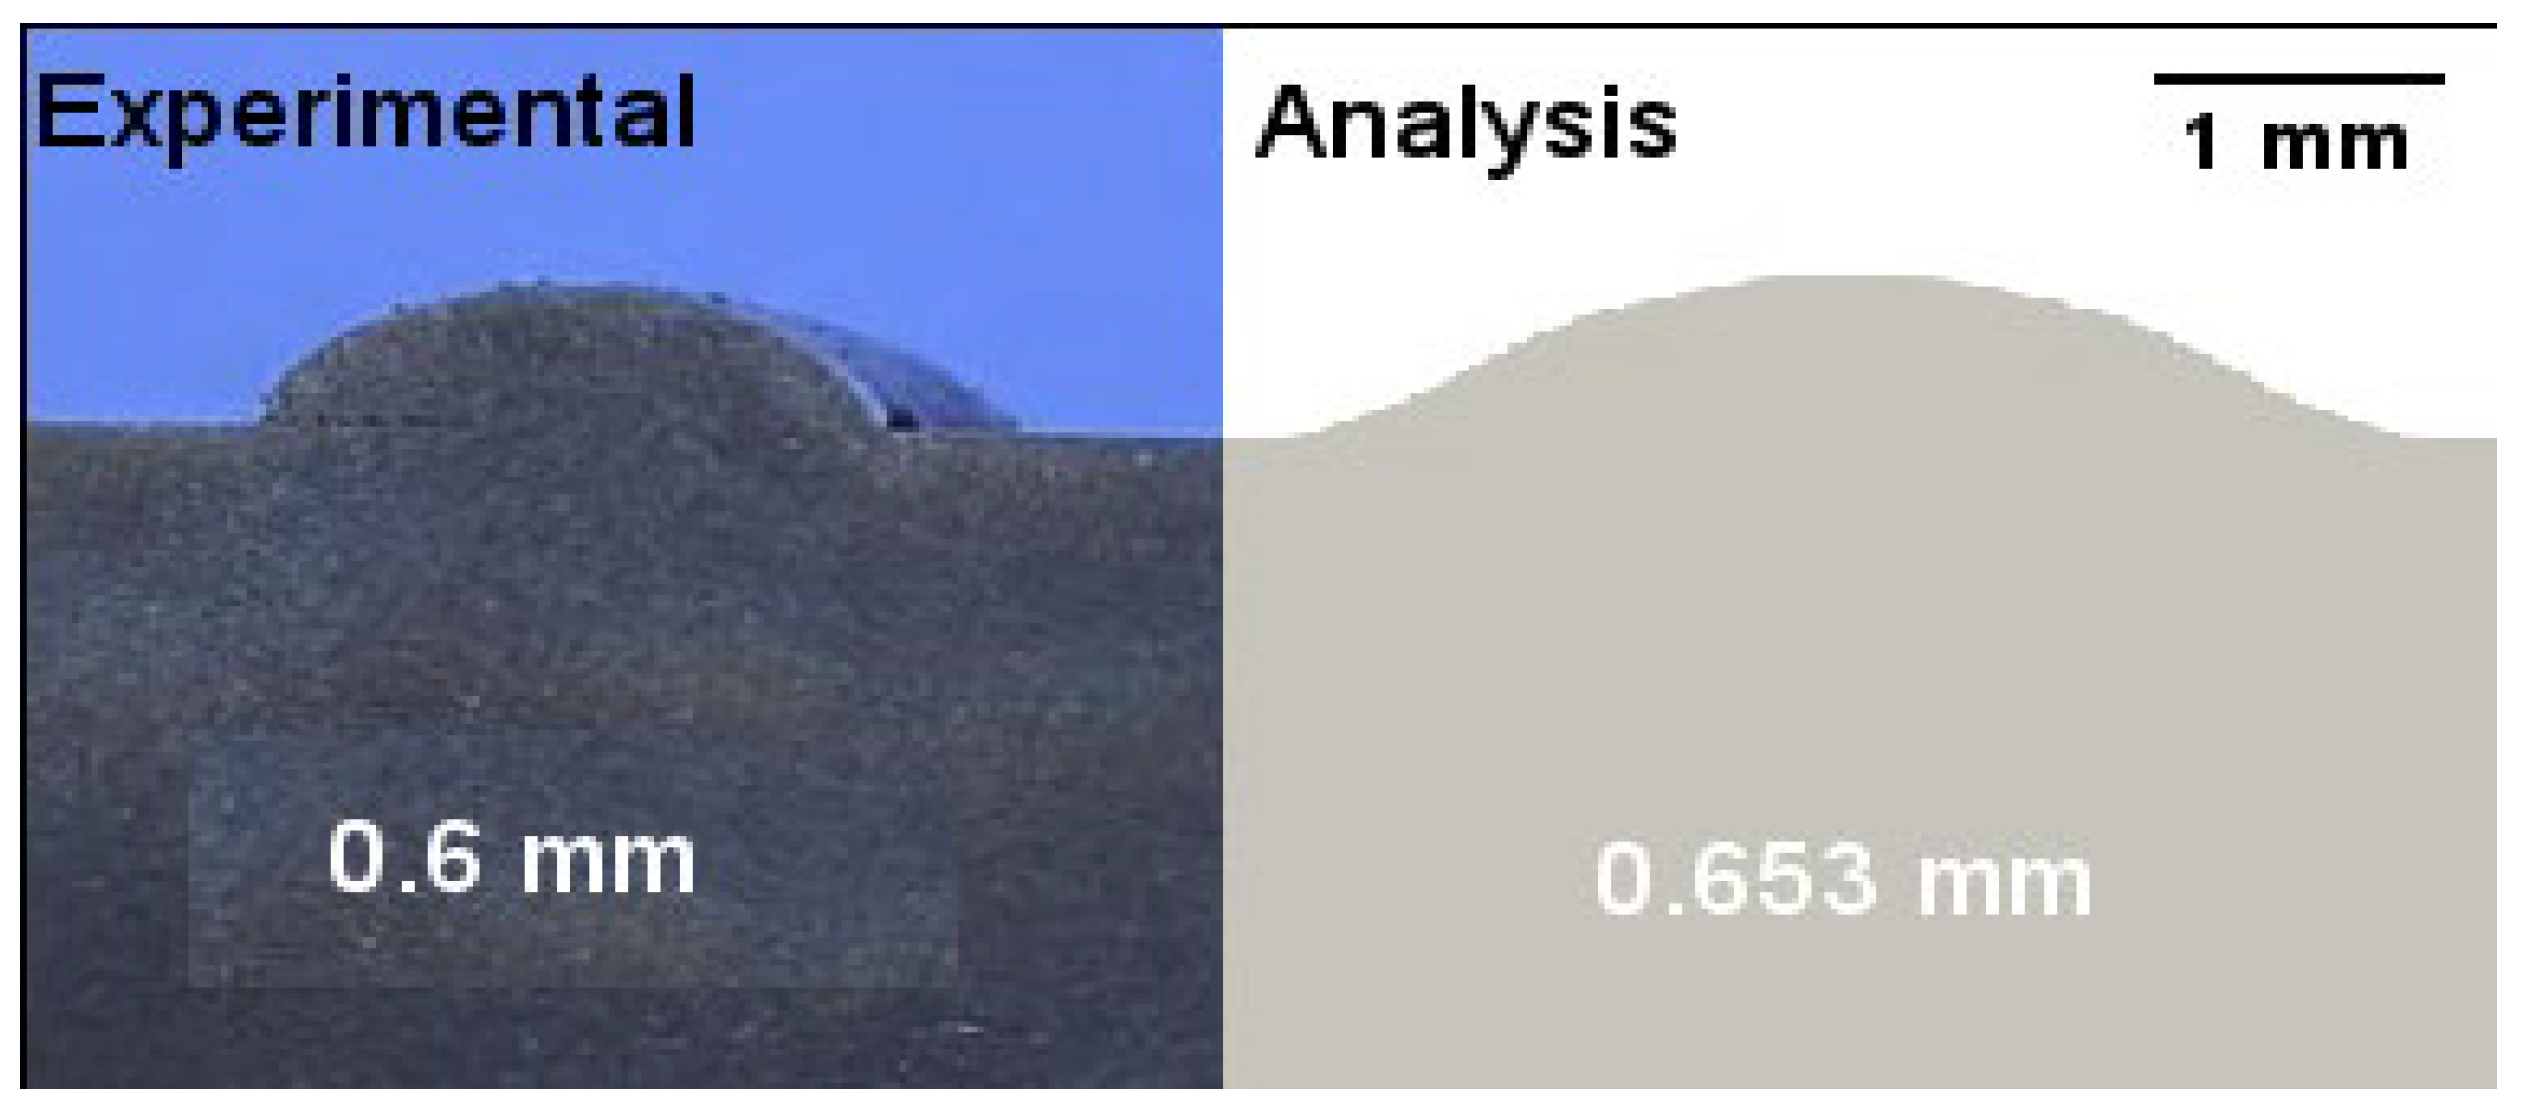
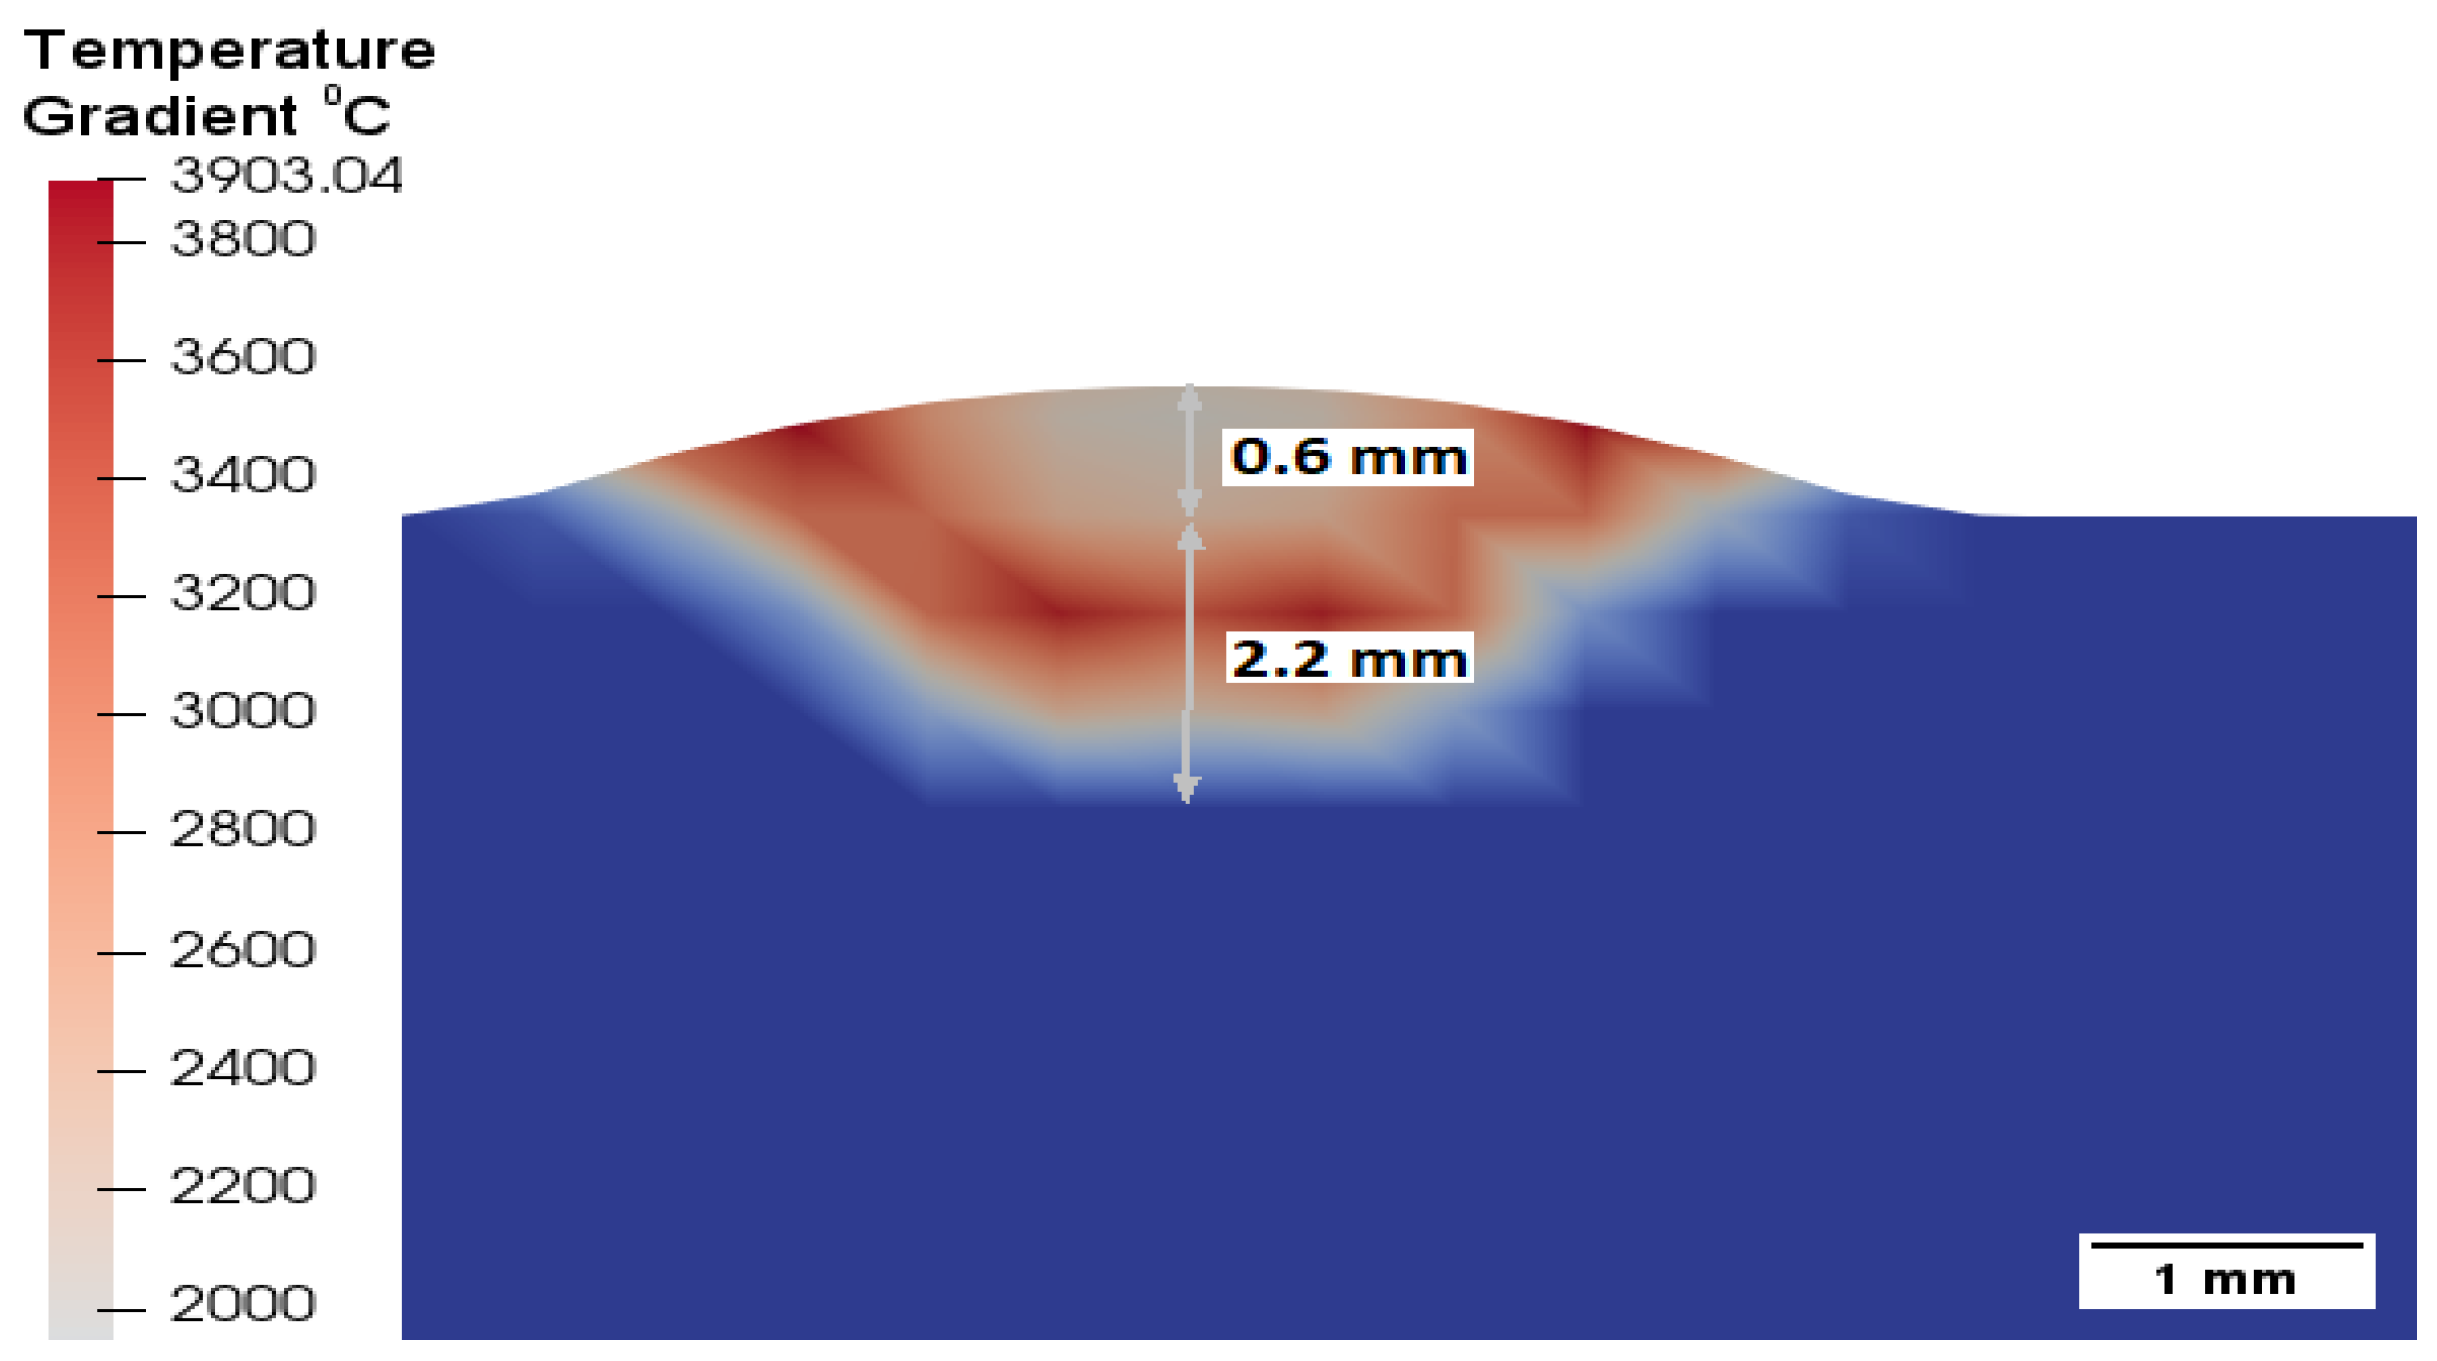
  • The outputs of the analysis studies and the experimental studies confirmed each other at a rate of 80%. Therefore, real-time deposition analyses modelled for DED, which will be performed before implementation, will prevent financial and time losses that may occur in experiments.
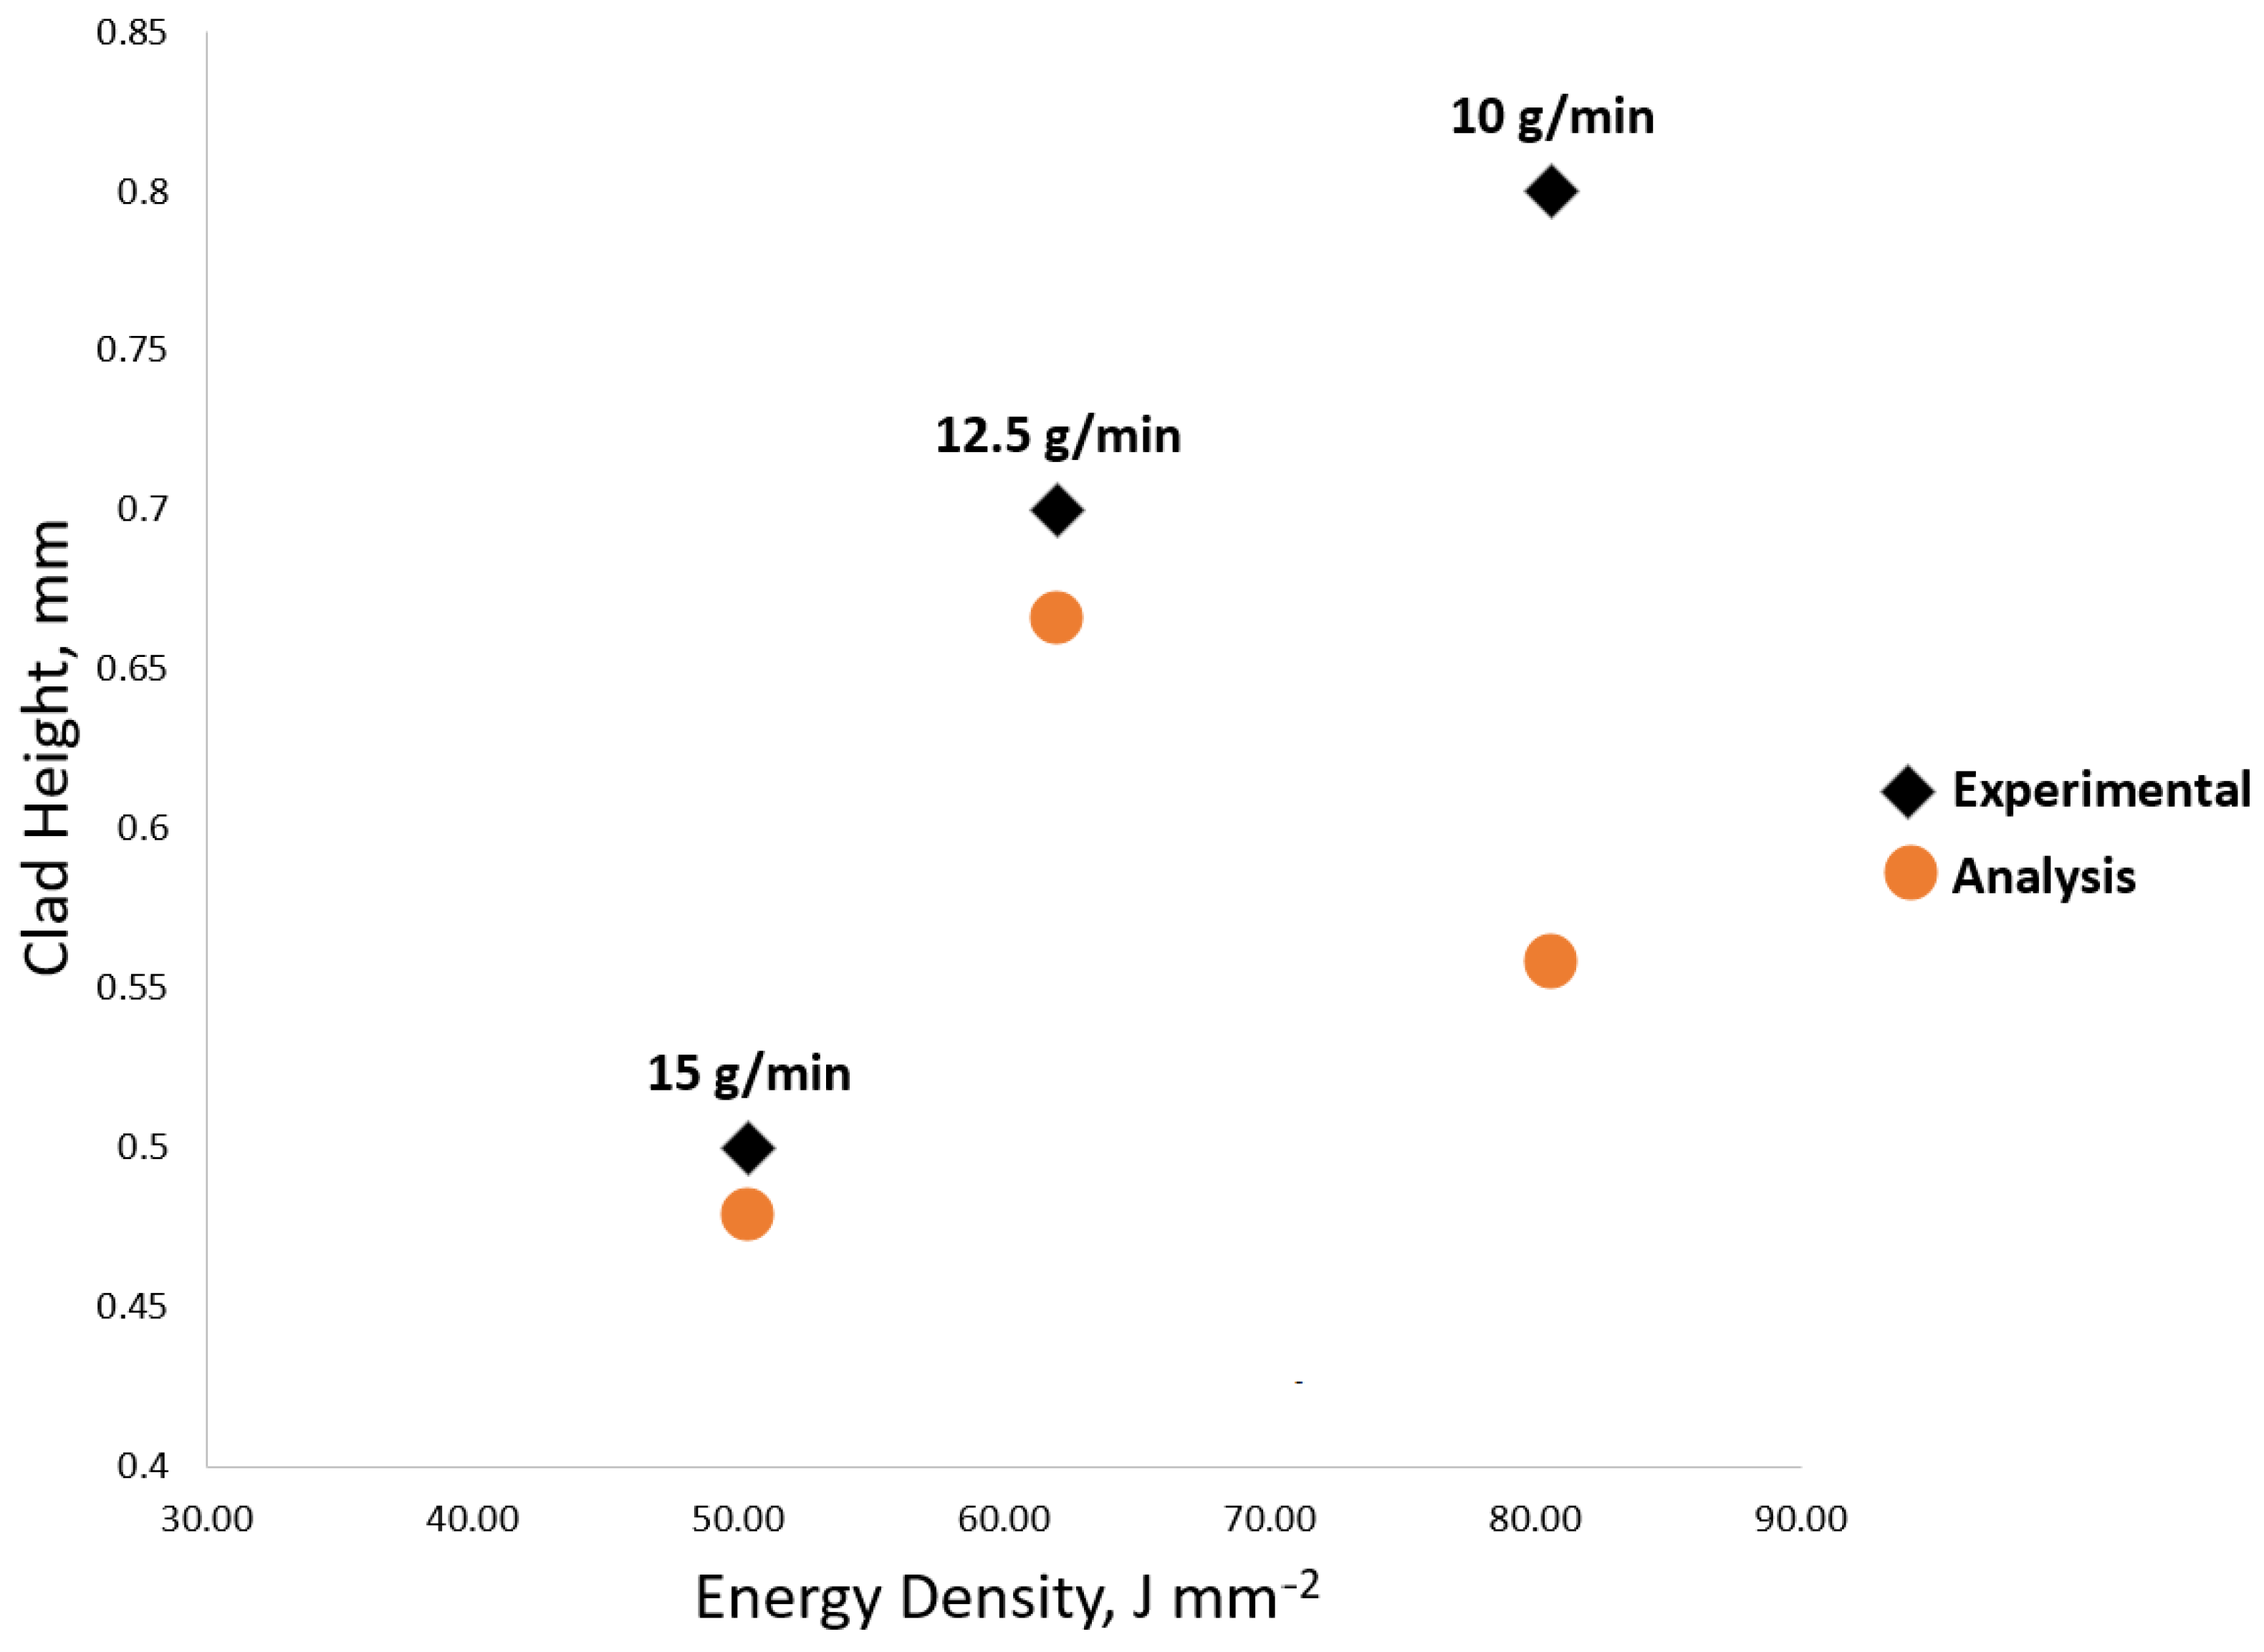
  • When evaluated in terms of the single line heights in the analysis studies, it was seen that the energy density directly affects the clad height (deposition ratio) and the powder feed rate inversely. Higher clad heights were achieved when the energy density rates were increased and the powder feed rates decreased.
  • In terms of the energy density, it can be seen that single-line clad heights can be achieved at 0.7 mm and above when Ev > 62.03 J mm−2. When Ev > 62.03 J mm−2, it is seen that single-line clad heights can be achieved at 0.7 mm and above. The single-line cladding heights were between 0.5–0.9 mm, and these height values were produced between 45.36–80.65 J mm−2 with energy densities.
  • It has been observed that the most critical process parameters affecting the formation of porosity are the energy density and powder feed rate. Its porosity increases indirectly with the energy density and is inversely proportional to the powder feed rate. It has been observed that the change in the amount of porosity in the re-melting-applied samples, compared to the samples produced as built, changes with the correlation between the powder feeding and energy density.
  • The gas pores in the as-build samples are quite small. The fact that the porosity pores formed in the microstructure after the re-melting process are larger or more than those formed in the as-build samples can be explained by the formation of (welded) gas pores during the process (see Figure 11).
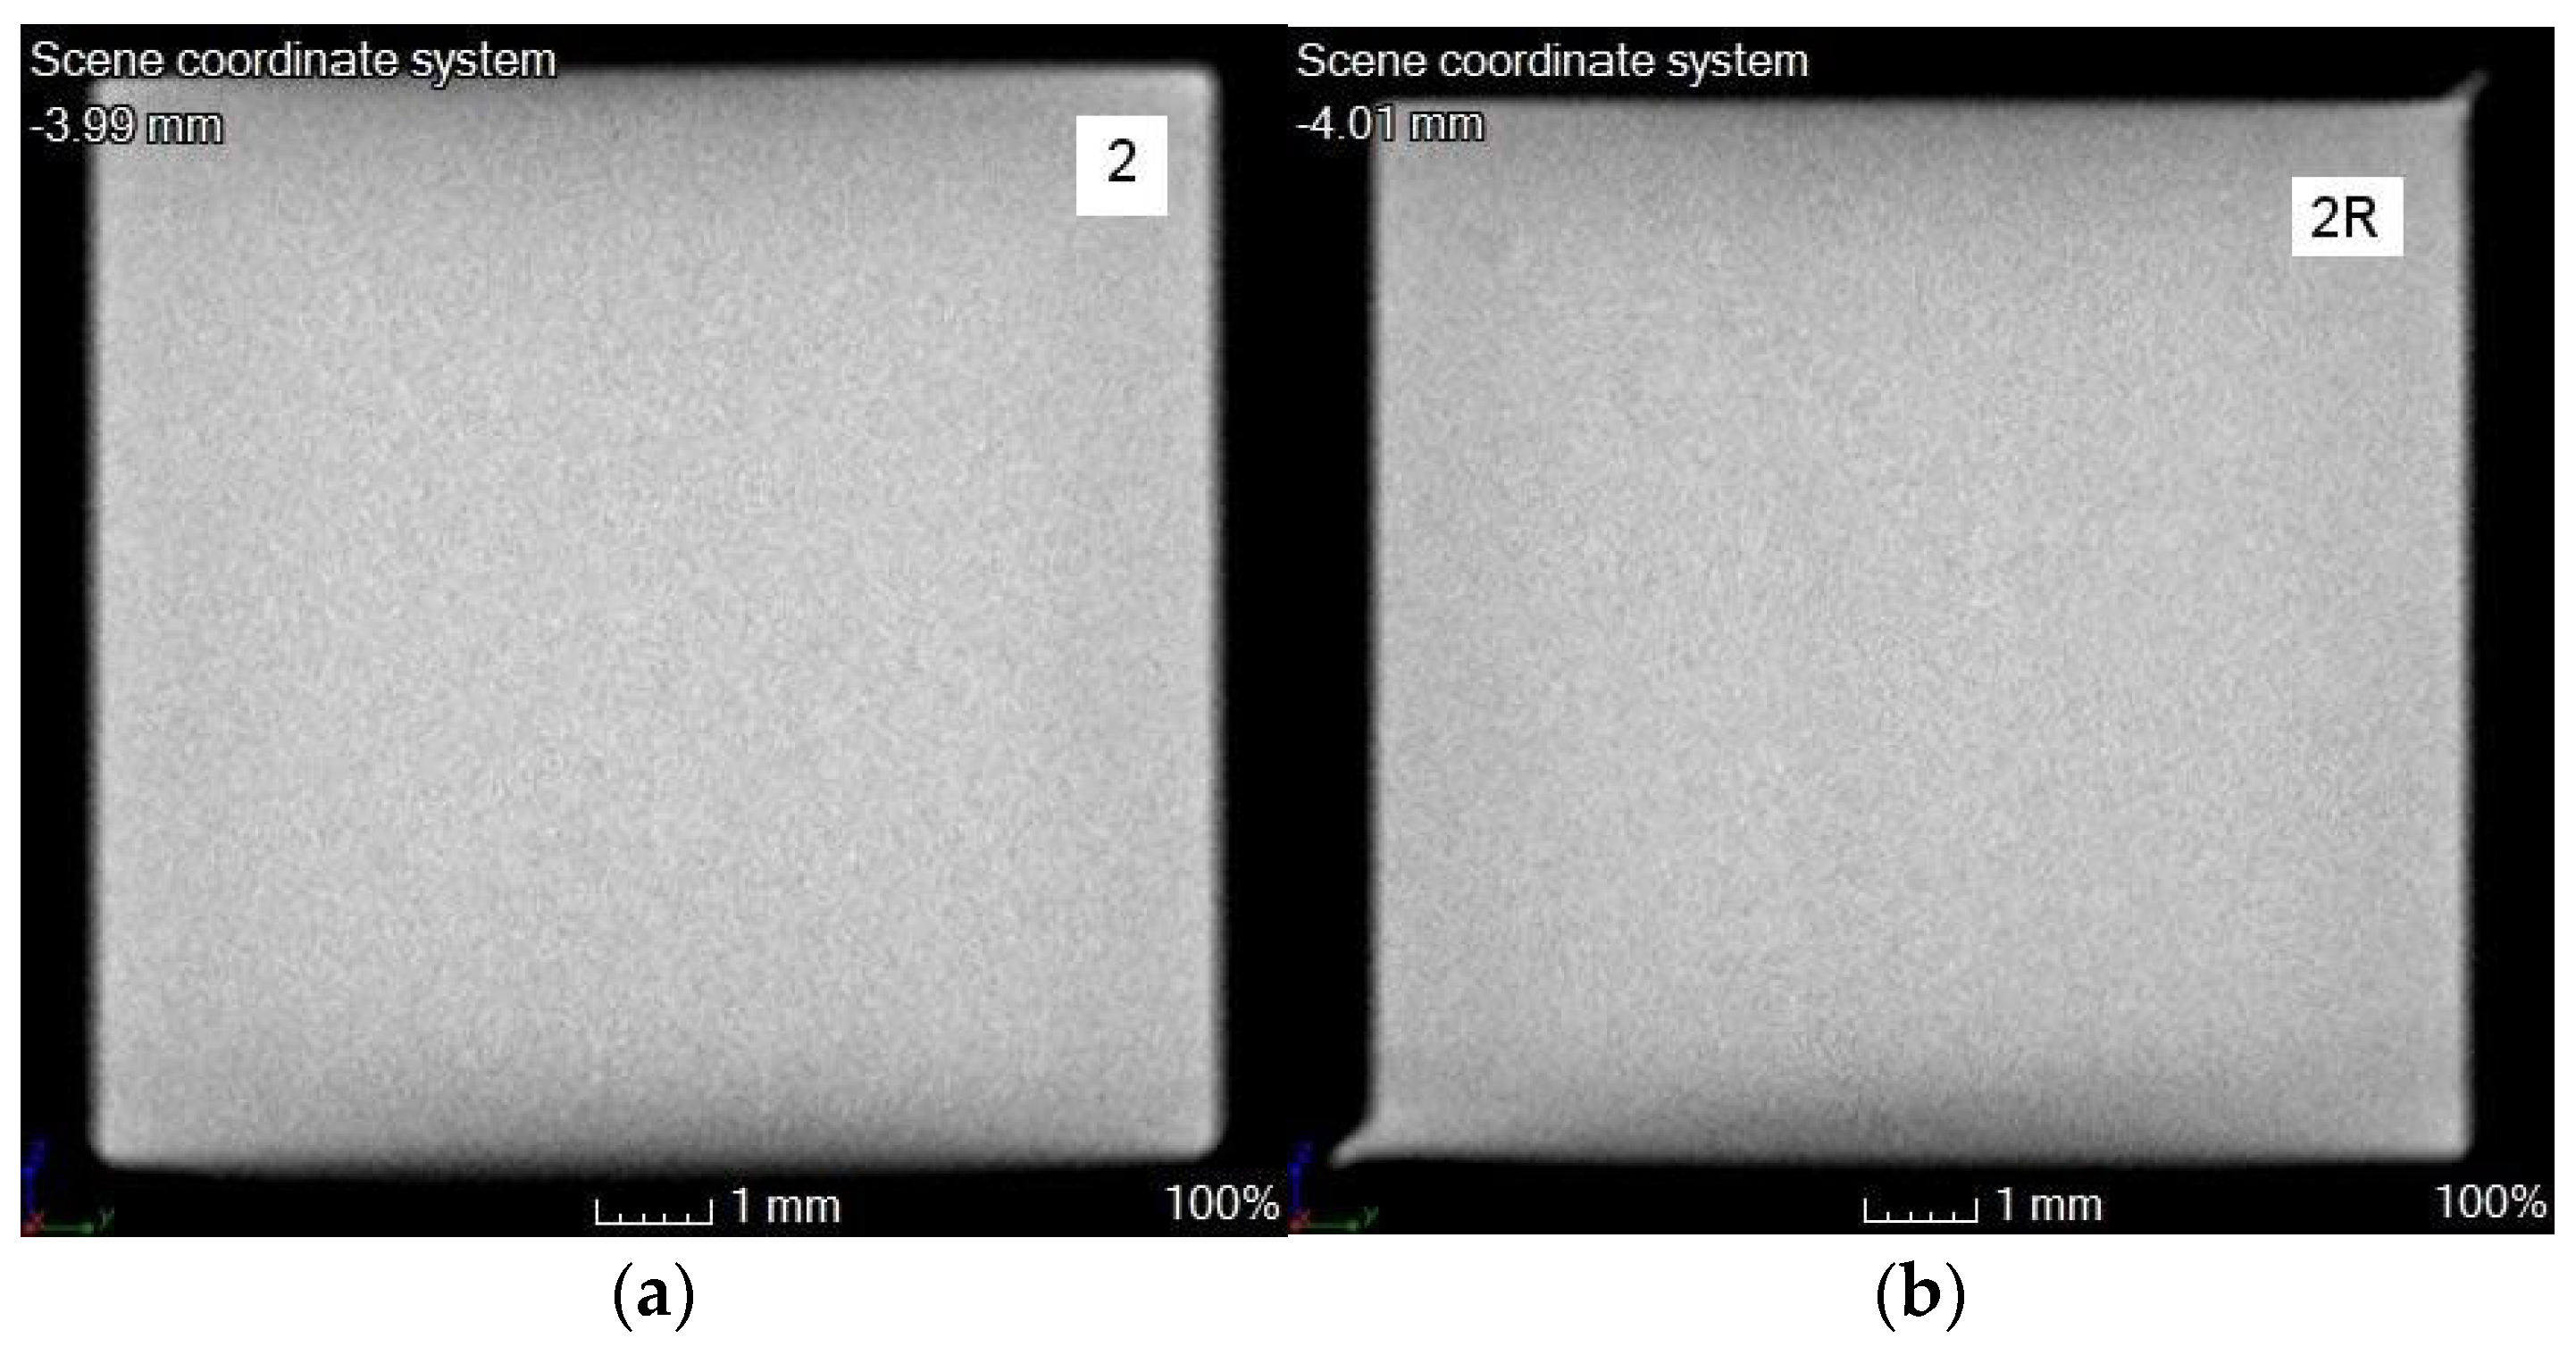
  • In the CT, it is seen that an almost error-free stacking process is obtained in both the as-build and re-melting samples in the experimental studies.
  • Many homogeneous and equiaxed structure formations are observed, depending on the thermal history. Such structures are also described in the literature on producing 316L steel through DED (Additive Manufacturing) [31,38,39].
  • Re-melting slightly affects the microstructure of the material, but it causes grain growth, even if only a little [32,40]. Grain growth is observed to be three times greater in the re-melting regions compared to the normal regions. Due to grain growth, small increases in the porosity and some decreases in the impact strength are observed in the re-melting samples.
  • The change in the micro-hardness due to the process, the decrease in energy density, and the increase in powder feeding ensure a slight decrease in the micro-hardness values. On the other hand, although the energy density decreased in the re-melted samples, it was observed that the additional laser applied between the layers slightly enlarged the grain structure, which caused a slight increase in the micro-hardness.
  • Charpy strengths vary depending on parameters such as the energy density, porosity, and differences in the microstructure. When evaluated in terms of dynamic loads, it is seen that the obtained impact strengths are higher than those of the wrought materials produced using traditional methods. The results of the Charpy samples produced through re-melting show slightly lower values than those produced as is. Although there is no change in terms of the energy densities, this decrease in value can be explained by considering the changes in the amount of porosity and the microstructure of a secondary laser application. As seen in Figure 17, after the re-melting process of this sample produced with an energy density of 40.32 J mm−2, an increase in the Charpy strength was observed. It can be explained that the re-melting process reduces the grain sizes in the microstructure and improves the Charpy strength in this sample compared to the as-built sample. The re-melting process did not show an effective improvement over the mechanical properties in the studies.

Author Contributions

Conceptualization, H.K., H.G. and G.K.; methodology, H.K.; software, H.K.; validation, H.K., H.G. and G.K.; investigation, H.K.; writing—original draft preparation, H.K.; writing—review and editing, H.K., H.G. and G.K.; supervision, H.G. and G.K. All authors have read and agreed to the published version of the manuscript.

Funding

This study was supported and funded by the TUBITAK Defense Industries Research and Development Institute (SAGE).

Acknowledgments

We thank TUBITAK SAGE and the Department of Additive Manufacturing.

Conflicts of Interest

The authors declare no conflict of interest.

References

  1. Manjaiah, M.; Hascoët, J.; Rauch, M. Effect of process parameters on track geometry, microstructural evolution on 316L stainless steel multi-layer clads. Mater. Sci. Eng. B-Adv. Funct. Solid-State Mater. 2020, 259, 114583. [Google Scholar] [CrossRef]
  2. Ligabo, I.A.; Braga, V.; Ferreira, C.C.A.; Siqueira, R.H.M.; Lourenço, J.C.; Abdalla, A.J.; Lima, M.S.F. Microstructure and Corrosion Behavior of AISI 316 Steel Layers Deposited on AISI 347 Steel Substrate by Laser Metal Deposition. Metals 2022, 12, 2161. [Google Scholar] [CrossRef]
  3. Antony, K.; Arivazhagan, N.; Senthilkumaran, K. Numerical and experimental investigations on laser melting of stainless steel 316L metal powders. J. Manuf. Process. 2014, 16, 345–355. [Google Scholar] [CrossRef]
  4. Ding, H.; Zou, B.; Wang, X.; Liu, J.; Li, L. Microstructure, mechanical properties and machinability of 316L stainless steel fabricated by direct energy deposition. Int. J. Mech. Sci. 2023, 243, 108046. [Google Scholar] [CrossRef]
  5. Bruzzo, F.; Catalano, G.; Demir, A.G.; Previtali, B. In-Process Laser Re-Melting of Thin Walled Parts to Improve Surface Quality after Laser Metal Deposition. Key Eng. Mater. 2019, 813, 191–196. [Google Scholar] [CrossRef]
  6. Caiazzo, F. Laser-aided Directed Metal Deposition of Ni-based superalloy powder. Opt. Laser Technol. 2018, 103, 193–198. [Google Scholar] [CrossRef]
  7. Pacheco, J.T.; Meura, V.H.; Bloemer, P.R.A.; Veiga, M.T.; Filho, O.C.d.M.; Cunha, A.; Teixeira, M.F. Laser directed energy deposition of AISI 316L stainless steel: The effect of build direction on mechanical properties in as-built and heat-treated conditions. Adv. Ind. Manuf. Eng. 2022, 4, 100079. [Google Scholar] [CrossRef]
  8. dos Santos Paes, L.E.; Pereira, M.; Xavier, F.A.; Weingaertner, W.L.; D’Oliveira, A.S.C.M.; Costa, E.C.; Vilarinho, L.O.; Scotti, A. Understanding the behavior of laser surface remelting after directed energy deposition additive manufacturing through comparing the use of iron and Inconel powders. J. Manuf. Process. 2021, 70, 494–507. [Google Scholar] [CrossRef]
  9. Zhuang, D.-D.; Du, B.; Zhang, S.-H.; Tao, W.-W.; Wang, Q.; Shen, H.-B. Effect and action mechanism of ultrasonic assistance on microstructure and mechanical performance of laser cladding 316L stainless steel coating. Surf. Coatings Technol. 2022, 433, 128122. [Google Scholar] [CrossRef]
  10. Fang, J.; Dong, S.; Li, S.; Wang, Y.; Xu, B.; Li, J.; Liu, B.; Jiang, Y. Direct laser deposition as repair technology for a low transformation temperature alloy: Microstructure, residual stress, and properties. Mater. Sci. Eng. A 2019, 748, 119–127. [Google Scholar] [CrossRef]
  11. Guo, P.; Zou, B.; Huang, C.; Gao, H. Study on microstructure, mechanical properties and machinability of efficiently additive manufactured AISI 316L stainless steel by high-power direct laser deposition. J. Mater. Process. Technol. 2016, 240, 12–22. [Google Scholar] [CrossRef]
  12. Helbert, V.; Rioual, S.; Le Bozec, N.; Thierry, D. Corrosion behavior of additively manufactured AISI 316L stainless steel under atmospheric conditions. Mater. Corros. 2022, 73, 1833–1843. [Google Scholar] [CrossRef]
  13. Hrabe, N.; White, R.; Lucon, E. Effects of internal porosity and crystallographic texture on Charpy absorbed energy of electron beam melting titanium alloy (Ti-6Al-4V). Mater. Sci. Eng. A 2018, 742, 269–277. [Google Scholar] [CrossRef]
  14. Huang, Y.; Ansari, M.; Asgari, H.; Farshidianfar, M.H.; Sarker, D.; Khamesee, M.B.; Toyserkani, E. Rapid prediction of real-time thermal characteristics, solidification parameters and microstructure in laser directed energy deposition (powder-fed additive manufacturing). J. Mater. Process. Technol. 2019, 274, 116286. [Google Scholar] [CrossRef]
  15. Koike, R.; Misawa, T.; Kakinuma, Y.; Oda, Y. Basic Study on Remelting Process to Enhance Density of Inconel 625 in Direct Energy Deposition. Int. J. Autom. Technol. 2018, 12, 424–433. [Google Scholar] [CrossRef]
  16. Kovalev, O.; Bedenko, D.; Zaitsev, A. Development and application of laser cladding modeling technique: From coaxial powder feeding to surface deposition and bead formation. Appl. Math. Model. 2018, 57, 339–359. [Google Scholar] [CrossRef]
  17. Liu, Q.C.; Elambasseril, J.; Sun, S.J.; Leary, M.; Brandt, M.; Sharp, P.K. The Effect of Manufacturing Defects on the Fatigue Behaviour of Ti-6Al-4V Specimens Fabricated Using Selective Laser Melting. Adv. Mater. Res. 2014, 891–892, 1519–1524. [Google Scholar] [CrossRef]
  18. Mandal, S. Impact Properties of AISI 316L Stainless Steel Repaired by Directed Energy Deposition (DED) Additive Manufacturing. Carbohydr. Polym. 2019, 6, 5–10. [Google Scholar]
  19. Parekh, R.; Buddu, R.K.; Patel, R. Multiphysics Simulation of Laser Cladding Process to Study the Effect of Process Parameters on Clad Geometry. Procedia Technol. 2016, 23, 529–536. [Google Scholar] [CrossRef] [Green Version]
  20. Qin, M.; Gao, S.; Wang, C.C.; Liao, W.-H. Multi-axis direct metal deposition process with effective regrouping strategy. J. Manuf. Process. 2022, 81, 707–716. [Google Scholar] [CrossRef]
  21. Qiu, C.; Panwisawas, C.; Ward, M.; Basoalto, H.C.; Brooks, J.W.; Attallah, M.M. On the role of melt flow into the surface structure and porosity development during selective laser melting. Acta Mater. 2015, 96, 72–79. [Google Scholar] [CrossRef] [Green Version]
  22. Saboori, A.; Aversa, A.; Bosio, F.; Bassini, E.; Librera, E.; De Chirico, M.; Biamino, S.; Ugues, D.; Fino, P.; Lombardi, M. An investigation on the effect of powder recycling on the microstructure and mechanical properties of AISI 316L produced by Directed Energy Deposition. Mater. Sci. Eng. A 2019, 766, 138360. [Google Scholar] [CrossRef]
  23. Saboori, A.; Aversa, A.; Marchese, G.; Biamino, S.; Lombardi, M.; Fino, P. Microstructure and Mechanical Properties of AISI 316L Produced by Directed Energy Deposition-Based Additive Manufacturing: A Review. Appl. Sci. 2020, 10, 3310. [Google Scholar] [CrossRef]
  24. Sames, W.; Medina, F.; Peter, W.; Babu, S.; Dehoff, R. Effect of Process Control and Powder Quality on Inconel 718 Produced Using Electron Beam Melting. In 8th International Symposium on Superalloy 718 and Derivatives; John Wiley & Sons, Inc.: Hoboken, NJ, USA, 2014; Volume 2014, pp. 409–423. [Google Scholar] [CrossRef]
  25. Shamsaei, N.; Yadollahi, A.; Bian, L.; Thompson, S.M. An overview of Direct Laser Deposition for additive manufacturing; Part II: Mechanical behavior, process parameter optimization and control. Addit. Manuf. 2015, 8, 12–35. [Google Scholar] [CrossRef]
  26. Song, B.; Yu, T.; Jiang, X.; Xi, W.; Lin, X.; Ma, Z.; Wang, Z. Development of the molten pool and solidification characterization in single bead multilayer direct energy deposition. Addit. Manuf. 2021, 49, 102479. [Google Scholar] [CrossRef]
  27. Kruth, J.P.; Vandenbroucke, B.; Van Vaerenbergh, J.; Naert, I. Rapid Manufacturing of Dental Prostheses by Means of Selective Laser Sintering/Melting. In Proceedings of the Les 11emes Assises Eur. Du Prototypage Rapide (AFPR), Paris, France, 4–5 October 2005. [Google Scholar]
  28. Sun, G.; Shen, X.; Wang, Z.; Zhan, M.; Yao, S.; Zhou, R.; Ni, Z. Laser metal deposition as repair technology for 316L stainless steel: Influence of feeding powder compositions on microstructure and mechanical properties. Opt. Laser Technol. 2018, 109, 71–83. [Google Scholar] [CrossRef]
  29. Tan, Z.E.; Pang, J.H.L.; Kaminski, J.; Pepin, H. Characterisation of porosity, density, and microstructure of directed energy deposited stainless steel AISI 316L. Addit. Manuf. 2018, 25, 286–296. [Google Scholar] [CrossRef]
  30. Vaithilingam, J.; Goodridge, R.D.; Hague, R.J.; Christie, S.D.; Edmondson, S. The effect of laser remelting on the surface chemistry of Ti6al4V components fabricated by selective laser melting. J. Mater. Process. Technol. 2016, 232, 1–8. [Google Scholar] [CrossRef] [Green Version]
  31. Wang, Q.; Zhang, S.; Zhang, C.; Wang, J.; Shahzad, M.B.; Chen, H.; Chen, J. A high strength low alloy steel fabricated by direct laser deposition. Vacuum 2019, 161, 225–231. [Google Scholar] [CrossRef]
  32. Wang, S.; Zhu, L.; Fuh, J.Y.H.; Zhang, H.; Yan, W. Multi-physics modeling and Gaussian process regression analysis of cladding track geometry for direct energy deposition. Opt. Lasers Eng. 2019, 127, 105950. [Google Scholar] [CrossRef]
  33. Wang, S.; Zhu, L.; Dun, Y.; Yang, Z.; Fuh, J.Y.H.; Yan, W. Multi-physics modeling of direct energy deposition process of thin-walled structures: Defect analysis. Comput. Mech. 2021, 67, 1229–1242. [Google Scholar] [CrossRef]
  34. Zhang, Q.; Chen, J.; Lin, X.; Tan, H.; Huang, W. Grain morphology control and texture characterization of laser solid formed Ti6Al2Sn2Zr3Mo1.5Cr2Nb titanium alloy. J. Mater. Process. Technol. 2016, 238, 202–211. [Google Scholar] [CrossRef]
  35. Zhang, Y.; Zhang, J. Modeling of solidification microstructure evolution in laser powder bed fusion fabricated 316L stainless steel using combined computational fluid dynamics and cellular automata. Addit. Manuf. 2019, 28, 750–765. [Google Scholar] [CrossRef]
  36. Zhou, J.; Tsai, H.L.; Lehnhoff, T.F. Investigation of transport phenomena and defect formation in pulsed laser keyhole welding of zinc-coated steels. J. Phys. D Appl. Phys. 2006, 39, 5338–5355. [Google Scholar] [CrossRef]
  37. Zhou, Q.; Wang, Y.; Choi, S.-K.; Cao, L.; Gao, Z. Robust optimization for reducing welding-induced angular distortion in fiber laser keyhole welding under process parameter uncertainty. Appl. Therm. Eng. 2018, 129, 893–906. [Google Scholar] [CrossRef]
  38. Zinovieva, O.; Romanova, V.; Zinoviev, A.; Nekhorosheva, O.; Balokhonov, R. Elastic properties of additively manufactured steel produced with different scan strategies. Int. J. Mech. Sci. 2023, 244, 108089. [Google Scholar] [CrossRef]
  39. Wang, C.; Zhu, P.; Lu, Y.; Shoji, T. Effect of heat treatment temperature on microstructure and tensile properties of austenitic stainless 316L using wire and arc additive manufacturing. Mater. Sci. Eng. A 2021, 832, 142446. [Google Scholar] [CrossRef]
  40. Zinovieva, O.; Zinoviev, A.; Romanova, V.; Balokhonov, R. Three-dimensional analysis of grain structure and texture of additively manufactured 316L austenitic stainless steel. Addit. Manuf. 2020, 36, 101521. [Google Scholar] [CrossRef]
Figure 1. AISI 316L powders SEM image.
Metals 13 01144 g001
Figure 2. Distribution of AISI 316L powders under SEM.
Metals 13 01144 g002
Figure 3. Comparison of Experimental Study and Flow 3D Weld Analysis.
Metals 13 01144 g003
Figure 4. Heat Affected Zone (HAZ) between Substrate and Clad Geometry.
Metals 13 01144 g004
Figure 5. (a) Cladding Head, (b) 6 Axis Robot, (c) Powder Feeder.
Metals 13 01144 g005
Figure 6. (a) Placement of Charpy samples on the substrate plate, (b) Cutting direction of microanalysis and Micro hardness samples, (c) Density sample and micro analysis sample.
Metals 13 01144 g006
Figure 7. Experimental and Analysis Results of the Relationship between Energy Density and Clad Height.
Metals 13 01144 g007
Figure 8. Variation of Porosity Depending on Energy Density In terms of Power and Scan Speed.
Metals 13 01144 g008
Figure 9. Microstructure investigation with an optical microscope (as build specimens) (a) Ev = 49.63 J mm−2 specimen (b) Ev = 80.64 J mm−2 specimen.
Metals 13 01144 g009
Figure 10. (a) Change of porosity depends on energy density and microstructure analysis (b) as built sample produced with 40.32 J mm−2, (c) re-melting sample produced with 40.32 J mm−2.
Metals 13 01144 g010
Figure 11. Variation of Porosity Amount Dependent on Energy Density in As-Build and Re-melting Samples.
Metals 13 01144 g011
Figure 12. Image made with CT: (a) As-build specimens with energy density of 62.03 J mm−2; (b) Re-melting specimens with energy density of 62.03 J mm−2.
Metals 13 01144 g012
Figure 13. Grain structure and microstructure processes in as-build samples: (a) As-build sample produced with an energy density of 80.65 J mm−2; (b) As-build sample produced with an energy density of 49.63 J mm−2.
Metals 13 01144 g013
Figure 14. Grain growth in re-melting samples: (a) Re-melting sample produced with an energy density of 80.65 J mm−2; (b) Re-melting sample produced with an energy density of 49.63 J mm−2, (c) Differences of grain sizes in as-build area and re-melting area.
Metals 13 01144 g014
Figure 15. Change of Micro-Hardness in As-Build and Re-melting Samples due to Energy Density and Powder Feed Rate.
Metals 13 01144 g015
Figure 16. Changing of Impact Strength of As-Build and Re-Melting Samples Depending on Energy Density.
Metals 13 01144 g016
Figure 17. Changing of Impact Strength of As-Build and Re-Melting Samples Depending on Energy Density.
Metals 13 01144 g017
Figure 18. Microstructures of Charpy samples examined under SEM: (a) As-build specimens; (b) Re-melting specimens.
Metals 13 01144 g018aMetals 13 01144 g018b
Table 1. Chemical composition of AISI 316L material (w%).
Material CSiMnCrMoNiFe
Data Sheet (GVT)0.020.71.5172.512.5rest
EDS Analysis0.020.641.6117.22.6111.2rest
Standard (EN 10088-1)0.02<1.0<2.018.02.0–3.011.3rest
Table 2. 316 L material thermal properties.
PropertiesValueUnitRef.
Density8000Kg/m3
Viscosity5Pa s[24]
Thermal conductivity15.91W/m K[25]
Specific heat450J/kg−0K[25]
Liquidus line1723K[26]
Solidus line1658K[26]
Table 3. Process Parameters: Formula for Calculating Energy Density using Power (P), Scan Speed (Vr), and Laser Spot Size (Ds).
Parameter Set NoP (W)Vr (mm/sec)Ds (mm)Ev (J mm−2)
via Equation (1) [27]
1.2500103.180.65
2.2500133.162.03
3.2500163.150.40
4.2250133.155.83
5.2250163.145.36
6.2250103.172.58
7.2000163.140.32
8.2000103.164.52
9.2000133.149.63
Disclaimer/Publisher’s Note: The statements, opinions and data contained in all publications are solely those of the individual author(s) and contributor(s) and not of MDPI and/or the editor(s). MDPI and/or the editor(s) disclaim responsibility for any injury to people or property resulting from any ideas, methods, instructions or products referred to in the content.

