Article

Modeling Segregation of Fe–C Alloy in Solidification by Phase-Field Method Coupled with Thermodynamics

1
Shenyang National Laboratory for Materials Science, Institute of Metal Research, Chinese Academy of Sciences, Shenyang 110016, China
2
School of Materials Science and Engineering, University of Science and Technology of China, Hefei 230026, China
*
Author to whom correspondence should be addressed.
Metals 2023, 13(6), 1148; https://doi.org/10.3390/met13061148
Submission received: 24 May 2023 / Revised: 12 June 2023 / Accepted: 17 June 2023 / Published: 20 June 2023
(This article belongs to the Special Issue Modeling of Alloy Solidification)

Abstract

:
The primary carbide in high carbon chromium bearing steels, which arises from solute segregation during non-equilibrium solidification, is one of the key factors affecting the mechanical properties and performance of the related components. In this work, the effects of carbide forming element diffusion, primary austenite grain size, and the cooling rate on solute segregation and carbide precipitation during the solidification of an Fe–C binary alloy were studied by the phase-field method coupled with a thermodynamic database. It was clarified that increasing the ratio of solute diffusivity in solid and liquid, refining the grain size of primary austenite to lower than a critical value, and increasing the cooling rate can reduce the solute segregation and precipitation of primary carbide at late solidification. Two characteristic parameters were introduced to quantitatively evaluate the solute segregation during solidification including the phase fraction threshold of primary austenite when the solute concentration in liquid reaches the eutectic composition, and the maximum segregation ratio. Both parameters can be well-correlated to the ratio of solute diffusivity in solid and liquid, the grain size of primary austenite, and the cooling rate, which provides potential ways to control the solute segregation and precipitation of primary carbide in bearing steels.

1. Introduction

As one of the most important components of many kinds of machines, bearings have been widely used in major equipment (such as high precision machine tools, large mining machinery, and metallurgical equipment) and emerging industries (such as aerospace, rail transit, and wind power generation). The key ring and roller materials used in all kinds of bearings are mainly GCr15 series high carbon chromium bearing steels, and the main factors affecting the service life of bearing steels are non-metallic inclusions and microstructure uniformity [1,2,3]. The non-metallic inclusions have been gradually reduced and refined by the current technology to control the O content in bearing steels [4], and brittle and hard inclusions like Al2O3 can be modified into other types that are insensitive to the rolling contact fatigue life of bearings by adding Ca [5] or rare earth elements [6,7,8]. Therefore, the influence of carbides in steels on the service life of bearings has emerged and even been a key factor to determine the performance of bearing steels. The primary carbide, which precipitates from melt during the solidification of steels, is the largest, most harmful, and most difficult to eliminate, and to control the morphology, distribution, and size of the primary carbides is an important pathway to improving the service life and reliability of bearings [9,10].
The precipitation and growth behavior of primary carbides has been revealed to stem from the solute segregation of bearing steels during solidification, which depends on several key factors including the diffusion of carbide forming elements, the grain size of primary austenite, and the cooling rate [11,12,13]. The diffusion of carbon and chromium was indicated to be a controlling factor for primary carbides in GCr15 bearing steels [14,15]. By characterizing the microstructure at different locations in the ingot, it was found that the size of the primary carbides varied with the center segregation in continuous casting [12]. Furthermore, the size of the primary carbides in the central region with a slower cooling rate was the largest, while that in the marginal region was the smallest [16]. The austenite grain could also be refined by adding rare earth elements, thus leading to the further refinement of primary carbides [3,14].
Although previous studies have clarified several factors affecting the precipitation of primary carbides in steels, the underlying mechanism was not clear due to the limitations of traditional experimental methods, particularly for an in-depth understanding of the solidification of high temperature steel melt. In the last few decades, the phase-field method has been developed to become one of the most powerful tools to investigate the dynamics of microstructure evolution during the solidification of metallic alloys [17,18,19,20,21], which has been widely used in the study of complex phase transitions in multi-component and multi-phase alloys [22,23,24,25]. The advantage of the phase-field method is to introduce the concept of a diffusive interface to represent different phases by uniform order parameters, which avoids the intractable problem of explicitly tracking the solid–liquid interface. Through a variety of advanced numerical methods such as adaptive finite element method [26,27,28] and GPU (Graphics Processing Unit) parallel computing [29,30], the spatial scale of the quantitative phase-field simulation has been increased to the centimeter scale with thousands of grains [28], which is consistent with the actual solidification experiments observed in situ and in real-time by synchrotron X-ray radiography [31,32,33]. The above models and algorithms provide a feasible path to study the solidification of steels and the underlying physical mechanism. In the present work, the phase-field model coupled with a thermodynamic database [23,24] was used to simulate the solidification of an Fe–C binary alloy, and vectorized, parallel, and GPU-accelerated algorithms were developed to improve the computational efficiency of large-scale phase-field simulation for polycrystalline solidification. We studied the solute segregation and several affecting factors including the solute diffusion, the grain size of the primary austenite, and the cooling rate. Several potential approaches are proposed to improve the solute segregation and primary carbide precipitation during the solidification of steels based on the results of the phase-field simulations such as increasing the ratio of the diffusivity of the solute in solid and liquid, refining the grain size of primary austenite to lower than a certain threshold, and increasing the cooling rate.

2. Model Description and Numerical Implementations

2.1. Phase-Field Model for Alloy Solidification

The kinetic governing equations of the phase-field variables for a multi-phase system are given as [23,24]:
ϕ α t = β = 1 β α v ˜ M α β v ˜ γ = 1 v ˜ σ ˜ β γ σ ˜ α γ 2 ϕ γ + π 2 η 2 ϕ γ + π η ϕ α ϕ β Δ G α β V m
where ϕα (the subscript could be α, β, and γ, representing different phases, respectively) is the volume fraction of the α phase; Mαβ and σ ˜ α β are respectively the anisotropic interface mobility and energy between the α and β phases; v ˜ = α = 1 v s α is the number of phases that are locally coincident (i.e., v ˜ = 1 in bulk phases, v ˜ = 2 in dual interfaces, v ˜ = 3 in triple junctions, and so on); sα is a step function; η is the interface width; ∆Gαβ is the chemical driving force; Vm is the molar volume. The anisotropy is applied to the interface mobility and energy by using the two-dimensional cubic anisotropy function as:
M α β n = μ α β a μ n = μ α β 1 + δ μ cos 4 θ
σ ˜ α β n = σ α β a σ n = σ α β 1 δ σ cos 4 θ
where n is the interface normal vector with θ = arctan(ϕy/ϕx). The constants μαβ, σαβ, δμ, δσ are the interface mobility, interface energy, and the corresponding anisotropy coefficient, respectively. The step function is defined as sα = 1 when the sum of ϕα in its four nearest grids is between ς and 1 − ς, otherwise the value is zero. The effect of the numerical parameter ς on the interface stability was investigated by Kim et al. [22], and it was revealed that stable interface and good repeatability could be obtained when 0.01 < ς < 0.05. The calculation of the phase transition driving force is the key to phase-field simulations, and to solve the chemical driving force term in Equation (1) with acceptable time and accuracy, the extrapolation method [23] was employed, in which the chemical driving force could be expanded by the Taylor’s theorem as follows:
Δ G α β i = 1 n 1 Δ G α β c α / β i , eq c α / β i c α / β i , eq + Δ G α β T eq T T eq
where the superscript eq represents the equilibrium state, and the equilibrium composition of all the components in each phase at different temperatures can be calculated by Thermo-Calc® with the corresponding TCFE8 thermodynamic database.
The diffusion equations for multi-component alloys, with the anti-trapping current [34] to eliminate the abnormal interface kinetic effects arising from arbitrary interface width, are given as:
c i t = α v ϕ α D α c α i + α L v η π c L i c α i ϕ L ϕ α ϕ α t ϕ α ϕ α
where ci is the concentration of the ith component; Dα is the solute diffusivity in the α phase; ciα is the concentration of the ith component in the α phase. The solute composition in each phase can be calculated by solving the quasi-equilibrium condition [23] at all interface grid cells in every time step, which is very time-consuming. Therefore, in order to improve the computational efficiency of phase-field simulations, we adopted the practice in [23], that is, we did not carry out the thermodynamic calculation at each time step, but instead only after a certain recalculation interval (0.1 K in the present work), and extrapolated the quasi-equilibrium data in-between. It should be noted that the solute diffusivity in solid (DS) in Fe–C binary alloys varies with the composition and temperature, and DS is about 2.5 × 10⁻⁹ m2/s for the Fe-1.0 wt.% C alloy at the liquidus temperature, which is calculated by the Thermo-Calc® with the corresponding MOBFE3 mobility database. However, as the effect of solute diffusion on segregation was studied in this work, we set a certain range of DS, as listed in Table 1. Moreover, although for most metallic alloys the solute diffusivity in liquid (DL) is 3~4 orders of magnitude larger than that in solid, DL in this work was set to be 1 order of magnitude larger than DS, considering that the carbon in austenite is the interstitial atom.
The interface mobility was calibrated through the same method as in the literature [35], that was, the crystal growth rate did not increase with the increase in the interface mobility, meaning that the solidification was dominated by the diffusion of the solute rather than the interface kinetics. The interface energy was also obtained by Thermo-Calc® and the corresponding TCFE8 thermodynamic database. The anisotropy strength of the interface mobility and energy was set at a relatively large value to make the primary dendritic arm easy to develop. In the phase-field simulation, a small grid size of ∆x = 0.25 μm was used so that the fine and complex microstructure in the interdendritic region could be reproduced. The mesh size was 1024 × 1024 ∆x2, which corresponded to a physical domain size of 256 × 256 μm2. The time step was determined by the diffusion equation as ∆t = 0.8∆x2/(4DL). All of the material and numerical parameters used in the present phase-field simulations are listed in Table 1. Furthermore, all of the phase-field simulations in the present work started with the liquidus temperature, which was determined to be 1735 K by using the Thermo-Calc® and the corresponding TCFE8 thermodynamic database.

2.2. Thermodynamic Description of the Fe–C Binary System

Since only the growth of the primary austenite (γ) during the solidification of the Fe-1.0 wt.% C binary alloy was of concern, the phase transition involved was the precipitation of austenite from the liquid phase (L). A one-sublattice model (Fe, C)1 can be used to describe the Gibbs free energy per formula unit for the liquid phase as follows:
G L = x C G C L ° + x Fe G Fe L ° + R T x C ln x C + x Fe ln x Fe + G ex L
where xFe and xC are the mole fraction of Fe and C; G Fe L ° and G C L ° are the molar Gibbs free energy of pure substances; R is the ideal gas constant; T is the temperature. The excess Gibbs energy representing the degree of deviation from the ideal solution is given by
G ex L = x C x Fe L C , Fe L
with the Redlich–Kister polynomial being
L C , Fe L = k = 0 L C , Fe L k x C x Fe k
A two-sublattice model (Fe)1(C, Va)1, with Fe on the first sublattice and C and vacancies on the interstitial sublattice, was employed to describe the Gibbs free energy of austenite as follows:
G γ = y C G Fe : C γ ° + y Va G Fe : Va γ ° + R T y C ln y C + y Va ln y Va + G ex γ
where yC = xC/(1 − xC) and yVa = 1 − yC are the site fraction of C and Va in the interstitial sublattice, and G Fe : C γ ° and G Fe : Va γ ° are the Gibbs free energy of the hypothetical compound of Fe and C as well as Fe and Va. The excess Gibbs energy, analogously, is given as:
G ex γ = y C y Va L Fe : C , Va γ = y C y Va k = 0 L Fe : C , Va γ k y C y Fe k
The thermodynamic evaluation of the Fe–C binary system has been studied for several decades, and the specific parameters in Equations (6)~(10) have been optimized using the CALPHAD (CALculation of PHAse Diagram) method, which is summarized in Table 2 for the liquid phase and austenite [36]. The Gibbs energies of pure Fe as liquid and solid (FCC), and those of pure C as liquid and solid (graphite), can be referred to the SGTE (Scientific Group Thermodata Europe) database for pure substances [37]. In addition, it should be noted that the contribution of magnetic order–disorder transition is not considered in the above thermodynamic model, because the solidification process takes place at a temperature that is much higher than the Curie temperature of the Fe–C binary alloy [36].

2.3. Numerical Implementations

The phase-field simulations were performed on two-dimensional uniform finite difference grids with an explicit Euler time scheme. A standard five-point Laplacian operator was applied for solving both the phase-field and solute diffusion equations. To reduce the simulation consumption time, the anti-trapping current term in Equation (5) was only calculated near the solid–liquid interface where ϕ L 2 1 × 10 8 . The simulation of phase transition during solidification with solute diffusion leads to a huge amount of computation. Therefore, a vectorized and GPU-accelerated numerical solving code, which was based on the Parallel Computing Toolbox of MATLAB®, was developed to greatly reduce the computing time. All calculations were performed on a single workstation with an Intel® Core i7-11700K CPU (Central Processing Unit) (16 processers, 3.60 GHz), a NVIDIA® GeForce RTX 3060 Ti GPU (4864 CUDA (Compute Unified Device Architecture) cores, 1.41 GHz, 8 GB graphic memory), and 64 GB RAM (Random Access Memory). The simulation with the longest computing time took no more than 48 h when the concentration in liquid exceeded the eutectic composition, and then the simulation was stopped as the eutectic reaction was not considered.

3. Results and Discussion

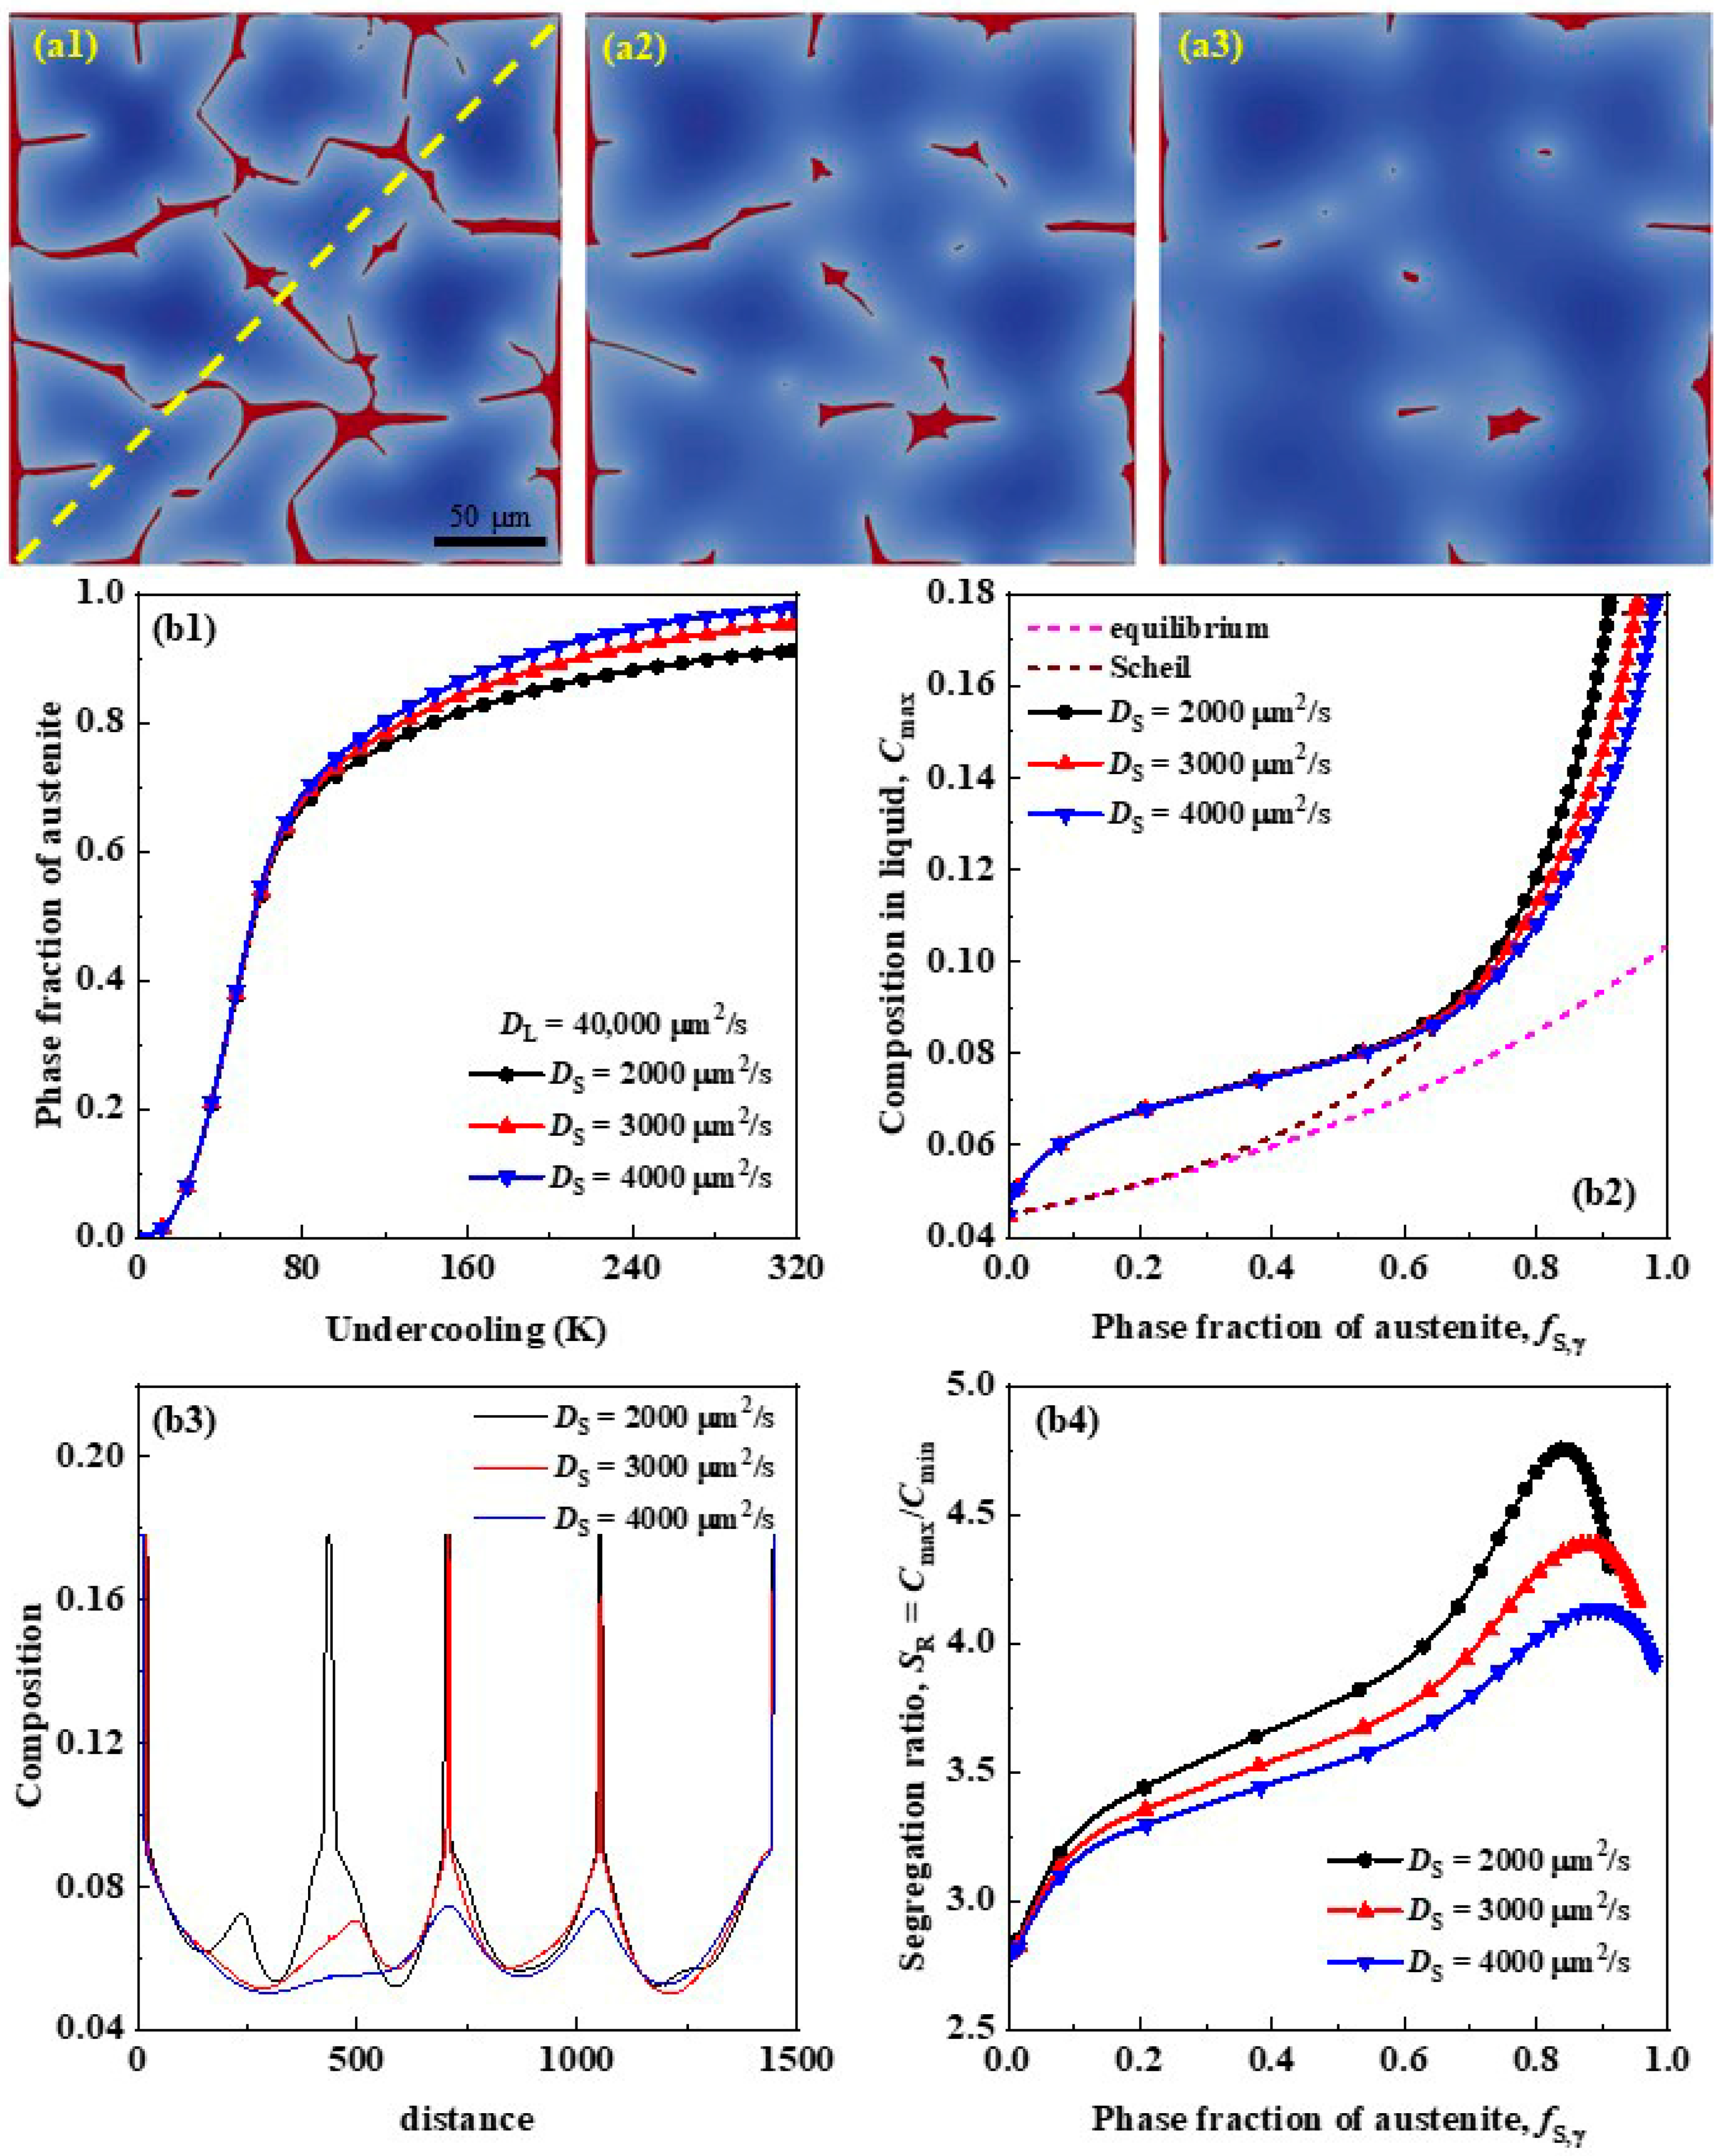
3.1. Effects of Solute Diffusivity on Segregation

The diffusion of solute elements, especially carbide forming elements, during solidification is one of the most important factors affecting segregation and carbide precipitation. The equiaxed dendrite structure and solute segregation in the phase-field simulations with different diffusivity of the C element in solid are shown in Figure 1, from which it is clear that the solute diffusivity in solid has a significant influence on the solute segregation during solidification. According to Figure 1(a1–a3), the residual liquid with a high concentration of C at late solidification is greatly reduced when the solute diffusivity in solid increases, which means that the volume fraction of the primary austenite at the same undercooling will be larger with a higher solute diffusivity in solid (Figure 1(b1)).
The maximum solute concentration in liquid against the fraction of austenite is plotted in Figure 1(b2), and the prediction by the lever rule and the Gulliver–Scheil equation is also given. In equilibrium solidification, the solute concentration in liquid at late solidification is much lower than the eutectic composition (cE), and therefore no cementite is precipitated. However, in Scheil solidification, when the primary austenite fraction reaches about 0.9, the solute concentration in liquid reaches cE, and then cementite begins to precipitate. The results of the phase-field simulations were between the predictions by the equilibrium lever rule and non-equilibrium Gulliver–Scheil equation, which are the two limiting cases of the actual solidification process [38]. It should be noted that the maximum solute concentration in liquid during early solidification was higher than the predictions by the Gulliver–Scheil equation and the lever rule, since these two analytical models assume that the composition in liquid is uniform and that there is no solute segregation. With the increase in the solute diffusivity in solid, the maximum solute concentration in liquid in the phase-field simulations gradually transitions from the Gulliver–Scheil equation to the lever rule. In other words, increasing the solute diffusivity in solid will enlarge the primary austenite fraction when the liquid composition reaches cE at late solidification, which means that the solute segregation and the amount of cementite precipitated will both be reduced.
In order to clearly compare the solute segregation at late solidification with different diffusivity of C in solid, the distribution of C along the diagonal of the computational domain at undercooling ∆T = 300 K was plotted, as seen in Figure 1(b3). It is obvious that not only was the volume fraction of the residual liquid reduced, but more importantly, the solute concentration of the residual liquid significantly decreased with an increase in the solute diffusivity in solid. Moreover, the reduced solute segregation with a larger solute diffusivity in solid could also be seen from the segregation ratio (Figure 1(b4)).
Two characteristic parameters were further introduced to quantitatively evaluate the segregation at late solidification. The first was the volume fraction threshold of the primary austenite (fS*) when the liquid concentration reached the eutectic composition, and the other was the maximum segregation ratio (SR,max). A higher fS* or a lower SR,max indicates that the segregation at late solidification is reduced, thus leading to less cementite precipitation. Interestingly, the values of both two parameters had a clear relationship with the ratio of the solute diffusivity in solid and liquid (DS/DL), rather than only the diffusivity itself in solid or liquid (Figure 2).
It has been revealed that the phase fraction threshold of the primary austenite can be approximately correlated to DS/DL as a logistic function (Figure 2a), while the maximum segregation ratio varied with DS/DL as an approximate power law (Figure 2b). The value of fS* increased rapidly with the increase in DS/DL, and when DS/DL was about 0.2, the phase fraction threshold of primary austenite was close to 1, indicating that there was almost no cementite precipitation at this condition. In addition, the value of SR,max decreased with increasing DS/DL, which also clarifies that a higher DS/DL is beneficial to reduce solute segregation and cementite precipitation. In the actual metallurgical industry, the diffusivity of carbon could be reduced by adding rare earth elements [3,14], but the quantitative evaluation of the diffusivity of carbon in solid and liquid after the addition of rare earth elements is still unknown, which is expected to be calculated by first-principle methods.

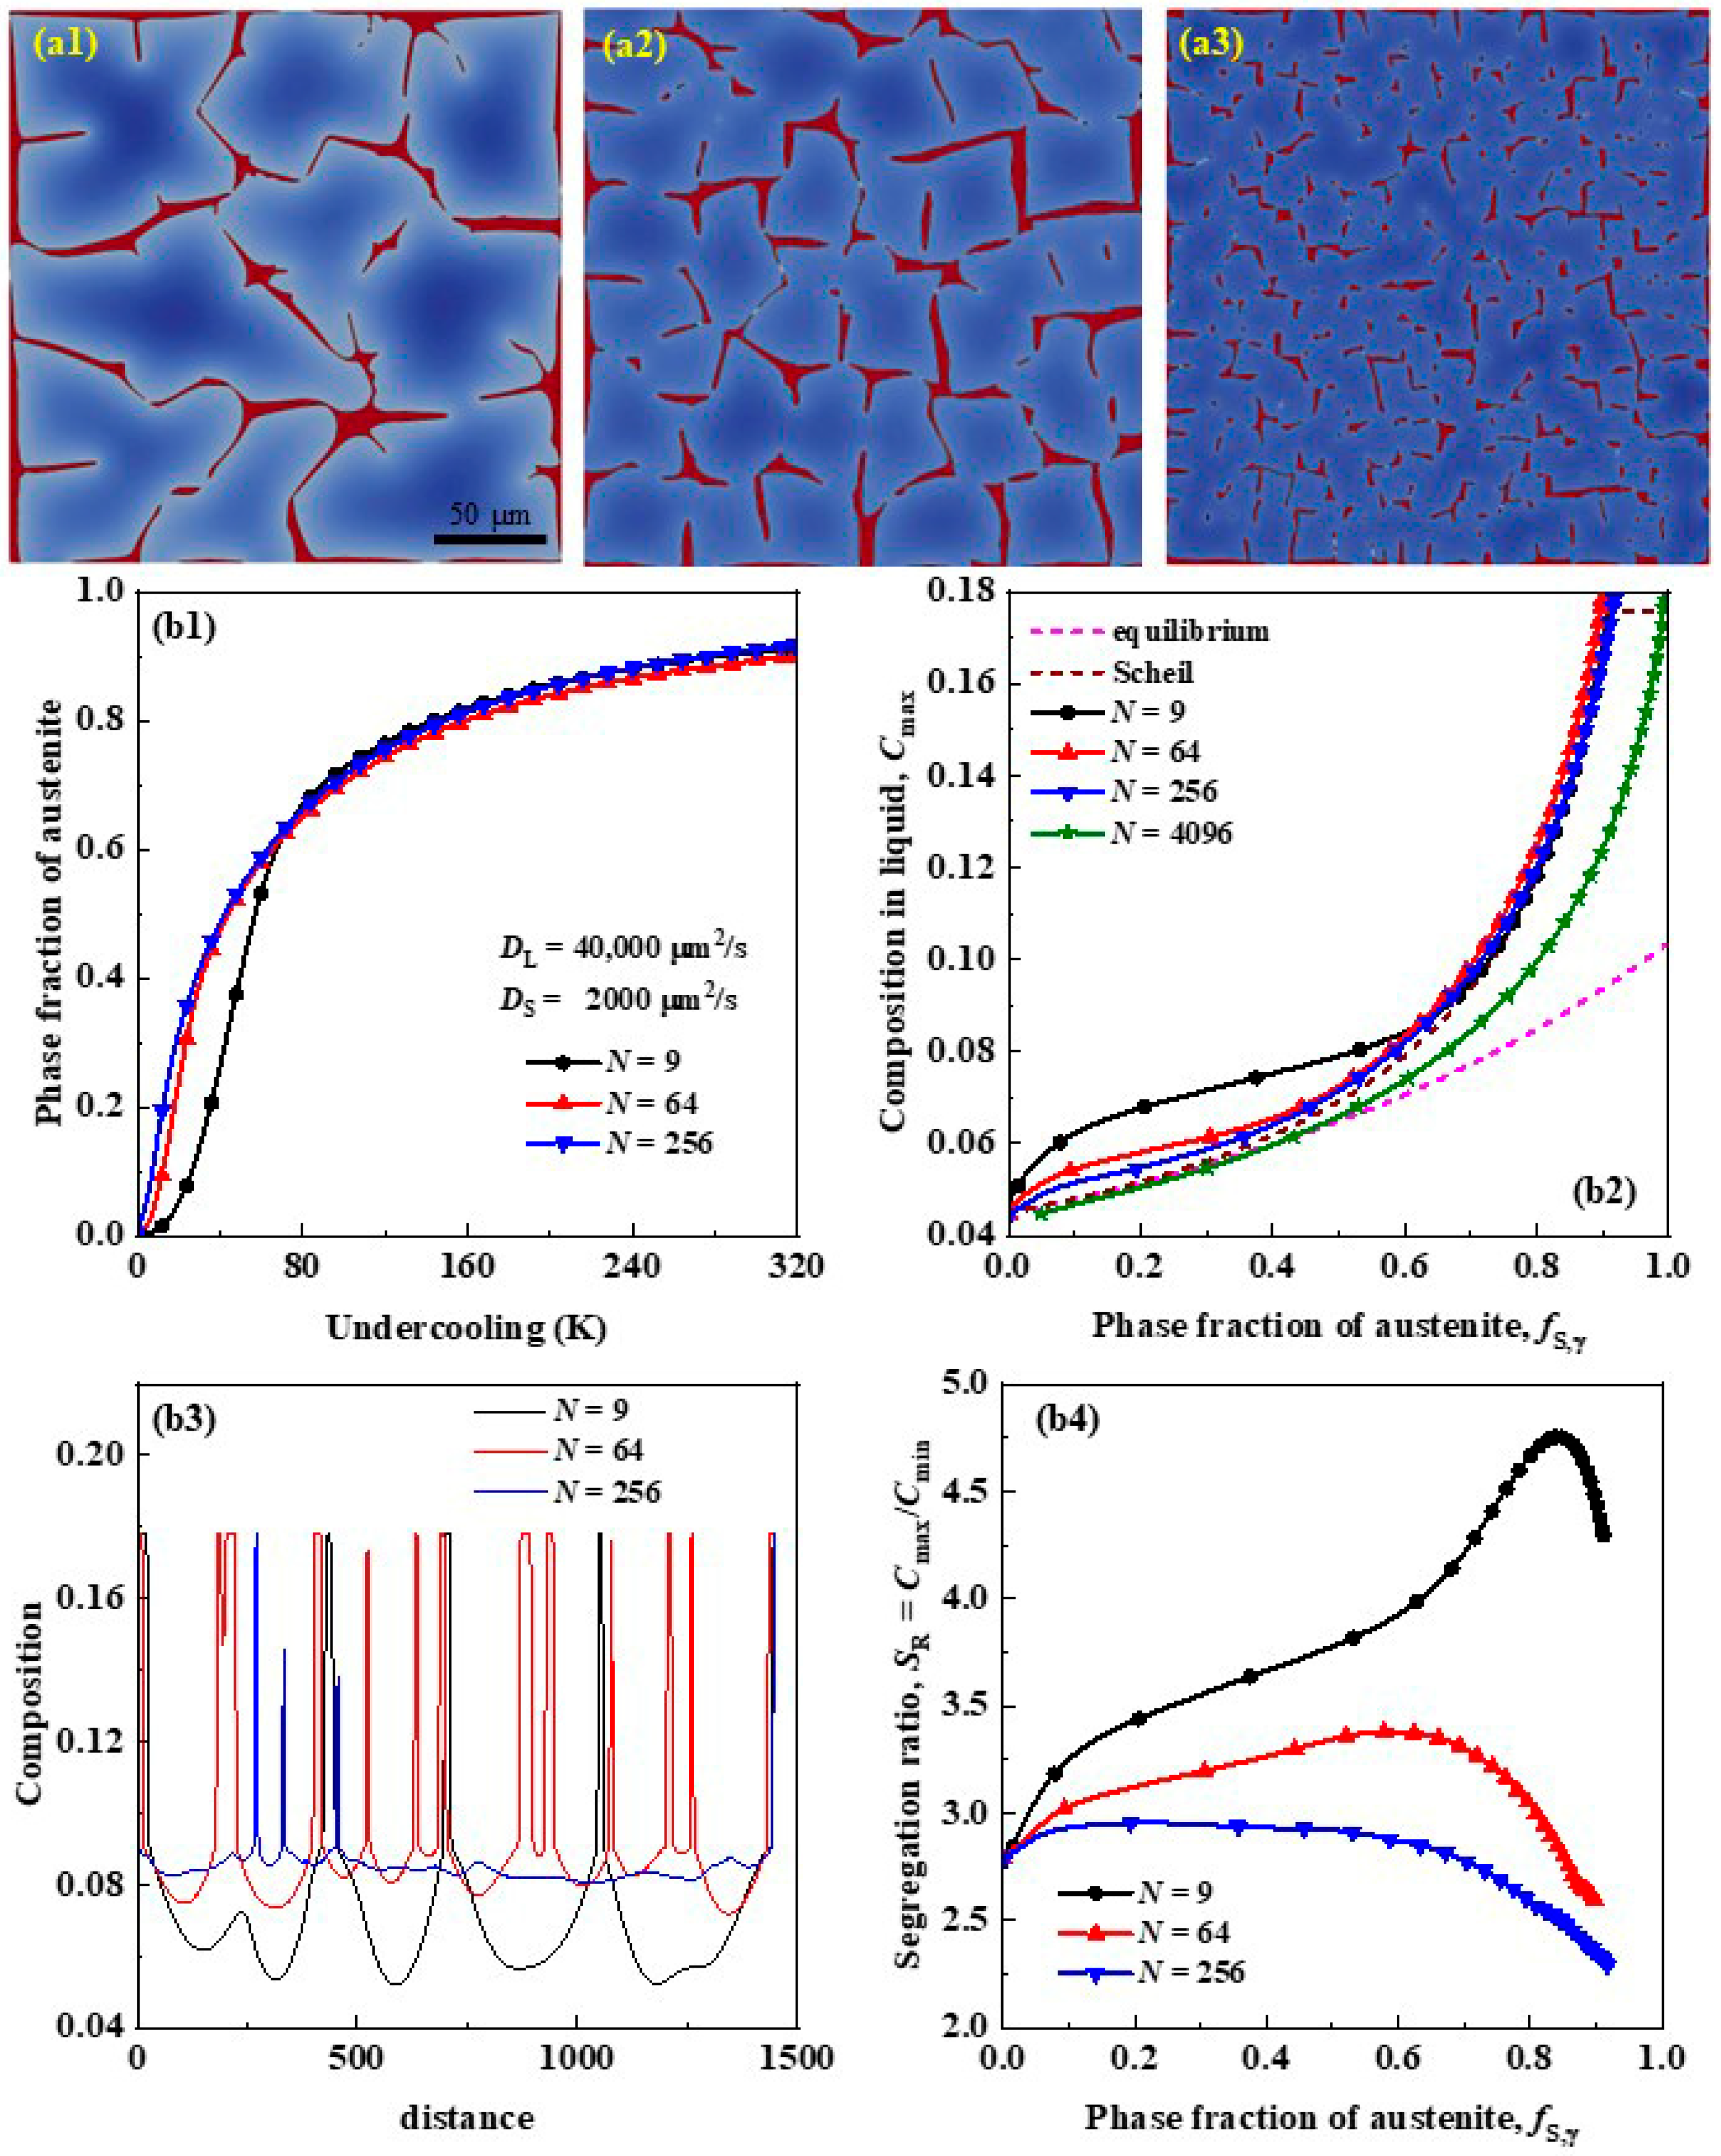
3.2. Effects of Grain Size on Segregation

In addition to solute diffusion, another important factor affecting segregation and carbide precipitation is the grain size of primary austenite. An intuitive understanding of the effect of grain size on solute segregation is that the residual liquid at late solidification will not form complex channels when the grain of the primary austenite is small, thus hindering the long-distance diffusion of solute elements [14]. The grain morphology and solute distribution in the phase-field simulations with different sizes of primary austenite are shown in Figure 3. When the grain size of primary austenite is large, there is apparent residual liquid phase channels of solute enrichment at late solidification (Figure 3(a1–a3)), and therefore the cementite can easily precipitate and grow in a larger size.
Similarly, the volume fraction of primary austenite, the liquid concentration, and the solute segregation were plotted, as shown in Figure 3(b1–b4). The results of phase-field simulations were still between the lever rule and Gulliver–Scheil equation. With the decrease in the grain size of primary austenite, the simulated results changed from close to the Gulliver–Scheil equation to close to the lever rule. In the cases of a larger grain size, refining the grain of primary austenite has no significant effect on the volume fraction of austenite (Figure 3(b1)) and liquid concentration (Figure 3(b2)) at late solidification. However, the liquid concentration could be reduced by further refining primary austenite grains, and even when the number of grains is sufficiently large (N = 4096 in Figure 3(b2)), the austenite phase fraction is close to 1 when the liquid concentration reaches cE. Moreover, the solute concentration in solid is relatively higher and more uniform with a small grain size of primary austenite (Figure 3(b3)), resulting in a decrease in the segregation ratio (Figure 3(b4)).
The results in Figure 3 clarify that reducing the grain size of primary austenite is beneficial to reducing solute segregation and cementite precipitation at late solidification. However, from a quantitative point of view, the influence of the grain size on solute segregation becomes significant only when the grain size of primary austenite is lower than a certain critical value (D* ≈ 100 μm as shown in Figure 4a), and otherwise, the segregation will be even slightly more severe with a decrease in the grain size of the primary austenite. In contrast, the relationship between the maximum segregation ratio and the grain size is monotonic, in which SR,max decreases in an approximate linear manner as the grain of primary austenite is refined (Figure 4b). Therefore, only when the grain size of primary austenite is reduced to a certain threshold can further grain refinement be helpful in reducing solute segregation and cementite precipitation.

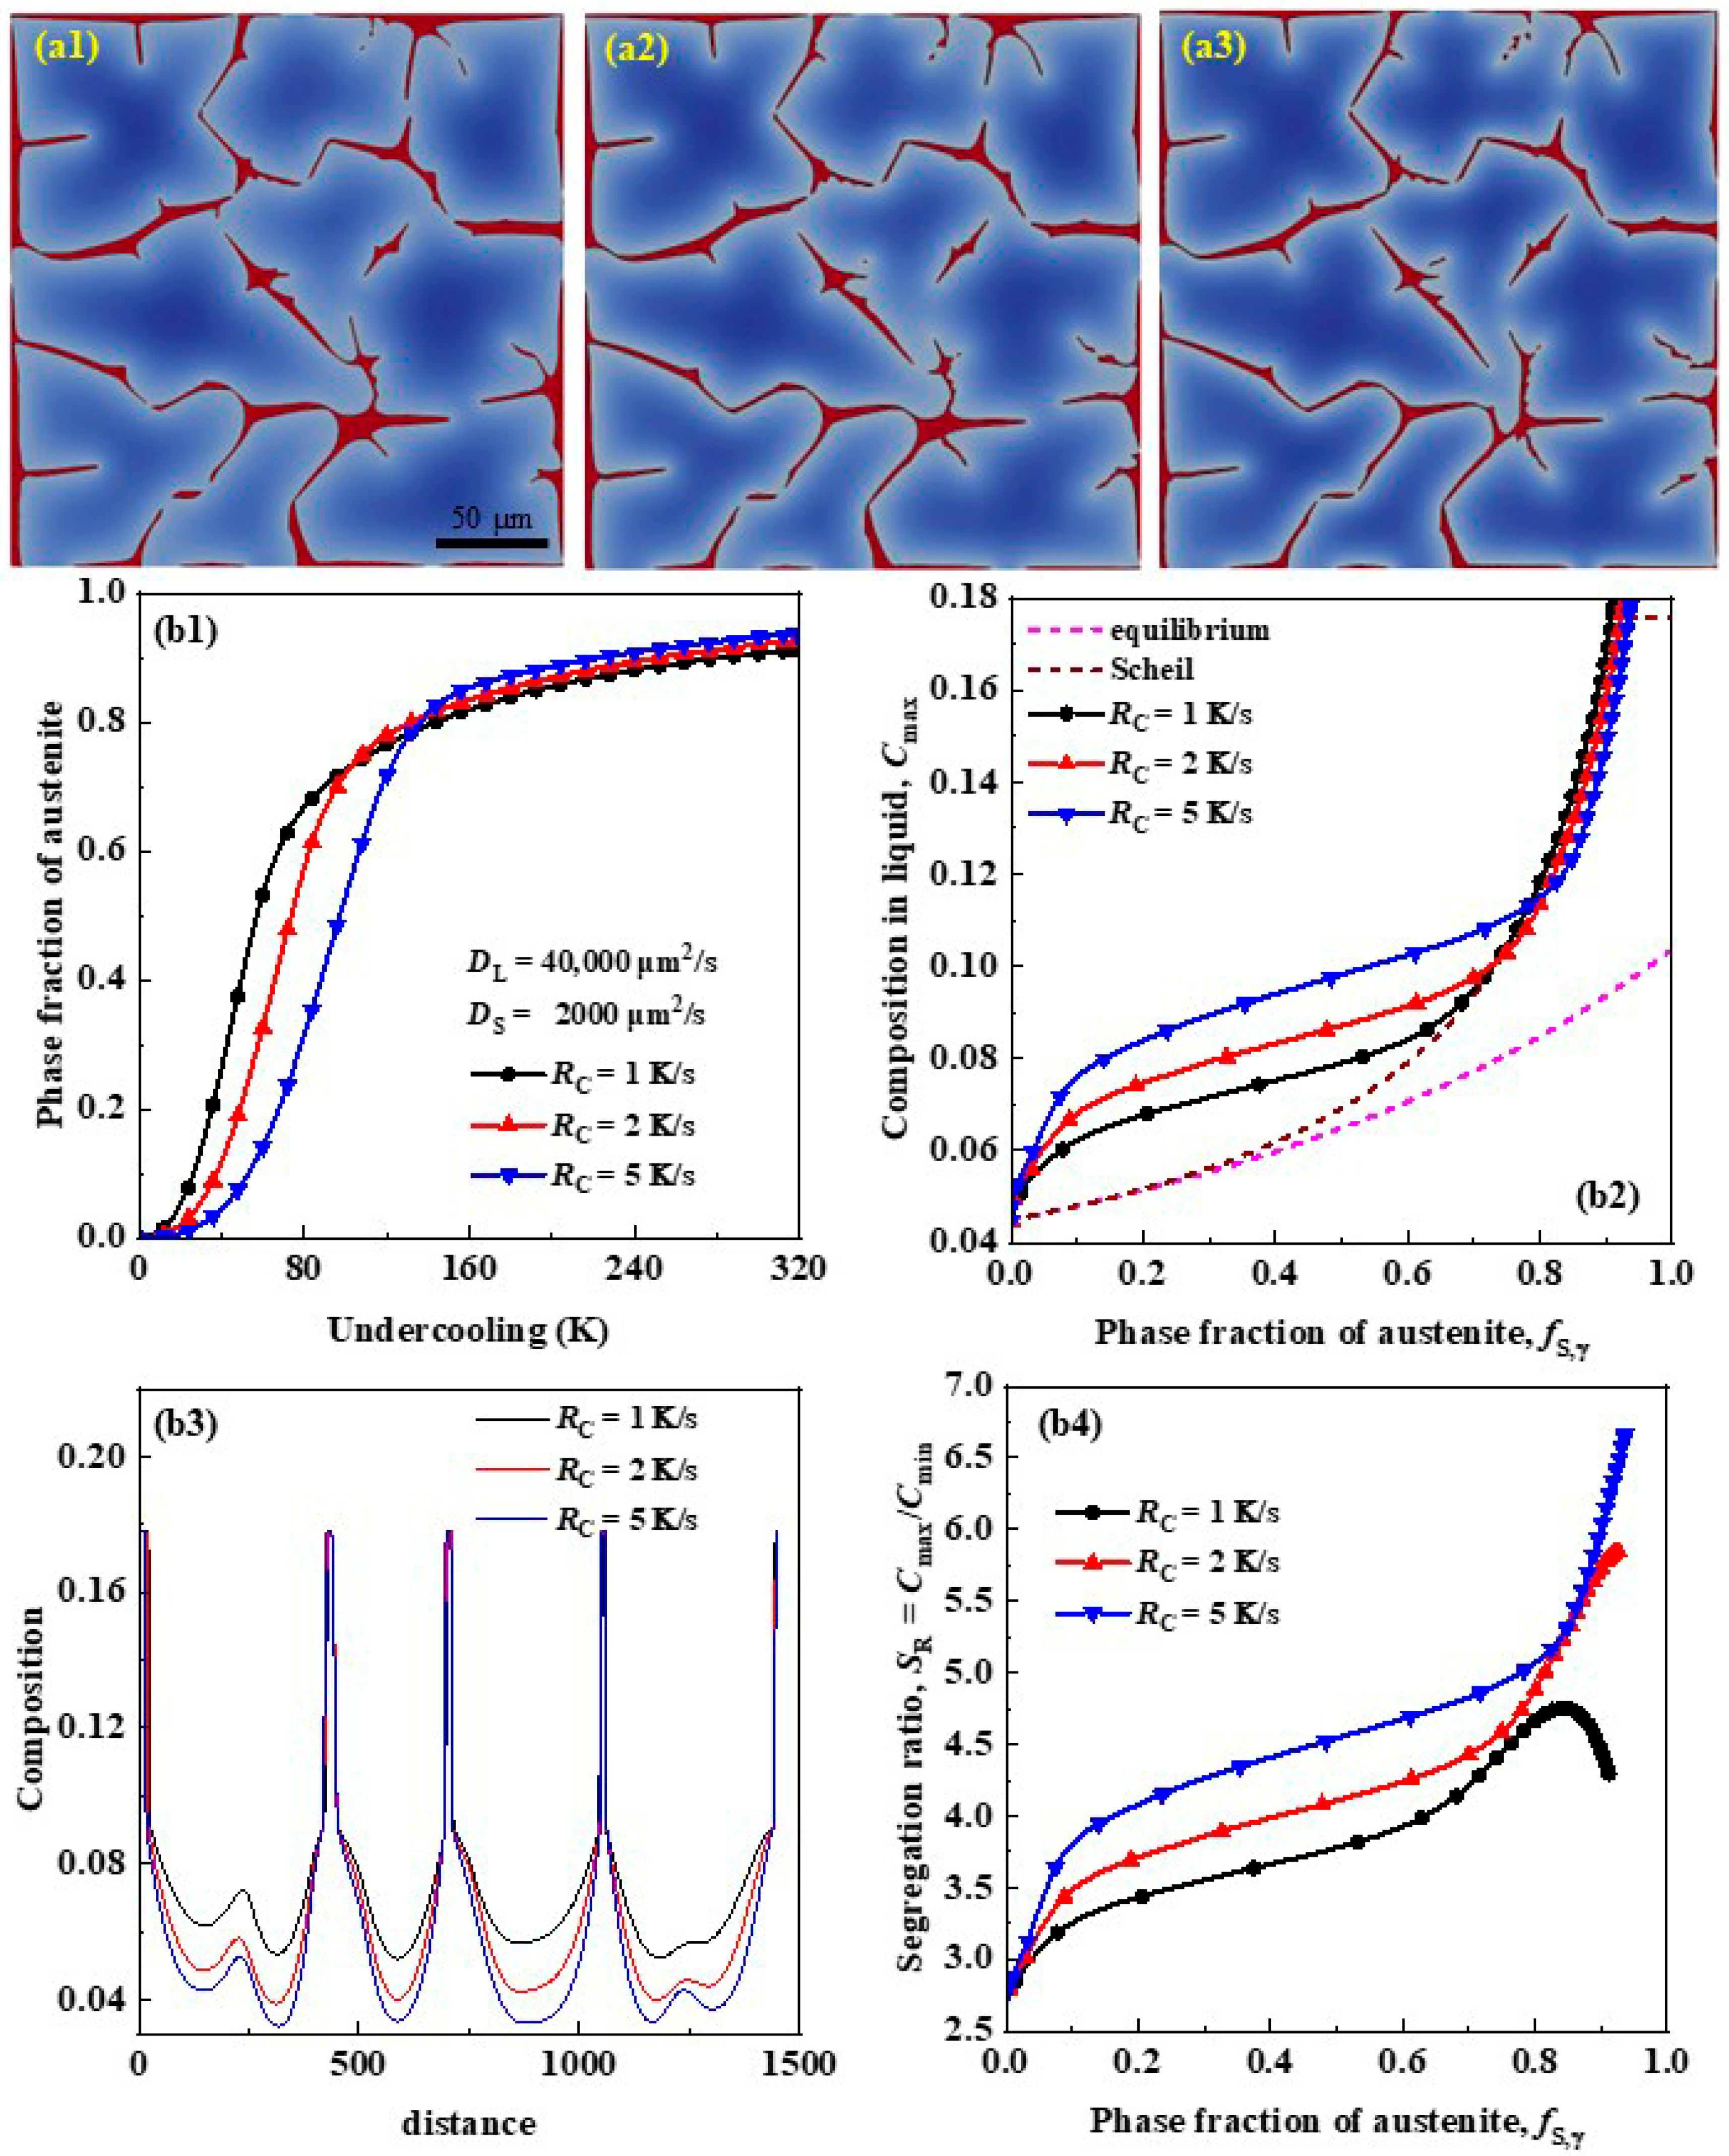
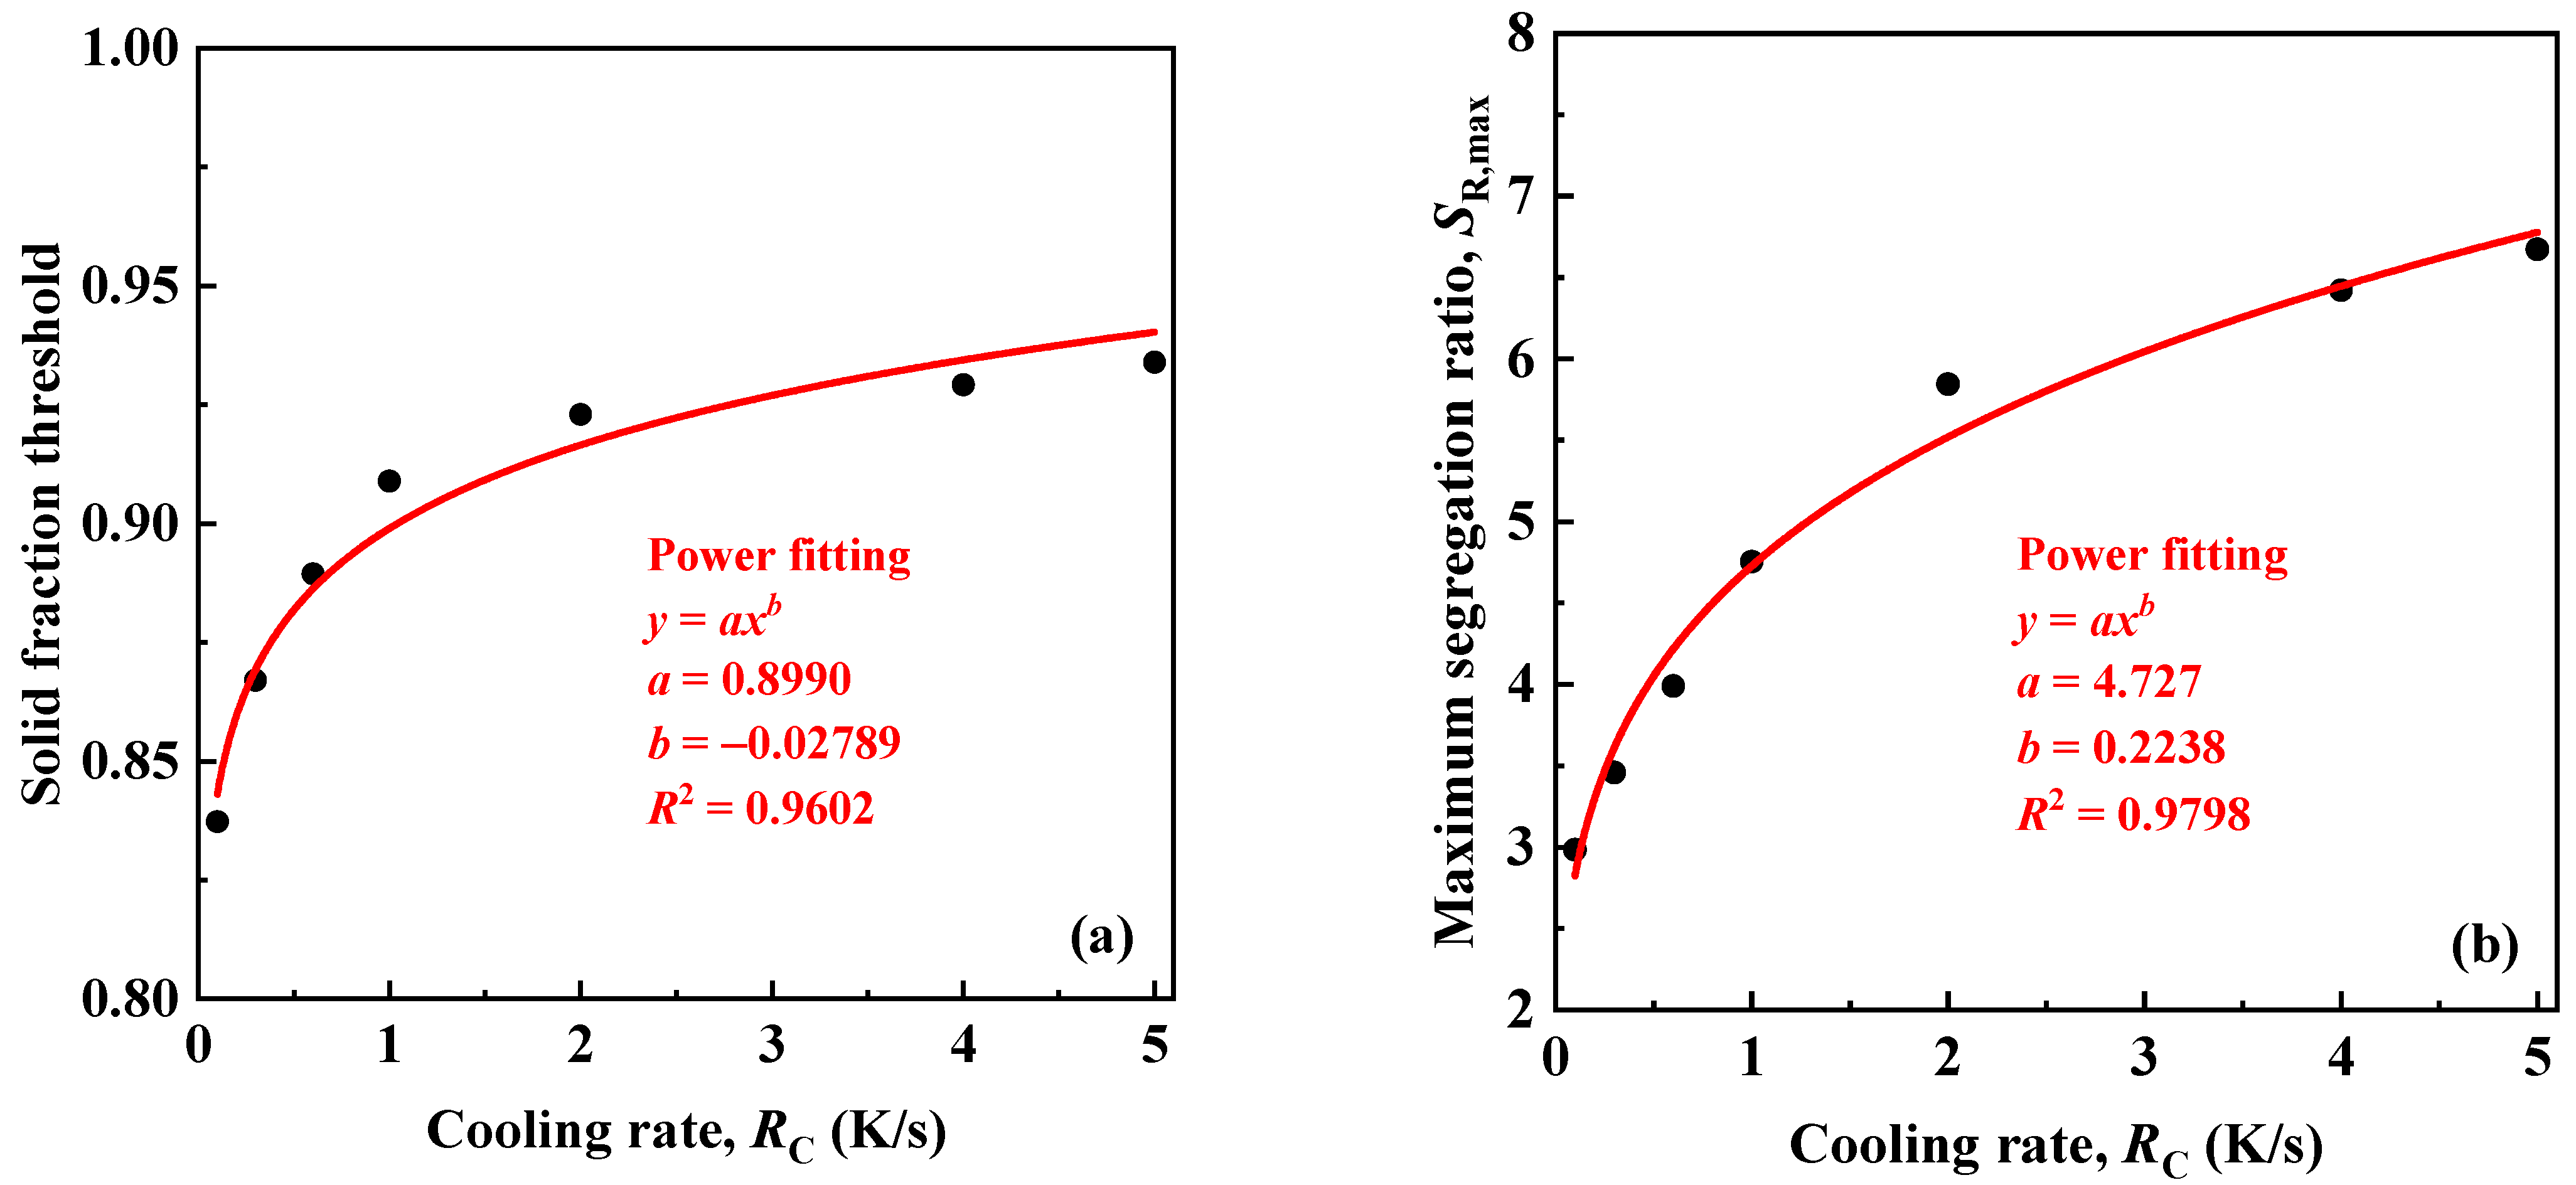
3.3. Effects of Cooling Rate on Segregation

It has been revealed from the above discussion that the grain size of primary austenite has a significant influence on the solute segregation and carbide precipitation at late solidification. In actual solidification, the grain of primary austenite can be refined in several ways such as by adding an external nucleating substrate (inoculation treatment) or breaking coarse dendrites to form fragments (electromagnetic stirring). One way to obtain a higher nucleation rate is to increase the cooling rate during solidification, in which the thickness of the solute boundary ahead of the solid–liquid interface is small, to reduce the inhibition of nucleation. However, the effect of the cooling rate on solute segregation, regardless of that on the nucleation rate, has not been clearly concluded. Therefore, the solidification of Fe-1.0 wt.% C binary alloys at the same grain number of primary austenite but different cooling rates was simulated (Figure 5).
On the whole, the solute distribution was more uniform at a lower cooling rate (Figure 5(a1–a3)) because the solidification time was relatively longer, and the solute had enough time to diffuse evenly. In addition, the cooling rate had a significant influence on the phase fraction of primary austenite and the solute concentration in liquid during early solidification, but this effect becomes very slight at late solidification (Figure 5(b1,b2)), which can also be verified by the fact that the composition of residual liquid is almost the same (Figure 5(b3)). However, unlike the concentration in residual liquid, the solid composition in solid at late solidification is higher and more uniform when the cooling rate is slower, resulting in a lower segregation ratio (Figure 5(b4)).
Although the cooling rate had a slight effect on the solute segregation (Figure 5(b2)), quantitatively speaking, there was indeed a good relationship between the cooling rate and the phase fraction threshold of primary austenite when the liquid concentration reached the eutectic composition. Specifically, the phase fraction threshold increased in an approximate power function as the cooling rate (Figure 6a), which indicates that increasing the cooling rate can indeed reduce the solute segregation at late solidification. Moreover, the maximum segregation ratio could also be correlated to the cooling rate in an approximate power manner (Figure 6b). However, as above-mentioned, the increase in SR,max indicates the non-uniform distribution of the solute in solid and liquid, but there was no direct correlation to the enrichment of the solute in the residual liquid and carbide precipitation at late solidification. It is again emphasized that the effect of the cooling rate on solute segregation in this work was discussed based on the absence of its influence on the nucleation rate, which is generally inconsistent with actual solidification.

4. Conclusions

In this work, the effects of the solute diffusion, the grain size (or grain refinement) of primary austenite, and the cooling rate on the solute segregation of an Fe-1.0 wt.% C binary alloy during solidification were studied by the phase-field method coupled with a thermodynamic database. It was revealed that the solute segregation and primary cementite precipitation could be reduced by several effective ways including increasing the ratio between solute diffusivity in solid and liquid (DS/DL), decreasing the grain size of the primary austenite to smaller than a certain threshold, and increasing the cooling rate. The main conclusions are summarized as follows:
(1)
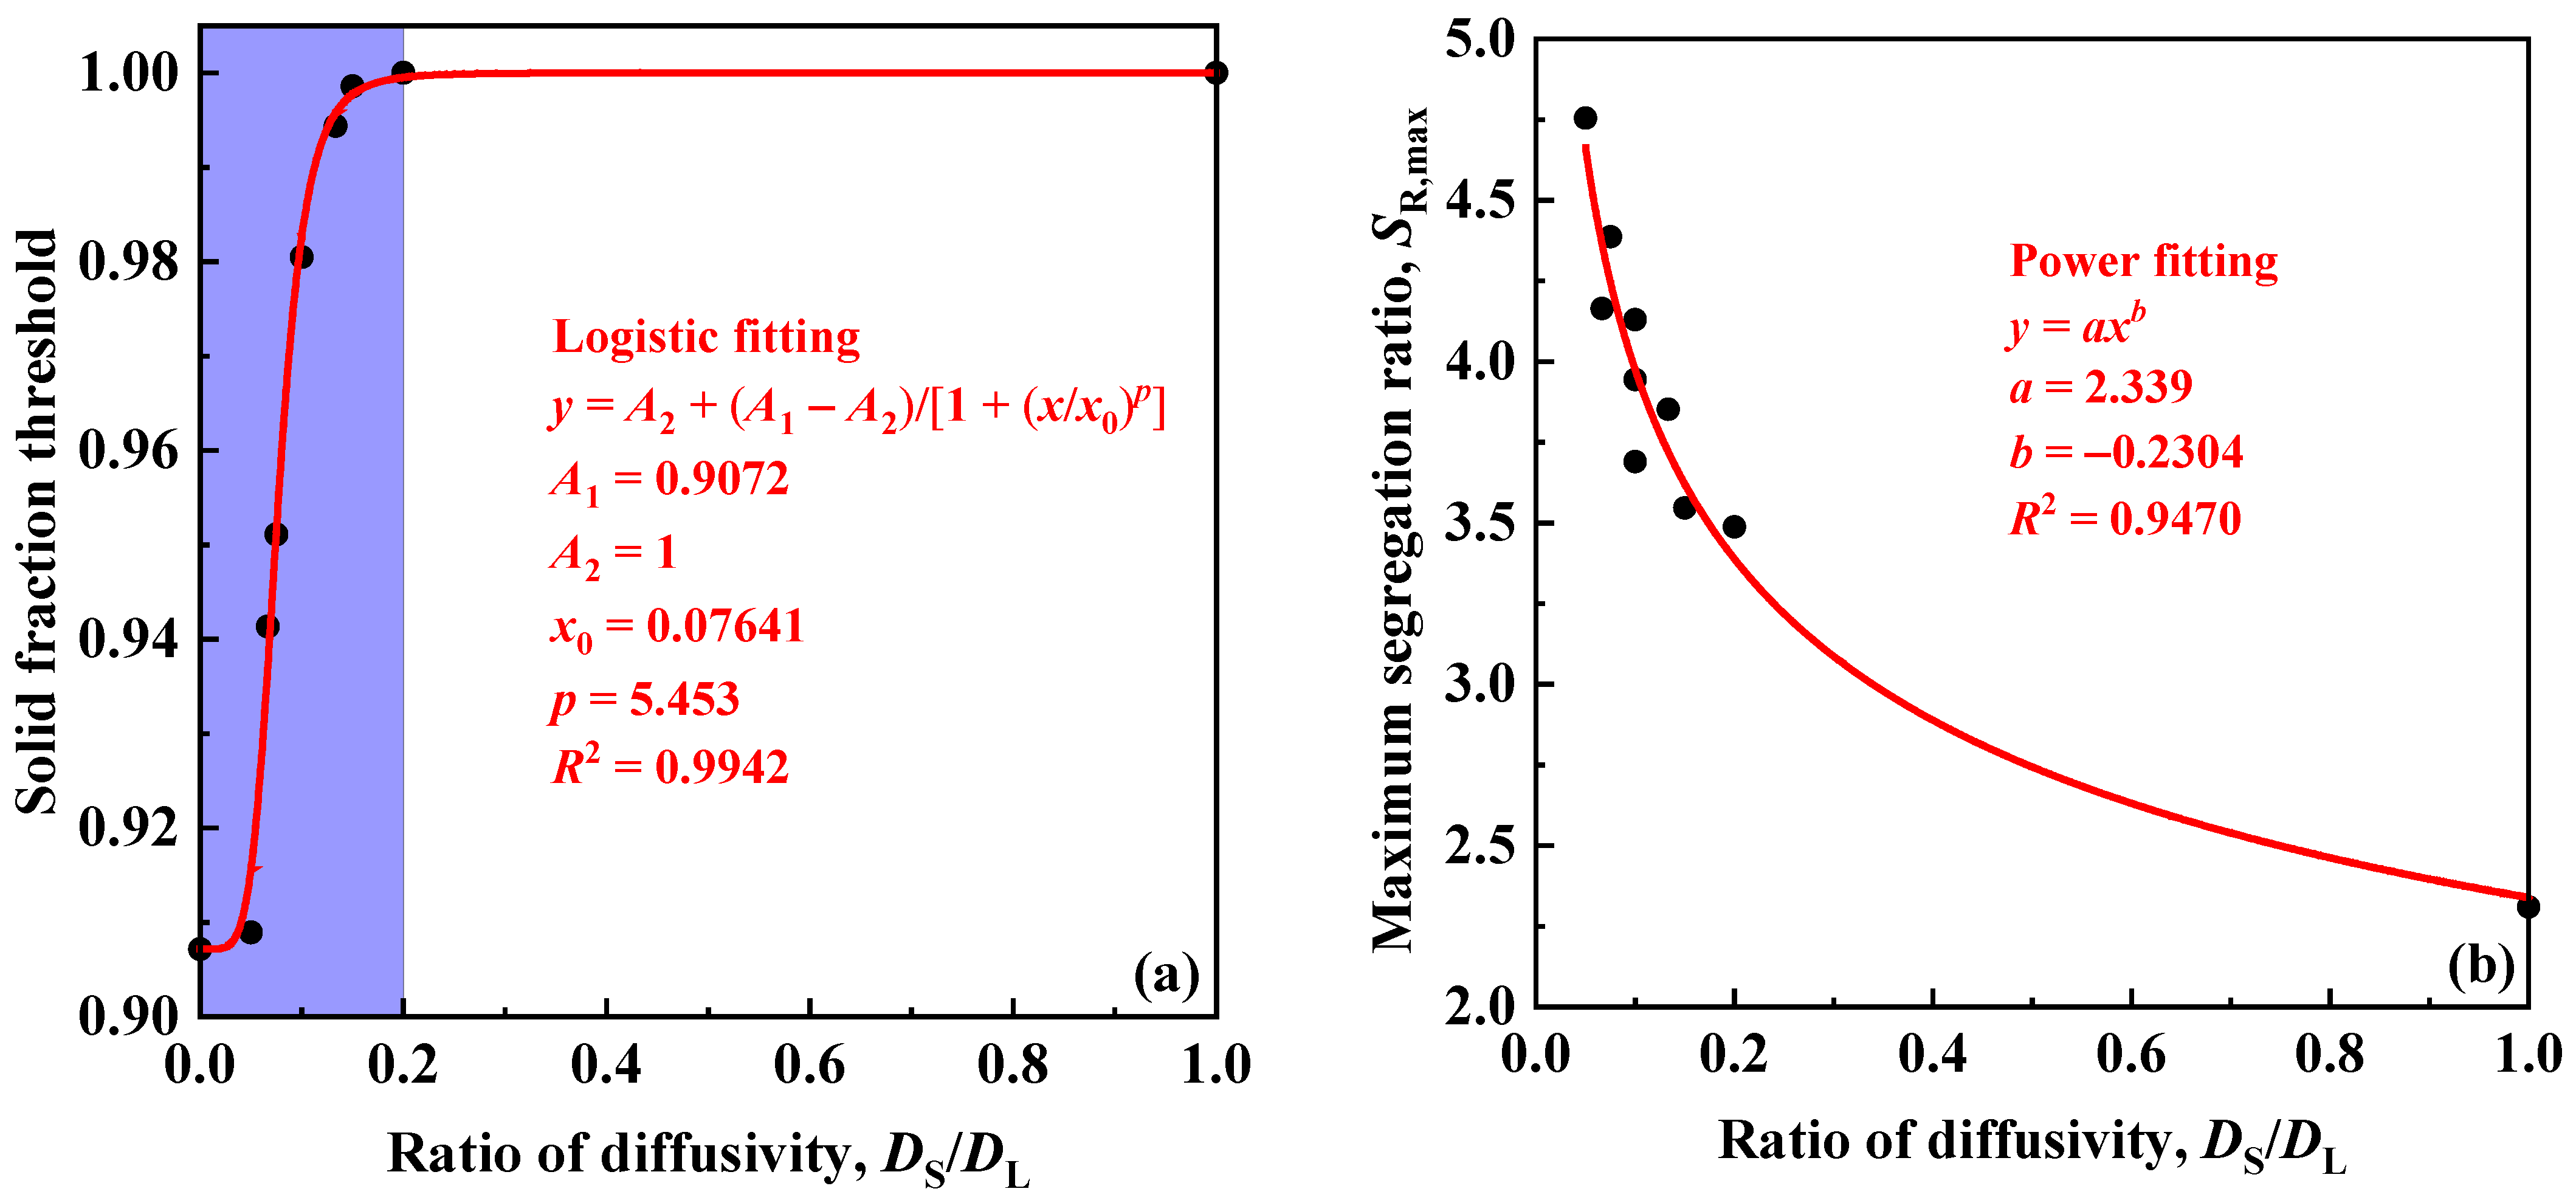
By increasing the ratio of solute diffusivity in solid and liquid, the phase fraction threshold of primary austenite when the solute concentration in residual liquid reaches the eutectic composition increases as a logistic function, and the maximum segregation ratio decreases as a power function, both indicating that the solute segregation and cementite precipitation will be reduced.
(2)
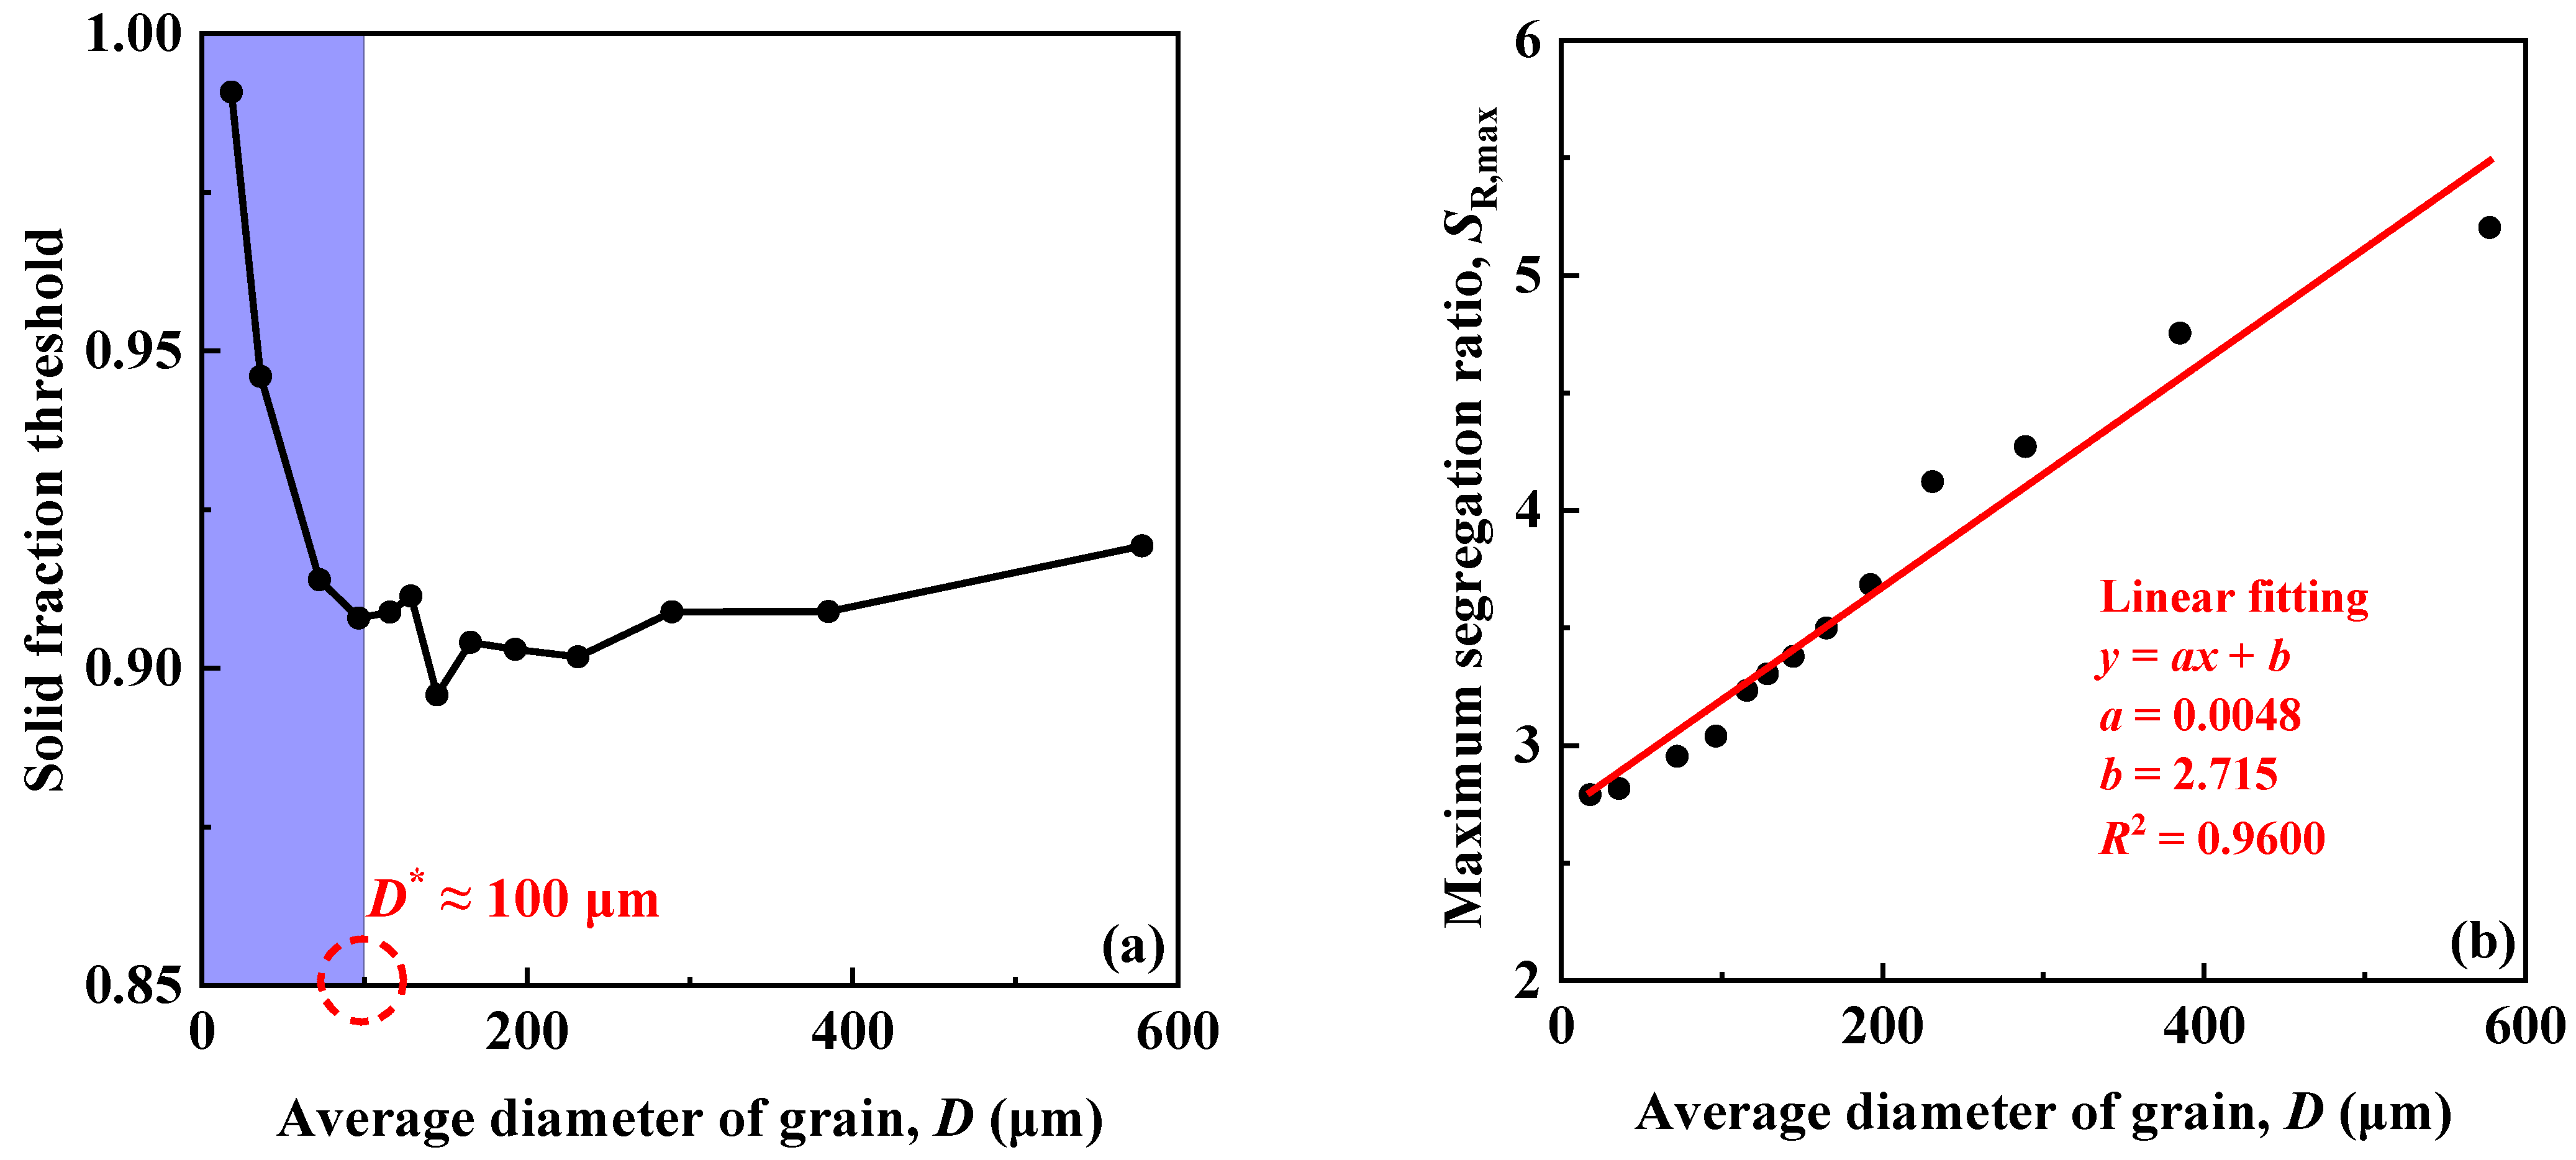
By decreasing the grain size of primary austenite, the phase fraction threshold of primary austenite increases dramatically only when the grain size is lower than a certain value (revealed to be about 100 μm here), while the maximum segregation ratio is decreased monotonically in an approximate linear manner, and therefore the grain size of primary austenite must be reduced to small enough to improve the solute segregation and inhibit carbide precipitation by grain refinement.
(3)
By increasing the cooling rate (artificially ignoring the effect of the cooling rate on the nucleation rate), the phase fraction threshold of the primary austenite increases as a power function, indicating that even without considering the change in grain size, a higher cooling rate is still helpful to reduce solute segregation and carbide precipitation. However, although the segregation ratio increases with an increase in the cooling rate, the underlying reason is that the short solidification time leads to the heterogeneous solute distribution in solid, rather than the aggravating solute enrichment in liquid.

Author Contributions

Methodology, T.-Z.G. and Y.C.; software, T.-Z.G. and W.-Y.H.; validation, T.-Z.G.; writing—original draft preparation, T.-Z.G.; writing—review and editing, Y.C., W.-Y.H., X.-Q.C. and D.-Z.L.; visualization, T.-Z.G. and W.-Y.H.; supervision, Y.C., X.-Q.C. and D.-Z.L.; project administration, Y.C.; funding acquisition, Y.C., X.-Q.C. and D.-Z.L. All authors have read and agreed to the published version of the manuscript.

Funding

This research was funded by the National Natural Science Foundation of China (No. 52203301), the China Postdoctoral Science Foundation (No. 2021TQ0335), the Young Talents Project of SYNL (No. 2021000559), and the Strategic Priority Research Program of the Chinese Academy of Sciences (No. XDC04000000).

Data Availability Statement

The data presented in this study are available on request from the corresponding author. The data are not publicly available due to the data also forms part of an ongoing study.

Conflicts of Interest

The authors declare no conflict of interest.

References

  1. Li, D.; Chen, X.-Q.; Fu, P.; Ma, X.; Liu, H.; Chen, Y.; Cao, Y.; Luan, Y.; Li, Y. Inclusion flotation-driven channel segregation in solidifying steels. Nat. Commun. 2014, 5, 5572. [Google Scholar] [CrossRef] [PubMed] [Green Version]
  2. Silva, A. The effects of non-metallic inclusions on properties relevant to the performance of steel in structural and mechanical applications. J. Mater. Res. Technol. 2019, 8, 2408–2422. [Google Scholar] [CrossRef]
  3. Li, D.; Wang, P.; Chen, X.-Q.; Fu, P.; Luan, Y.; Hu, X.; Liu, H.; Sun, M.; Chen, Y.; Cao, Y.; et al. Low-oxygen rare earth steels. Nat. Mater. 2022, 21, 1137–1143. [Google Scholar] [CrossRef] [PubMed]
  4. Kawakami, K.; Taniguchi, T.; Nakashima, K. Generation mechanisms of non-metallic inclusions in high-cleanliness steel. Tetsu Hagane-J. Iron Steel Inst. Jpn. 2007, 93, 743–752. [Google Scholar] [CrossRef] [Green Version]
  5. Ma, W.J.; Bao, Y.P.; Wang, M.; Zhao, L.H. Effect of Mg and Ca treatment on behavior and particle size of inclusions in bearing steels. ISIJ Int. 2014, 54, 536–542. [Google Scholar] [CrossRef] [Green Version]
  6. Wang, H.P.; Xiong, L.; Zhang, L.; Wang, Y.; Shu, Y.Y.; Zhou, Y.H. Investigation of RE-O-S-As inclusions in high carbon steels. Metall. Mater. Trans. B 2017, 48, 2849–2858. [Google Scholar] [CrossRef]
  7. Yang, C.Y.; Luan, Y.K.; Li, D.Z.; Li, Y.Y. Effects of rare earth elements on inclusions and impact toughness of high-carbon chromium bearing steel. J. Mater. Sci. Technol. 2019, 35, 1298–1308. [Google Scholar] [CrossRef]
  8. Zhang, S.C.; Yu, J.T.; Li, H.B.; Jiang, Z.H.; Geng, Y.F.; Feng, H.; Zhang, B.B.; Zhu, H.C. Refinement mechanism of cerium addition on solidification structure and sigma phase of super austenitic stainless steel S32654. J. Mater. Sci. Technol. 2022, 102, 105–114. [Google Scholar] [CrossRef]
  9. Sourmail, T. Precipitation in creep resistant austenitic stainless steels. Mater. Sci. Technol. 2001, 17, 1–14. [Google Scholar] [CrossRef]
  10. Yen, H.W.; Chen, P.Y.; Huang, C.Y.; Yang, J.R. Interphase precipitation of nanometer-sized carbides in a titanium-molybdenum-bearing low-carbon steel. Acta Mater. 2011, 59, 6264–6274. [Google Scholar] [CrossRef]
  11. Li, T.; Ma, Y.; Cai, Q.; Ma, J. Cause and control on unqualified UT of large-size high-carbon high-chromium bearing steel ring. Hot Work. Technol. 2013, 42, 230. [Google Scholar]
  12. Kim, K.H.; Park, S.D.; Bae, C.M. New approach to the soaking condition of 100Cr6 high-carbon chromium bearing steel. Met. Mater. Int. 2014, 20, 207–213. [Google Scholar] [CrossRef]
  13. Khan, F.A. The effect of soaking on segregation and primary-carbide dissolution in ingot-cast bearing steel. Metals 2018, 8, 800. [Google Scholar] [CrossRef] [Green Version]
  14. Li, S.S.; Chen, Y.; Gong, T.Z.; Chen, X.Q.; Fu, P.X.; Li, D.Z. Effect of cooling rate on the precipitation mechanism of primary carbide during solidification in high carbon-chromium bearing steel. Acta Metall. Sin. 2022, 58, 1024–1034. [Google Scholar]
  15. Xu, C.; Chen, Y.; Gong, T.; Shi, Y.; Wang, J.; Chen, X.-Q.; Liu, P.; Guo, Y.; Li, D. Ab initio study of local structures during cooling of liquid Fe-C and Fe-Cr-C alloys. Comput. Mater. Sci. 2022, 212, 111572. [Google Scholar] [CrossRef]
  16. Tian, Q.R.; Wang, G.C.; Yuan, X.H.; Wang, Q.; Sridhar, S. Complex precipitates of TiN-MCx in GCr15 bearing steel. Metals 2019, 9, 641. [Google Scholar] [CrossRef] [Green Version]
  17. Zhang, Y.; Wang, X.; Yang, S.; Chen, W.; Hou, H. The Morphology and solute segregation of dendrite growth in Ti-4.5% Al alloy: A phase-field study. Materials 2021, 14, 7257. [Google Scholar] [CrossRef]
  18. Mianroodi, J.R.; Shanthraj, P.; Svendsen, B.; Raabe, D. Phase-field modeling of chemoelastic binodal/spinodal relations and solute segregation to defects in binary alloys. Materials 2021, 14, 1787. [Google Scholar] [CrossRef]
  19. Guan, J.; Pu, Z.-P.; Zhao, S.-C.; Liu, D.-R. Three-dimensional modeling of segregation behavior during solidification of a Sn-6 wt.% Pb alloy. Materials 2022, 15, 1298. [Google Scholar] [CrossRef]
  20. Wang, K.L.; Yang, W.K.; Shi, X.C.; Hua, H.; Zhao, Y.H. Phase-field-method-studied mechanism of Cu-rich phase precipitation in AlxCuMnNiFe high-entropy alloy. Acta Phys. Sin. 2023, 72, 076102. [Google Scholar] [CrossRef]
  21. Kurz, W.; Rappaz, M.; Trivedi, R. Progress in modelling solidification microstructures in metals and alloys. Part II: Dendrites from 2001 to 2018. Int. Mater. Rev. 2021, 66, 30–76. [Google Scholar] [CrossRef]
  22. Kim, S.G.; Kim, W.T.; Suzuki, T.; Ode, M. Phase-field modeling of eutectic solidification. J. Cryst. Growth 2004, 261, 135–158. [Google Scholar]
  23. Eiken, J.; Böttger, B.; Steinbach, I. Multiphase-field approach for multicomponent alloys with extrapolation scheme for numerical application. Phys. Rev. E 2006, 73, 066122. [Google Scholar] [CrossRef] [PubMed]
  24. Steinbach, I. Phase-field models in materials science. Model. Simul. Mater. Sci. Eng. 2009, 17, 073001. [Google Scholar] [CrossRef]
  25. Fattebert, J.-L.; DeWitt, S.; Perron, A.; Turner, J. Thermo4PFM: Facilitating phase-field simulations of alloys with thermodynamic driving forces. Comput. Phys. Commun. 2023, 288, 108739. [Google Scholar] [CrossRef]
  26. Chen, Y.; Bogno, A.A.; Xiao, N.M.; Billia, B.; Kang, X.H.; Nguyen-Thi, H.; Luo, X.H.; Li, D.Z. Quantitatively comparing phase-field modeling with direct real time observation by synchrotron X-ray radiography of the initial transient during directional solidification of an Al-Cu alloy. Acta Mater. 2012, 60, 199–207. [Google Scholar] [CrossRef]
  27. Chen, Y.; Billia, B.; Li, D.Z.; Nguyen-Thi, H.; Xiao, N.M.; Bogno, A.A. Tip-splitting instability and transition to seaweed growth during alloy solidification in anisotropically preferred growth direction. Acta Mater. 2014, 66, 219–231. [Google Scholar] [CrossRef]
  28. Gong, T.Z.; Chen, Y.; Cao, Y.F.; Kang, X.H.; Li, D.Z. Fast simulations of a large number of crystals growth in centimeter-scale during alloy solidification via nonlinearly preconditioned quantitative phase-field formula. Comput. Mater. Sci. 2018, 147, 338–352. [Google Scholar] [CrossRef]
  29. Yamanaka, A.; Aoki, T.; Ogawa, S.; Takaki, T. GPU-accelerated phase-field simulation of dendritic solidification in a binary alloy. J. Cryst. Growth 2011, 318, 40–45. [Google Scholar] [CrossRef]
  30. Yang, C.; Xu, Q.Y.; Liu, B.C. GPU-accelerated three-dimensional phase-field simulation of dendrite growth in a nickel-based superalloy. Comput. Mater. Sci. 2017, 136, 133–143. [Google Scholar] [CrossRef]
  31. Clarke, A.J.; Tourret, D.; Song, Y.; Imhoff, S.D.; Gibbs, P.J.; Gibbs, J.W.; Fezzaa, K.; Karma, A. Microstructure selection in thin-sample directional solidification of an Al-Cu alloy: In situ X-ray imaging and phase-field simulations. Acta Mater. 2017, 129, 203–216. [Google Scholar] [CrossRef] [Green Version]
  32. Gong, T.Z.; Chen, Y.; Li, S.S.; Cao, Y.F.; Hou, L.Y.; Li, D.Z.; Chen, X.Q.; Reinhart, G.; Nguyen, H. Equiaxed dendritic growth in nearly isothermal conditions: A study combining in situ and real-time experiment with large-scale phase-field simulation. Mater. Today Commun. 2021, 28, 102467. [Google Scholar] [CrossRef]
  33. Gong, T.Z.; Chen, Y.; Chen, X.-Q.; Li, D.Z.; Reinhart, G.; Nguyen, H.; Debierre, J.-M. Scaling law for growth of misoriented equiaxed Al-Cu dendrites: A phase-field study with in situ experiment validation. Comput. Mater. Sci. 2023, 226, 112238. [Google Scholar] [CrossRef]
  34. Kim, S.G. A phase-field model with antitrapping current for multicomponent alloys with arbitrary thermodynamic properties. Acta Mater. 2007, 55, 4391–4399. [Google Scholar] [CrossRef]
  35. Böttger, B.; Apel, M.; Santillana, B.; Eskin, D.G. Relationship between solidification microstructure and hot cracking susceptibility for continuous casting of low-carbon and high-strength low-alloyed steels: A phase-field Study. Metall. Mater. Trans. A 2013, 44, 3765–3777. [Google Scholar] [CrossRef] [Green Version]
  36. Gustafson, P. A thermodynamic evaluation of the Fe-C system. Scand. J. Metall. 1985, 14, 259–267. [Google Scholar] [CrossRef]
  37. Dinsdale, A.T. SGTE data for pure elements. Calphad 1991, 15, 317–425. [Google Scholar] [CrossRef]
  38. Gong, T.; Chen, Y.; Li, S.; Cao, Y.; Li, D.; Chen, X.-Q.; Reinhart, G.; Nguyen-Thi, H. Revisiting dynamics and models of microsegregation during polycrystalline solidification of binary alloy. J. Mater. Sci. Technol. 2021, 74, 155–167. [Google Scholar] [CrossRef]
Figure 1. Segregation during the solidification of primary austenite in Fe-1.0 wt.% C alloy at different diffusivities of C in solid. (a1a3) Solute concentration at late solidification at the undercooling ∆T = 300 K. (b1b4) The phase fraction of primary austenite, maximum solute concentration in liquid, solute profile along the diagonal of the computational domain (as the yellow dashed line in (a1)), and the segregation ratio, respectively.
Metals 13 01148 g001
Figure 2. Relationship of (a) the phase fraction of primary austenite when the solute concentration in liquid increases to the eutectic concentration and (b) the maximum segregation ratio with different diffusivity of C in solid and liquid. The black dots are results of the phase-field simulations, and the red lines are fitting lines.
Metals 13 01148 g002
Figure 3. Segregation during the solidification of primary austenite in Fe-1.0 wt.% C alloy at different grain sizes of primary austenite. (a1a3) Solute concentration at late solidification at the undercooling ∆T = 300 K. (b1b4) The phase fraction of primary austenite, maximum solute concentration in liquid, solute profile along the diagonal of the computational domain, and the segregation ratio, respectively.
Metals 13 01148 g003
Figure 4. Relationship of (a) the phase fraction of primary austenite when the solute concentration in liquid increases to the eutectic concentration and (b) the maximum segregation ratio with different grain sizes of primary austenite. The black dots are results of the phase-field simulations, and the red lines are fitting lines.
Metals 13 01148 g004
Figure 5. Segregation during the solidification of primary austenite in the Fe-1.0 wt.% C alloy at different cooling rates. (a1a3) Solute concentration at late solidification at the undercooling ∆T = 300 K. (b1b4) The phase fraction of primary austenite, maximum solute concentration in liquid, solute profile along the diagonal of the computational domain, and the segregation ratio, respectively.
Metals 13 01148 g005
Figure 6. Relationship of (a) the phase fraction of primary austenite when the solute concentration in liquid increases to the eutectic concentration and (b) the maximum segregation ratio with the cooling rate. The black dots are results of the phase-field simulations, and the red lines are fitting lines.
Metals 13 01148 g006
Table 1. Parameters used in the phase-field simulations.
ParameterMeaningValue
DLDiffusivity of C in liquid1 × 10−8~4 × 10⁻⁸ m2/s
DSDiffusivity of C in solid1 × 10−9~4 × 10⁻⁹ m2/s
μL/γInterface mobility1 × 10−10 m4/(J∙s)
σL/γInterface energy0.06 J/m2
δμKinetic anisotropy coefficient0.05
δσStatic anisotropy coefficient0.05
VmMolar volume6.7 × 10−6 m3/mol
ηInterface width1.0 μm
xGrid resolution0.25η
tTime step0.8∆x2/(4DL)
Table 2. Evaluated thermodynamic parameters for the Fe–C binary system [36].
PhaseThermodynamic Parameters
Liquid
(C, Fe)1
L C , Fe L 0 = 124,320 + 28.5 T
L C , Fe L 1 = 19,300
L C , Fe L 2 = 49,260 19 T
Austenite
(Fe)1(C, Va)1
L Fe : C , Va γ 0 = 34,671
G Fe : C γ ° = 77,207 15.877 T + G Fe γ ° + G C gra °
G Fe : Va γ ° = G Fe γ °
Disclaimer/Publisher’s Note: The statements, opinions and data contained in all publications are solely those of the individual author(s) and contributor(s) and not of MDPI and/or the editor(s). MDPI and/or the editor(s) disclaim responsibility for any injury to people or property resulting from any ideas, methods, instructions or products referred to in the content.

