Article

Micro-Deformation and Fracture Features of Ti834 Titanium Alloy under Fatigue Loading

1
School of Materials Science and Engineering, Northeastern University, Shenyang 110819, China
2
Northwest Institute for Nonferrous Metal Research, Xi’an 710016, China
*
Author to whom correspondence should be addressed.
Metals 2023, 13(7), 1149; https://doi.org/10.3390/met13071149
Submission received: 8 March 2023 / Revised: 28 May 2023 / Accepted: 6 June 2023 / Published: 21 June 2023
(This article belongs to the Special Issue Fatigue Behavior and Crack Mechanism of Metals and Alloys)

Abstract

:
A sustained load holding period imposed during fatigue loading is detrimental to material performances, causing a sharp decline in the fatigue life of near-α titanium alloys. Therefore, the deformation discrepancies of dwell fatigue (DF) and low cycle fatigue (LCF) were studied for Ti834 titanium alloy with bimodal structures in this work. The fractographies after dwell fatigue and low cycle fatigue testing were characterized using scanning electron microcopy (SEM), and the crack propagation paths at the subsurface were investigated using an optical microscope (OM). In order to reveal the mechanism of fatigue damage, detailed dislocation structures were observed using transmission electron microcopy (TEM). The crack propagation paths in microscales and the dislocation distributions were observed in the LCF and DF. The reasons for the discrepancies are also discussed in this work, which effectively enhances the understanding of the dwell failure procedures. The results show that the near basal cracks are formed under dwell fatigue, and the deformation is highly localized at the boundary of αp grains under dwell fatigue. In contrast, during low cycle fatigue, the sample tends to deform homogenously. An intergranular fracture along the primary αp grains is formed due to the localized deformation during dwell fatigue. However, a transgranular fracture is formed in the primary αp grains under low cycle fatigue.

1. Introduction

Near-α titanium alloys are widely used as blades and disks for high-temperature compressor components as they possess high strength-to-weight ratios and excellent thermal strength and fatigue properties. Such components undergo complex loading during their applications, and the fatigue property is a significant indicator for evaluating the life of the components.
Furthermore, aircrafts that are in service undertake three main processes: take-off, cruising, and landing [1,2,3], leading the alloys that are in service exhibit a substantial decline in fatigue life, which is regarded as the dwell fatigue effect.
The early explanations of dwell fatigue effect are mainly based on the hypothesis of the dislocation pile-ups model proposed by Stroh [1]. The dislocation pile-ups under tensile stress in the favorably oriented grains generate stress concentrations at the boundary. This generates shear stress in the “strong” grain and instigates the formation of a slip band, which results in a basal crack. However, this hypothesis does not investigate the crystallographic orientation relationships and detailed dislocation nonconformities of a pair of soft/hard grains induced by the facets. In recent years, the dwell fatigue effect of Ti624x (x = 2, 4, 6) titanium alloy was studied by Qiu [3], who showed that the dwell fatigue effect significantly decreases with the increase in Mo, as the condition of texture formation is created by the lower Mo content. Furthermore, the crystallographic orientation combination, which consists of a hard orientation region surrounded by the regions that are favorably oriented for a prismatic slip, creates a condition for the appearance of dwell cracks. This combination is also argued to be important to the nucleation of facets because of the high stress that is generated at the boundaries of the hard/soft grains [4].
In previous works, further research on the types and distributions of dislocations in soft grains and hard grains has also been conducted [5,6,7]. S. Joseph found [6,8] that the intense stress concentration developed at the boundary of the soft grains due to single dislocation pile-ups. Then, the super-jogs formed by a cross-slip of <c + a> dislocations instigated the source; then, the dislocations multiplied, creating the formation of facets. X. Wang suggested [9] that the site of crack initiation preferentially occurred at the slip band and at the dislocation net in αp during dwell fatigue. Hasijia [10] was the first to introduce the concepts of load shedding in titanium alloy research, and he utilized the crystallographic plasticity model to explain that the slip occurring in the soft grain would lead the load shedding into a hard grain. A similar work on the plasticity model was also investigated by Zheng [11]. In addition, the fracture features at the crack initiation site for cold dwell fatigue were associated with the cracking of basal facets [5,12,13]. The c-axis of an HCP crystal was nearly perpendicular to the facets, which varied by up to 15° with respect to the primary loading direction. The occurring of basal facets resulted from the high basal stress in the hard grains [14]. Moreover, the high rate of sensitivity in titanium alloy for room temperature dwell fatigue was also responsible for the load shedding and high basal stress, which was argued to be crucial for the facets [15]. Anahid [16] also observed facet nucleation in Ti6242; the crack initiation site occurred at the interface of α/β under dwell fatigue for the α + β alloy.
In general, there are intense relationships between the micro-deformation and the propagation of cracks under dwell fatigue; however, the integrated relationships between them are rarely reported. Thus, the objective of this work is to study the micro-deformation, fractographies, and crack propagation present in Ti834 alloy failure samples to understand the micro failure process during dwell fatigue.

2. Experimental Section

A Ti834 titanium alloy plate with a thickness of 30 mm was used in our present study. The test specimens were cut from a uniaxial direction in the rolled plate, and the obtained specimens are parallel with respect to the rolling direction. The chemical composition (wt.%) of the alloy is shown in Table 1. Prior to testing, the Ti834 titanium alloy samples were annealed at a temperature of 1020 °C for 2 h, air cooled, annealed at 700 °C for another 2 h, then air cooled.
Cylindrical tensile specimens with a diameter of 5 mm and gauge length of 35 mm were machined, as shown in Figure 1a. The tensile tests were carried out on an Instron 5859 machine, and both specimens were tested under the same conditions. Cylindrical fatigue specimens with a diameter of 5 mm and gauge length 15 mm were machined according to the shape and dimension shown in Figure 1b. All of the fatigue tests were carried out on an MTS810 machine with a loading control mode, and three specimens were tested for low cycle fatigue and dwell fatigue, respectively. The in situ tensile specimen, which had a thickness of 0.5 mm and gauge length of 6 mm, is shown in Figure 1c.
A continuous triangular wave with a stress ratio of R = 0.1 and peak stress of 960 MPa, together with a ramp-up and down time of 1 s, was used for the specimens of low cycle fatigue. The applied peak stress of 960 MPa was based on it being 90% of the ultimate tensile stress. A continuous trapezoid wave with the same stress ratio of R = 0.1 and peak stress of 960 MPa was used for the specimens of dwell fatigue. The dwell time at peak stress was set to be 120 s, and the ramp-up and down time was 1 s. The loading waveform of low cycle fatigue and dwell fatigue is schematically shown in Figure 2.
The in situ tensile testing was completed on a thermal field emission Zeiss Gemini500 scanning electron microscope (SEM). The microstructures were acquired using the SEM technique at a controlled displacement of 0.15 mm and 0.2 mm. The crystalline orientation before testing was measured using electron backscatter diffraction (EBSD) using a Zeiss Gemini500 machine. The fracture surface was examined using the scanning electron microscope (SEM) component of the GSM-6700 machine. The crystalline orientation around the secondary cracks was measured using the EBSD analysis. Failure samples were cut along the axial direction from the crack initiation site for the investigation of orientations. Furthermore, an optical microscopy (OM) examination on secondary cracks was performed at the location of crack propagation, as schematically shown in Figure 3. In this figure, the rough fracture surfaces were primarily removed; subsequently, the residue surfaces were observed by the OM procedure.
The foils for TEM observation were prepared in the vicinity of the fracture surface. The foils were first mechanically thinned down to about 0.05 mm. Finally, a twin-jet polishing method was carried out at a voltage of 40–45 V and current of 30 mA in the electrolyte containing perchloric acid (25 mL), n-butanol (175 mL), and methanol (300 mL). The dislocation structures were finally examined using a JEM-200 CX TEM microscope.

3. Result and Discussion

3.1. Initial Microstructures of the Alloy

Figure 4 shows the microstructures of the Ti834 titanium alloy plates for the initial plates and the as-duplex annealed samples, respectively. Both microstructures are composed of a primary equiaxed αp phase embedded in the transformed β matrix (Figure 4a). When compared with the initial microstructure, the size and quantity of the αp grains in the annealed samples have increased due to the recrystallization. Meanwhile, the secondary αs platelets have the tendency to be straighter (Figure 4b). These can be attributed to the release of stored energy [17,18]. During this processing, a sufficient time allows for the growth of the α phase. Thus, the thickness and length of αs phase increase. In the same way, the proportion and size of αp grains are significantly increased.
The inverse pole figure (IPF) plotted on the base of the EBSD data is shown in Figure 4c, which can be used to examine the crystalline orientation of samples before fatigue testing. The pole figure (PF) shown in Figure 4b demonstrates a weak T texture in the fatigue samples. The final T texture comes from initial texture when rolling in the α + β two-phase regions [19,20,21]. The formation of texture on the plates during the hot rolling is closely related to the activated slip system. The N texture results from the basal slip of {0001} [11,12,13,14,15,16,17,18,19,20], and the T texture results from the prismatic slip of {10–10} [11,12,13,14,15,16,17,18,19,20]. The basal slip is suppressed during the hot rolling process, and the prismatic slip is activated, which leads to the formation of the T texture. The details on the types and formation of textures in titanium alloy have been investigated by Li et al. [19,21].

3.2. Tensile Properties of the Alloy

The uniaxial tensile properties of Ti834 titanium alloy are shown in Table 2. The engineering stress–strain curve is plotted in Figure 5a. The Ti834 titanium alloy exhibits an excellent combination of yield strength (976 MPa), ultimate tensile strength (1076 MPa), and elongation (13%). Figure 5b shows the fracture morphologies of the failure tensile sample. Numerous cleavage facets surrounded by tearing edges are observed on the fracture surface, which is a typical quasi-cleavage fracture mode [22,23].
The in situ tensile testing was performed to reveal the detailed deformation processes of Ti834 titanium alloy. Figure 6 shows the load–displacement curve during the in situ tensile testing. For the SEM observation of the microstructure evolution, the tensile test was interrupted at the controlling displacement of 0.15 mm and 0.2 mm.
Figure 7 shows the in situ SEM observation on the polished surface of the tensile specimen before deformation and under the controlled displacement of 0.2 mm. The initial microstructure before tensile testing was captured for comparison with the 0.2 mm displacement, as shown in Figure 7a. The microstructure at the displacement of 0.2 mm is presented in Figure 7b. It can be seen from the figure that the parallel slip lines firstly occur in the αp grain and then traverse into the αps interface, finally extending into the αs phase region (Figure 7a,b).
The KAM maps before deformation and at the displacement of 0.2 mm are depicted in the studied region (as shown in Figure 7c,d), wherein the local misorientation and degree of strain energy can be clearly represented [24]. The result shows that the stress is mainly concentrated in the vicinity of the grain boundaries and that the stress is enhanced with the increase in displacement. As a particularly important phase in the near-α titanium alloy, the primary αp phase is considered to be a soft phase. The soft αp phase easily yields in the early stage of plasticity deformation, and the deformation is stopped by the obstacles of αp grain boundaries, which leads to the stress concentration. Similar results were obtained by other scholars [25,26,27].

3.3. Fatigue Properties of the Alloy

Figure 8 shows the plastic deformation distance as a function of the loading cycle for the dwell fatigue and low cycle fatigue tests; the tested results are shown in Table 3. It can be seen that the final failure cycles of the dwell fatigue samples are lower than that of the low cycle fatigue samples. The accumulation of plastic distance is positively related with cycles for the two failure samples, but the plastic distance accumulation rate of the dwell fatigue samples is significantly higher than the low cycle fatigue samples. The ultimate accumulation distances of the low cycle fatigue and dwell fatigue samples reach 0.33 mm and 0.59 mm, respectively. According to a reference reported by Sun et al. [28], the high accumulation of plastic distance during the dwell fatigue is responsible for the decrease in dwell cycles.

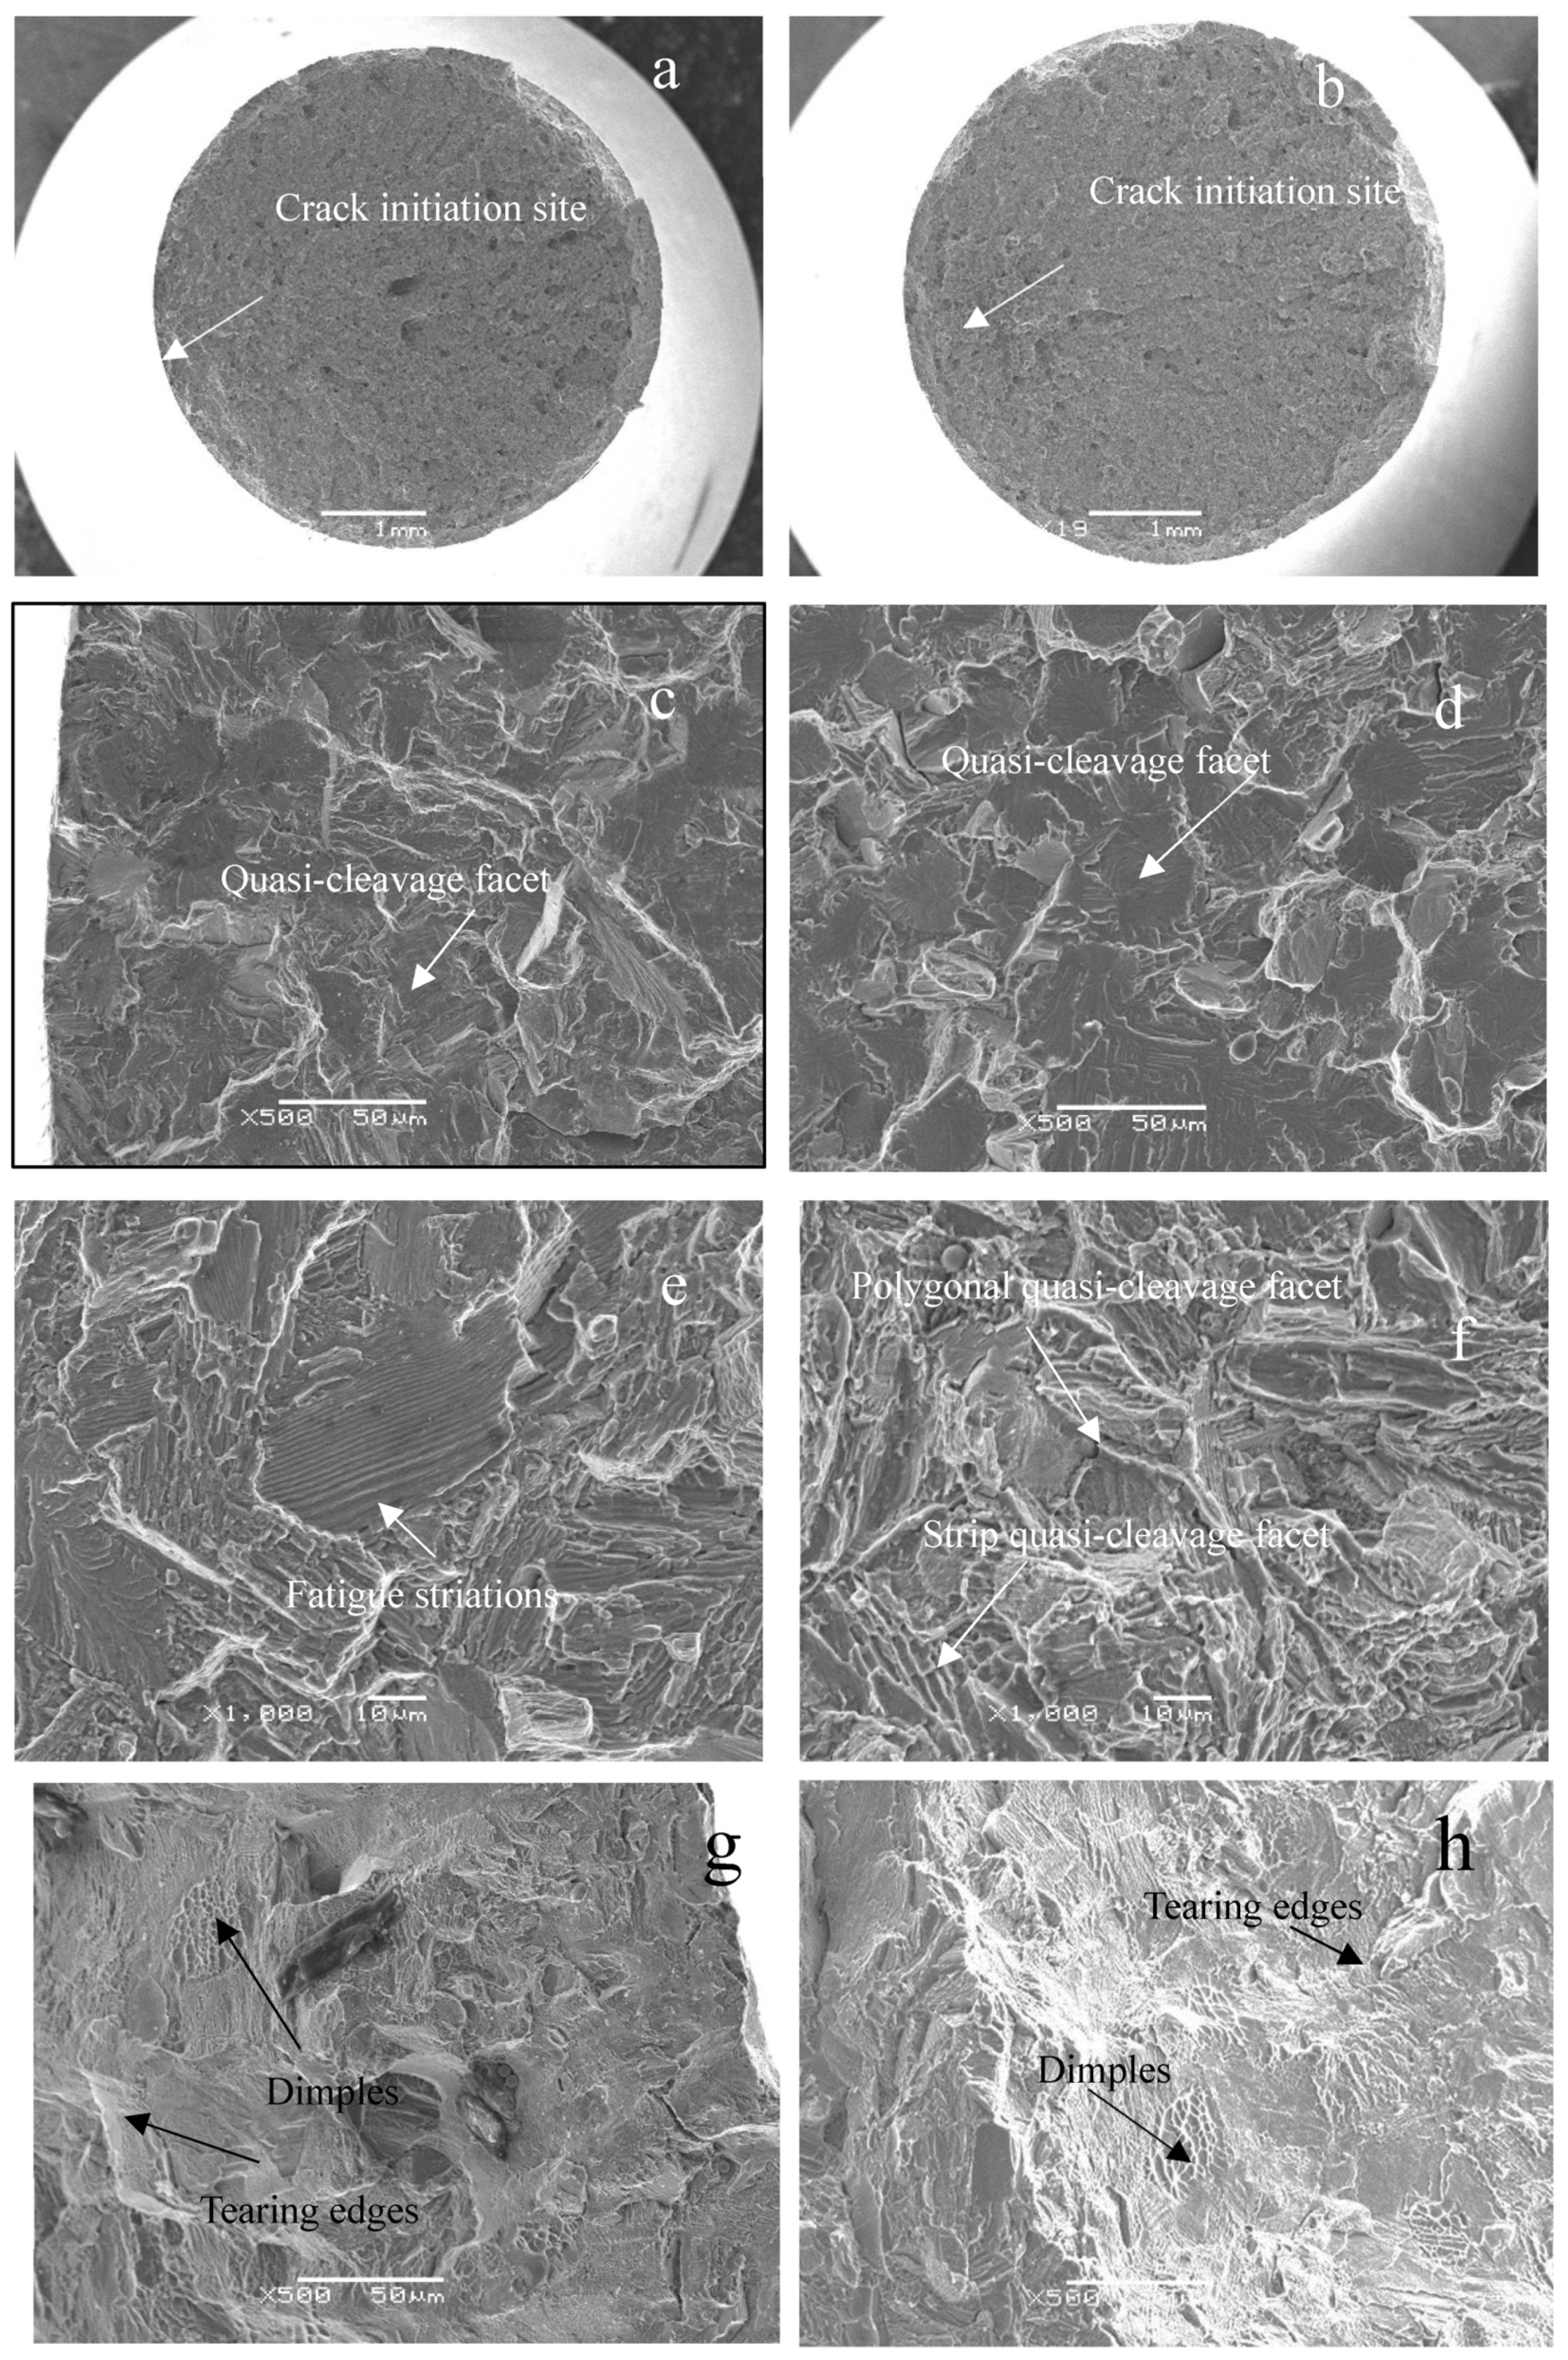
3.4. Fracture Surface

According to previous studies conducted by some scholars [1,3,8,9], the initiation and propagation modes of the low cycle fatigue and dwell fatigue cracks are different. Therefore, in order to understand the differences, the low cycle fatigue and dwell fatigue tests were performed at a peak stress of 960 MPa, respectively. The fractographies of the fatigue specimens are shown in Figure 9. The crack initiation region, propagation region, and final fracture region were separately studied so as to analyze the propagation process of the cracks.
Figure 9a exhibits the macro-fracture surface of the low cycle fatigue failure specimens. It can be seen from the figure that the spreading lines converge on the surface of the sample, which suggests that the crack initiation site is located at the sample surface. Meanwhile, the spreading lines converge on the subsurface in the dwell fatigue sample (Figure 9b), suggesting that the crack initiation site lies at the subsurface. The difference in crack initiation site is attributed to the loading process. The Stroh dislocation pile-up hypothesis [1] points out that the stress re-distribution between soft and hard grains appears under dwell fatigue, and the condition of stress re-distribution is created by a vacuum region at the subsurface. In contrast, the stress re-distribution effect is reduced under low cycle fatigue, so the initiation site is prone to lie at the surface of the fatigue sample. In addition, a large number of fatigue failure analyses have shown that most fatigue failures originate from the surface of the specimen [29,30]. In our present work, the loading method of the low cycle fatigue is a triangular wave and the whole experimental process is a typical fatigue failure process, so it is easier for cracks to form on the surface of the specimen. However, due to the introduction of the holding peak stress, the dwell fatigue failure is a typical mixed failure mode, which is the fatigue failure plus the static failure, resulting in cracks that are more likely to form on the subsurface of the specimen.
Figure 9c exhibits the micro-morphologies of the crack initiation region for the low cycle failure specimens. A few quasi-cleavage facets surrounded by tearing edges from plastic deformation are generated. Similar facets are observed at the crack initiation region under the dwell fatigue (Figure 9d). When compared with the crack initiation region of the low cycle fatigue, more numerous and clearer facets can be seen. The differential facets can be attributed to the stress re-distribution effect between the soft and hard grains during the dwell fatigue. A strong stress concentration is generated at the vicinity of soft/hard grain boundaries due to the stress re-distribution effect. This effect would cause a strong basal stress in a hard grain [4], which would lead to the formation of near-normal facets. This peculiar orientation of facets results in more obvious and clearer morphologies. Many other researchers have observed similar feature facets under the dwell fatigue scenario [1,5,12,13].
The crack propagation region of the low cycle fatigue failed samples is shown in Figure 9e. It can be seen from the figure that numerous parallel fatigue striations are generated on the facet, and each striation corresponds to an incremental part of crack growth during a single stress cycle [18]. The crack propagation region of dwell fatigue failure samples is shown in Figure 9f. The polygonal and strip quasi-cleavage facets surrounded by a few tearing edges are the main morphological features in the dwell crack propagation region for the dwell fatigue. The differences in loading modes are responsible for the fracture morphologies in the crack propagation region. The samples of low cycle fatigue are controlled by the fatigue failure process due to the triangular wave, which corresponds to the typical fatigue striations. However, this process is converted to mixed fatigue and static loading failure due to the trapezoidal wave. Therefore, the static features are significantly obvious for the dwell fatigue fracture surface. The typical morphological features have also been observed by other researchers in some static tests for near-α titanium alloys [5,12]. The final fracture regions of the low cycle fatigue and dwell fatigue samples are exhibited in Figure 9g,h, respectively. Numerous dimples and tearing edges can be observed on the fracture surface.

3.5. Secondary Cracks in the Fatigue Specimens

The fracture morphologies of the crack initiation region for the low cycle fatigue and dwell fatigue failure samples have been discussed in Section 3.4. Furthermore, in order to understand the crystal orientations in the initiation region, IPF maps and angles between the primary loading direction and the c-axis around the cracks will be discussed in this section.
Figure 10a exhibits the crack path in the crack initiation region for the low cycle fatigue failure sample. It can be seen from the figure that the angle between the primary loading direction and crack path is close to 40°. The path for the dwell fatigue crack is shown in Figure 10b. As it can be seen, the angles reach 60° or 70°, respectively. Compared with the angles for both the low cycle fatigue and dwell fatigue cracks, it is found that the angle for the dwell fatigue crack is higher than that of the low cycle fatigue.
The crystal orientations around the crack path for the low cycle fatigue as constructed by the IPF maps are shown in Figure 10c. The corresponding angles between the primary loading direction and c-axis are schematically shown in Table 4. The angle from location 1 to 5 is around 45°, suggesting that the low cycle fatigue crack is prone to propagate along the direction of the maximum critical resolved shear stress (CRSS). Moreover, the orientations for the dwell fatigue are shown in Figure 10d. The corresponding angles are also schematically shown in Table 4. The angles for location 1, 2, 5, and 6 are also 45°, indicating the feature of soft orientation. Meanwhile, the angles in location 3 and 4 reach 9.5° and 22°, respectively, which is a feature of a typical hard orientation. The re-distribution of stress appears between the hard orientation and soft orientation grains during dwell fatigue. This can cause a strong stress concentration in the vicinity of the soft/hard grain boundaries [4,5,6,12]. After that, high basal stress forms in the hard grain, which results in the formation of a facet [14].
In order to understand the propagation modes of the low cycle fatigue and dwell fatigue cracks in the microstructures, secondary cracks at the subsurface of the fatigue sample were investigated in our present study. Figure 11a shows the secondary cracks in the primary αp for the low cycle failure sample. Typical transgranular fracture modes can be seen for the crack propagation in the primary αp. The secondary cracks for the dwell failure sample in the primary αp grain are shown in Figure 11b. The crack with the feature of intergranular fracture mode is prone to propagating along the interface of αps, as is shown by the arrow A [30,31]. The stress concentration is prone to be generated at the boundary of αp for the dwell fatigue sample, resulting in the intergranular fracture. The detailed stress distributions in the low cycle fatigue and dwell fatigue samples will be discussed in the next section. The secondary cracks in the αs phase region are shown in Figure 11c,d, and the region marked by the dotted line is the ungrounded region. The transgranular fracture can be seen in the coarse αs platelets region.

3.6. Dislocation Structures in the Fatigue Specimens

The crack propagation paths in the primary αp and secondary αs phase were investigated in the previous work. Furthermore, in order to reveal a mechanism of fatigue failure, the dislocation distributions will be discussed in this section. Figure 12 shows the detailed micro-morphologies in the vicinity of the fracture surface for the failure samples of low cycle and dwell fatigue. Numerous sub-grains are formed in the primary αp for the low cycle fatigue samples, as shown in Figure 12a. Obvious dislocation tangles and pile-ups are generated at the boundaries of the sub-grains. A crack propagates along the boundary of the sub-grain, suggesting that the movement of dislocations is blocked by the boundary; then, the stress concentration is enhanced by these dislocations along the sub-grain boundaries [4,8]. Finally, the stress concentration leads to the formation of a crack along the boundary. Figure 12b shows the discrete dislocations in the primary αp phase. The appearance of sub-grains and discrete dislocations suggests that the αp phase, under the process of low cycle fatigue, is prone to deform homogeneously [5]. Figure 12c,d show the morphological features at the boundary of the αp phase under low cycle fatigue. Few dislocations are generated at the boundary of the αp grain.
Figure 12e shows the micro-morphologies at the boundary of the αp grain in the dwell fatigue failure sample, and Figure 12f complements Figure 12e. Numerous dislocation tangles and pile-ups are generated at the at the boundary of the αp phase, suggesting that the stress concentration is formed at this location [8]. The cracks can then easily propagate along the boundary due to the stress concentration (Figure 11b). Compared with the failure samples of low cycle fatigue, the deformation for the dwell fatigue samples is highly localized at the boundary of the αp grain. Moreover, the localization enhances the deformation discrepancy of the boundary and inner portion of the αp grain, leading to the propagation of cracks along the boundary of the αp grain.
Localized deformation during dwell fatigue has also been proposed by some scholars [32,33], which is considered to be closely associated with the introduction of creep. Therefore, creep will also be discussed in the present study. Figure 12g shows the micro-morphologies in the primary αp grain for the failure sample of creep under 960 MPa. Obvious dislocation tangles can be seen at the boundary of the primary αp grain. Compared with the boundary, the dislocation tangles in the primary αp phase significantly decrease (Figure 12g,h), suggesting that localized creep deformation occurs at the boundary of the αp grain, which is similar to dwell fatigue. The micro-mechanism of creep for Ti6242 alloy was investigated by Gerland [16], who showed that the cavities at the grain boundary are closely related to the localized slip. Moreover, the dwell fatigue failure mechanism was also studied by Sun [28], who suggested that the dwell fatigue samples easily deform at some localized sites.
As mentioned above, low cycle fatigue samples are prone to deform homogenously, which is characterized by the sub-grains in the primary αp grain. In contrast, localized deformation is generated at the grain boundary of the primary αp phase for the dwell fatigue samples, which is characterized by the dislocation tangles and pile-ups at the αp grain boundary.
Figure 13 shows the dislocation morphologies in the secondary αs phase. Figure 13a,b show the morphologies for the low cycle fatigue sample. Generated dislocation tangles can be seen at the boundary of αs platelets, and an obvious dislocation array also appears in the αs platelets. Two adjacent platelets can link with each other in this array.
Figure 13c,d show the dislocation distributions in the secondary αs grain for the dwell fatigue sample, showing many dislocation tangles in the αs platelets along with a few long straight dislocation lines in the αs platelets. Compared with the dislocation morphologies under the low cycle fatigue condition, the density and number of dislocations significantly increase for the dwell fatigue sample.
The dislocation morphology and distribution for the creep failure sample are shown in Figure 13e,f. Numerous dislocation tangles and isolated long straight dislocation lines can be observed in the secondary phase. We observe that the dislocation distributions are similar to the dwell fatigue, suggesting that the process of dwell fatigue is closely linked to the creep deformation. The introduction of creep for the dwell fatigue sample in the peak stress can cause more activated slip systems [16,32,33]. Thus, the densities of dislocations in the secondary platelets are higher than those present in the low cycle fatigue sample.
The diagram for the dislocation distributions and crack propagation modes under the low cycle fatigue and dwell fatigue is schematically shown in Figure 14. The sub-grains are generated under the low cycle fatigue due to the homogeneous deformation. Then, the stress concentration that is later formed in the vicinity of the sub-grain boundary causes the crack to propagate along the boundary. The sub-grain formed inside the primary αp grain has a significant effect on the crack propagation. Due to the obvious crystal defects near the sub-grain boundary, a higher energy can be generated [9,34], resulting in the sub-grain boundary becoming the preferred path of crack propagation. In addition, the formation of the sub-grain can increase the dislocation densities inside the grain, resulting in a more obvious plastic deformation of the sub-grain boundary and accelerating the formation of cracks. In contrast, the localized deformation during the dwell fatigue process causes the crack to propagate along the αps interface.

4. Conclusions

The micro-deformation procedures for the LCF and DF procedures have obvious discrepancies. The relationships between the crack propagation modes and dislocation distributions for both the LCF samples and DF samples were discussed in this work, and the fracture surfaces were also investigated. The discrepancies of dislocation distribution are introduced to explain the crack propagation model under low cycle fatigue and dwell fatigue. Main conclusions can be drawn as follows:
(1)
The crack initiation site of the low cycle fatigue and dwell fatigue samples are located at the sample surface and subsurface, respectively;
(2)
The low cycle fatigue is a typical fatigue failure mode, whereas the dwell fatigue process is a mixed failure that is associated with the static and fatigue modes. The morphologies are clear, with the high numbers of the quasi-cleavage facets under dwell fatigue resulting from the dwell crack that propagates along the near basal plane;
(3)
Homogeneous deformation is generated in the low cycle fatigue sample, and a localized deformation is generated during dwell fatigue. The primary αp phase is characterized by numerous sub-grains under the low cycle fatigue scenario. Dislocation movement that is blocked by the sub-grain boundaries results in the crack propagating along the boundary. The dislocation tangles and pile-ups are formed at the boundary of the primary αp phase under the dwell fatigue scenario, where the strong stress concentration is generated. Thus, the crack easily propagates along the αps interface.

Author Contributions

N.W.: literature search, study design, figures, data collection, data analysis, and writing; W.J.: study design, literature search figures, data analysis, writing, and funding; X.M.: study design and funding; W.Z.: study design and data collection; C.M.: study design and data collection. All authors have read and agreed to the published version of the manuscript.

Funding

This research was funded by the Xi’an Science and Technology Bureau Program of Shaanxi Province (2020YZ0002).

Institutional Review Board Statement

Not applicable.

Informed Consent Statement

Not applicable.

Data Availability Statement

Not applicable.

Conflicts of Interest

The authors declare no conflict of interest.

References

  1. Bache, M. A review of dwell sensitive fatigue in titanium alloys: The role of microstructure, texture and operating conditions. Int. J. Fatigue 2003, 25, 1079–1087. [Google Scholar] [CrossRef]
  2. Lee, D.H.; Nam, W. High temperature fatigue behavior in tensile hold LCF of near-alpha Ti-1100 with lamellar structure. J. Mater. Sci. 1999, 34, 2843–2849. [Google Scholar] [CrossRef]
  3. Qiu, J.; Xin, F.; Ma, Y.; Lei, J.; Huang, A.; Rugg, D.; Yang, R. Fatigue crack growth behavior of beta-annealed Ti–6Al–2Sn–4Zr–xMo (x = 2, 4 and 6) alloys: Influence of microstructure and stress ratio. Int. J. Fatigue 2016, 83, 6075–6087. [Google Scholar] [CrossRef] [Green Version]
  4. Dunne, F.; Rugg, D.; Walker, A. Lengthscale-dependent, elastically anisotropic, physically-based hcp crystal plasticity: Application to cold-dwell fatigue in Ti alloys. Int. J. Plast. 2007, 23, 1061–1083. [Google Scholar] [CrossRef]
  5. Joseph, S.; Lindley, T.; Dye, D. Dislocation interactions and crack nucleation in a fatigued near-alpha titanium alloy. Int. J. Plast. 2018, 110, 38–56. [Google Scholar] [CrossRef]
  6. Joseph, S.; Joseph, K.; Lindley, T.; Dye, D. The role of dwell hold on the dislocation mechanisms of fatigue in a near alpha titanium alloy. Int. J. Plast. 2020, 131, 102743. [Google Scholar] [CrossRef]
  7. Singh, N.; Gouthama; Singh, V. Low cycle fatigue behavior of Ti alloy IMI 834 at room temperature. Mater. Sci. Eng. A 2002, 325, 324–332. [Google Scholar] [CrossRef]
  8. Josepha, S.; Josephb, K.; Lindleya, T.C.; Dyea, D. On the dislocation mechanisms leading to cracking in dwell fatigue of a near-alpha titanium alloy. arXiv 2019, arXiv:1905.11714v1. [Google Scholar]
  9. Wang, X.; Vo, P.; Jahazi, M.; Yue, S. Dwell Fatigue Microstructure in a near-α titanium alloy. Metall. Mater. Trans. A 2007, 38, 831–839. [Google Scholar] [CrossRef]
  10. Hasija, V.; Ghosh, S.; Mills, M.J.; Joseph, D.S. Deformation and creep modeling in polycrystalline Ti–6Al alloys. Acta Mater. 2003, 51, 4533–4549. [Google Scholar] [CrossRef]
  11. Zheng, Z.; Balint, D.S.; Dunne, F.P. Dwell fatigue in two Ti alloys: An integrated crystal plasticity and discrete dislocation study. J. Mech. Phys. Solids 2016, 96, 411–427. [Google Scholar] [CrossRef] [Green Version]
  12. Pilchak, A.L.; Williams, J.C. Observations of facet formation in near-α titanium and comments on the role of hydrogen. Met. Mater. Trans. A 2010, 42, 1000–1027. [Google Scholar] [CrossRef]
  13. Kacher, J.; Robertson, I.M. In situ TEM characterisation of dislocation interactions in α-titanium. Philos. Mag. 2016, 96, 1437–1447. [Google Scholar] [CrossRef]
  14. Sinha, V.; Spowart, J.E.; Mills, M.J.; Williams, J.C. Observations on the faceted initiation site in the dwell-fatigue tested ti-6242 alloy: Crystallographic orientation and size effects. Metall. Mater. Trans. 2006, 37, 1507–1518. [Google Scholar] [CrossRef]
  15. Anahid, M.; Samal, M.K.; Ghosh, S. Dwell fatigue crack nucleation model based on crystal plasticity finite element simulations of polycrystalline titanium alloys. J. Mech. Phys. Solids 2011, 59, 2157–2176. [Google Scholar] [CrossRef]
  16. Gerland, M.; Lefranc, P.; Doquet, V.; Sarrazin-Baudoux, C. Deformation and damage mechanisms in an α/β 6242 Ti alloy in fatigue, dwell-fatigue and creep at room temperature. Influence of internal hydrogen. Mater. Sci. Eng. A 2009, 507, 132–143. [Google Scholar] [CrossRef]
  17. Wanjara, P.; Jahazi, M.; Monajati, H.; Yue, S. influence of thermomechanical processing on microstructural evolution in near- alloy imi834. Mater. Sci. Eng. A 2006, 416, 300–311. [Google Scholar] [CrossRef]
  18. Irvine, D.; Marzari, N. Fundamentals of Materials Science; Springer: Berlin/Heidelberg, Germany, 2005; Volume 24. [Google Scholar]
  19. Wu, S.H.; Huang, J.C.; Wang, Y.N. Evolution of microstructure and texture in Mg-Al-Zn alloys during electron-beam and gas tungsten arc welding. Met. Mater. Trans. A 2004, 35, 2455–2469. [Google Scholar] [CrossRef]
  20. Li, W.; Chen, Z.; Liu, J.; Zhu, S.; Sui, G.; Wang, Q. Technology, Rolling texture and its effect on tensile property of a near-α titanium alloy Ti60 plate. J. Mater. Sci. Technol. 2018, 35, 790–798. [Google Scholar] [CrossRef]
  21. Obasi, G.C.; Birosca, S.; Prakash, D.L.; Da Fonseca, J.Q.; Preuss, M. The influence of rolling temperature on texture evolution and variant selection during α → β → α phase transformation in Ti–6Al–4V. Acta Mater. 2012, 60, 6013–6024. [Google Scholar] [CrossRef]
  22. Zhang, C.; Guo, C.; Zhang, S.; Feng, H.; Chen, C.; Cao, P. Engineering, Microstructural manipulation and improved mechanical properties of a near a titanium alloy. Mater. Sci. Eng. A 2019, 771, 138569. [Google Scholar] [CrossRef]
  23. Jia, R.; Zeng, W.; He, S.; Gao, X.; Xu, J. The analysis of fracture toughness and fracture mechanism of Ti60 alloy under different temperatures. J. Alloys Compd. 2019, 810, 151899. [Google Scholar] [CrossRef]
  24. Jin, L.; Dong, J.; Sun, J.; Luo, A.A. In-situ investigation on the microstructure evolution and plasticity of two magnesium alloys during three-point bending. Int. J. Plast. 2015, 72, 218–232. [Google Scholar] [CrossRef]
  25. Castany, P.; Pettinari-Sturmel, F.; Douin, J.; Coujou, A. In situ transmission electron microscopy deformation of the titanium alloy Ti–6Al–4V: Interface behaviour. Mater. Sci. Eng. A 2008, 483–484, 719–722. [Google Scholar] [CrossRef]
  26. Hémery, S.; Villechaise, P.; Banerjee, D. Microplasticity at room temperature in α/β titanium alloys. Metall. Mater. Trans. A 2020, 3, 4931–4969. [Google Scholar] [CrossRef]
  27. Castany, P.; Pettinari-Sturmel, F.; Crestou, J.; Douin, J.; Coujou, A. Experimental study of dislocation mobility in a Ti–6Al–4V alloy. Acta Mater. 2007, 55, 6284–6291. [Google Scholar] [CrossRef]
  28. Sun, C.; Li, Y.; Xu, K.; Xu, B. Effects of intermittent loading time and stress ratio on dwell fatigue behavior of titanium alloy Ti-6Al-4V ELI used in deep-sea submersibles. J. Mater. Sci. Technol. 2020, 77, 223–236. [Google Scholar] [CrossRef]
  29. Xu, Z.; Huang, C.; Wan, M.; Tan, C.; Zhao, Y.; Ji, S.; Zeng, W. Influence of microstructure on strain controlled low cycle fatigue crack initiation and propagation of Ti-55531 alloy. Int. J. Fatigue 2022, 156, 106678. [Google Scholar] [CrossRef]
  30. Tan, C.; Li, X.; Sun, Q.; Xiao, L.; Zhao, Y.; Sun, J. Effect of α-phase morphology on low-cycle fatigue behavior of TC21 alloy. Int. J. Fatigue 2015, 75, 1–9. [Google Scholar] [CrossRef]
  31. Jia, R.; Zeng, W.; Zhao, Z.; Zhang, P.; Xu, J.; Wang, Q. In-situ investigation on the deformation mechanism of duplex microstructure of a near α titanium alloy. J. Alloys Compd. 2022, 893, 162184. [Google Scholar] [CrossRef]
  32. Aiyangar, A.K.; Neuberger, B.W.; Oberson, P.G.; Ankem, S. The effects of stress level and grain size on the ambient temperature creep deformation behavior of an alpha Ti-1.6 wt pct V alloy. Metall. Mater. Trans. A 2005, 36, 637–644. [Google Scholar] [CrossRef]
  33. Neeraj, T.; Hou, D.-H.; Daehn, G.; Mills, M. Phenomenological and microstructural analysis of room temperature creep in titanium alloys. Acta Mater. 2000, 48, 1225–1238. [Google Scholar] [CrossRef]
  34. Liu, F.; Peng, H.; Liu, Y.; Wang, C.; Wang, Q.; Chen, Y. Crack initiation mechanism of titanium alloy in very high cycle fatigue regime at 400 °C considering stress ratio effect, International. J. Fatigue 2022, 163, 107012. [Google Scholar] [CrossRef]
Figure 1. Schematic of the specimen used for the test. (a) The ambient tensile specimen (in mm); (b) the specimen for the low cycle fatigue and dwell fatigue tests (in mm); (c) the in situ tensile test specimen (in mm).
Metals 13 01149 g001
Figure 2. The loading waveform of the low cycle fatigue and dwell fatigue procedures. The applied maximum applied stress was 0.9 of the ultimate tensile strength, and the stress ratio R was 0.1. (a) Low cycle fatigue; (b) dwell fatigue.
Metals 13 01149 g002
Figure 3. A schematic exhibition of the OM observation of the secondary crack near the fracture surface.
Metals 13 01149 g003
Figure 4. The microstructure of the as-rolled plate of Ti834 titanium alloy. (a) Initial microstructure; (b) duplex annealed microstructure, annealed at 1020 °C for 2 h, air cooled, annealed at 700 °C for 2 h, then air cooled. Crystalline orientation for Ti834 titanium alloy plate after duplex annealing. (c) IPF map; (d) PF map.
Metals 13 01149 g004
Figure 5. Uniaxial tensile properties for the Ti834 alloy under the ambient tensile test: (a) the engineering stress–strain curve under the ambient tensile test; (b) the fracture surface of the failure sample under the ambient tensile testing.
Metals 13 01149 g005
Figure 6. The in situ tensile curve controlled by the displacement.
Metals 13 01149 g006
Figure 7. In situ SEM observation for a tensile specimen at different controlled displacements: (a) 0 mm; (b) 0.2 mm; (c) KAM map before deformation; (d) KAM map at the displacement of 0.2 mm.
Metals 13 01149 g007
Figure 8. Cyclic strain accumulation of the specimens under low cycle and dwell fatigue for the Ti834 titanium alloy.
Metals 13 01149 g008
Figure 9. SEM observation of the fatigue fracture surface: (a) macro morphologies of the low cycle fatigue sample; (b) macro morphologies of the dwell fatigue sample; (c) crack initiation region of the low cycle fatigue sample; (d) crack initiation region of the dwell fatigue sample; (e) crack propagation zone of the low cycle fatigue sample; (f) crack propagation zone of the dwell fatigue sample; (g,h) the final fracture region for the low cycle fatigue and dwell fatigue samples, respectively.
Metals 13 01149 g009
Figure 10. The crystal orientations around the fatigue crack. (a,b) SEM morphologies of the low cycle fatigue crack and dwell fatigue crack, respectively; (c,d) the crystal orientation corresponding to Figure 10a,b, respectively.
Metals 13 01149 g010
Figure 11. The OM observation of the secondary crack at the subsurface: (a,c) the failure specimens of the low cycle fatigue; the crack propagates in the αp and through αs platelets, respectively. (b) The failure specimens of the dwell fatigue; the crack path along the boundary of αp is pointed out by the arrow A. (d) The crack propagates through αs platelets for the dwell fatigue sample.
Metals 13 01149 g011
Figure 12. TEM observation of the dislocation structures in the primary αp grain near the fracture surface: (a) sub-grains in the αp for the LCF sample; (b) discrete dislocations in the αp for the LCF sample; (c,d) the dislocation distributions for the LCF sample; (e,f) the dislocation structures in the vicinity of the αps interface for the DF sample; (g,h) the dislocation morphologies at the boundary of the primary αp grain and inner portion of the αp grain under the creep deformation, respectively.
Metals 13 01149 g012
Figure 13. TEM observation of the dislocation structures in the βtrans zone near the fracture surface: (a,b) the dislocation tangles and array in the αs platelets for the LCF sample; (c) the straight dislocations in the αs platelets for the DF sample; (d) the dislocation tangles in the αs platelets for the DF sample; (e) the dislocation tangles in the αs platelets for the creep sample; (f) the isolated long straight dislocation lines in the αs platelets for the creep sample.
Metals 13 01149 g013
Figure 14. The schematic diagram of the dislocation distributions and cracks propagation. (a) The microstructures before deformation are composed by the primary αp and secondary αs phase; (b) the dislocation pile-ups and cracks occur at the boundary of αp, and the dislocation array is formed in the αs regions under dwell fatigue; (c) the sub-grains are formed in the primary αp, and the dislocation pile-ups are created at the boundary of the sub-grains, leading to the crack propagating along the boundary of the sub-grains under low cycle fatigue.
Metals 13 01149 g014
Table 1. Chemical compositions of Ti834 alloy (wt.%).
ElementsTiAlSnZrMoSiNbC
ContentBalance5.843.50.50.350.70.05
Table 2. The uniaxial tensile properties of Ti834 alloy.
AlloyRm/MPaRp0.2/MPaA/%Z/%
Ti83410769768.513
Table 3. The tested results for the low cycle fatigue and dwell fatigues samples.
Loading ConditionsRLoading Cycleσpeak/MPaDistance (mm)
LCF0.115,537960 MPa0.33
DF0.1373960 MPa0.59
Table 4. The angles between the c-axis of the HCP structure and the primary loading direction around fatigue crack.
Location 123456
Low cycle fatigueMetals 13 01149 i001
Location
Metals 13 01149 i002Metals 13 01149 i003Metals 13 01149 i004Metals 13 01149 i005Metals 13 01149 i006
Angle/°38.1637.538.164747.5
Dwell
fatigue
Metals 13 01149 i007Metals 13 01149 i008Metals 13 01149 i009Metals 13 01149 i010Metals 13 01149 i011Metals 13 01149 i012
Angle/°41.843.19.522.255.548.4
Disclaimer/Publisher’s Note: The statements, opinions and data contained in all publications are solely those of the individual author(s) and contributor(s) and not of MDPI and/or the editor(s). MDPI and/or the editor(s) disclaim responsibility for any injury to people or property resulting from any ideas, methods, instructions or products referred to in the content.

