
Processing of Al/SiC/Gr Hybrid Composite on EDM by Different Electrode Materials Using RSM-COPRAS Approach
 , and
, and
Abstract
:1. Introduction
- (i)
- To design the experiments as per the number of machining variables and their levels.
- (ii)
- To investigate the effect of the machining variables on the MRR and TWR during the machining of the Al composite with EDM.
- (iii)
- To determine the influence of different tool materials on the morphology of the machine surface of Al composite.
- (iv)
- To establish an empirical relationship between the machining variables and responses after performing experiments.
- (v)
- To optimize the machining variables of the EDM process using RSM–COPRAS.
2. Material Development
2.1. Aluminum-Based Metal Matrix Composite (AMC)
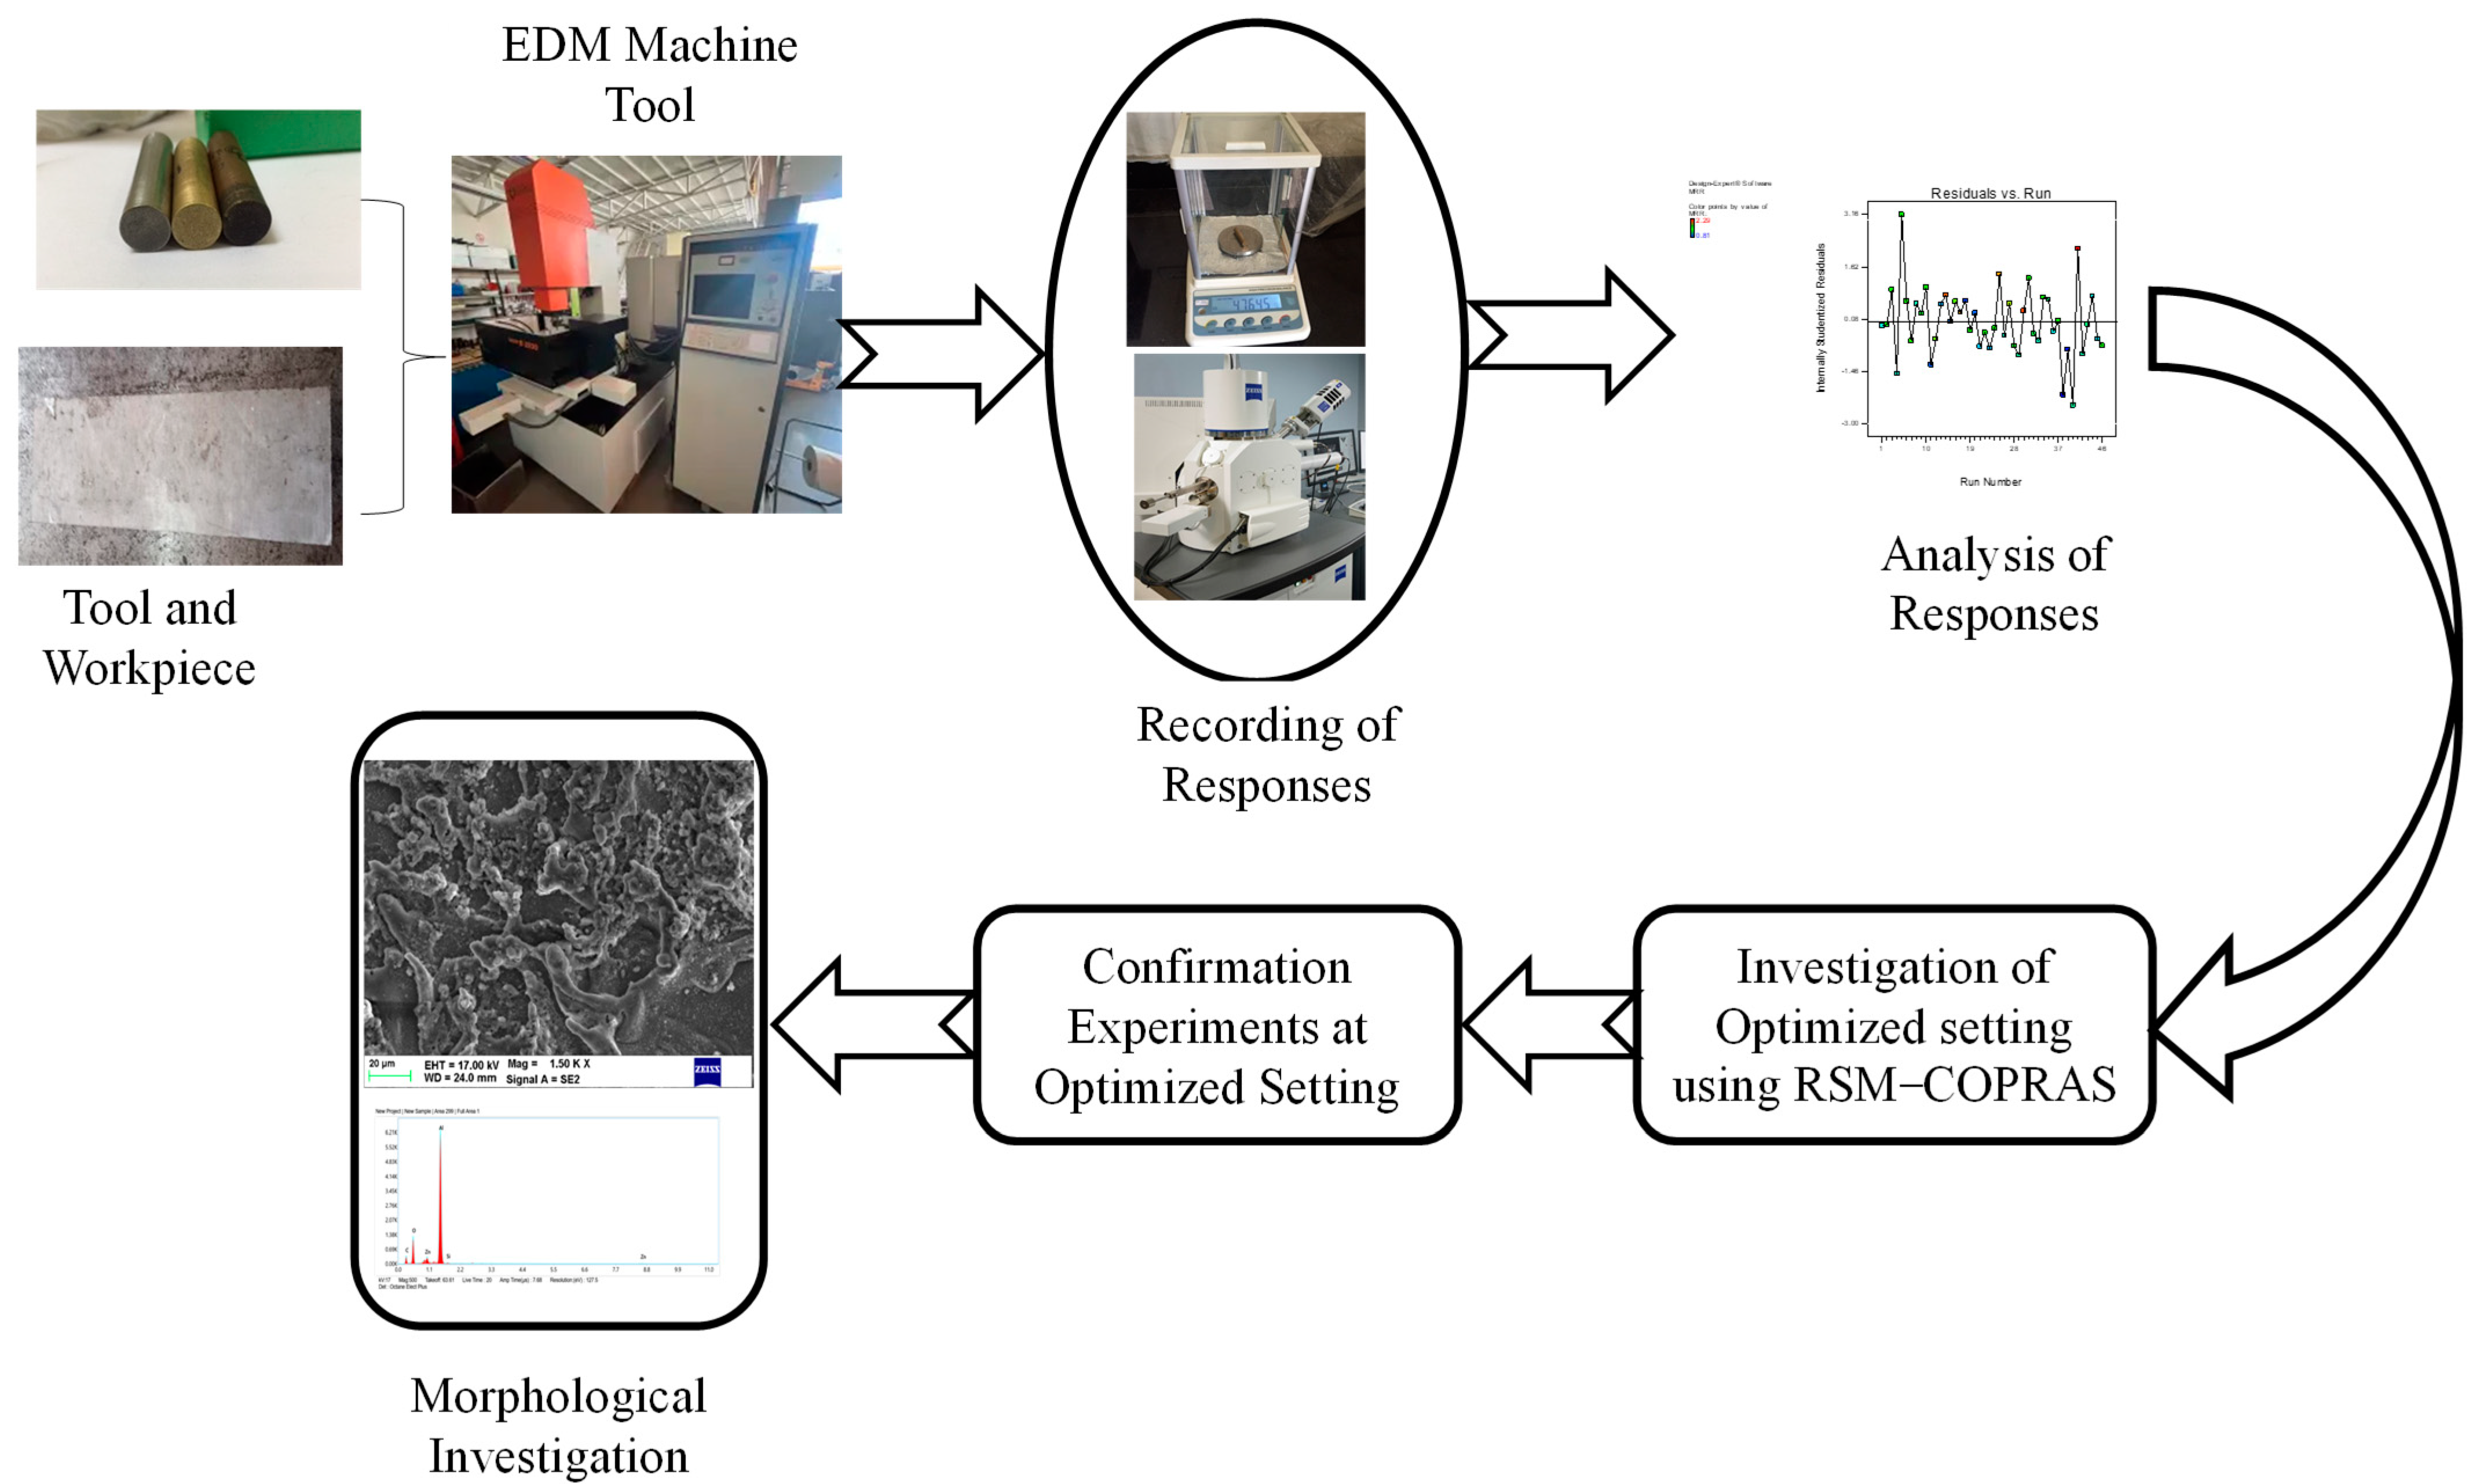
2.2. Experimentations
2.3. Evaluation of Responses
3. Methodology
- In COPRAS, fewer calculations are used compared with TOPSIS and AHP.
- Easy to use compared with TOPSIS.
- It has unique characteristics for maximizing and minimizing the output, which is missing in the maximum technique.
- It can calculate both quantitative and qualitative responses.
- It presents the utility degree, which is the primary benefit compared with other available methods.
4. Results and Discussion
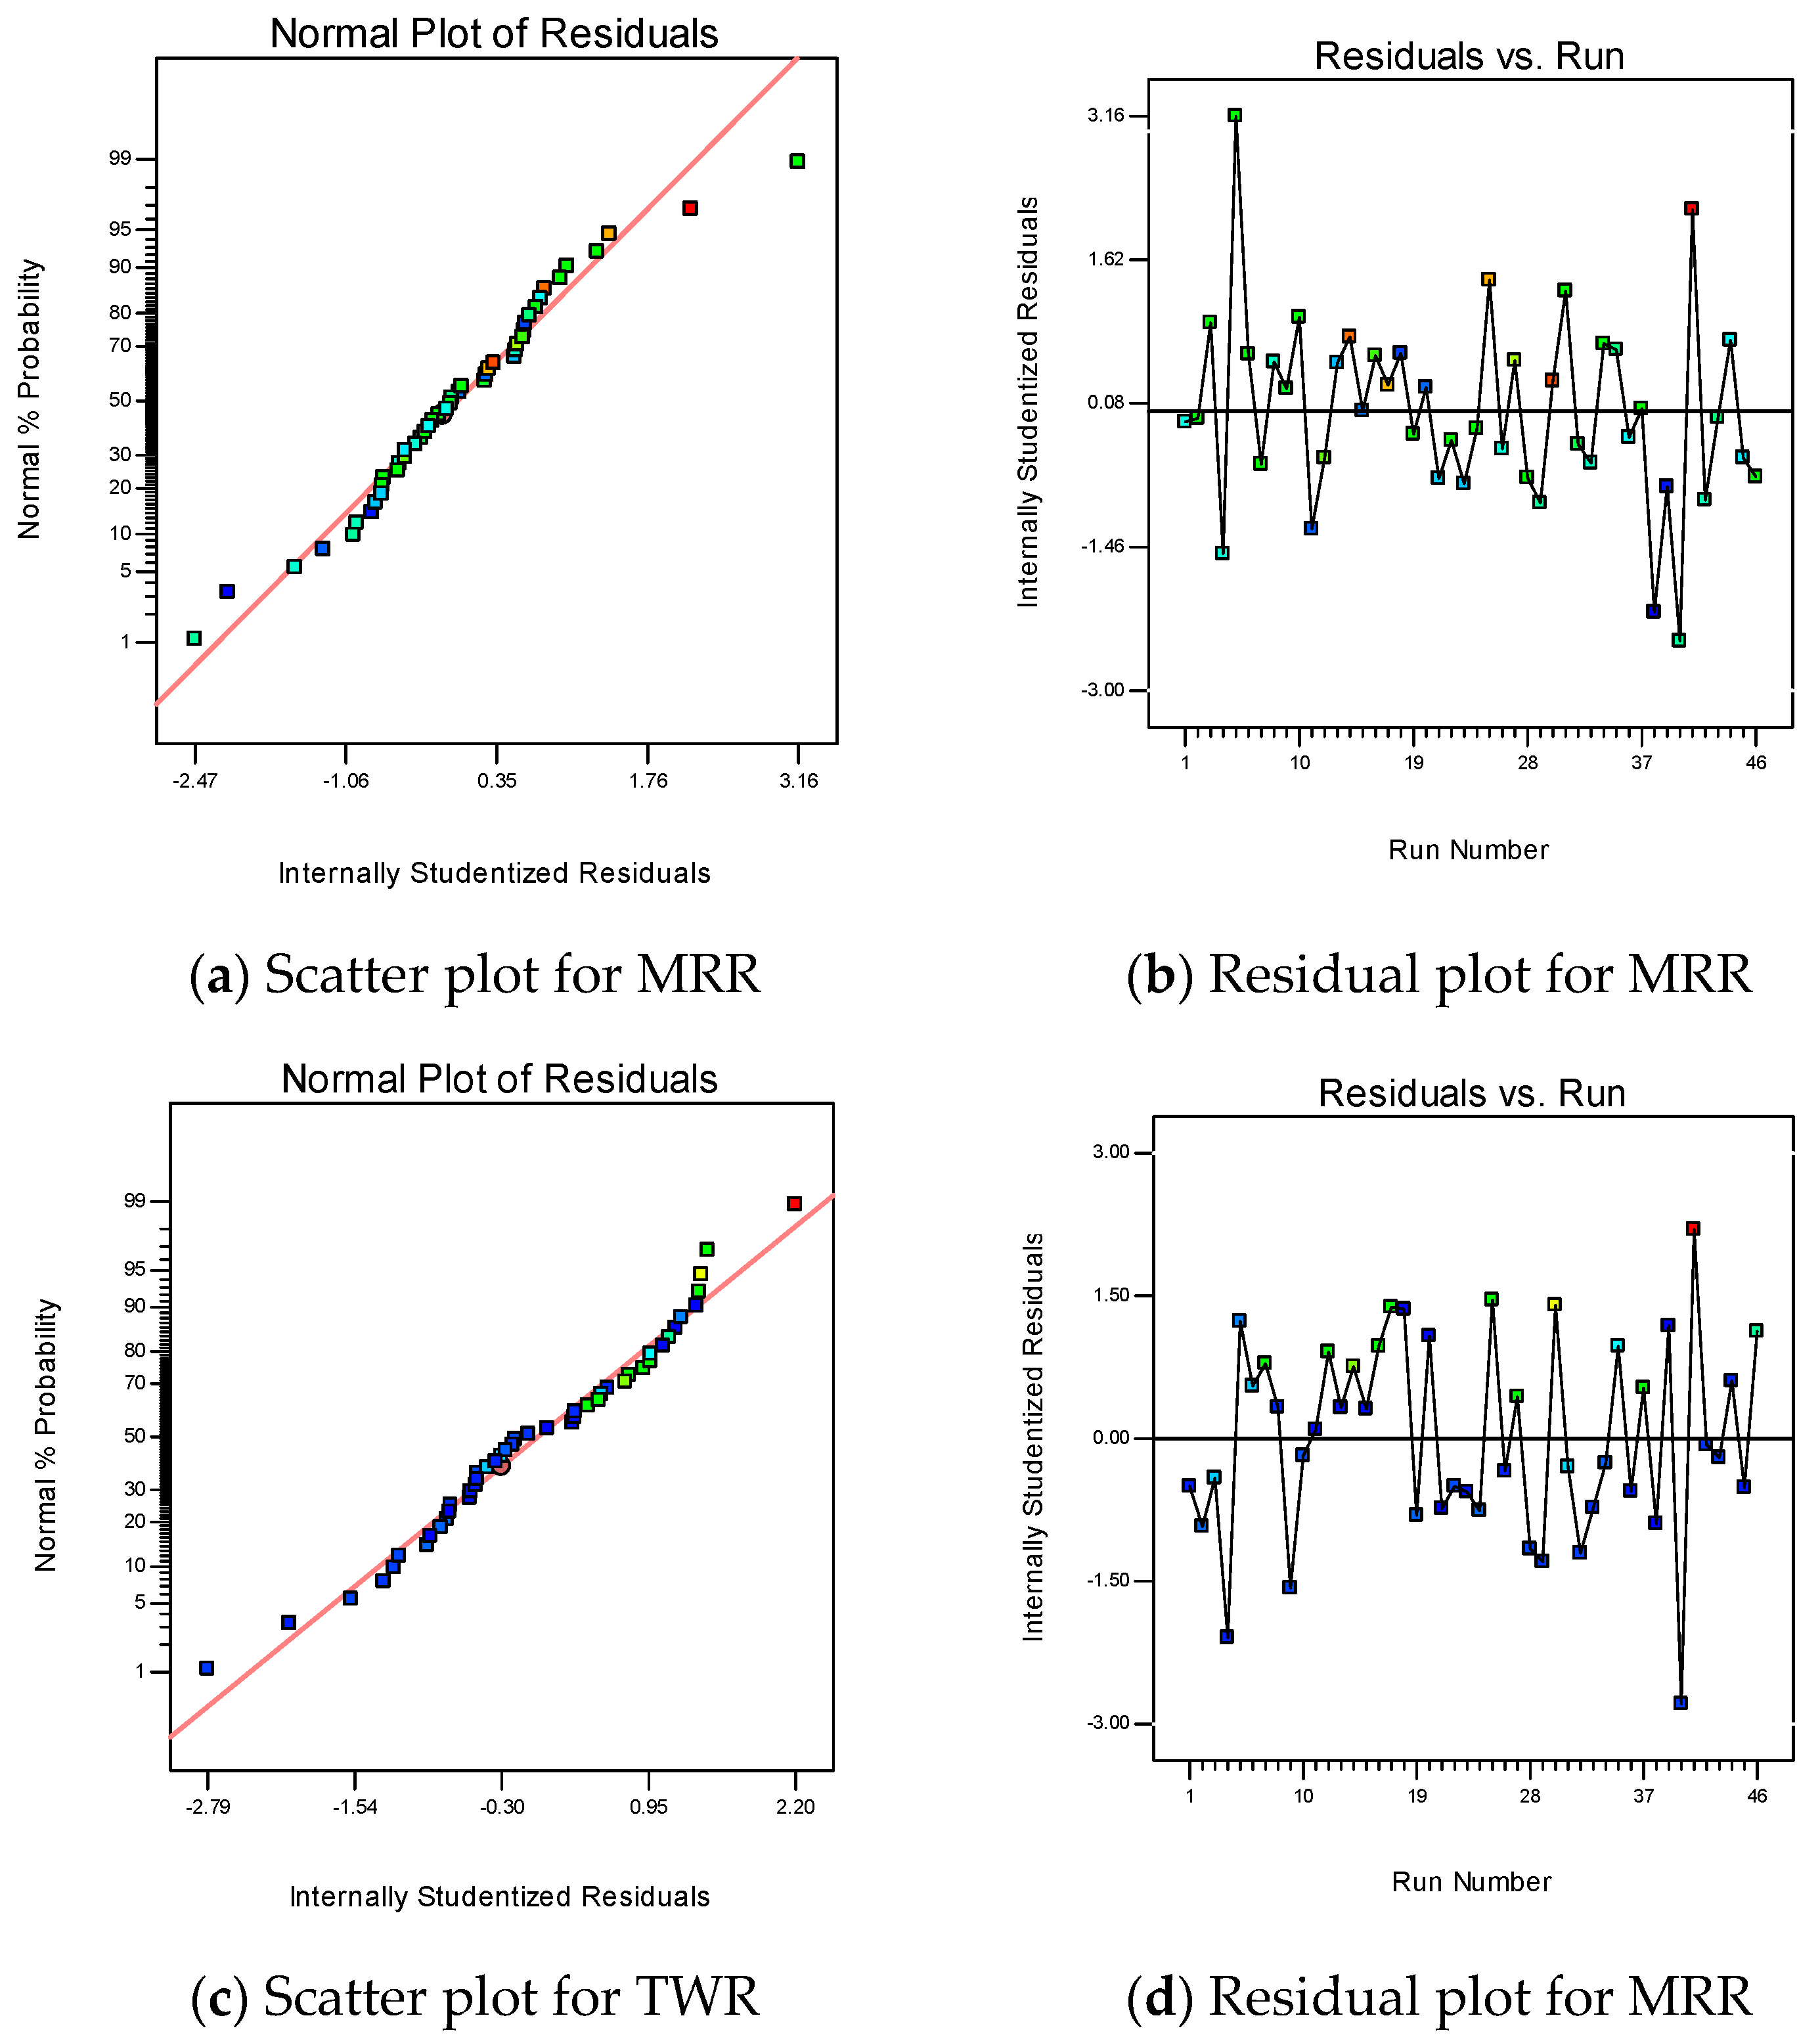
4.1. Analysis of the Responses
4.2. Implementation of COPRAS
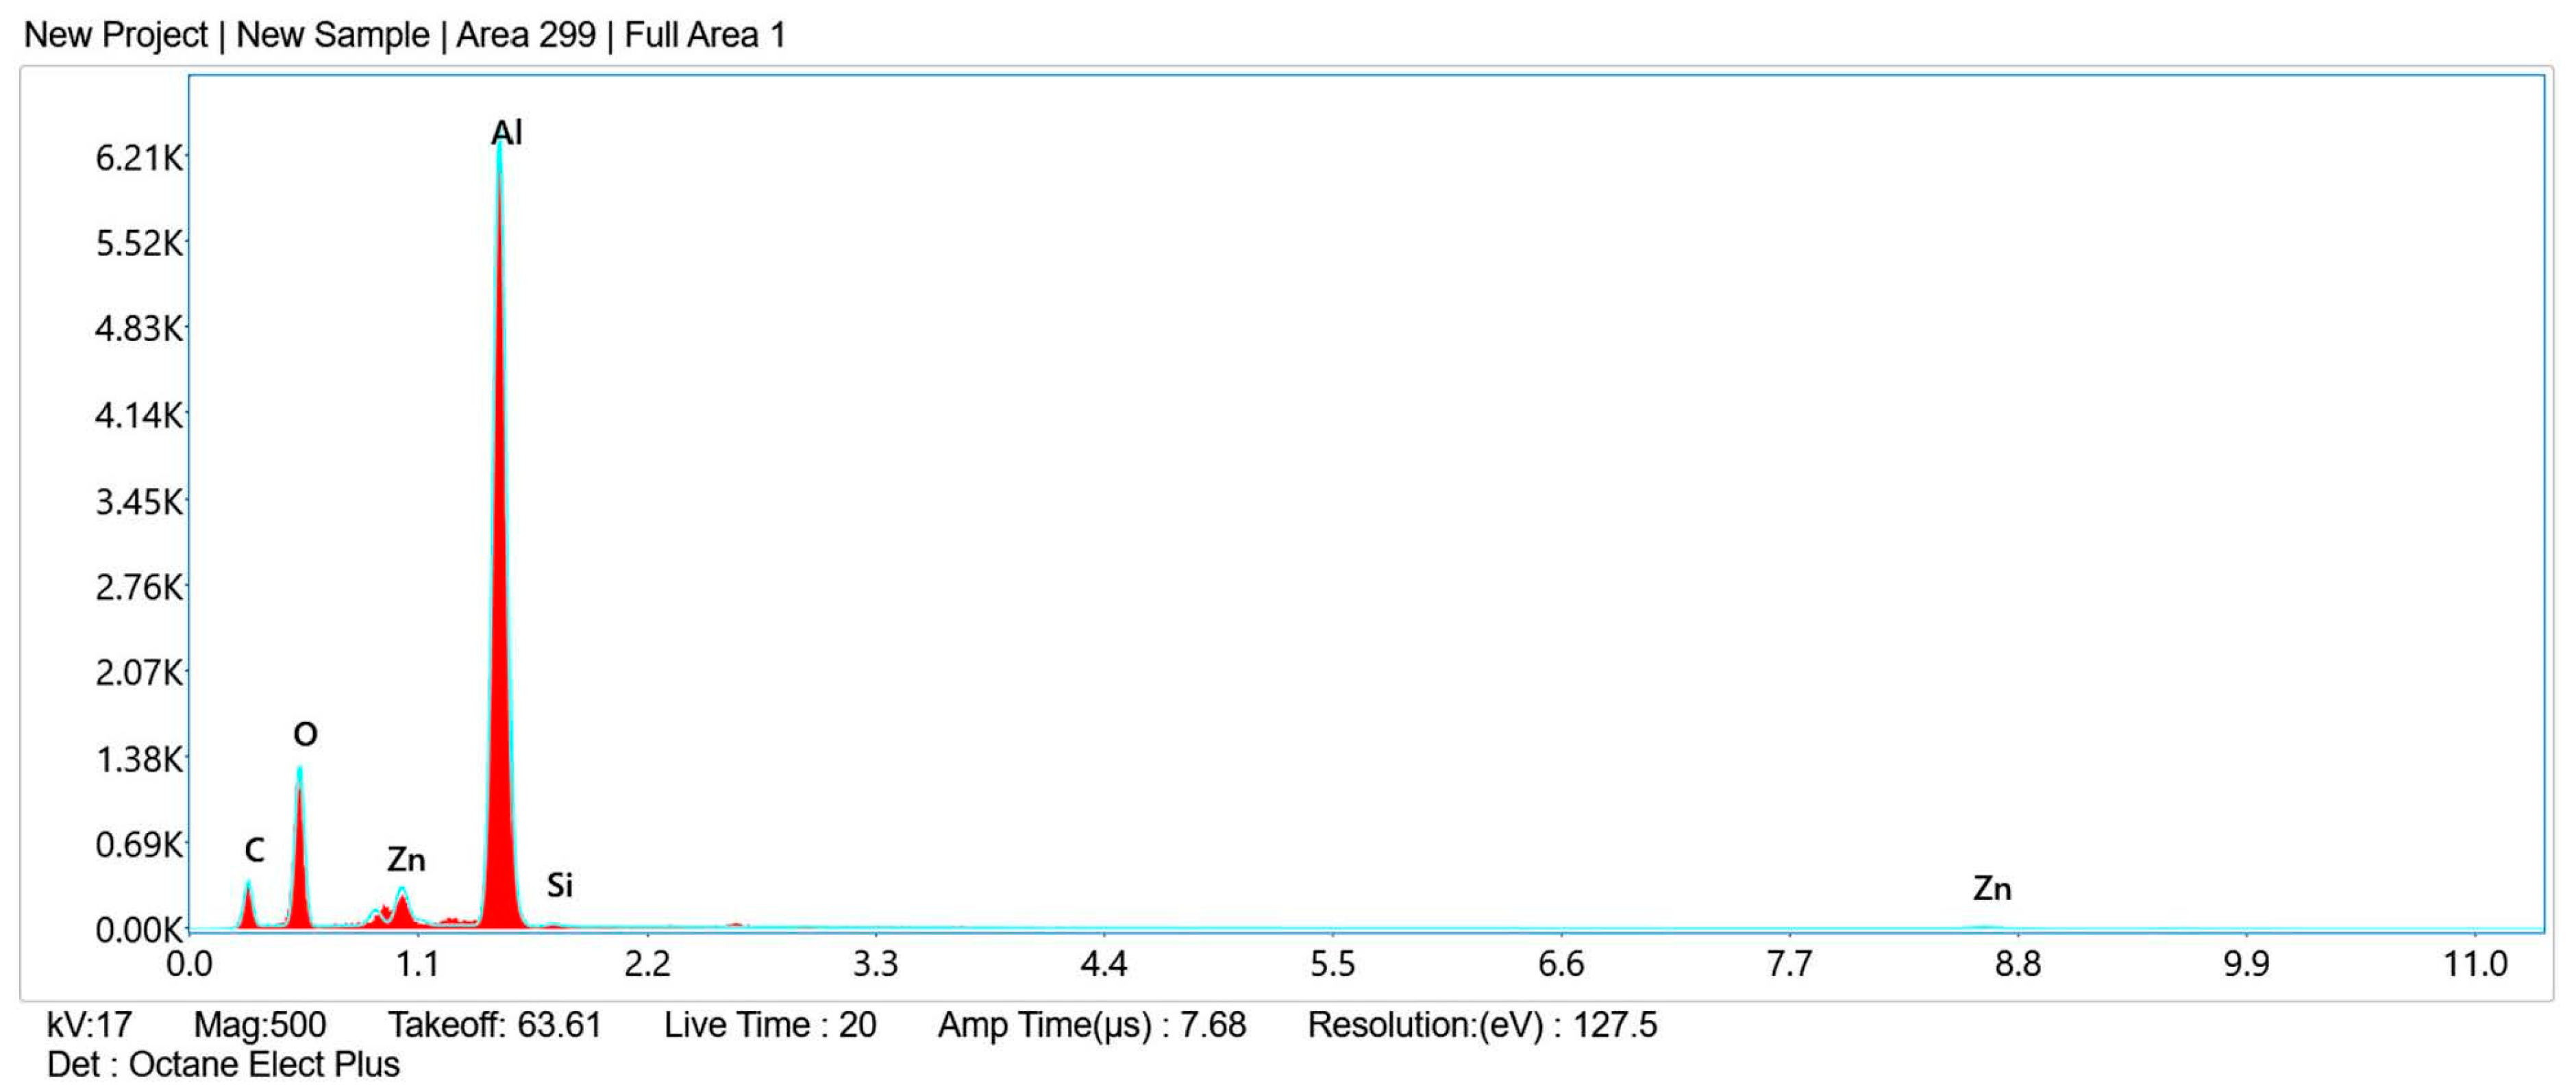
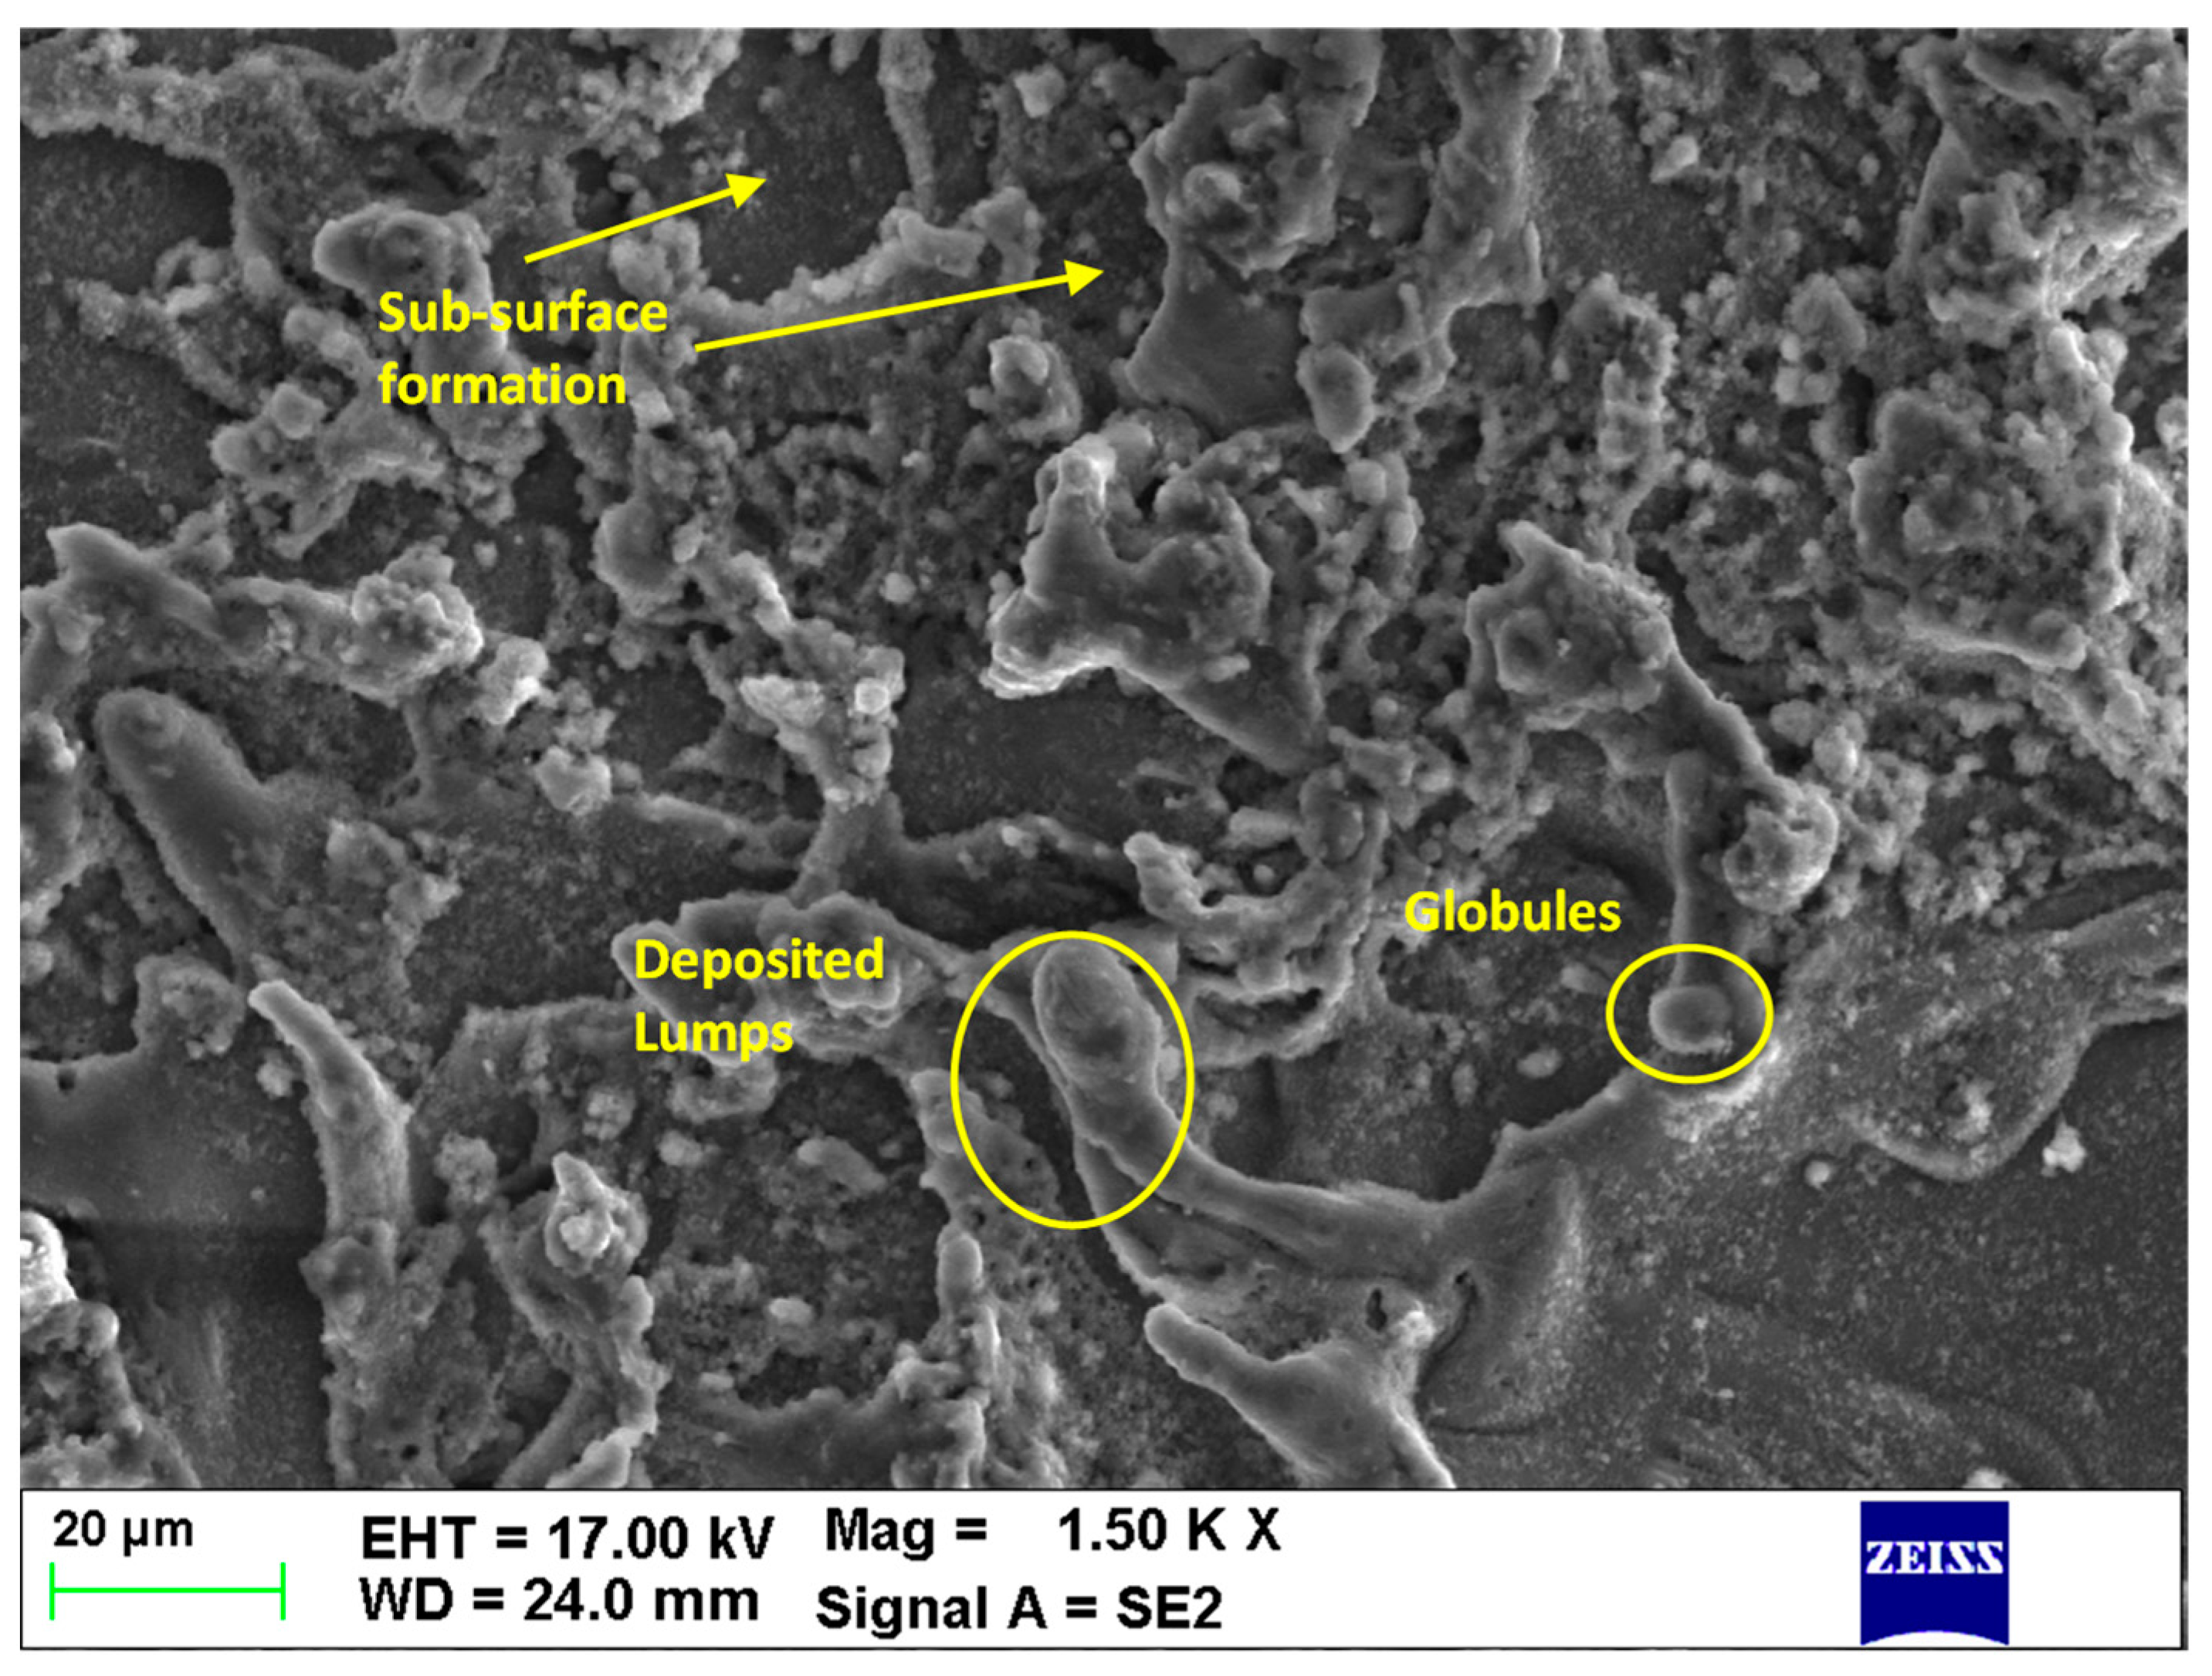
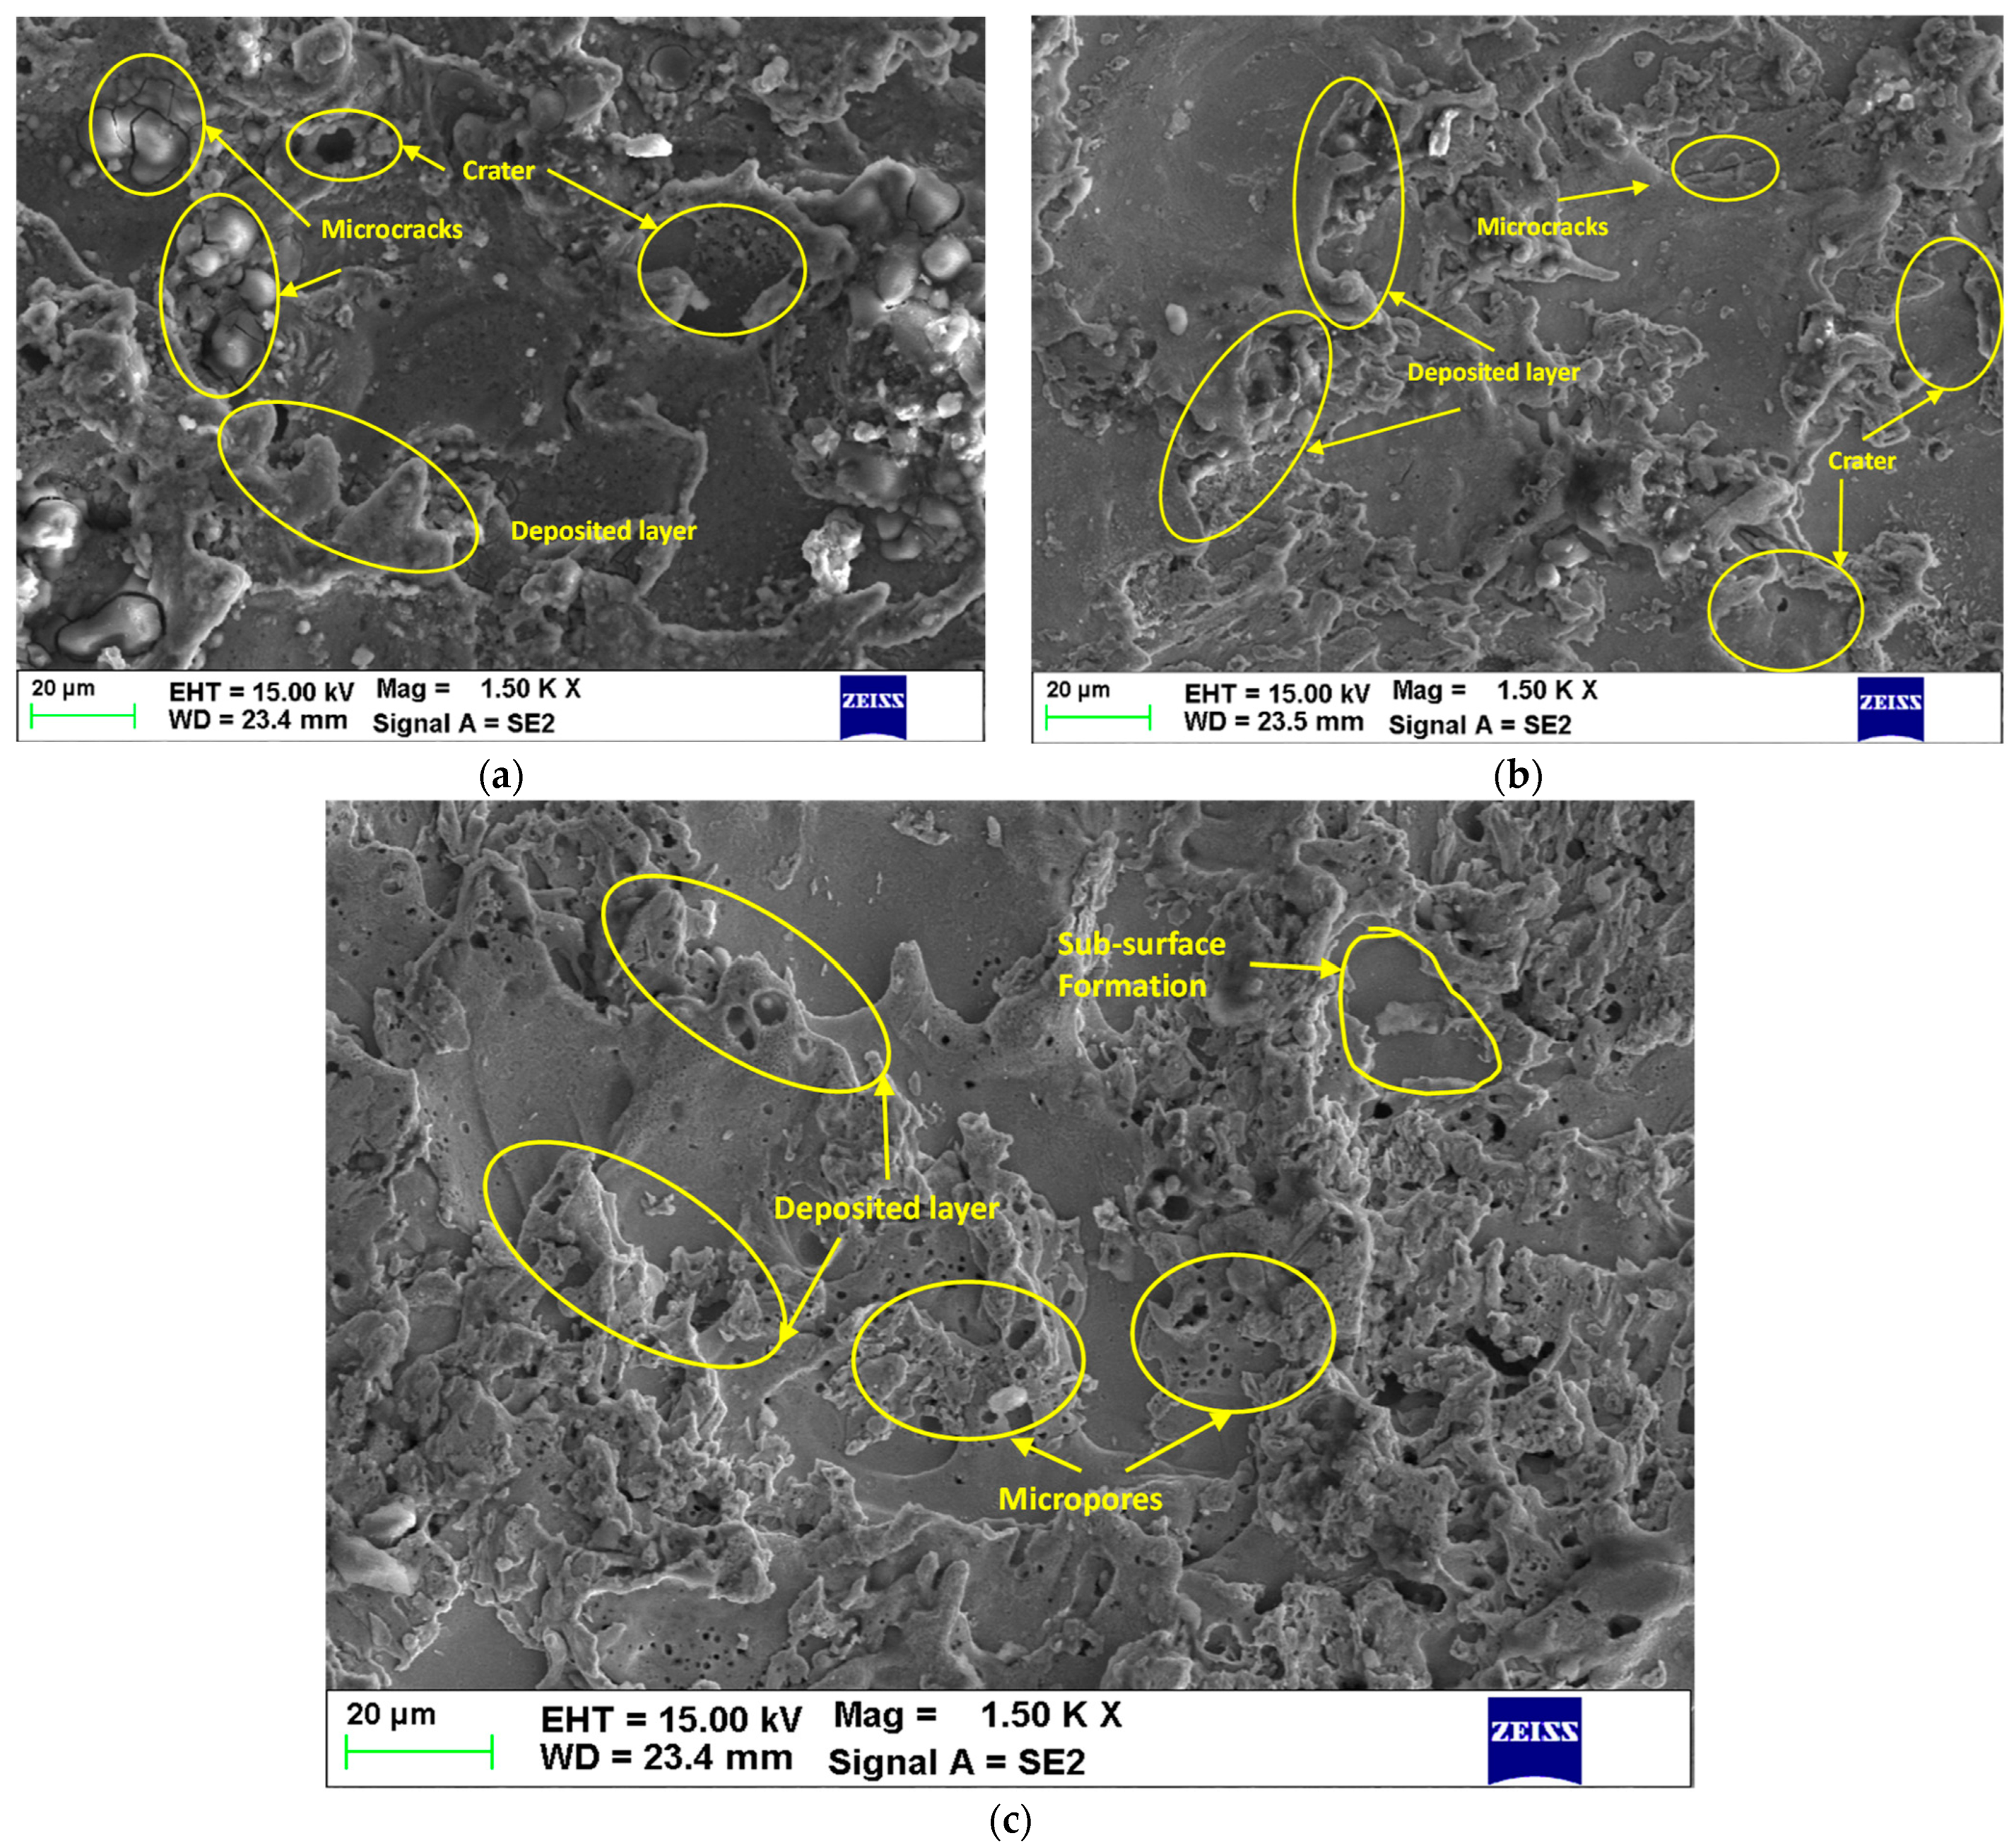
5. Morphological Investigations
6. Concluding Remarks
- After the preliminary study, the significant machining parameters of EDM were investigated; these were Ton, Toff, SV, and I.
- ANOVA showed that I played a pivotal role in MRR, followed by Ton, Toff, and I. Similarly, ANOVA of TWR showed that Toff, I, and Ton had a significant influence.
- The integrated approach of RSM–COPRAS suggested that the optimized settings for MRR and TWR are Ton: 60; Toff: 60; V: 7; I: 12; and tool: brass. At these settings, the MRR and TWR were 1.11 g/s and 0.0114 g/s, respectively.
- The morphological investigation revealed the presence of cracks, craters, and lumps on the workpiece and tool. The maximum TWR was observed in the case of brass, followed by those of Cu and SS-304.
- From this research, it can be found that the current methodology is a very effective and powerful technique to tackle the multi-response problems in industrial experiments.
Author Contributions
Funding
Institutional Review Board Statement
Informed Consent Statement
Data Availability Statement
Acknowledgments
Conflicts of Interest
References
- Mohan, B.; Rajadurai, A.; Satyanarayana, K.G. Electric discharge machining of Al–SiC metal matrix composites using rotary tube electrode. J. Mater. Process. Technol. 2004, 153, 978–985. [Google Scholar] [CrossRef]
- Kanagarajan, D.; Karthikeyan, R.; Palanikumar, K.; Sivaraj, P. Influence of process parameters on electric discharge machining of WC/30% Co composites. Proc. Inst. Mech. Eng. Part B J. Eng. Manuf. 2008, 222, 807–815. [Google Scholar] [CrossRef]
- Belgassim, O.; Abusaada, A. Investigation of the influence of EDM parameters on the overcut for AISI D3 tool steel. Proc. Inst. Mech. Eng. Part B J. Eng. Manuf. 2012, 226, 365–370. [Google Scholar] [CrossRef]
- Mohanty, C.P.; Satpathy, M.P.; Mahapatra, S.S.; Singh, M.R. Optimization of cryo-treated EDM variables using TOPSIS-based TLBO algorithm. Sādhanā 2018, 43, 51. [Google Scholar] [CrossRef] [Green Version]
- Mohanty, C.P.; Mahapatra, S.S.; Singh, M.R. An intelligent approach to optimize the EDM process parameters using utility concept and QPSO algorithm. Eng. Sci. Technol. Int. J. 2017, 20, 552–562. [Google Scholar] [CrossRef] [Green Version]
- Lee, S.H.; Li, X.P. Study of the effect of machining parameters on the machining characteristics in electrical discharge machining of tungsten carbide. J. Mater. Process. Technol. 2001, 115, 344–358. [Google Scholar] [CrossRef]
- Bhaumik, M.; Maity, K. Effect of different tool materials during EDM performance of titanium grade 6 alloy. Eng. Sci. Technol. Int. J. 2018, 21, 507–516. [Google Scholar] [CrossRef]
- Mishra, D.K.; Datta, S.; Masanta, M. Effects of tool electrode on EDM performance of Ti-6Al-4V. Silicon 2018, 10, 2263–2277. [Google Scholar]
- Li, C.; Xu, X.; Li, Y.; Tong, H.; Ding, S.; Kong, Q.; Zhao, L.; Ding, J. Effects of dielectric fluids on surface integrity for the recast layer in high speed EDM drilling of nickel alloy. J. Alloy. Compd. 2019, 783, 95–102. [Google Scholar] [CrossRef]
- Sharma, N.; Khanna, R.; Gupta, R.D.; Sharma, R. Modeling and multiresponse optimization on WEDM for HSLA by RSM. Int. J. Adv. Manuf. Technol. 2013, 67, 2269–2281. [Google Scholar] [CrossRef]
- Khanna, R.; Sharma, N.; Kumar, N.; Gupta, R.D.; Sharma, A. WEDM of Al/SiC/Ti composite: A hybrid approach of RSM-ARAS-TLBO algorithm. Int. J. Lightweight Mater. Manuf. 2022, 5, 315–325. [Google Scholar] [CrossRef]
- Sharma, A.; Sharma, N.; Singh, R.P.; Arora, R.; Gill, R.S.; Singh, G. Micro-drill on Al/SiC composite by EDD process: An RSM-MOGOA based hybrid approach. Int. J. Lightweight Mater. Manuf. 2022, 5, 564–575. [Google Scholar] [CrossRef]
- Ong, P.; Chong, C.H.; bin Rahim, M.Z.; Lee, W.K.; Sia, C.K.; bin Ahmad, M.A.H. Intelligent approach for process modelling and optimization on electrical discharge machining of polycrystalline diamond. J. Intell. Manuf. 2020, 31, 227–247. [Google Scholar] [CrossRef]
- Lin, M.-Y.; Tsao, C.; Hsu, C.; Chiou, A.-H.; Huang, P.-C.; Lin, Y.-C. Optimization of micro milling electrical discharge machining of Inconel 718 by Grey-Taguchi method. Trans. Nonferr. Met. Soc. China 2013, 23, 661–666. [Google Scholar] [CrossRef]
- Nikalje, A.M.; Kumar, A.; Srinadh, K.V. Influence of parameters and optimization of EDM performance measures on MDN 300 steel using Taguchi method. Int. J. Adv. Manuf. Technol. 2013, 69, 41–49. [Google Scholar] [CrossRef]
- Kalsi, N.S.; Sehgal, R.; Sharma, V.S. Multi-objective optimization using grey relational Taguchi analysis in machining: Grey relational Taguchi analysis. Int. J. Organ. Collect. Intel. 2016, 6, 45–64. [Google Scholar] [CrossRef]
- Jangra, K.; Grover, S.; Aggarwal, A. Simultaneous optimization of material removal rate and surface roughness for WEDM of WC-Co composite using grey relational analysis along with Taguchi method. Int. J. Ind. Eng. Comput. 2011, 2, 479–490. [Google Scholar] [CrossRef]
- Sharma, N.; Sharma, V.S.; Sharma, R.C.; Arora, R.; Sharma, A. Development of quality microholes by electrical discharge drilling on Al/SiC composite using of Grey-desirability approach. Int. J. Lightweight Mater. Manuf. 2022, 5, 267–277. [Google Scholar] [CrossRef]
- Khanna, R.; Kumar, A.; Garg, M.P.; Singh, A.; Sharma, N. Multiple performance characteristics optimization for Al 7075 on electric discharge drilling by Taguchi grey relational theory. J. Ind. Eng. Int. 2015, 11, 459–472. [Google Scholar] [CrossRef] [Green Version]
- Selvarajan, L.; Manohar, M.; Dhinakaran, P. Modelling and experimental investigation of process parameters in EDM of Si3N4-TiN composites using GRA-RSM. J. Mech. Sci. Technol. 2017, 31, 111–122. [Google Scholar] [CrossRef]
- Tzeng, C.-J.; Chen, R.-Y. Optimization of electric discharge machining process using the response surface methodology and genetic algorithm approach. Int. J. Precis. Eng. Manuf. 2013, 14, 709–717. [Google Scholar] [CrossRef]
- Świercz, R.; Oniszczuk-Świercz, D.; Chmielewski, T. Multi-response optimization of electrical discharge machining using the desirability function. Micromachines 2019, 10, 72. [Google Scholar] [CrossRef] [Green Version]
- Ray, A. Optimization of process parameters of green electrical discharge machining using principal component analysis (PCA). Int. J. Adv. Manuf. Technol. 2016, 87, 1299–1311. [Google Scholar]
- Dureja, J.S.; Gupta, V.K.; Sharma, V.S.; Dogra, M. Design optimization of cutting conditions and analysis of their effect on tool wear and surface roughness during hard turning of AISI-H11 steel with a coated—Mixed ceramic tool. Proc. Inst. Mech. Eng. Part B J. Eng. Manuf. 2009, 223, 1441–1453. [Google Scholar] [CrossRef]
- Saini, S.; Ahuja, I.S.; Sharma, V.S. Modelling the effects of cutting parameters on residual stresses in hard turning of AISI H11 tool steel. Int. J. Adv. Manuf. Technol. 2013, 65, 667–678. [Google Scholar] [CrossRef]
- Goyal, K.K.; Sharma, N.; Gupta, R.D.; Gupta, S.; Rani, D.; Kumar, D. Measurement of performance characteristics of WEDM while processing AZ31 Mg-alloy using Levy flight MOGWO for orthopedic application. Int. J. Adv. Manuf. Technol. 2022, 119, 7175–7197. [Google Scholar] [CrossRef]
- Khan, A.; Maity, K.P. A novel MCDM approach for simultaneous optimization of some correlated machining parameters in turning of CP-titanium grade 2. Int. J. Eng. Res. Afr. 2016, 22, 94–111. [Google Scholar]
- Majumder, H.; Khan, A.; Naik, D.K.; Kumar, C.S. Machinability assessment of shape memory alloy nitinol during WEDM operation: Application potential of taguchi based AHP–DFA technique. Surf. Rev. Lett. 2022, 29, 2250002. [Google Scholar] [CrossRef]
- Bhowmick, S.; Mondal, R.; Sarkar, S.; Biswas, N.; De, J.; Majumdar, G. Parametric optimization and prediction of MRR and surface roughness of titanium mixed EDM for Inconel 718 using RSM and fuzzy logic. CIRP J. Manuf. Sci. Technol. 2023, 40, 10–28. [Google Scholar] [CrossRef]
- Shanbhog, N.; Arunachalam, N.; Bakshi, S.R. Surface integrity studies on ZrB2 and graphene reinforced ZrB2 ceramic matrix composite in EDM process. CIRP J. Manuf. Sci. Technol. 2022, 38, 401–413. [Google Scholar] [CrossRef]
- Işık, A.T.; Çakıroğlu, R.; Günay, M. Multiresponse optimization of performance indicators through Taguchi-grey relational analysis in EDM of cemented carbide. CIRP J. Manuf. Sci. Technol. 2023, 41, 490–500. [Google Scholar] [CrossRef]
- Zavadskas, E.K.; Kaklauskas, A.; Turskis, Z.; Tamošaitienė, J. Contractor Selection Multi-Attribute Model Applying COPRAS Method with Grey Interval Numbers. 2008, pp. 123–127. Available online: https://etalpykla.vilniustech.lt/handle/123456789/94386 (accessed on 17 September 2022).
- Organ, A.; Yalçın, E. Performance evaluation of research assistants by COPRAS method. Eur. Sci. J. 2016, 12, 102–109. [Google Scholar]
- Popovic, G.; Stanujkic, D.; Stojanovic, S. Investment project selection by applying COPRAS method and imprecise data. Serb. J. Manag. 2012, 7, 257–269. [Google Scholar] [CrossRef] [Green Version]


| Element | Percentage |
|---|---|
| Cr | 0.2 |
| Cu | 0.28 |
| Si | 0.6 |
| Mg | 0.74 |
| Zn | 0.14 |
| C | 0.17 |
| Al | Balance |
| Machining Parameters | Symbols (Units) | Level/Code | ||
|---|---|---|---|---|
| −1 | 0 | 1 | ||
| Tool | Steel-304 | Brass | Copper | |
| Current | I (A) | 10 | 12 | 14 |
| Voltage | V (V) | 6 | 7 | 8 |
| Pulse off time | Toff (µs) | 30 | 60 | 90 |
| Pulse on time | Ton (µs) | 30 | 60 | 90 |
| Run | X1: Ton (µs) | X2: Toff (µs) | X3: SV (V) | X4: I (A) | X5: Tool | MRR (g/s) | TWR (g/s) |
|---|---|---|---|---|---|---|---|
| 1 | 0 | 0 | 0 | 0 | 0 | 1.22 | 5.84 × 10⁻⁵ |
| 2 | 0 | 0 | 1 | 0 | −1 | 1.58 | 0.000157 |
| 3 | 0 | −1 | 1 | 0 | 0 | 1.59 | 0.00029 |
| 4 | 0 | 0 | 0 | −1 | 1 | 1.24 | 6.19 × 10⁻⁵ |
| 5 | 0 | 1 | −1 | 0 | 0 | 1.61 | 0.00019 |
| 6 | −1 | 0 | 0 | 0 | −1 | 1.62 | 0.000288 |
| 7 | 0 | 0 | 0 | 1 | −1 | 1.75 | 0.000661 |
| 8 | −1 | 0 | 1 | 0 | 0 | 1.26 | 7.51 × 10⁻⁵ |
| 9 | 0 | 1 | 0 | 0 | −1 | 1.45 | 0.000106 |
| 10 | 0 | 0 | 0 | −1 | −1 | 1.51 | 0.000121 |
| 11 | −1 | 0 | −1 | 0 | 0 | 0.95 | 2.94 × 10⁻⁵ |
| 12 | 1 | 0 | 0 | 1 | 0 | 1.79 | 0.000661 |
| 13 | 0 | 0 | 1 | −1 | 0 | 1.08 | 4.30 × 10⁻⁵ |
| 14 | 0 | 0 | 0 | 1 | 1 | 2.13 | 0.000951 |
| 15 | 0 | 0 | −1 | −1 | 0 | 0.99 | 4.00 × 10⁻⁵ |
| 16 | −1 | 0 | 0 | 0 | 1 | 1.77 | 0.000661 |
| 17 | 1 | 0 | 0 | 0 | −1 | 2.02 | 0.00074 |
| 18 | 0 | 1 | 0 | −1 | 0 | 0.91 | 2.50 × 10⁻⁵ |
| 19 | 1 | 0 | 1 | 0 | 0 | 1.58 | 0.000151 |
| 20 | −1 | 0 | 0 | −1 | 0 | 0.96 | 3.40 × 10⁻⁵ |
| 21 | 0 | 0 | 0 | 0 | 0 | 1.11 | 1.14 × 10⁻⁵ |
| 22 | 0 | 1 | 0 | 0 | 1 | 1.51 | 0.000117 |
| 23 | 0 | 0 | 0 | 0 | 0 | 1.1 | 4.63 × 10⁻⁵ |
| 24 | 1 | 0 | −1 | 0 | 0 | 1.59 | 0.000161 |
| 25 | 1 | −1 | 0 | 0 | 0 | 2.04 | 0.000794 |
| 26 | 0 | 1 | 0 | 1 | 0 | 1.24 | 6.45 × 10⁻⁵ |
| 27 | 0 | 0 | 1 | 0 | 1 | 1.84 | 0.000715 |
| 28 | 0 | 0 | −1 | 0 | −1 | 1.47 | 0.000111 |
| 29 | 0 | 0 | 1 | 1 | 0 | 1.32 | 8.72 × 10⁻⁵ |
| 30 | 1 | 0 | 0 | 0 | 1 | 2.18 | 0.001039 |
| 31 | 0 | −1 | −1 | 0 | 0 | 1.65 | 0.000313 |
| 32 | 0 | 0 | −1 | 1 | 0 | 1.43 | 0.000105 |
| 33 | −1 | −1 | 0 | 0 | 0 | 1.26 | 8.47 × 10⁻⁵ |
| 34 | −1 | 0 | 0 | 1 | 0 | 1.54 | 0.000143 |
| 35 | 0 | 0 | 0 | 0 | 0 | 1.36 | 0.000356 |
| 36 | 0 | 0 | 0 | 0 | 0 | 1.19 | 4.76 × 10⁻⁵ |
| 37 | 0 | −1 | 0 | 1 | 0 | 1.68 | 0.000652 |
| 38 | 0 | −1 | 0 | −1 | 0 | 0.81 | 2.14 × 10⁻⁵ |
| 39 | −1 | 1 | 0 | 0 | 0 | 0.85 | 2.34 × 10⁻⁵ |
| 40 | 0 | 0 | −1 | 0 | 1 | 1.32 | 9.38 × 10⁻⁵ |
| 41 | 0 | −1 | 0 | 0 | 1 | 2.29 | 0.001405 |
| 42 | 1 | 1 | 0 | 0 | 0 | 1.28 | 8.53 × 10⁻⁵ |
| 43 | 1 | 0 | 0 | −1 | 0 | 1.36 | 9.06 × 10⁻⁵ |
| 44 | 0 | 1 | 1 | 0 | 0 | 1.19 | 6.73 × 10⁻⁵ |
| 45 | 0 | 0 | 0 | 0 | 0 | 1.15 | 5.61 × 10⁻⁵ |
| 46 | 0 | −1 | 0 | 0 | −1 | 1.66 | 0.000494 |
| MRR | ||||||
| Source | SS | df | MS | F-Value | p-Value | Remarks |
| Model | 4.43 | 6 | 0.74 | 21.5 | <0.0001 | significant |
| X1-Ton | 0.82 | 1 | 0.82 | 23.98 | <0.0001 | |
| X2-Toff | 0.54 | 1 | 0.54 | 15.73 | 0.0003 | |
| X4-I | 1.01 | 1 | 1.01 | 29.42 | <0.0001 | |
| X5-Tool | 0.093 | 1 | 0.093 | 2.71 | 0.1078 | |
| X12 | 0.24 | 1 | 0.24 | 7.12 | 0.0111 | |
| X52 | 1.88 | 1 | 1.88 | 54.66 | <0.0001 | |
| Residual | 1.34 | 39 | 0.034 | |||
| Lack of Fit | 1.29 | 34 | 0.038 | 4.14 | 0.0587 | not significant |
| Error | 0.046 | 5 | 9.18 × 10⁻³ | |||
| Total | 5.77 | 45 | ||||
| R2 | 0.767846 | Pred R2 | 0.679282 | |||
| Adj R2 | 0.73213 | Adeq Precision | 18.28723 | |||
| TWR | ||||||
| Source | SS | df | MS | F-Value | p-Value | |
| Model | 3.23 × 10⁻⁶ | 6 | 5.38 × 10⁻⁷ | 12.7 | <0.0001 | significant |
| X1-Ton | 3.55 × 10⁻⁷ | 1 | 3.55 × 10⁻⁷ | 8.38 | 0.0062 | |
| X2-Toff | 7.12 × 10⁻⁷ | 1 | 7.12 × 10⁻⁷ | 16.83 | 0.0002 | |
| X4-I | 5.21 × 10⁻⁷ | 1 | 5.21 × 10⁻⁷ | 12.31 | 0.0012 | |
| X5-Tool | 3.50 × 10⁻⁷ | 1 | 3.50 × 10⁻⁷ | 8.27 | 0.0065 | |
| X2*X5 | 2.03 × 10⁻⁷ | 1 | 2.03 × 10⁻⁷ | 4.79 | 0.0346 | |
| X52 | 1.09 × 10⁻⁶ | 1 | 1.09 × 10⁻⁶ | 25.63 | <0.0001 | |
| Residual | 1.65 × 10⁻⁶ | 39 | 4.23 × 10⁻⁷ | |||
| Lack of Fit | 1.57 × 10⁻⁶ | 34 | 4.61 × 10⁻⁷ | 2.79 | 0.1266 | not significant |
| Error | 8.26 × 10⁻⁷ | 5 | 1.65 × 10⁻⁷ | |||
| Total | 4.88 × 10⁻⁶ | 45 | ||||
| R2 | 0.661495 | Pred R2 | 0.464859 | |||
| Adj R2 | 0.609417 | Adeq Precision | 16.17298 | |||
| Sr No | Data Set | Normalized Data | Weighted Normalized Decision Matrix | Bi | Ci | Min (Ci)/Ci | Qi | Ui | Rank | |||
|---|---|---|---|---|---|---|---|---|---|---|---|---|
| MRR | TWR | MRR | TWR | |||||||||
| 1 | 1.22 | 5.84 × 10⁻⁵ | 0.0184 | 0.0047 | 0.00918 | 0.00233 | 0.009 | 0.002 | 0.1952 | 0.023 | 29.1636 | 12 |
| 2 | 1.58 | 0.00016 | 0.0238 | 0.0125 | 0.01189 | 0.00627 | 0.012 | 0.006 | 0.0726 | 0.017 | 21.6721 | 31 |
| 3 | 1.59 | 0.00029 | 0.0239 | 0.0231 | 0.01197 | 0.01157 | 0.012 | 0.012 | 0.0393 | 0.015 | 18.7933 | 40 |
| 4 | 1.24 | 6.19 × 10⁻⁵ | 0.0187 | 0.0049 | 0.00933 | 0.00247 | 0.009 | 0.002 | 0.1842 | 0.022 | 28.3698 | 13 |
| 5 | 1.61 | 0.00019 | 0.0242 | 0.0152 | 0.01212 | 0.00758 | 0.012 | 0.008 | 0.0600 | 0.016 | 20.8338 | 35 |
| 6 | 1.62 | 0.00029 | 0.0244 | 0.0230 | 0.01219 | 0.01149 | 0.012 | 0.011 | 0.0396 | 0.015 | 19.1061 | 39 |
| 7 | 1.75 | 0.00066 | 0.0263 | 0.0528 | 0.01317 | 0.02638 | 0.013 | 0.026 | 0.0172 | 0.014 | 18.3601 | 43 |
| 8 | 1.26 | 7.51 × 10⁻⁵ | 0.0190 | 0.0060 | 0.00948 | 0.00300 | 0.009 | 0.003 | 0.1518 | 0.020 | 25.6703 | 16 |
| 9 | 1.45 | 0.00011 | 0.0218 | 0.0085 | 0.01091 | 0.00423 | 0.011 | 0.004 | 0.1075 | 0.018 | 23.5435 | 22 |
| 10 | 1.51 | 0.00012 | 0.0227 | 0.0097 | 0.01137 | 0.00483 | 0.011 | 0.005 | 0.0942 | 0.018 | 22.9292 | 26 |
| 11 | 0.95 | 2.94 × 10⁻⁵ | 0.0143 | 0.0023 | 0.00715 | 0.00117 | 0.007 | 0.001 | 0.3878 | 0.034 | 43.7694 | 5 |
| 12 | 1.79 | 0.00066 | 0.0269 | 0.0528 | 0.01347 | 0.02638 | 0.013 | 0.026 | 0.0172 | 0.015 | 18.7446 | 41 |
| 13 | 1.08 | 4.30 × 10⁻⁵ | 0.0163 | 0.0034 | 0.00813 | 0.00172 | 0.008 | 0.002 | 0.2651 | 0.027 | 34.0633 | 8 |
| 14 | 2.13 | 0.00095 | 0.0321 | 0.0759 | 0.01603 | 0.03795 | 0.016 | 0.038 | 0.0120 | 0.017 | 21.5425 | 33 |
| 15 | 0.99 | 4.00 × 10⁻⁵ | 0.0149 | 0.0032 | 0.00745 | 0.00160 | 0.007 | 0.002 | 0.2850 | 0.027 | 34.9745 | 7 |
| 16 | 1.77 | 0.00066 | 0.0266 | 0.0528 | 0.01332 | 0.02638 | 0.013 | 0.026 | 0.0172 | 0.015 | 18.5523 | 42 |
| 17 | 2.02 | 0.00074 | 0.0304 | 0.0591 | 0.01520 | 0.02953 | 0.015 | 0.030 | 0.0154 | 0.016 | 20.7907 | 36 |
| 18 | 0.91 | 2.50 × 10⁻⁵ | 0.0137 | 0.0020 | 0.00685 | 0.00100 | 0.007 | 0.001 | 0.4560 | 0.039 | 49.4814 | 4 |
| 19 | 1.58 | 0.00015 | 0.0238 | 0.0121 | 0.01189 | 0.00603 | 0.012 | 0.006 | 0.0755 | 0.017 | 21.9298 | 29 |
| 20 | 0.96 | 3.40 × 10⁻⁵ | 0.0145 | 0.0027 | 0.00723 | 0.00136 | 0.007 | 0.001 | 0.3353 | 0.031 | 39.1791 | 6 |
| 21 | 1.11 | 1.14 × 10⁻⁵ | 0.0167 | 0.0009 | 0.00835 | 0.00045 | 0.008 | 0.000 | 1.0000 | 0.078 | 100.0000 | 1 |
| 22 | 1.51 | 0.00012 | 0.0227 | 0.0093 | 0.01137 | 0.00467 | 0.011 | 0.005 | 0.0974 | 0.018 | 23.2169 | 25 |
| 23 | 1.1 | 4.63 × 10⁻⁵ | 0.0166 | 0.0037 | 0.00828 | 0.00185 | 0.008 | 0.002 | 0.2462 | 0.026 | 32.5675 | 10 |
| 24 | 1.59 | 0.00016 | 0.0239 | 0.0129 | 0.01197 | 0.00643 | 0.012 | 0.006 | 0.0708 | 0.017 | 21.6070 | 32 |
| 25 | 2.04 | 0.00079 | 0.0307 | 0.0634 | 0.01535 | 0.03169 | 0.015 | 0.032 | 0.0144 | 0.016 | 20.8893 | 34 |
| 26 | 1.24 | 6.45 × 10⁻⁵ | 0.0187 | 0.0051 | 0.00933 | 0.00257 | 0.009 | 0.003 | 0.1767 | 0.022 | 27.7066 | 14 |
| 27 | 1.84 | 0.00072 | 0.0277 | 0.0571 | 0.01385 | 0.02854 | 0.014 | 0.029 | 0.0159 | 0.015 | 19.1088 | 38 |
| 28 | 1.47 | 0.00011 | 0.0221 | 0.0089 | 0.01106 | 0.00443 | 0.011 | 0.004 | 0.1027 | 0.018 | 23.3029 | 24 |
| 29 | 1.32 | 8.72 × 10⁻⁵ | 0.0199 | 0.0070 | 0.00994 | 0.00348 | 0.010 | 0.003 | 0.1307 | 0.019 | 24.3654 | 17 |
| 30 | 2.18 | 0.00104 | 0.0328 | 0.0829 | 0.01641 | 0.04147 | 0.016 | 0.041 | 0.0110 | 0.017 | 21.9324 | 28 |
| 31 | 1.65 | 0.00031 | 0.0248 | 0.0250 | 0.01242 | 0.01249 | 0.012 | 0.012 | 0.0364 | 0.015 | 19.1120 | 37 |
| 32 | 1.43 | 0.00011 | 0.0215 | 0.0084 | 0.01076 | 0.00419 | 0.011 | 0.004 | 0.1086 | 0.018 | 23.4428 | 23 |
| 33 | 1.26 | 8.47 × 10⁻⁵ | 0.0190 | 0.0068 | 0.00948 | 0.00338 | 0.009 | 0.003 | 0.1346 | 0.019 | 24.1334 | 20 |
| 34 | 1.54 | 0.00014 | 0.0232 | 0.0114 | 0.01159 | 0.00571 | 0.012 | 0.006 | 0.0797 | 0.017 | 21.9227 | 30 |
| 35 | 1.36 | 0.00036 | 0.0205 | 0.0284 | 0.01024 | 0.01421 | 0.010 | 0.014 | 0.0320 | 0.012 | 15.9317 | 46 |
| 36 | 1.19 | 4.76 × 10⁻⁵ | 0.0179 | 0.0038 | 0.00896 | 0.00190 | 0.009 | 0.002 | 0.2395 | 0.026 | 32.8318 | 9 |
| 37 | 1.68 | 0.00065 | 0.0253 | 0.0520 | 0.01264 | 0.02602 | 0.013 | 0.026 | 0.0175 | 0.014 | 17.7086 | 45 |
| 38 | 0.81 | 2.14 × 10⁻⁵ | 0.0122 | 0.0017 | 0.00610 | 0.00085 | 0.006 | 0.001 | 0.5327 | 0.043 | 55.3729 | 2 |
| 39 | 0.85 | 2.34 × 10⁻⁵ | 0.0128 | 0.0019 | 0.00640 | 0.00093 | 0.006 | 0.001 | 0.4872 | 0.040 | 51.6900 | 3 |
| 40 | 1.32 | 9.38 × 10⁻⁵ | 0.0199 | 0.0075 | 0.00994 | 0.00374 | 0.010 | 0.004 | 0.1215 | 0.018 | 23.5436 | 21 |
| 41 | 2.29 | 0.00141 | 0.0345 | 0.1121 | 0.01724 | 0.05607 | 0.017 | 0.056 | 0.0081 | 0.018 | 22.7343 | 27 |
| 42 | 1.28 | 8.53 × 10⁻⁵ | 0.0193 | 0.0068 | 0.00963 | 0.00340 | 0.010 | 0.003 | 0.1336 | 0.019 | 24.2410 | 19 |
| 43 | 1.36 | 9.06 × 10⁻⁵ | 0.0205 | 0.0072 | 0.01024 | 0.00362 | 0.010 | 0.004 | 0.1258 | 0.019 | 24.3115 | 18 |
| 44 | 1.19 | 6.73 × 10⁻⁵ | 0.0179 | 0.0054 | 0.00896 | 0.00269 | 0.009 | 0.003 | 0.1694 | 0.021 | 26.5692 | 15 |
| 45 | 1.15 | 5.61 × 10⁻⁵ | 0.0173 | 0.0045 | 0.00866 | 0.00224 | 0.009 | 0.002 | 0.2032 | 0.023 | 29.2057 | 11 |
| 46 | 1.66 | 0.00049 | 0.0250 | 0.0394 | 0.01249 | 0.01972 | 0.012 | 0.020 | 0.0231 | 0.014 | 18.0160 | 44 |
| Ton | Toff | V | I | Tool | Predicted | Experimental | ||
|---|---|---|---|---|---|---|---|---|
| MRR | TWR | MRR | TWR | |||||
| 60 | 60 | 7 | 12 | Brass | 1.11 | 1.14 × 10⁻⁵ | 1.03 | 0.00103 |
| 60 | 60 | 7 | 12 | SS-304 | 1.36 | 0.000091 | 1.52 | 0.000098 |
| 60 | 60 | 7 | 12 | Cu | 1.66 | 0.000125 | 1.79 | 0.000137 |
| Tool Material | Surface Roughness |
|---|---|
| SS-304 | 3.19 |
| Brass | 2.96 |
| Copper | 2.67 |
Disclaimer/Publisher’s Note: The statements, opinions and data contained in all publications are solely those of the individual author(s) and contributor(s) and not of MDPI and/or the editor(s). MDPI and/or the editor(s) disclaim responsibility for any injury to people or property resulting from any ideas, methods, instructions or products referred to in the content. |
© 2023 by the authors. Licensee MDPI, Basel, Switzerland. This article is an open access article distributed under the terms and conditions of the Creative Commons Attribution (CC BY) license (https://creativecommons.org/licenses/by/4.0/).
Share and Cite
Abbas, A.T.; Sharma, N.; Alsuhaibani, Z.A.; Sharma, V.S.; Soliman, M.S.; Sharma, R.C. Processing of Al/SiC/Gr Hybrid Composite on EDM by Different Electrode Materials Using RSM-COPRAS Approach. Metals 2023, 13, 1125. https://doi.org/10.3390/met13061125
Abbas AT, Sharma N, Alsuhaibani ZA, Sharma VS, Soliman MS, Sharma RC. Processing of Al/SiC/Gr Hybrid Composite on EDM by Different Electrode Materials Using RSM-COPRAS Approach. Metals. 2023; 13(6):1125. https://doi.org/10.3390/met13061125
Chicago/Turabian StyleAbbas, Adel T., Neeraj Sharma, Zeyad A. Alsuhaibani, Vishal S. Sharma, Mahmoud S. Soliman, and Rakesh Chandmal Sharma. 2023. "Processing of Al/SiC/Gr Hybrid Composite on EDM by Different Electrode Materials Using RSM-COPRAS Approach" Metals 13, no. 6: 1125. https://doi.org/10.3390/met13061125