Article

Multi-Objective Lightweight Optimization Design of the Aluminium Alloy Front Subframe of a Vehicle

1
School of Mechanical and Transportation Engineering, Guangxi University of Science and Technology, Liuzhou 545006, China
2
Guangxi Earthmoving Machinery Collaborative Innovation Center, Liuzhou 545006, China
3
Guangxi Key Laboratory of Automobile Components and Vehicle Technology, Guangxi University of Science and Technology, Liuzhou 545006, China
4
Liuzhou Wuling New Energy Automobile Co., Ltd., Liuzhou 545007, China
*
Author to whom correspondence should be addressed.
Metals 2023, 13(4), 705; https://doi.org/10.3390/met13040705
Submission received: 3 March 2023 / Revised: 28 March 2023 / Accepted: 30 March 2023 / Published: 4 April 2023

Abstract

:
The aluminium alloy front subframe of an automobile was developed through multi-operating condition topology optimization and multi-objective optimization methods. By considering the influences of loads on the strength, static stiffness, and modal of the aluminium alloy front subframe under typical operating conditions, the performance parameters of the aluminium alloy front subframe after topology optimization were obtained. After topology optimization was performed, the parametric model of the aluminium alloy front subframe was established. Based on the Isight optimization platform, sample points were generated with the optimal Latin hypercube test method, and the response surface approximate model was constructed. The minimum mass and maximum first-order frequency were taken as the objectives, the stress under typical working conditions did not exceed the set target value, and the maximum displacement of the installation point was taken as the constraint condition. The multi-objective particle swarm optimization algorithm was used to optimize the aluminium alloy front subframe. The error of the free modal and finite element free modal analysis of the aluminium alloy front subframe samples was less than 15%. The optimized aluminium alloy front subframe was 2.4 kg lighter than the original subframe under the premise of satisfying various performance indices, and the lightweight rate was up to 12%.

1. Introduction

The subframe is an auxiliary device connecting the suspension connector and the body. It is an important part of the chassis. The traditional subframe is made of steel, which undoubtedly increases the weight of the whole vehicle. Studies have shown that for every 100 kg reduction in the vehicle weight, fuel consumption will be reduced by approximately 0.4 L per 100 km, and CO2 emissions will be reduced by 8 to 11 g [1]. With the rise of new energy vehicles, an increasing number of automobile enterprises have begun to use aluminium alloy subframes. Using aluminium alloy subframes not only improves vehicle handling and stability but also reduces the weight of the vehicle. The production mode of aluminium alloy subframes mainly includes the extruded profile welding type and casting type. In recent years, many scholars have performed research on the development of subframes and have obtained some research results. Li et al. [1] proposed a subframe topology optimization method from a conceptual design to a detailed design, which further reduced the overall subframe weight, met the requirements of stiffness and natural frequency, passed the durability requirements, and, finally, reduced the subframe mass from the initial structure of 82.6 kg to 21.4 kg. Kim et al. [2] proposed a subframe method based on topology optimization, which took the bar section and stiffness value as the design variables to simultaneously optimize the topology and shape of the subframe. Ali and Fraser [3] used the finite element method to analyse a certain subframe of a Chevrolet vehicle, used LS-DYNA commercial software to model the subframe, analysed the subframe under normal driving conditions and vehicle collision conditions, and established the appropriate subframe material by comparison with the performance of the original subframe of the vehicle. Nam et al. [4] proposed a fatigue life evaluation technology for the aluminium subframes of automobiles. Based on the virtual test simulation technology of the nonlinear suspension component model, this technology can effectively predict the fatigue life of the vehicle chassis structure. By testing an actual aluminium subframe, the accuracy of the model was verified. Lee et al. [5] optimized the shape and thickness of the subframe to meet the requirements of multidisciplinary design optimizations (MDOs) and meet the weight, fatigue, crash, NVH, and K & C performance requirements. The proposed method was also suitable for complex vehicle design problems. Oh et al. [6] developed a subframe using a hydraulic forming technology. To improve the stiffness of the suspension and reduce the maximum stress that affects the durability cycle life, they adopted a variety of optimization design techniques, shape, size, and topology optimization, and formed the shape of the optimized rear suspension through a hydraulic forming process. The effectiveness of this design method was proven by finite element commercial software. To improve the NVH performance of vehicles, Park et al. [7] studied the front subframe of the vehicle, optimized the dynamic stiffness of the suspension bushing of the subframe, analysed the advantages and disadvantages of the integral subframe with different total shapes, and proposed structural reinforcement and other methods to improve the overall NVH performance of the vehicle. Hur and Lee [8] designed an integrated method for pre-tests, modelled associations and updated analyses of automobile subframes, evaluated model correlations by combining modal parameters of modal tests and finite element analyses, and analysed changes in the natural frequencies and MAC values of material characteristics based on sensitivity analysis results. The iterative method was used to modify the finite element model, and good results were obtained. Belingardi et al. [9] established the goals of strength, stiffness, and natural frequency of the subframe. The subframe designed using composite materials and optimizing the placement of stiffeners was superior to the steel subframe. Chiu Huang [10] designed a hydraulic moulding mould for the subframe, which could be used to achieve a lightweight subframe design. Han et al. [11] applied composite materials to the chassis component subframe, comparing the natural frequency and damping characteristics of steel and composite test pieces, achieving a certain improvement in stiffness, strength, and NVH performance of the composite subframe compared to the steel subframe, achieving a 50% weight reduction effect. Law et al. [12] proposed a new design method for the subframe after studying the subframe structure and design methods. The subframe structure designed using this method was superior in terms of lightness of weight and durability. Jang et al. [13] conducted a lightweight optimization design for the front subframe structure of a car. After optimization, while ensuring performance indicators, the optimized front subframe mass decreased by 30%, while verifying the practicality of the optimization design method. Fichera et al. [14] conducted theoretical calculation and analysis of the performance and load of the subframe, and then conducted topology optimization on the subframe structure, which resulted in a reasonable subframe structure. Rotondella et al. [15] constructed a subframe welding model and verified the reliability of the model through comparison of experiments and simulations. This method could predict structural dynamic characteristics. Da’Quan et al. [16] used ANSYS to study the topology optimization of the subframe under complex load conditions. The study found that the structural performance of the side member of the subframe was improved, while the weight of the subframe remained unchanged. Price et al. [17] designed a cast aluminium alloy subframe that reduced the weight by 40% while maintaining the same strength as the original subframe by optimizing weight and geometry. Liao et al. [18] designed a new high-strength steel subframe structure based on the stiffness and strength analysis of the subframe under various working conditions. Through comparative analysis of various performances with the original subframe, the feasibility of the new subframe was verified. Hamdi et al. [19] optimized the design of the subframe, which resulted in a significant improvement in NVH performance and a significant reduction in quality. Through verification, this method has made a positive contribution to improving vehicle NVH performance.
In this paper, an aluminium alloy front subframe envelope is first established based on the original steel front subframe, the topology optimization of the aluminium alloy front subframe envelope is carried out by the method of multi-condition topology optimization, and the optimal force path of the subframe is obtained. According to the topology optimization results in CATIA with regards to the detailed mathematical modelling design, its strength, stiffness, and modal performance analysis, the aluminium alloy front subframe performance indicators are obtained. Then, the aluminium alloy front subframe after topology optimization is used to establish a parametric model. Based on the Isight optimization platform, the optimal Latin hypercube test method is used to generate sample points [20], and an approximate response surface model of the aluminium alloy front subframe is constructed. Regarding a former deputy frame optimization design, the multi-objective particle swarm optimization algorithm is adopted for aluminium alloys. Through the analysis of the strength, static stiffness, and modal and fatigue durability, the performance of the aluminium alloy front subframe meets the design requirements, and the modal error of the aluminium alloy front subframe sample and the finite element analysis modal is less than 15%. Moreover, this model successfully passed the bench fatigue durability test.

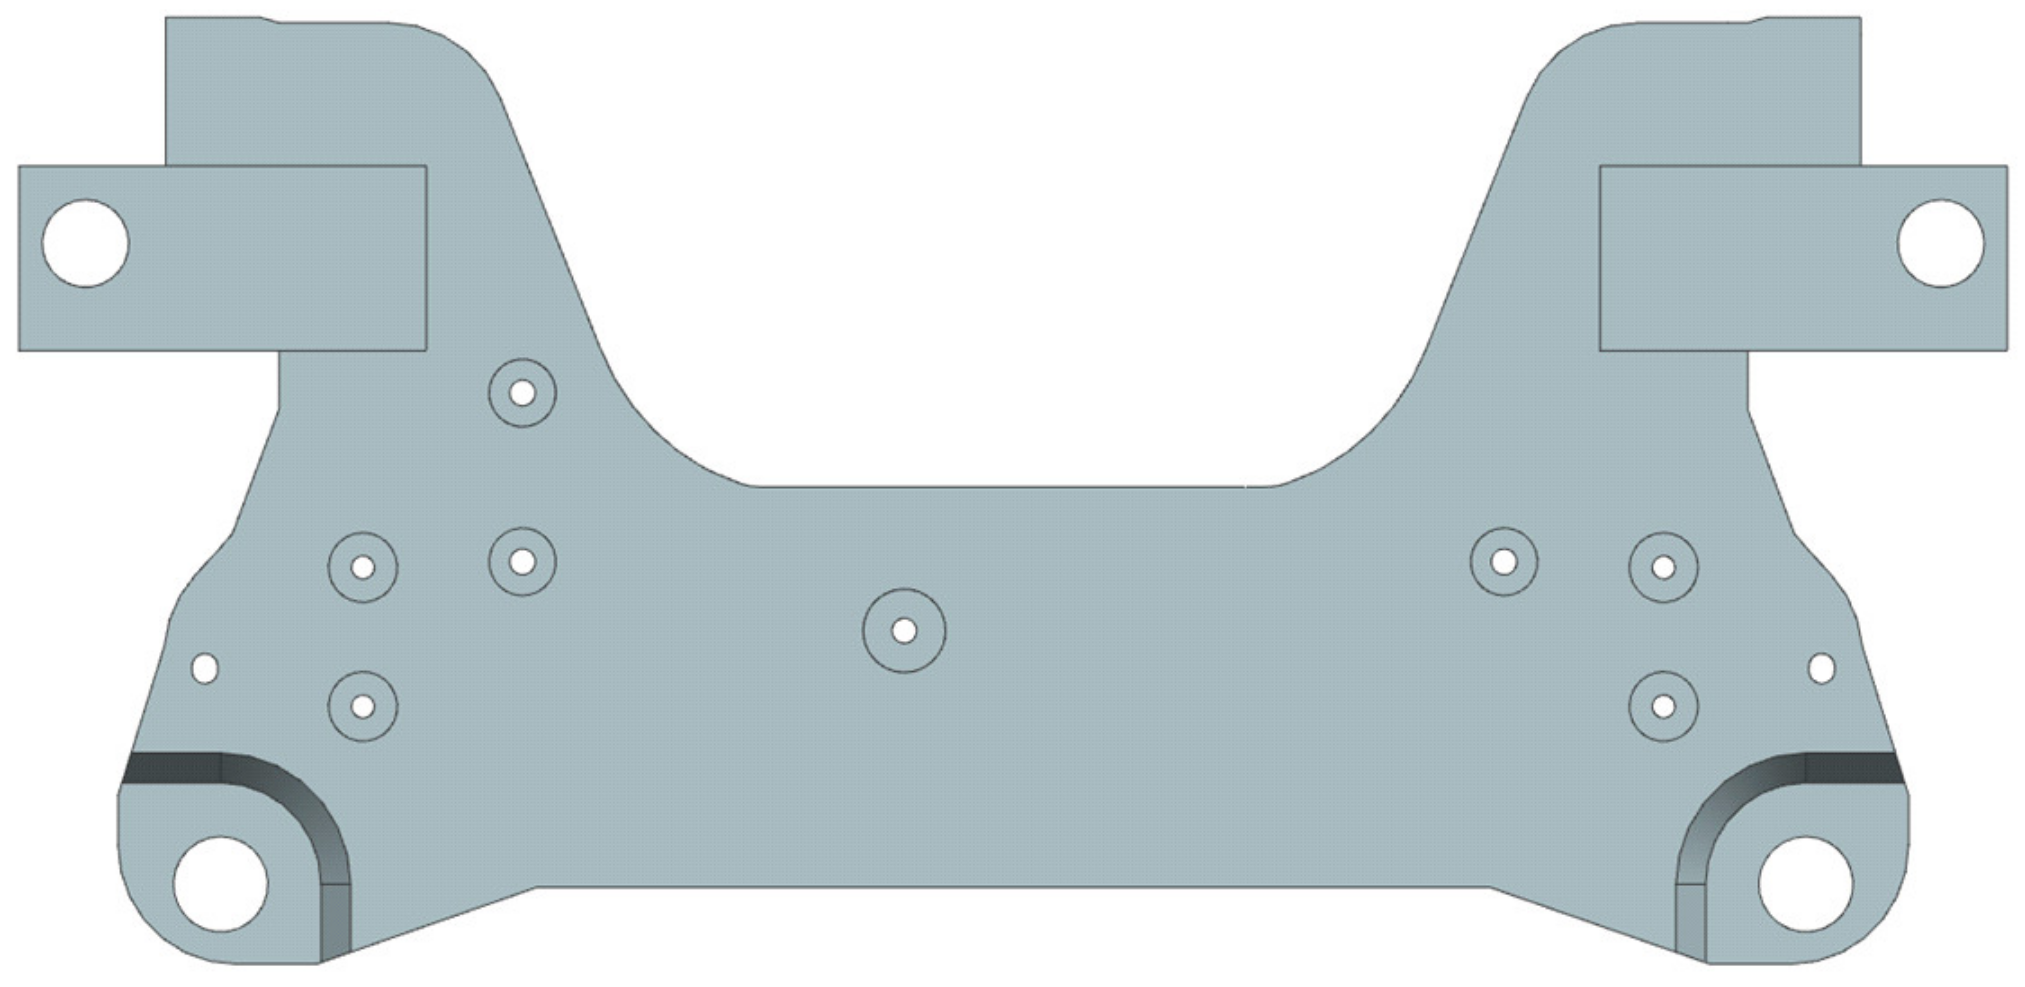
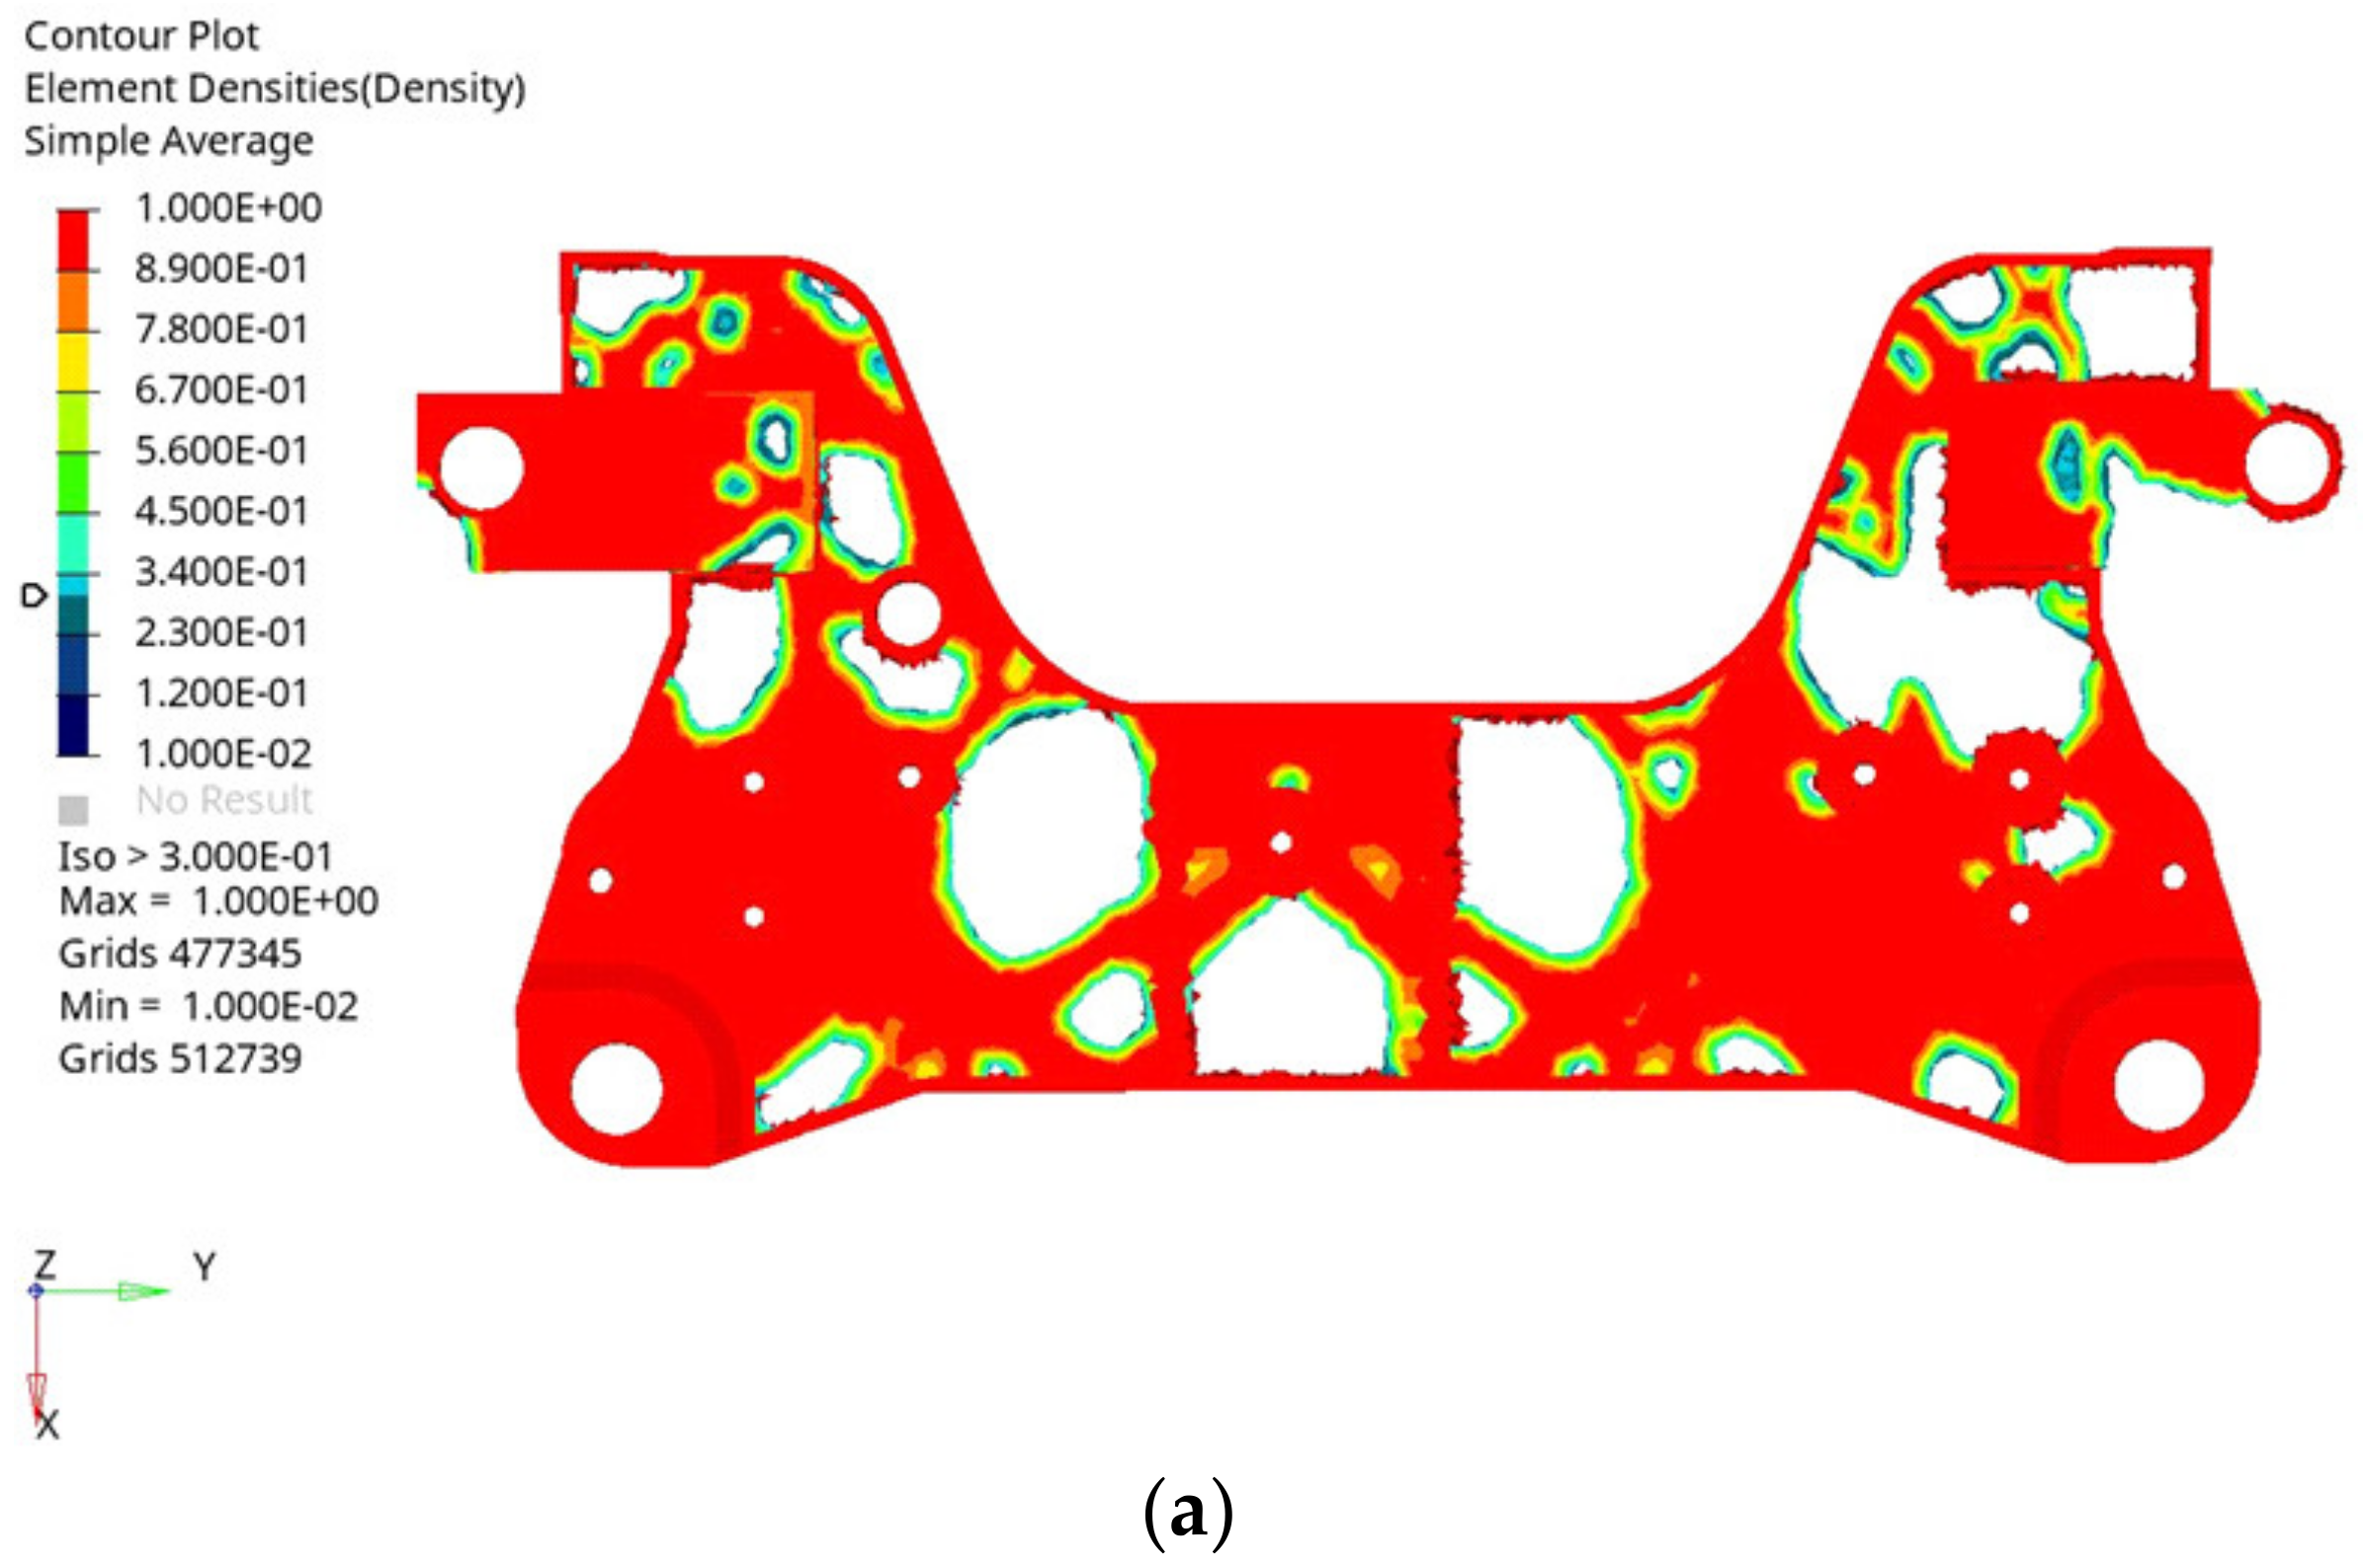
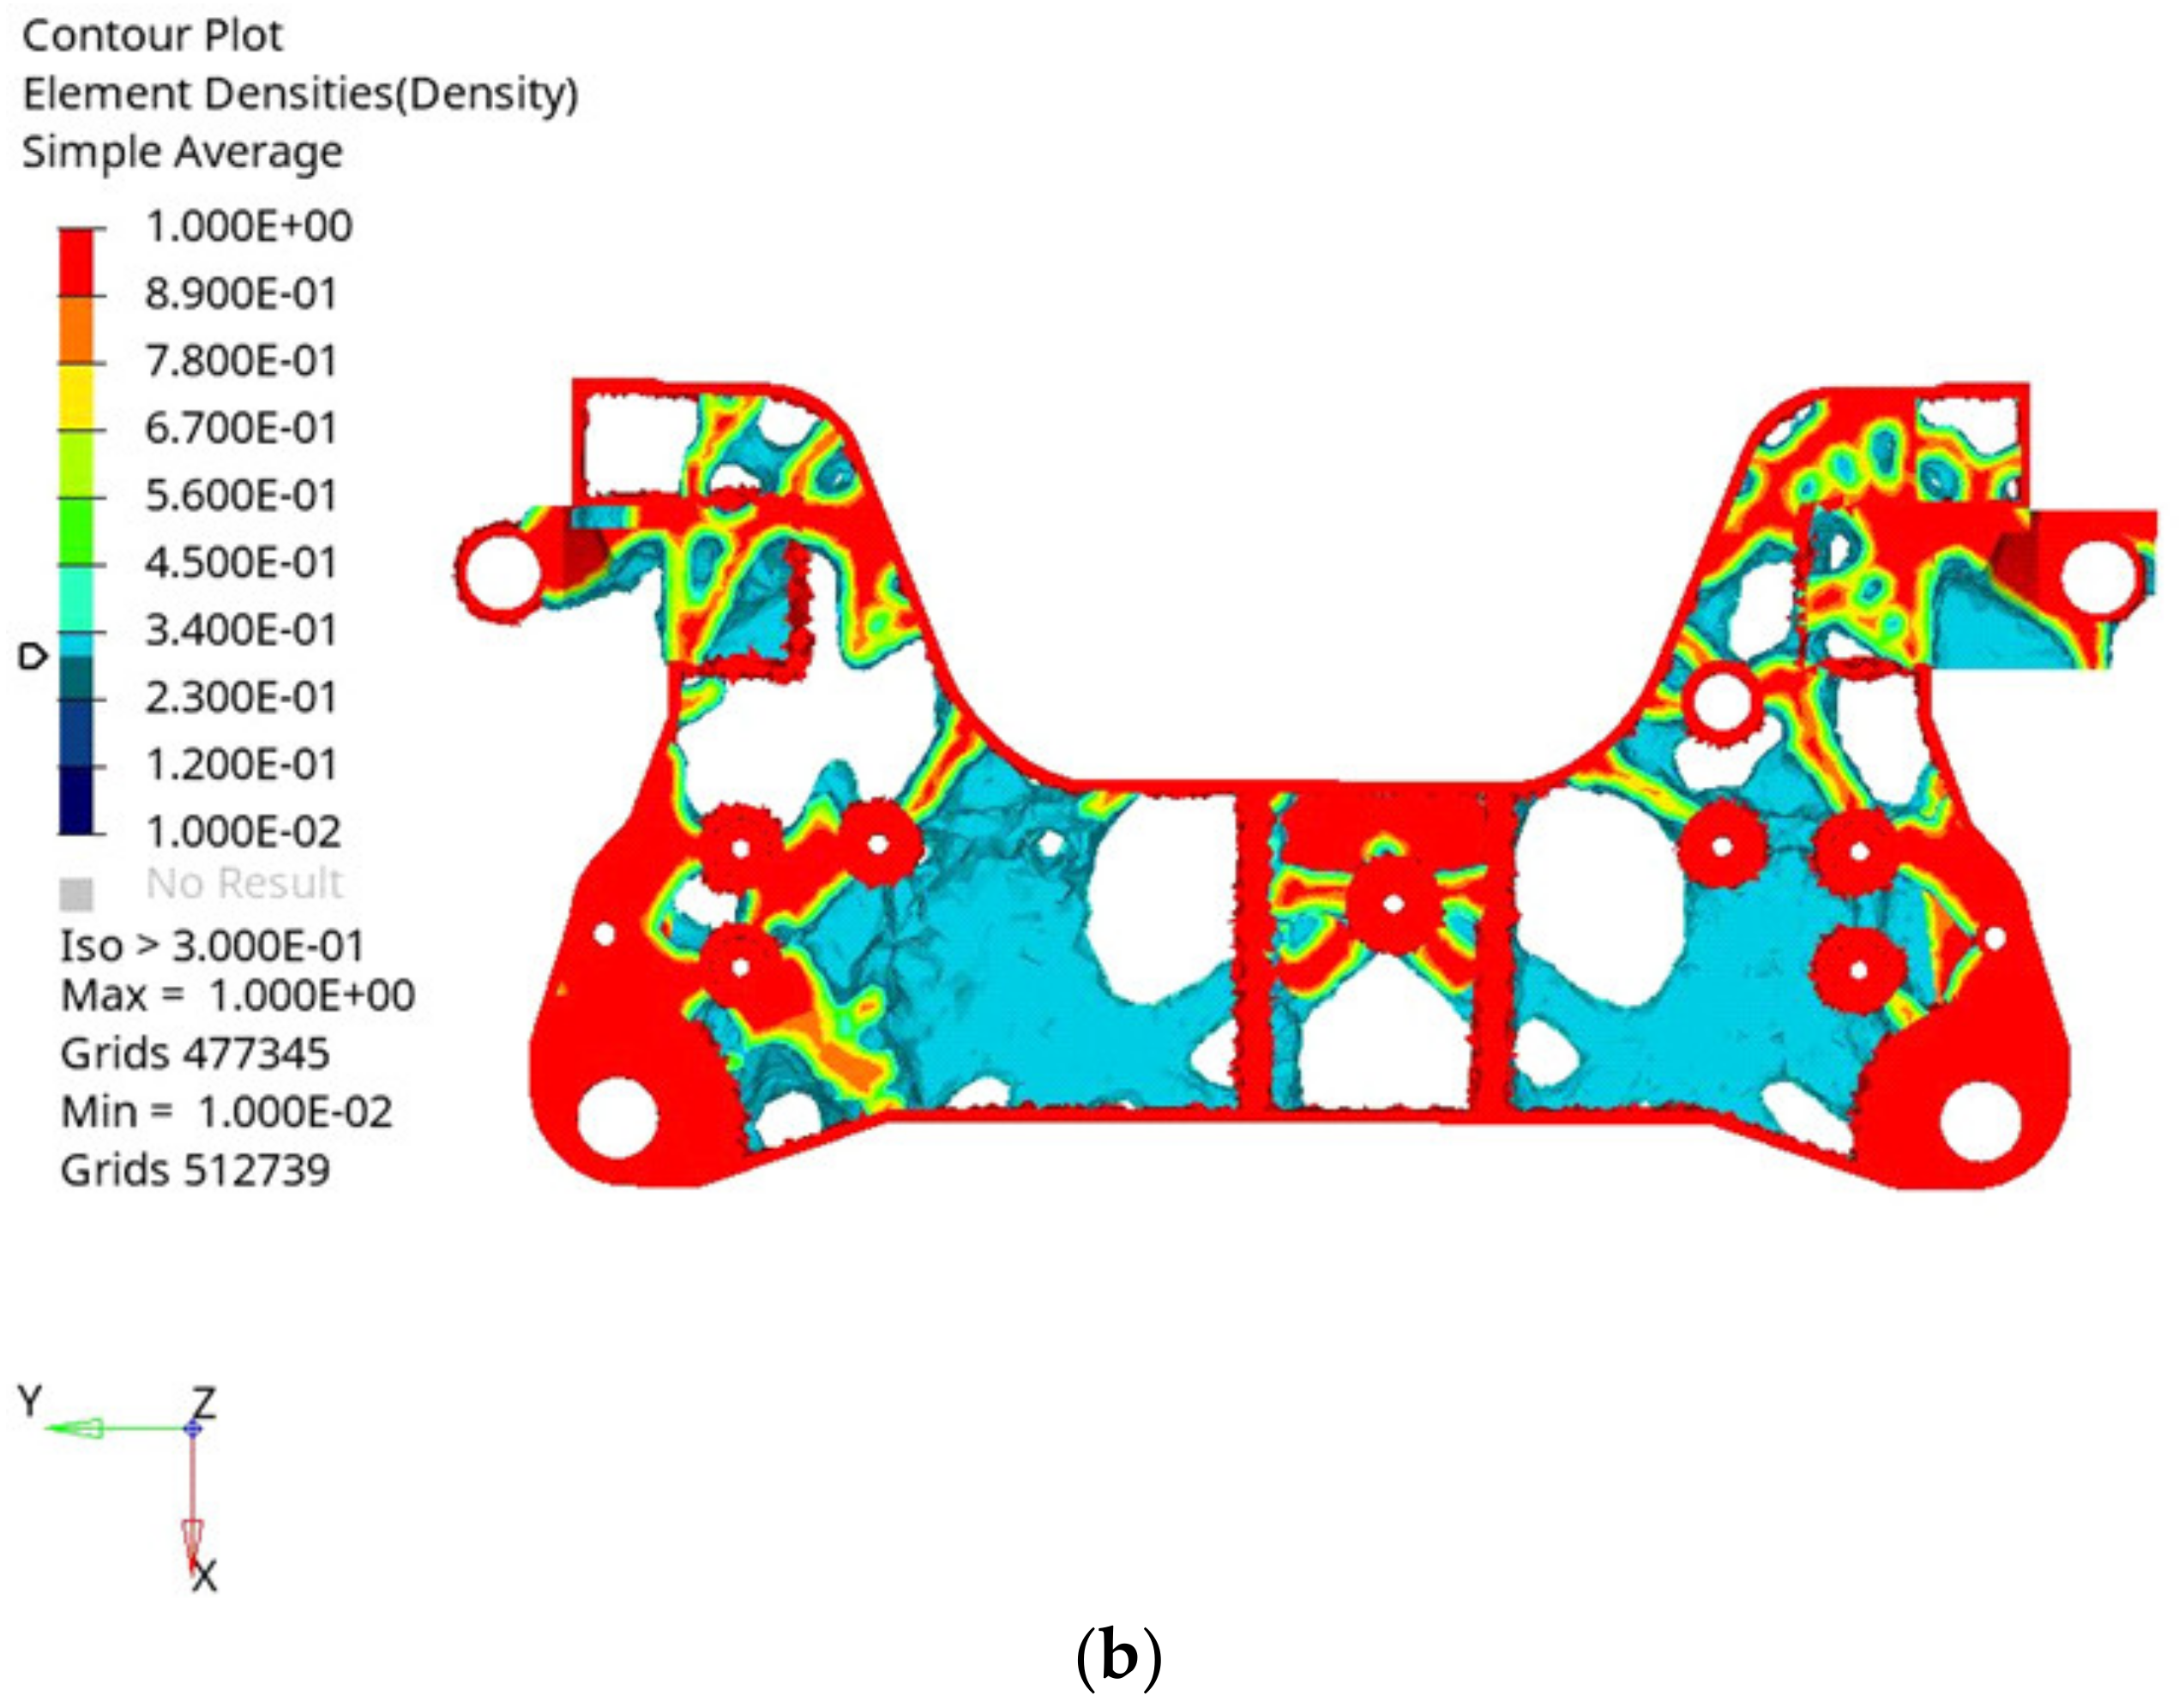
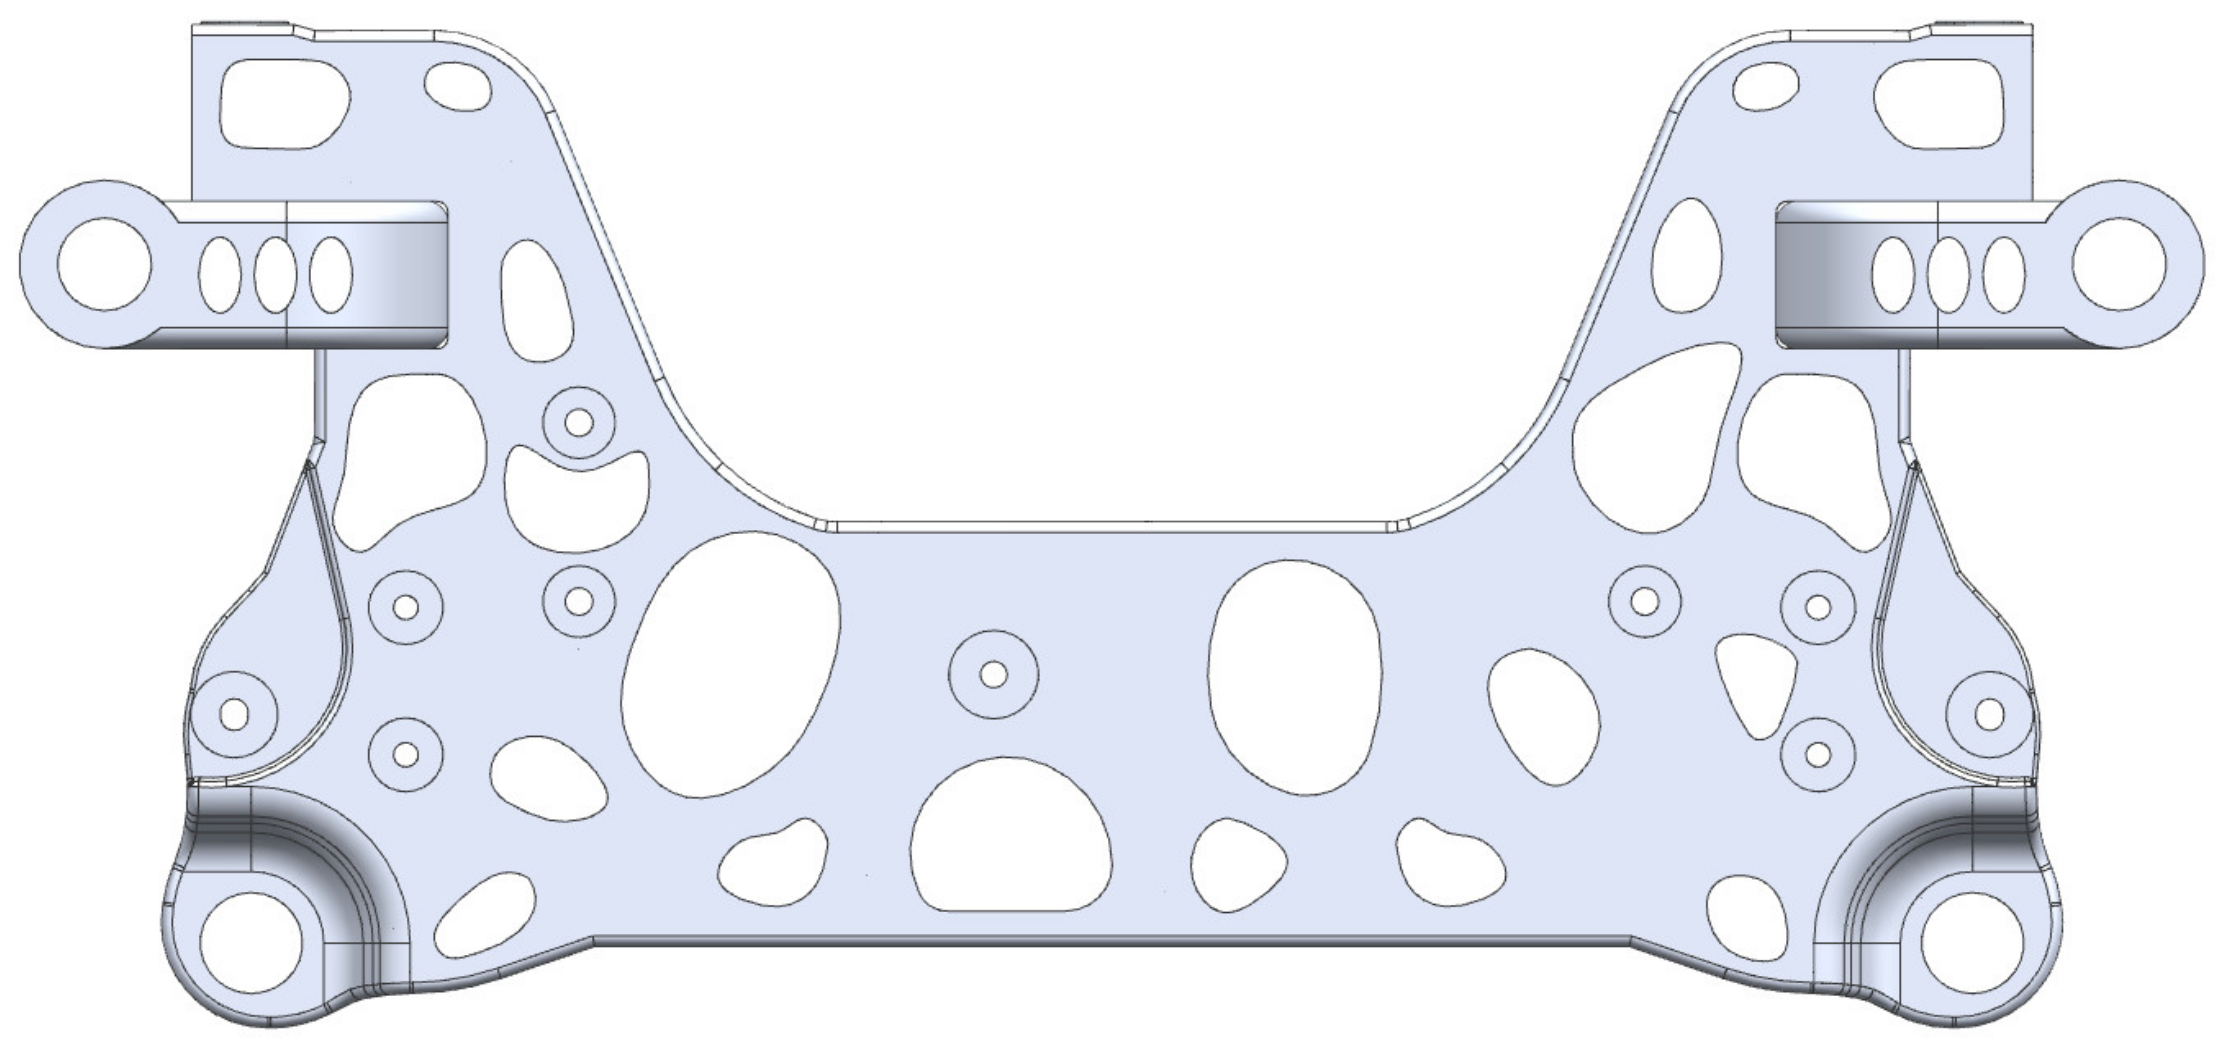
2. Multi-Condition Topology Optimization of the Aluminium Alloy front Subframe

The aluminium alloy front subframe envelope body is established based on the hard points of each subframe connection. The principle of establishing the aluminium alloy front subframe envelope body should ensure that there is no movement interference between the envelope body and the surrounding parts. The established envelope body is shown in Figure 1. The aluminium alloy material used is a ZL114A cast aluminium alloy with a density of 2.68 × 10⁻⁹ t/mm3, Poisson’s ratio of 0.33, elastic modulus of 7.24 × 10⁴ MPa, yield strength of 230 MPa, and tensile strength of 290 MPa.
The subframe will encounter various working conditions during use, so the influence of the various working conditions on the subframe structure should be comprehensively considered in exploitation and design. Regarding vice frames, the typical working conditions are the forward braking condition, backward braking condition, forward emergency braking condition, backward emergency braking condition, overconvex hull condition, over unilateral hull condition, over one side deep pit condition, ultimate steering condition, steering braking condition, steering drive condition, maximum driving acceleration condition, and diagonal torsion condition. The load information of each typical working condition extracted from the multibody dynamics analysis software Adams/car is summarized and used to check the strength of the aluminium alloy front subframe, as shown in Table 1. Due to space limitations, only part of the load information is shown here.
The topology optimization method based on the compromise programming method in Optistruct software is used to optimize the topology of the aluminium alloy front subframe under multiple working conditions. The compromise programming method solves the optimal solution of the multi-objective optimization problem by approximating the one-by-one objective function. It can not only deal with the relative importance of different objective functions, but also give the sensitivity analysis of the optimal strategy to each constraint condition. It can also weigh multiple objectives, avoiding the disadvantage of not considering other influencing factors in the single objective optimization. The volume percentage and weighted compliance are taken as the optimization response; the goal was to minimize the weighted compliance. The volume percentage is taken as the constraint condition, and the symmetric constraint and the process restriction of the unidirectional drawing die are introduced. Considering the influences of 12 typical working conditions on the topology optimization, the corresponding topology optimization model can be expressed as [11]:
min C ( ρ ) = k = 1 m w k q C k ( ρ ) C k min C k max C k min q 1 q s . t V ( ρ ) V 0 v o l f r a c c o n s = v o l f r a c g e o = s y m m e t r y σ max < [ σ ]
where C ( ρ ) is the objective function of comprehensive compliance; m is the total number of working conditions; w k is the weight value in the k t h working condition; C k ( ρ ) is the objective function of compliance under the k t h working condition; C k min and C k max are the minimum and maximum compliance values of the k t h working condition, respectively; V ( ρ ) is the volume after topology optimization; V 0 is the volume before topology optimization; v o l f r a c is the volume percentage; c o n s is the constraint condition; g e o is the geometric limit; s y m m e t r y is the symmetric constraint; σ max is the maximum stress under the ultimate load condition; and [ σ ] is the allowable stress of the material.
By dividing the aluminium alloy front subframe envelope into the design area and the non-design area, the minimum and maximum member sizes are set. The minimum member size should be more than 3 times the average mesh size of the model, and the maximum member size should be more than 2 times the minimum member size, in order to eliminate the excessive concentration of materials. Because the aluminium alloy front subframe envelope mesh size is 5 mm, here the minimum member size is set to 16 and the maximum member size is set to 40. After 21 iterations, the topology optimization results of the aluminium alloy front subframe envelope obtained when the threshold is adjusted to 0.3 are shown in Figure 2.
Based on the topology optimization results, according to the stress path of the aluminium alloy front subframe envelope and considering the position of the reinforcing bars, the detailed digital modelling design of the aluminium alloy front subframe is carried out in CATIA. The detailed design digital modelling of the aluminium alloy front subframe is shown in Figure 3. The weighing result of the aluminium alloy front subframe in CATIA is 18.55 kg.

3. Performance Analysis of the Aluminium Alloy Front Subframe

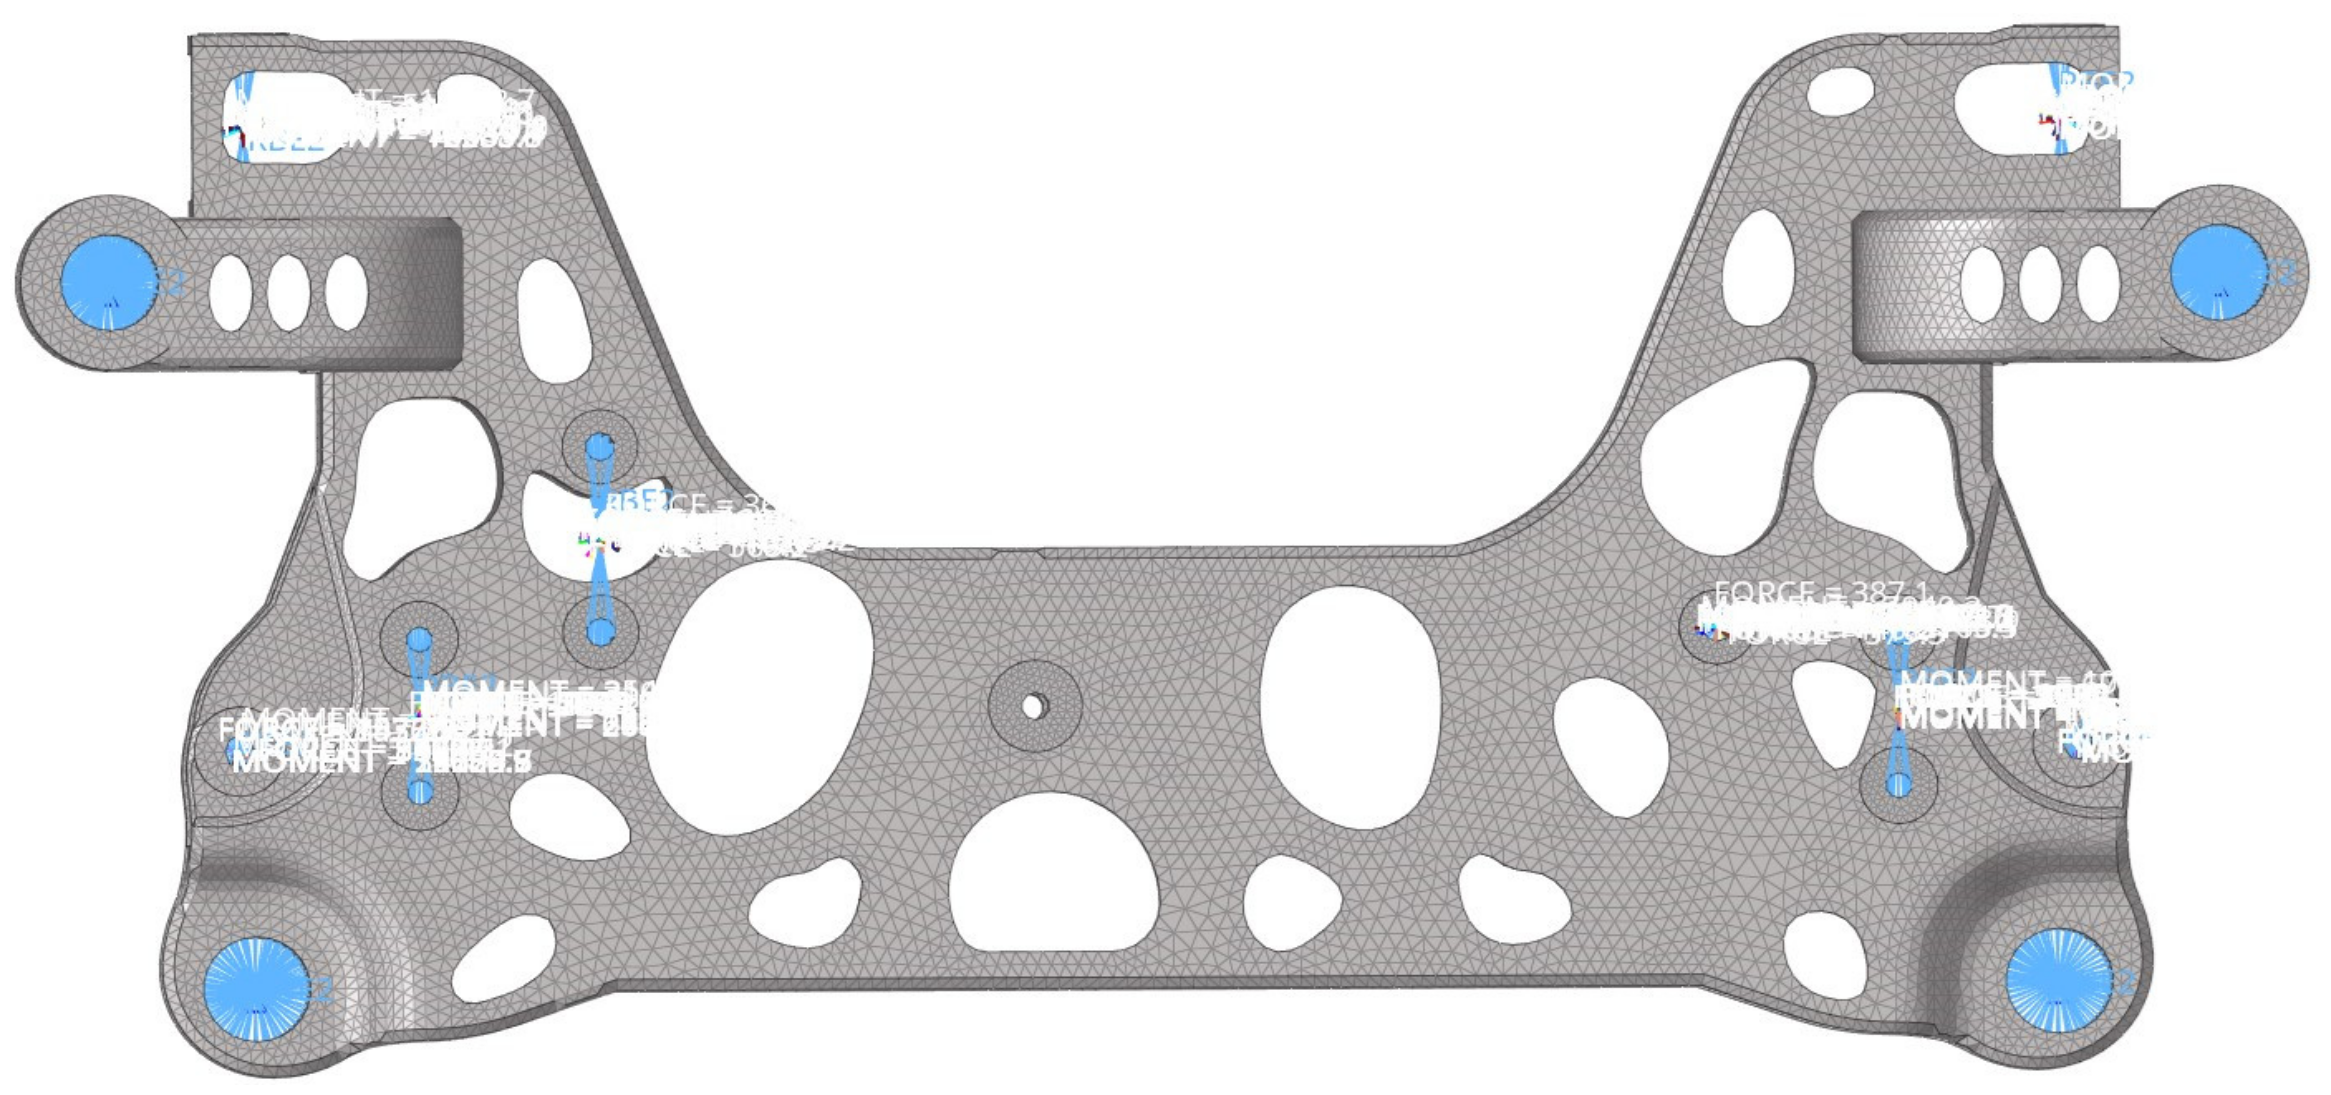
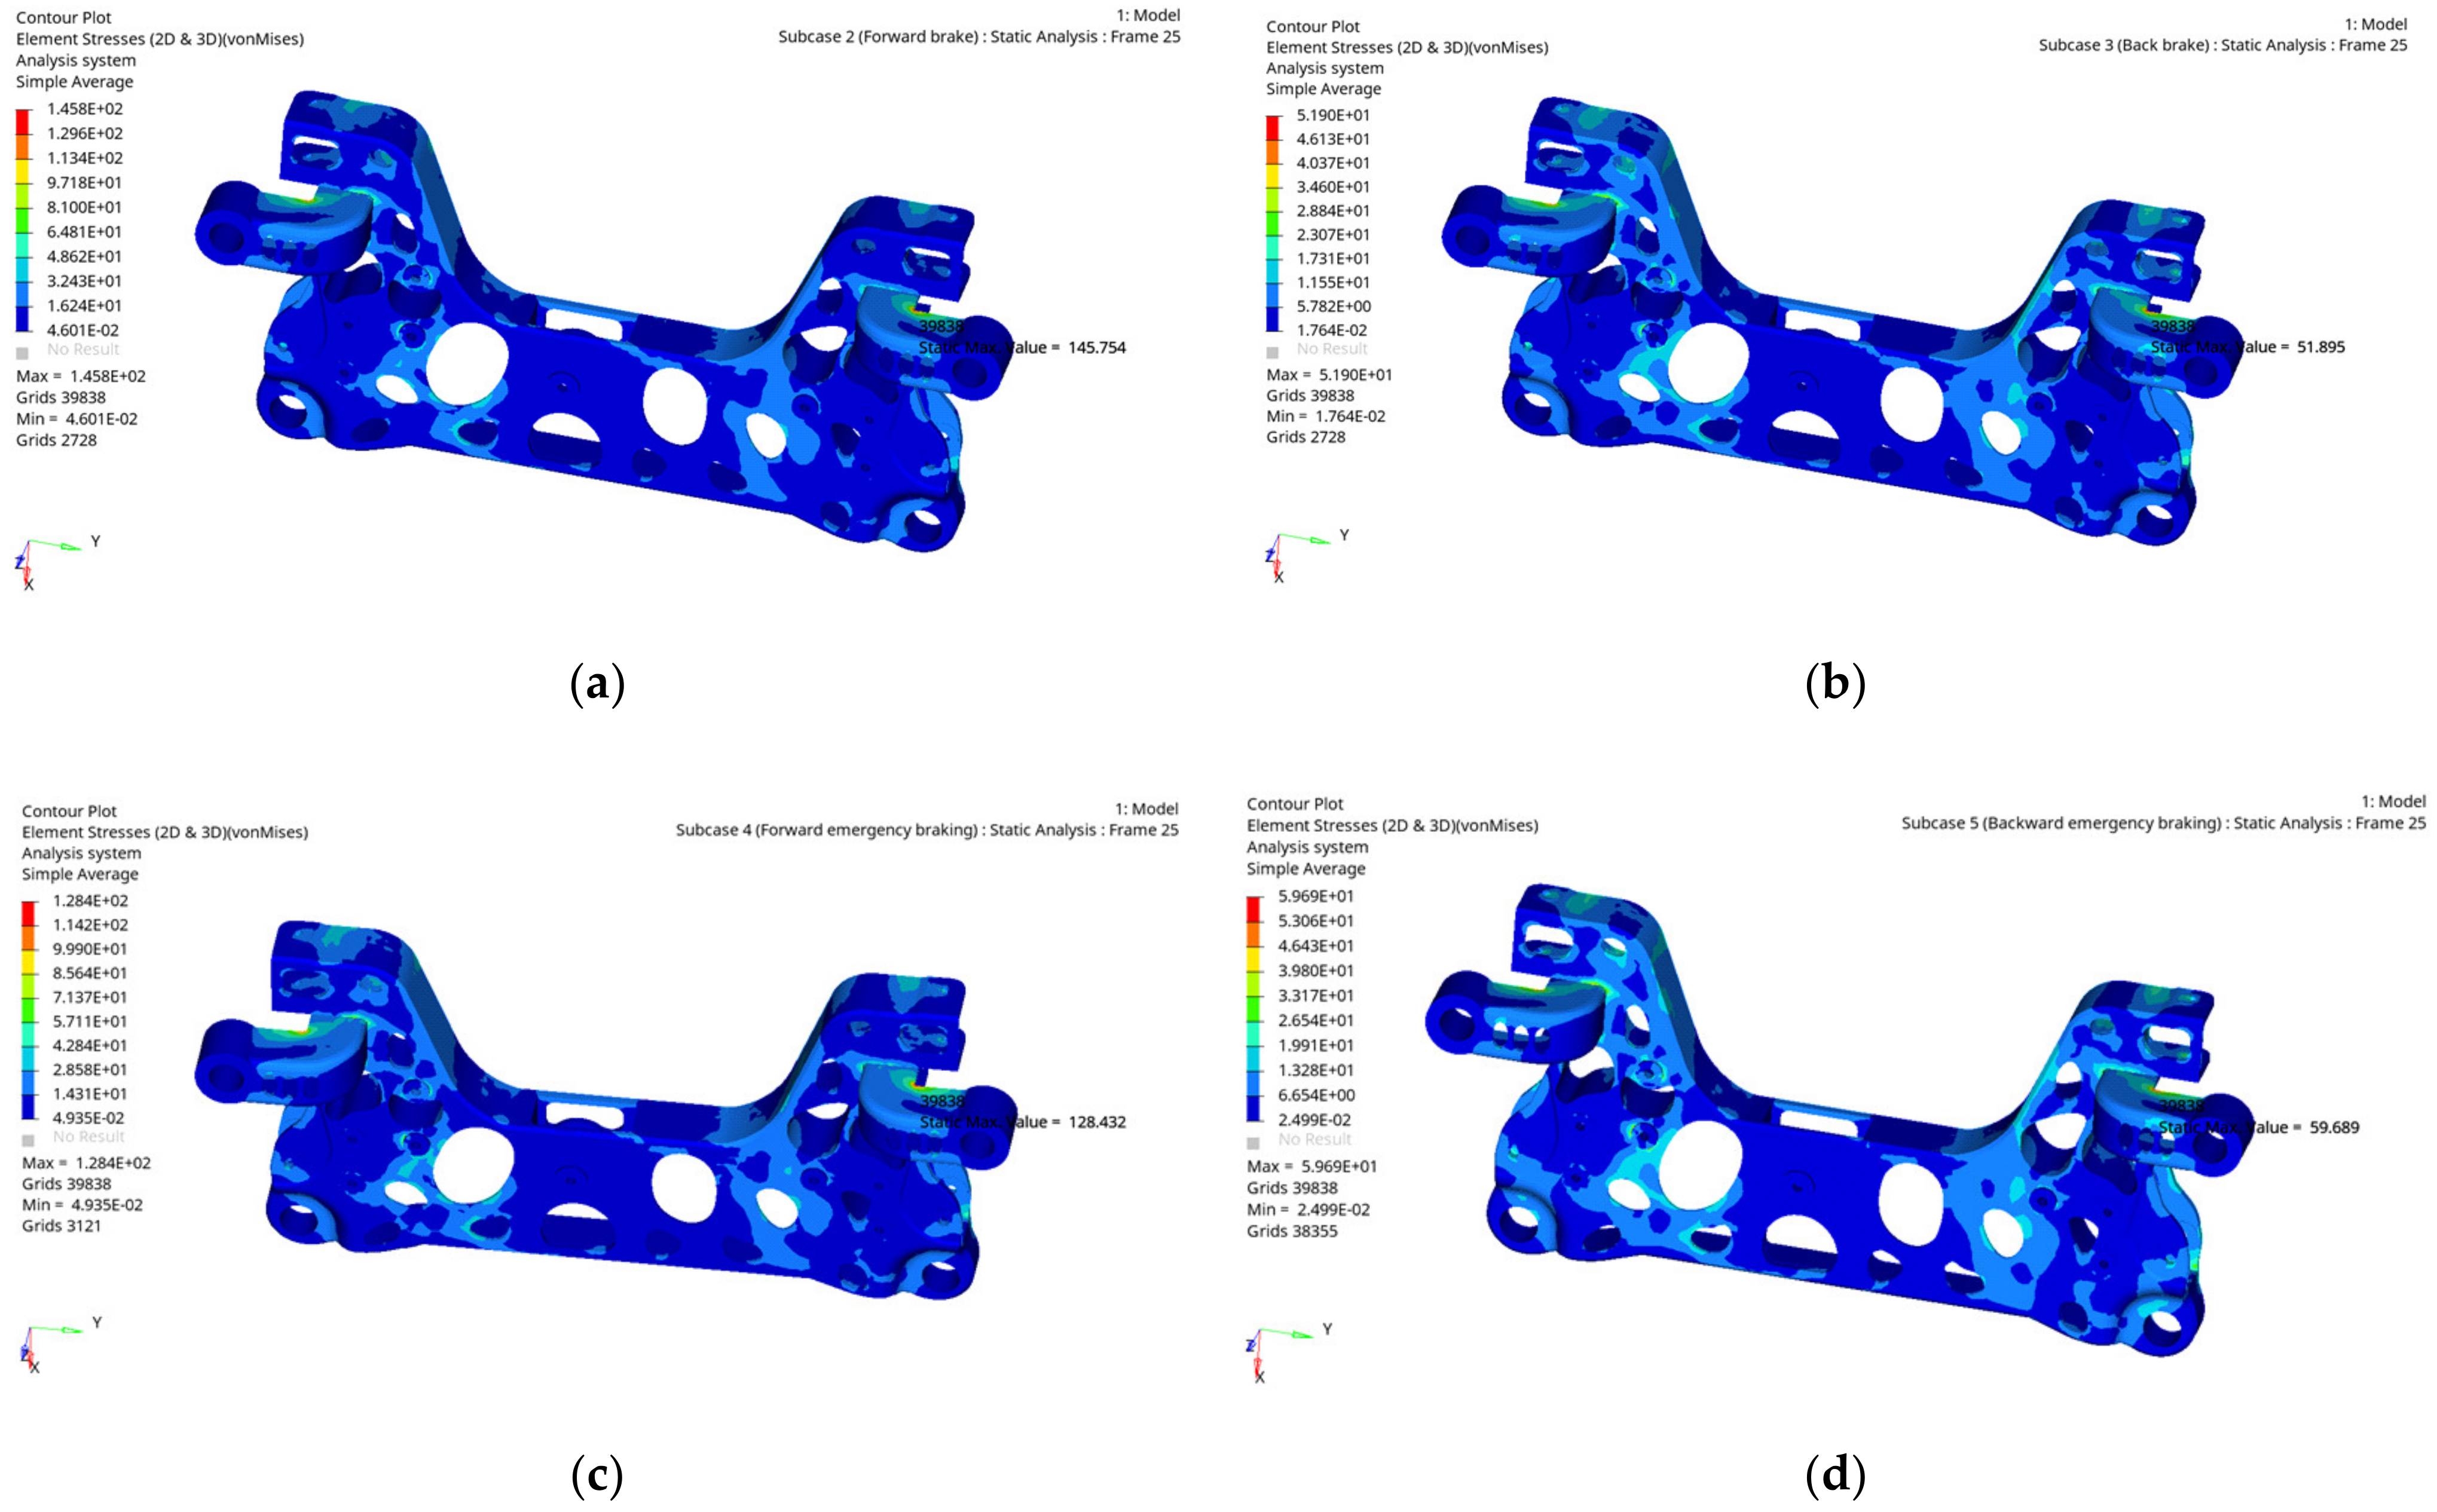
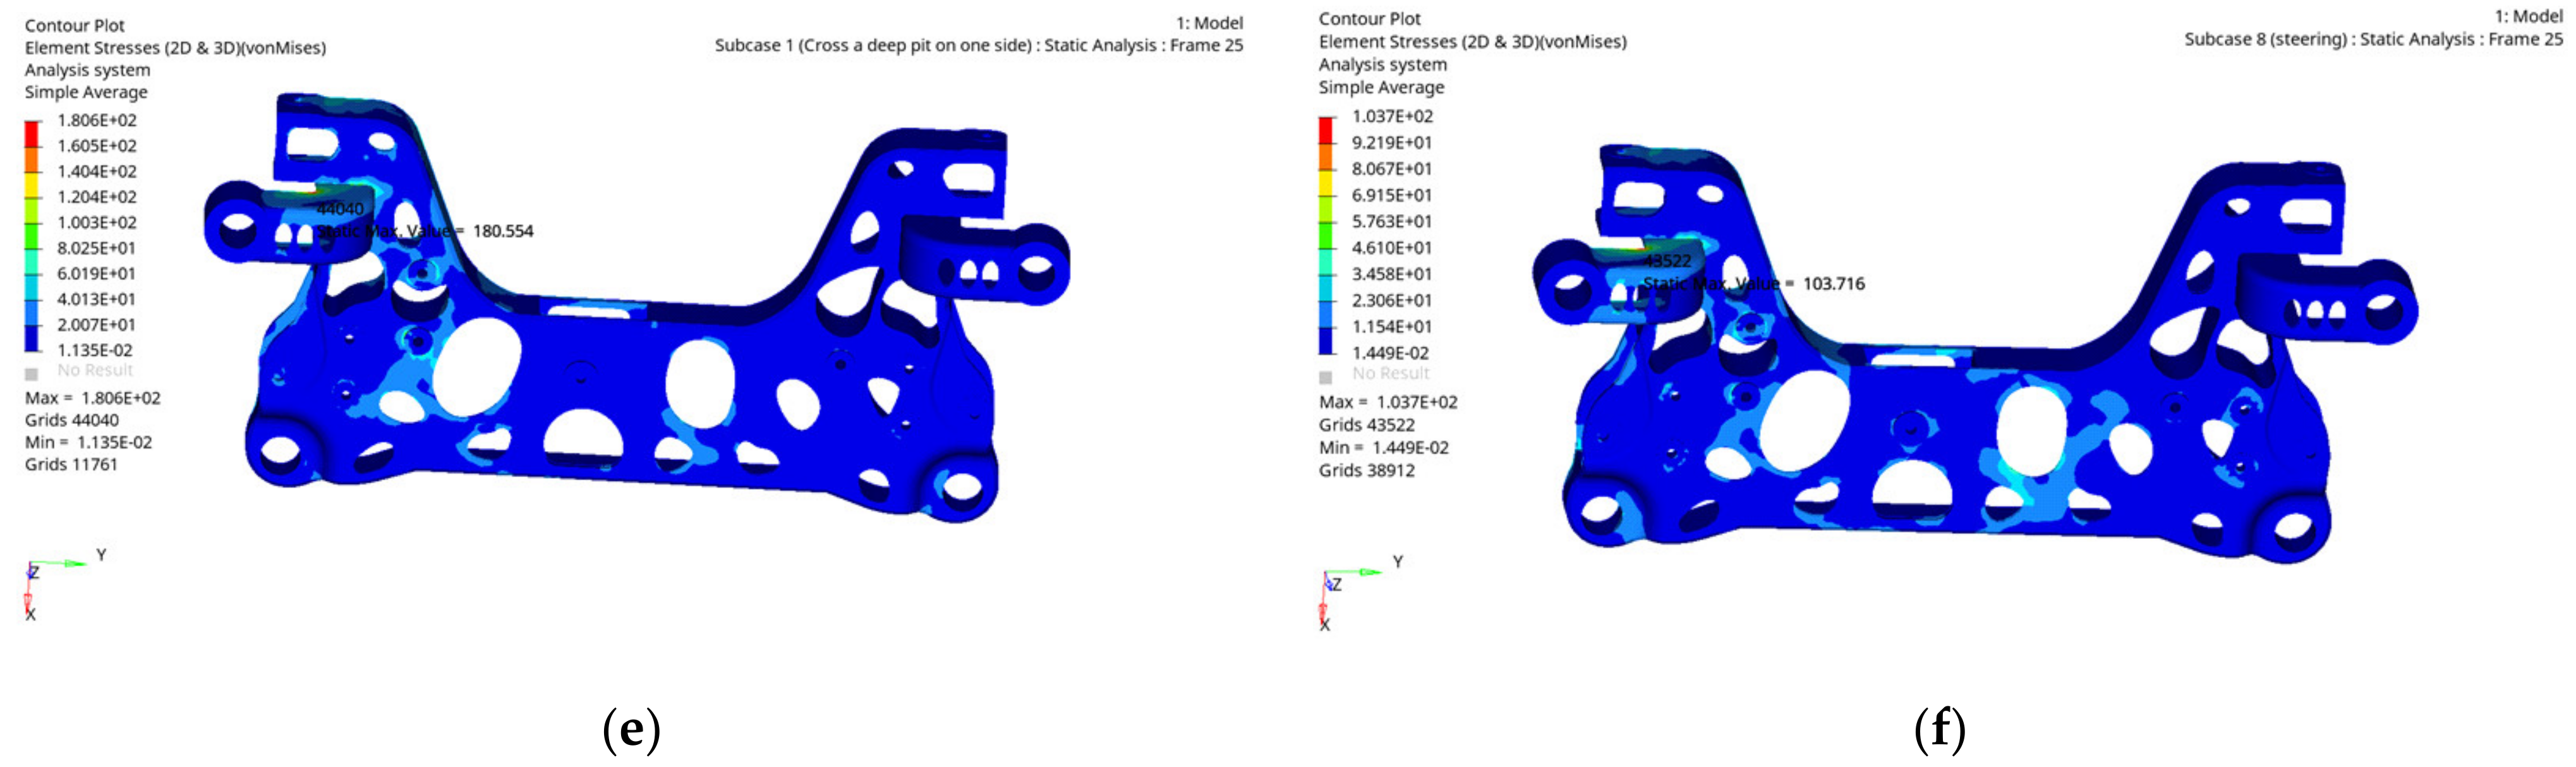
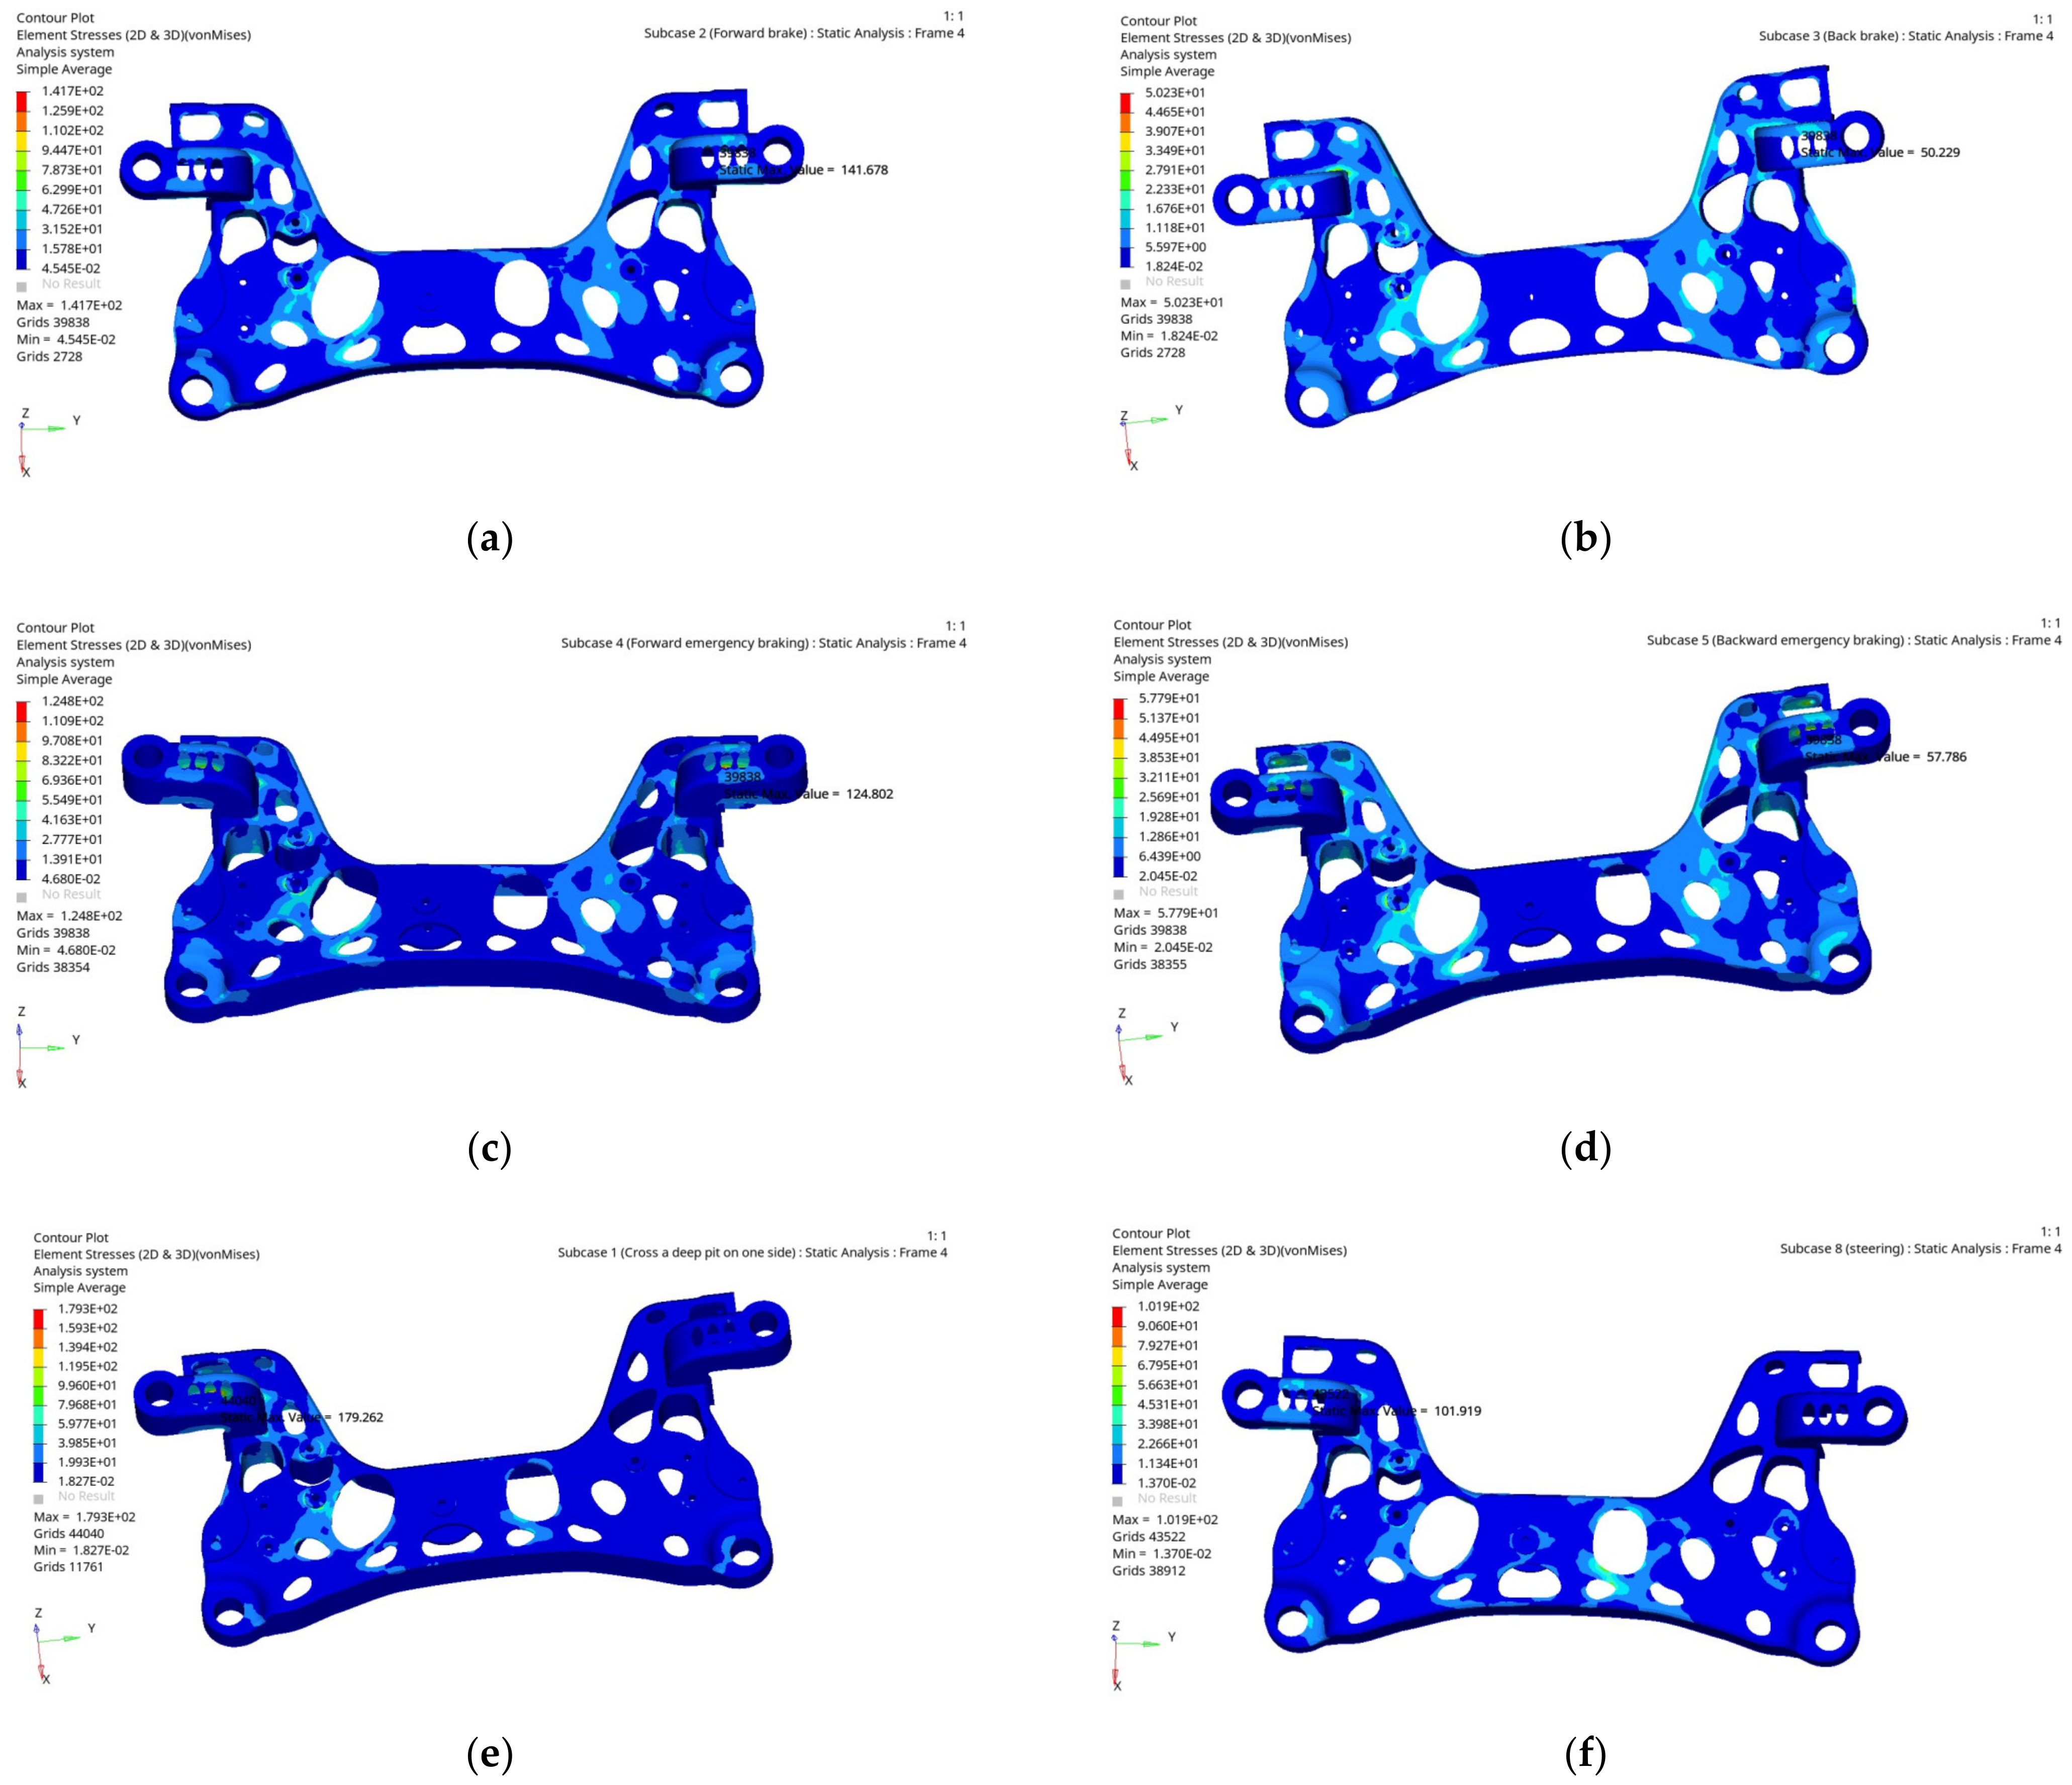
3.1. Strength Performance Analysis of the Aluminium Alloy Front Subframe

The strength performance of the aluminium alloy front subframe under each typical working condition is analysed according to the typical working condition load extracted by multibody dynamics. The establishment of displacement and load boundary conditions for the aluminium alloy front subframe is shown in Figure 4.
The analysis results are shown in Figure 5. Due to space limitations, only part of the stress analysis results of the aluminium alloy front subframe under typical working conditions are listed. According to the cloud diagram of the stress analysis results, it can be seen that the stress of the aluminium alloy front subframe under each typical working condition is the maximum when the aluminium alloy front subframe is under the one side deep pit condition. Moreover, the stress value is 180.6 MPa, which is far less than the material yield strength of 230 MPa and is within the safe range of the material. This shows that the aluminium alloy front subframe meets the strength performance requirements and has a large space for optimization.

3.2. Static Stiffness Performance Analysis of the Aluminium Alloy Front Subframe

As a bearing part, the aluminium alloy front subframe needs to meet certain static stiffness requirements. Thus, it is necessary to carry out static stiffness analysis on the aluminium alloy front subframe. The static stiffness can be calculated with the ratio of the load of the subframe to the deformation under the corresponding load, as shown in Equation (2):
K = F L
where K is the static stiffness value of the subframe, F is the load of the subframe at each connection hard point, and L is the deformation amount under the corresponding load.
In the static stiffness analysis of the aluminium alloy front subframe, the three translational degrees of freedom and three rotational degrees of freedom of the connection position between the aluminium alloy front subframe and the body are constrained. The load condition is a unit force of 1000 N in each of the three translational directions being applied to each installation point of the aluminium alloy front subframe. Table 2 summarizes the static stiffness analysis results at each mounting point of the aluminium alloy front subframe.
According to the static stiffness analysis results of each installation point, the static stiffness of the aluminium alloy front subframe at each installation point reaches and exceeds the target value.

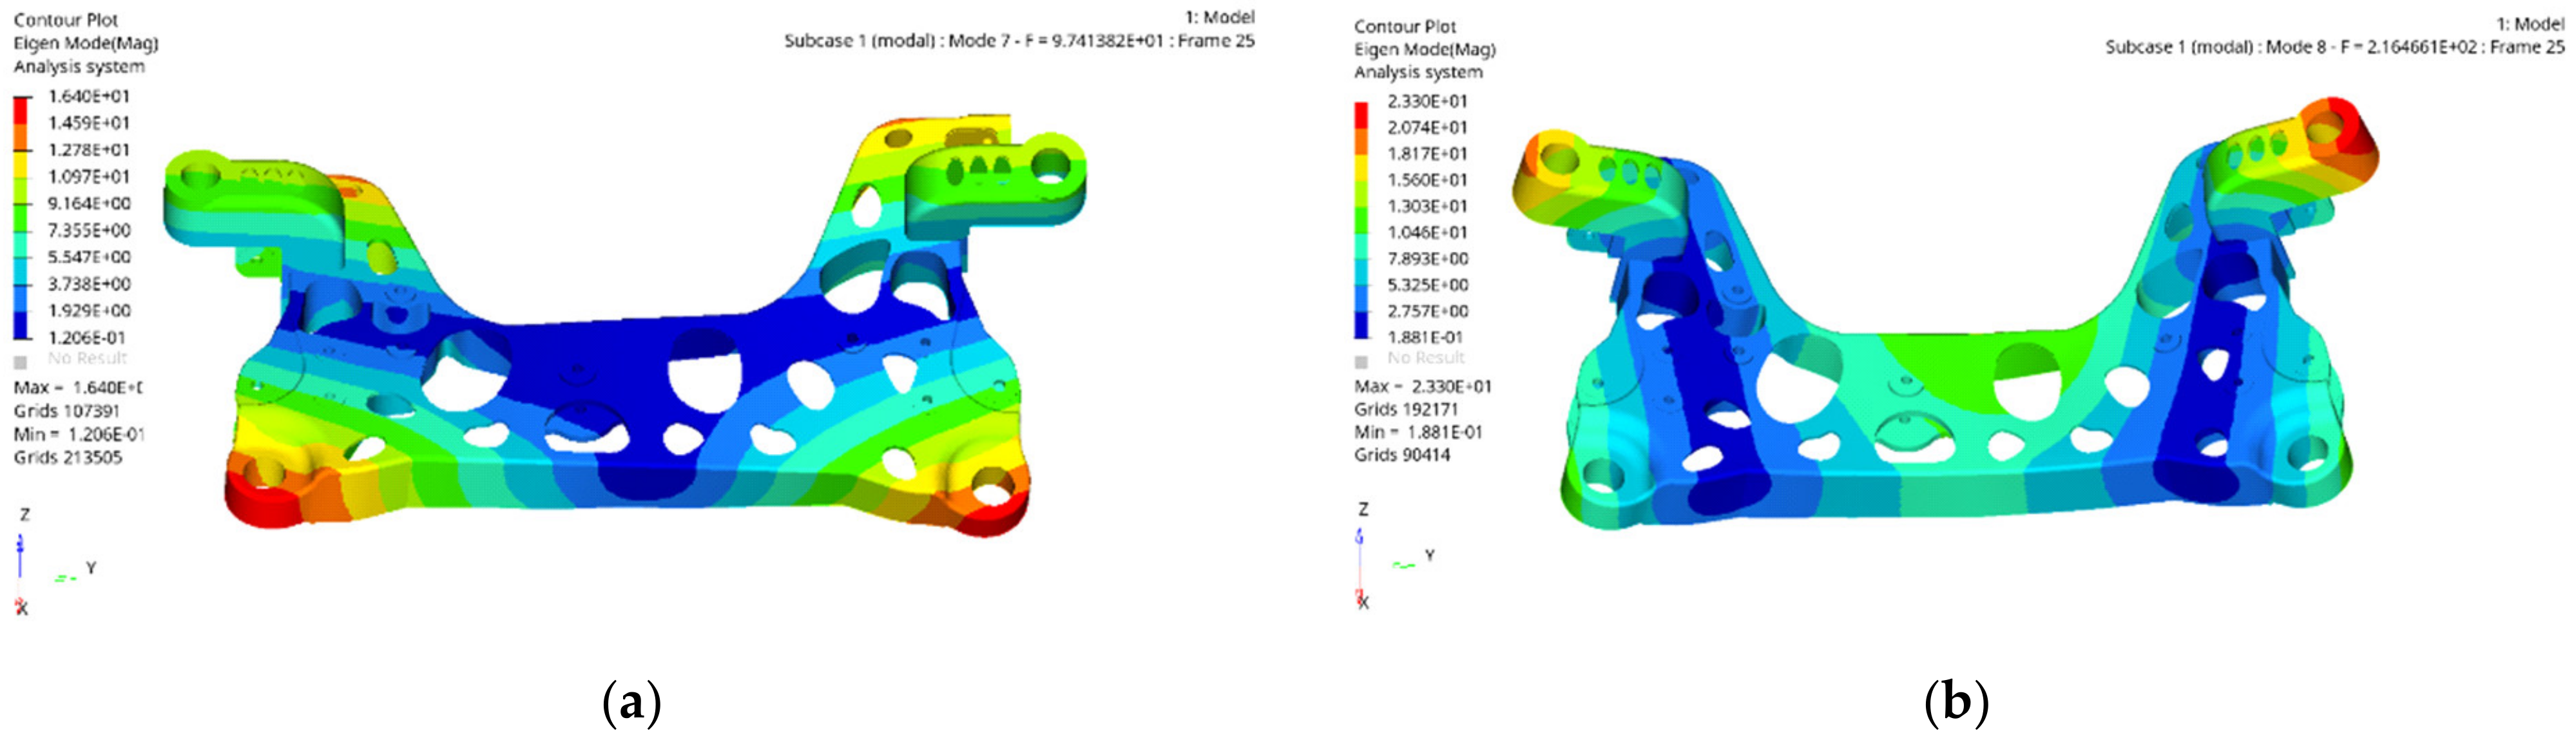
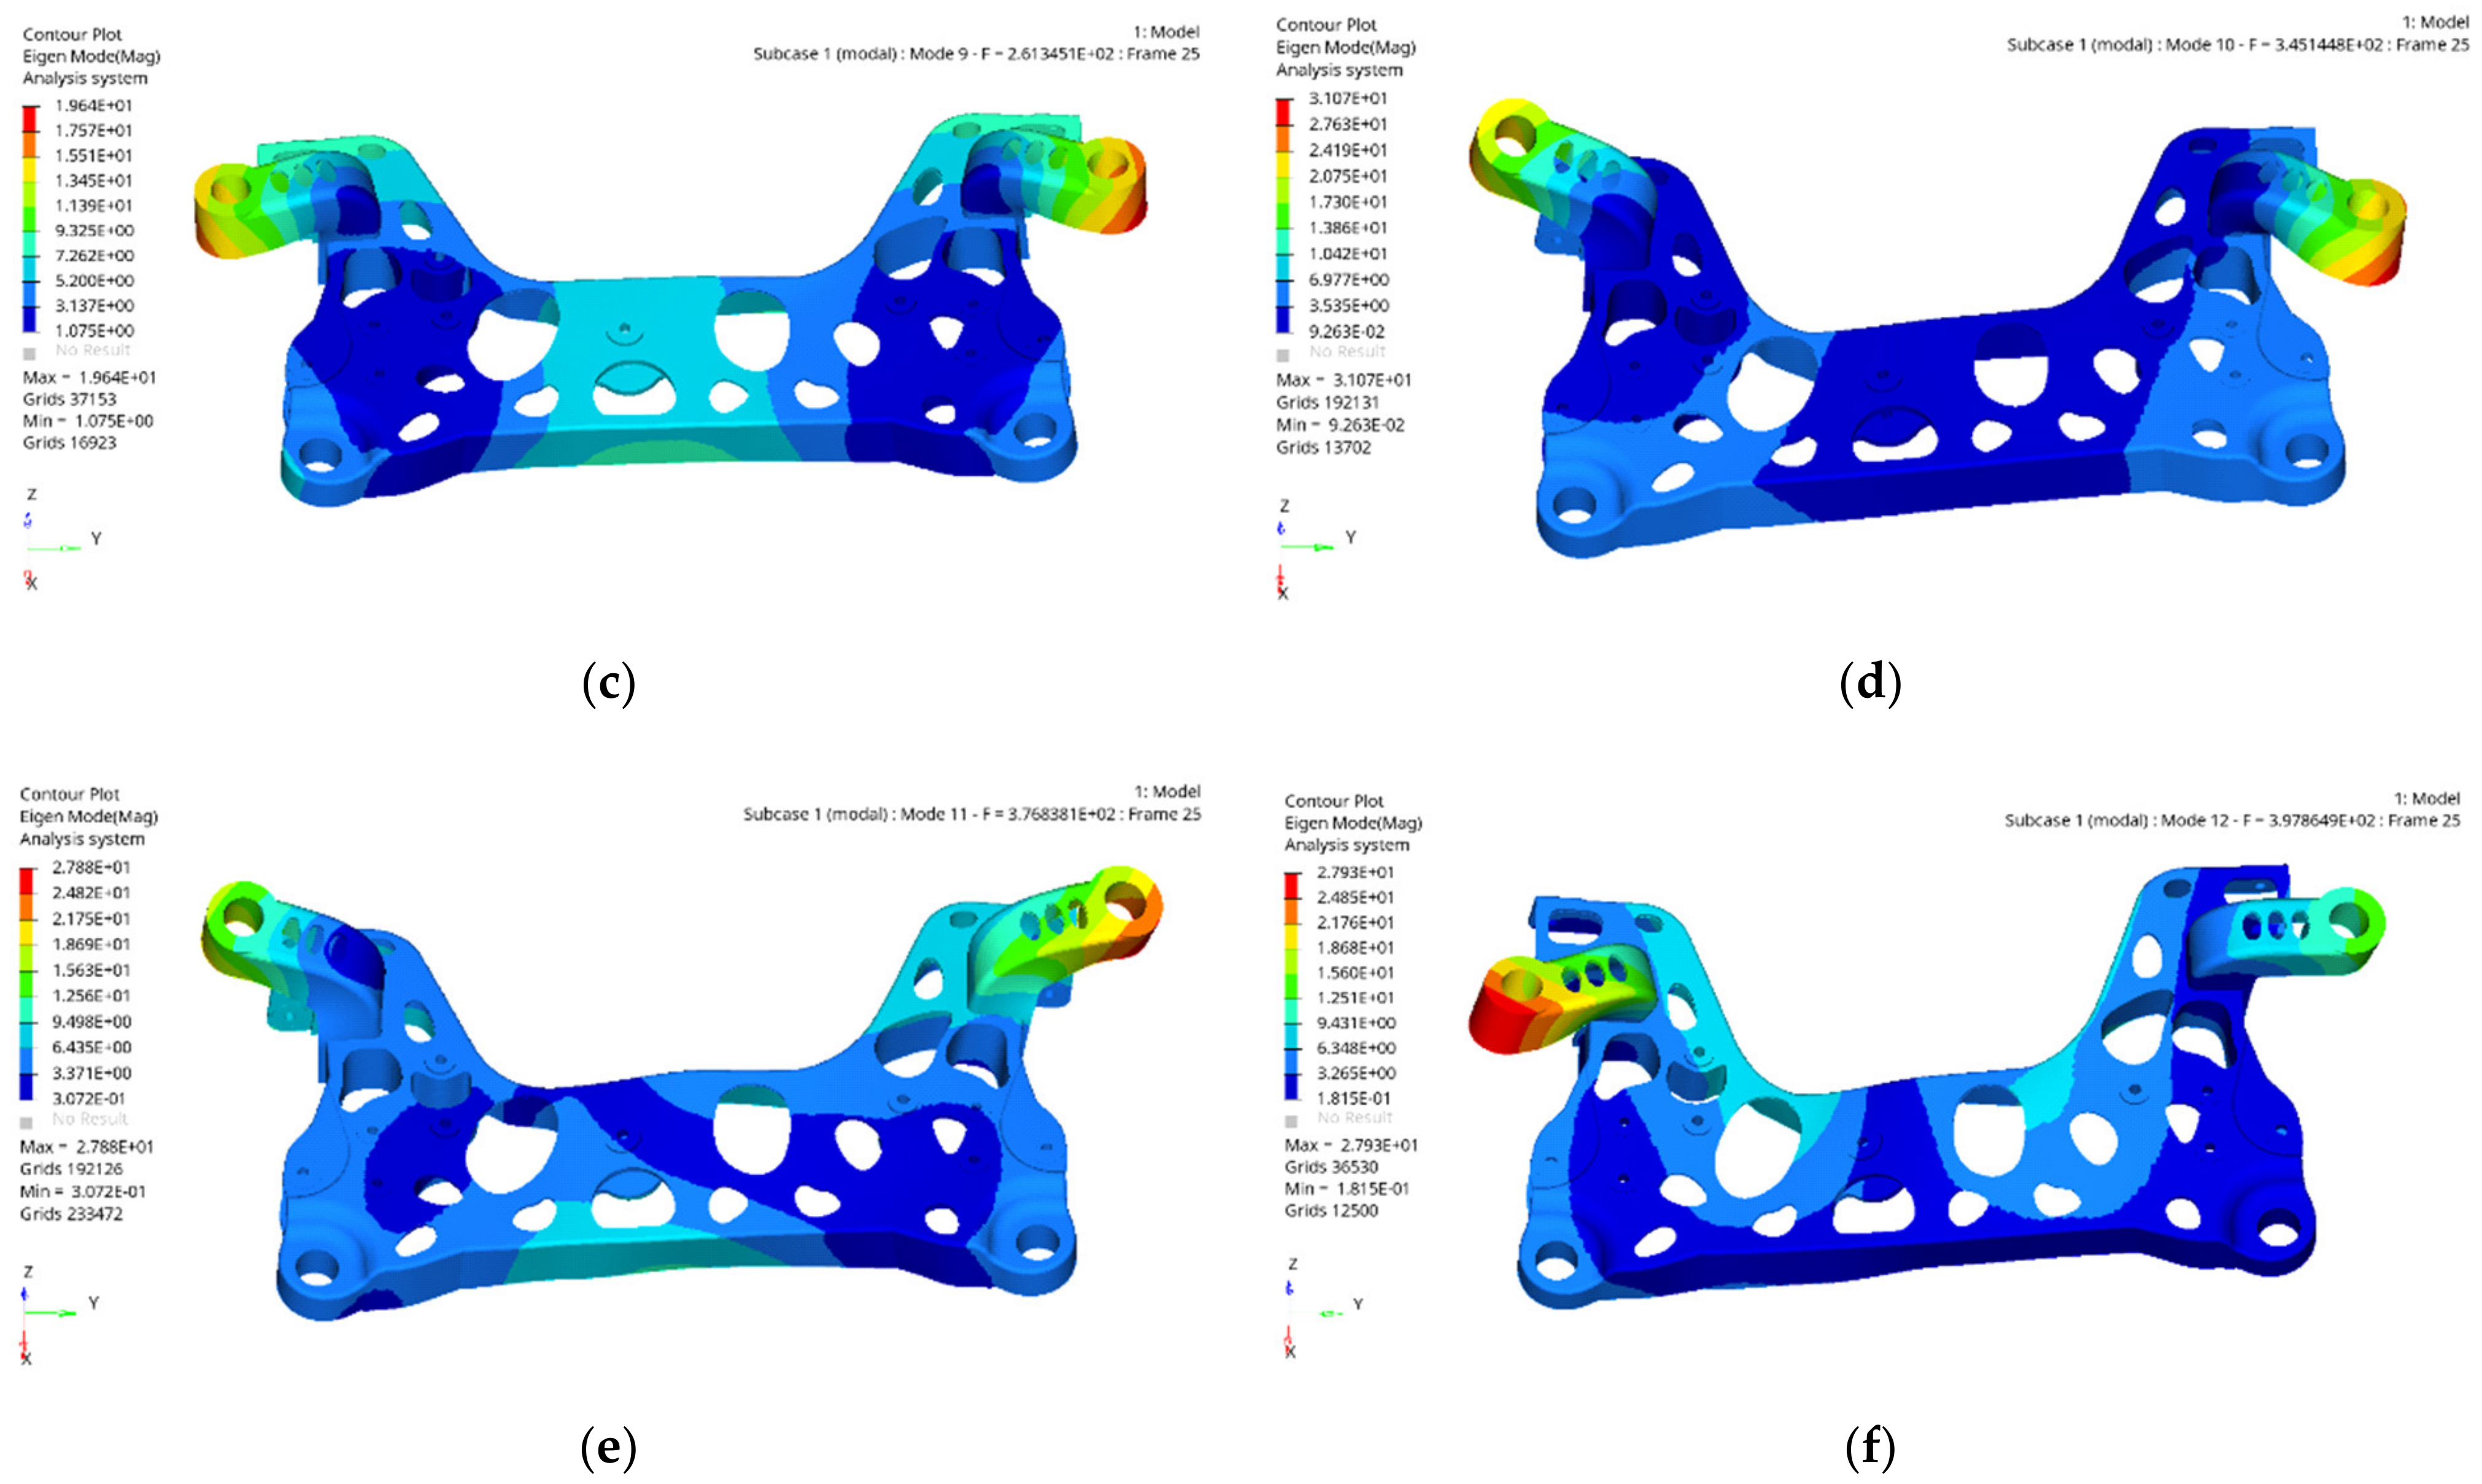
3.3. Free Modal Analysis of the Aluminium Alloy Front Subframe

The natural frequency is a characteristic property of objects. Resonance occurs when externally applied vibrations coincide with the natural frequency of the object. When resonance occurs, vibration and noise will increase dramatically and eventually lead to the destruction of parts [11]. Because the low-order mode has a great influence on the vibration performance of the subframe, usually only the influence of the low-order mode on the subframe is considered. When the vibration frequency of the subframe is close to the excitation frequency, the damage of the parts will be accelerated. Therefore, the frequency of the subframe is close to the excitation frequency, and the frequency of the first-order modal should be increased as much as possible. The modal calculation of the aluminium alloy front subframe is carried out under the OptiStruct module of HyperMesh. The Lanczos algorithm is used to analyse the free modal of the aluminium alloy front subframe. The Lanczos method has a fast convergence speed. The first 6 modals are rigid body modals, so only the modals after the 7th order are considered. To clearly see the modal shape of the subframe, the scaling coefficient is set to 3. The first 6 orders of nonrigid body modal shapes are shown in Figure 6.
The subframe is mainly affected by the ground excitation frequency and engine excitation frequency, while the excitation frequency of general highway pavement is below 25 Hz, and the engine excitation frequency can be calculated by the following formula:
f = n z 120
where n is the idle speed of the engine, r/min, and z is the number of cylinders of the engine.
The idle speed of the engine of the model under study is 1500 r/min, and the engine is a four-cylinder engine. Thus, the engine excitation frequency is calculated to be 50 Hz, and the free modal of the aluminium alloy subframe should be beyond 50 Hz to avoid resonance. The results of the finite element analysis show that the free modal first-order frequency of the aluminium alloy subframe is 97 Hz. It is much higher than the ground and engine excitation frequency, and the difference between each modal frequency is more than 20 Hz. Thus, the aluminium alloy subframe will not resonate with the excitation frequency, and the modal performance of the aluminium alloy subframe meets the design requirements.

4. Lightweight Optimization Design Based on Multi-Objective Methods

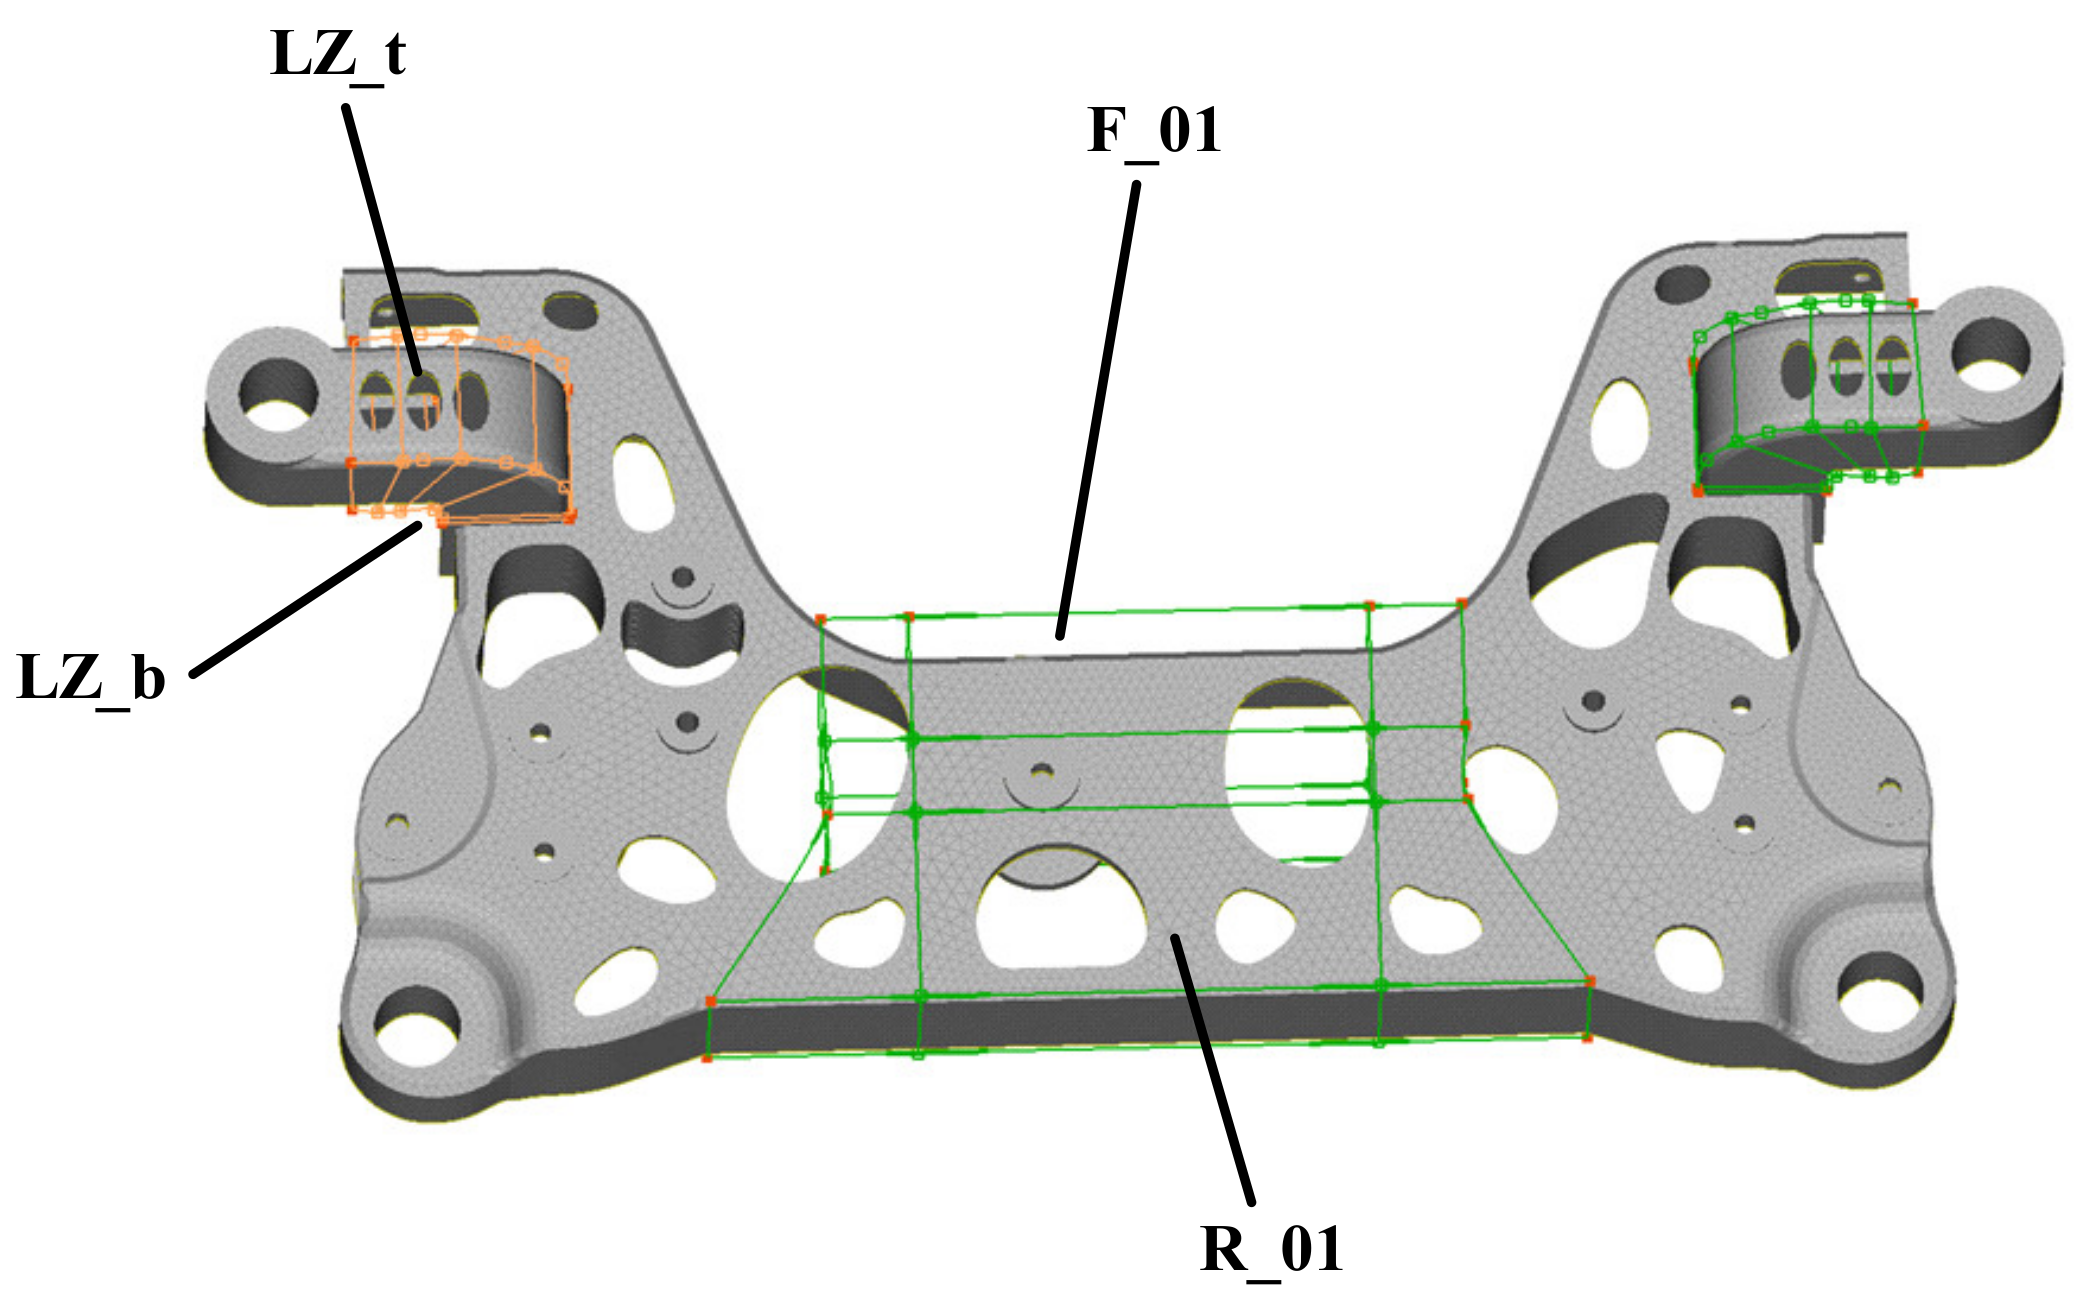
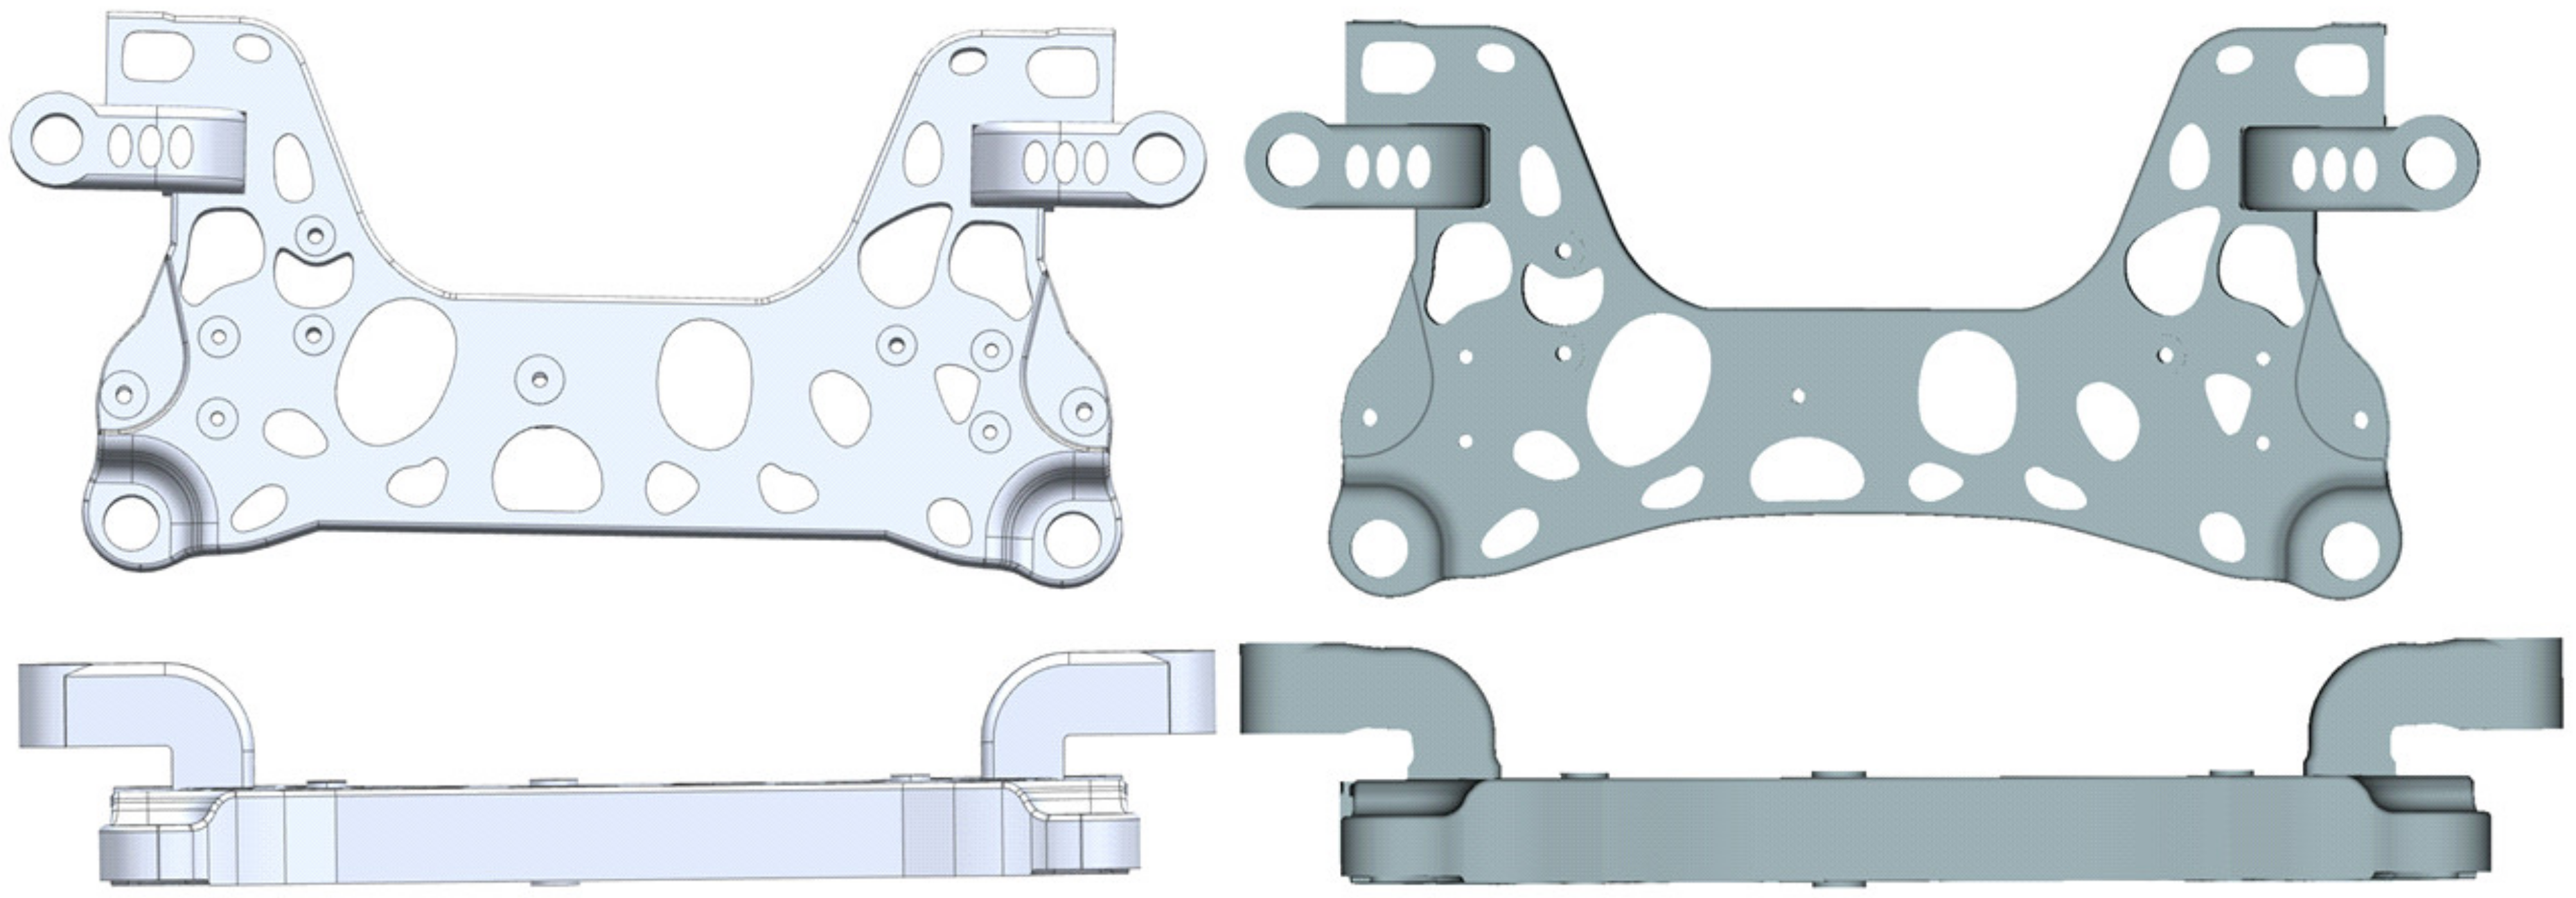
4.1. Establishment of the Parametric Model of the Aluminium Alloy Front Subframe

The parametric model of the aluminium alloy front subframe is created in the Morph module of Ansa. The Morph module can quickly carry out mesh deformation and create shape design variables. Four positions of the aluminium alloy front subframe are selected to set the parametric variables. The parameterized model and optimized positions are shown in Figure 7. The four positions are named F_01, R_01, LZ_t, and LZ_b. The variation range of the parameterized variables at four positions of the aluminium alloy front subframe is shown in Table 3.

4.2. Establishment of the Optimization Mathematical Model

Based on the strength performance obtained in Section 3.1 and the performance of the modal analysis obtained in Section 3.3, the aluminium alloy front subframe can be further optimized, and the mass can be further reduced. The design of the aluminium alloy front subframe should meet various performance requirements at the same time, including the strength, static stiffness, modal performance, and fatigue endurance performance [18], which is a multi-objective optimization problem [21]. The establishment of a multi-objective optimization design mainly includes the determination of the design variables, constraints, and optimization objectives, as well as the selection of an optimization algorithm. In this paper, the multi-objective optimization platform Isight, combined with Ansa, OptiStruct, and Meta, is adopted to conduct the multi-objective optimization of the aluminium alloy front subframe. The parameters of the aluminium alloy front subframe model were established in the morph module of Ansa; the strength, stiffness, and modal were calculated in the OptiStruct module; and the strength, stiffness, and modal values were extracted in the Meta software. The specific mathematical model is as follows:
O b j e c t : { M a s s min ( X ) 18 , F r e q _ 1 max ( X ) , D i s p min ( X ) }
s . t .   97 F r e q _ 1 200 M ax _ s t r e s s 1 180 M ax _ s t r e s s 2 145 M ax _ s t r e s s 3 128 D i s p min ( X ) 0.07      
V a r i a b l e :   20 F _ 01 10 8 L Z _ b 0 5 L Z _ t 5 30 R _ 01 15
where M a s s min ( X ) is the minimum mass of the aluminium alloy front subframe; F r e q _ 1 max ( X ) is the first order frequency of the nonrigid body modal of the aluminium alloy front subframe; D i s p min ( X ) is the minimum maximum displacement; F r e q _ 1 is the first order nonrigid body modal of the aluminium alloy front subframe, M ax _ s t r e s s 1 , M ax _ s t r e s s 2 , M ax _ s t r e s s 3 are the stress values of the over one side deep pit condition, forward braking condition, and forward emergency braking condition, respectively; and F _ 01 ,   R _ 01 ,   L Z _ t ,   L Z _ b are the four defined optimization design variables.

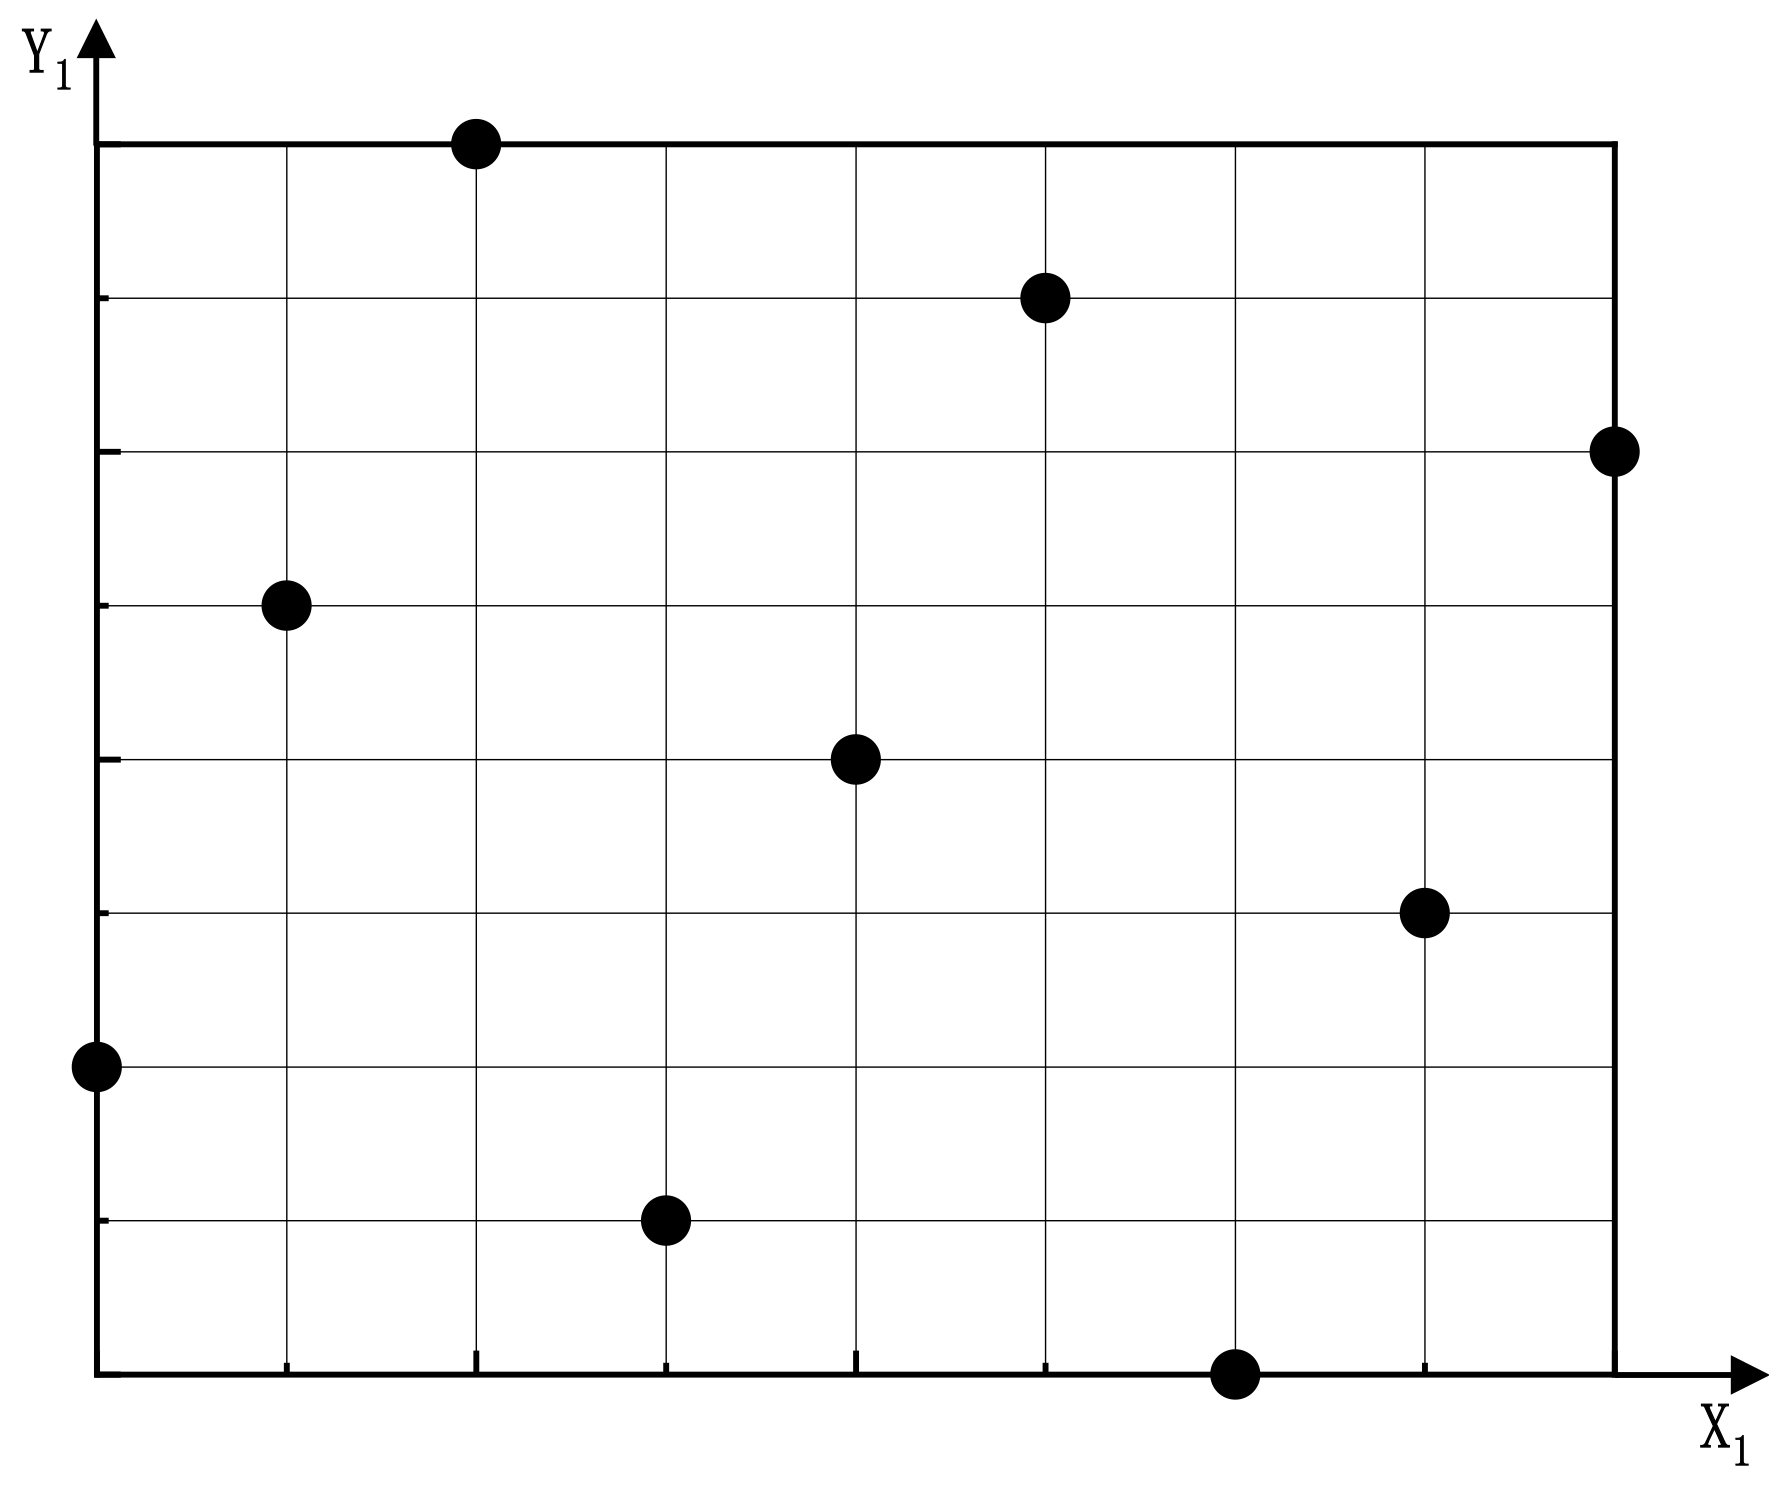
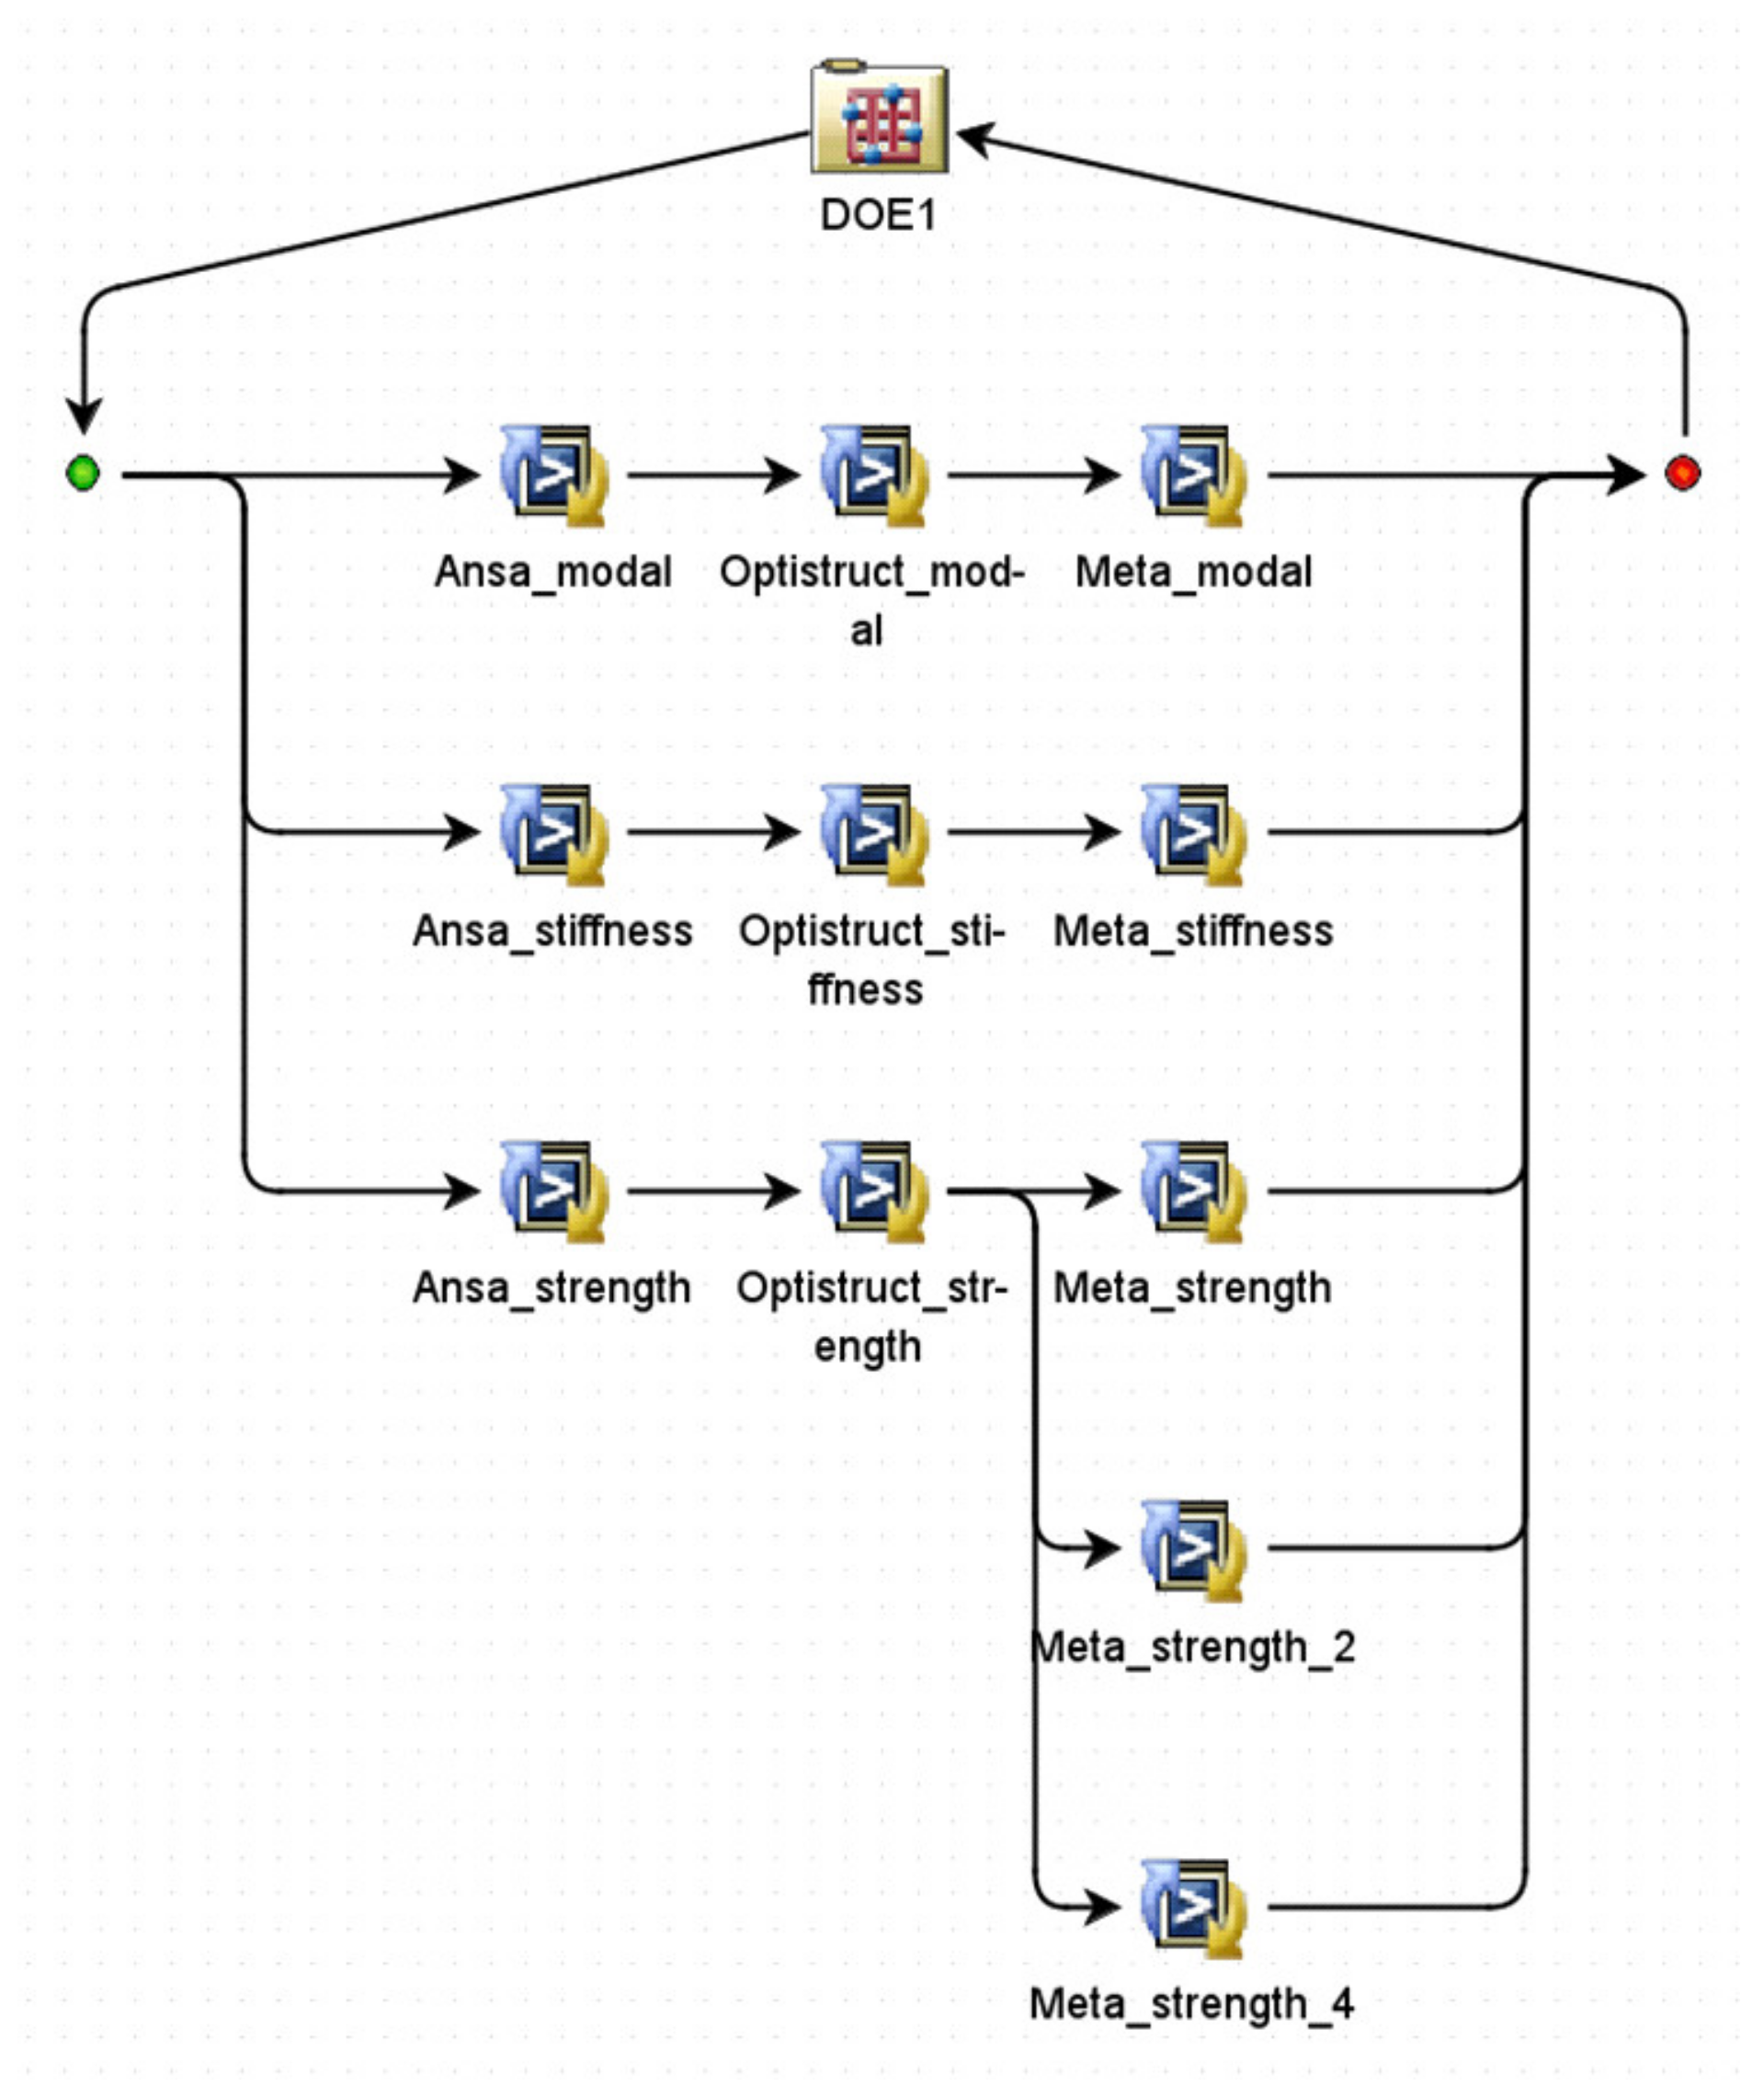
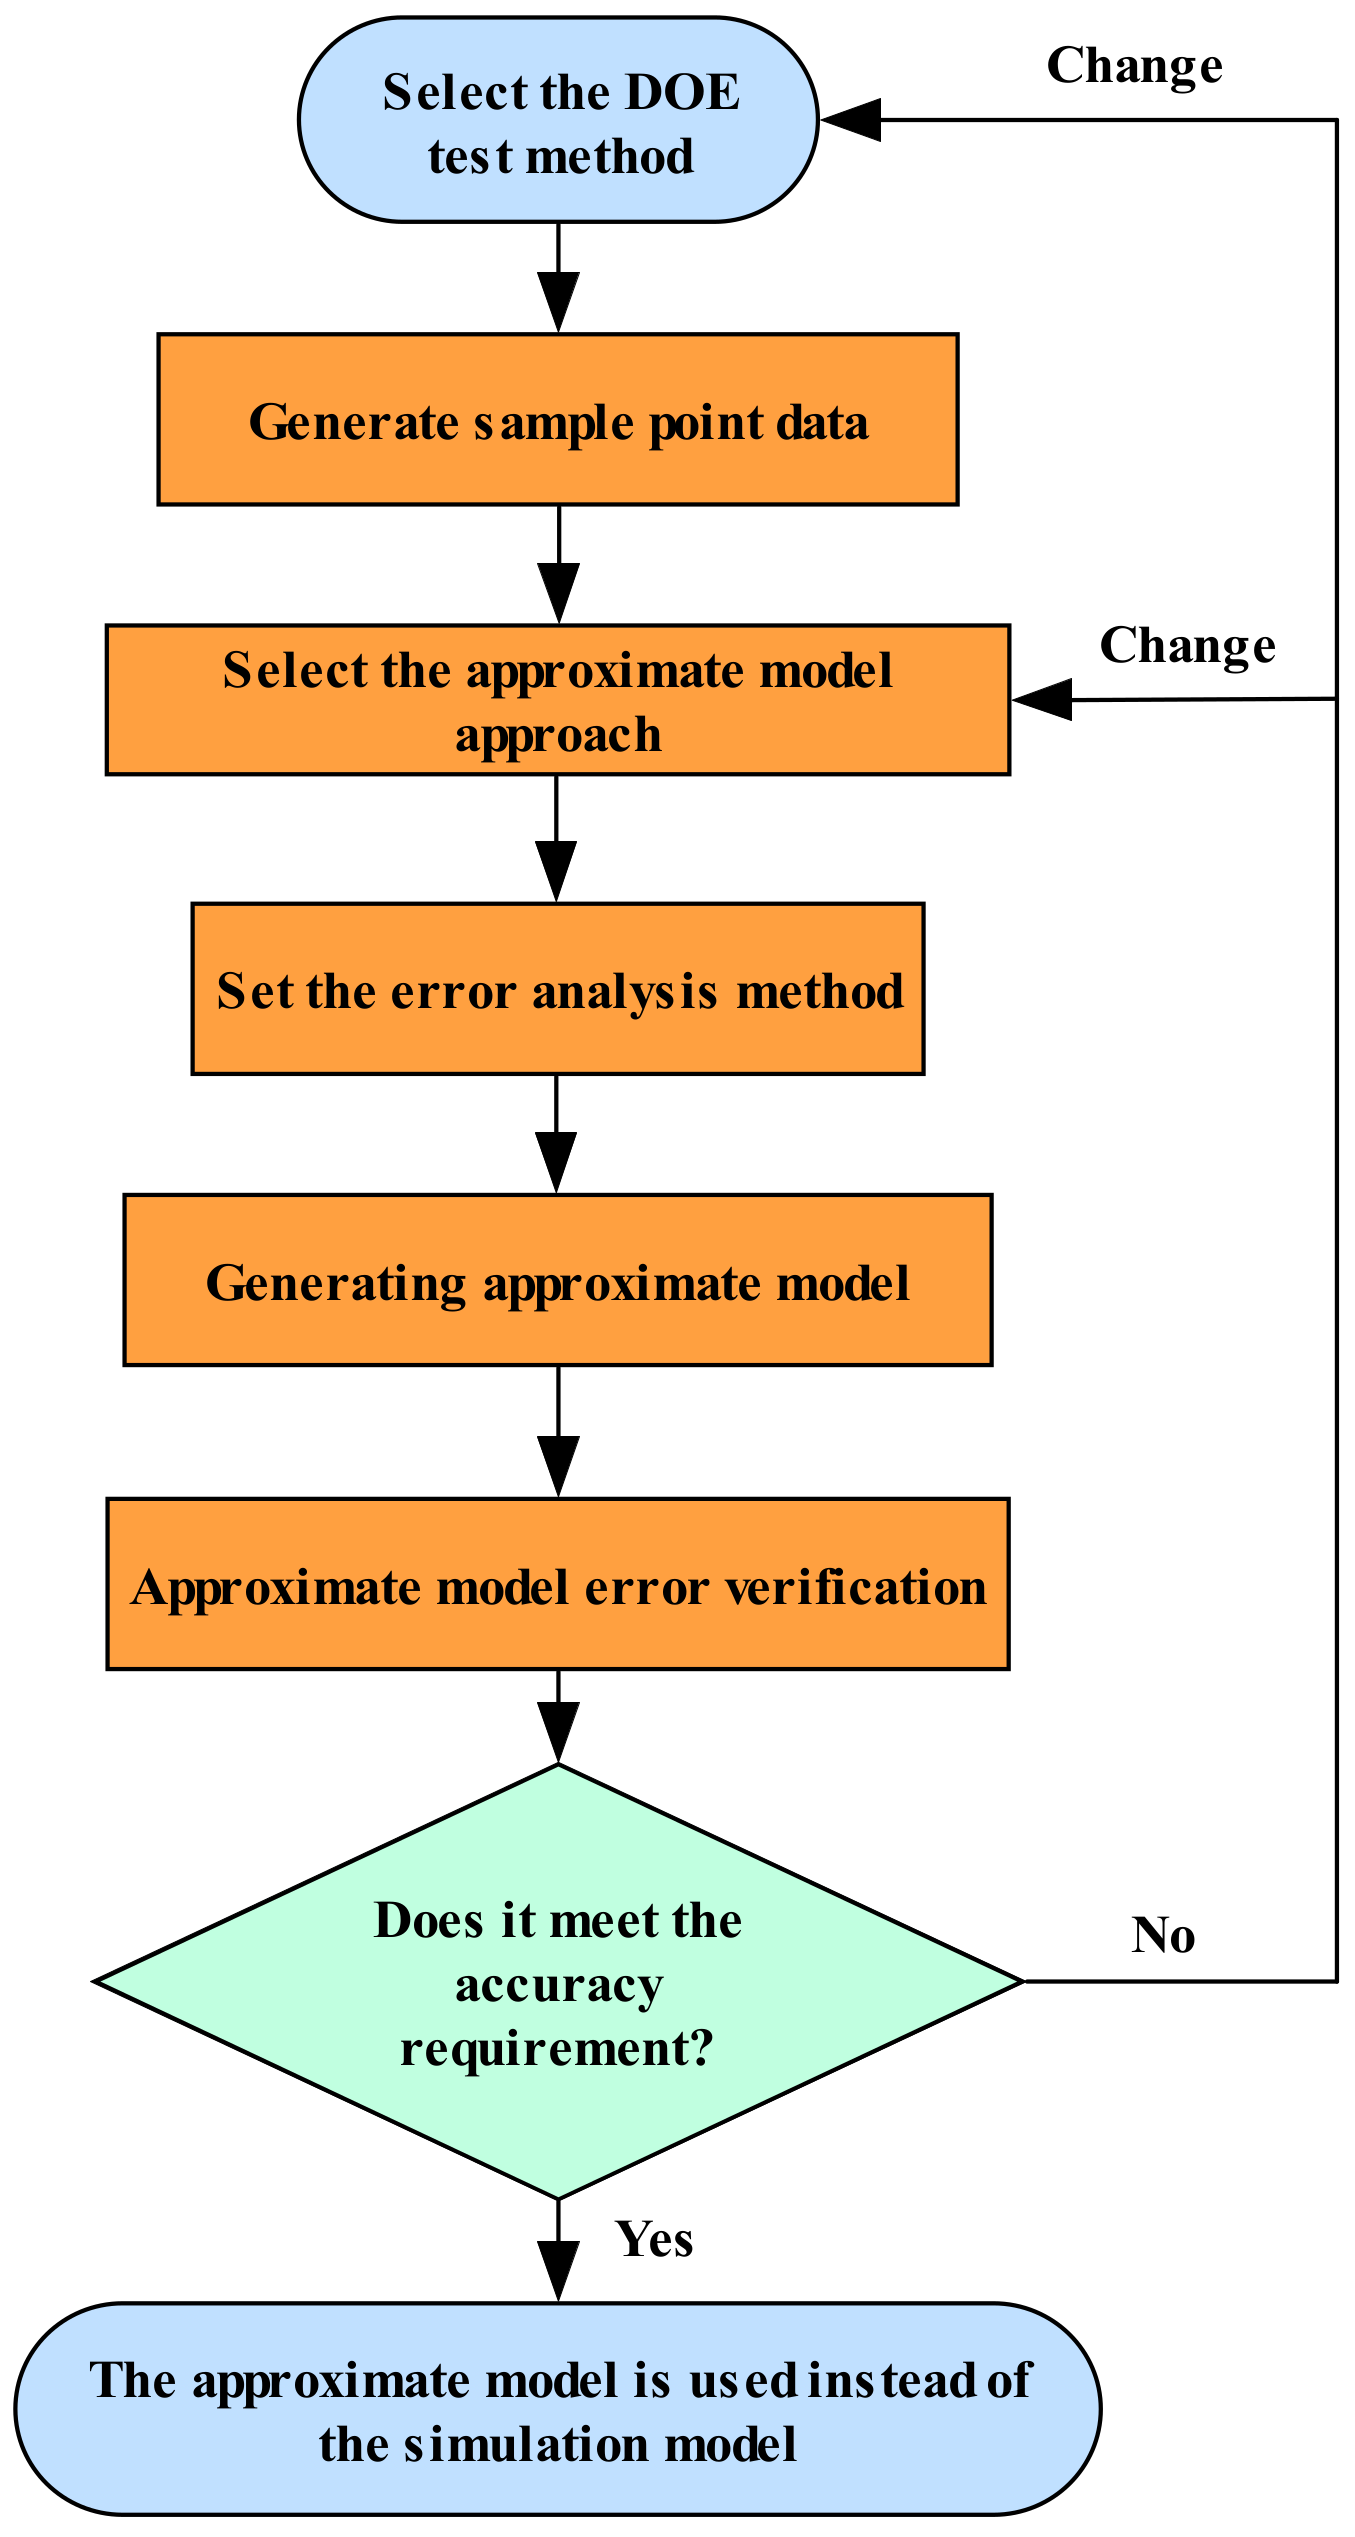
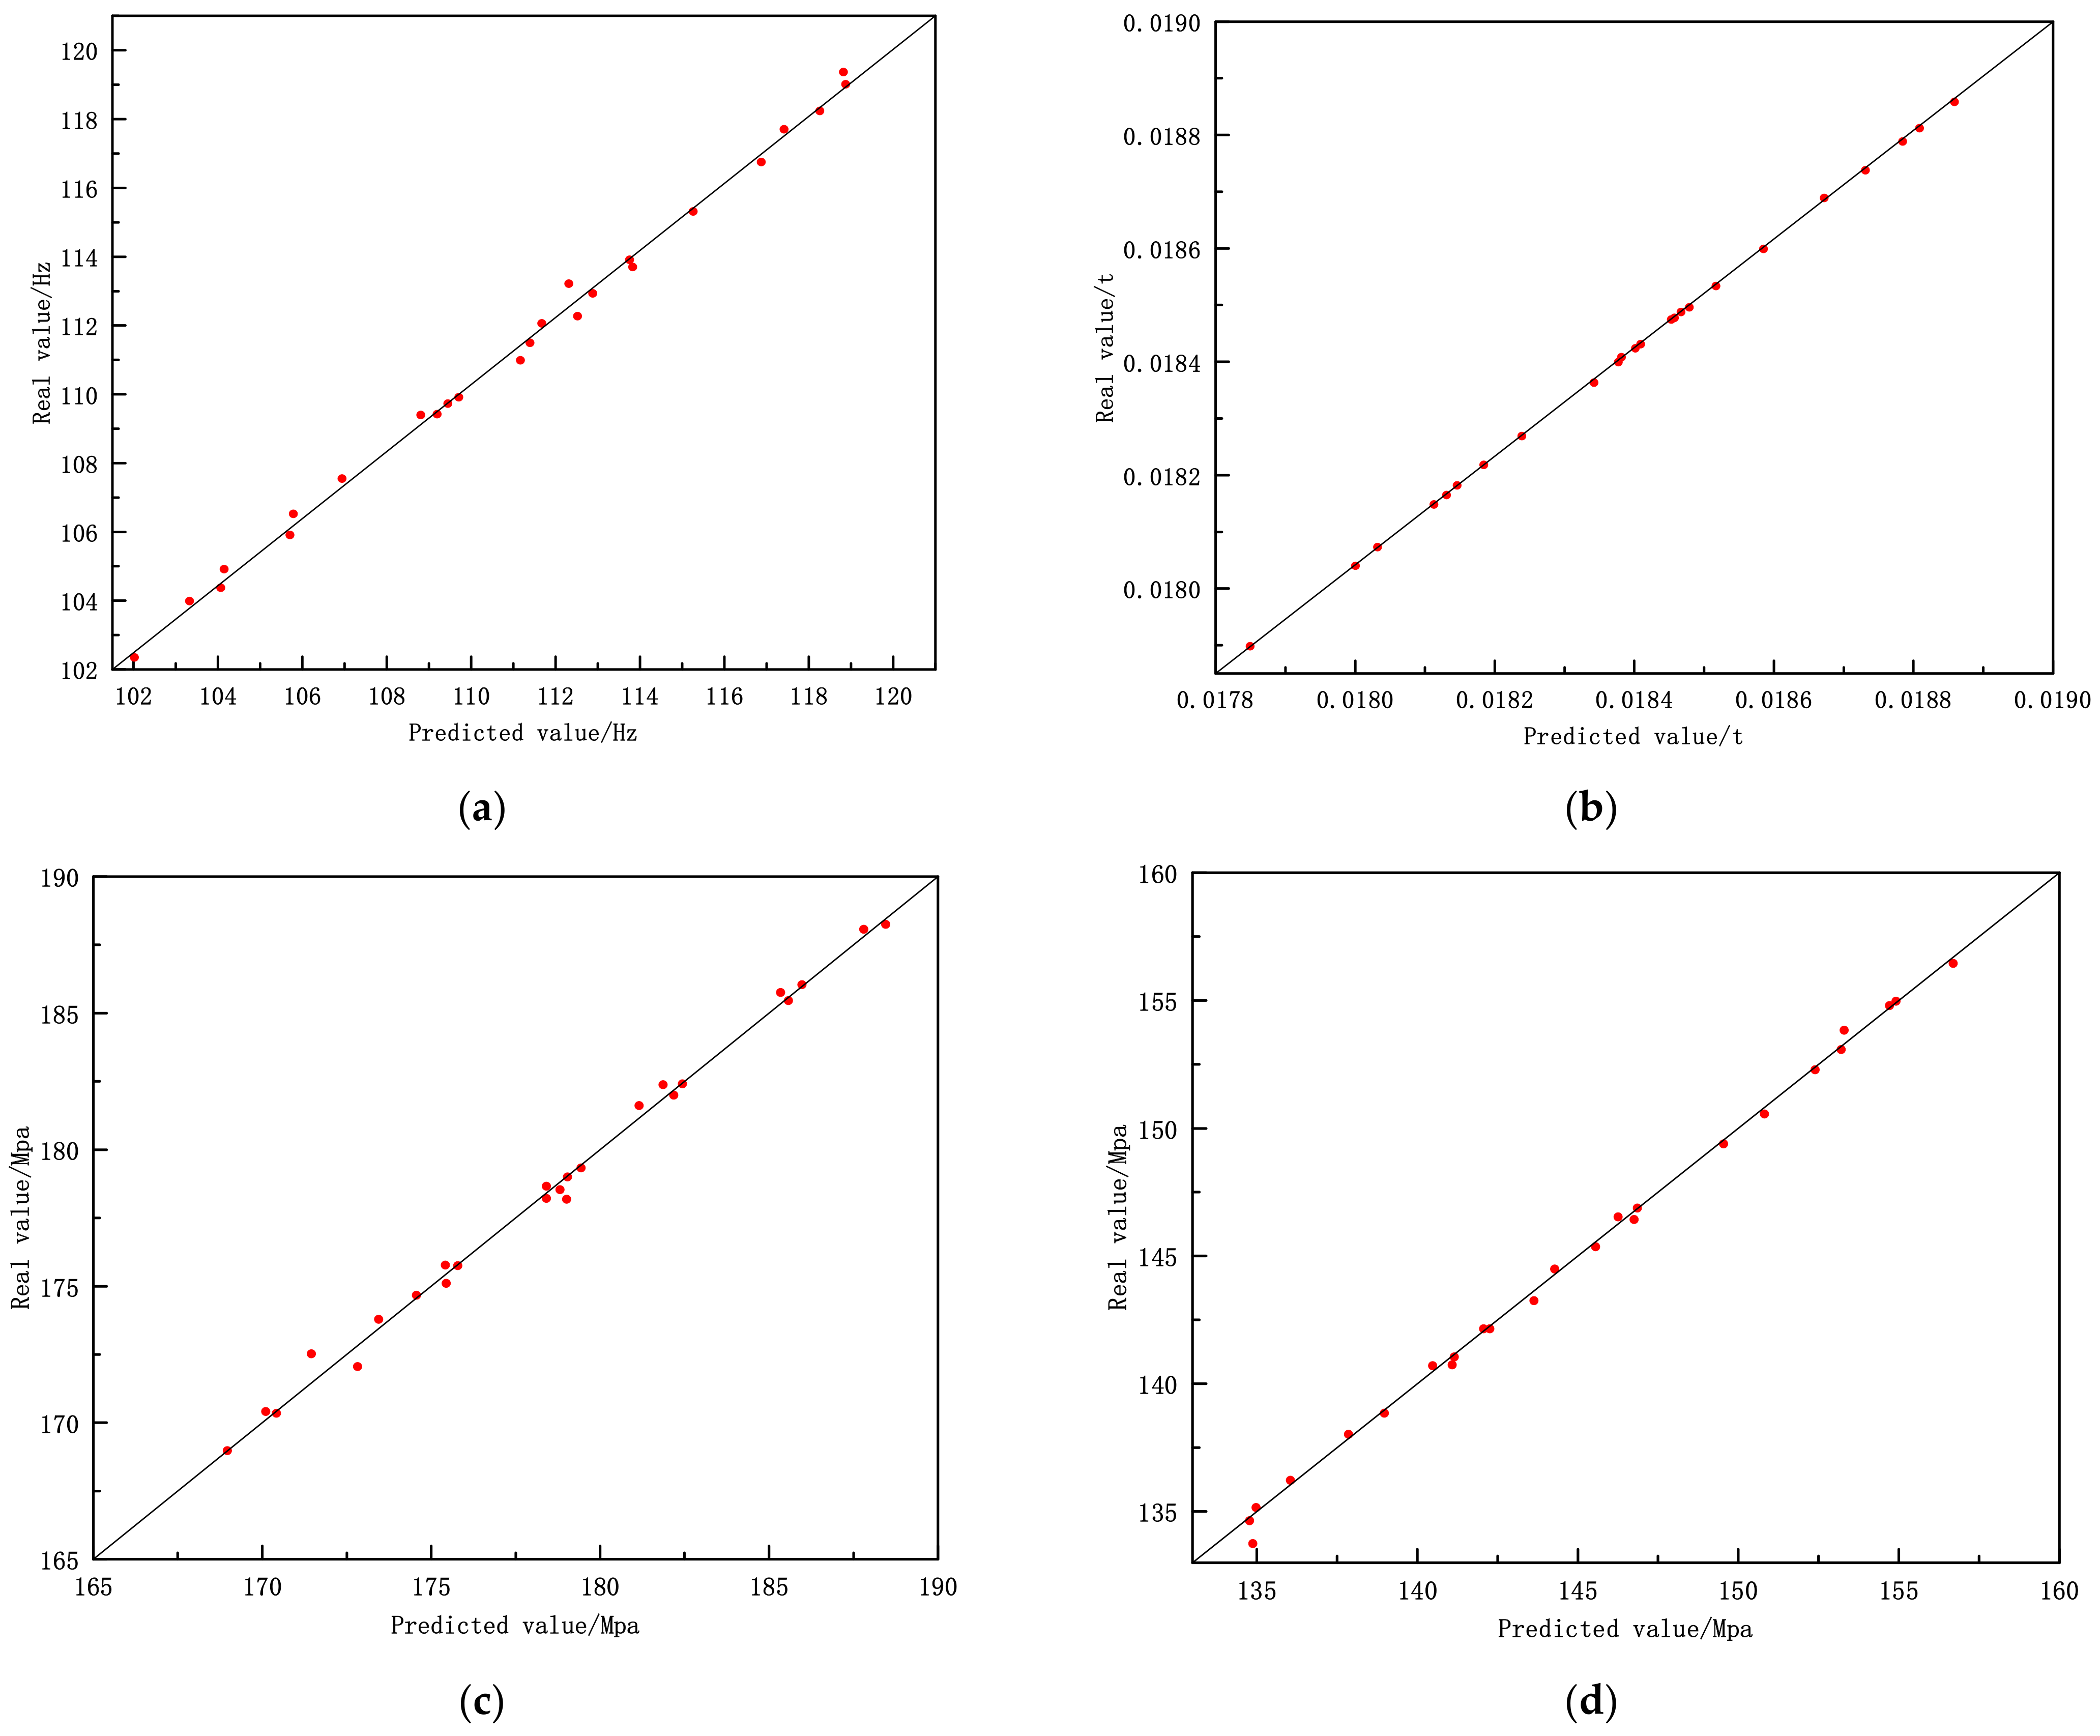
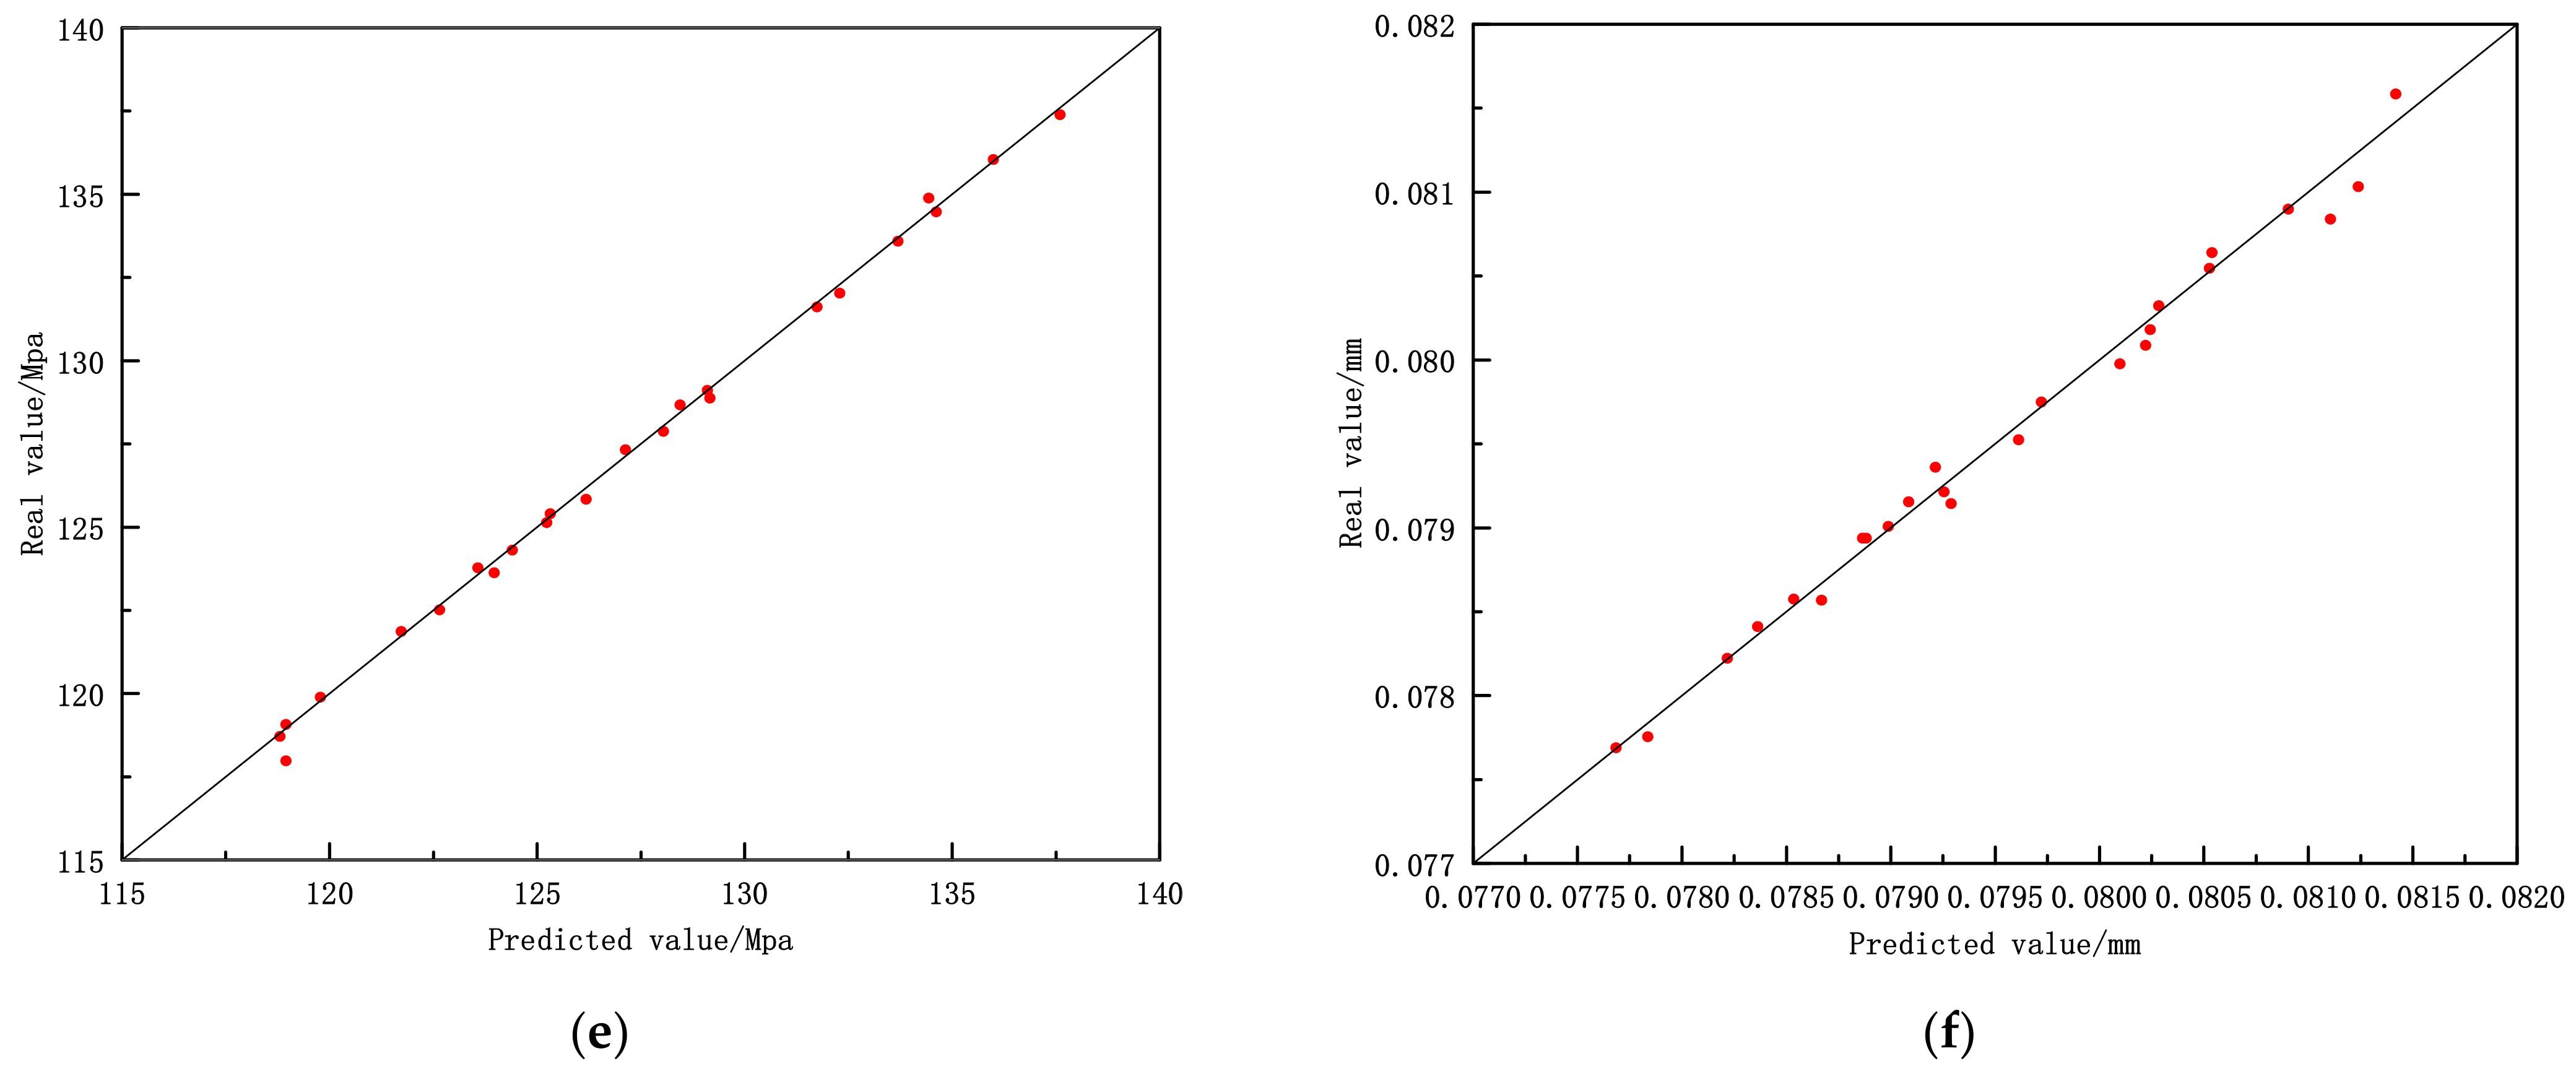
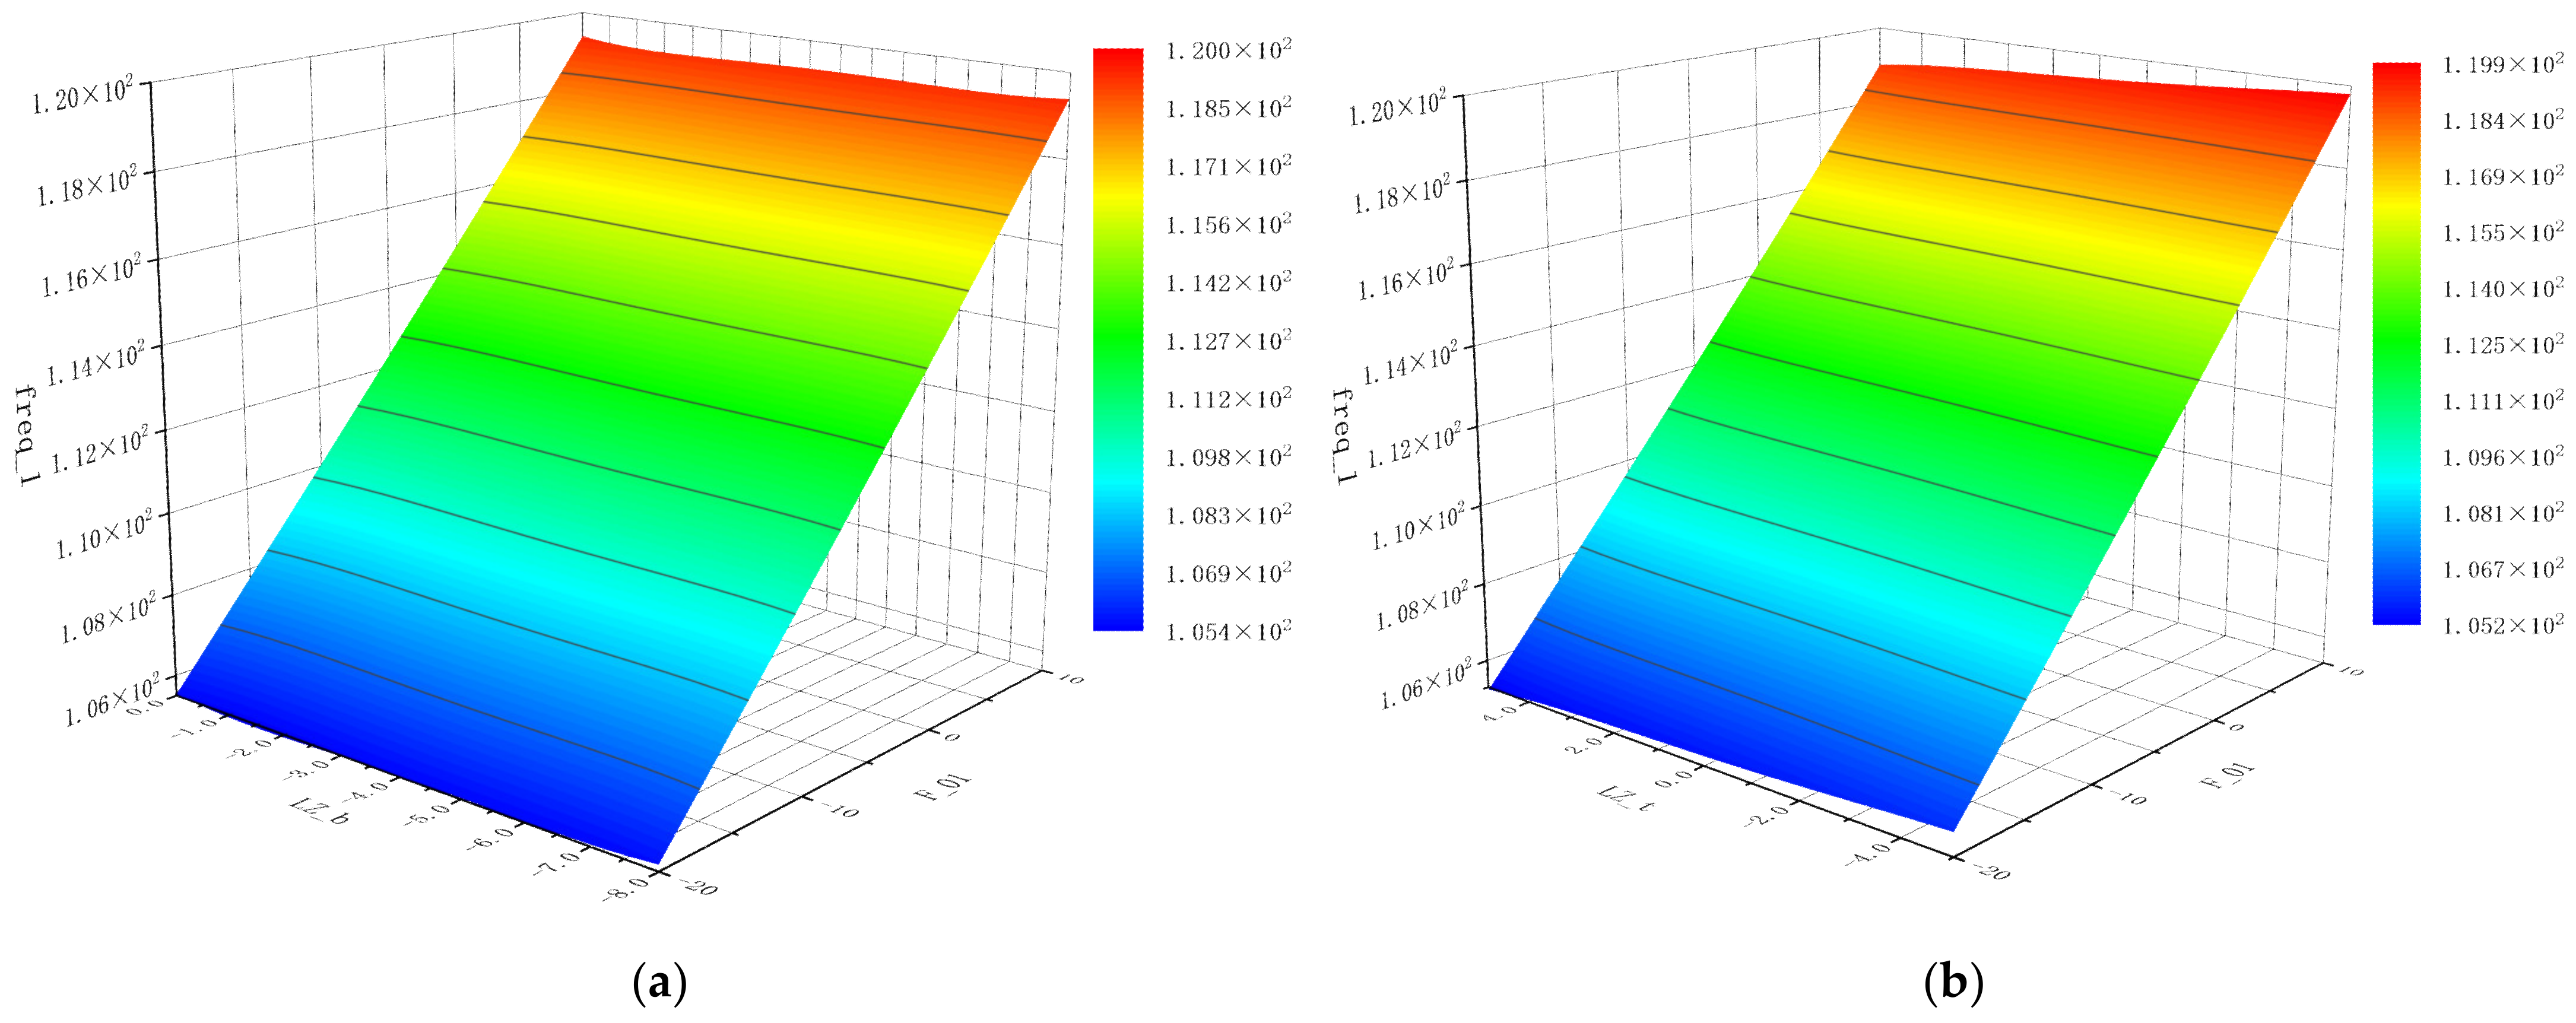
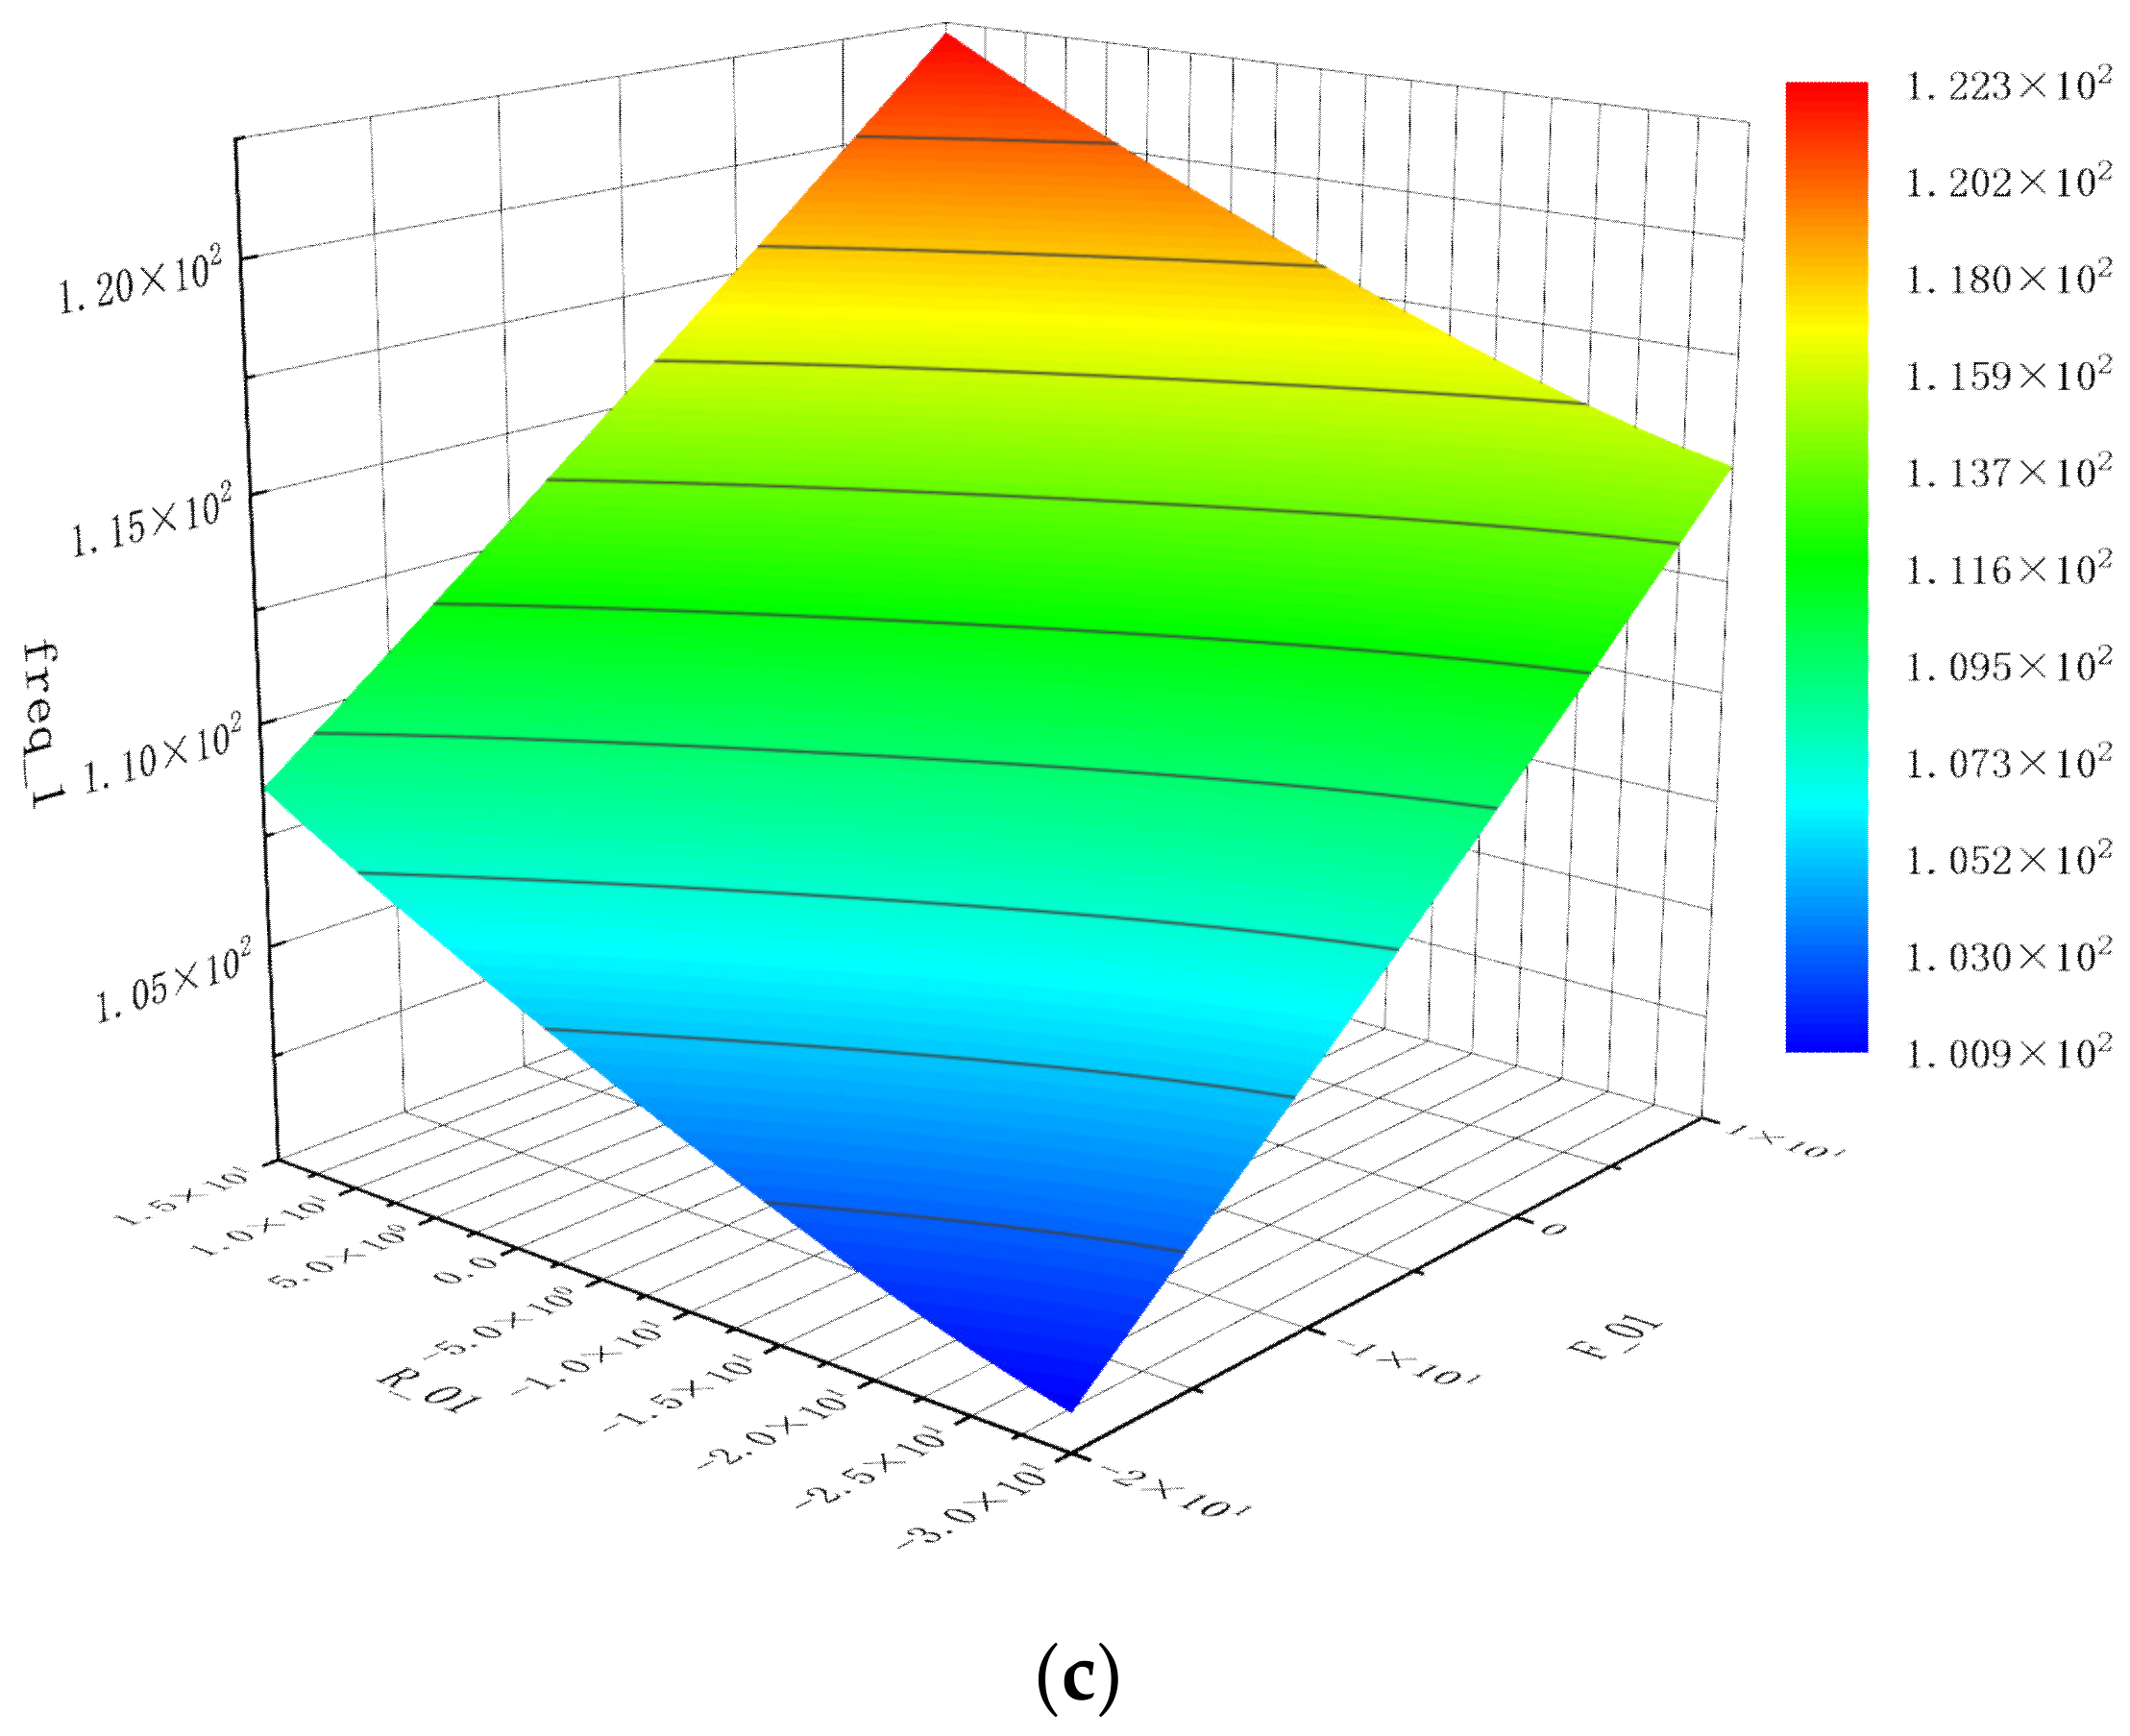
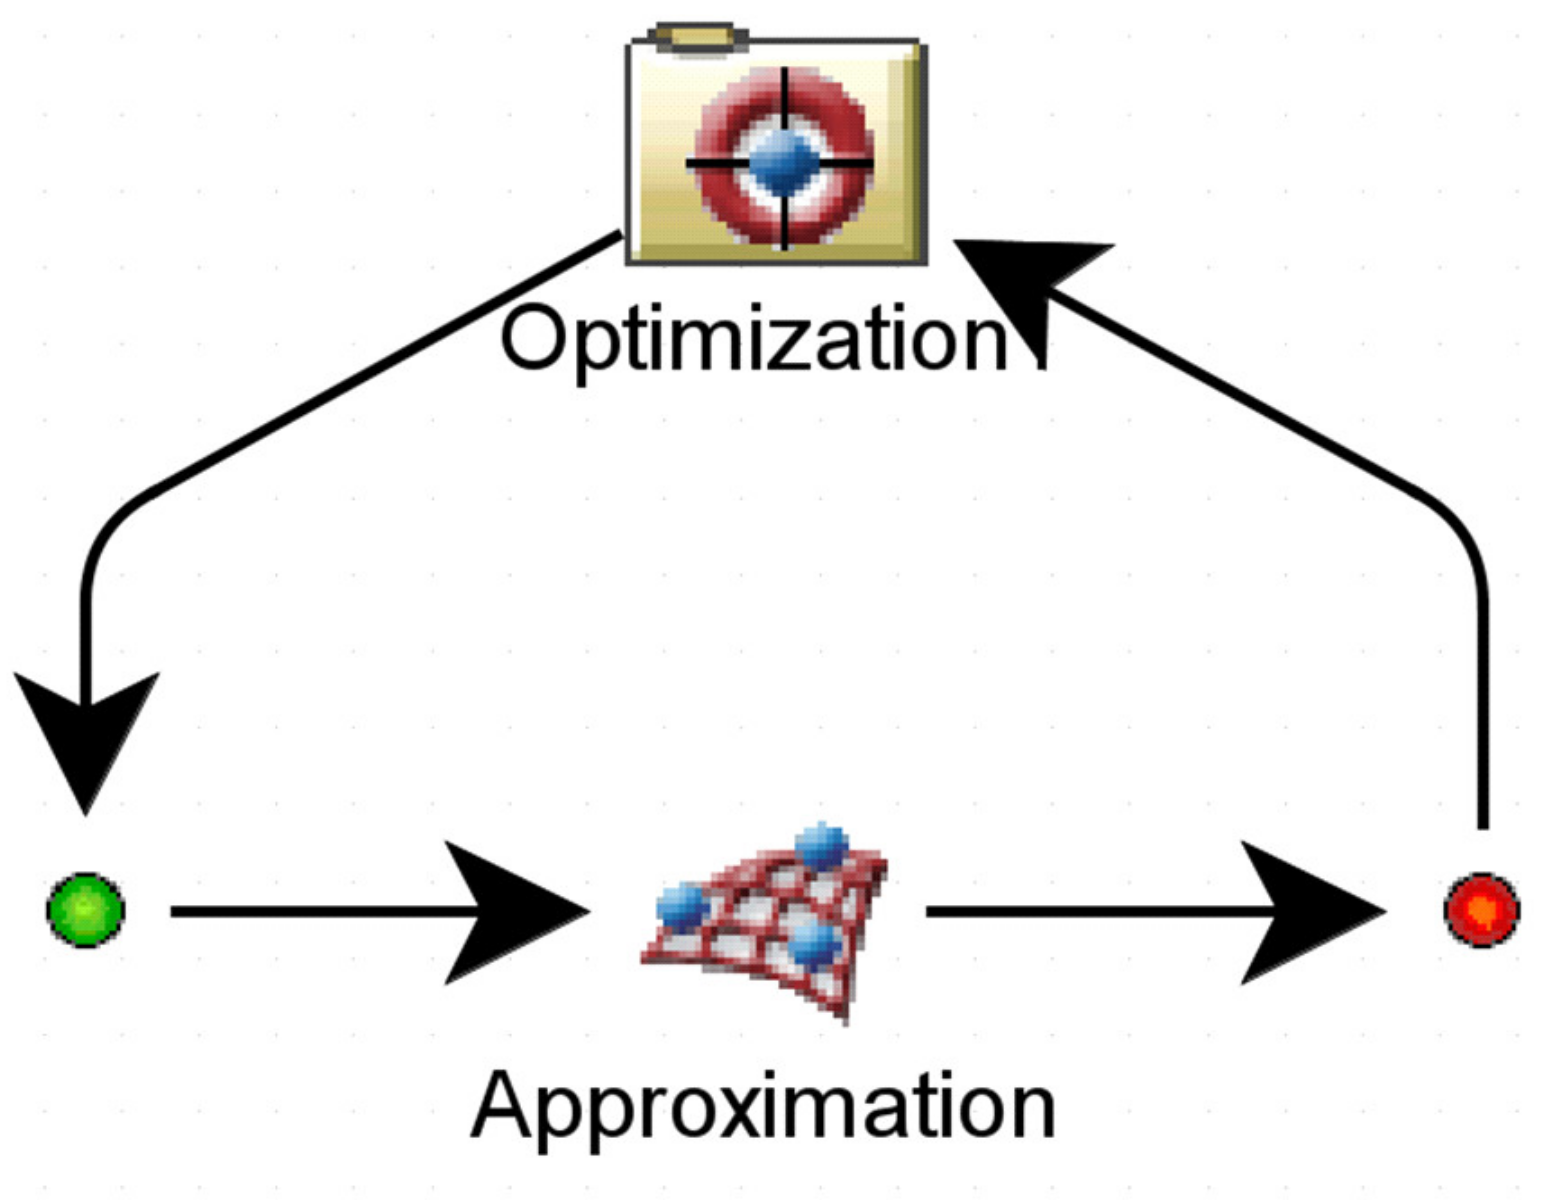
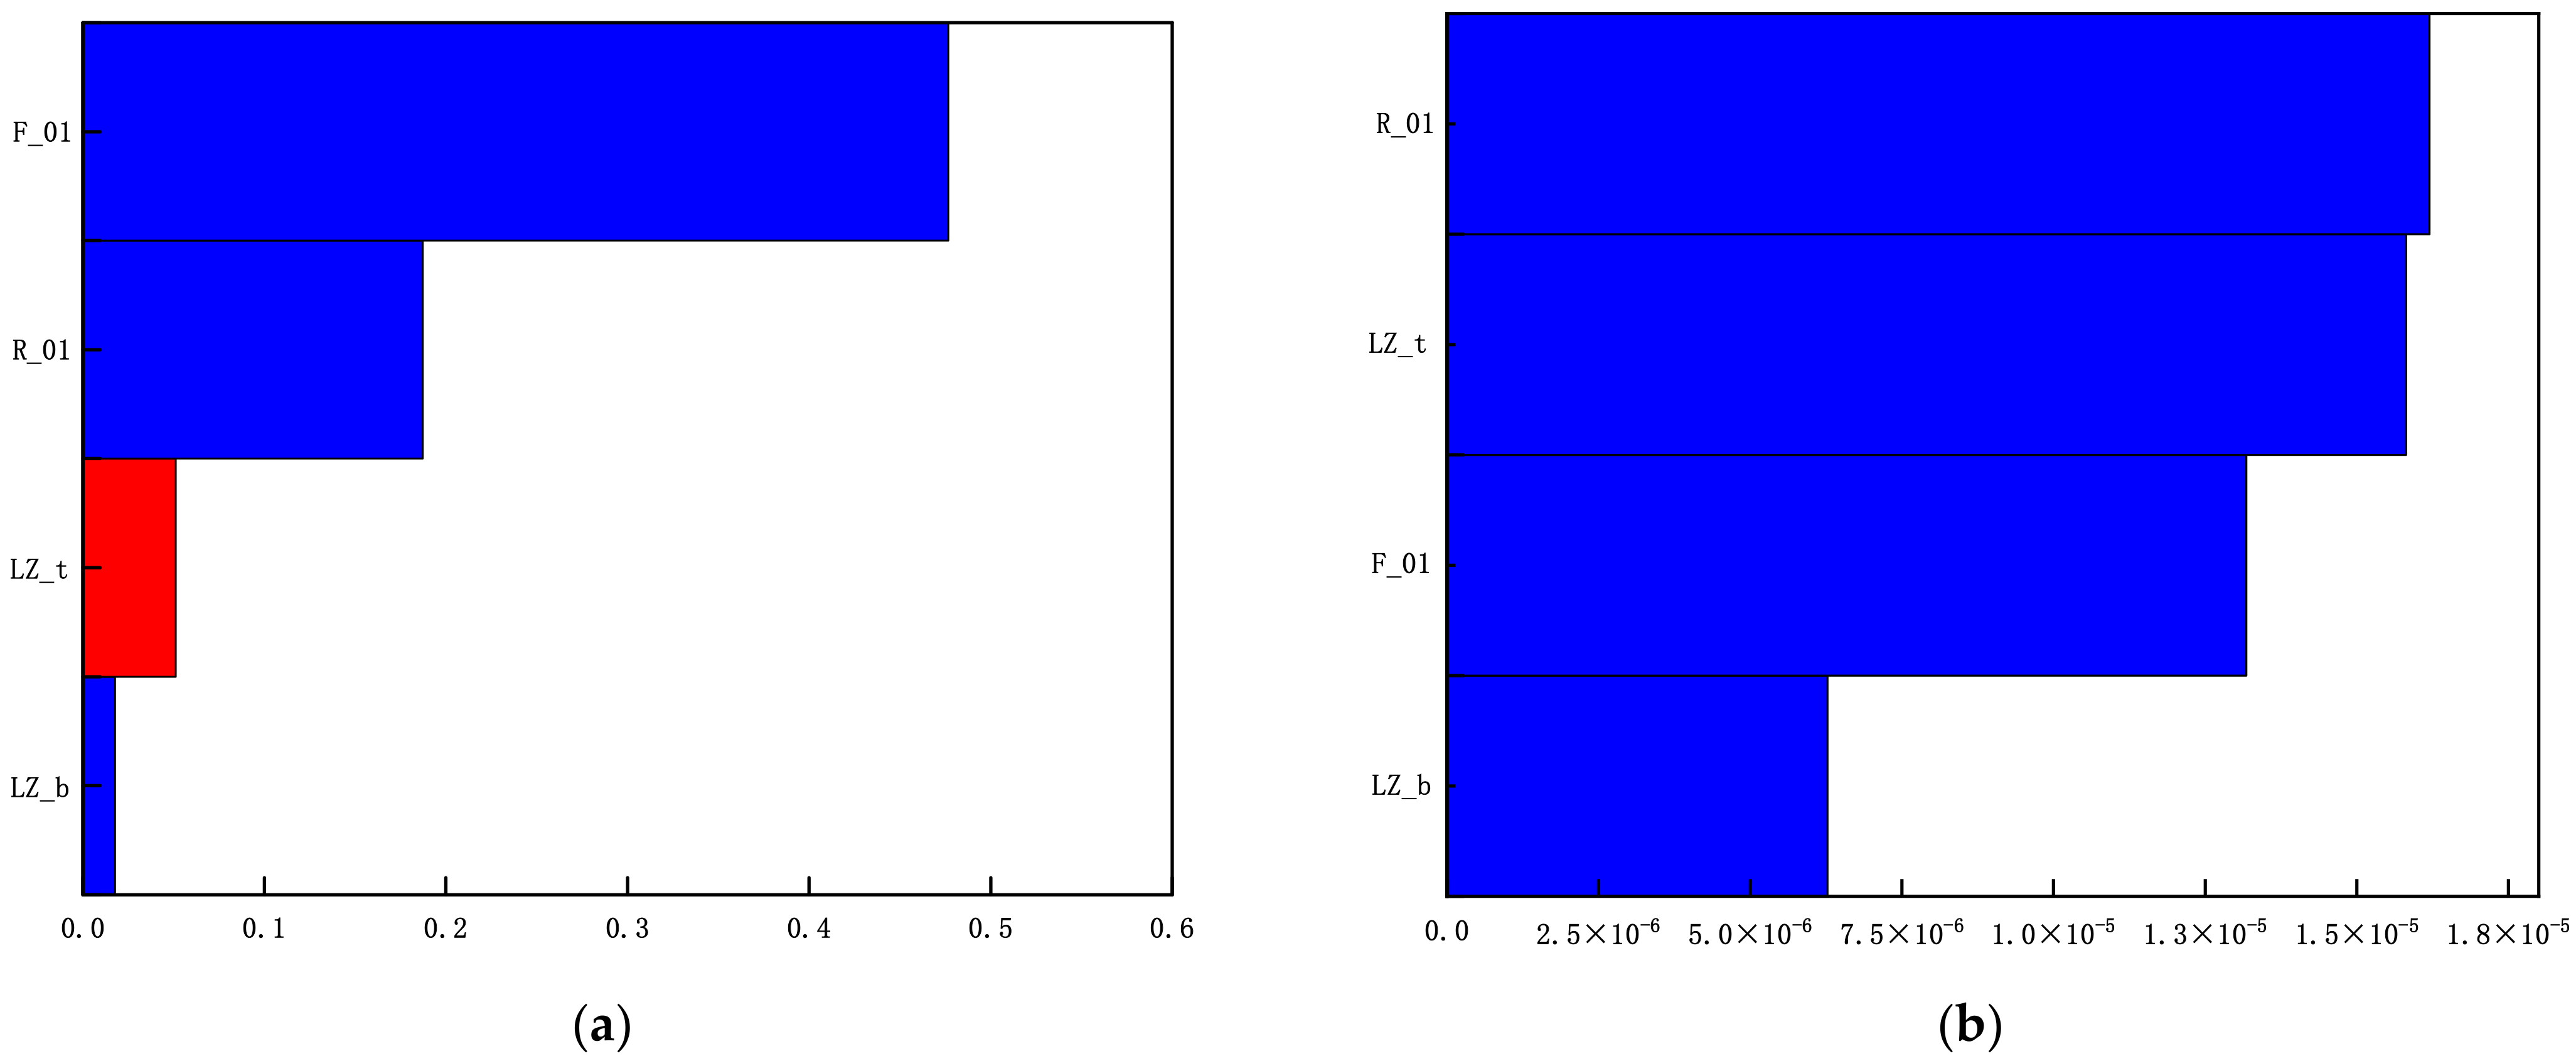
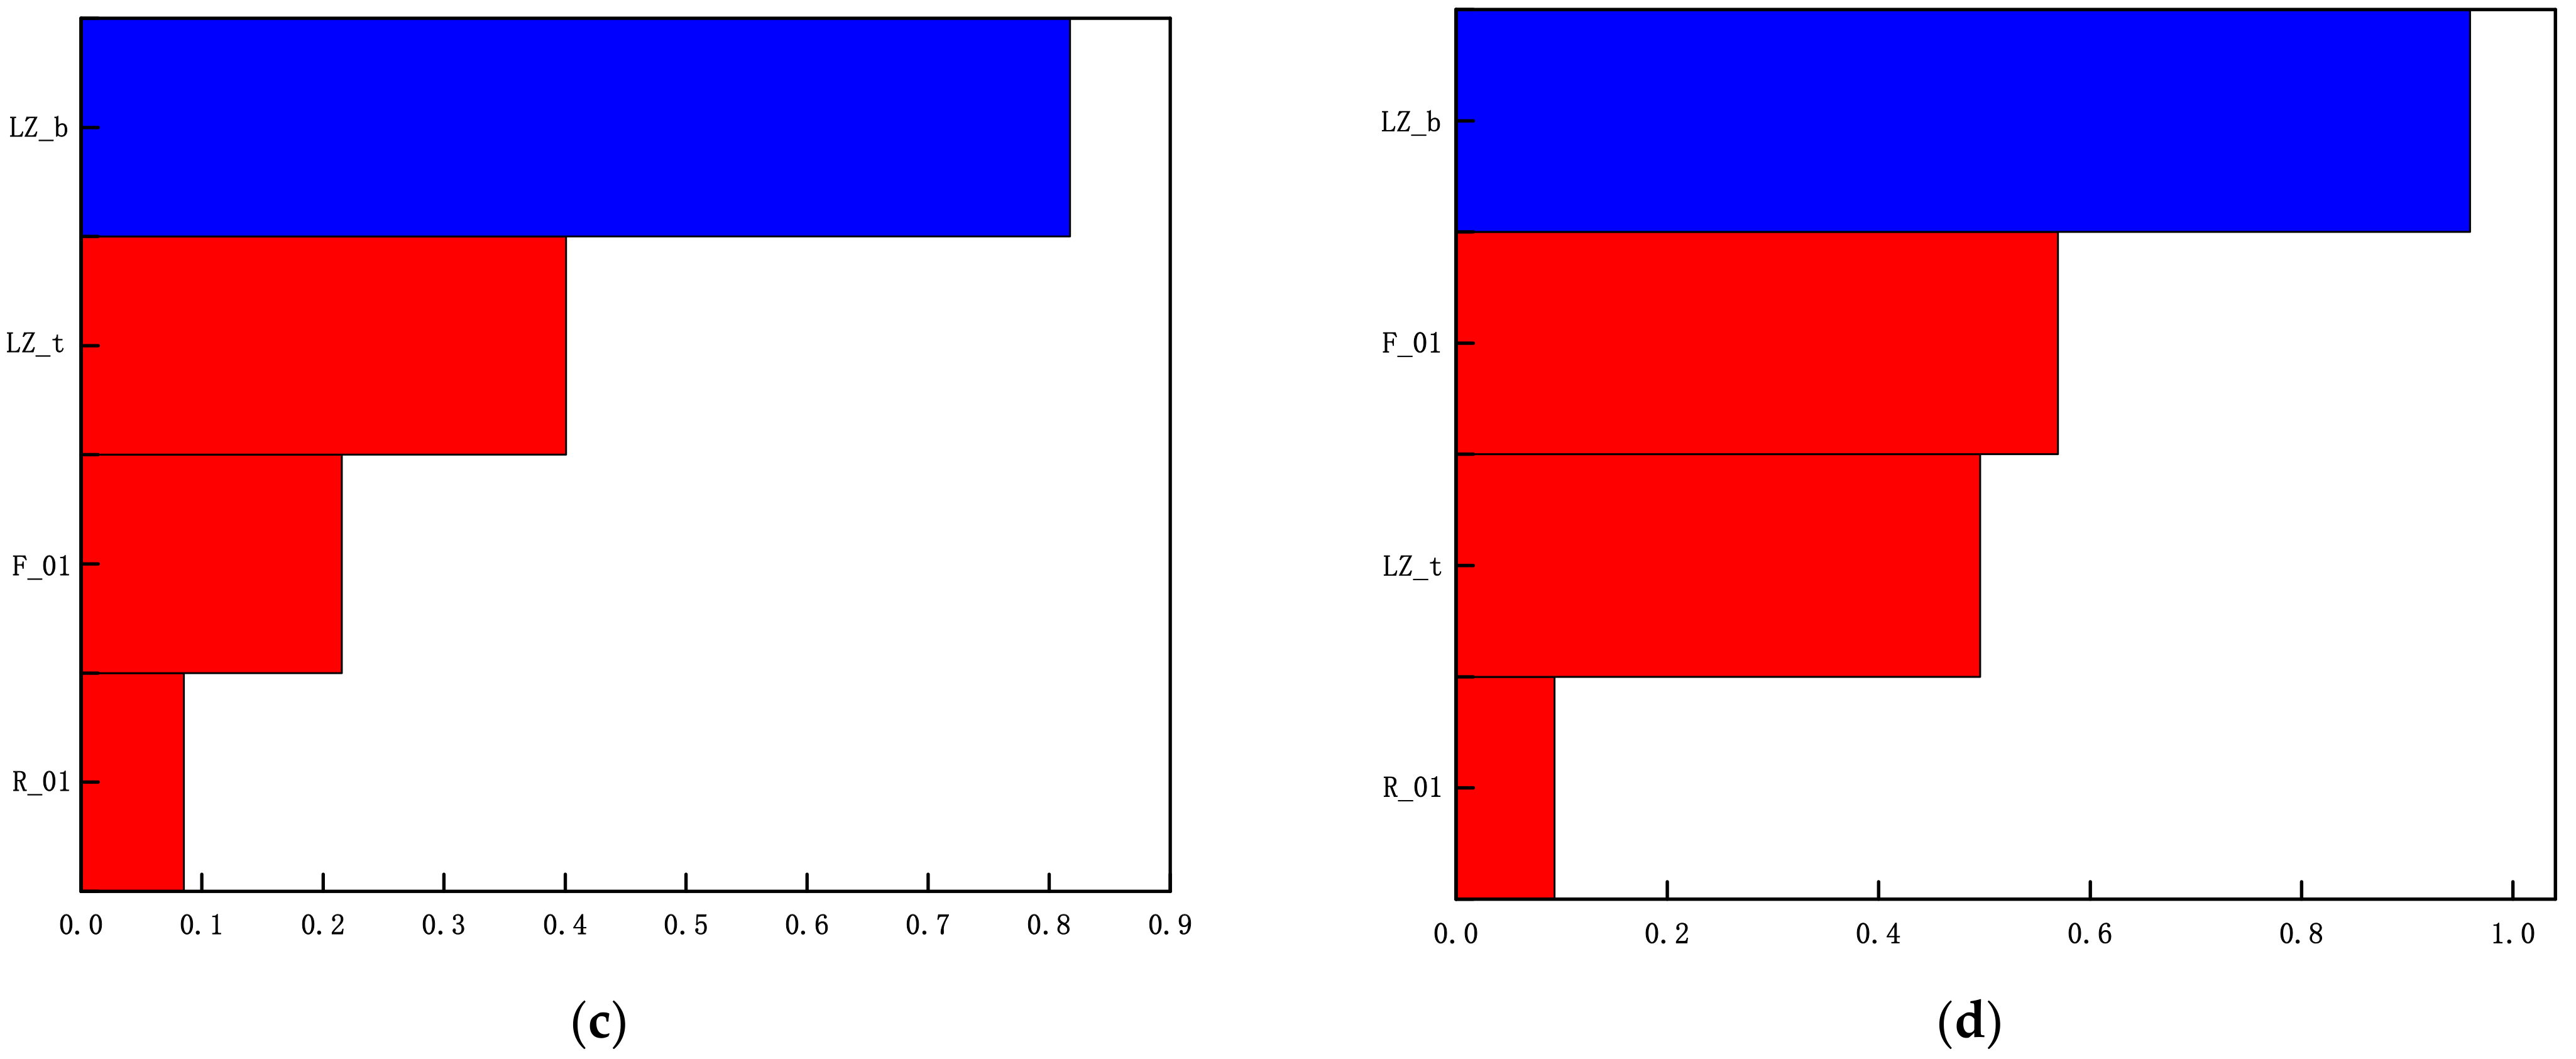
4.3. Experimental Design and Establishment of the Approximate Model

Through experimental design, key test factors of the aluminium alloy front subframe can be quickly identified, the optimal combination of the variables and parameters can be identified, and the relationship between the variables and optimization objectives can be analysed to reduce the subjectivity of the design and improve the reliability of the design [22]. In this paper, the optimal Latin hypercube experimental design algorithm is adopted [23,24]. It can make the fitting of factors and responses more accurate and make the sampling points more uniform. The distribution of the optimal Latin hypercube sample points is shown in Figure 8. The number of DOE design points is 25. Figure 9 shows the DOE multi-objective optimization platform built based on Isight.
DOE1 is the experimental design module; the Ansa_modal branch is the modal optimization branch, the Ansa_stiffness branch is the static stiffness optimization branch, and the Ansa_strength is the strength optimization branch. Regarding the strength optimization, three working conditions with maximum stresses are considered. They are the over one side deep pit condition, forward braking condition, and forward emergency braking condition.
The approximate model method is a method used to approximate a set of input variables and output variables by the mathematical model method. The relationship between the input variables and output response of the approximate model is as follows:
y ( x ) = y ˜ ( x ) + ε
where y ( x ) is the actual response value and an unknown function; y ˜ ( x ) is the response approximation with a known polynomial; and ε is the error between the actual value and the approximate value.
When the approximate model has a sufficient accuracy, the approximate model can be used to replace the actual model for simulation analyses to shorten the calculation time and improve the calculation efficiency. Figure 10 shows the construction process of the aluminium alloy front subframe approximate model.
A response surface model is used to construct approximate models [25,26,27]. Because four positions of the aluminium alloy front subframe are defined as parametric design variables, a second-order polynomial is selected to establish the response surface approximation model, and the specific formula is as follows [28]:
y ˜ = β 0 + β 1 x 1 + β 2 x 2 + + β M x M + β M + 1 x 1 2 + β M + 2 x 2 2 + + β 2 M x 2 M 2 + i j β i j x i x j
where y ˜ is the response approximation; β 0 , β 1 , β 2 β M β i j are the polynomial coefficients; and x 1 , x 2 x M x i are the components of the design variable.
After the approximate model is constructed, an error test should be conducted on the fitting results of the approximate model, and the R-squared error analysis method should be used to test the fitting accuracy between the approximate model and the actual sample points [29,30,31]. The closer R-squared is to 1, the higher the accuracy of the approximate model, with a high credibility. Moreover, a fitting accuracy above 0.9 is generally acceptable. The R-squared value of each response of the aluminium alloy front subframe is shown in Table 4, and it can be seen from Table 4 that the fitting accuracy of each response is greater than 0.98, indicating that the fitting effect of each response variable is good. An approximation model can be used in place of the actual model for multi-objective optimization simulations, thus greatly shortening the computing workload and calculation time.
Figure 11 shows the fitting results of the predicted and actual values of each response of the aluminium alloy front subframe. The abscissa is the predicted value, and the ordinate is the actual value. The points on the 45° oblique line indicate that the predicted results are the same as the actual results.
Figure 12 shows the response surface approximation model between the first-order frequency response of the aluminium alloy front subframe and each variable, and the response surface can better express the changing trend of the test point. The corresponding response value of the two variables can be found at any value within the design range. It can be seen from the equal potential surface that the degree of linearity of the fitting is relatively high.

4.4. Multi-Objective Optimization of the Aluminium Alloy Front Subframe Based on the Approximate Model

The multi-objective particle swarm optimization algorithm [32] was used to optimize the aluminium alloy front subframe. Multi objective particle swarm optimization is a population-based search process that uses the principles of evolutionary computation: first, initialize from a group of random populations, and search for the optimal value through updating the population generations. The evolution process depends on the previous population. Compared to other optimization algorithms, the advantage of the Multi Objective Particle Swarm optimization algorithm is its strong versatility, simplicity, and ease of implementation, with fewer parameters to adjust. Figure 13 shows the multi-objective optimization design platform based on the approximate model, in which Optimization is the multi-objective optimization module. Moreover, Approximation is the approximate model obtained after generating sample points through the optimal Latin hypercube experimental design. The parameters of the multi-objective particle swarm optimization algorithm are as follows: the maximum number of iterations is set to 100, in order to obtain more optimization results; the number of particles is set to 10; the inertia weight is set to 0.9; the global increment is set to 0.9; the particle increment is set to 0.9; the maximum velocity is set to 0.1; the max failed runs is set to 5; the failed run penalty value is set to 1.0 × 1030; the failed run objective value is set to 1.0 × 1030.
The multi-objective optimization design based on the response surface approximation model iteration was run 1002 times. The local effect diagram can show which had the greatest influence on the target response variable and can find the weak link in the design. To better guide the design, the local effect between each variable and the response is shown in Figure 14. Blue represents a positive effect, and red represents a negative effect. From the local effect diagram, it can be seen that F_01 has the most significant effect on the frequency, R_01 has the most significant effect on the mass, and LZ_b has the most significant effect on the stress over one side deep pit condition and forwards braking condition. The optimal solution set was selected from the 1002 iterations to make it closest to the set target value, and the optimal solution of the four variables was finally determined, as shown in Table 5.
Figure 15 shows the digital–analogue comparison before and after multi-objective optimization of the aluminium alloy front subframe. After optimization, the weight is reduced from 18.55 kg to 17.6 kg, reducing the weight by 0.95 kg.

5. Performance Analysis and Verification of the Aluminium Alloy Front Subframe after Optimization

5.1. Strength Performance Analysis of the Optimized Aluminium Alloy Front Subframe

The displacement boundary conditions and load boundary conditions from Section 3.1 are used to analyse the strength performance of the optimized aluminium alloy front subframe. Figure 16 shows the cloud diagram of the stress analysis results of the optimized aluminium alloy front subframe under some typical working conditions. According to the cloud diagram of the stress analysis results, the working condition corresponding to the maximum stress of the optimized aluminium alloy front subframe is the limiting condition of the one side deep pit condition, and the stress value is 179.3 MPa, which is 1.3 MPa less than the value of 180.6 MPa before optimization.
Table 6 shows the comparative analysis results of the stress of the aluminium alloy front subframe before and after optimization. After optimization, the stress of the aluminium alloy front subframe is reduced in all typical working conditions, which is less than the material yield strength. After optimization, the aluminium alloy front subframe meets the strength requirements.

5.2. Static Stiffness Performance Analysis of the Optimized Aluminium Alloy Front Subframe

Table 7 shows the comparative analysis results of the static stiffness performance of the aluminium alloy front subframe before and after optimization. The results show that the static stiffness values of each hard point of the aluminium alloy front subframe have little change compared with those before optimization, which is within the acceptable range and meets the design requirements.

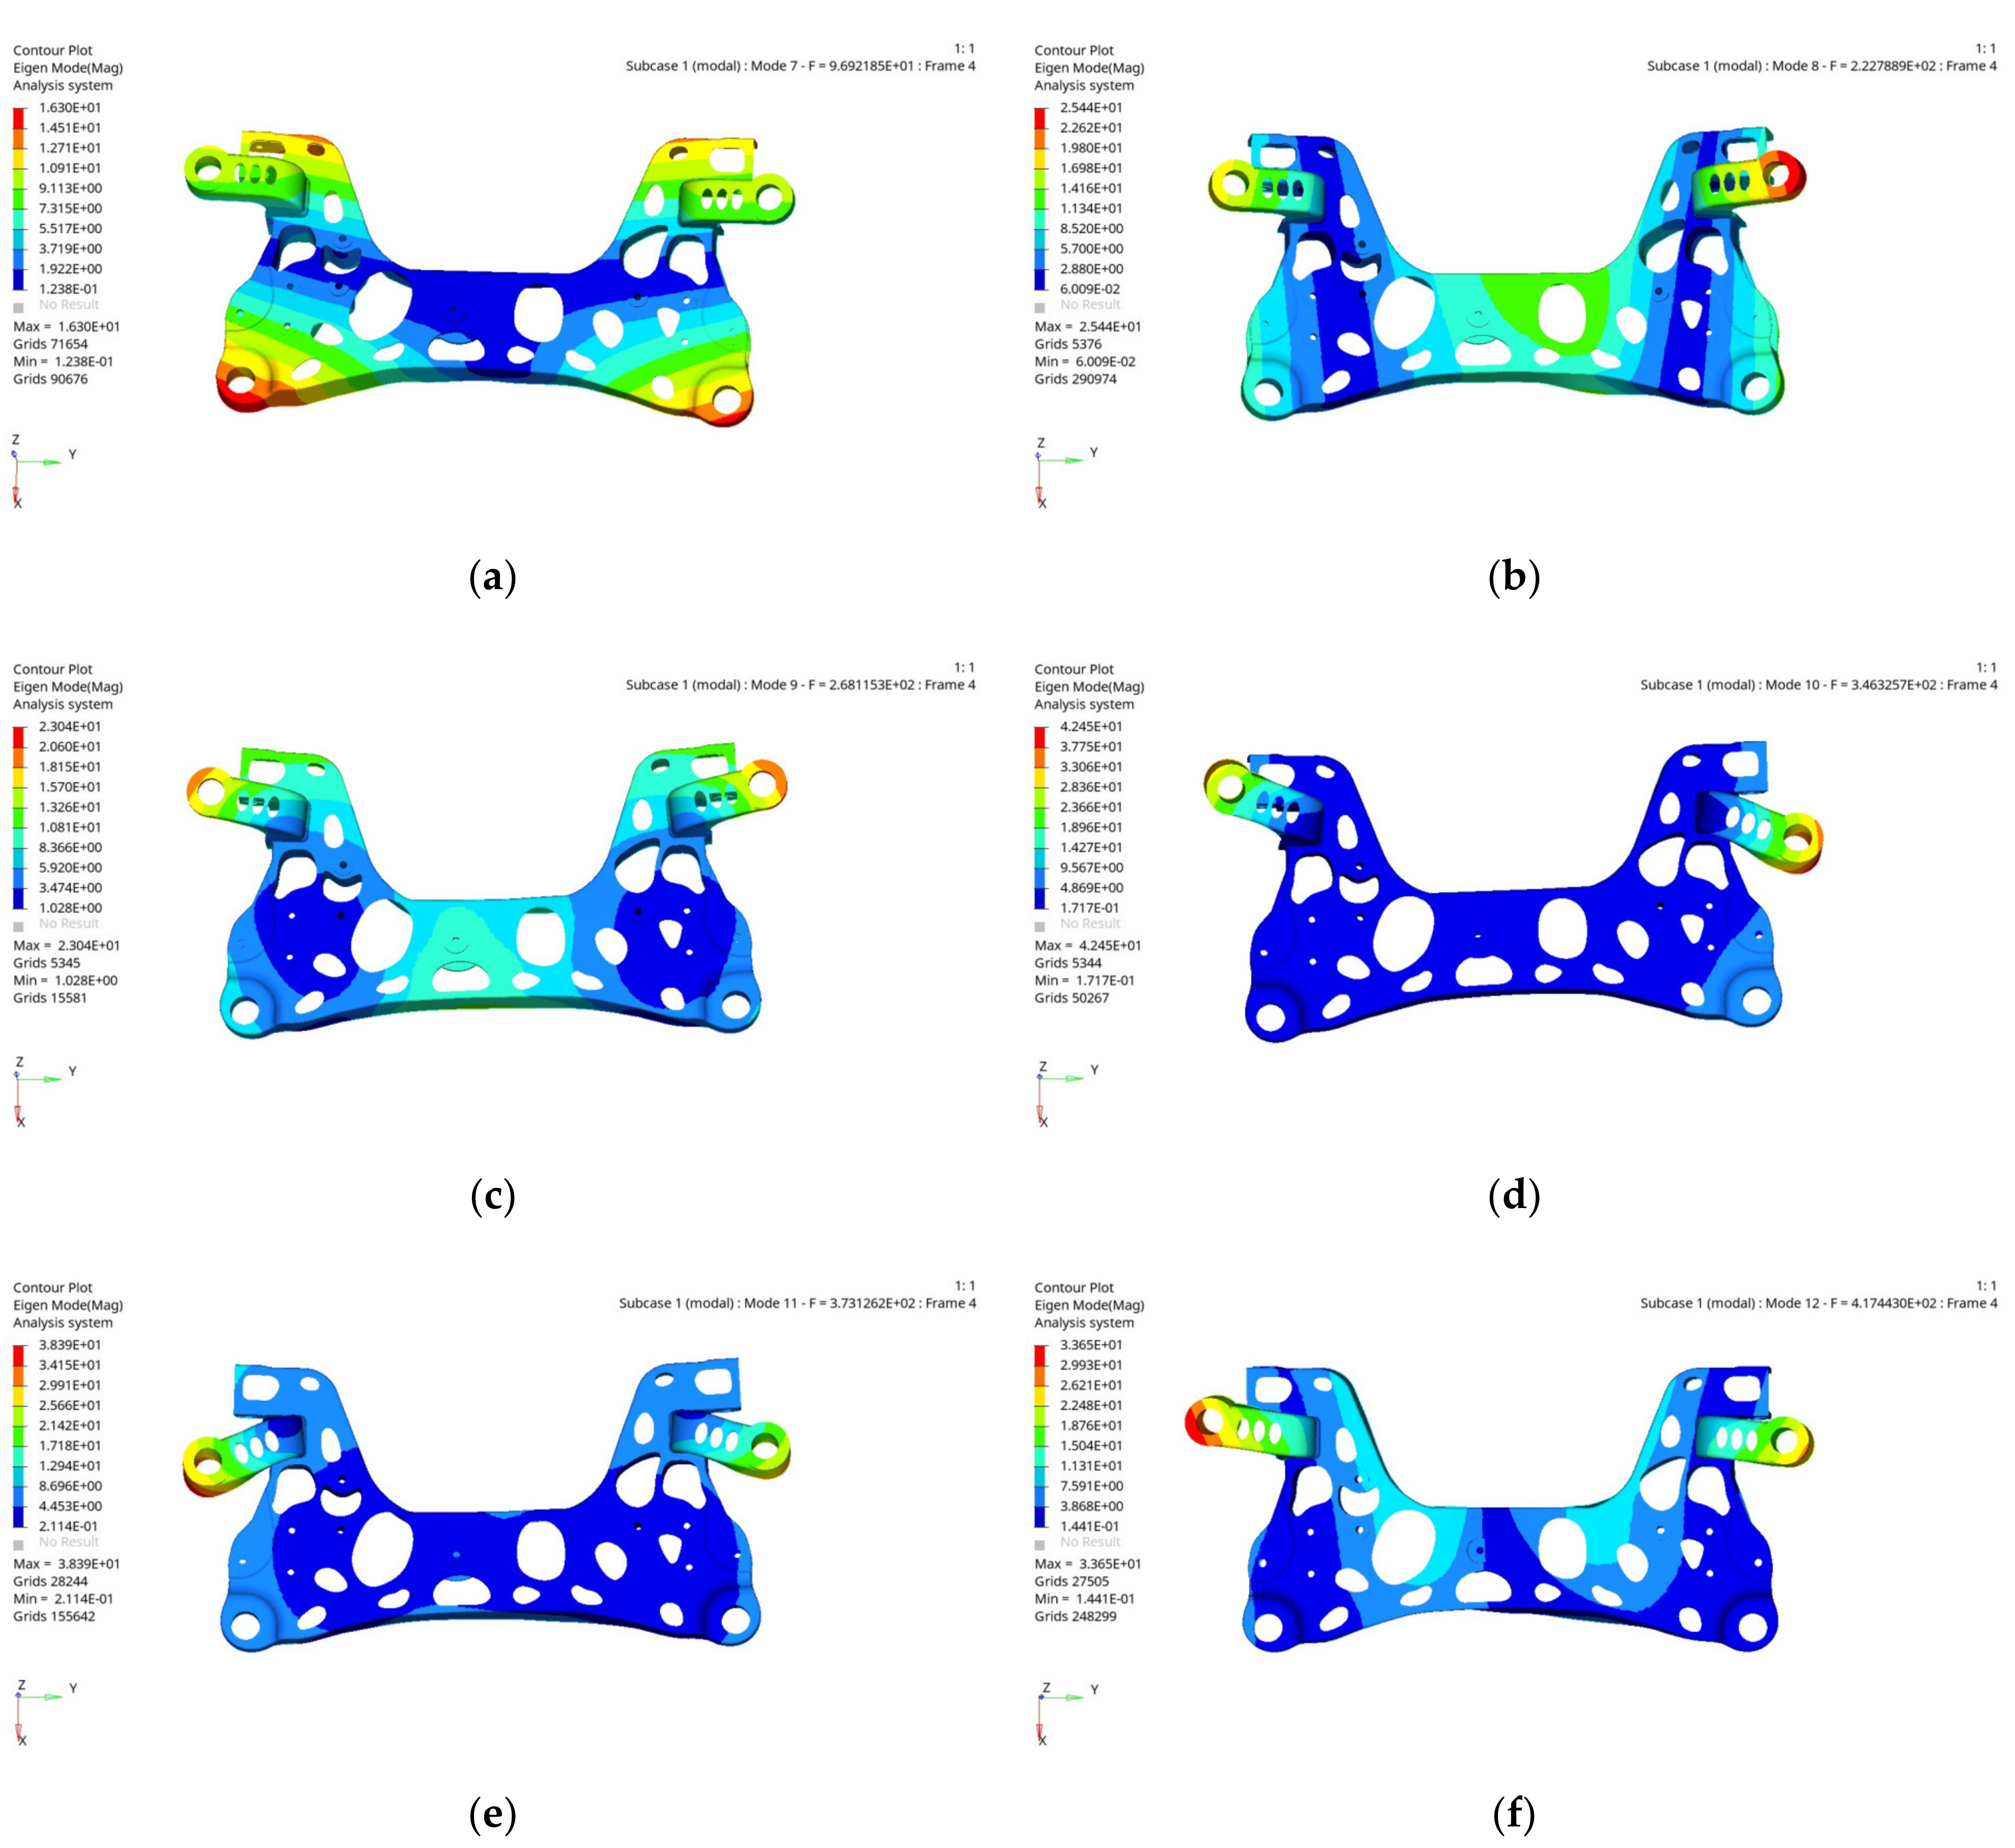
5.3. Free Modal Performance Analysis of the Optimized Aluminium Alloy Front Subframe

Free modal analysis is carried out on the optimized aluminium alloy front subframe, and the first six rigid body modals are filtered out. The cloud diagram of the free modal analysis results is shown in Figure 17. Table 8 shows the comparison results of the free modal analysis before and after optimization of the aluminium alloy front subframe. After optimization, the first-order modals and fifth-order modals of the aluminium alloy front subframe are slightly reduced, while the other modals are improved. These results are higher than the ground and engine excitation frequencies, and the difference between each modal frequency is more than 20 Hz. The optimized aluminium alloy front subframe meets the modal performance requirements.

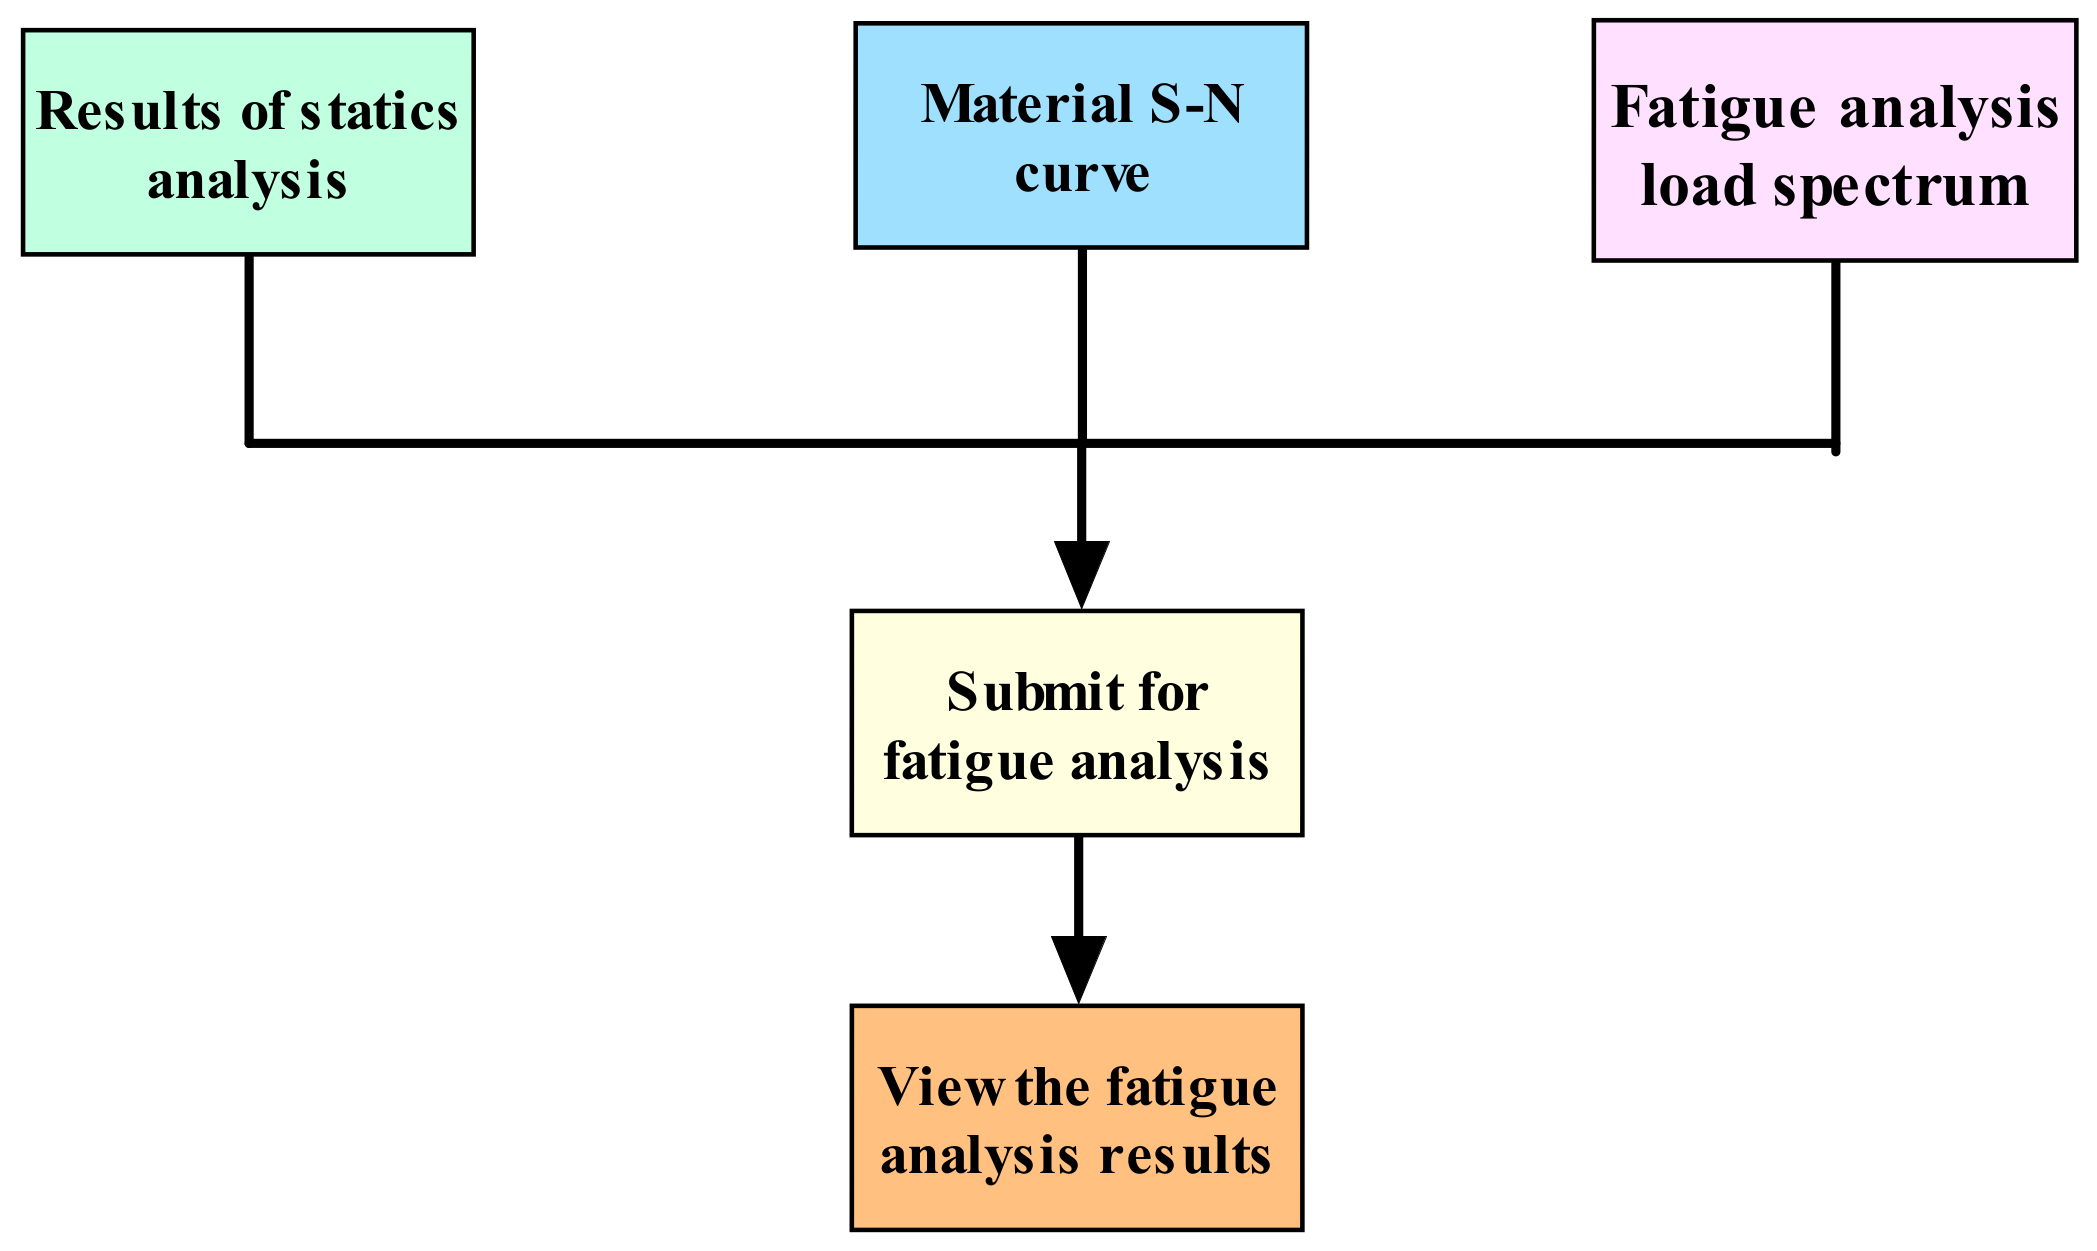
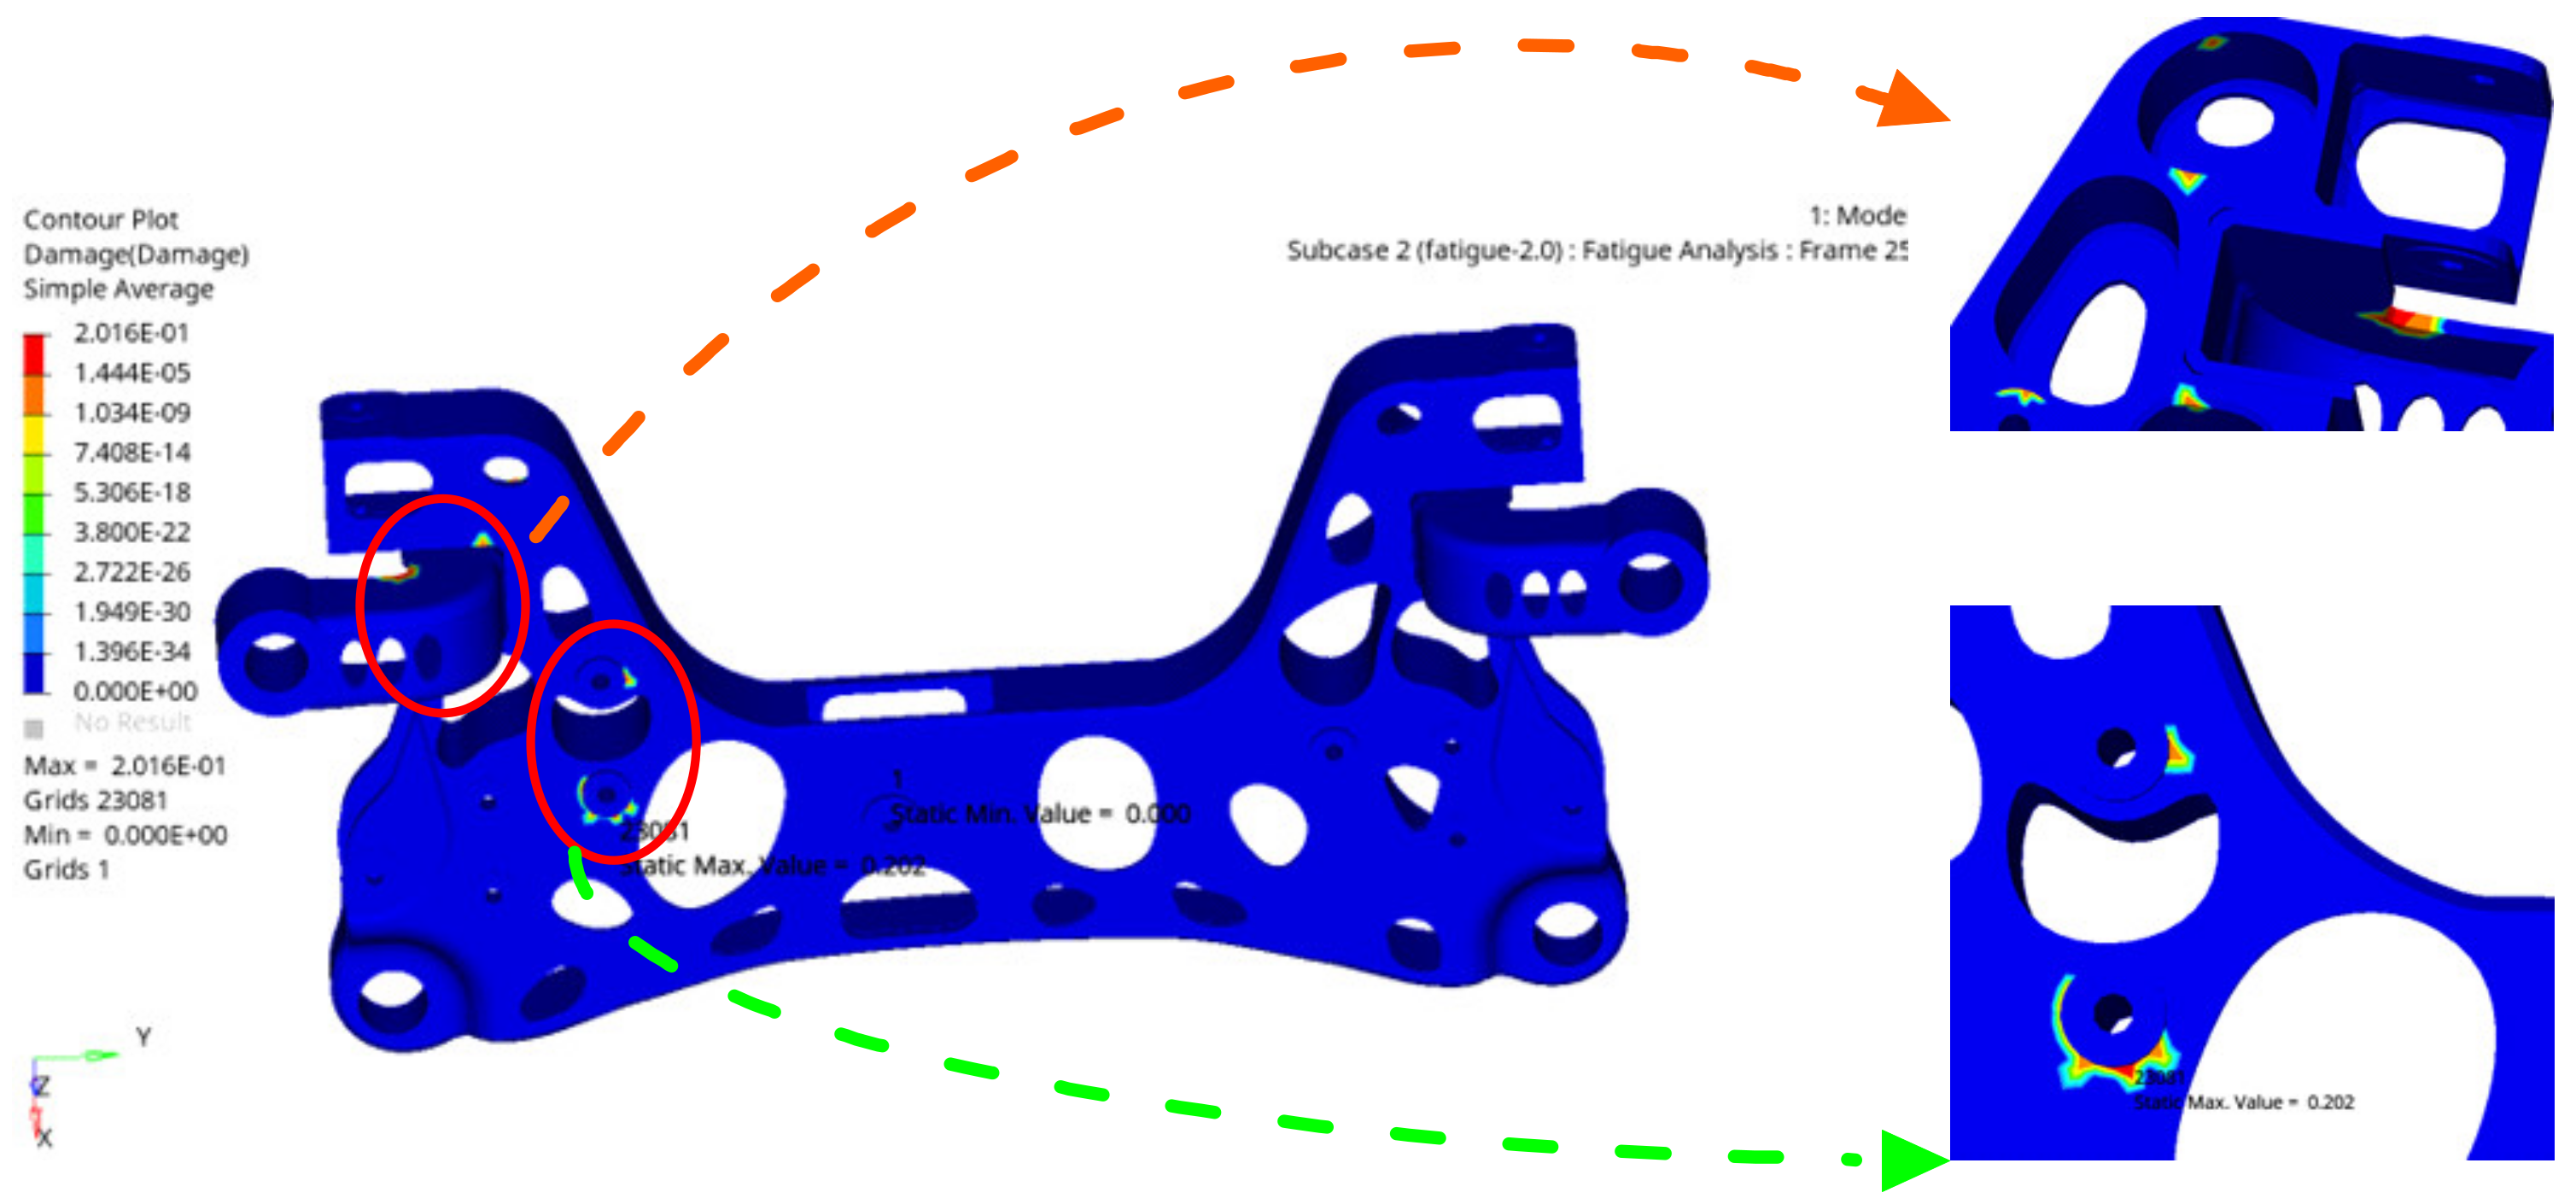
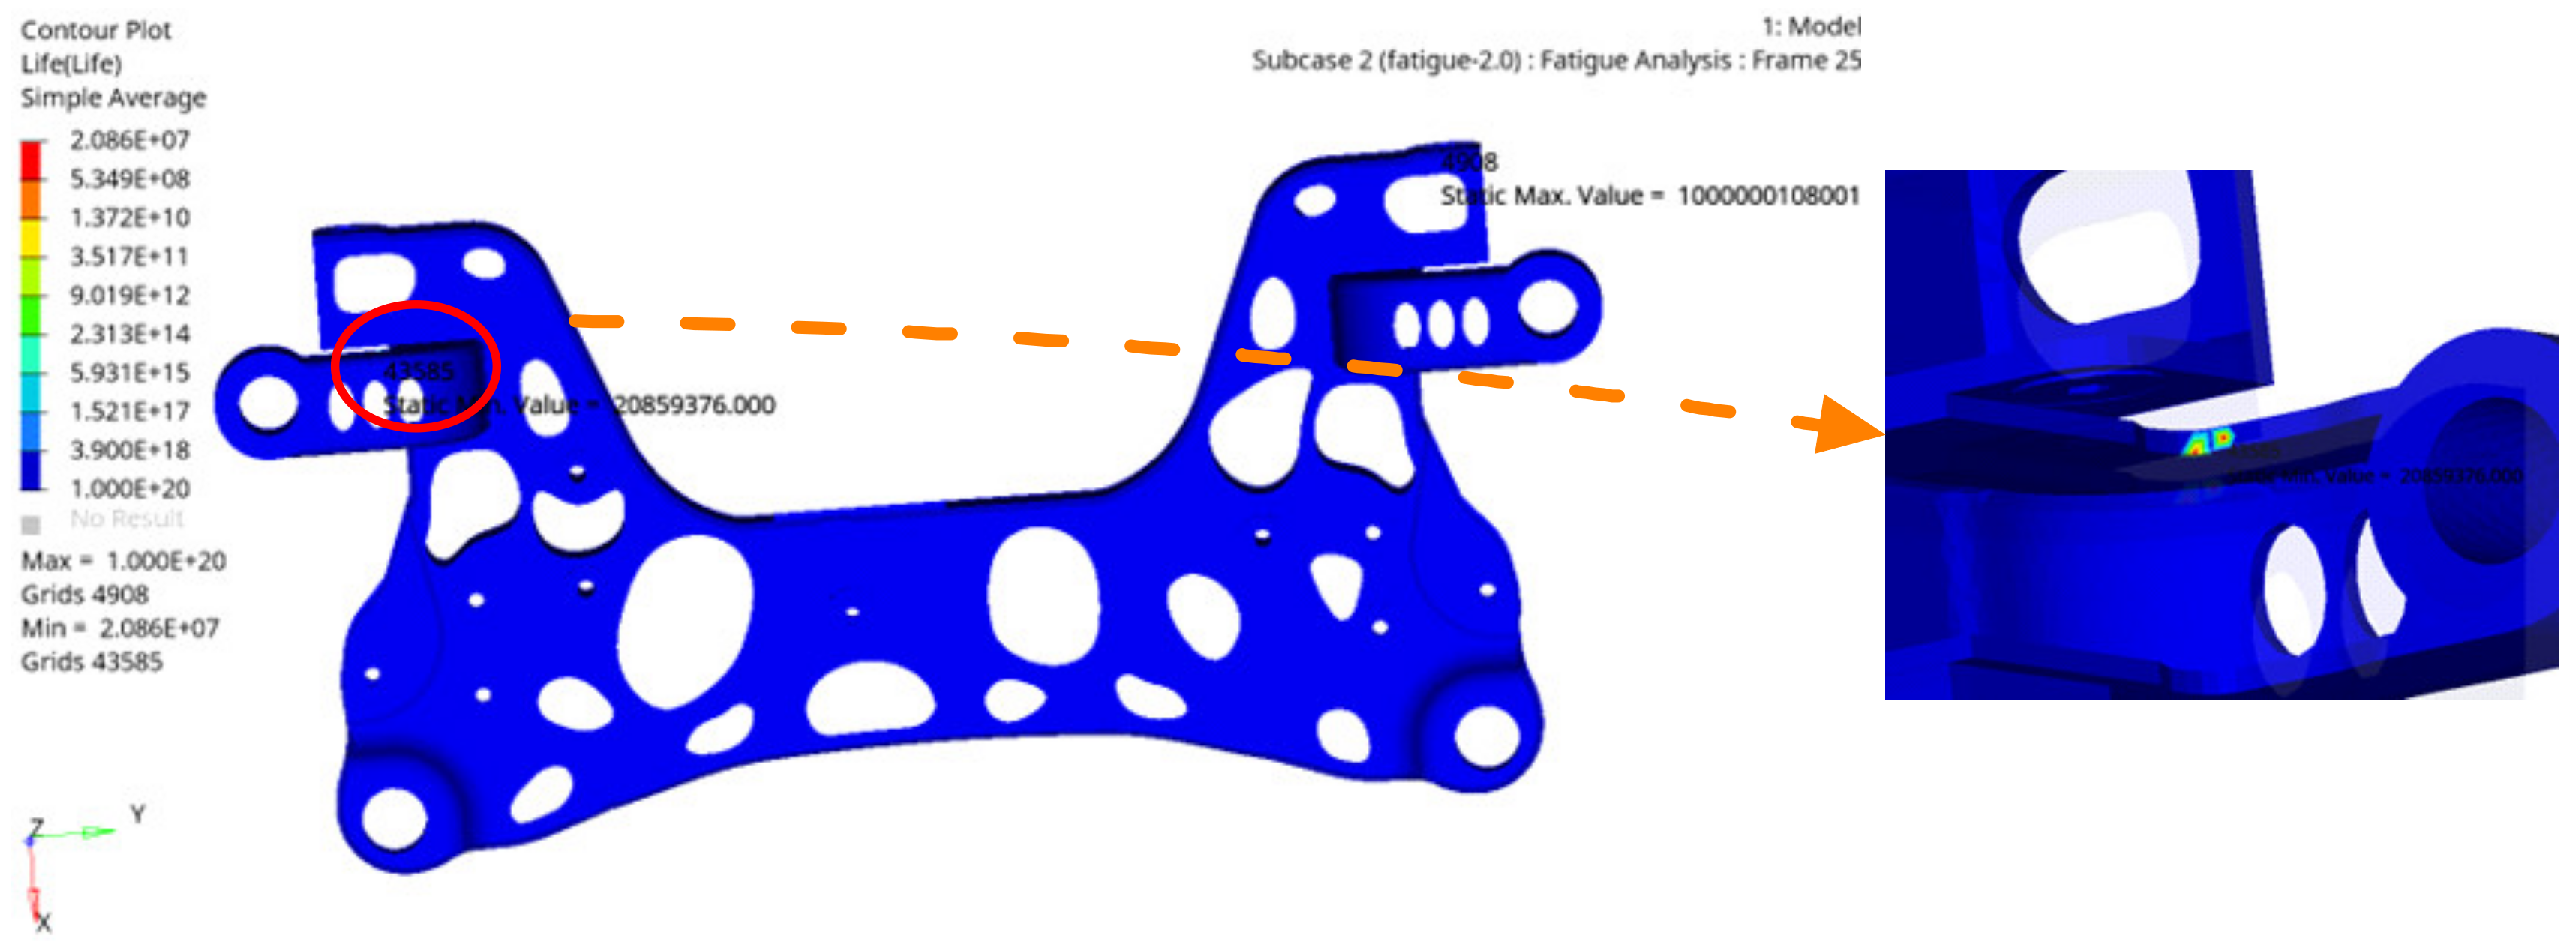
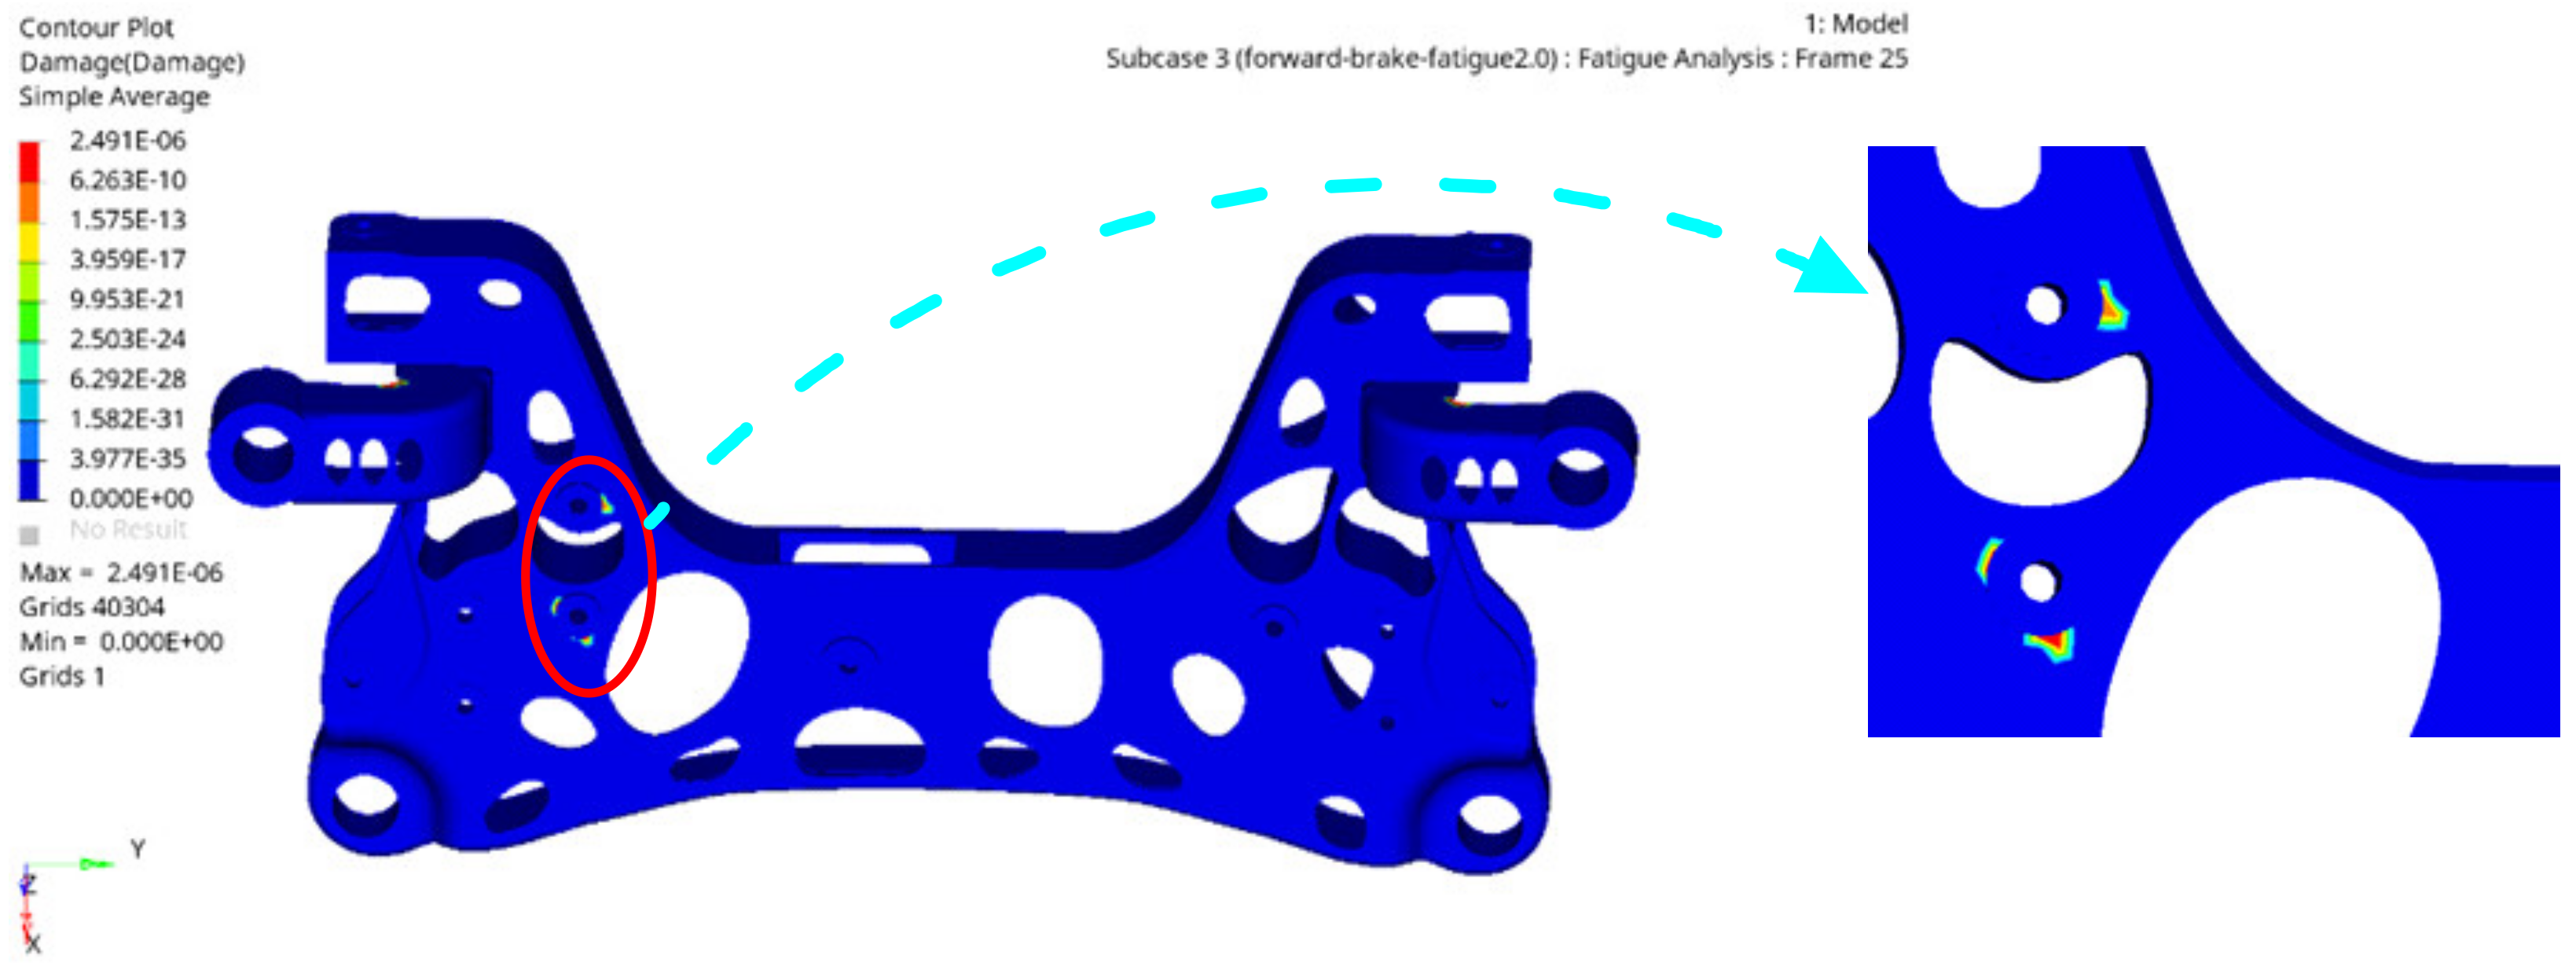
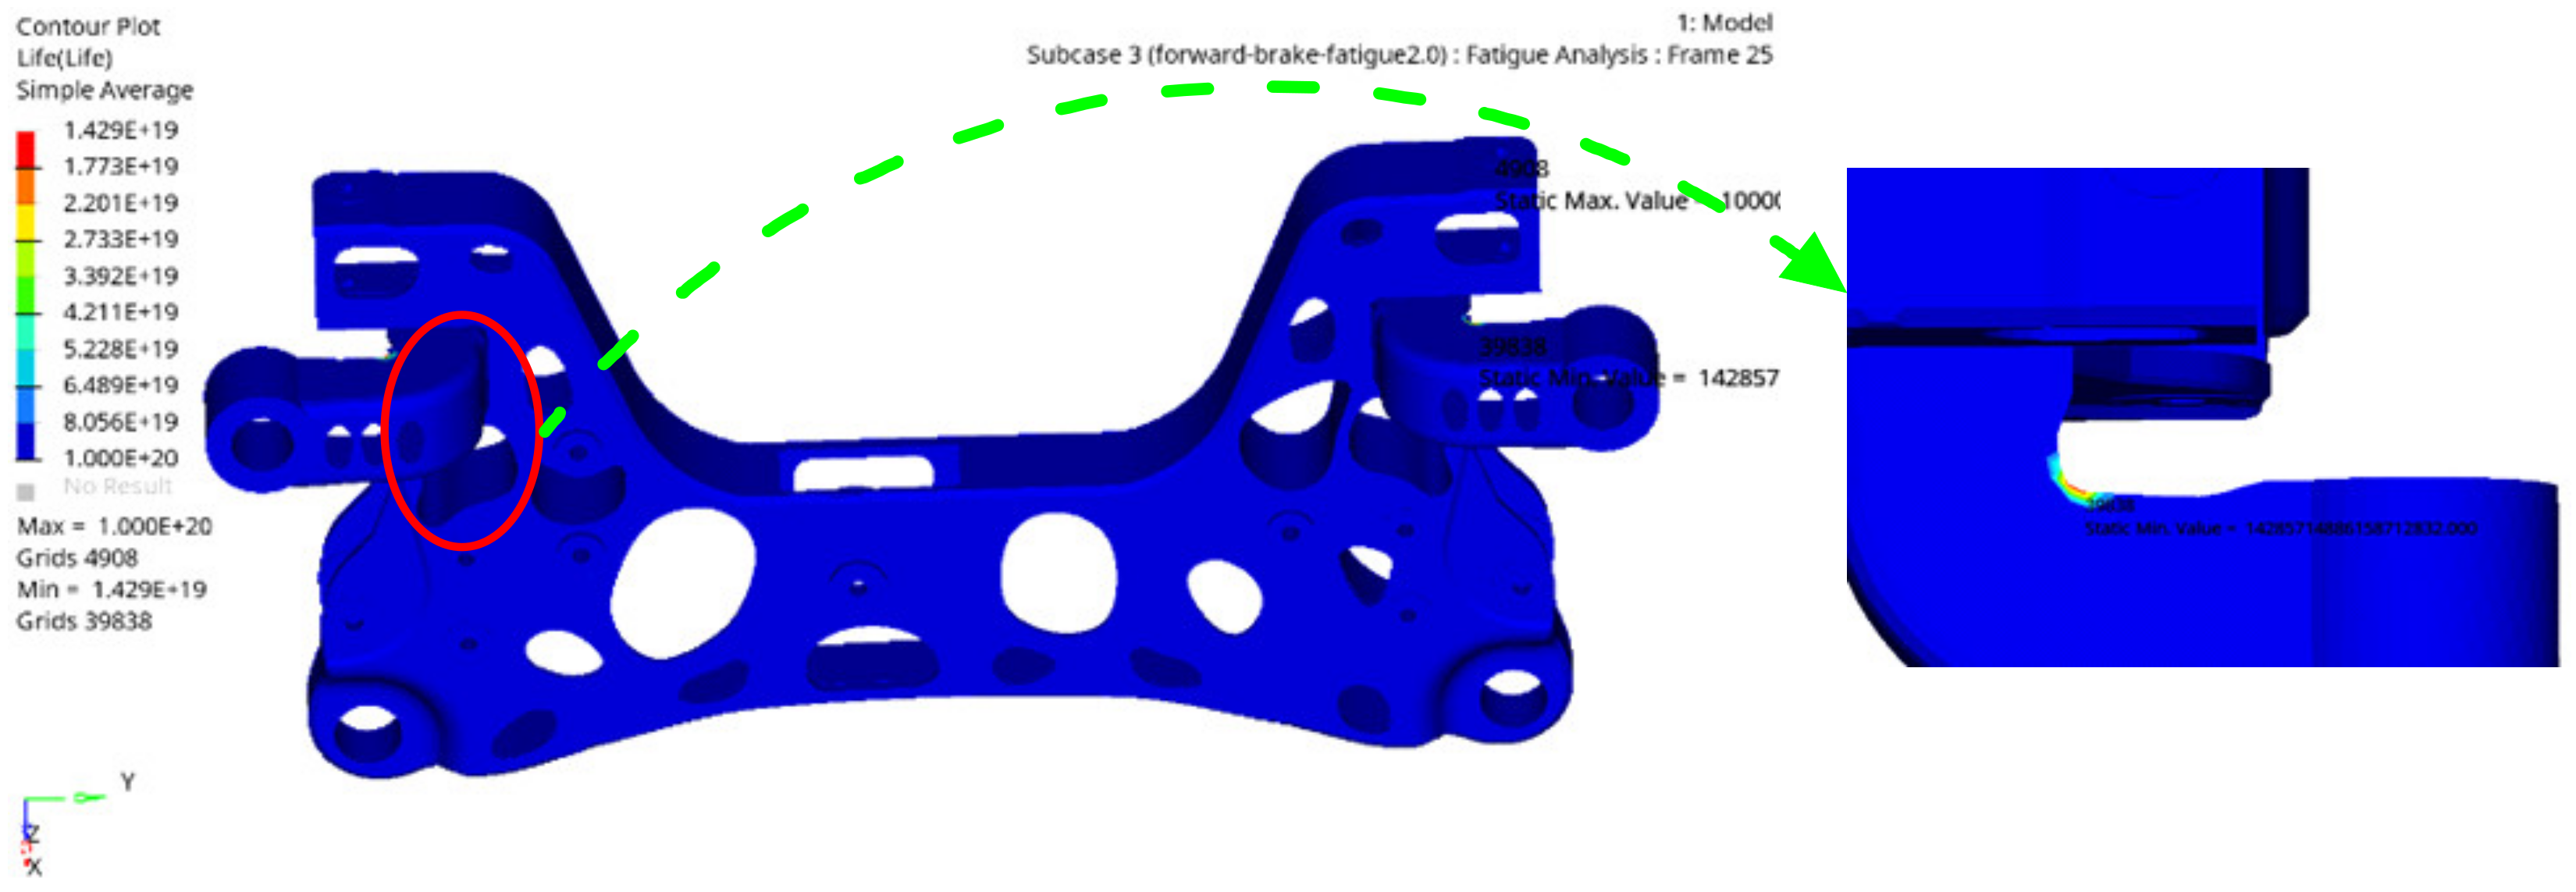
5.4. Fatigue Life Analysis of the Optimized Aluminium Alloy Front Subframe

Automobile parts will be subjected to various excitation loads during use. Even if the automobile parts meet the strength requirements, they will fracture or fail due to fatigue damage. Therefore, it is imperative to carry out a fatigue analysis of the aluminium alloy front subframe. The aluminium alloy front subframe will be affected by the excitation of the ground and the engine during use because of a high stress alternating frequency; therefore, the analysis method of the high cycle fatigue is adopted, that is, the stress-life (S–N) fatigue analysis method [33,34,35,36,37]. The fatigue life analysis of the aluminium alloy front subframe is carried out in the fatigue process module of the HyperMesh software, and the whole fatigue analysis process is shown in Figure 18.
After the pre-treatment parameters of the fatigue analysis are set, they are submitted to the solver for calculation. The fatigue life of the aluminium alloy front subframe is analysed under two conditions of high stress: the over one side deep pit condition and forward braking condition. The target value of the fatigue damage is less than 0.25. The fatigue damage cloud diagram and fatigue life cloud diagram of the optimized aluminium alloy front subframe are shown in Figure 19 and Figure 20, respectively, under the one side deep pit conditions.
It can be seen from Figure 19 that the maximum fatigue damage of the aluminium alloy front subframe is 0.201, which is less than the target value of 0.25; thus, the design requirements are met. It can be seen from Figure 20 that the minimum fatigue life of the aluminium alloy front subframe is 2.08 × 10⁷, which also meets the design requirements.
The fatigue damage cloud diagram and fatigue life cloud diagram of the aluminium alloy front subframe under forwards braking conditions are shown in Figure 21 and Figure 22.
Figure 21 shows that the maximum fatigue damage of the aluminium alloy front subframe in the forward braking condition is 2.49 × 10⁻⁶, which is far less than the target value of 0.25; thus, the design requirements are satisfied. Figure 22 shows that the minimum fatigue life of the aluminium alloy front subframe in the forward braking condition is 1.42 × 10¹⁹, which also meets the design requirements.

6. Test Analysis of the Aluminium Alloy Front Subframe Sample

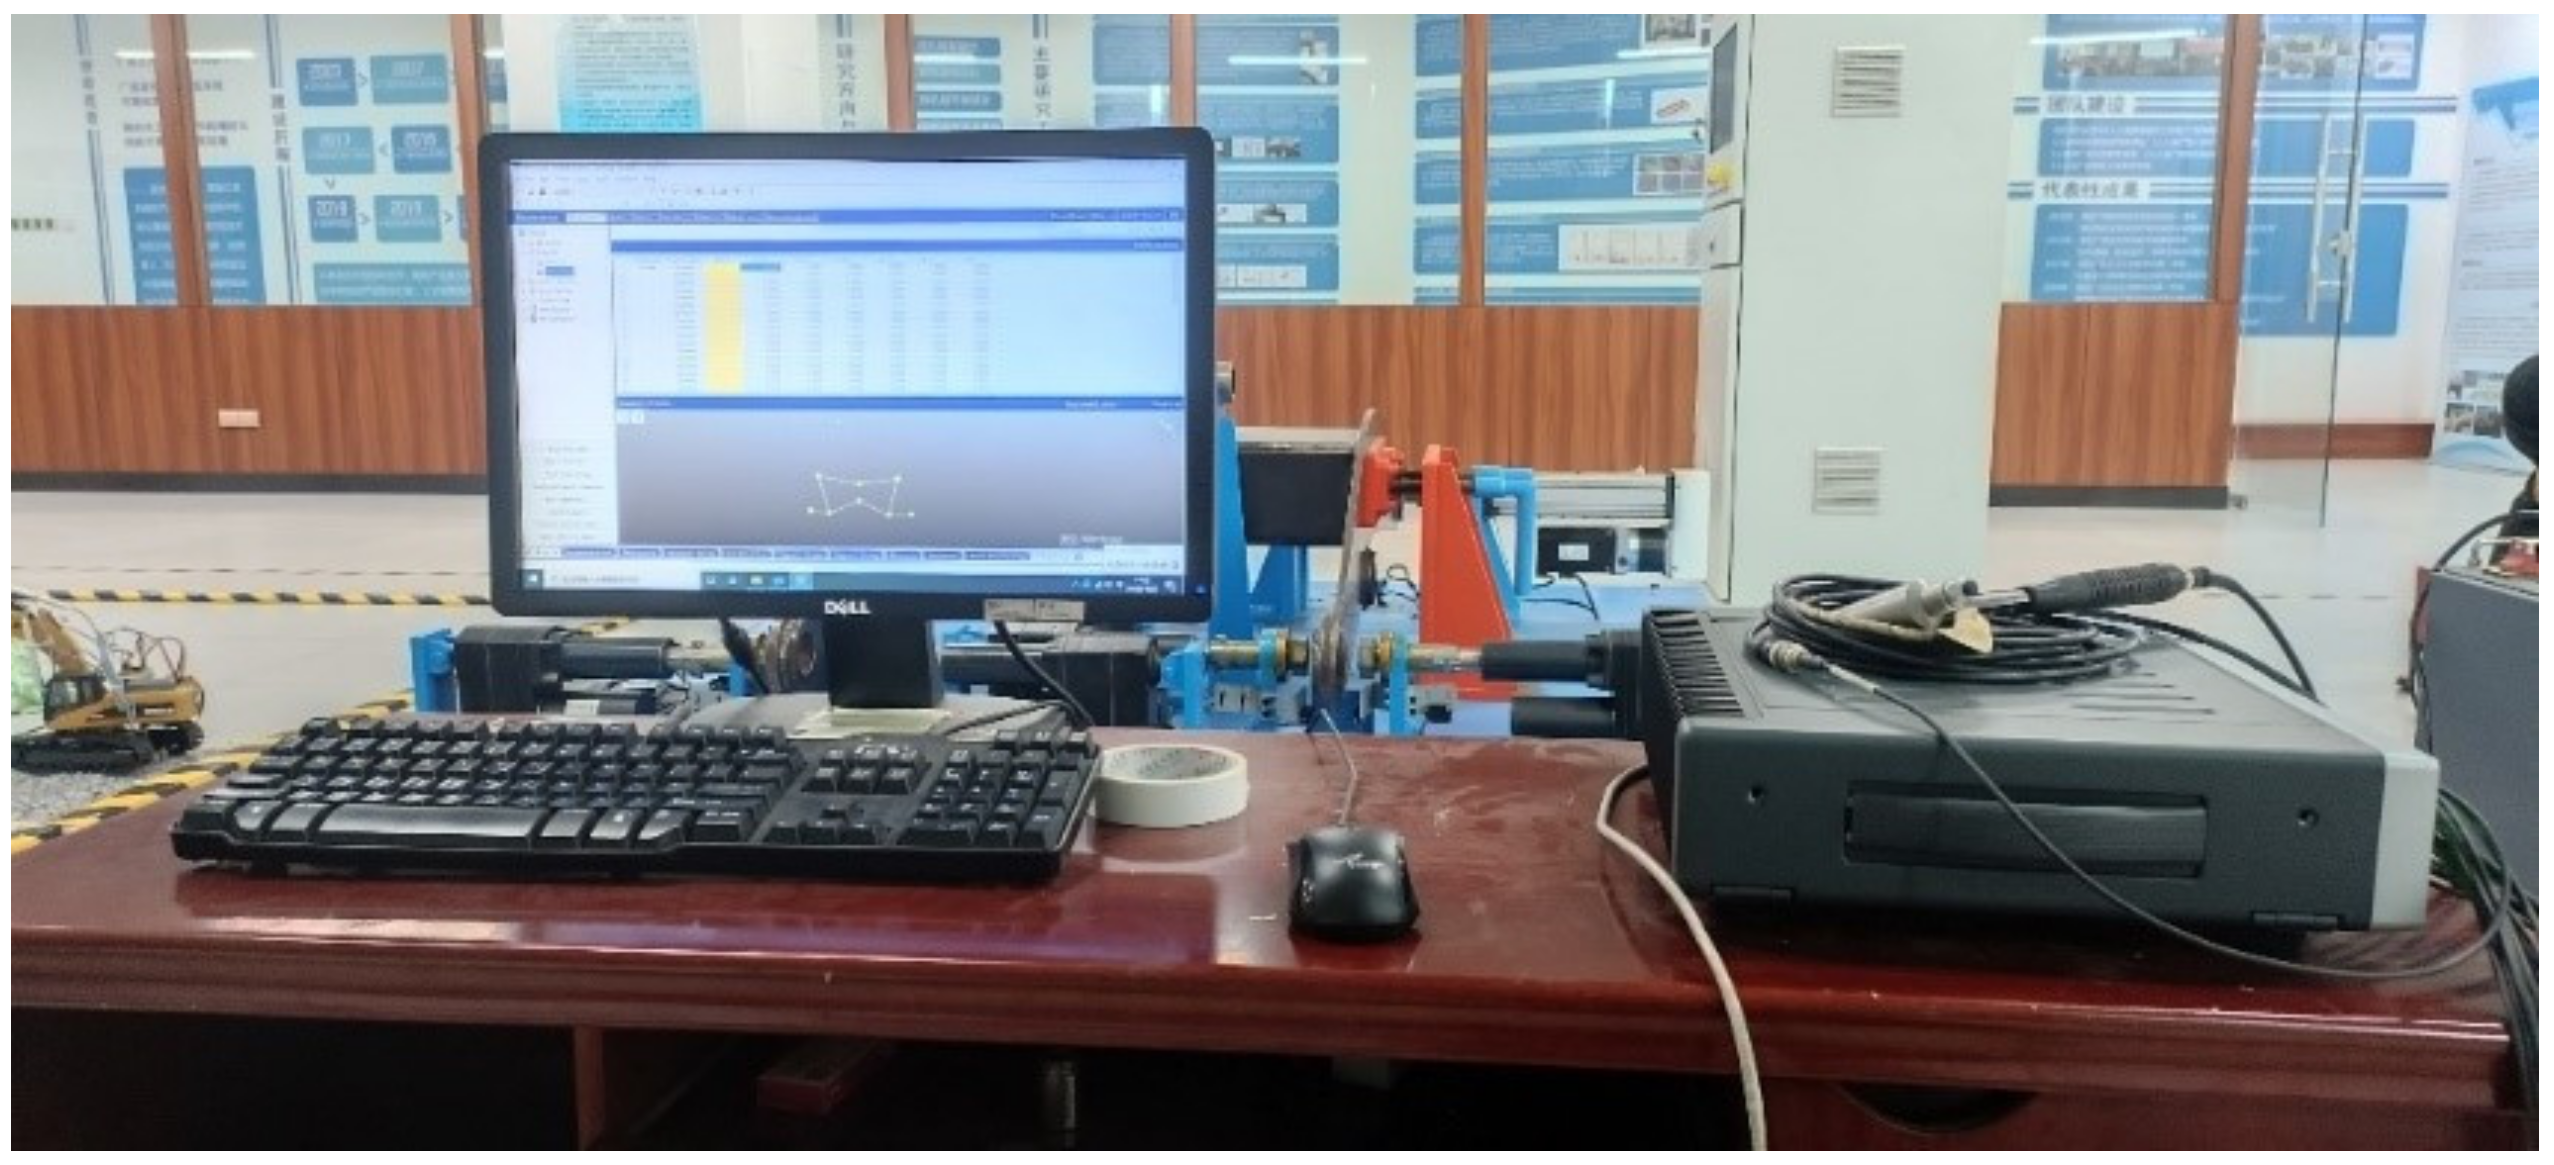
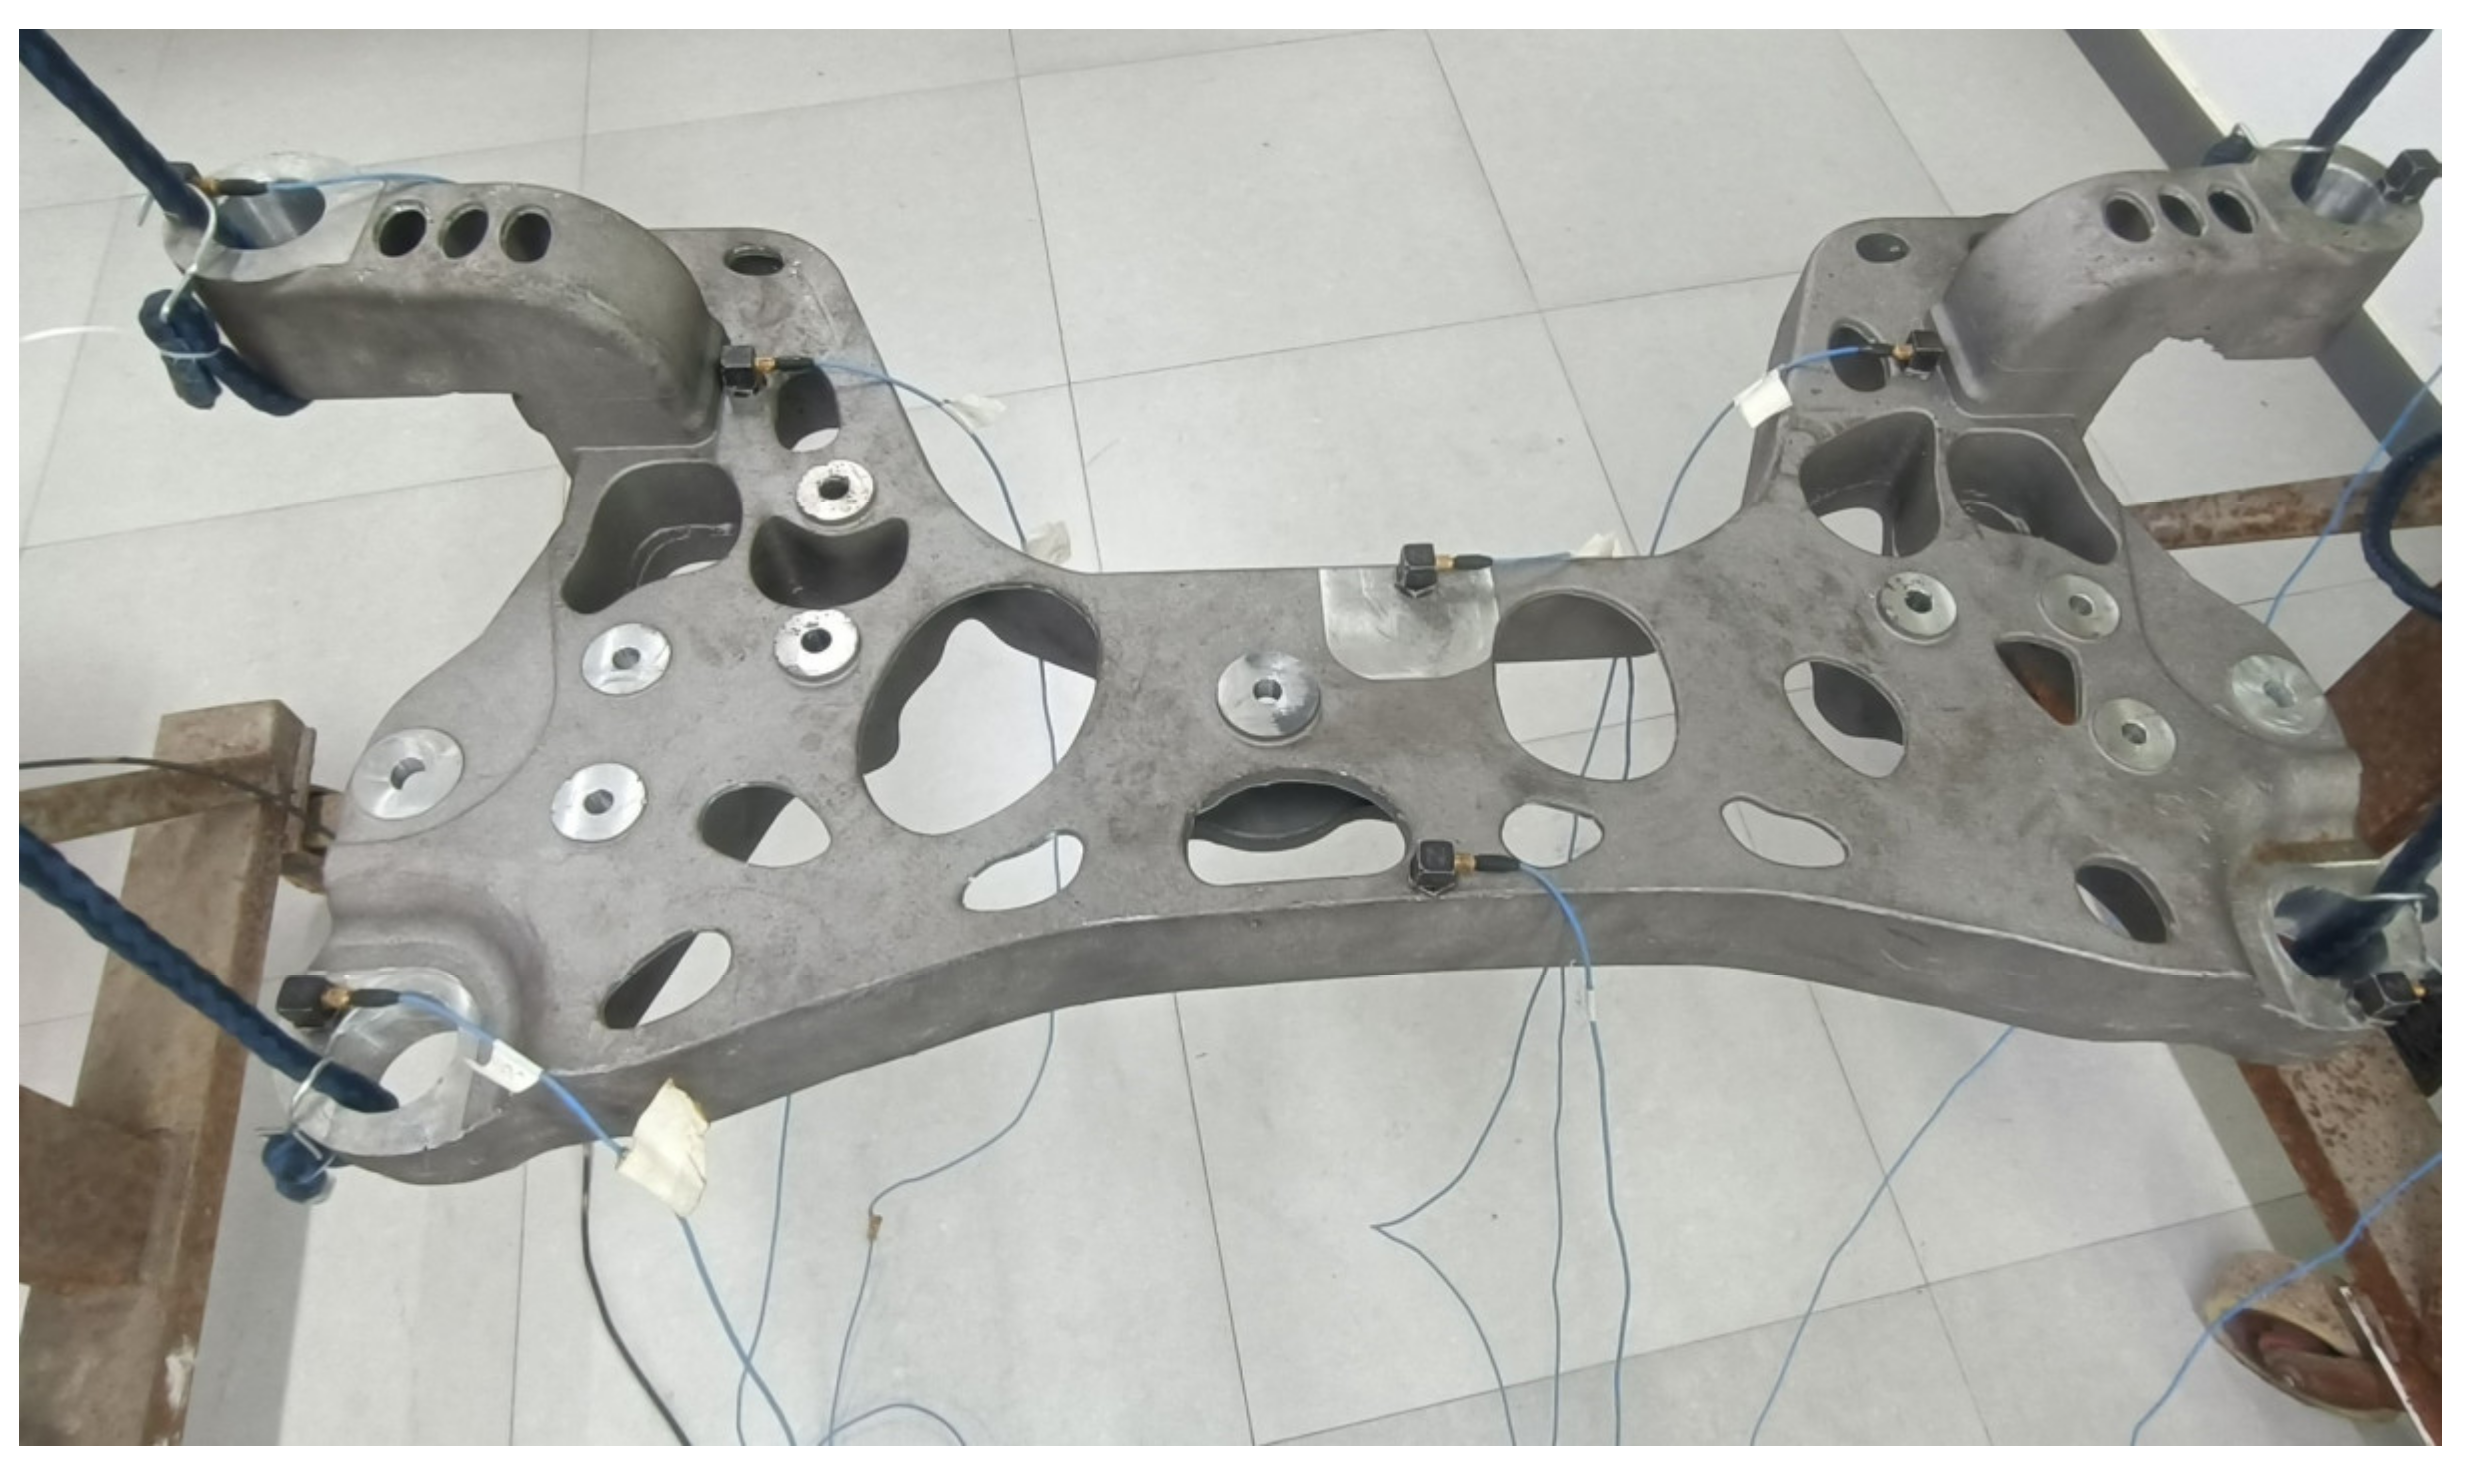
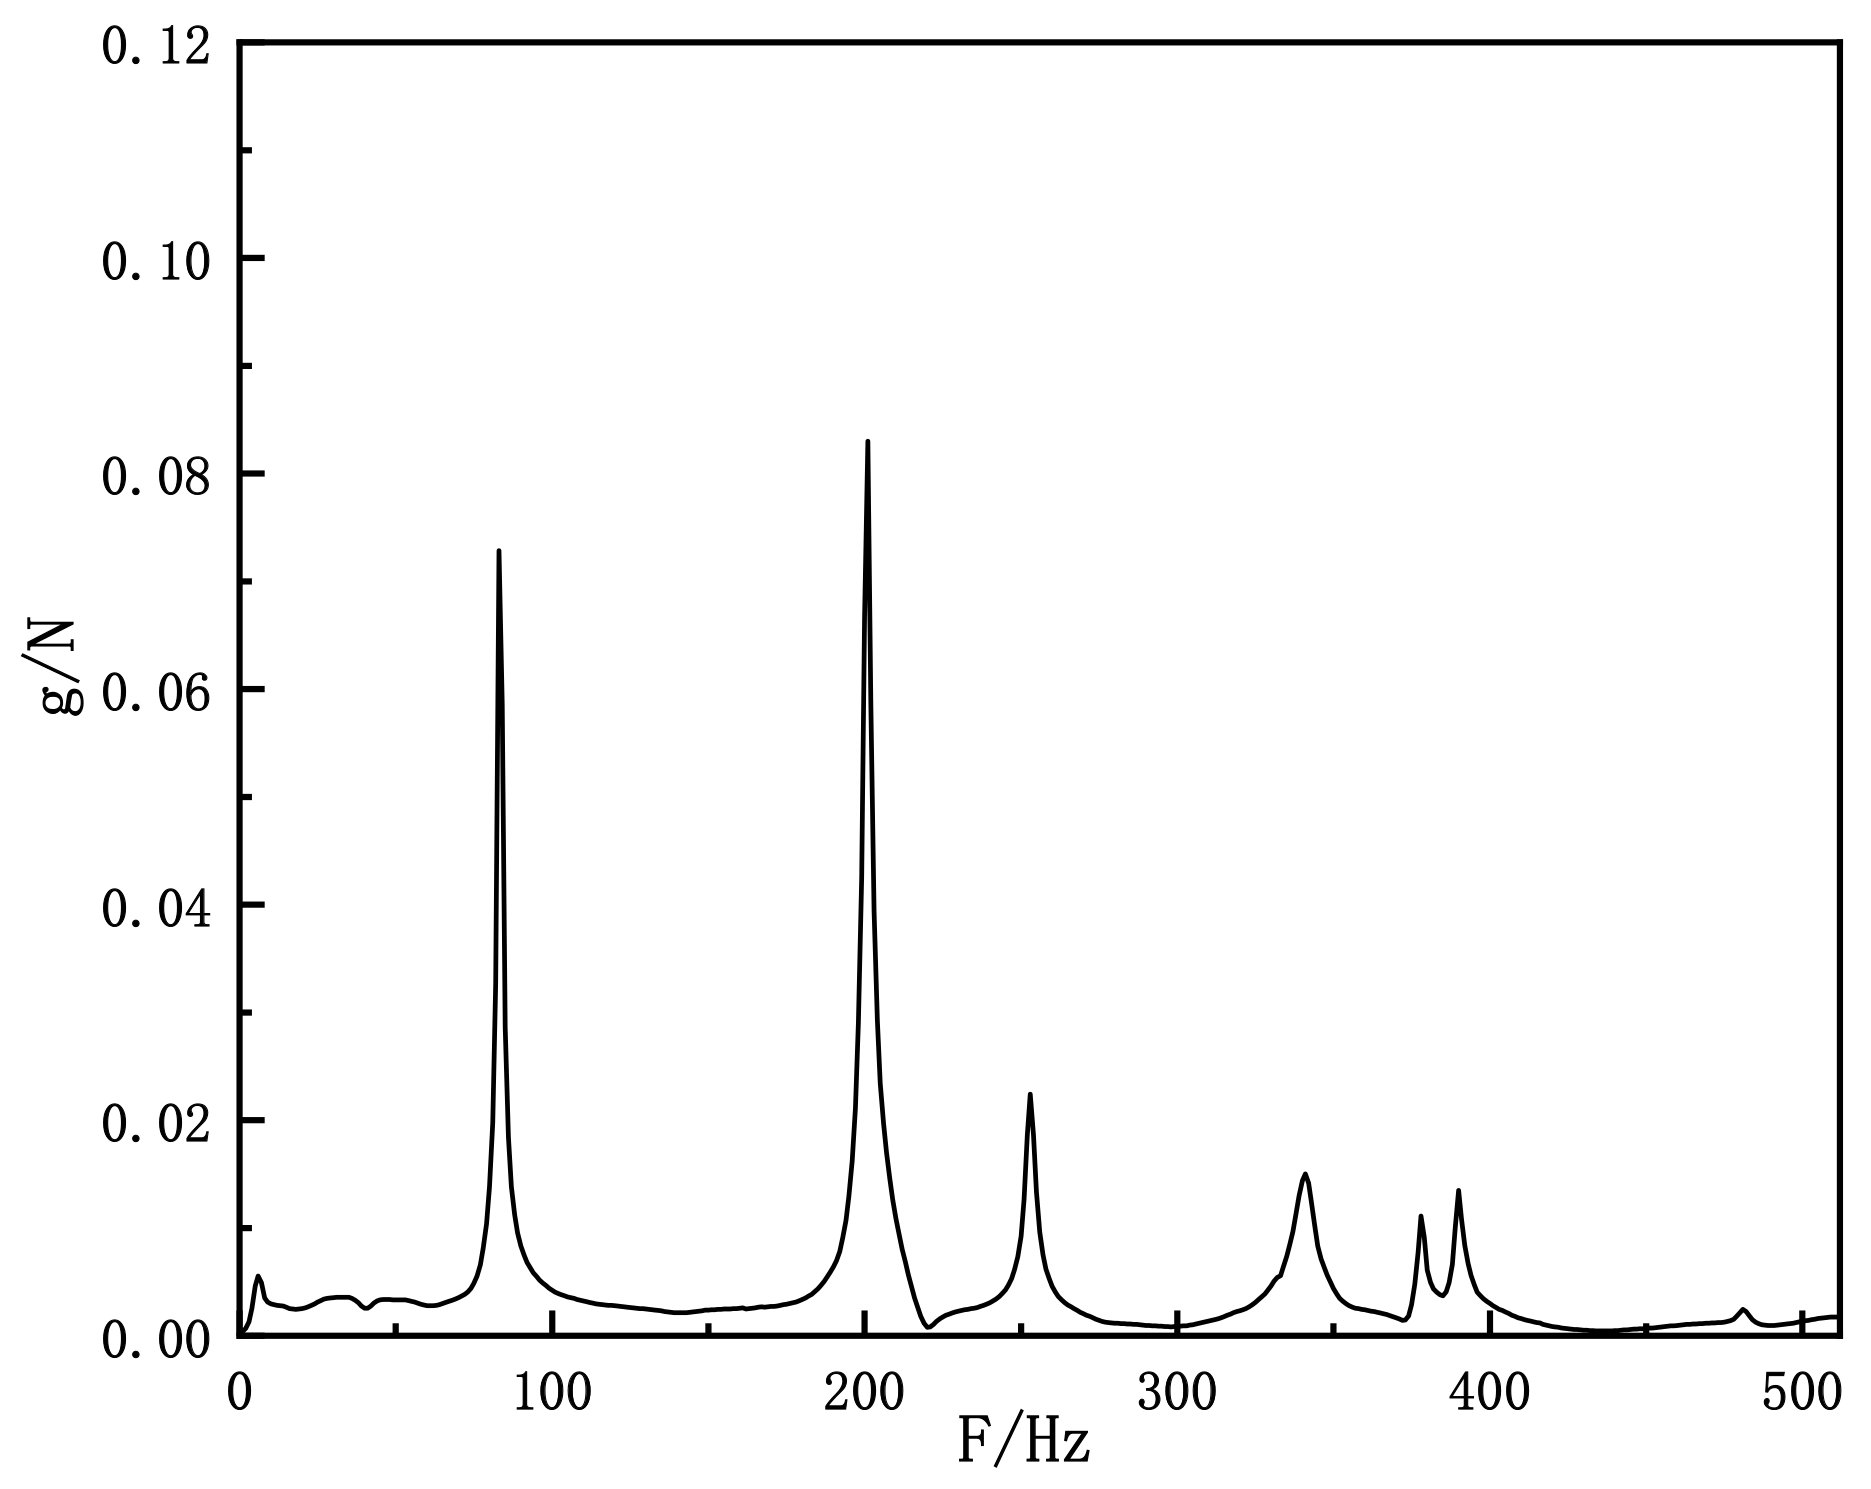
6.1. Free Modal Test Analysis of the Aluminium Alloy Front Subframe

The aluminium alloy front subframe studied in this paper is produced by an integrated casting method. After casting, the aluminium alloy front subframe sample is obtained by fine machining. To verify the accuracy and reliability of the finite element analysis results, a free modal test of the finished aluminium alloy front subframe was carried out. The modal test equipment used is shown in Figure 23, and the free modal test platform built for the aluminium alloy subframe is shown in Figure 24. The aluminium alloy front subframe sample was suspended on the test bench by a special rubber cord for the modal test so that it was in a free suspension state. The method of force hammer knocking and multipoint picking up was adopted for the modal test [38]. Eight test points were selected in the aluminium alloy front subframe body, and the force hammer knocking position was repeatedly knocked six times to obtain the average value to improve the accuracy of the test results.
The least square frequency domain method is used to identify the modal shapes. Figure 25 shows the comprehensive frequency response function curve of the aluminium alloy front subframe. The results show that the first-order modal of the aluminium alloy front subframe is 84 Hz, the second-order modal is 201 Hz, the third-order modal is 254 Hz, the fourth-order modal is 342 Hz, the fifth-order modal is 389 Hz, and the sixth-order modal is 390 Hz. By comparing the free modal finite element analysis results of the aluminium alloy front subframe with the test analysis results, as shown in Table 9, it can be seen that the maximum error of the free modal finite element results and test results of the first six orders of the aluminium alloy front subframe is 14.29%, and the maximum error is no more than 15%, which verifies the accuracy of the finite element model.

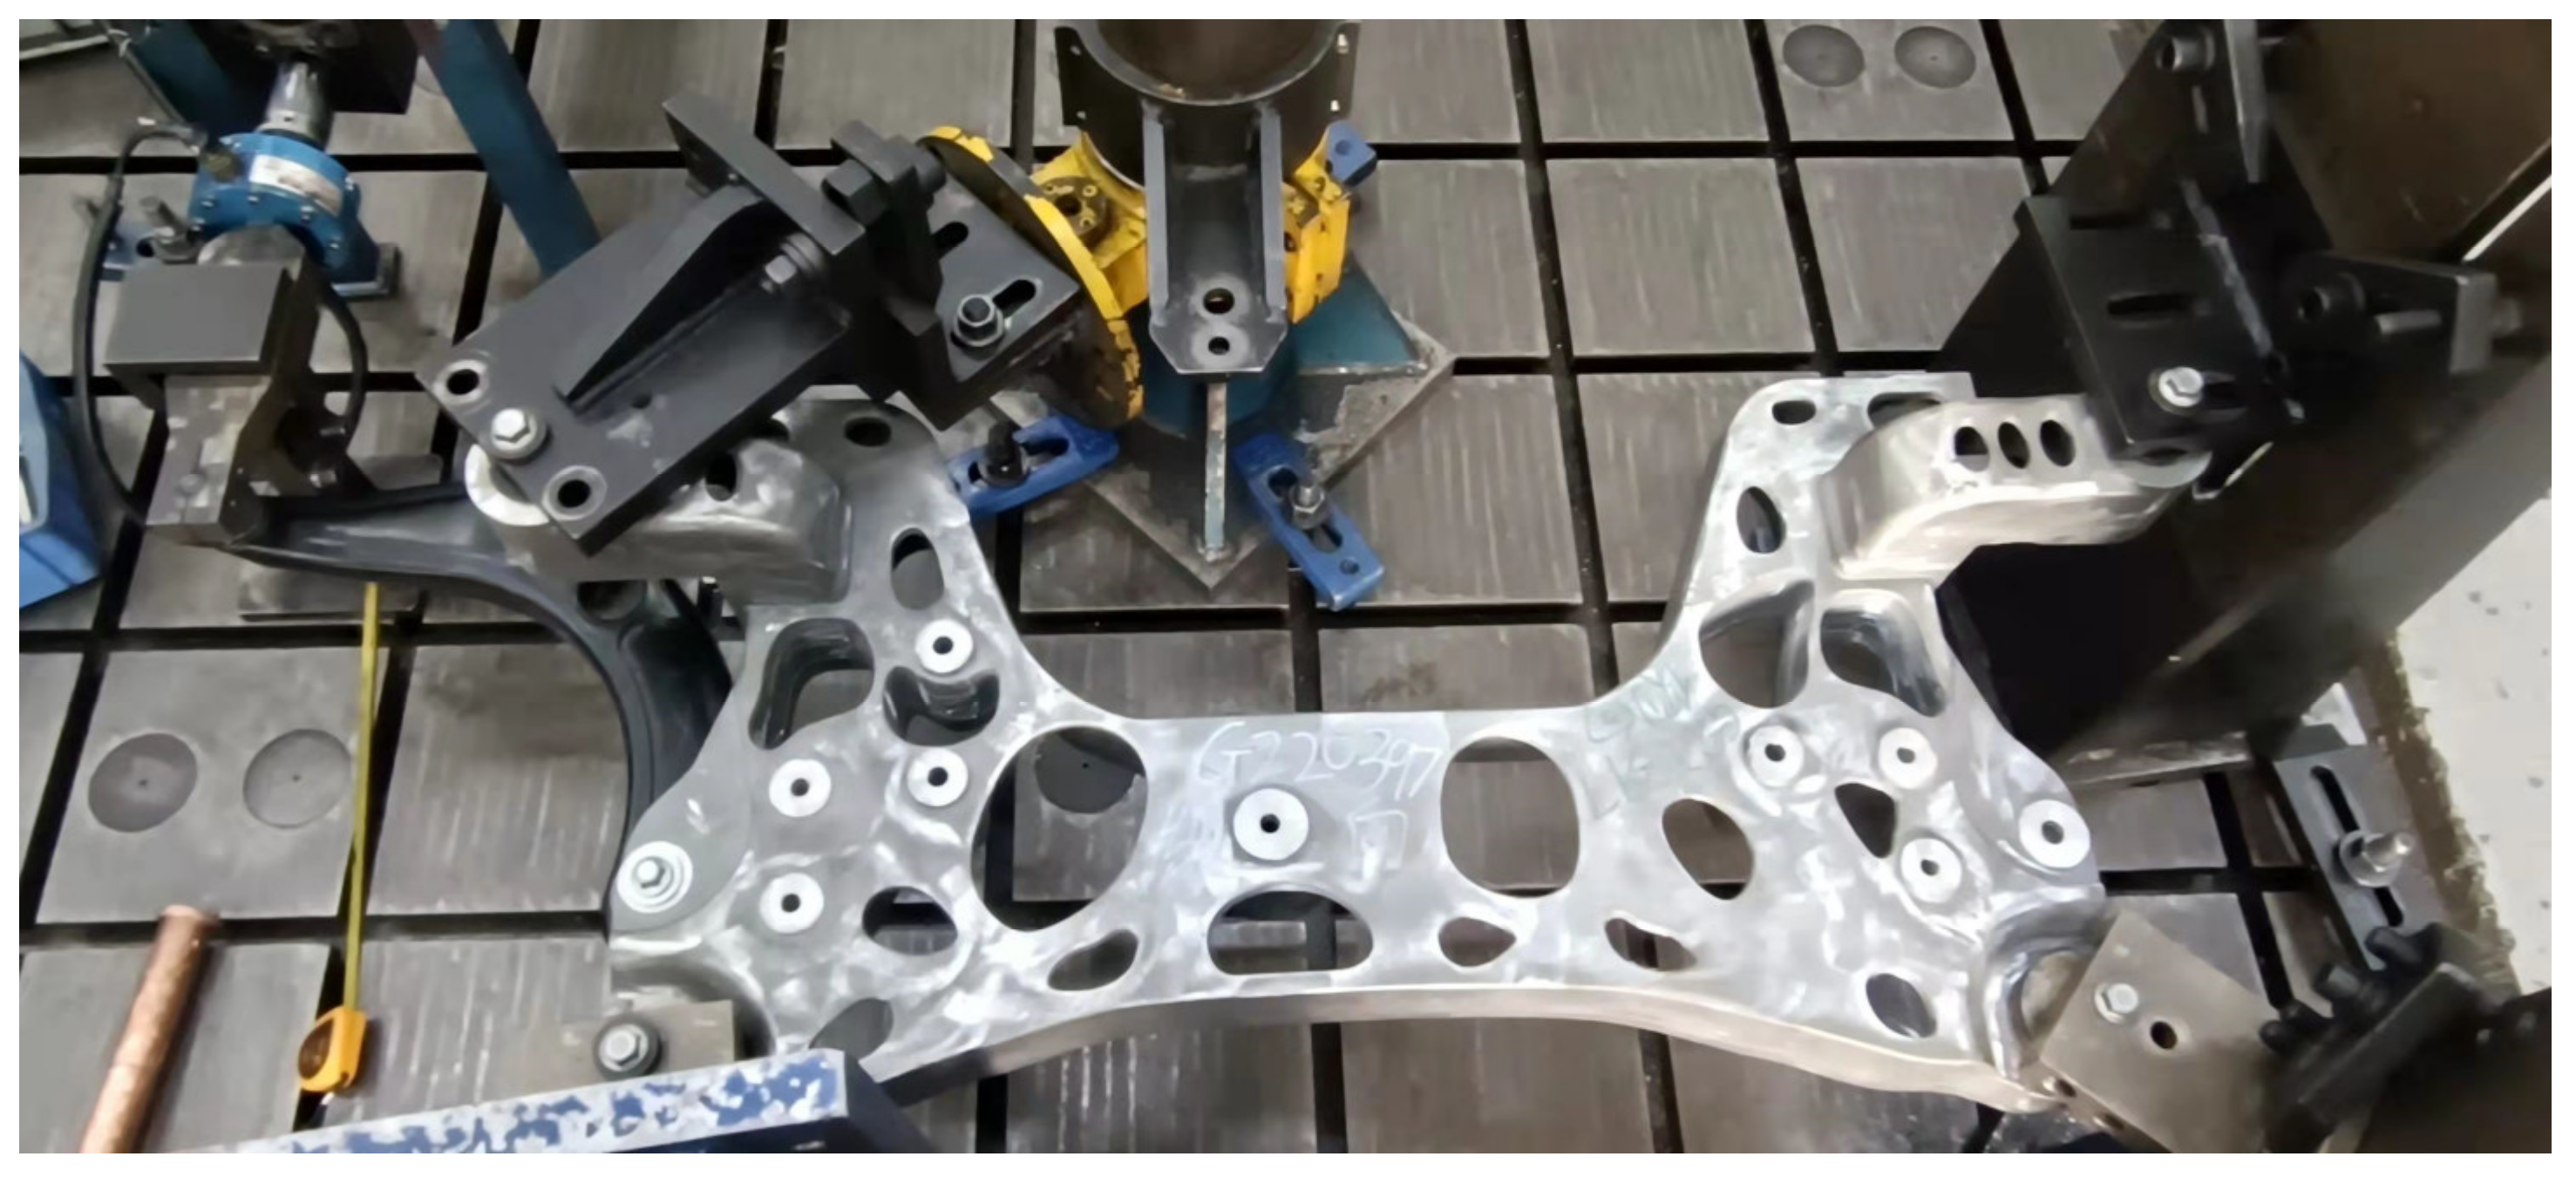
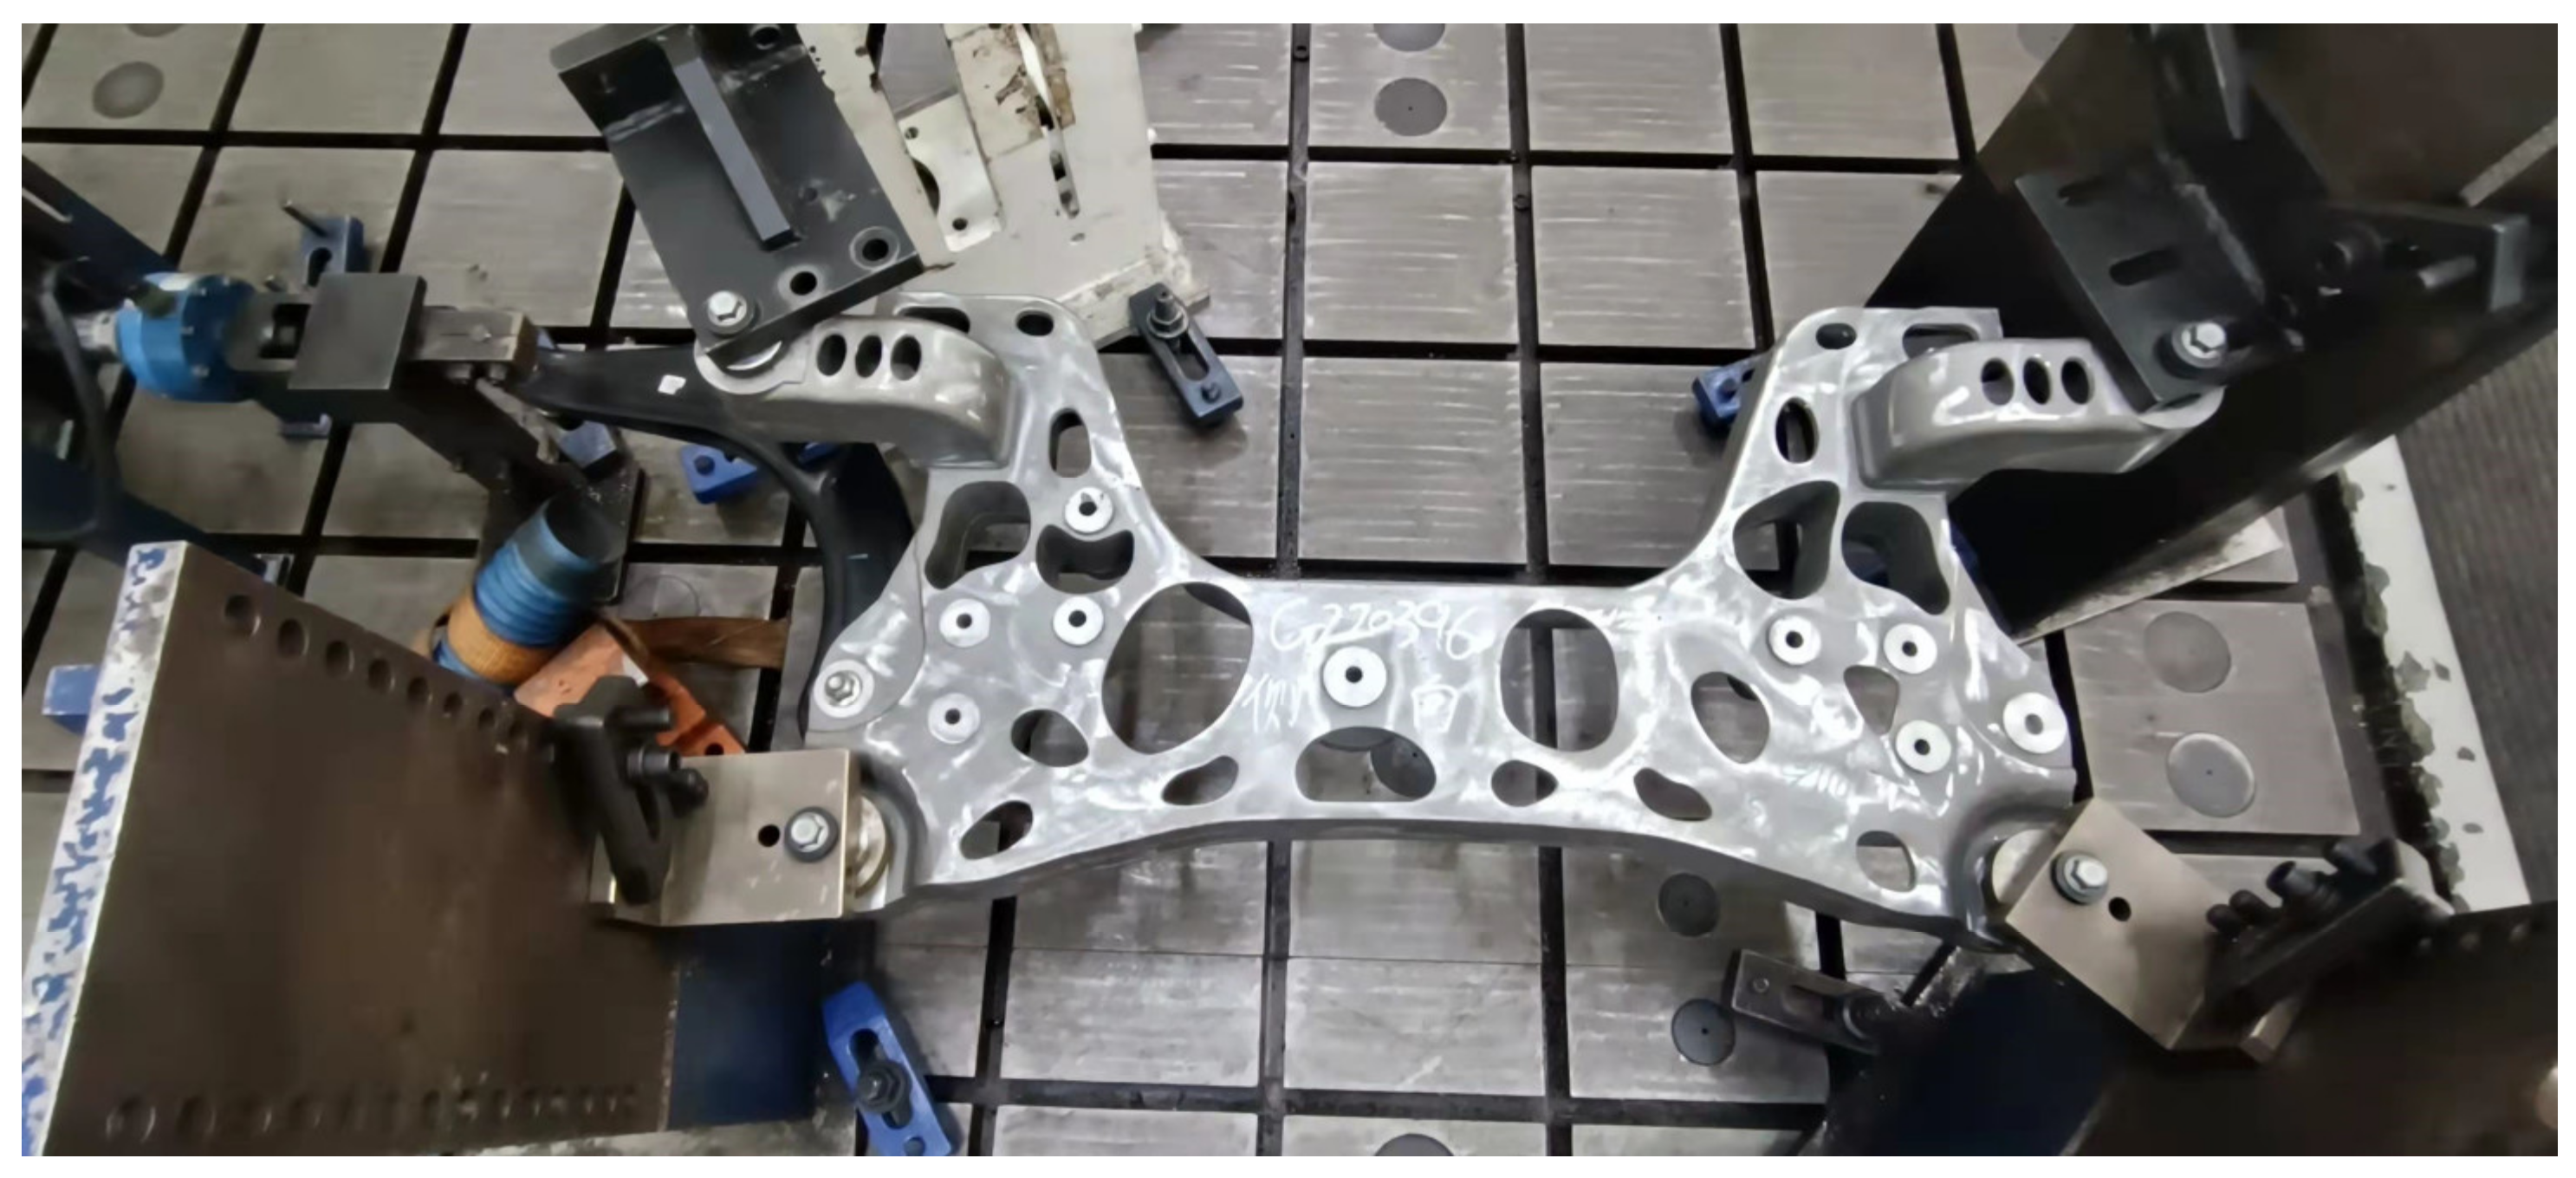
6.2. Fatigue Endurance Bench Test of the Aluminium Alloy Front Subframe

To verify the fatigue durability of the front subframe of the aluminium alloy, a fatigue durability bench test was carried out on the front subframe of the aluminium alloy. According to the bench test standards of enterprises, the longitudinal durability test and lateral durability test of the front subframe were investigated, and the durability of the front and rear installation points of the swinging arm of the front subframe of the aluminium alloy was checked. The simulated loading of the aluminium alloy front subframe and the body were bolted together. In the longitudinal endurance test analysis, force values ranging from −6 kN to 8.6 kN in the X-direction were loaded on the swing arm ball pin in the form of a sine wave. The test frequency range was 2 Hz, and the test target was 350,000 times without cracking. The built longitudinal fatigue endurance bench test platform is shown in Figure 26. In the analysis of the lateral force durability test, a force in the direction of Y ± 9 kN was loaded on the swing arm ball pin in the form of a sine wave. The test frequency range was also 2 Hz, and the test target was 300,000 times without cracking. The built lateral force fatigue endurance bench test platform is shown in Figure 27.
The longitudinal durability test and lateral durability test of the aluminium alloy front subframe verified three samples. It was verified by the test that the aluminium alloy front subframe could reach 350,000 times without cracking in the longitudinal durability test and 300,000 times without cracking in the lateral durability test. These results satisfy the requirements of the bench durability test.

7. Conclusions

In this paper, the influence of typical working conditions on an aluminium alloy front subframe structure was considered by the multi-working condition topology optimization method, and the optimal stress path structure of the aluminium alloy front subframe was obtained. According to the optimal stress path structure, the detailed structural design of the aluminium alloy front subframe and the performance analysis showed that the aluminium alloy front subframe met the requirements for the performance of strength, static stiffness, and modal. Further optimization can be obtained. Then, the response surface approximation model was constructed using the optimal Latin hypercube test method Isight. Meanwhile, the multi-objective particle swarm optimization algorithm was used to optimize the multi-objective design of the aluminium alloy front subframe, which further reduced the weight of the aluminium alloy subframe. Aluminium alloy subframe samples were manufactured based on the optimization results. Free modal test analysis and fatigue endurance bench tests were carried out on the aluminium alloy subframe samples. The following conclusions can be drawn from this study.
  • The multi-operating condition topology optimization method is adopted to find the best stress path of the aluminium alloy front subframe, which prevents blindness in the design and development process of the aluminium alloy front subframe and can greatly shorten the development cycle.
  • The response surface approximation model was constructed by using the optimal Latin Hypercube test method in the Isight software. Meanwhile, the multi-objective particle swarm optimization algorithm was used to carry out the multi-objective optimization design of the aluminium alloy front subframe. After 1002 iterations, the optimal structure of the aluminium alloy front subframe was obtained. After optimization, the maximum stress of the aluminium alloy front subframe corresponds to the extreme single-side pit condition, and the stress value is 179.3 MPa, which is 1.3 MPa less than that of 180.6 MPa before optimization. After optimization, the static stiffness values of each hard point of the aluminium alloy front subframe have little change, while the static stiffness values of some hard points remain unchanged. Under the premise of satisfying various performance indexes, the aluminium alloy front subframe loses 0.95 kg compared with the topology optimization, and 2.4 kg compared with the original subframe, with a lightweight rate of 12%.
  • Free modal test analysis was carried out on the aluminium alloy front subframe sample after multi-objective optimizations. The error between the test results and the finite element free modal analysis results was less than 15%, which verified the accuracy of the finite element model. The fatigue endurance bench test of the aluminium alloy front subframe samples showed that the longitudinal endurance test of the aluminium alloy front subframe could reach the target value of 350,000 times, and the lateral endurance test could reach the target value of 300,000 times, satisfying the bench fatigue durability requirements.

Author Contributions

Conceptualization, Y.S. and X.M.; methodology, X.M., W.L. and Z.Z.; software, X.M.; validation, Y.S., X.M. and Z.Z.; formal analysis, J.H.; writing—original draft preparation, X.M.; writing—review and editing, Y.S.; funding acquisition, Y.S. All authors have read and agreed to the published version of the manuscript.

Funding

This work was supported by the Central Guidance Project of China (ZY21195053) and the Science and Technology Project of Liuzhou (2021CBA0102).

Data Availability Statement

All data used to support the findings of this study are included within the article.

Conflicts of Interest

The authors declare no conflict of interest.

References

  1. Li, C.; Kim, I.Y.; Jeswiet, J. Conceptual and detailed design of an automotive engine cradle by using topology, shape, and size optimization. Struct. Multidiscip. Optim. 2015, 51, 547–564. [Google Scholar] [CrossRef]
  2. Kim, S.I.; Kang, S.W.; Yi, Y.S.; Park, J.; Kim, Y.Y. Topology optimization of vehicle rear suspension mechanisms. Int. J. Numer. Methods Eng. 2018, 113, 1412–1433. [Google Scholar] [CrossRef]
  3. Ali, U.; Fraser, R.A. Numerical Modeling of Rear Subframe under Different Loading Conditions; 2013-01-0571; SAE 2013 World Congress & Exhibition: Detroit, MI, USA, 2013. [Google Scholar]
  4. Nam, J.; Shin, H.; Choi, G. Durability prediction for automobile aluminum front subframe using nonlinear models in virtual test simulations. Int. J. Automot. Technol. 2014, 15, 593–601. [Google Scholar] [CrossRef]
  5. Lee, G.S.; Park, J.M.; Choi, B.L.; Choi, D.H.; Nam, C.H.; Kim, G.H. Multidisciplinary Design Optimization of Vehicle Front Suspension System Using PIDO Technology. Trans. Korean Soc. Automot. Eng. 2012, 20, 1–8. [Google Scholar]
  6. Oh, J.H.; Choi, H.H.; Park, S.H. The Optimization of Rear Suspension Using Hydroforming. Trans. Mater. Process. 2008, 17, 481–485. [Google Scholar]
  7. Park, S.Y.; Park, D.C.; Yoon, K.S.; Lee, M.S. A Study of Front Subframe System Optimization for Improving Vehicle Nvh Performance; 2009-01-2097; SAE 2009 Noise and Vibration Conference and Exhibition: St. Charles, IL, USA, 2009. [Google Scholar]
  8. Hur, D.; Lee, K. A Study on the FE Model Updating and Optimization for Vehicle Subframe. Trans. KSAE 2003, 10, 220–227. [Google Scholar]
  9. Belingardi, G.; Koricho, E.G. Design of a composite engine support sub-frame to achieve lightweight vehicles. Int. J. Automot. Compos. 2014, 1, 90–111. [Google Scholar] [CrossRef]
  10. Chiu, H.; Cheng, K.; Chang, M.; Chi, S. The Lightweight Chassis Sub-Frame Design by Applying Hydroforming Technology; 2010-01-0989; SAE 2010 World Congress & Exhibition: Detroit, MI, USA, 2010. [Google Scholar]
  11. Han, D.-H.; Ha, S. Development of lightweight composite sub-frame in automotive chassis parts considering structure & NVH performance. Compos. Res. 2019, 32, 21–28. [Google Scholar]
  12. Law, S.E.; Widmer, D.R. Crossmember Design Process—A Case Study; 2001-01-3068; SAE 2002 World Congress & Exhibition: Detroit, MI, USA, 2001. [Google Scholar]
  13. Jang, C.-S.; Yoo, Y.-D.; Jeon, J.-W.; Choi, B.-L.; Jung, E.-W. Design of a Light Weight Suspension Component Using CAE; 980901; International Congress & Exposition: Detroit, MI, USA, 1998. [Google Scholar]
  14. Fichera, G.; Scionti, M.; Petrone, F. Optimization of the mount system of a vehicle’s front subframe. Shock. Vib. Dig. 2006, 38, 342–343. [Google Scholar]
  15. Rotondella, V.; Merulla, A.; Baldini, A.; Mantovani, S. Dynamic modal correlation of an automotive rear subframe, with particular reference to the modelling of welded joints. Adv. Acoust. Vib. 2017, 2017, 8572674. [Google Scholar] [CrossRef] [Green Version]
  16. Da’Quan, L.; Zhou, J.; Park, J. The Use of Topology Optimization in Enhancing the Structural Property of an Automotive Front Sub-Frame. In Proceedings of the 2022 ASEE Gulf Southwest Annual Conference, Prairie View, TX, USA, 16–18 March 2022. [Google Scholar]
  17. Price, M. Design Optimization of a Magnesium Subframe. Master’s Thesis, Mississippi State University, Starkville, MS, USA, 2018. [Google Scholar]
  18. Liao, J.; Shan, L.; Feng, Y. The Design and Size Optimization of the New FCEV Subframe Based on Hypermesh Platform. Adv. Mater. Res. 2011, 328–330, 435–440. [Google Scholar] [CrossRef]
  19. Hamdi, A.; Yannou, B.; Landel, E. Design Target Cascading for Vibro-Acoustic Conceptual Design of An Automobile Subframe. In Proceedings of the DS 32, Proceedings of DESIGN 2004, the 8th International Design Conference, Dubrovnik, Croatia, 17–20 May 2004. [Google Scholar]
  20. Huang, L.; Yuan, C. Physical Drawbead Design and Modeling with ABAQUS/Isight; 2017-01-0305; WCX™ 17: SAE World Congress Experience: Detroit, MU, USA, 2017. [Google Scholar]
  21. Coello Coello, C.A. Recent Trends in Evolutionary Multiobjective Optimization. In Evolutionary Multiobjective Optimization; Springer: London, UK, 2005; pp. 7–32. [Google Scholar]
  22. Chen, X.; Yu, X.; Ji, B. Study of Crankshaft Strength Based on iSIGHT Platform and DOE Methods. In Proceedings of the 2010 International Conference on Measuring Technology and Mechatronics Automation, Changsha, China, 13–14 March 2010; pp. 548–551. [Google Scholar]
  23. Park, J.S. Optimal Latin-hypercube designs for computer experiments. J. Stat. Plan. Inference 1994, 39, 95–111. [Google Scholar] [CrossRef]
  24. Liefvendahl, M.; Stocki, R. A study on algorithms for optimization of Latin hypercubes. J. Stat. Plan. Inference 2005, 136, 3231–3247. [Google Scholar] [CrossRef] [Green Version]
  25. Patil, S.A.; Moradi, R.; Lankarani, H.M. Vehicle mass optimization for frontal structure using I-sight and study of weld parameterization for mass improvement. In ASME International Mechanical Engineering Congress and Exposition; ASME: New York, NY, USA, 2014; Volume 46613, p. V012T015A011. [Google Scholar]
  26. Fang, H.; Horstemeyer, M.F. Global response approximation with radial basis functions. Eng. Optim. 2006, 38, 407–424. [Google Scholar] [CrossRef]
  27. Alsharif, F.; McNaughton, J.L., Jr. Optimization Analysis of a V-Twin Motorcycle Engine Using WAVE Cycle Analysis and an iSight Optimization Framework. In Ricardo Software e-Brochure V3; Ricardo, Inc.: Shoreham-by-Sea, UK, 2005; Volume 14, p. 15. [Google Scholar]
  28. Smith, M. Abaqus User’s Manual, Version 2020; Dassault Systèmes Simulia Corp.: Johnston, RI, USA, 2020. [Google Scholar]
  29. Nicholson, J.C.; Arora, J.S.; Goyal, D.; Tinjum, J.M. Multi-objective structural optimization of wind turbine tower and foundation systems using Isight: A process automation and design exploration software. In Proceedings of the 10th World Congress on Structural and Multidisciplinary Optimization, Orlando, FL, USA, 19–24 May 2013; pp. 19–24. [Google Scholar]
  30. Ren, J.; Zhu, H.W.; Wang, H.; Zhao, C.F.; Zhong, J.L. Multi-objective structural optimization of VL seal ring based on Isight. J. Phys. Conf. Ser. 2020, 1622, 012031. [Google Scholar] [CrossRef]
  31. Wang, D.F.; Xie, C.; Liu, Y.C.; Xu, W.C.; Chen, Q. Multi-objective Collaborative Optimization for the Lightweight Design of an Electric Bus Body Frame. Automot. Innov. 2020, 3, 250–259. [Google Scholar] [CrossRef]
  32. Richards, Z.D.; Valavanis, K. Particle Swarm trade-off curve analysis for bi-objective optimization. In Proceedings of the IEEE Congress on Evolutionary Computation, Barcelona, Spain, 18–23 July 2010; p. 16. [Google Scholar]
  33. Campbell, F.C. Fatigue and Fracture: Understanding the Basics; ASM International: Almere, The Netherlands, 2012. [Google Scholar]
  34. Xu, J.T.; Song, Y.D.; Ding, J.B.; Ding, S.Q. Analysis of a front sub-frame fatigue strength based on Miner theory. In Proceedings of the 2010 International Conference on Computer Application and System Modeling (ICCASM 2010), Taiyuan, China, 22–24 October 2010. [Google Scholar]
  35. Zhang, L.B.; Liu, Y.; Huang, P.C. FEM-based fatigue analysis method and application in automobile industry. Comput. Aided Eng. 2006, 1, 195–198. [Google Scholar]
  36. Bignonnet, A.; Thomas, J.J. Fatigue Assessment and Reliability in Automotive Design; 2001-01-4061; SAE Brasil International Conference on Fatigue: São Paulo, Brasil, 2001. [Google Scholar]
  37. Peiskammer, D.; Dannbauer, H.; Dutzler, E.; Puchner, K. Using fatigue life prediction to increase reliability of automotive structures. SAE Trans. 2003, 112, 174–180. [Google Scholar]
  38. Yu, Z.Q.; Jia, H.F.; Huang, X.Y. Design of the Lower Control Arm of an Electric SUV Front Suspension Based on Multi-Disciplinary Optimization Technology. Jordan J. Mech. Ind. Eng. 2021, 15, 7–14. [Google Scholar]
Figure 1. Aluminium alloy front subframe envelope.
Metals 13 00705 g001
Figure 2. Topology optimization results of aluminium alloy front subframe envelope under multiple working conditions. (a) Positive results of multi-condition topology optimization. (b) Rear result of multi-condition topology optimization.
Metals 13 00705 g002aMetals 13 00705 g002b
Figure 3. Aluminium alloy front subframe detailed design of digital model.
Metals 13 00705 g003
Figure 4. Establishment of displacement and load boundary conditions for aluminium alloy front subframe.
Metals 13 00705 g004
Figure 5. Cloud diagram of stress results of aluminium alloy front subframe under some typical working conditions. (a) Forward braking condition. (b) Backward braking condition. (c) Forward emergency braking condition. (d) Backward emergency braking condition. (e) Over one side deep pit condition. (f) Ultimate steering condition.
Metals 13 00705 g005aMetals 13 00705 g005b
Figure 6. Non-rigid body modal shapes for the front 6th order of aluminium alloy front subframe. (a) First order modal shape. (b) Second order modal shape. (c) Third modal shape. (d) Fourth modal shape. (e) Fifth modal shape. (f) Sixth modal shape.
Metals 13 00705 g006aMetals 13 00705 g006b
Figure 7. Parameterized model and optimized position of aluminium alloy front subframe.
Metals 13 00705 g007
Figure 8. Distribution of optimal Latin hypercube sample points.
Metals 13 00705 g008
Figure 9. Multi-objective experimental design optimization platform.
Metals 13 00705 g009
Figure 10. Process of building approximate model of aluminium alloy front subframe.
Metals 13 00705 g010
Figure 11. The fitting results of the predicted and actual response values of the aluminium alloy front subframe. (a) Results of first-order modal frequency fitting. (b) Mass fitting results. (c) Stress fitting results of over one side deep pit condition. (d) Stress fitting results of forward braking condition. (e) Stress fitting results of forward emergency braking condition. (f) Fitting results of the maximum displacement of the right front point of the lower arm.
Metals 13 00705 g011aMetals 13 00705 g011b
Figure 12. First order frequency response and variable response surface approximation model of the aluminium alloy front subframe. (a) Response surface approximation model between the first order frequency of the aluminium alloy front subframe and design variables LZ_b and F_01. (b) Response surface approximation model between the first order frequency of the aluminium alloy front subframe and design variables LZ_t and F_01. (c) Response surface approximation model between the first-order frequency of the aluminium alloy front subframe and design variables R_01 and F_01.
Metals 13 00705 g012aMetals 13 00705 g012b
Figure 13. Approximate model multi-objective optimization design platform.
Metals 13 00705 g013
Figure 14. Local effect diagram of each variable and response. (a) Frequency local effect diagram. (b) Mass Local Effect diagram. (c) Local effect diagram of stress in over one side deep pit condition. (d) Local effect diagram of forward braking condition.
Metals 13 00705 g014aMetals 13 00705 g014b
Figure 15. Digital and analogue comparison before and after multi-objective optimization of aluminium alloy front subframe.
Metals 13 00705 g015
Figure 16. Cloud image of stress analysis results of aluminium alloy front subframe under some typical working conditions after optimization. (a) Forward braking condition. (b) Backward braking condition. (c) Forward emergency braking condition. (d) Backward emergency braking condition. (e) Over one side deep pit condition. (f) Ultimate steering condition.
Metals 13 00705 g016
Figure 17. Optimized non-rigid body modal shapes for the front 6th order of the aluminium alloy front subframe. (a) First modal shape. (b) Second order modal shapes. (c) Third order modal shapes. (d) Fourth order modal shapes. (e) Fifth order modal shapes. (f) Sixth order modal shapes.
Metals 13 00705 g017
Figure 18. Fatigue analysis flow of aluminium subframe.
Metals 13 00705 g018
Figure 19. Fatigue damage cloud image of aluminium alloy front subframe over one side deep pit condition.
Metals 13 00705 g019
Figure 20. Fatigue life cloud diagram of aluminium alloy front subframe over one side deep pit condition.
Metals 13 00705 g020
Figure 21. Fatigue damage cloud diagram of aluminium alloy front subframe under forward braking condition.
Metals 13 00705 g021
Figure 22. Fatigue life cloud diagram of aluminium alloy front subframe under forward braking condition.
Metals 13 00705 g022
Figure 23. Aluminium alloy front subframe modal test equipment.
Metals 13 00705 g023
Figure 24. Free modal test platform of aluminium alloy subframe.
Metals 13 00705 g024
Figure 25. Integrated frequency response function curve of aluminium alloy front subframe.
Metals 13 00705 g025
Figure 26. Longitudinal fatigue endurance test of aluminium alloy front subframe on bench.
Metals 13 00705 g026
Figure 27. Lateral force fatigue endurance test of aluminium alloy front subframe on bench.
Metals 13 00705 g027
Table 1. Summary of load information of each typical working condition.
Load Loading ConditionLoad Extraction PositionFX/NFY/NFZ/NTX/N.mmTY/N.mmTZ/N.mm
Forward brakingLeft front mounting point of lower control arm3284.07−13,698.91976.43−12,565.55−4972.7317,758.18
Backward braking−1938.665250.36440.282433.937908.52−17,822.63
Forward emergency braking3603.93−12,297.02503.65−10,162.87−6142.7417,802.89
Backward emergency braking−2567.505922.08384.721116.0510,045.76−19,683.54
Overconvex hull−312.96−2037.32330.97−16,806.04682.42−1978.72
Over unilateral hull−471.74−3045.79522.29−17,978.29624.39−2796.88
Over one side deep pit2486.79−19,902.803368.50−19,125.35−2931.9518,310.30
Ultimate steering160.9012,037.52−1142.56−14,712.09−395.00−8286.05
Steering braking2172.52−4666.31467.00−13,050.78−3580.2314,608.78
Steering drive−1786.4513,389.08933.28501.838327.25−22,282.73
Maximum driving acceleration−959.993711.35661.4911,256.405734.13−10,161.87
Diagonal torsion−330.45−2186.29192.93−12,220.28305.09−2008.30
Forward brakingLeft rear mounting point of lower control arm6415.2311,730.02−399.92−17,445.814444.701461.34
Backward braking−3404.68−6275.54−788.882620.12−84.12−2600.15
Forward emergency braking7662.7513,728.3810.44−13,110.003269.032080.89
Backward emergency braking−5073.90−8907.96−945.29248.28838.25−2830.12
Overconvex hull−392.48−749.2188.65−28,138.937174.87−3304.56
Over unilateral hull−608.28−1141.71153.51−30,776.387415.47−3843.70
Over one side deep pit3891.647412.00−1043.45−32,024.116871.48−588.33
Ultimate steering−355.88−657.6956.79−23,436.626460.99−3803.89
Steering braking3647.187040.50−319.42−18,503.064927.97506.97
Steering drive−4046.88−7266.67−699.38−772.01983.45−3228.57
Maximum driving acceleration−1541.12−2936.89−705.7115,925.78−3253.31−2182.21
Diagonal torsion−439.74−838.4542.95−18,237.105292.08−1926.40
Forward brakingSteering gear left mounting point−35.71282.71−42.47−5.02−335.09−5480.94
Backward braking−37.87−61.51−76.32179.50−675.911313.98
Forward emergency braking−481.47250.38150.66164.99−2733.61−5023.66
Backward emergency braking352.29−63.1764.88217.271332.791586.27
Overconvex hull−89.3074.389.83166.08−829.91−1352.61
Over unilateral hull−150.66−221.9679.69−853.46−1710.82−1956.74
Over one side deep pit502.532156.57−778.591839.086405.35−4312.94
Ultimate steering349.17887.21−328.71−229.114762.882935.18
Steering braking47.06633.97−97.38−452.641676.53−2247.49
Steering drive−730.26−1058.18−224.87−1624.26−8359.982036.35
Maximum driving acceleration−290.88−45.50−356.4043.70−1885.46733.59
Diagonal torsion−98.05−185.83−19.56−1143.84−1169.12−1932.29
Table 2. Static stiffness analysis results of each mounting point of the aluminium alloy front subframe.
NumberPosition of Mounting PointDirection Static Stiffness Value (N/mm)Target Static Stiffness Value (N/mm)
1Lower arm left front pointX23,81012,000
Y25,64116,000
Z40,0005000
2Lower swing arm left back pointX50,000020,000
Y90,90920,000
Z52,6315000
3Lower arm right front pointX13,88912,000
Y45,45516,000
Z45,4555000
4Lower swing arm right back pointX200,00020,000
Y200,00020,000
Z62,5005000
5Steering gear left pointX40,00025,000
Y55,55625,000
Z22,7278000
6Steering gear right pointX71,42925,000
Y90,90925,000
Z28,5718000
7Stabilizer bar left pointX58,82410,000
Y76,9235000
Z40,00016,000
8Stabilizer bar right pointX100,00010,000
Y111,1115000
Z47,61916,000
Table 3. Variation range of design variables of aluminium alloy front subframe.
Design VariableInitial Value
(mm)
Lower Limiting Value
(mm)
Upper Limit Value
(mm)
F_010−2010
R_010−3015
LZ_t0−55
LZ_b0−80
Table 4. Fitted R-squared values for each response.
ResponsesTotal Error
Freq_10.99675
Mass0.99995
Max_stress10.99493
Max_stress20.99783
Max_stress30.99781
Disp0.9897
Table 5. Comparison of variable data before and after optimization.
Design VariableInitial Value/mmLower Limiting Value/mmUpper Limit Value/mmOptimal Value/mm
F_010−20101.5
R_010−3015−27
LZ_t0−55−4
LZ_b0−80−4.5
Table 6. Comparative analysis results of stress before and after optimization of aluminium alloy front subframe.
Typical Working ConditionsModel Stress before Optimization/MPaModel Stress after Optimization/MPa
Forward braking condition145.7141.7
Backward braking condition51.950.2
Forward emergency braking condition128.4124.8
Backward emergency braking condition59.757.8
Over one side deep pit condition180.6179.3
Ultimate steering condition103.7101.9
Table 7. Comparative analysis results of static stiffness performance of aluminium alloy front subframe before and after optimization.
NumberPosition of Mounting PointDirectionStatic Stiffness Value of the Model before Optimization (N/mm)Static Stiffness Value of Optimized Model (N/mm)
1Lower arm left front pointX23,81024,390
Y25,64123,809
Z40,00037,037
2Lower swing arm left back pointX500,000500,000
Y90,90983,333
Z52,63150,000
3Lower arm right front pointX13,88913,888
Y45,45540,000
Z45,45540,000
4Lower swing arm right back pointX200,000200,000
Y200,000200,000
Z62,50062,500
5Steering gear left pointX40,00038,461
Y55,55652,631
Z22,72721,739
6Steering gear right pointX71,42971,428
Y90,90983,333
Z28,57127,027
7Stabilizer bar left pointX58,82458,823
Y76,92383,333
Z40,00038,461
8Stabilizer bar right pointX100,000100,000
Y111,111111,111
Z47,61945,454
Table 8. Comparison of free modal analysis results before and after optimization of aluminium alloy front subframe.
OrderModel Frequency before Optimization/HzOptimized Model
Frequency/Hz
First order modal9796
Second order modal216222
Third order modal261268
Fourth order modal345346
Fifth order modal376373
Sixth order modal397417
Table 9. The results of free modal finite element analysis of aluminium alloy front subframe are compared with the results of test analysis.
Order NumberFinite Element Analysis Frequency/HzTest Analysis Frequency/HzError/%
First order modal968414.29
Second order modal22220110.45
Third order modal2682545.93
Fourth order modal3463421.47
Fifth order modal3733891.32
Sixth order modal4173906.92
Disclaimer/Publisher’s Note: The statements, opinions and data contained in all publications are solely those of the individual author(s) and contributor(s) and not of MDPI and/or the editor(s). MDPI and/or the editor(s) disclaim responsibility for any injury to people or property resulting from any ideas, methods, instructions or products referred to in the content.

