Article

Design Optimization of Chute Structure Based on E-SVR Surrogate Model

1
Henan Key Laboratory of Intelligent Manufacturing of Mechanical Equipment, Zhengzhou University of Light Industry, Zhengzhou 450002, China
2
Zhejiang PanGood Power Technology Co., Ltd., Jinhua 321100, China
3
College of Mechanical Engineering, Donghua University, Shanghai 201620, China
4
Luoyang TiHot Railway Machinery Manufacturing Co., Ltd., Luoyang 471000, China
*
Author to whom correspondence should be addressed.
Metals 2023, 13(3), 635; https://doi.org/10.3390/met13030635
Submission received: 7 February 2023 / Revised: 18 March 2023 / Accepted: 21 March 2023 / Published: 22 March 2023

Abstract

:
To reduce the wear and damage of the chute caused by long-term impact of coke, a structure parameter optimization model was established in this paper, which takes the minimum impact force as the objective and the coke-conveying speed as the constraint. Furthermore, the ensemble of support vector regression (E-SVR) with different kernel functions was developed to replace the implicit relationship between the conveying speed, the impact force, and the structure parameters. Using the numerical examples, the effectiveness of the E-SVR model was verified. Finally, the optimal chute structure parameters were obtained by using the E-SVR model. After optimization, the maximum impact force was reduced by 17.07% and the maximum conveying speed was reduced by 6.59%, which still falls within the specified range. Therefore, the feasibility of the optimization results and the effectiveness of the E-SVR surrogate model were verified.

1. Introduction

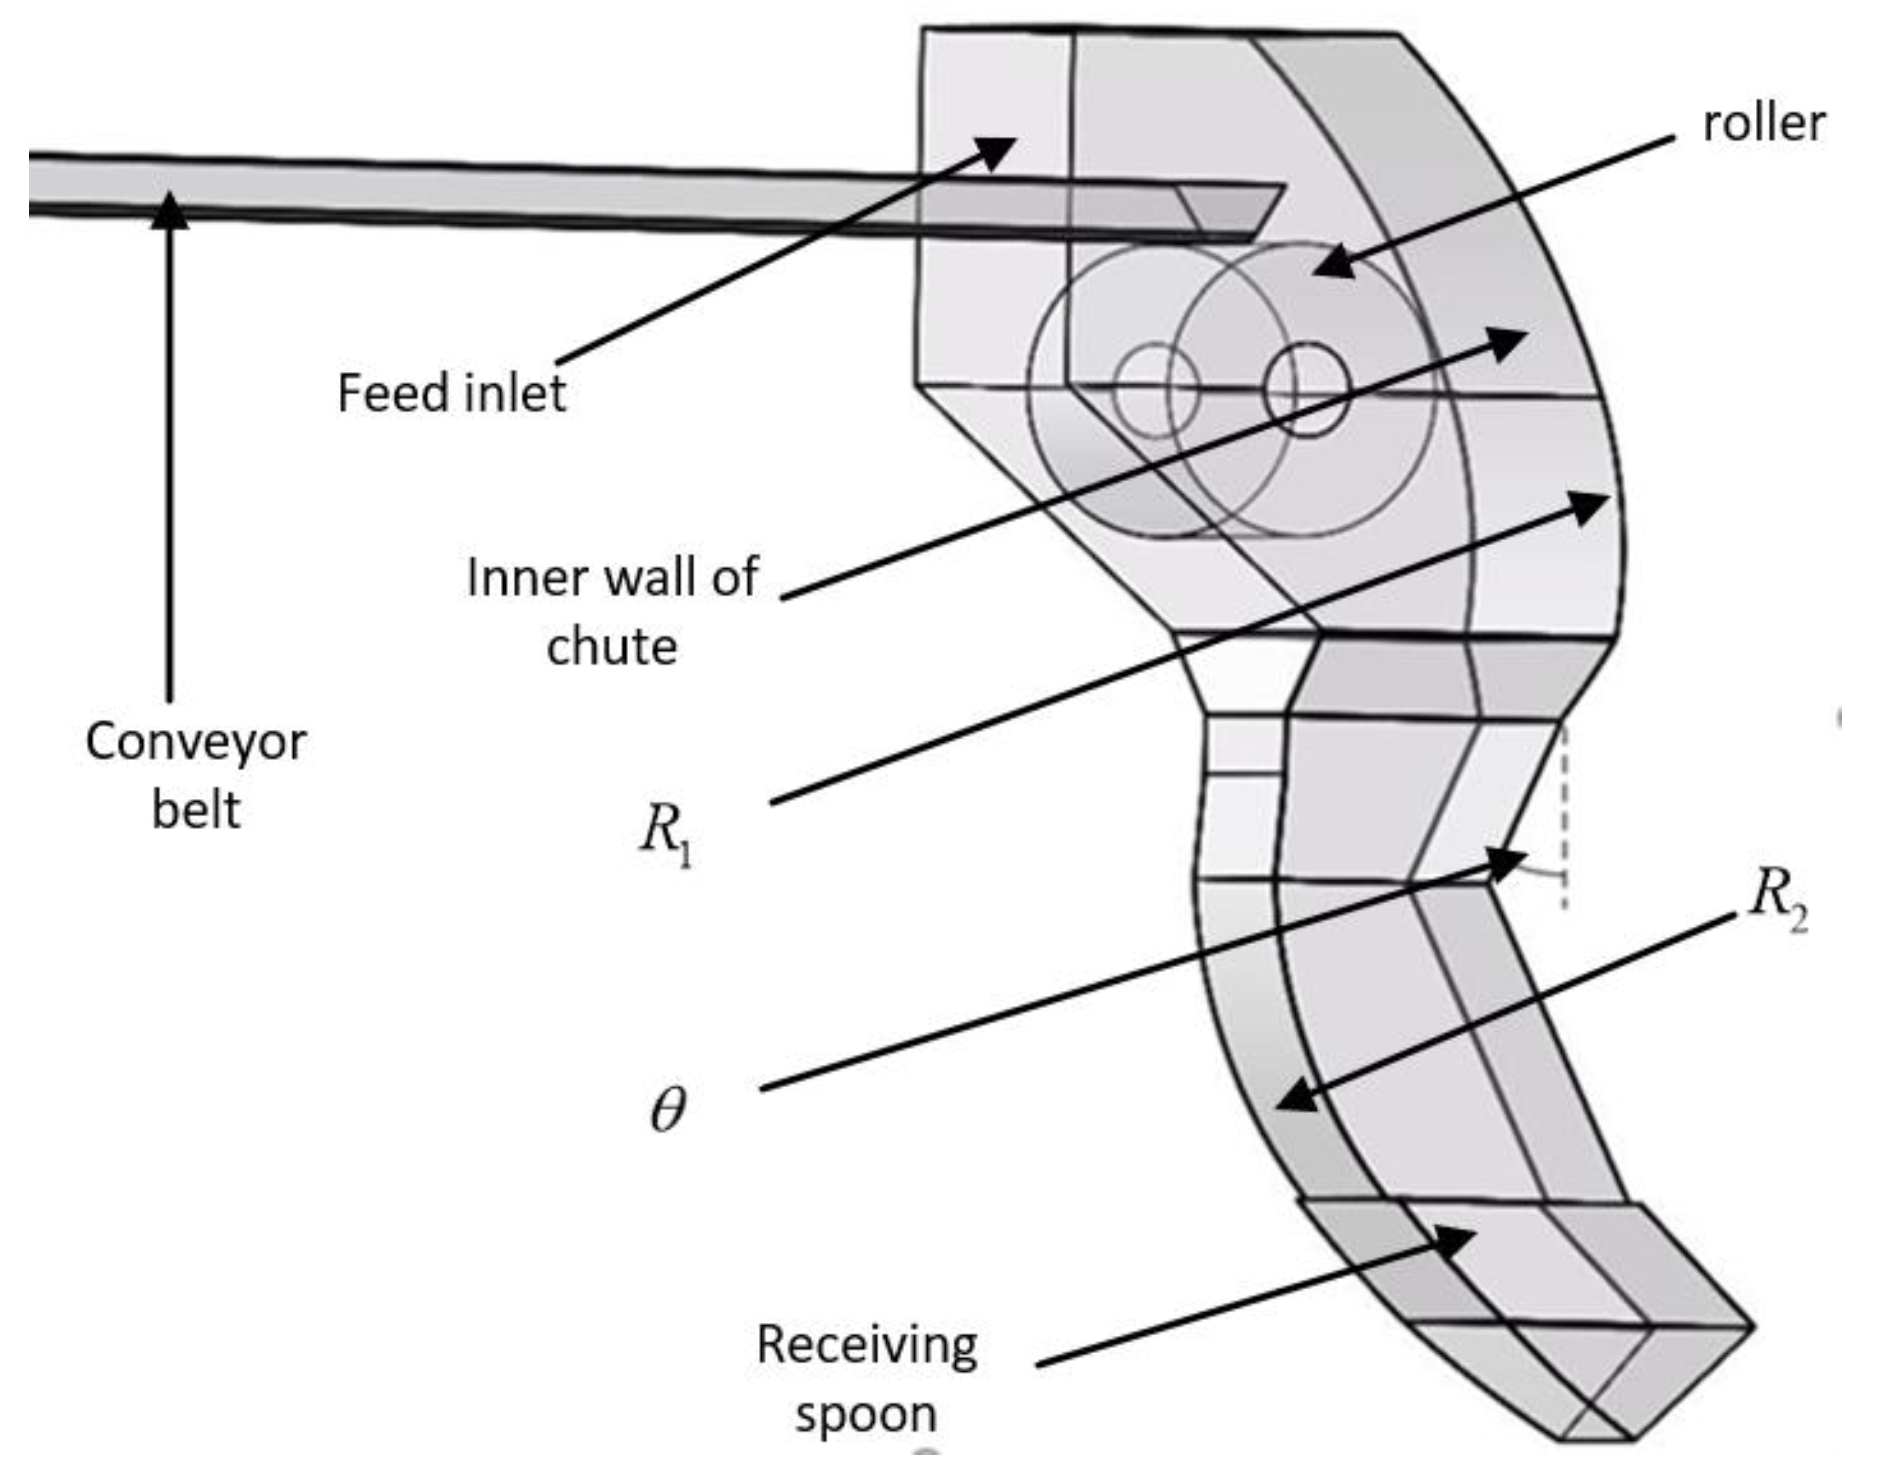
The steel industry is one of the basic industries of modern industrialized countries and is also an important symbol of a country’s degree of development and economic strength. The transportation and delivery of bulk materials (such as coke and iron ore) are the basic production link in the steel industry. As the key equipment in the steel industry, the chute delivers the bulk materials from high to low. However, due to the long-term impact of the bulk materials, the chute is easily worn or damaged, reducing its service life. Once the chute is damaged, it can only be stopped for maintenance, which seriously affects the production schedule. Moreover, maintenance usually consists of padding the steel plate at the worn place, which leads to the unsmooth conveying of bulk materials in the chute and can even result in the plugging phenomenon. Furthermore, the collision to the chute may cause the bulk materials to be broken, producing a large amount of dust or even the phenomenon of the bulk materials falling, resulting in serious safety risks to the on-site staff.
To overcome the above issues, scholars have conducted extensive research on chute structure design. Based on the wear mechanism, new materials have been adopted for the chute, and the wear-resistant lining board has been adhered to the inner shell of the chute [1,2,3] to increase its service life. On the other hand, to avoid the plugging phenomenon, structural design methods were adopted to improve the conveying smoothness of the materials in the chute [4,5]. The structural parameters, the contour curves of the impact plate, and the contour curves of the diversion plate of the chute were analyzed to reduce chute wear under the premise of conveying smoothness requirements [6,7,8,9]. Other methods for improving the working performance and service life of the chute include structural parameters optimization [10,11,12,13], baffle settings [14], and motion control [15]. However, the existing structural design methods of the chute still depend on experience and simple verification, which lacks data support. Moreover, the implicit relationship between chute structure parameters and performance responses (such as impact force of coke to the chute and conveying speed of coke) further increases the difficulty of optimization.
To reduce optimization costs, various surrogate models were applied to approximate the implicit relationship between the design parameters and performance responses. Among the surrogate models, the Support Vector Regression (SVR) model was widely used in engineering problems because of its good performance in small samples, including nonlinear, high-dimension, overfitting, and multiple local minima problems [16,17]. SVR is the specific application of a Support Vector Machine (SVM) in the field of functional regression and has been widely used in the field of structural reliability analysis, such as the lightweight design of complex structures [18,19,20,21,22] and process parameters optimization [23,24]. However, there are multiple kernel functions in SVR, and each kernel function has its characteristic. Therefore, for an unknown implicit problem, how to select the optimal kernel function is still a challenge [25,26].
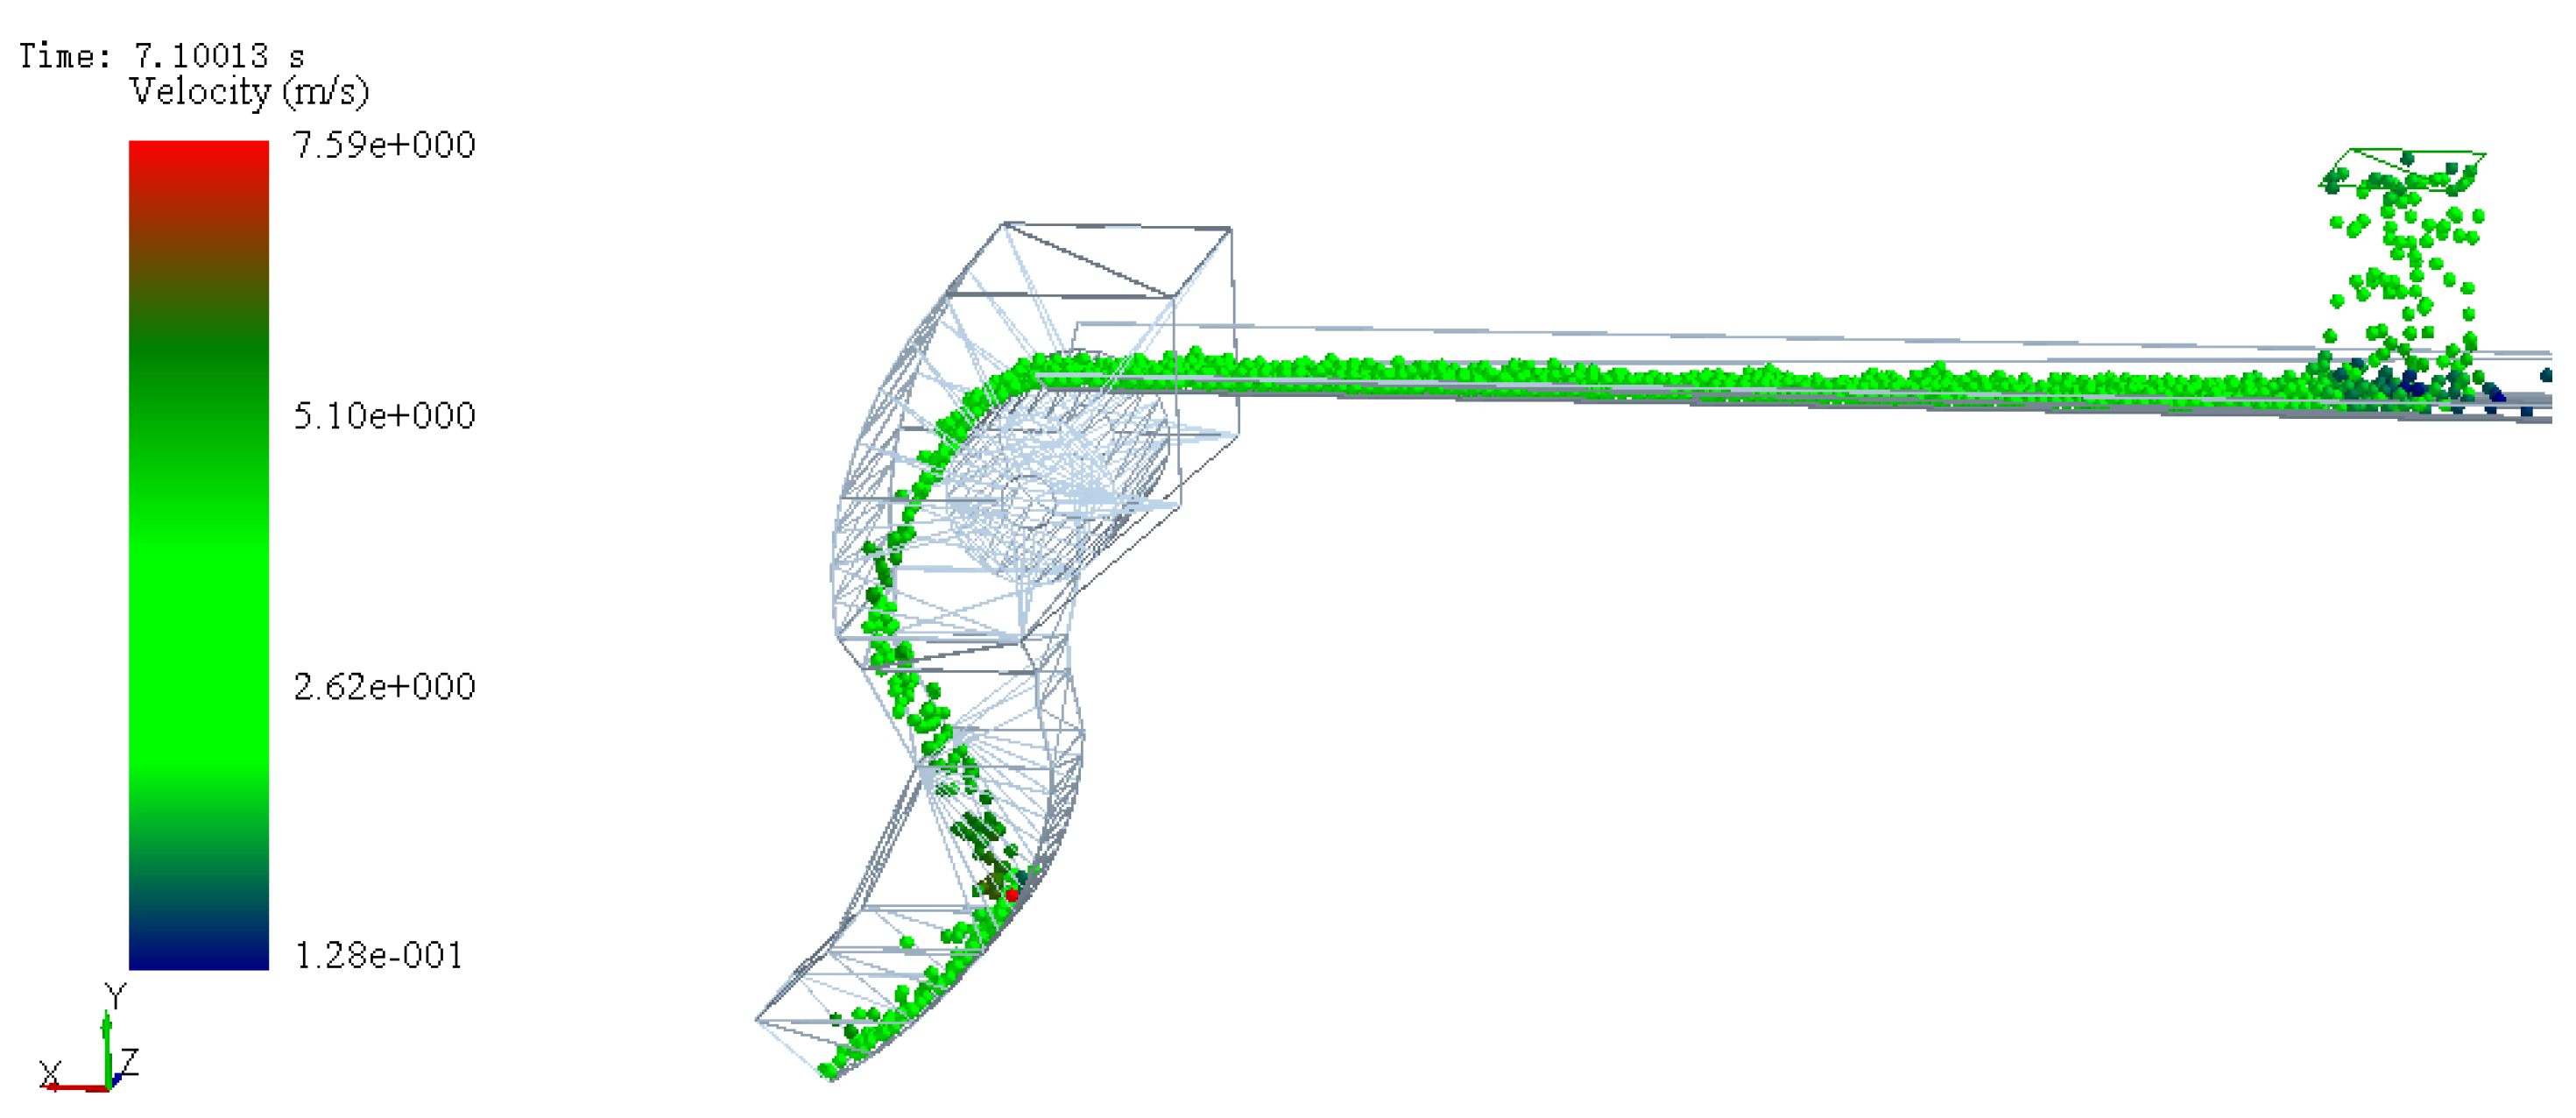
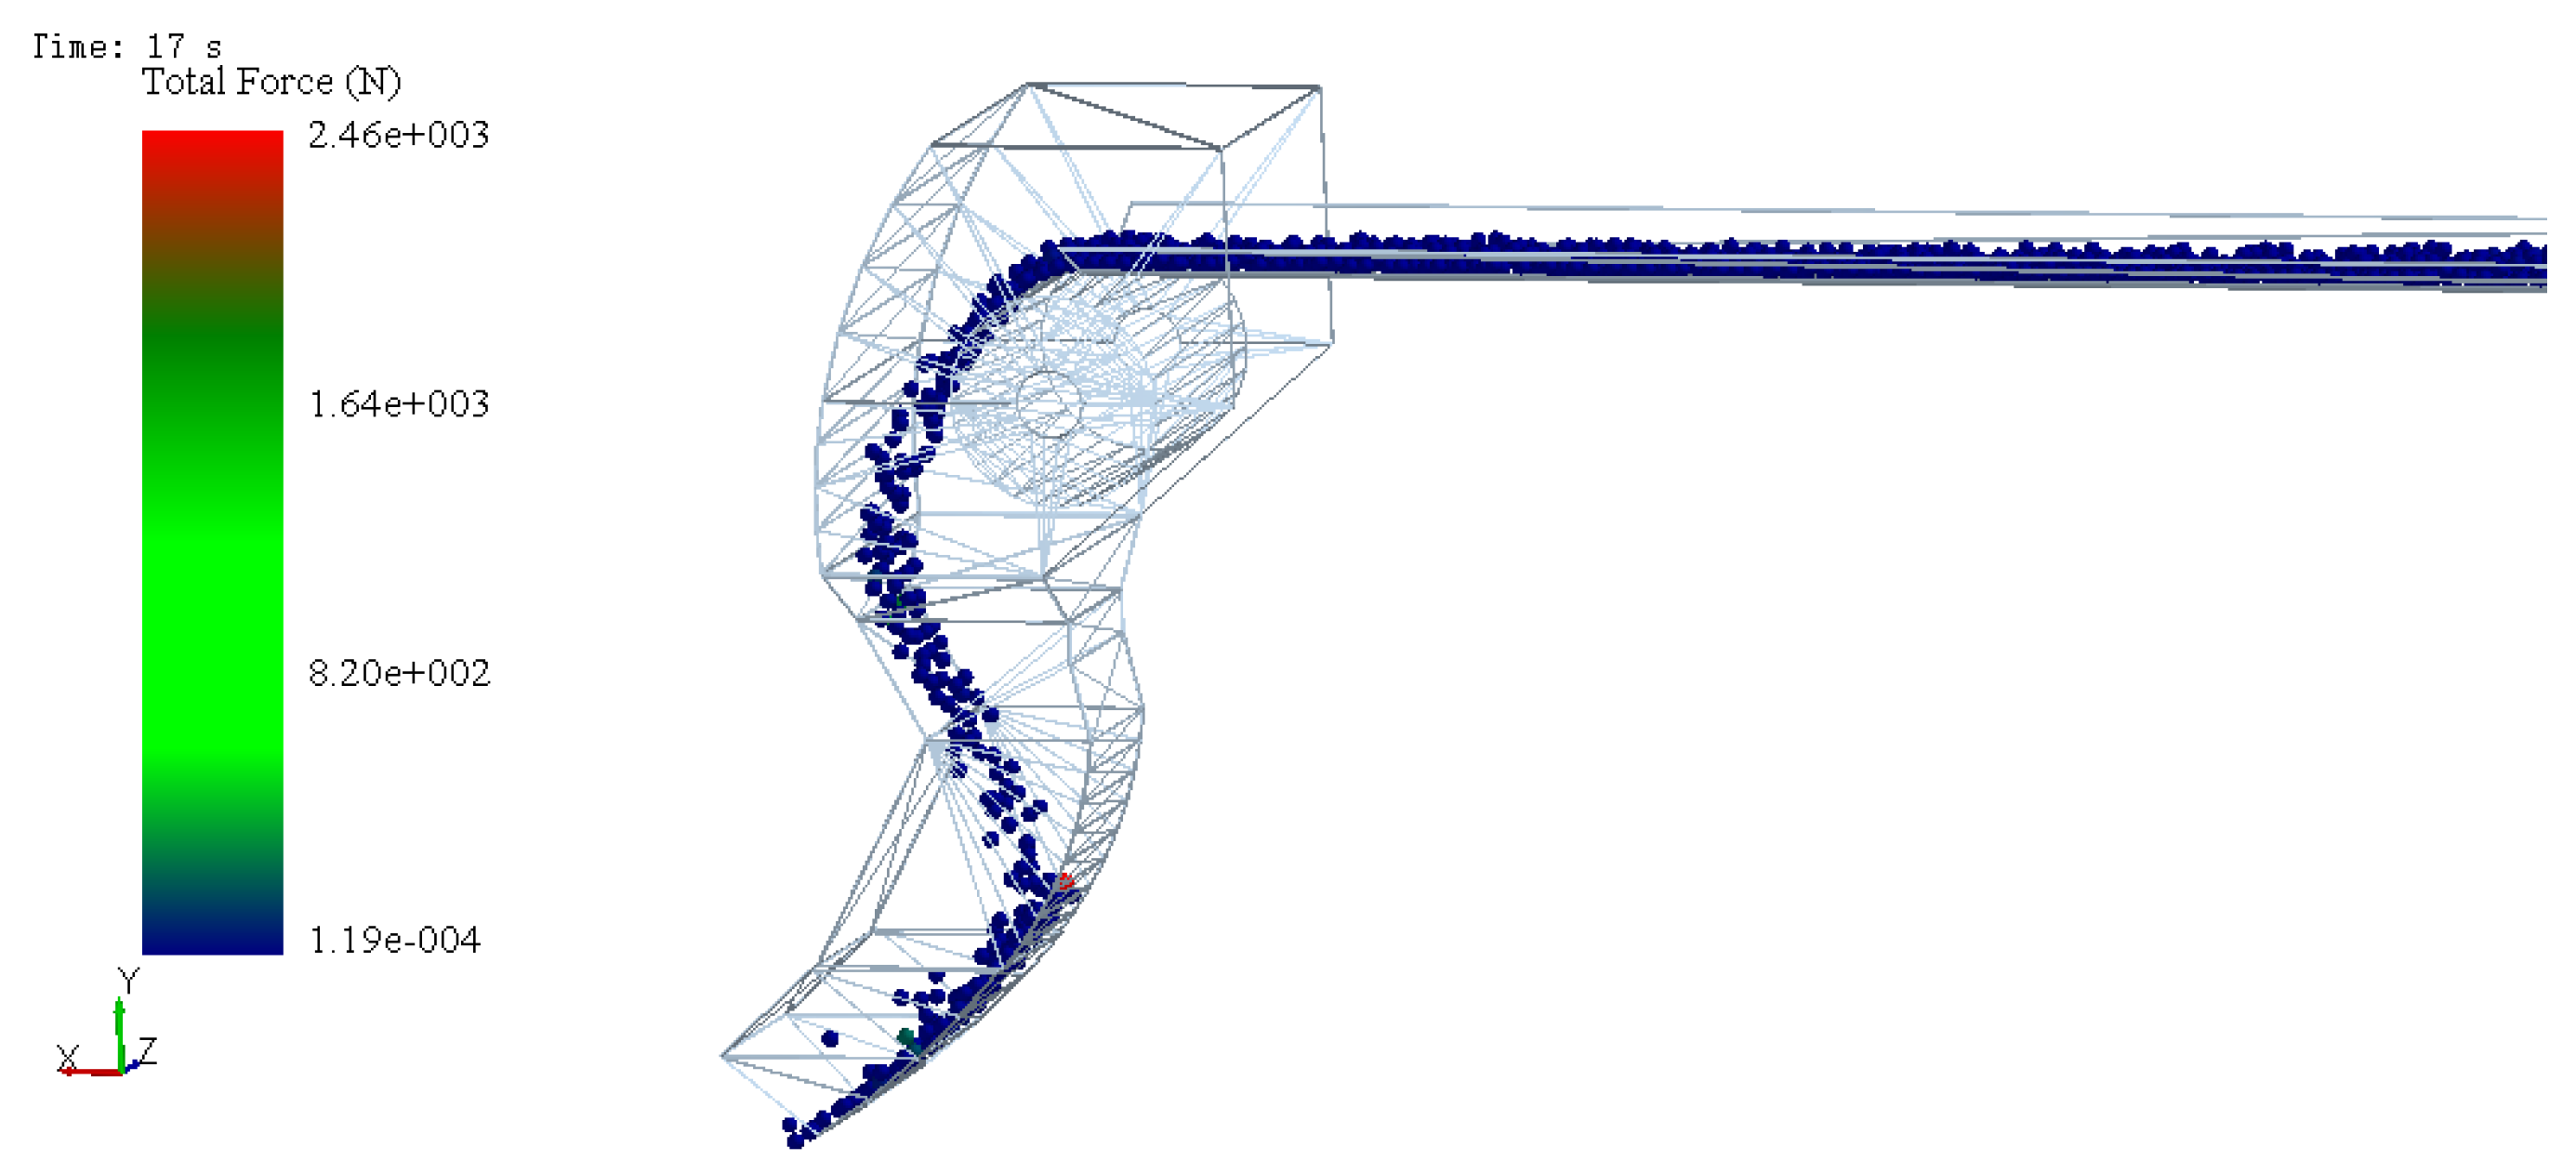
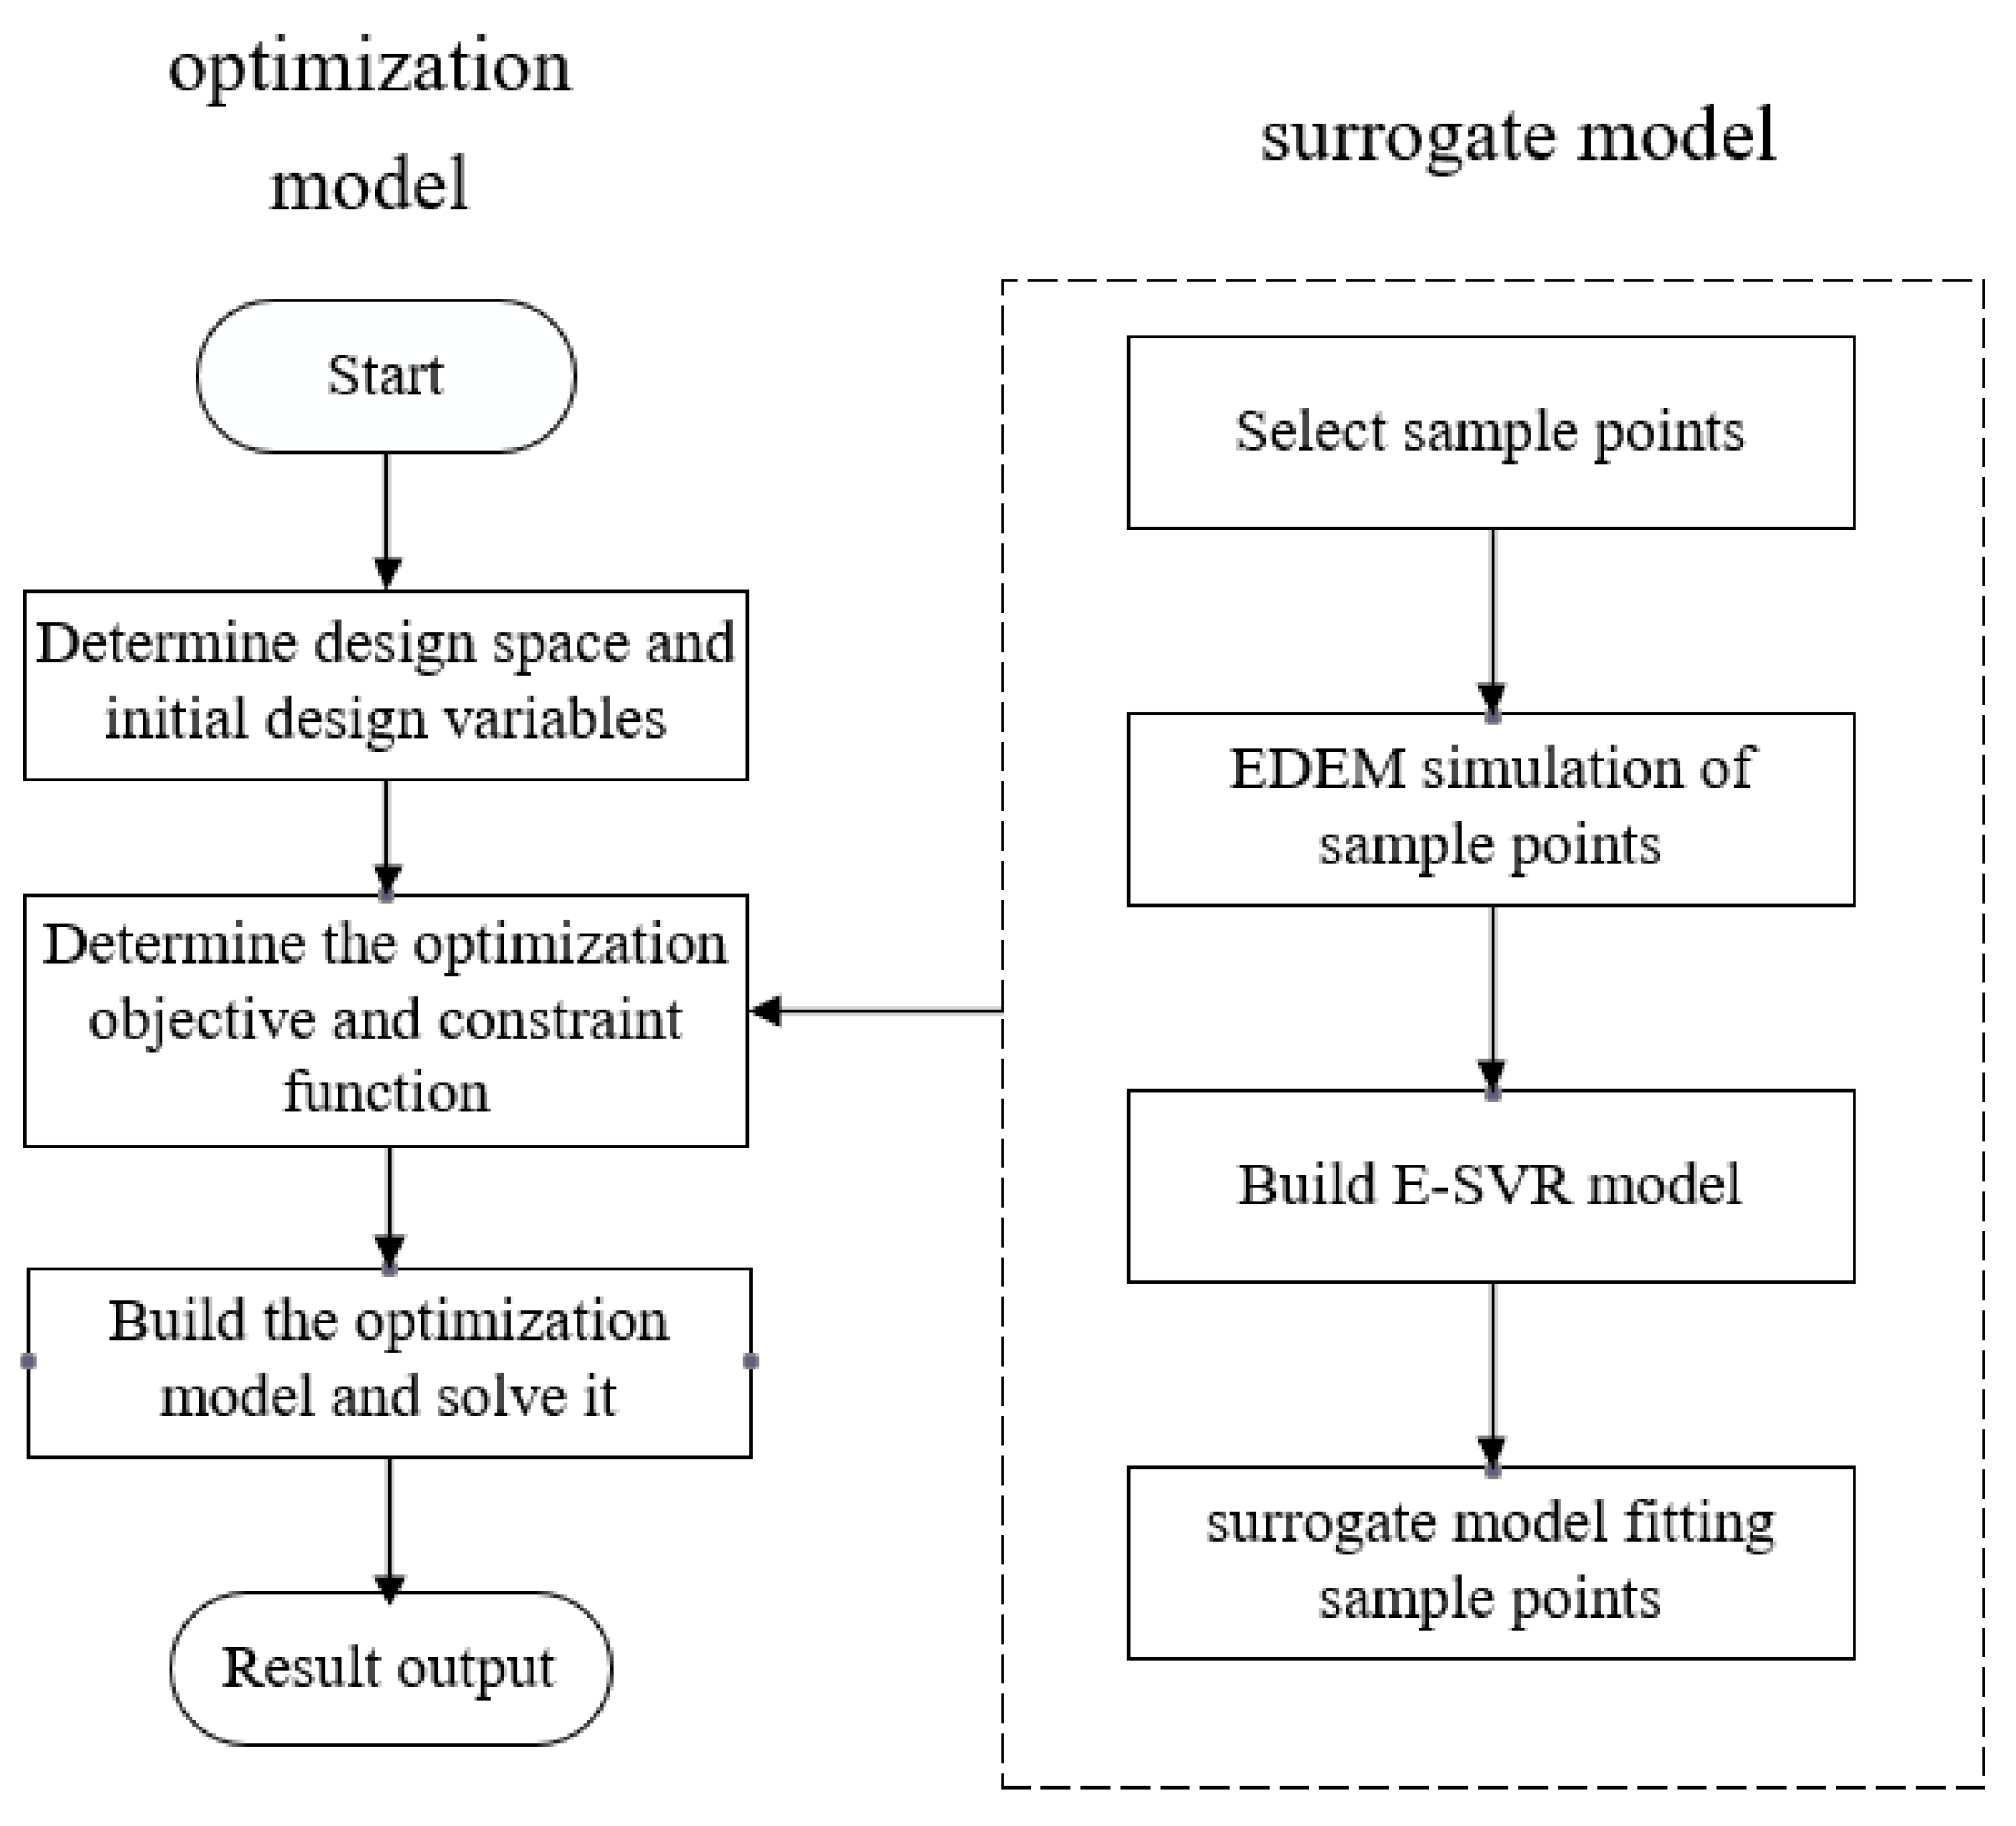
In this paper, the idea of ensemble of surrogates (EoS) is introduced to alleviate dependency on the kernel functions in modeling of performance responses of the chute. The E-SVR model with multiple kernel functions was constructed to replace the implicit relationship between the chute structural parameters and the performance response. Then, the design optimization of the chute structure was carried out to reduce the maximum impact force with the maximum conveying-speed constraint.

2. Simulation of the Material-Conveying Process

In practical production, the service life of the chute and the smoothness of material conveying in the chute are closely related to the structural parameters of the chute. In this paper, the coke-conveying process is simulated by EDEM 2019 software to obtain the maximum impact force and maximum material-conveying-speed data at different structural parameters.
According to the workshop layout of one steel plant, the initial 3D model of chute was built (shown in Figure 1). Then, the model was imported into EDEM software for material-conveying process simulation to obtain the impact force of coke on the chute and the conveying speed of coke in the chute under the current combination of structural parameters.
EDEM is a commonly used software to solve the motion analysis of discrete particles. By simulating the motion state of particles during the conveying process, the response results of particle velocity and impact force can be obtained. As shown in Figure 2, the material was conveyed from the input conveyor belt to the feed inlet. Under the influence of inertial force and gravity, the material dashed against the inner wall of chute and then changed direction and moved along the inner wall of the chute. Finally, the material was conveyed to the output conveyor belt through the receiving spoon at the bottom of the chute.
The settings of the material-conveying process in EDEM software were as follows: the contact model is the rolling friction model; the direction of gravity acceleration is Z, and the magnitude is −9.81 m/s2; the direction of the initial moving speed of the material is X, and the magnitude is 1.5 m/s; and the conveying materials is the spherical coke. Specific parameters are shown in Table 1.
Particles were generated by EDEM’s built-in particle factory. The particle position was set to “random,” and the weight generation rate was set to 50 kg/s.
In order to obtain the conveying speed of coke and the impact force on the chute, the conveying process of coke in the chute was simulated. The simulation began from the time the coke entered the chute until the batch of materials was output from the receiving spoon. The maximum conveying speed and the maximum impact force of coke under the current structural parameters were obtained, as shown in Figure 2 and Figure 3. At 7.1 s, the coke-conveying speed reached the maximum value of 7.59 m/s. At 17 s, the maximum impact force of coke (2460 N) on the chute occurred.

3. Optimization Model and Flowchart

3.1. Optimization Model

The phenomenon of blocking, dusting, and crushing often occurs in the conveying process of the chute. Moreover, the long-term impact easily leads wear and destruction of the chute. Therefore, the conveying speed of coke in the chute and the impact of coke on the chute should be considered comprehensively in the design of chute structure. According to the practical experience of enterprises, the phenomenon of plugging and high breakage rate will not occur when the maximum conveying speed of coke is 7–7.2 m/s. Therefore, taking the maximum impact force of coke on the chute as the optimization objective and the maximum conveying speed of coke within the specified interval as the constraint, the optimization model of chute structural parameters is constructed, as shown below:
f i n d : d min : f d s . t . : 7 v 7.2 d = R 1 , R 2 , θ 1700 R 1 2500 1800 R 2 2200 25 θ 30
In Equation (1), d is the structural parameters of the chute, f d is the maximum impact force of materials on the chute (N), v is the maximum conveying speed of materials (m/s), R 1 , R 2 is the key structure size of the chute (mm) and θ is the key angle of the chute (°). Figure 1 shows the location of R 1 , R 2 and θ . The structure parameters [2100, 2000, 27.5] of the chute previously used in a steel mill are determined as the initial design variables. It is worth noting that the uncertainty of the design variable is not considered in the optimization model (1). In the future, a reliability-based design optimization method will be conducted to obtain the optimal design that meets the probabilistic constraints [27].

3.2. Flowchart of Chute Structure Optimization

The flowchart of the proposed chute structure optimization method is shown in Figure 4. First, the initial value and the range of each design variable are determined. Then, the objective function and constraint function are approximated by the surrogate model to reduce the optimization cost. The E-SVR surrogate model is used here to achieve a good performance for the implicit objective or constraint function. Finally, the gradient-based optimization algorithm is used to obtain the optimal design.

4. E-SVR Model

4.1. SVR Model

Based on the classification model of the Support Vector Machine (SVM), the SVR model is extended to fit the implicit function. The main advantages of SVR are as follows [28,29]: strong adaptability to small sample data, strong generalization ability, and the ability to avoid the “dimension disaster” because the complexity of SVR is determined by the number of support vectors rather than the dimension of design space. The SVR model is expressed as
y ( x ) = w Φ ( x , x i ) + b
In Equation (2), Φ ( x , x i ) is the kernel function, which is the key to solving nonlinear problems [28]. The weight coefficient w and the deviation b are obtained by solving the following optimization problems:
min : 1 2 w 2 + C i = 1 n ( ξ i + + ξ i ) s . t . : y i w Φ ( x , x i ) b ε + ξ + w Φ ( x , x i ) + b y i ε + ξ ξ + , ξ 0
In Equation (3), C is the penalty factor and ξ i + , ξ i are the relaxation factors.
Great differences in prediction accuracy of SVR can be observed when different kernel functions are used. Therefore, the selection of kernel functions is very important in SVR. Typical kernel functions are shown in Table 2.
For given sample points, various surrogate model can be fitted, but the fitting precision is different, which has a great influence on the final optimization result. Therefore, the error index is used to evaluate the accuracy of the surrogate model. In this paper, commonly used error indices are used:
(1)
Multiple correlation coefficient R 2
R 2 = 1 i = 1 m ( y i y ^ i ) 2 i = 1 m ( y i y ¯ ) 2 = 1 M S E V a r
(2)
Relative average absolute error ( R A A E )
R A A E = i = 1 m y i y ^ i m × S T D
(3)
Relative maximum absolute error ( R M A E )
R M A E = max i = 1 , , m y i y ^ i S T D
In Equations (4)–(6), R 2 and R A A E represent the global relative error of the surrogate model. R M A E represents the local relative error. m represents the number of test samples used to evaluate the accuracy of the surrogate model. y i represents the true value, and y ^ i represents the predicted value through the surrogate model. y represents the average value of all true values. M S E , V a r and S T D represent the mean square error, variance of true value, and standard deviation, respectively, which are calculated as follows:
M S E = i = 1 m ( y i y ^ i ) 2 m , V a r = i = 1 m ( y i y ¯ ) 2 m , S T D = V a r
As seen from the above equations, the smaller MSE is, the larger R 2 and the smaller R A A E are. Therefore, the global error of the surrogate model is small, and the prediction accuracy is high. The local error index R M A E represents the local fitting accuracy of the surrogate model. In a certain region, the smaller R M A E is, the higher the fitting accuracy of the surrogate model is. In this paper, larger R 2 , smaller R A A E , and smaller R M A E indicate that the surrogate model has higher fitting accuracy.

4.2. E-SVR Surrogate Model

The kernel functions in SVR can be classified as the global kernel function and the local kernel function [30]. In the global kernel function (such as the polynomial kernel function), the farther to the test points, the greater the influence on the kernel function. Therefore, the strong generalization ability and the weak learning ability are observed in the global kernel function. Differently, in the local kernel function (such as the Gaussian radial basis kernel function), the closer to the test points, the greater the influence on the kernel function. Therefore, the strong learning ability and the weak generalization ability are observed in the local kernel function [31]. To comprehensively use the advantages of both the global kernel function and the local kernel function, an ensemble method was developed in this paper.
Among all the kernel functions, the polynomial kernel function and the Gaussian radial basis kernel function are most commonly used. When the samples are linearly or quadratic nonlinearly separable, the linear kernel function has better classification ability. On the other hand, the Gaussian radial basis kernel function has good performance for general nonlinear problems. The polynomial kernel function is a global kernel function. The Gaussian RBF kernel function has better adaptability to data and strong anti-interference ability to noise, so it belongs to local kernel function. To assess the problems of generalization and learning ability of the single-kernel function, the ensemble of SVR models constituted by polynomial kernel function and Gaussian radial basis kernel function was carried out.
The basic principle of establishing the E-SVR surrogate model is as follows. First, the polynomial kernel function-based SVR model (Poly-SVR) and the Gaussian RBF kernel function-based SVR model (RBF-SVR) were established. Then, the weight coefficients of each single-kernel-based SVR model were calculated. Finally, two single-kernel-based SVR models were linearly combined to obtain the E-SVR model. Compared with the single-kernel-based SVR model, the E-SVR model has better performance on the adaptability, robustness, and prediction ability of the implicit problems.
The equation for the E-SVR model is as follows:
y ^ E S V R ( x ) = i = 1 N w i y ^ i ( x )
where, the weight coefficient should satisfy the following equation:
i = 1 N w i = 1
In Equations (8) and (9), N is the number of the single-kernel SVR models used to construct the final E-SVR model, y ^ E S V R is the predicted value of the E-SVR model at test point x , y ^ i ( x ) is the predicted value of the i-th single-kernel SVR model at test point x , and w i represents the corresponding weight coefficient of the i-th single-kernel SVR model.
The weight value quantifies the prediction accuracy of the single-kernel function-based SVR model. In general, among the single-kernel SVR models, the higher the prediction accuracy of the single-kernel SVR model, the larger the weight value that will be assigned to it. Conversely, a smaller weight value will be assigned to the single-kernel SVR model with less accuracy. It is worth noting that, when the weight value of the single-kernel SVR model is assigned as 1 and the weight values of the other single-kernel SVR models are assigned as 0, the E-SVR model will degenerate into the single-kernel-based SVR model.
In this paper, the heuristic weight-solving strategy [32] proposed by Goel and Haftka is used to calculate the weight values of single-kernel function-based SVR models. The heuristic weight-solving strategy is simple and easy to implement, which can better balance the weight values of each single-kernel-based SVR model. The equation of Goel and Haftka’s method is as follows:
E a v g = 1 N i = 1 N E i ω i = ( E i + α E a v g ) β , α < 1 , β < 0 ω i = ω i / i = 1 N ω i
In Equation (10), E i is the predicted error of the single-kernel SVR model, which can be expressed by global error or local error. N is the number of single-kernel SVR models required to construct the final E-SVR model. α and β are used to control the importance of averaging and importance of individual surrogate, respectively [32]. Smaller α and larger negative β impart higher weight for the single-kernel SVR model with higher prediction accuracy. On the contrary, larger α and smaller β show high confidence in the averaging scheme for all the single-kernel SVR models [32]. According to Goel and Haftka’s study, α = 0.05 and β = 1 are used in this paper.

4.3. Numerical Examples

In this section, 2 test functions were introduced to compare the performance of Poly-SVR, RBF-SVR, and E-SVR models proposed in this paper.
(1)
Brain-Hoo function [33]:
f ( x , y ) = ( y 5.1 x 2 / 4 π 2 + 5 x / π 6 ) 2 + 10 ( 1 1 / 8 π ) cos ( x ) + 10 , x 5 , 10 , y 0 , 15
This is moderate nonlinear problem with 2 variables. The 3D graph of Brain-Hoo function is shown in Figure 5. In this example, 20 points by Latin hypercube sampling (LHS) were selected as the training samples. The error evaluation index ( R 2 , R A A E , R M A E ) were calculated through leave-one-out cross-validation [34]. The comparative results of different SVR models for the Brain-Hoo function are shown in Table 3.
Based on the results in Table 3, a much smaller global error evaluation index R A A E and local error evaluation index R M A E are observed in the Poly-SVR model compared to the RBF-SVR model. Therefore, the accuracy of the Poly-SVR model is much better than the RBF-SVR model in this example. Differently, E-SVR obtained by the ensemble of two different kernels has similar accuracy to the Poly-SVR model, where the same R 2 and slightly larger R A A E , R M A E are observed. Therefore, taking the 2D Brain-Hoo test function with moderate nonlinearity as an example, the E-SVR model has better performance.
(2)
Hartman3 function [32]
f ( x ) = i = 1 4 c i e x p j = 1 n a i j ( x j p i j ) 2 x = ( x 1 , x 2 , , x n ) , x i 0 , 1
This is a highly nonlinear problem with 3 variables. The corresponding parameters of Hartman3 function are given in Table 4 [32].
In this example, 30 points selected by Latin hypercube sampling (LHS) were used as the training samples. The error evaluation indices ( R 2 , R A A E , R M A E ) were calculated through leave-one-out cross-validation [34]. The comparative results of different SVR models for the Hartman3 function are shown in Table 5.
By comparing the experimental results in Table 5, it can be seen that the performance of the RBF-SVR model is better compared to the Poly-SVR model whether viewed from the global evaluation index ( R 2 , R A A E ) or the local evaluation index R M A E . Among the 3 SVR models, the global fitting performance of the E-SVR model is better than the Poly-SVR model and the RBF-SVR model because larger R 2 and smaller R A A E are observed. On the other hand, the local error evaluation index R M A E in the E-SVR model is smaller than the Poly-SVR model and slightly larger than the RBF-SVR model. Therefore, taking the Hartman3 test function as an example, the E-SVR model has better performance among the three different surrogate models.
After comprehensive analysis of these 2 examples with different dimension and nonlinearity, the following conclusions can be drawn. For the first problem, the Poly-SVR model has the best performance, which is a little better than the E-SVR model. For the second problem, the E-SVR model has the best performance when using most error indices. In other words, the E-SVR model has high fitting accuracy for both problems. Therefore, for the test functions with different dimension and nonlinearity, the E-SVR model constructed by RBF-kernel and Poly-kernel has good fitting performance.

5. Design Optimization of Chute Structure

5.1. Design of Experiment

In order to obtain the optimal design parameters of the chute, the optimization model (1) can be solved directly by using the EDEM simulation results. However, due to the huge cost of calculation, this is difficult to realize in practice. In this paper, the surrogate model is introduced to replace the implicit relationship between structural parameters and performance responses of the chute, then the surrogate model is directly used in the optimization process to greatly reduce the simulation cost.
To reduce the number of EDEM experiments but generate representative samples, various experiment design methods can be used to select the chute structure parameter combinations ( R 1 , R 2 , θ ) in the design space. LHS has the characteristic of uniform stratification and can obtain the representative sample in the case of less sampling, so LHS is more efficient than the ordinary sampling method [35]. Moreover, LHS has the freedom to define the sample number, thereby providing greater flexibility for problem with different dimensionality [36]. Therefore, the LHS method is used to select 30 chute structure parameter combinations ( R 1 , R 2 , θ ) in this paper. Specific data are shown in Table 6.

5.2. Solution and Verification

In this paper, the E-SVR surrogate model was used in the iterative optimization procedure of chute structure, and the Sequential Quadratic Programming (SQP) method was used to calculate the next design point. The optimal chute structure parameters [2259.6, 1813.4, 29.9] were obtained under the condition that the coke velocity was between 7 m/s and 7.2 m/s. All program codes are tested in Matlab R2014b.
In order to verify the effectiveness of the optimization results, a 3D model of the chute was reconstructed according to the optimal structure parameter [2259.6, 1813.4, 29.9]. The 3D model was imported into EDEM software for verification experiments. Moreover, the original chute of the factory was upgraded by using the structural parameters obtained from the optimization design of the chute structure through the E-SVR model. During the actual service of the upgraded chute for 1000 h, there was no blocking phenomenon. Through actual monitoring, the maximum impact force of coke on the chute was reduced to 2047 N, which was basically consistent with the simulation result of 2040 N and proved the effectiveness of using EDEM simulation.
After optimization, the maximum impact force was reduced by 17.07% and the maximum conveying speed was reduced by 6.59%, which still falls within the specified range. The result comparisons of the chute structure before and after optimization are shown in Table 7.

5.3. Comparison of Single/Ensemble-Kernel-Based SVR

To further verify the effectiveness of the proposed E-SVR model in design optimization of chute structure, the performance of commonly used single-kernel-based SVR models (Poly-SVR and RBF-SVR) are used for comparison.
The 30 chute structure parameter combinations in Section 5.1 to construct the Poly-SVR model and the RBF-SVR model, respectively. According to the Poly-SVR model, the design optimization model of the chute structure was solved, and the optimal parameter combination [2296.7, 1742.4, 29.3] was obtained. Using this parameter combination, a 3D model of the chute structure was reconstructed. Then, the model was imported into EDEM software to conduct simulation experiments.
Similarly, according to the RBF-SVR model, the design optimization model of the chute structure was solved, and the optimal parameter combination [2173.5, 1909.5, 28.2] was obtained. According to this parameter combination, the 3D model of chute structure was reconstructed, and the model was imported into EDEM software for verification experiments.
The comparison results of single/ensemble-kernel SVR models are shown in Table 8. As can be seen, different optimization results were obtained based on different kernel SVR models for the chute structure optimization problem. By comparing the optimization results of 3 single/ensemble-kernel SVR models with that before optimization, the performance of chute structure based on the 3 SVR models improved in different degrees. Moreover, the optimization result of E-SVR model is better than that of Poly-SVR and RBF-SVR models. Therefore, better performance is observed in the parameter optimization of chute structure.

6. Conclusions

To avoid blocking and crushing of the coke and reduce wear and destruction of the chute during the conveying process, the design optimization model of structure parameters of the chute was established and solved in this paper. In the proposed method, the conveying speed of coke in the chute and the impact force of coke on the chute were comprehensively considered.
(1)
The optimization model of the chute structure parameter was established and solved in this paper. The maximum impact force of coke on the chute and the material crushing rate were effectively reduced within the allowed speed range, which improved the utilization rate of coke and prolonged the service life of the chute.
(2)
The E-SVR model was developed to integrate the advantages of both the Poly-SVR model and the RBF-SVR model. The effectiveness of the E-SVR model was verified through numerical examples.
(3)
By using the E-SVR surrogate model in the chute structural parameter optimization models to replace the implicit relationship between the maximum impact force, maximum conveying speed, and design variables, the computational cost of design optimization was reduced.
(4)
Through comparison with the results by using the Poly-SVR model and results by using the RBF-SVR model, the optimal results obtained by the proposed E-SVR model are accurate and effective, which is of great significance for the design of chute structure.

Author Contributions

Conceptualization, X.L. and J.M.; methodology, X.L.; software, Y.L.; validation, Q.J., Z.C. and W.Z.; formal analysis, W.M.; investigation, Y.C.; resources, Z.C.; data curation, Y.L.; writing—original draft preparation, Q.J.; writing—review and editing, X.L.; visualization, W.M.; supervision, J.M.; project administration, J.M.; funding acquisition, X.L. All authors have read and agreed to the published version of the manuscript.

Funding

This research was funded by the National Natural Science Foundation of China, grant number 51905492.

Institutional Review Board Statement

Not applicable.

Informed Consent Statement

Not applicable.

Data Availability Statement

No new data were created or analyzed in this study. Data sharing is not applicable to this article.

Conflicts of Interest

The authors declare no conflict of interest. The funders had no role in the design of the study; in the collection, analyses, or interpretation of data; in the writing of the manuscript; or in the decision to publish the results.

References

  1. Tamoghna, M.; Henrik, S. Simulation of Burden Distribution and Charging in an Ironmaking Blast Furnace. IFAC Pap. Online 2015, 48, 183–188. [Google Scholar] [CrossRef]
  2. Yu, Y.H.; Wu, R.F.; Ruan, W.S. Design and performance analysis of chute with aluminum foam laminated structure. J. Mach. Des. 2017, 34, 65–69. [Google Scholar]
  3. Ma, C.; Ren, T. Structure Design and Optimization of Distributing Chutes in Blast Furnace for Wear Resistance. China Mech. Eng. 2017, 28, 253–257, 266. [Google Scholar]
  4. O’Shaughnessy, C.; Masoero, E.; Gosling, P.D. Topology optimization using the discrete element method. Part 1: Methodology, validation, and geometric nonlinearity. Meccanica 2022, 57, 1213–1231. [Google Scholar] [CrossRef]
  5. Zhou, L.; Esteban, R.; Bryan, E.; Antonio, M. A smooth contact algorithm for the combined finite discrete element method. Comput. Part Mech. 2020, 7, 807–821. [Google Scholar] [CrossRef]
  6. Li, X.; Yuan, H.; Sun, G.S. Anti-impact Design of Discharge Chute. Coal. Mine Mach. 2020, 41, 4–5. [Google Scholar]
  7. Roberts, A.W. Chute Performance and design for rapid flow conditions. Chem. Eng. Technol. 2010, 26, 163–170. [Google Scholar] [CrossRef]
  8. Ren, X.P.; Jia, Y.W. Value analysis of influence of different factors on wear of distributing chute. China Metall. 2020, 30, 11–15, 40. [Google Scholar]
  9. Zhang, C.H.; Xu, Y.S.; Qin, Y.L.; Zhao, J.Y.; Li, W.L. Optimization design and application of the material-transfer device based on DEM. J. Mach. Des. 2020, 37, 112–117. [Google Scholar]
  10. Murao, A.; Kashihara, Y.; Oyama, N.; Sato, M.; Watakabe, S.; Yamamoto, K.; Fukumoto, Y. Development of Control Techniques for Mixing Small Coke at Bell-less Top Blast Furnace. Tetsu Hagane J. Iron Steel Inst. Jpn. 2016, 102, 614–622. [Google Scholar] [CrossRef] [Green Version]
  11. Xia, R.; Wang, X.W.; Li, B. Abrasion performance of the scraper conveyor chute under complex working conditions. Proc. Inst. Mech. Eng. Part J J. Eng. Tribol. 2021, 235, 2364–2375. [Google Scholar] [CrossRef]
  12. Guixin, S.; Futang, X.; Yue, H.; Xiaogang, W. BP-ANN Model to Optimize the Structural Parameter Setting of Transfer Point. In Proceedings of the 2020 4th International Workshop on Renewable Energy and Development (Iwred 2020), Sanya, China, 24–26 April 2020; Volume 510. [Google Scholar] [CrossRef]
  13. Li, H.F.; Luo, Z.G.; Zhang, S.C.; Zou, Z.S. Effect of Chute Angle on Process of Mixing Charging. J. Northeast. Univ. Nat. Sci. 2012, 33, 681–684. [Google Scholar]
  14. Chen, L.S.; Luo, Z.G.; You, Y.; Zou, Z.S. Effects of Flap Angles on the Charging Procedure of Flap Distributors. J. Northeast. Univ. Nat. Sci. 2013, 34, 971. [Google Scholar]
  15. Huang, W.F.; Sun, X.M. Development and application of the breakup-proof device for the telescopic chute. Goal Eng. 2004, 10, 69–70. [Google Scholar]
  16. Jha, R.K.; Swami, P.D. Failure prognosis of rolling bearings using maximum variance wavelet subband selection and support vector regression. J. Braz. Soc. Mech. Sci. Eng. 2022, 44, 13. [Google Scholar] [CrossRef]
  17. Li, Y.X.; Huang, X.Z.; Zhao, C.Y.; Ding, P.F. Stochastic fractal search-optimized multi-support vector regression for remaining useful life prediction of bearings. J. Braz. Soc. Mech. Sci. Eng. 2021, 43, 18. [Google Scholar] [CrossRef]
  18. Andres-Perez, E.; Gonzalez-Juarez, D.; Martin-Burgos, M.J.; Carro-Calvo, L.; Salcedo-Sanz, S. Influence of the number and location of design parameters in the aerodynamic shape optimization of a transonic aerofoil and a wing through evolutionary algorithms and support vector machines. Eng. Optimiz. 2017, 49, 181–198. [Google Scholar] [CrossRef]
  19. Duan, L.; Xiao, N.; Li, G.; Cheng, A.; Chen, T. Design optimization of tailor-rolled blank thin-walled structures based on -support vector regression technique and genetic algorithm. Eng. Optimiz. 2017, 49, 1148–1165. [Google Scholar] [CrossRef]
  20. Ye, Y.F.; Gao, J.B.; Shao, Y.H.; Li, C.N.; Jin, Y.; Hua, X.Y. Robust support vector regression with generic quadratic nonconvex epsilon-insensitive loss. Appl. Math. Model. 2020, 82, 235–251. [Google Scholar] [CrossRef]
  21. Zhu, P.; Pan, F.; Chen, W.; Zhang, S. Use of support vector regression in structural optimization: Application to vehicle crashworthiness design. Math. Comput. Simulat. 2012, 86, 21–31. [Google Scholar] [CrossRef]
  22. Gupta, D.; Acharjee, K.; Richhariya, B. Lagrangian twin parametric insensitive support vector regression (LTPISVR). Neural Comput. Appl. 2020, 32, 5989–6007. [Google Scholar] [CrossRef]
  23. Liu, Y.F.; Yan, C.P.; Ni, H.X. The approach to multi-objective optimization for process parameters of dry hobbing under carbon quota policy. Int. J. Adv. Manuf. Technol. 2022, 121, 6073–6094. [Google Scholar] [CrossRef]
  24. Xiang, H.Y.; Li, Y.L.; Liao, H.L.; Li, C.J. An adaptive surrogate model based on support vector regression and its application to the optimization of railway wind barriers. Struct. Multidiscip. Optim. 2017, 55, 701–713. [Google Scholar] [CrossRef]
  25. Tsirikoglou, P.; Abraham, S.; Contino, F.; Lacor, C.; Ghorbaniasl, G. A hyperparameters selection technique for support vector regression models. Appl. Soft Comput. 2017, 10, 139–148. [Google Scholar] [CrossRef]
  26. Kong, D.D.; Chen, Y.J.; Li, N.; Tan, S.L. Tool wear monitoring based on kernel principal component analysis and v-support vector regression. Int. J. Adv. Manuf. Tech. 2017, 89, 175–190. [Google Scholar] [CrossRef]
  27. Kaminski, M.; Solecka, M. Optimization of the truss-type structures using the generalized perturbation-based Stochastic Finite Element Method. Finite Elem. Anal. Des. 2013, 63, 69–79. [Google Scholar] [CrossRef]
  28. Azamathulla, H.M.; Ghani, A.A.; Chang, C.K.; Hasan, Z.A.; Zakaria, N.A. Machine Learning Approach to Predict Sedment Load—A Case Study. Clean Soil Air Water 2010, 38, 969–976. [Google Scholar] [CrossRef]
  29. Yang, C.Z.; Liu, J.Q.; Zeng, Y.Y.; Xie, G.Y. Prediction of components degradation using support vector regression with optimized parameters. Energy Procedia 2017, 127, 284–290. [Google Scholar] [CrossRef]
  30. Huang, H.; Ding, S.; Jin, F.; Yu, J.; Han, Y. A Novel Granular Support Vector Machine Based on Mixed Kernel Function. Int. J. Digit. Content Technol. Its Appl. 2012, 6, 484–492. [Google Scholar] [CrossRef]
  31. Zhu, P.; Zhang, Y.; Chen, G.L. Metamodeling development for reliability-based design optimization of automotive body structure. Comput. Ind. 2011, 62, 729–741. [Google Scholar] [CrossRef]
  32. Goel, T.; Haftka, R.T.; Shyy, W.; Queipo, N.V. Ensemble of surrogates. Struct. Multidiscip. Optim. 2007, 33, 199–216. [Google Scholar] [CrossRef]
  33. Viana, F.A.C.; Haftka, R.T.; Steffen, V. Multiple surrogates: How cross-validation errors can help us to obtain the best predictor. Struct. Multidiscip. Optim. 2009, 39, 439–457. [Google Scholar] [CrossRef]
  34. Shan, S.Q.; Wang, G.G. Survey of modeling and optimization strategies to solve high-dimensional design problems with computationally-expensive black-box functions. Struct. Multidiscip. Optim. 2010, 41, 219–241. [Google Scholar] [CrossRef]
  35. Li, X.K.; Zhu, H.; Chen, Z.Z.; Ming, W.Y.; Cao, Y.; He, W.B.; Ma, J. Limit state Kriging modeling for reliability-based design optimization through classification uncertainty quantification. Reliab. Eng. Syst. Saf. 2022, 224, 108539. [Google Scholar] [CrossRef]
  36. Li, X.K.; Han, X.Y.; Chen, Z.Z.; Ming, W.Y.; Cao, Y.; Ma, J. A multi-constraint failure-pursuing sampling method for reliability-based design optimization using adaptive Kriging. Eng. Comput. 2022, 38, 297–310. [Google Scholar] [CrossRef]
Figure 1. Structure of the chute.
Metals 13 00635 g001
Figure 2. Simulation diagram of coke speed.
Metals 13 00635 g002
Figure 3. Simulation diagram of impact force.
Metals 13 00635 g003
Figure 4. Design optimization of chute structure.
Metals 13 00635 g004
Figure 5. Three-dimensional graph of the Brain-Hoo function.
Metals 13 00635 g005
Table 1. Material properties and simulation settings.
ParametersValue
Spherical material propertyDiameter (mm)80
Poisson ratio0.28
Shear modulus (GPa)1.98
Density (Kg/m3)500
Chute propertiesPoisson ratio0.3
Shear modulus (GPa)80
Density (Kg/m3)7850
Collision properties between materialsCoefficient of restitution0.40
Static friction coefficient0.40
Coefficient of rolling friction0.05
Collision properties between material and chuteCoefficient of restitution0.50
Static friction coefficient0.30
Coefficient of rolling friction0.10
Simulation parameter settingNumber of particles between materials/(s)5000
Fixed time step(s)6.8 × 10⁴
Table 2. Kernel functions in SVR.
Kernel FunctionFormulas
Linear kernel function k ( x , x ) = x T x
Sigmoid kernel function k ( x , x ) = tanh ( a x x + c )
Radial basis kernel function k ( x , x ) = exp x x 2 / ( 2 s 2 )
Polynomial kernel function k ( x , x ) = ( x T x + h ) d
Table 3. Brain-Hoo function test results.
Evaluation IndexPoly-SVRRBF-SVRE-SVR
R210.95751
RAAE0.00260.10780.0038
RMAE0.02761.31770.031
Table 4. Parameters of the Hartman function.
iaijcipij
13.010301.00.36890.11700.2673
20.110351.20.46990.43870.7470
33.010303.00.10910.87320.5547
40.110353,20.038150.57430.8828
Table 5. Hartman3 function test results.
Evaluation IndexPoly-SVRRBF-SVRE-SVR
R20.26280.74610.7581
RAAE0.67440.38540.3689
RMAE3.39071.81522.1837
Table 6. Chute structure parameter combinations.
R1, R2, θR1, R2, θR1, R2, θR1, R2, θR1, R2, θ
2168/2034/27.92350/2125/29.12406/2153/29.42042/1971/27.12296/2098/28.7
2375/2137/29.21877/1888/26.11738/1819/25.21961/1931/26.62338/2119/29.0
1907/1903/26.31934/1917/26.51979/1939/26.72144/2022/27.81830/1865/25.8
2052/1976/27.21782/1841/25.52428/2164/29.61763/1832/25.42088/1994/27.4
1852/1876/25.92205/2052/28.22220/2060/28.32495/2198/30.02010/1955/26.9
1705/1802/25.02281/2090/28.62460/2180/29.82248/2074/28.42116/2008/27.6
Table 7. Result comparisons of the chute structure before and after optimization.
Structure ParameterMaximum Impact ForceMaximum Conveying Speed
Before optimization2100, 2000, 27.52460 N7.59 m/s
After optimization2259.6, 1813.4, 29.92040 N7.09 m/s
Table 8. Comparison results of single/ensemble-kernel SVR models.
Structure
Parameter
Maximum Impact ForceMaximum Conveying Speed
Poly-SVR2296.7, 1742.4, 29.32420 N7.14 m/s
RBF-SVR2173.5, 1909.5, 28.22370 N7.18 m/s
E-SVR2259.6, 1813.4, 29.92040 N7.09 m/s
Disclaimer/Publisher’s Note: The statements, opinions and data contained in all publications are solely those of the individual author(s) and contributor(s) and not of MDPI and/or the editor(s). MDPI and/or the editor(s) disclaim responsibility for any injury to people or property resulting from any ideas, methods, instructions or products referred to in the content.

