
Effect of Sodium Silicate on the Hydration of Alkali-Activated Copper-Nickel Slag Materials


1
Faculty of Infrastructure Engineering, Dalian University of Technology, Dalian 116023, China
2
Beijing General Research Institute of Mining and Metallurgy, Beijing 100160, China
3
National Center for International Research on Green Metal Mining, Beijing 102628, China
*
Author to whom correspondence should be addressed.
Metals 2023, 13(3), 596; https://doi.org/10.3390/met13030596
Submission received: 12 February 2023
/
Revised: 7 March 2023
/
Accepted: 9 March 2023
/
Published: 15 March 2023
(This article belongs to the Topic Green Low-Carbon Technology for Metalliferous Minerals)
Abstract
:This paper studied the influence of the modulus and dosage of sodium silicate on the hydration of alkali-activated copper-nickel slag (CNS) materials. CNS was used as the main raw material, and ground granulated blast furnace slag (GBFS) powder was selected as the mineral additive. The hydration and hardening mechanisms were discussed. The experimental results showed that [SiO4]4− and [AlO4]5− with a high degree of polymerization in the CNS glassy phase more easily underwent depolymerization-condensation and produced more C-S-H gels when the modulus was small and the sodium silicate dosage was high. When the content of sodium silicate was 7.0% and the modulus of sodium silicate solution was 1.0, the 28-day compressive strength of the material reached 125 MPa. This alkali-activated copper-nickel slag material can be used for mine filling, which has certain economic and ecological benefits.
1. Introduction
Copper-nickel slag (CNS) is an industrial by-product produced among the production of copper-nickel non-ferrous alloys [1] that has potential pozzolanic activity [2]. After chemical activation, the gelling activity of CNS can be improved to produce a new auxiliary cementing material that can be used for mine filling or to prepare fine aggregate for high-performance concrete [3,4]. The use of activators can improve the utilization rate of raw materials and reduce production costs [5]. Previous research has shown that chemical activators such as sodium hydroxide and sodium silicate can improve the strength of cementitious composite materials [2]; however, the chemical activator sodium hydroxide has many shortcomings, such as high cost, strong corrosivity, low safety, and is not suitable for industrial production.
Aydin et al. [6] compared the use of NaOH and Na2SiO3 as the activators for the alkali activation of Turkish slag. The results showed that under the optimum SiO2/Na2O ratio, compared with NaOH-activated Turkish slag mortar and Portland cement mortar, the sodium silicate-activated Turkish slag mortar had higher compressive strength, lower porosity, and longer setting time. Palomo’s research [7] showed that during alkali-activation, the polymerization reaction is the main process that determines the performance of the alkali-activated cementitious material. Compared with caustic alkali activators, sodium silicate contains a large amount of soluble silicate. Additionally, the soluble silicate accelerates the formation of hydration products of the alkali-induced reaction. Magallanes et al. [8] used sodium silicate solution with different moduli to activate granulated blast furnace slag (GBFS) and metakaolin materials. Studies have shown that the optimum modulus is 1.0–1.5, and the strength of GBFS and metakaolin mixed materials reached 88 MPa using 10% Na2O. Chen et al. [9] studied the influence of sodium silicate solution modulus and alkali dosage on the autogenous shrinkage of alkali-activated slag cement. When the modulus of sodium silicate solution increased from 0.5 to 1.0, the autogenous shrinkage increased, but when the modulus increased to 2.0, the opposite result appeared. Furthermore, the reduction in alkali dosage enhanced the autogenous shrinkage. Luukkonen et al. [10] used solubility rate, chemical structure, and pH to systematically characterize the sodium silicate powders with different SiO2/Na2O and found that when the ratio was 0.9, the alkali-activated blast furnace slag mortar had the highest compressive strength. Bocullo et al. [11] studied the influence of the SiO2/Na2O ratio on the compressive strength of fly ash, and found that this ratio had a significant effect on the alkali activation reaction. The ratio of SiO2/Na2O below 2.0 introduced excessive sodium into the system, which led to the rapid formation of sodium carbonate. If the ratio exceeded 3.1, the structural strength decreased.
As there is no previous study on the activation of CNS with sodium silicate, this paper focused on the effect of different sodium silicate moduli and contents on the hydration reaction of alkali-activated copper-nickel slag materials and provides a scientific reference to the preparation and application of alkali-activated copper-nickel slag materials in the future.
2. Materials and Methods
2.1. Materials
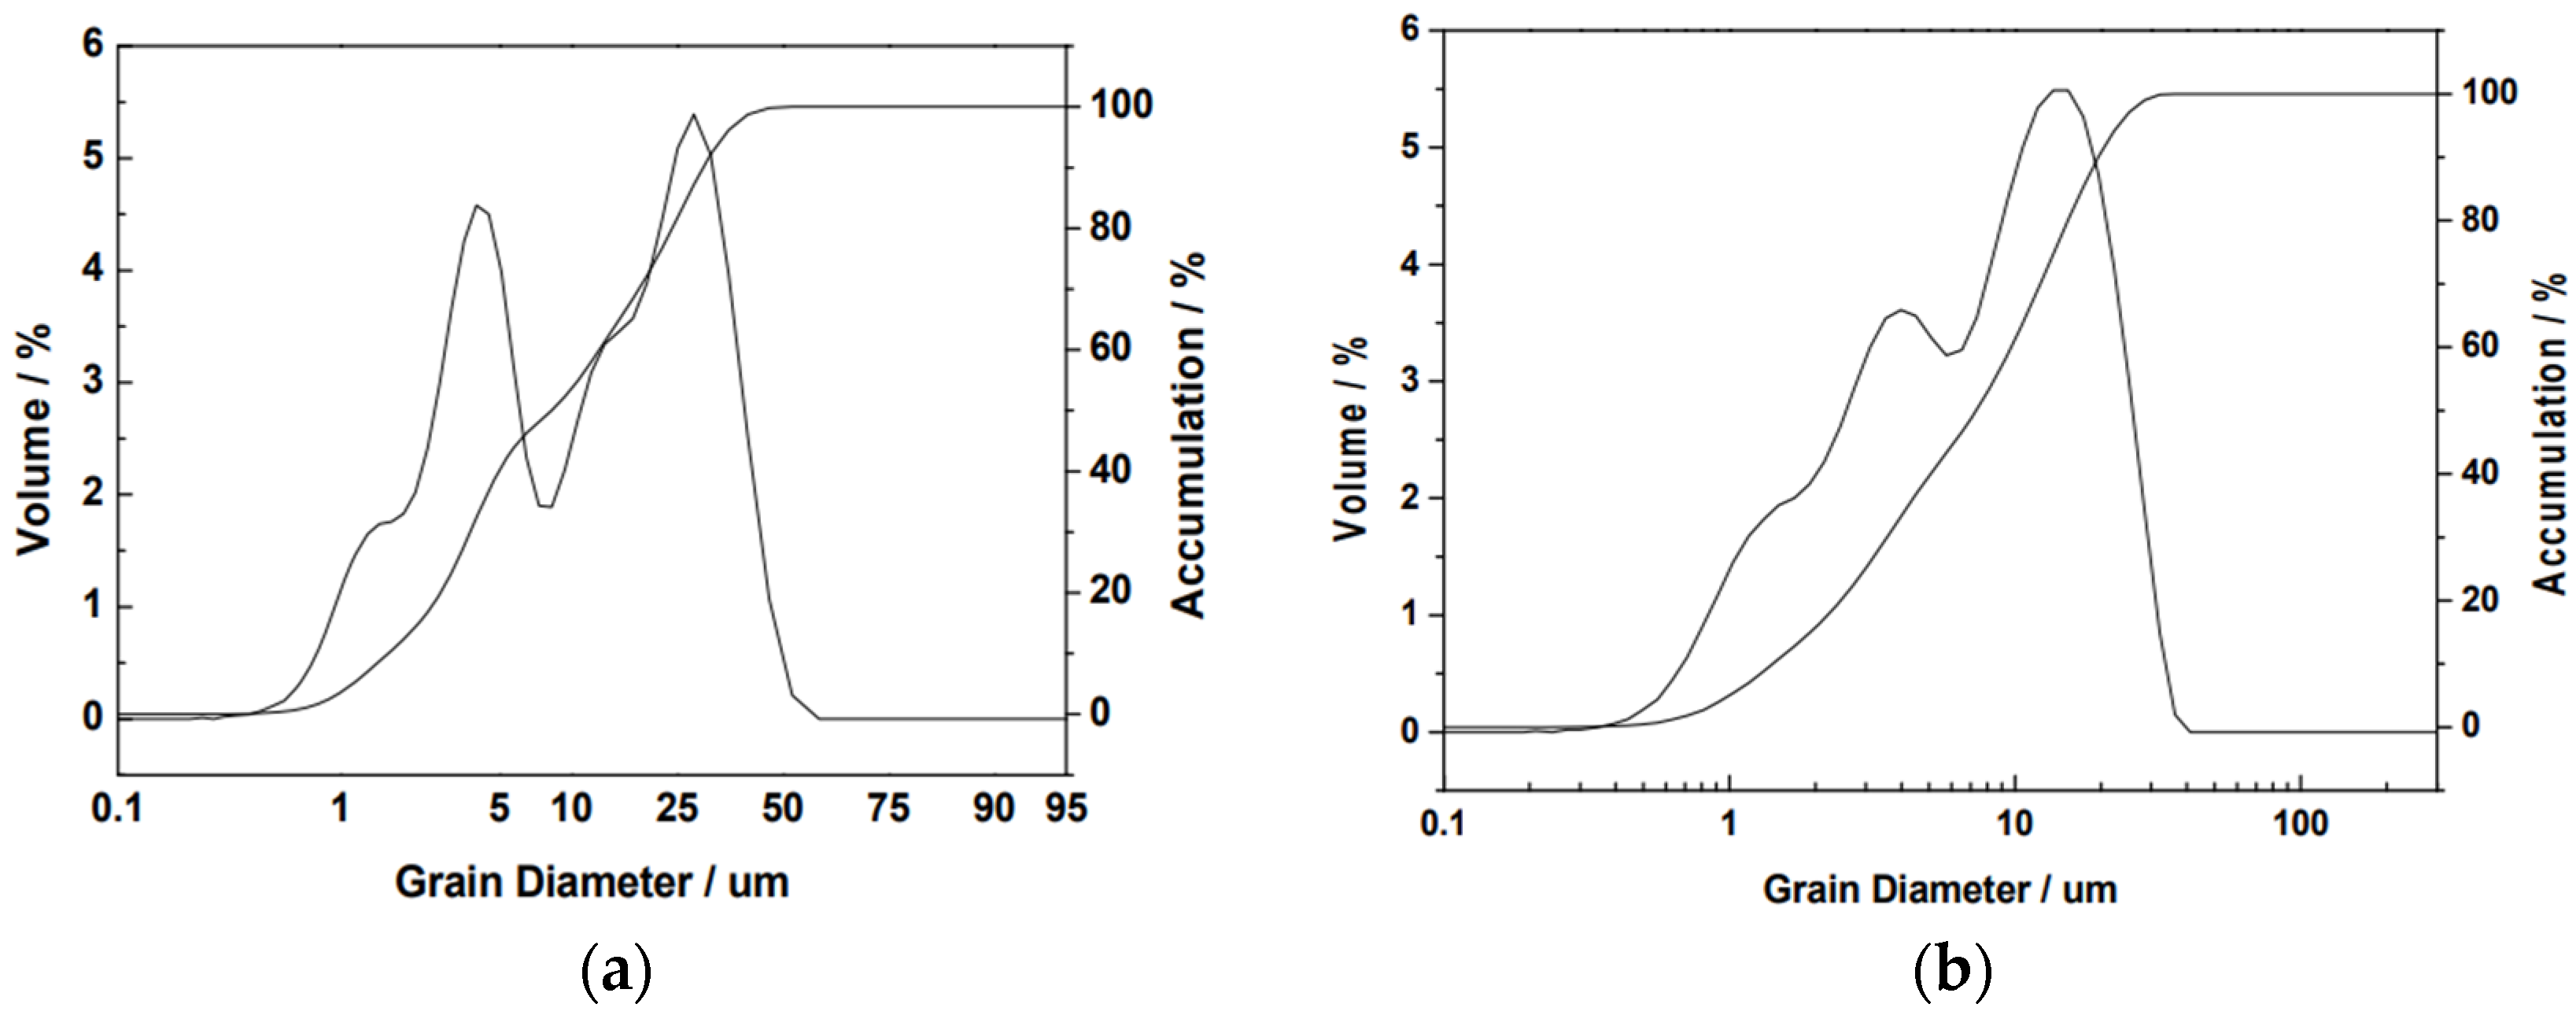
Copper-nickel slag (CNS) was obtained from Xinjiang, and the S95 ground granulated blast furnace slag (GGBFS) was obtained from Shandong. Their chemical compositions are shown in Table 1 [12]. CNS mainly contained Fe2O3 (53.87%), while only 1.66% CaO and 1.18% Al2O3 were present. The main mineral component of CNS is fayalite (Fe, Mg)2SiO4 (72.42%). Its spatial structure is an island-like [SiO4]4− tetrahedron. CNS contains 27.58% of a glassy phase, and its spatial structure is a netlike [SiO4]4− tetrahedral structure [12]. A ball mill was used to grind the CNS for 50 min, the median particle size of CNS was 8.30 µm, and the median particle size of GGBFS was 7.31 µm. The particle size distribution is shown in Figure 1. The sodium silicate solution was obtained from Shandong You Suo Chemical Technology Co., Ltd., Heze, China. By using chemical titration, the concentration of sodium silicate solution was 35%, the modulus was 3.2, the content of Na2O was 8.4%, and the content of SiO2 was 26.5%. Solid sodium silicate is an analytically pure chemical reagent with a modulus of 1.0.
2.2. Methods
2.2.1. Alkali Dissolution of Copper-Nickel Slag
Solid sodium silicate was mixed with water to prepare solutions with concentrations of 0.5, 1.0, 2.0, and 3.0 mol/L. Then, the temperature was kept at 20 ± 1 °C, and 1.0 g of CNS was weighed and immersed in the different sodium silicate solutions. After 3 days, the solution was centrifuged at 3000× g r/min for 20 min. Then, 5 mL of supernatant was extracted, and the concentration of Si, Al, Ca, and Fe ions in the solution were tested by plasma emission spectrometry (ICP).
2.2.2. Sample Preparation
Sodium hydroxide and water were added to the sodium silicate solution with a modulus of 3.2, and the activator solutions with moduli of 1.0, 1.5, 2.0, 2.5, 3.0, and 3.2 based on mass ratio were prepared. Then, with a water-binder ratio of 0.23, the mixture of CNS and GGBFS and the activator solution were poured into a mixer. After mixing, the stirred pastes were poured into a 20 × 20 × 20 mm mold. After vibration and compaction, they were put into a curing box at 20 ± 1 °C with a humidity of over 90% for curing to maintain the corresponding age. In addition, solid sodium silicate with a modulus of 1.0 was added to the activator solutions with different concentrations, and the mixture of CNS and GGBFS was prepared into cementitious materials according to the above steps, followed by curing to a certain age.
2.3. Tests
(1) The compressive strength was tested using a Shanghai Hualong WHY-300/10 microcomputer experimental press from China.
(2) An XRD test was conducted using a D8 Advance AXS X-ray diffractometer from Bruker Company in Karlsruhe, Germany with a Cu target. The scanning step size was 0.02, the scanning range was 5–80 (2θ), and the step time was 0.5 s.
(3) An FT-IR test was conducted using a Nicolet iS10 Fourier transform Infrared spectrometer from Thermo Fisher Scientific CN in Waltham, MA, USA. The spectral range was 400–4000 cm−1 and the detector resolution was 4 cm−1.
(4) A scanning electronic microscopy test was conducted using a Nova Nano SEM-50 from FEI in Hillsboro, OR, USA with a scanning frequency of 50/60 Hz.
(5) Alkali dissolution of CNS in glass phase was analyzed by an Inductive Coupled Plasma Emission Spectrometer from PerkinElmer Inc. in Waltham, MA, USA.
3. Results
3.1. Alkali Dissolution Experiment of Copper-Nickel Slag
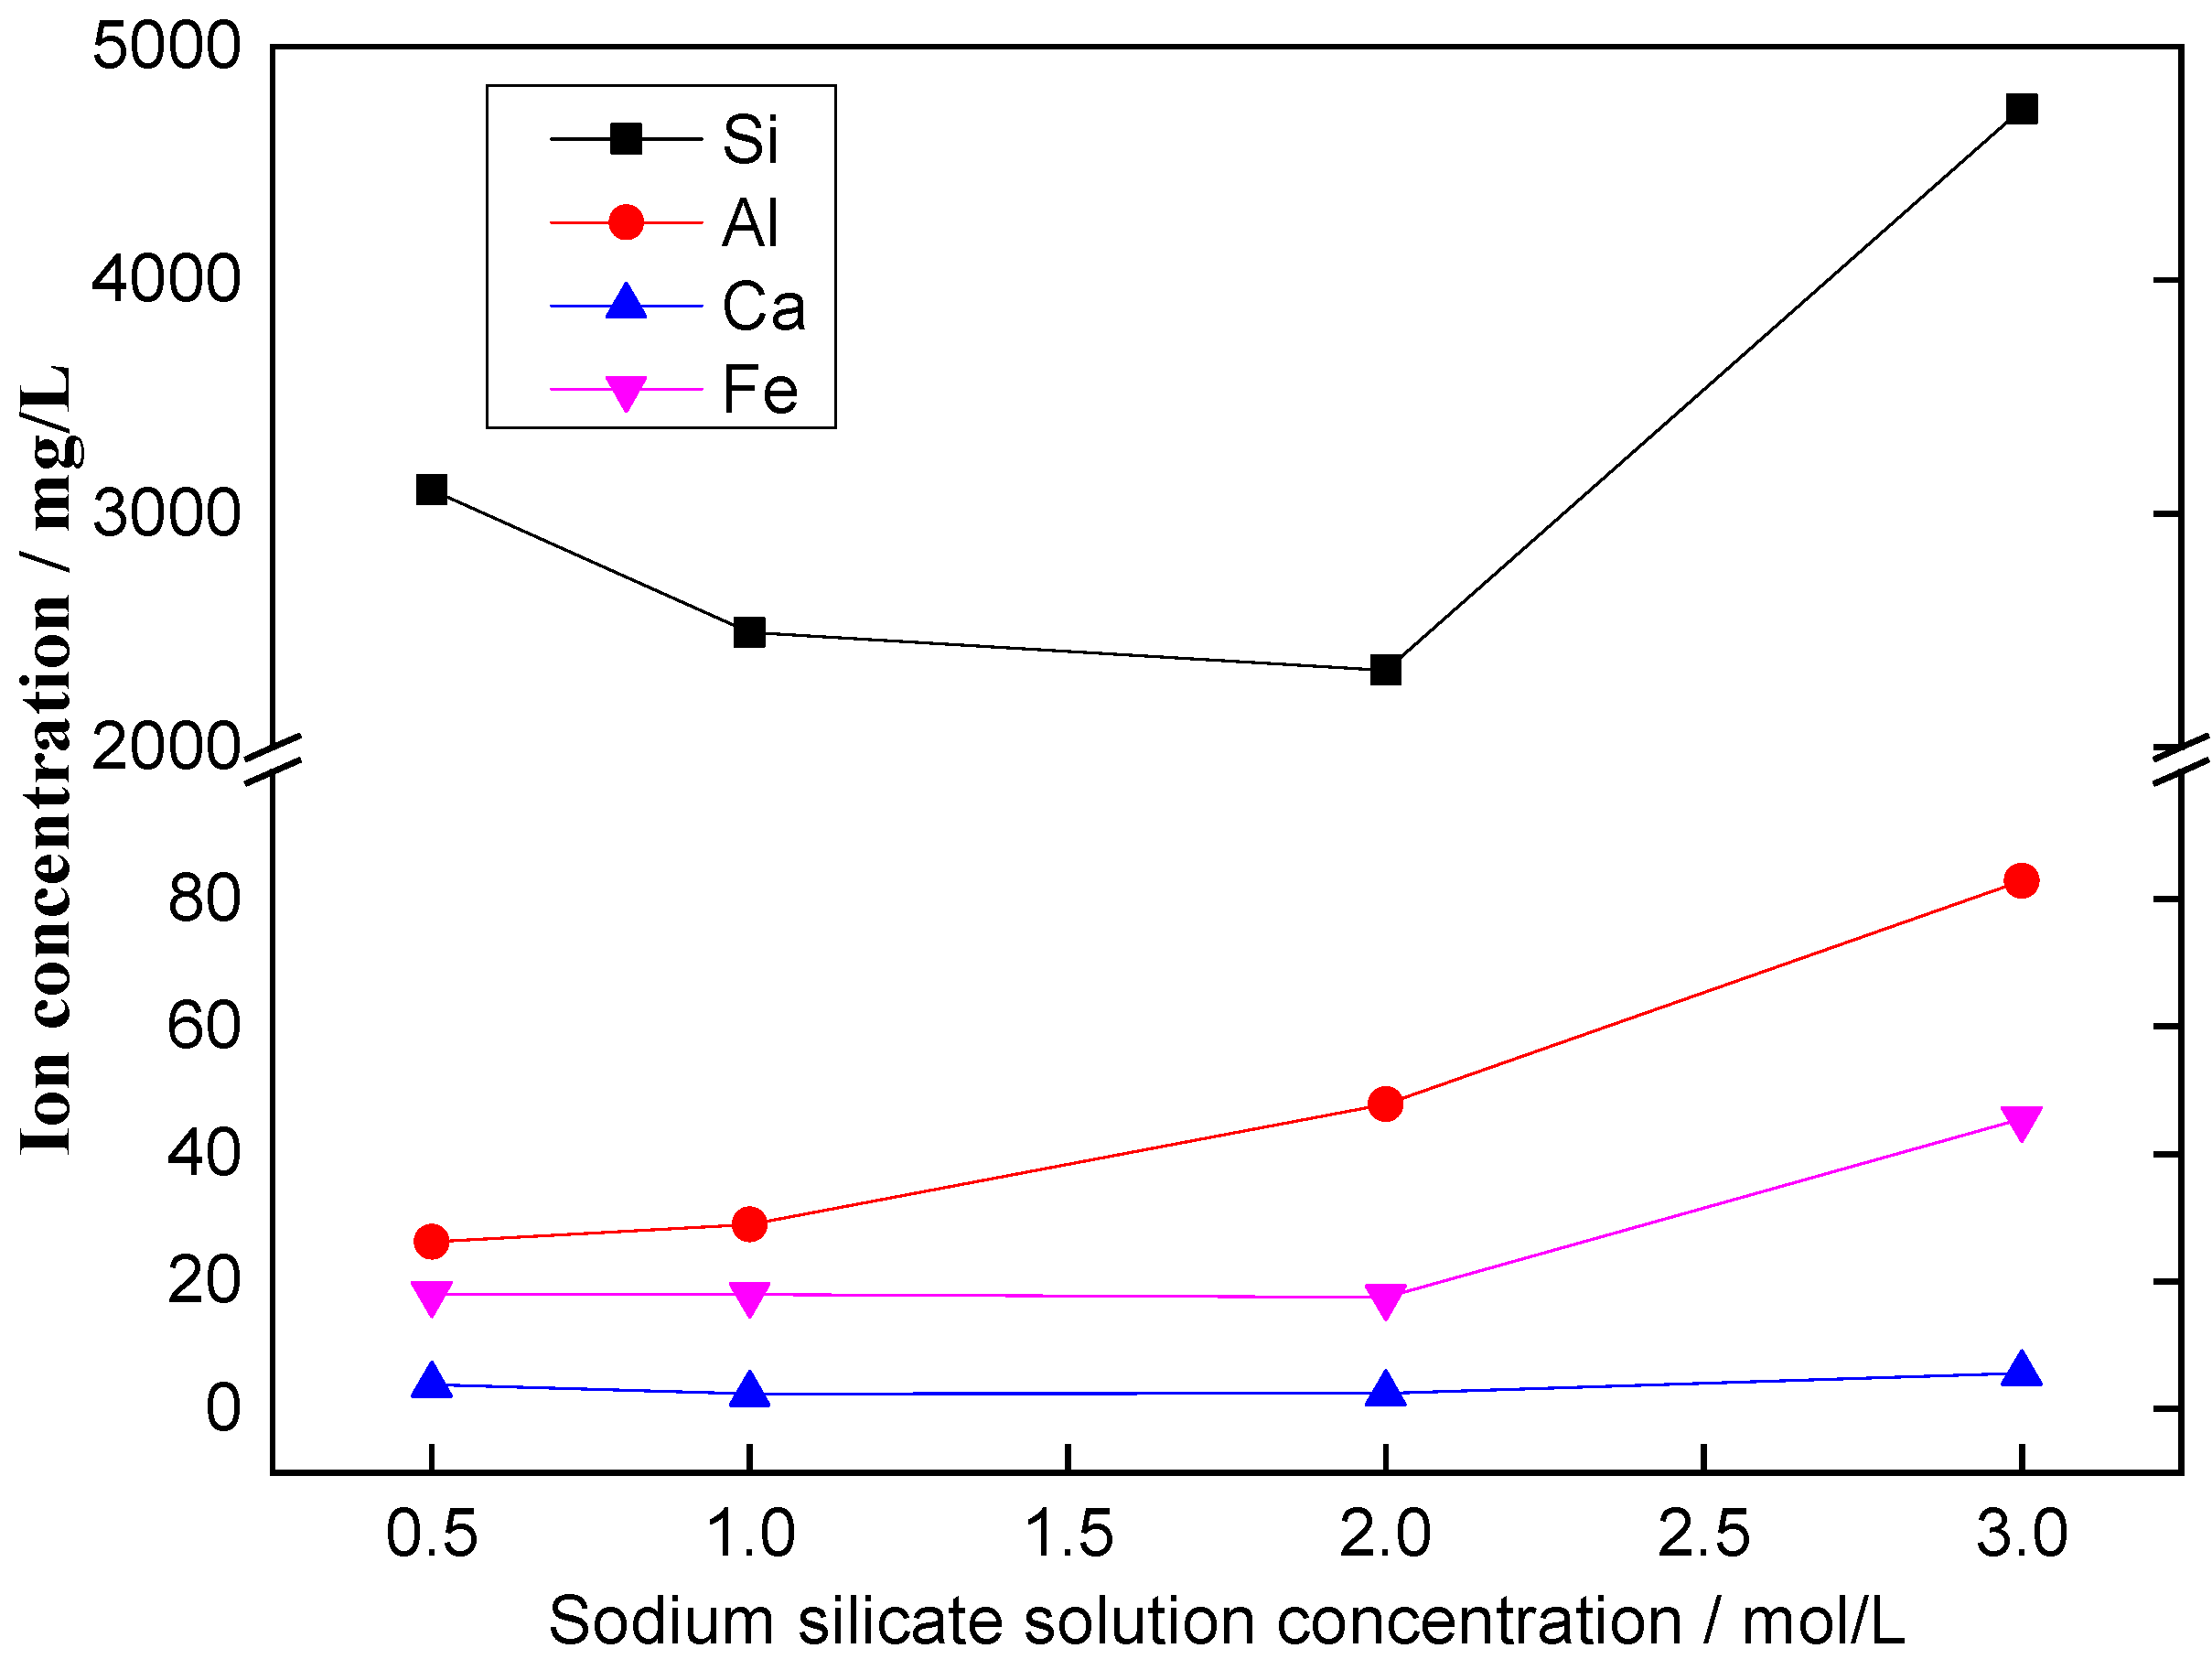
The effect of sodium silicate solution concentration on the dissolution rate of Si, Al, Ca and Fe is shown in Figure 2. Upon increasing the sodium silicate solution concentration, the dissolved concentration of Al, Ca, and Fe gradually increased, which indicated that highly concentrated sodium silicate solutions better promoted the dissolution of the glassy phase. The concentration of Si ions decreased first and then increased upon increasing the sodium silicate solution concentration because of the soluble Si ions from the activator solution. The decrease in the Si ions concentration indicates that the hydration process of CNS occurred in the activator solution. However, the relative amount of dissolved iron ions was small, which means that the crystalline phase is relatively stable and cannot be involved in the hydration reaction.
3.1.1. XRD
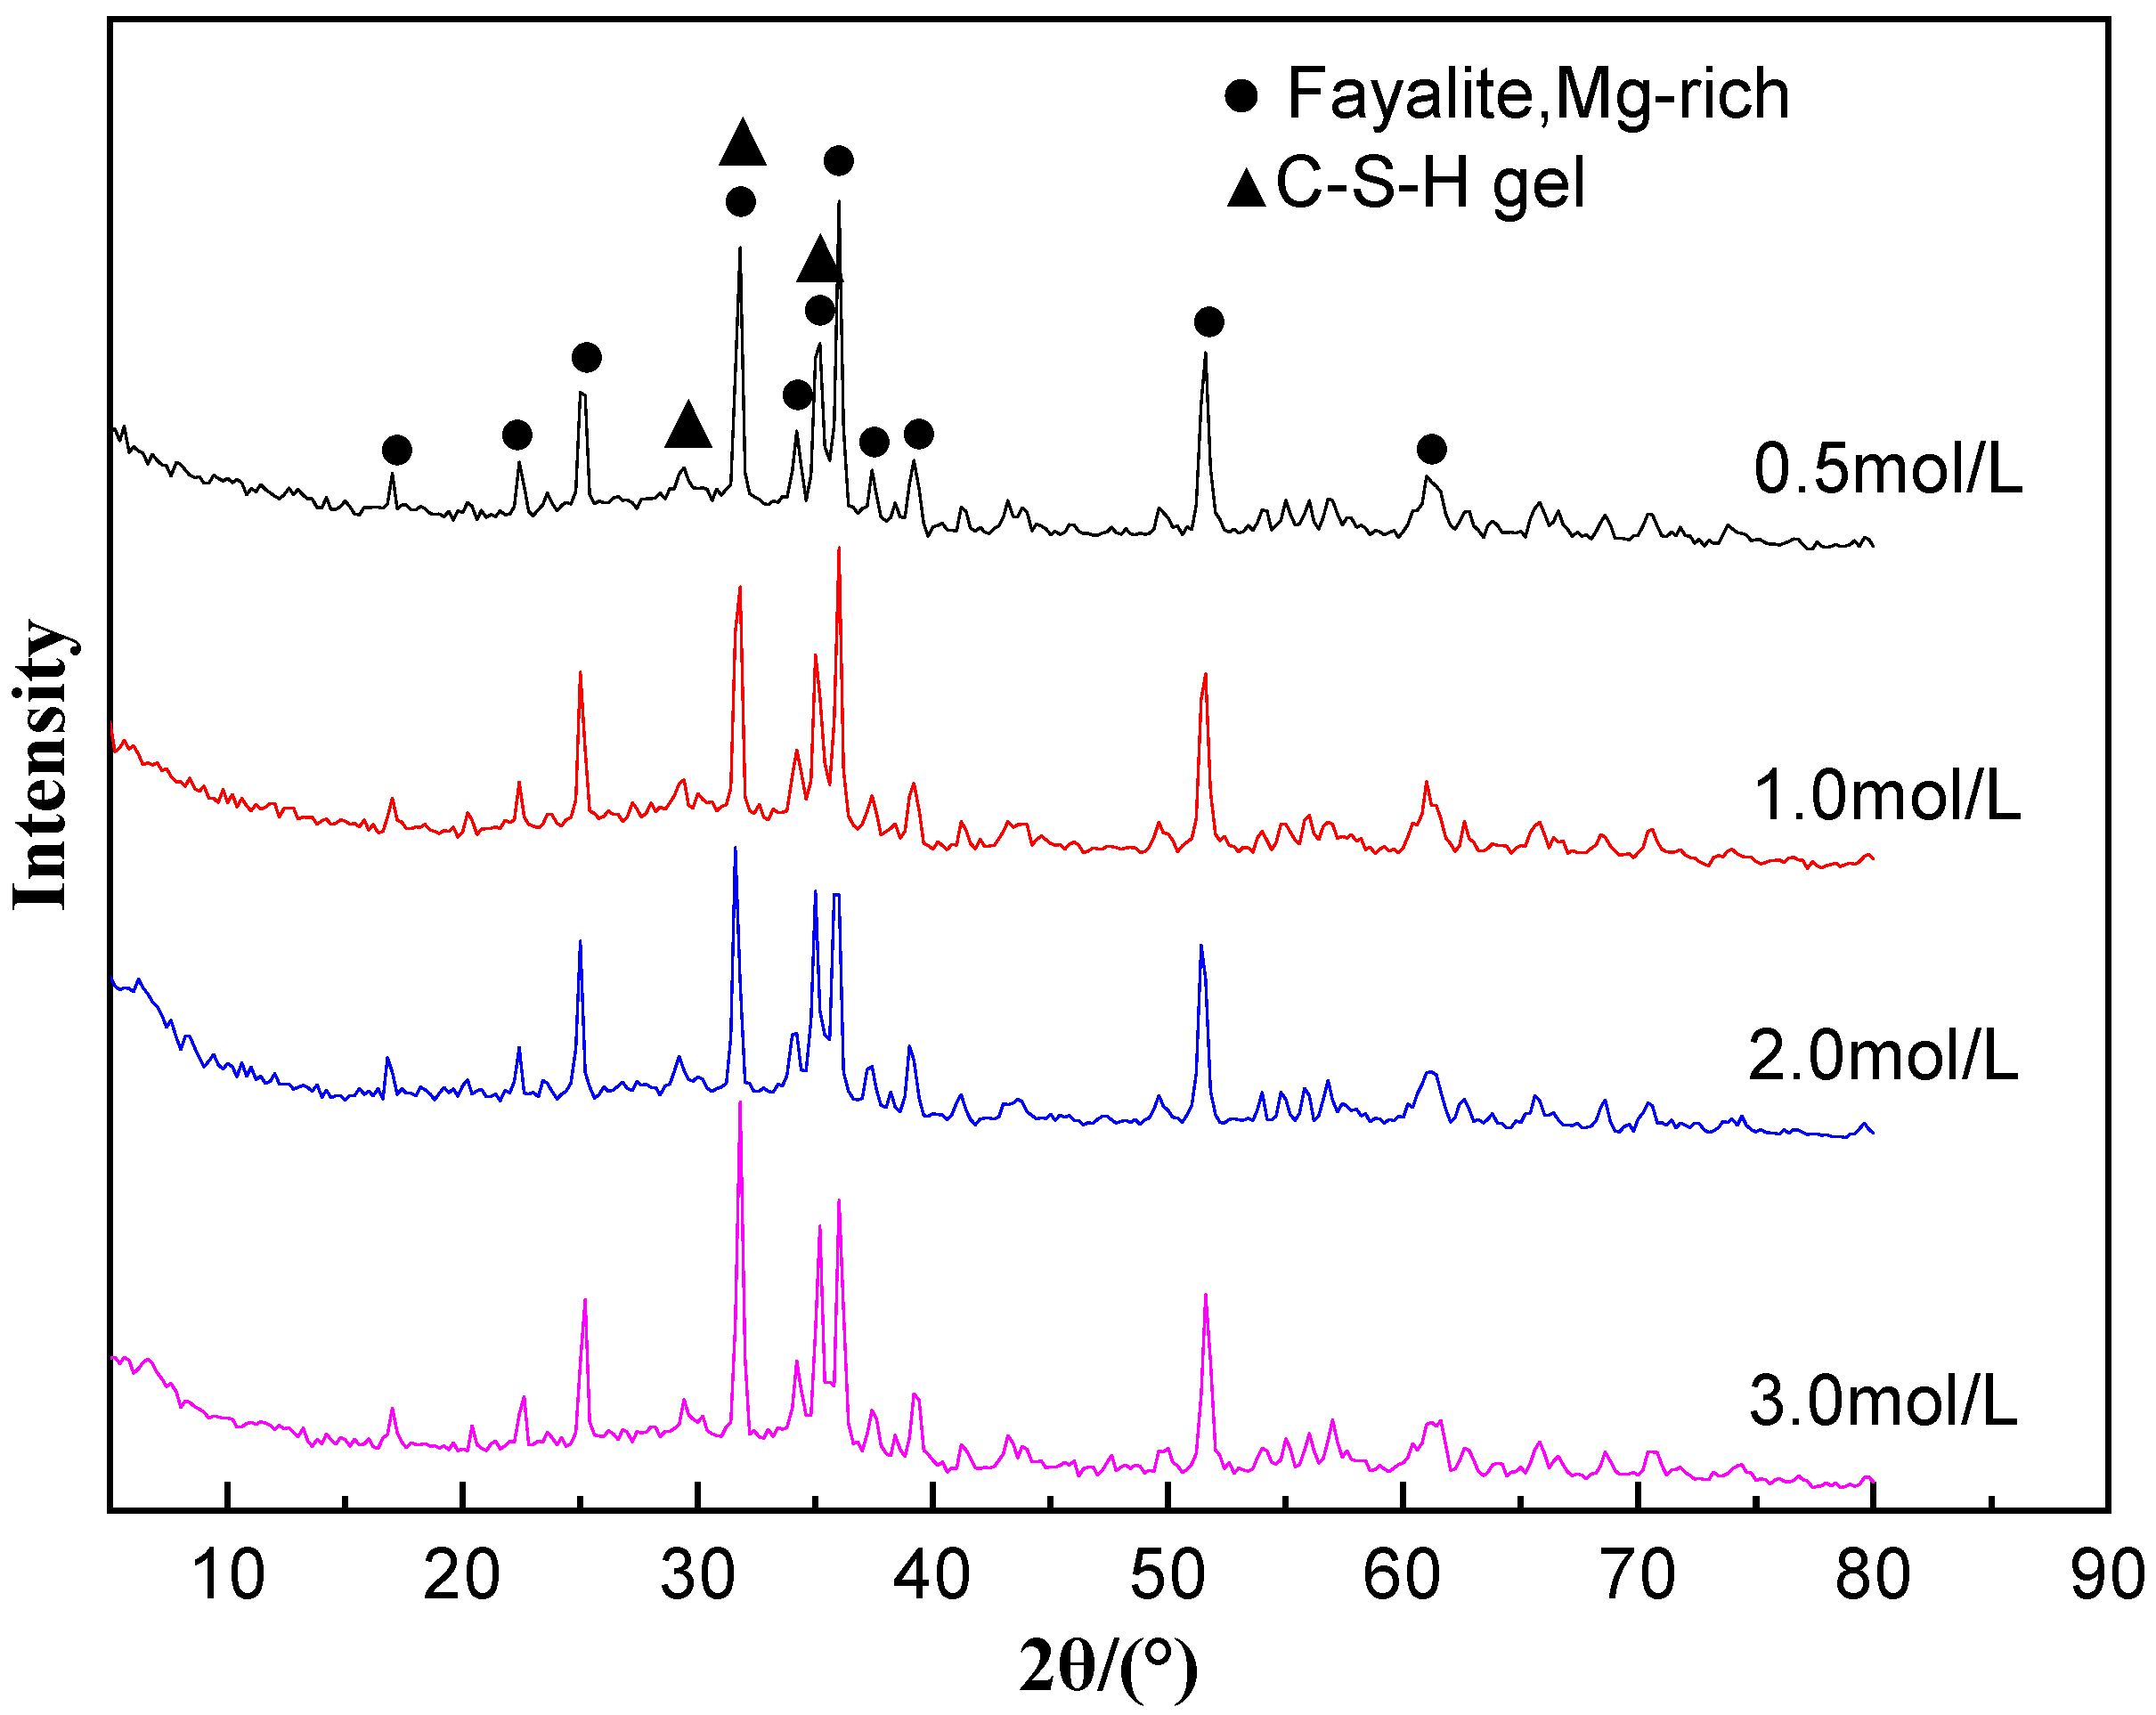
Figure 3 shows the XRD results of CNS dissolved by different concentrations of sodium silicate solutions. The diffraction peaks of two phases were found in the XRD pattern, namely, Mg-rich fayalite ((Fe, Mg)2SiO4) and C-S-H gels. As the concentration of sodium silicate solution gradually increased, the intensity of the diffraction peak of C-S-H gels gradually increased. The reason is that the concentration of Si and Ca ions dissolved in the glassy phase increases with the increase in sodium silicate solution concentration; thus, more C-S-H gels were formed.
3.1.2. FT-IR
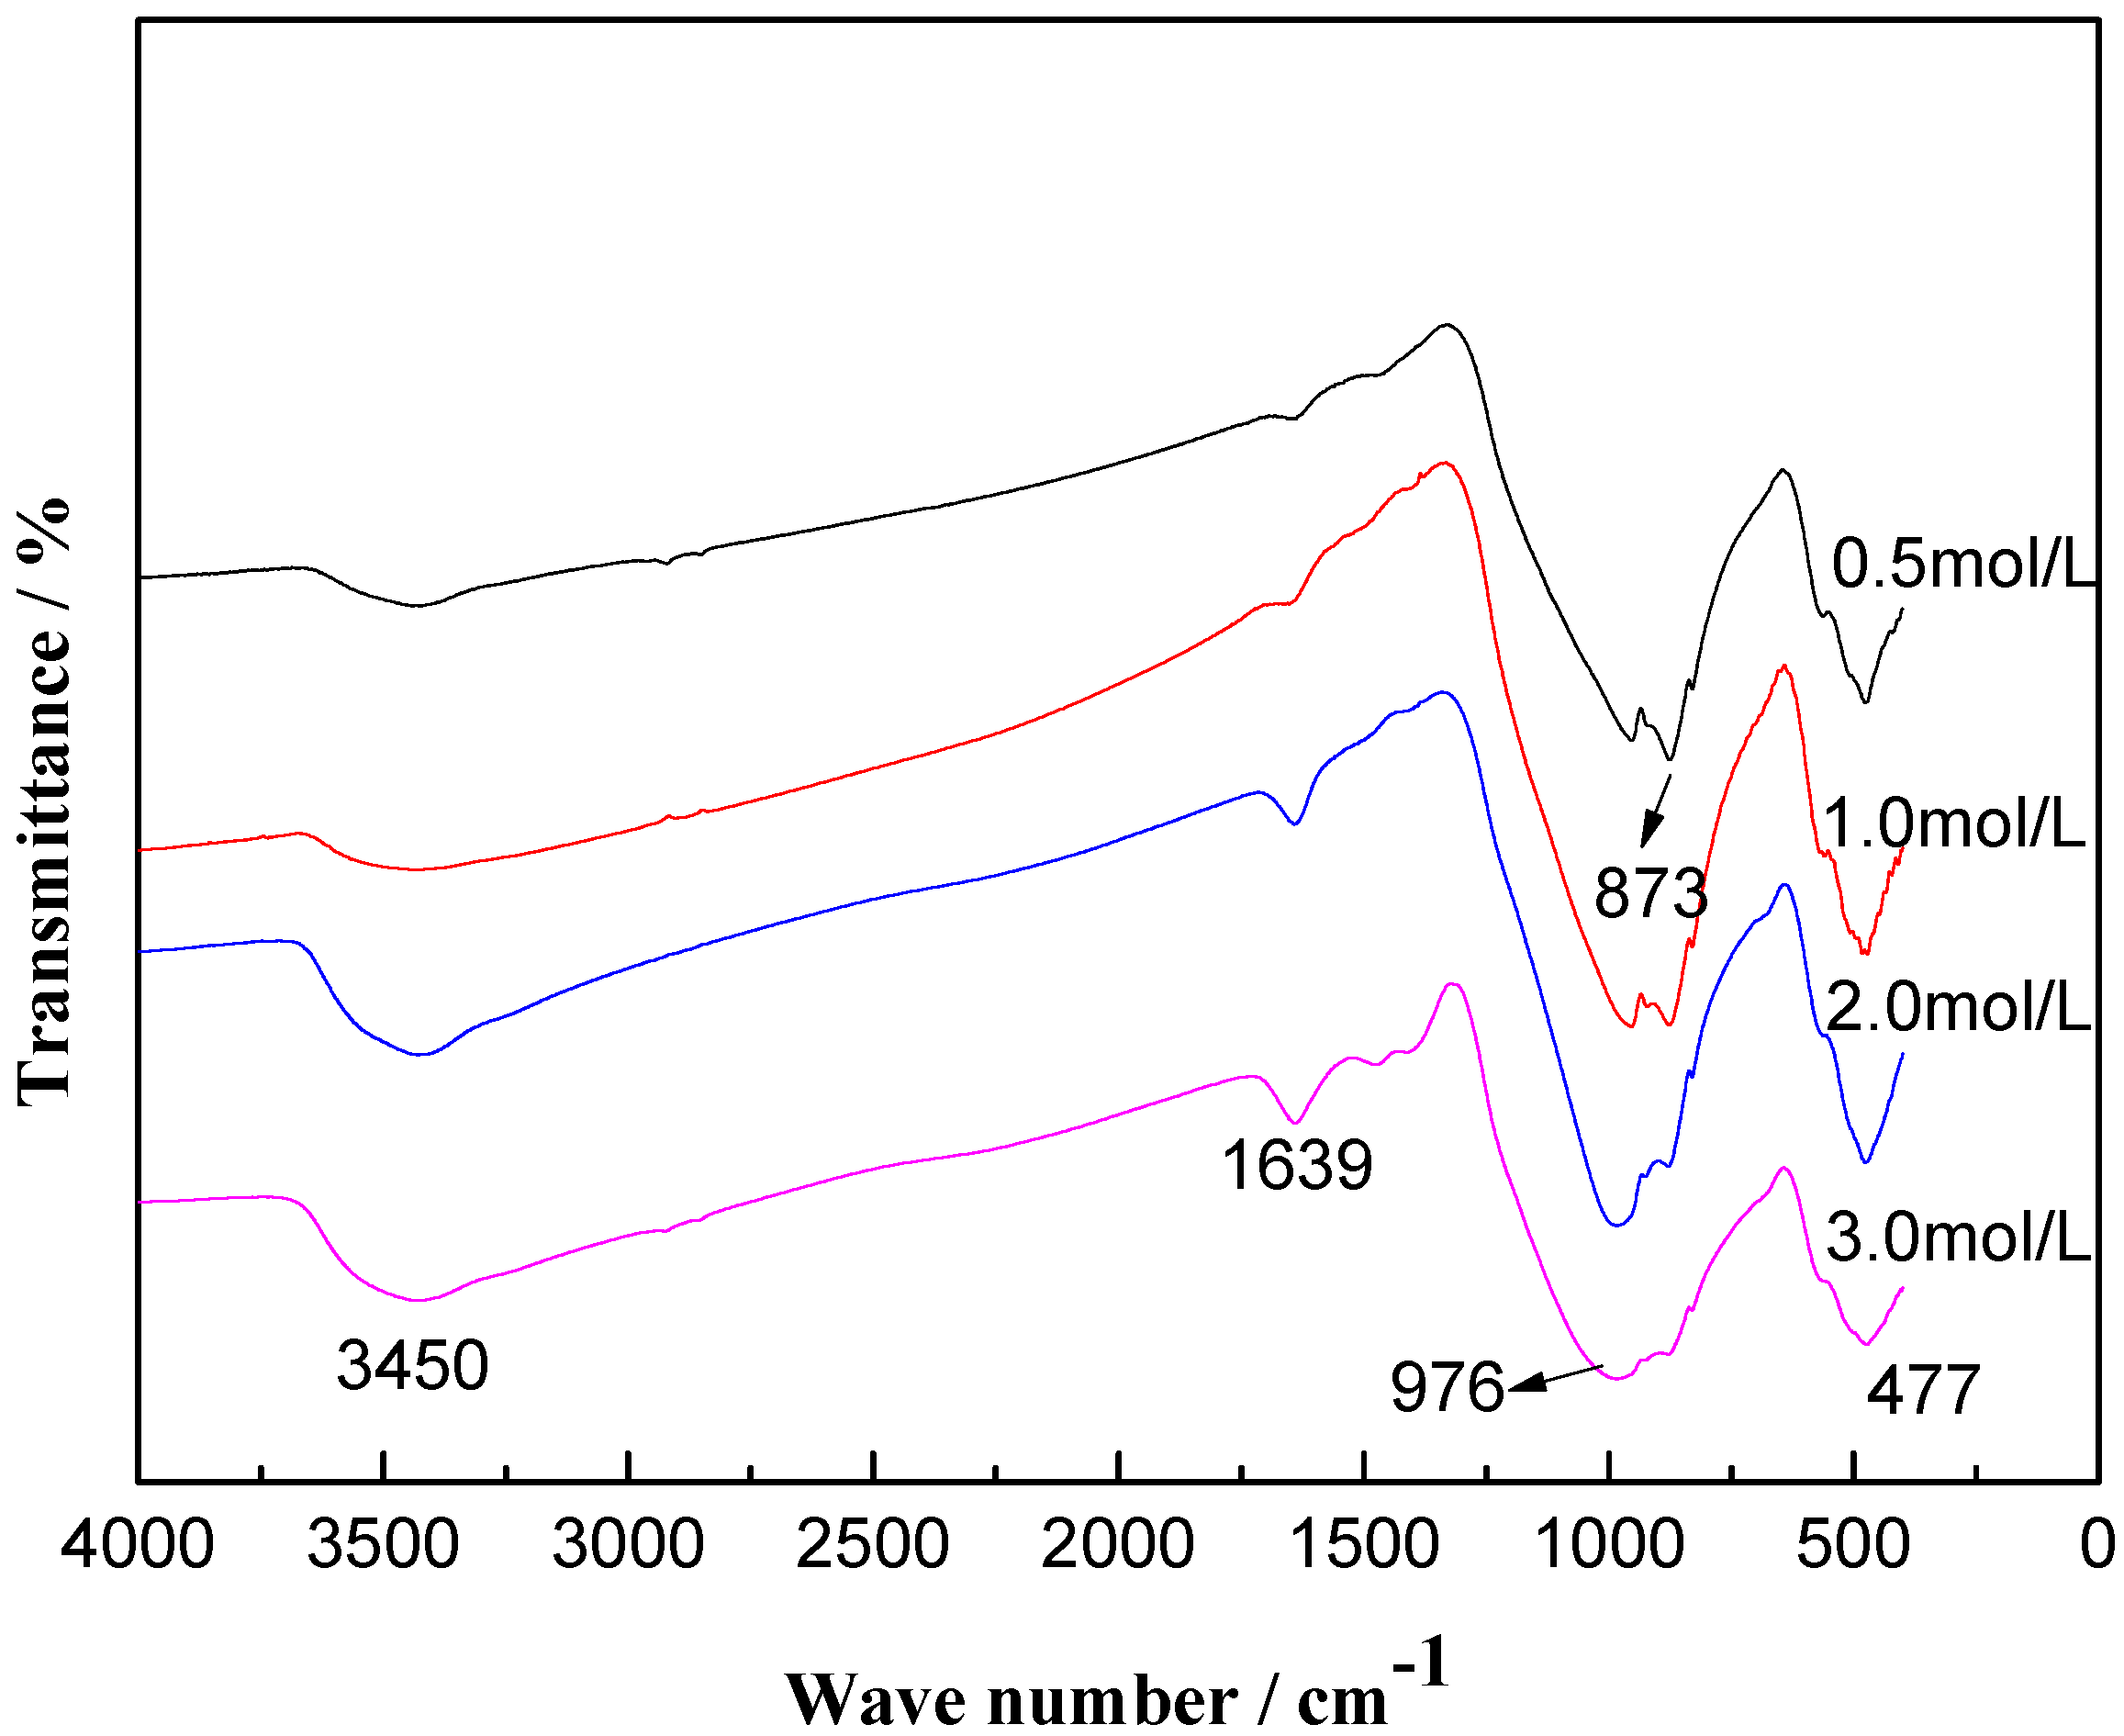
Figure 4 shows the FT-IR spectra of CNS dissolved by different concentrations of sodium silicate solutions, which contain five absorption bands. Among them, the peaks at 3450 cm−1 and 1639 cm−1 are the stretching and bending vibrations of the –OH groups [13,14]. The peak at 976 cm−1 is the stretching vibration of the Si-O group in C-S-H [15,16]. The peak at 873 cm−1 is the asymmetrical stretching vibration of Al-O [17]. The peak at 477 cm−1 represents the bending vibration of Si-O-Si [18]. Figure 4 clearly shows that upon increasing the concentration of sodium silicate solution, the intensity of absorption bands at 3450 cm−1, 1639 cm−1, and 976 cm−1 gradually increased. It indicates that a high concentration of sodium silicate solution promoted the hydration of CNS, which generated more hydration products.
3.2. The Influence of Sodium Silicate Solution Modulus
The modulus of sodium silicate solution has a great influence on the experimental results [19]. The following section explores the effect of the sodium silicate solution modulus on the alkali-activated CNS material. Specific experimental parameters are listed in Table 2.
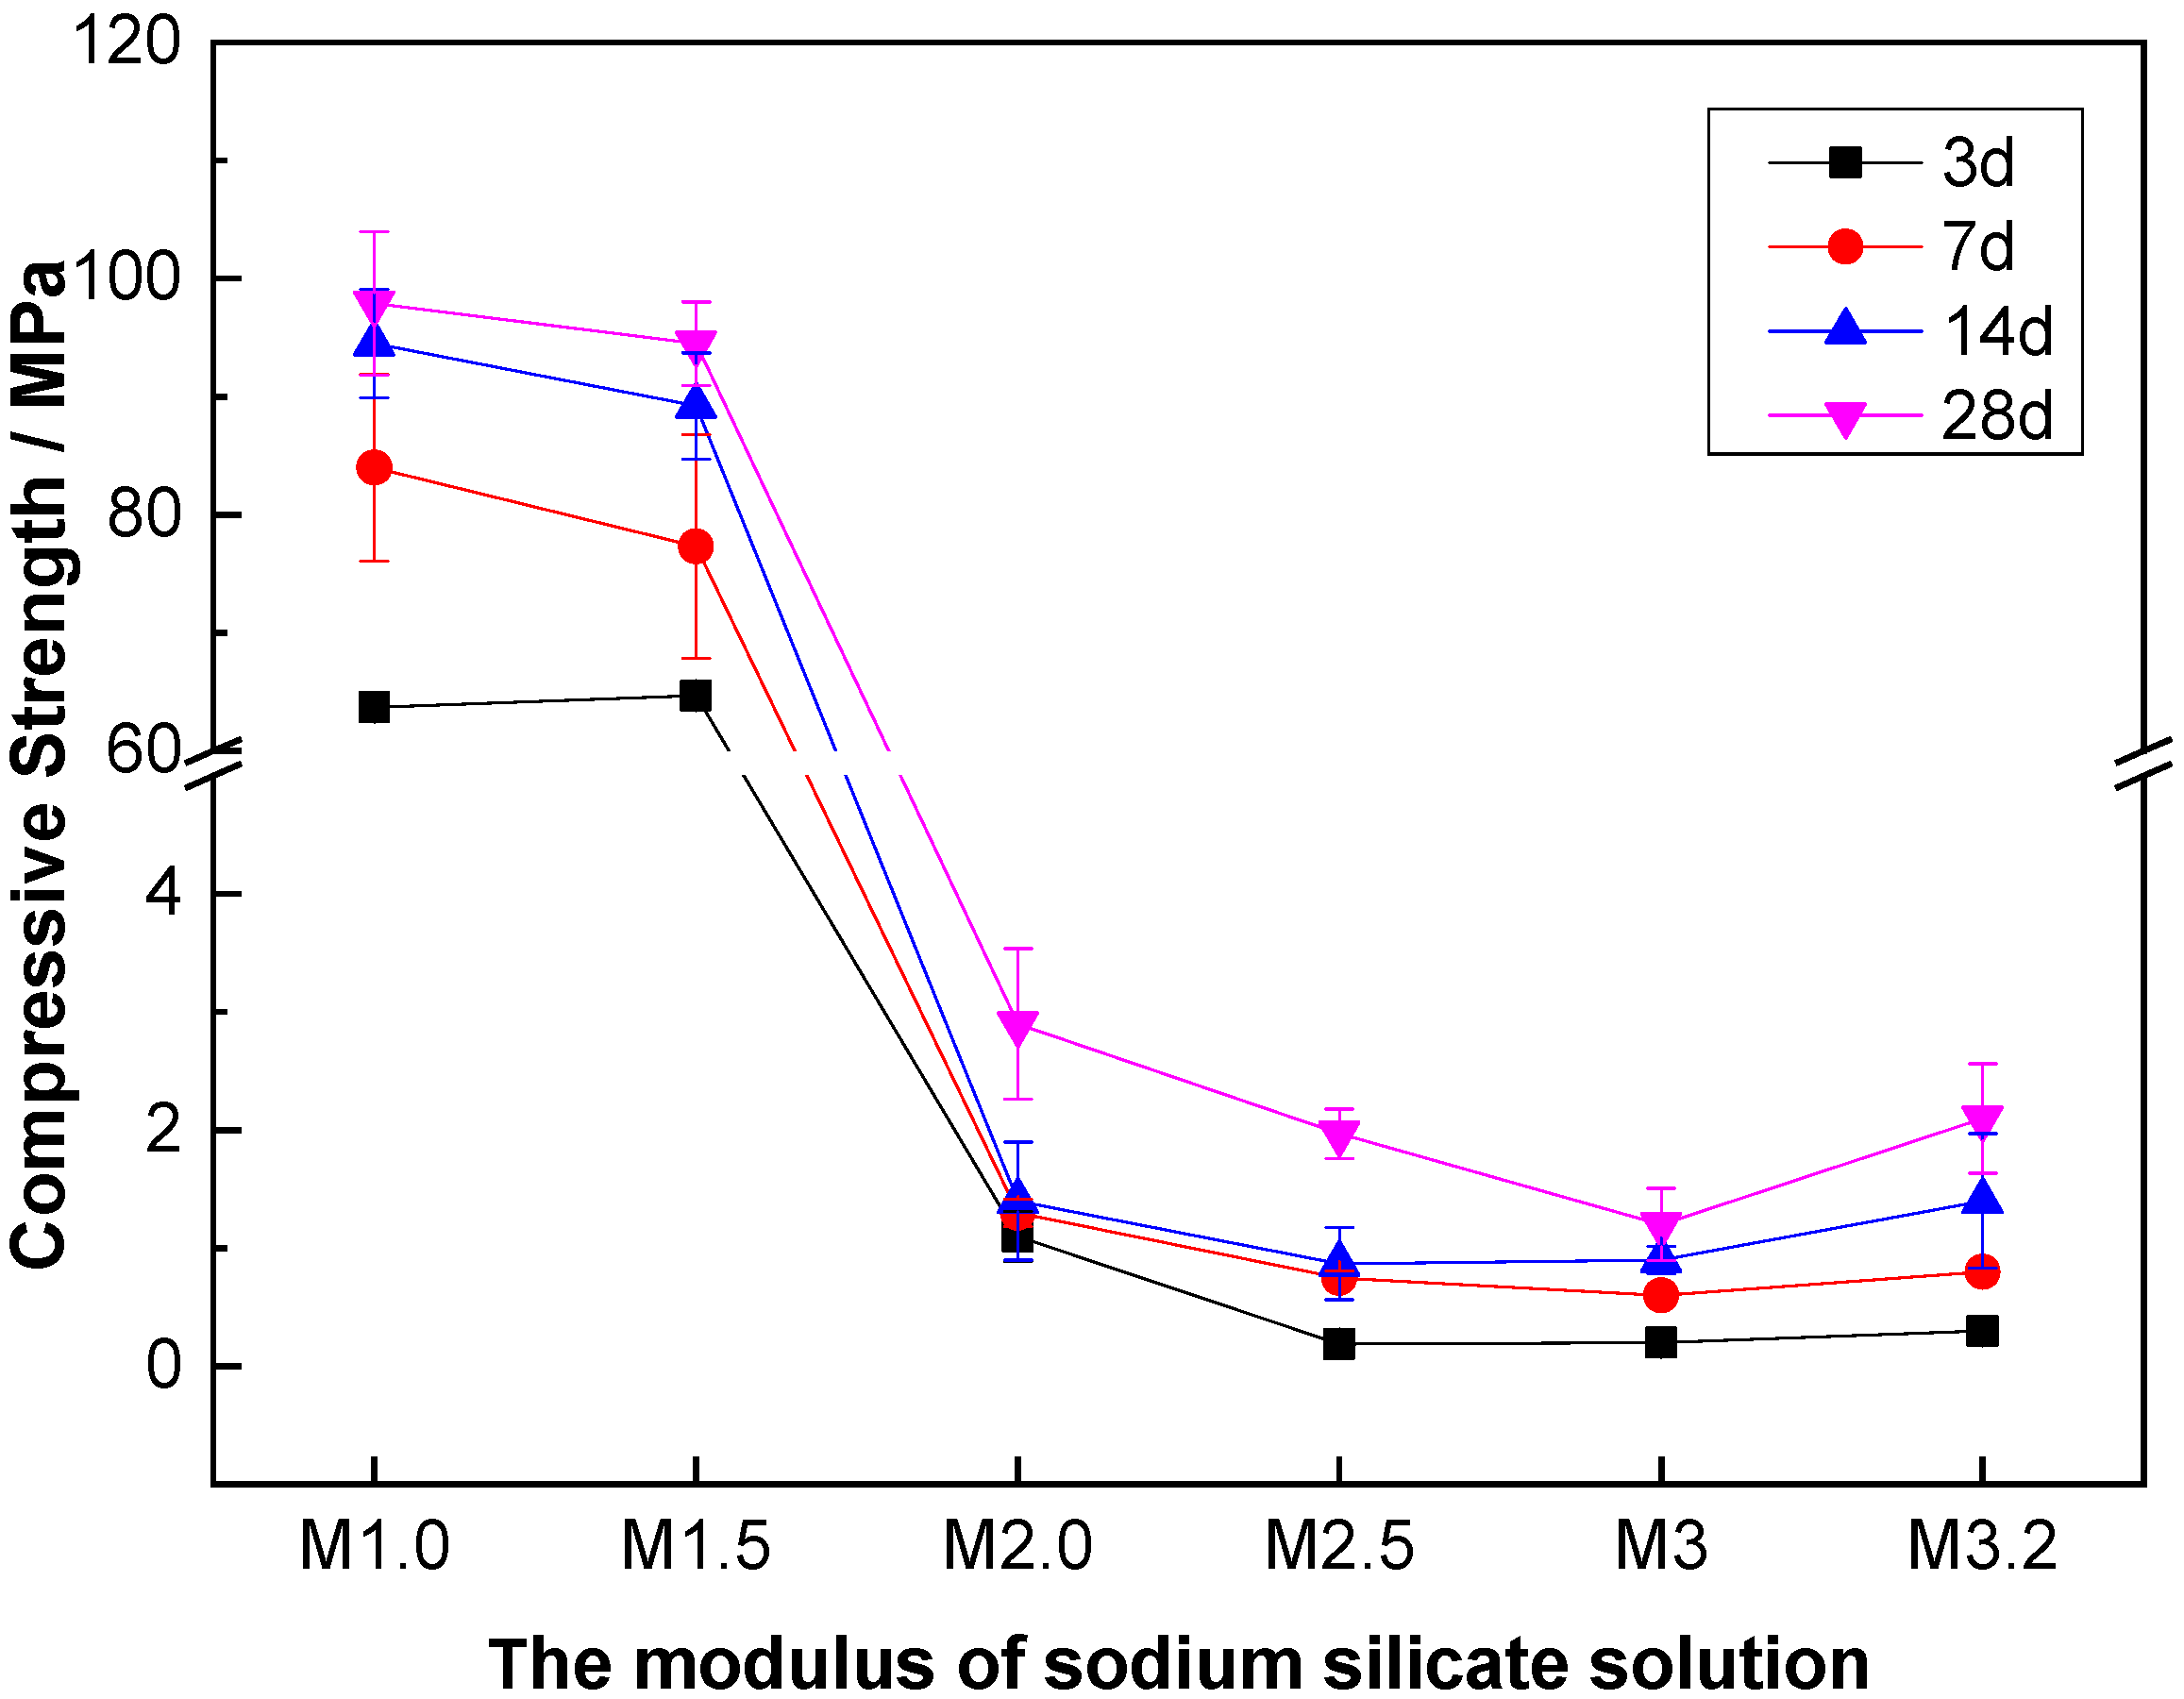
The influence of the sodium silicate solution modulus on the compressive strength of the alkali-activated CNS material is shown in Figure 5. When the modulus of sodium silicate solution was 1.0, the compressive strength of the alkali-activated CNS material was higher, and its 28-day compressive strength reached nearly 100 MPa. Upon increasing the modulus of sodium silicate solution, the compressive strength of the cementitious material decreased gradually. When the modulus of sodium silicate solution increased from 1.5 to 2.0, the compressive strength of the alkali-activated CNS material dropped sharply. Upon increasing the modulus of sodium silicate solution, the alkalinity of the solution decreased gradually. The lower alkalinity of the activator solution weakened the depolymerization reaction of the glassy phase, resulting in a slower dissolution rate of the active Si, Al, and Ca, thus reducing the compressive strength of the system.
3.2.1. XRD
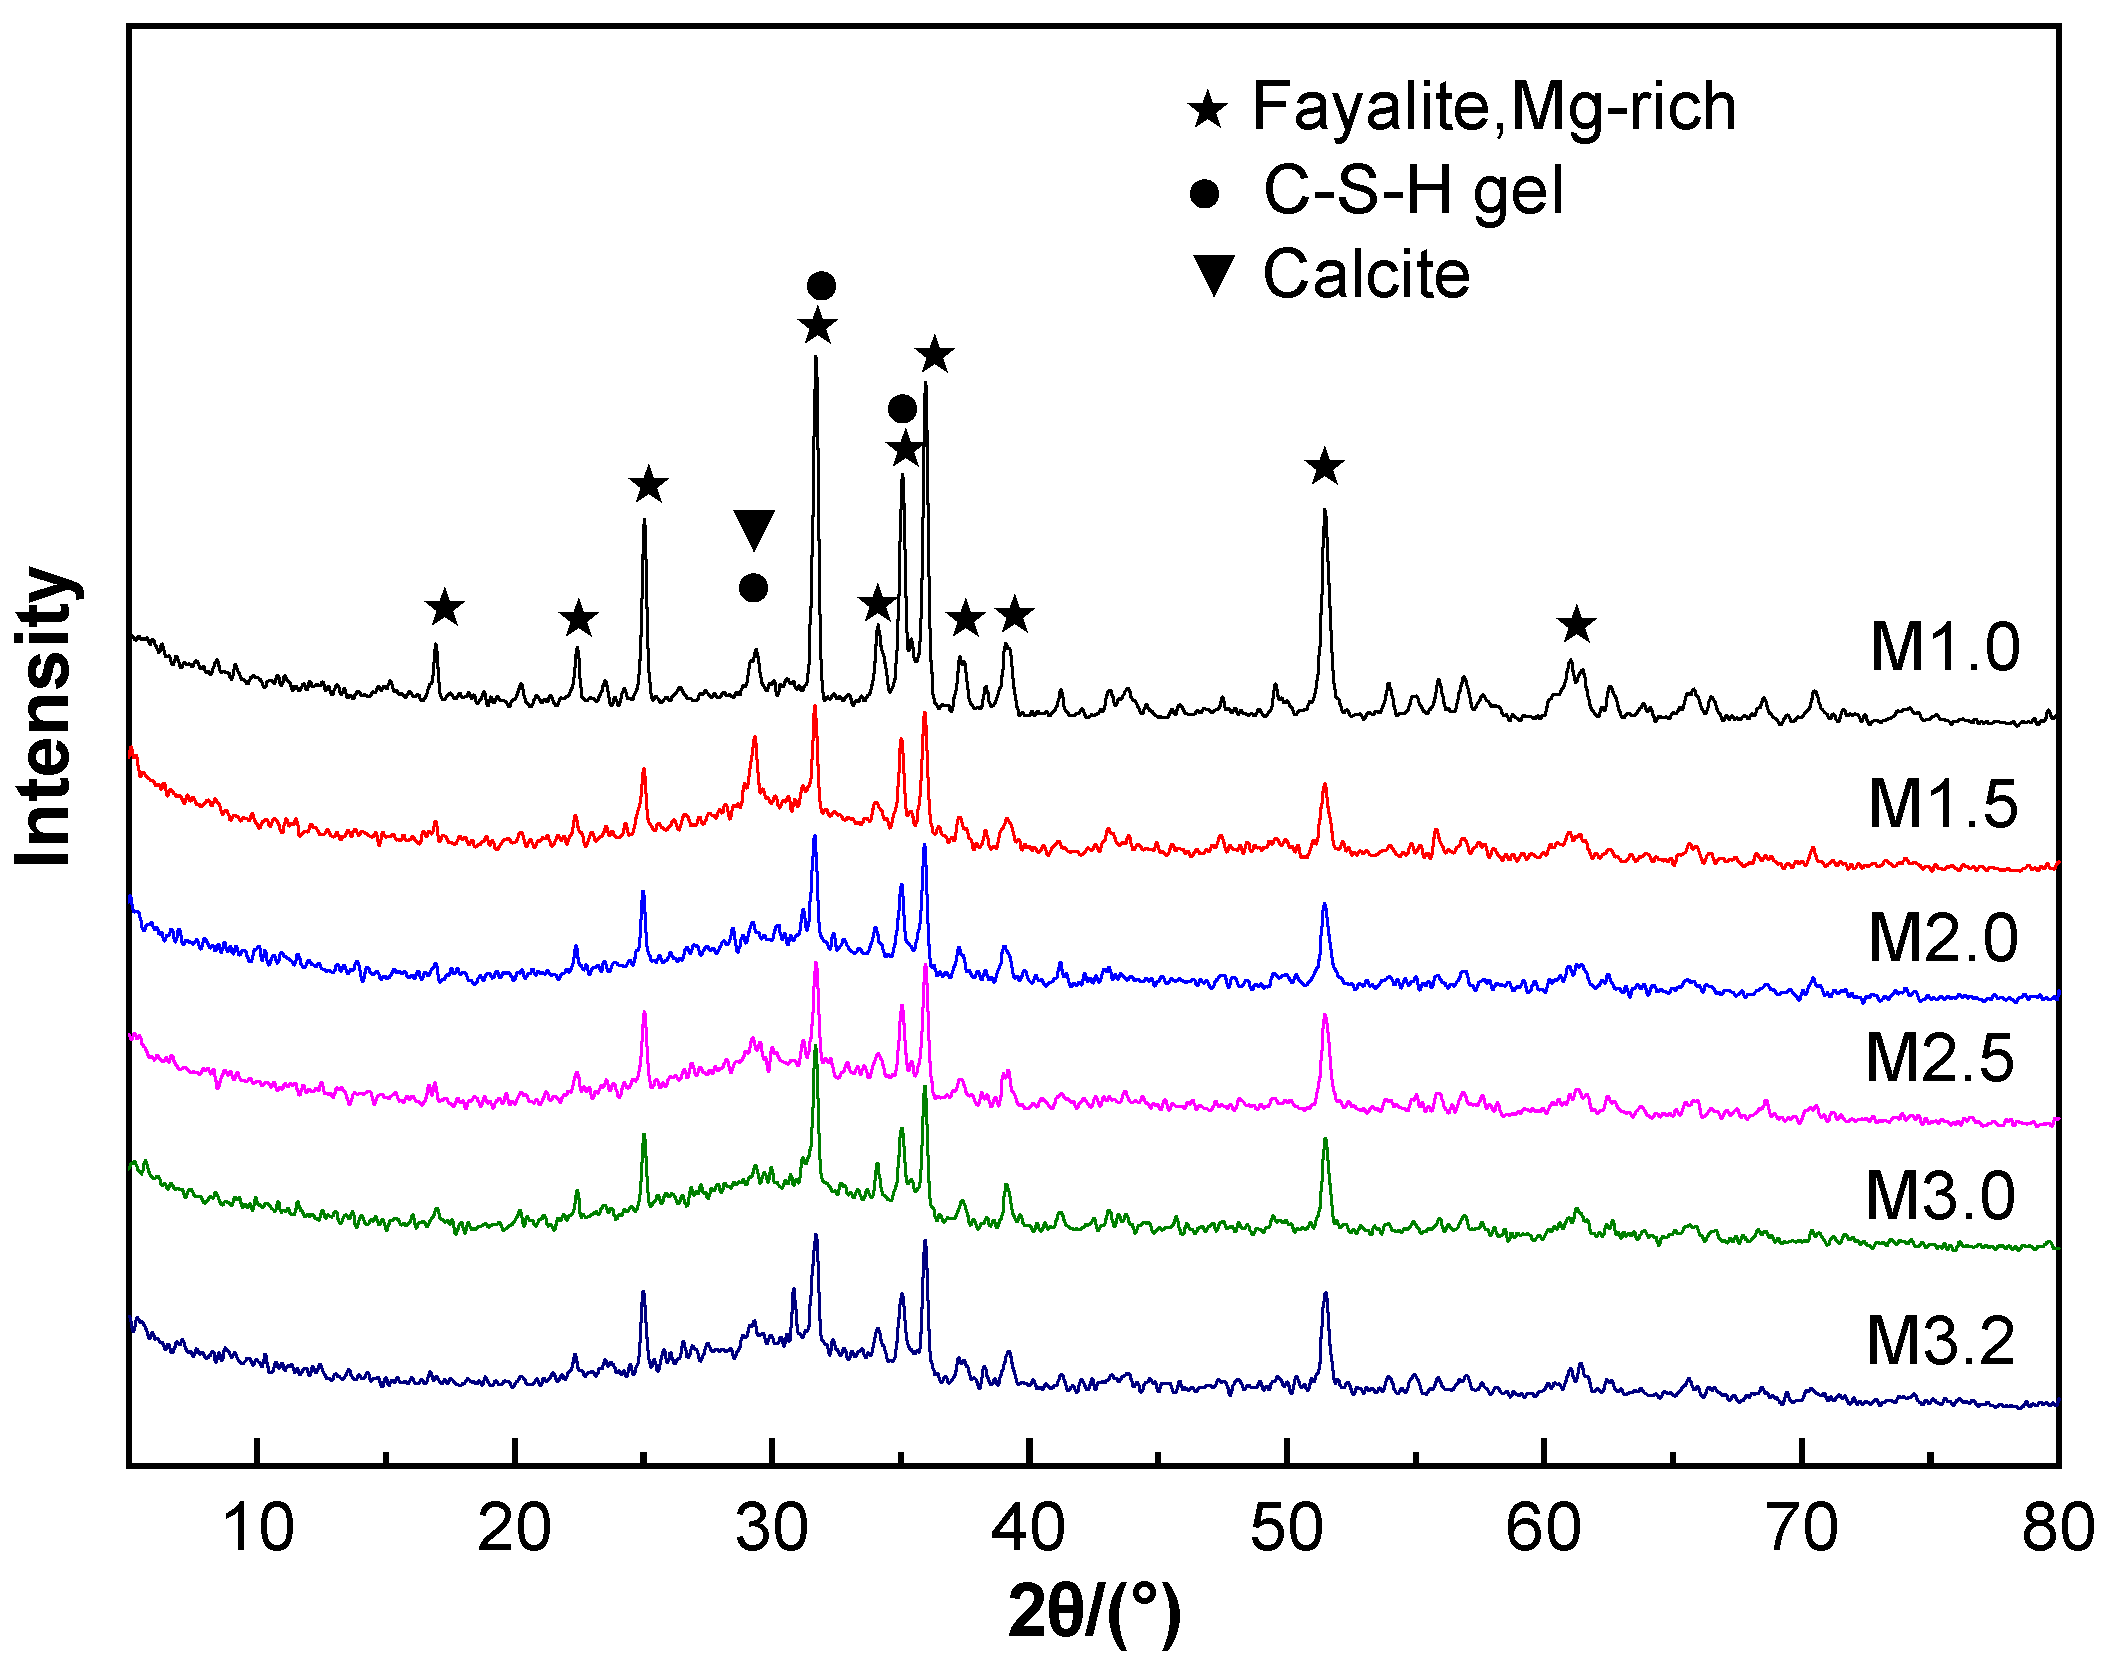
Figure 6 shows the XRD patterns of alkali-activated CNS material with different sodium silicate solution moduli after 28 days of hydration. The XRD patterns of the hydrated CNS cementitious materials contain three diffraction peaks, which correspond to Mg-rich fayalite, calcite, and C-S-H gels. Under the activation of sodium silicate, the glassy phase in the CNS depolymerized and dissolved the active Si, Al and Ca ions. Then, these active ions underwent a polycondensation reaction in the sodium silicate aqueous solution to form C-S-H gels that had a higher degree of polymerization. Furthermore, the hydration products were eventually partially carbonated by CO2 in the air to form calcite.
3.2.2. FT-IR
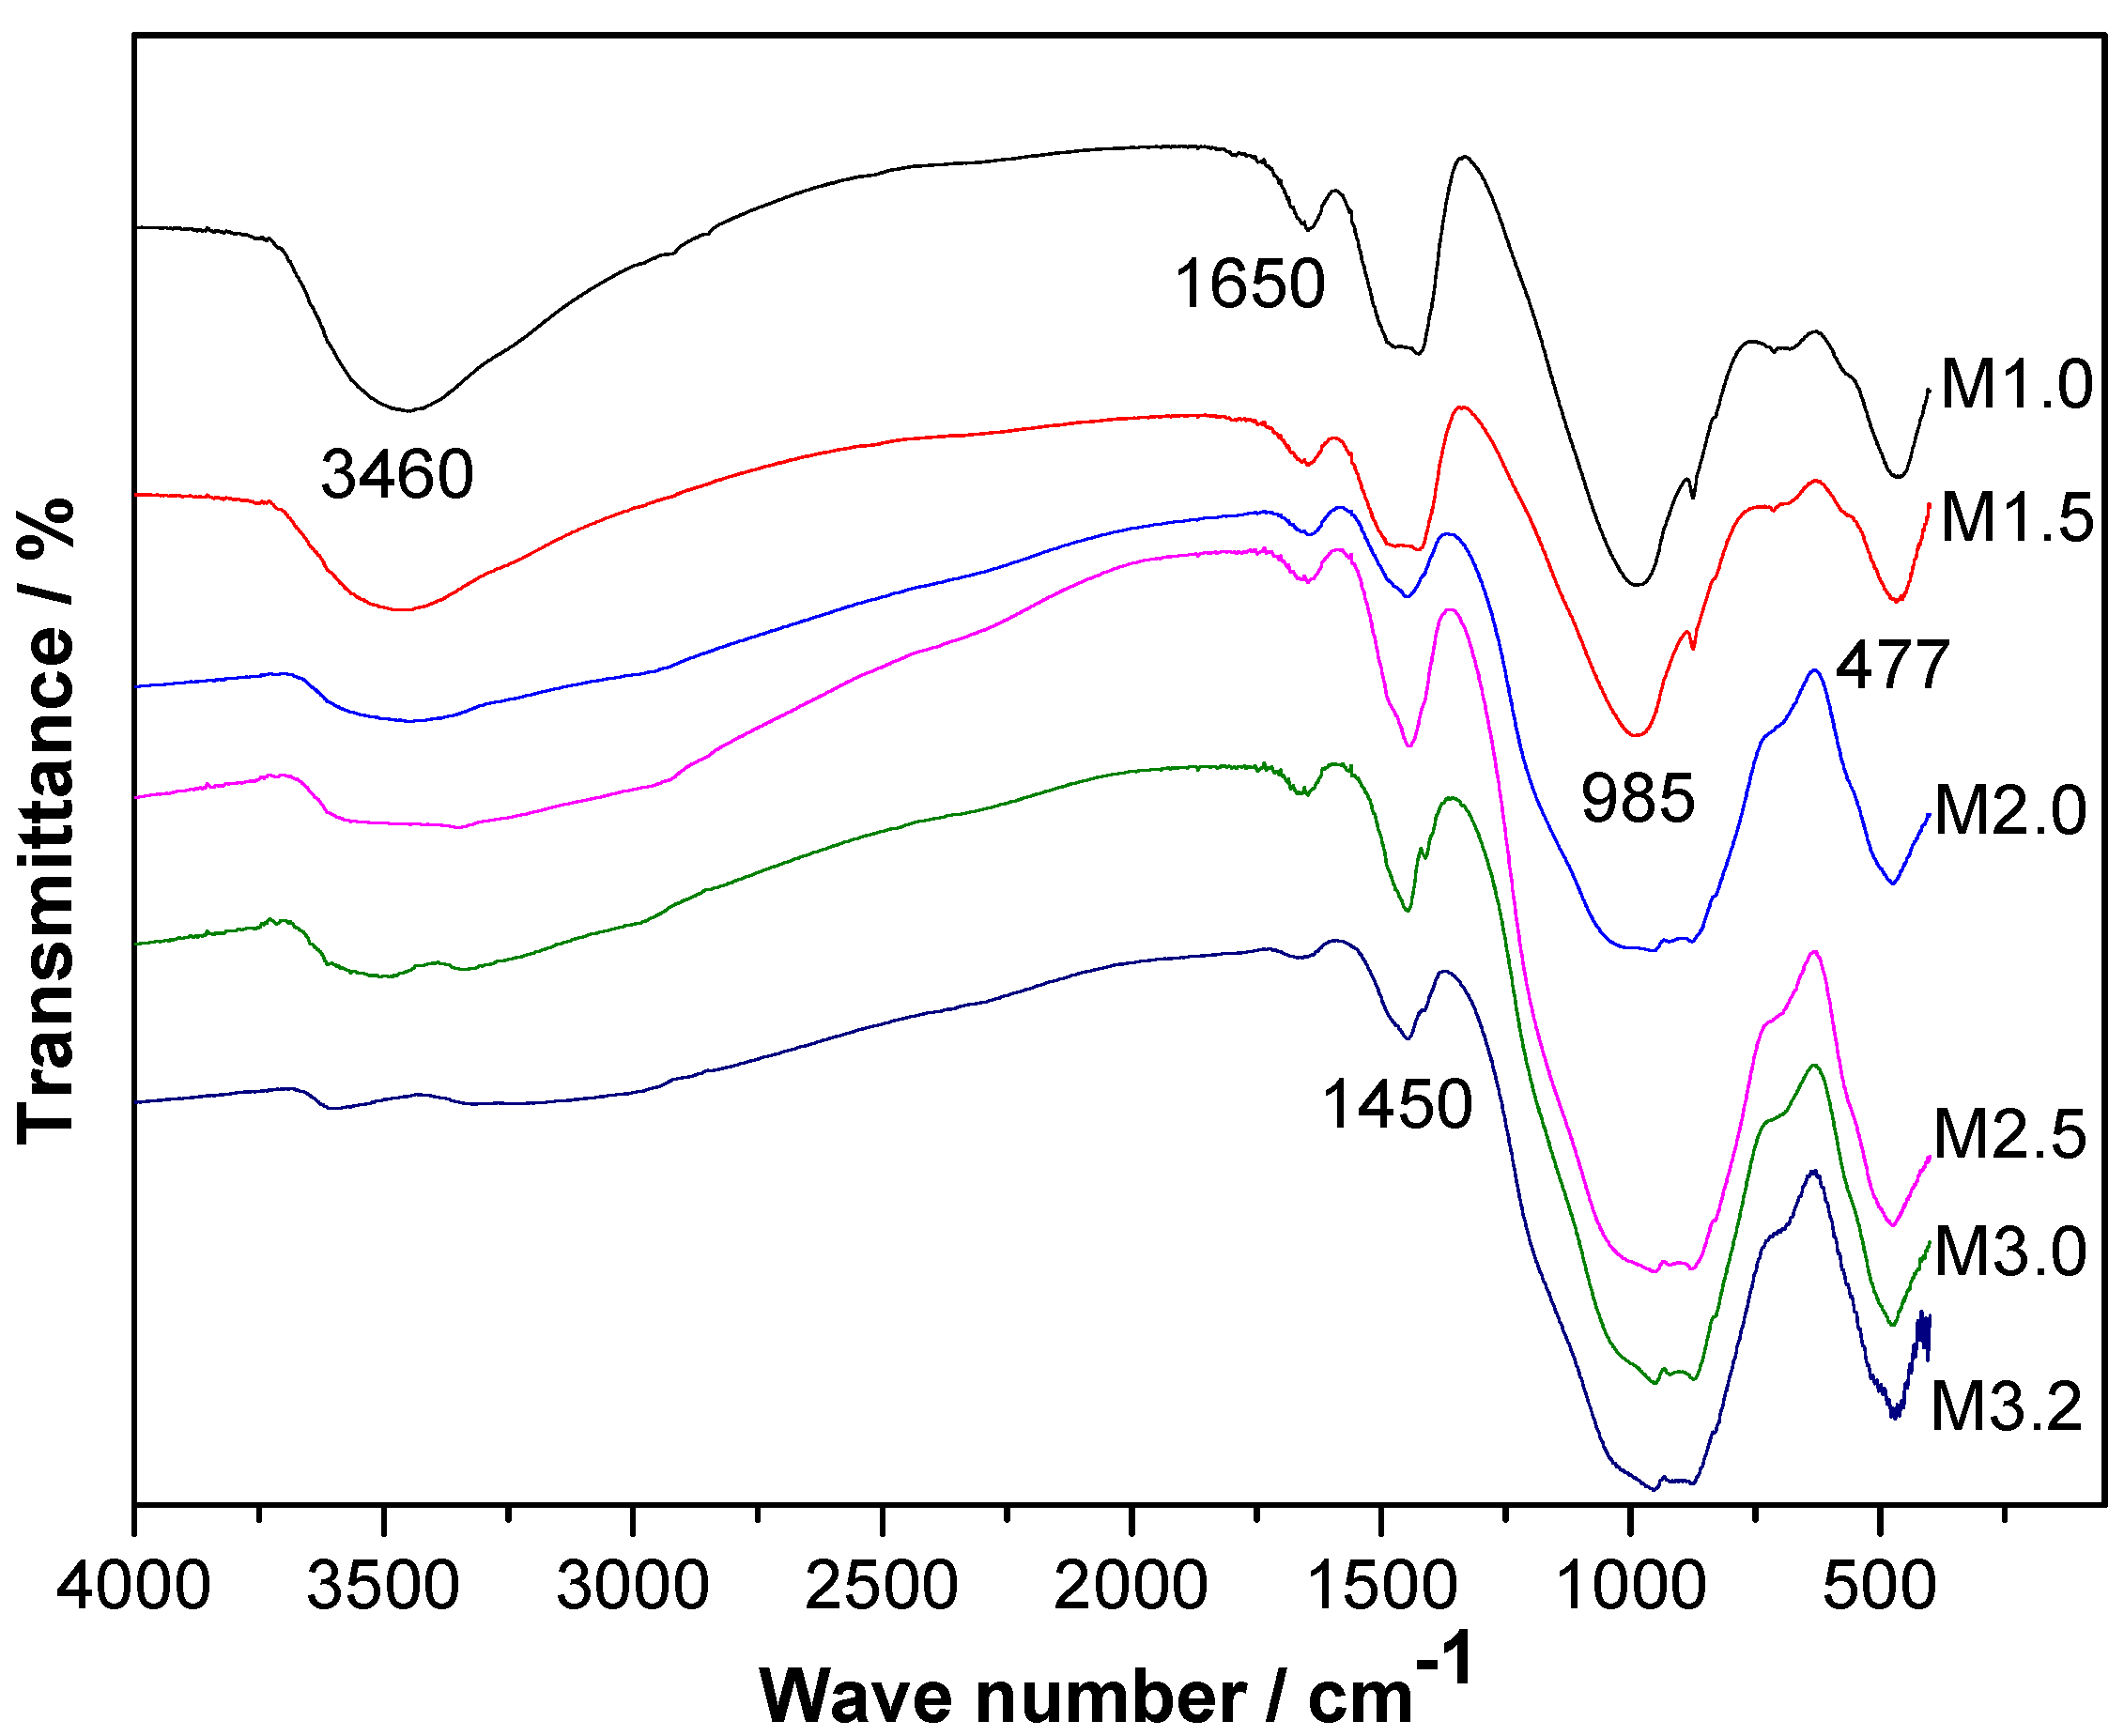
After 28 days of hydration, the FT-IR spectra of the alkali-activated CNS material with different sodium silicate solution moduli mainly included five absorption bands (3460 cm−1, 1650 cm−1, 1450 cm−1, 985 cm−1, and 477 cm−1), as shown in Figure 7. Among them, the absorption bands at 3460 cm−1 and 1650 cm−1 were the stretching and bending vibrations of the –OH group, respectively. The absorption band at 1450 cm−1 was attributed to the vibration of in calcite [20]. The peak near 985 cm−1 was related to the asymmetric stretching vibration of Si-O-T (T tetrahedral Si/Al) in C-(A)-S-H, and the peak near 477 cm−1 was related to the bending vibration of Si-O-Si. Comparing the intensity of each FT-IR peak in the six groups of experiments showed that the intensities of the three peaks at 3460 cm−1, 1650 cm−1, and 985 cm−1 were significantly different. Upon increasing the modulus of sodium silicate solution, the strength of the three infrared peaks gradually weakened, which indicated that the use of sodium silicate solution with a higher modulus was not conducive to the activation of CNS. This greatly weakened the development of hydration products and ultimately reduced the compressive strength of the composite cementitious materials.
3.2.3. SEM
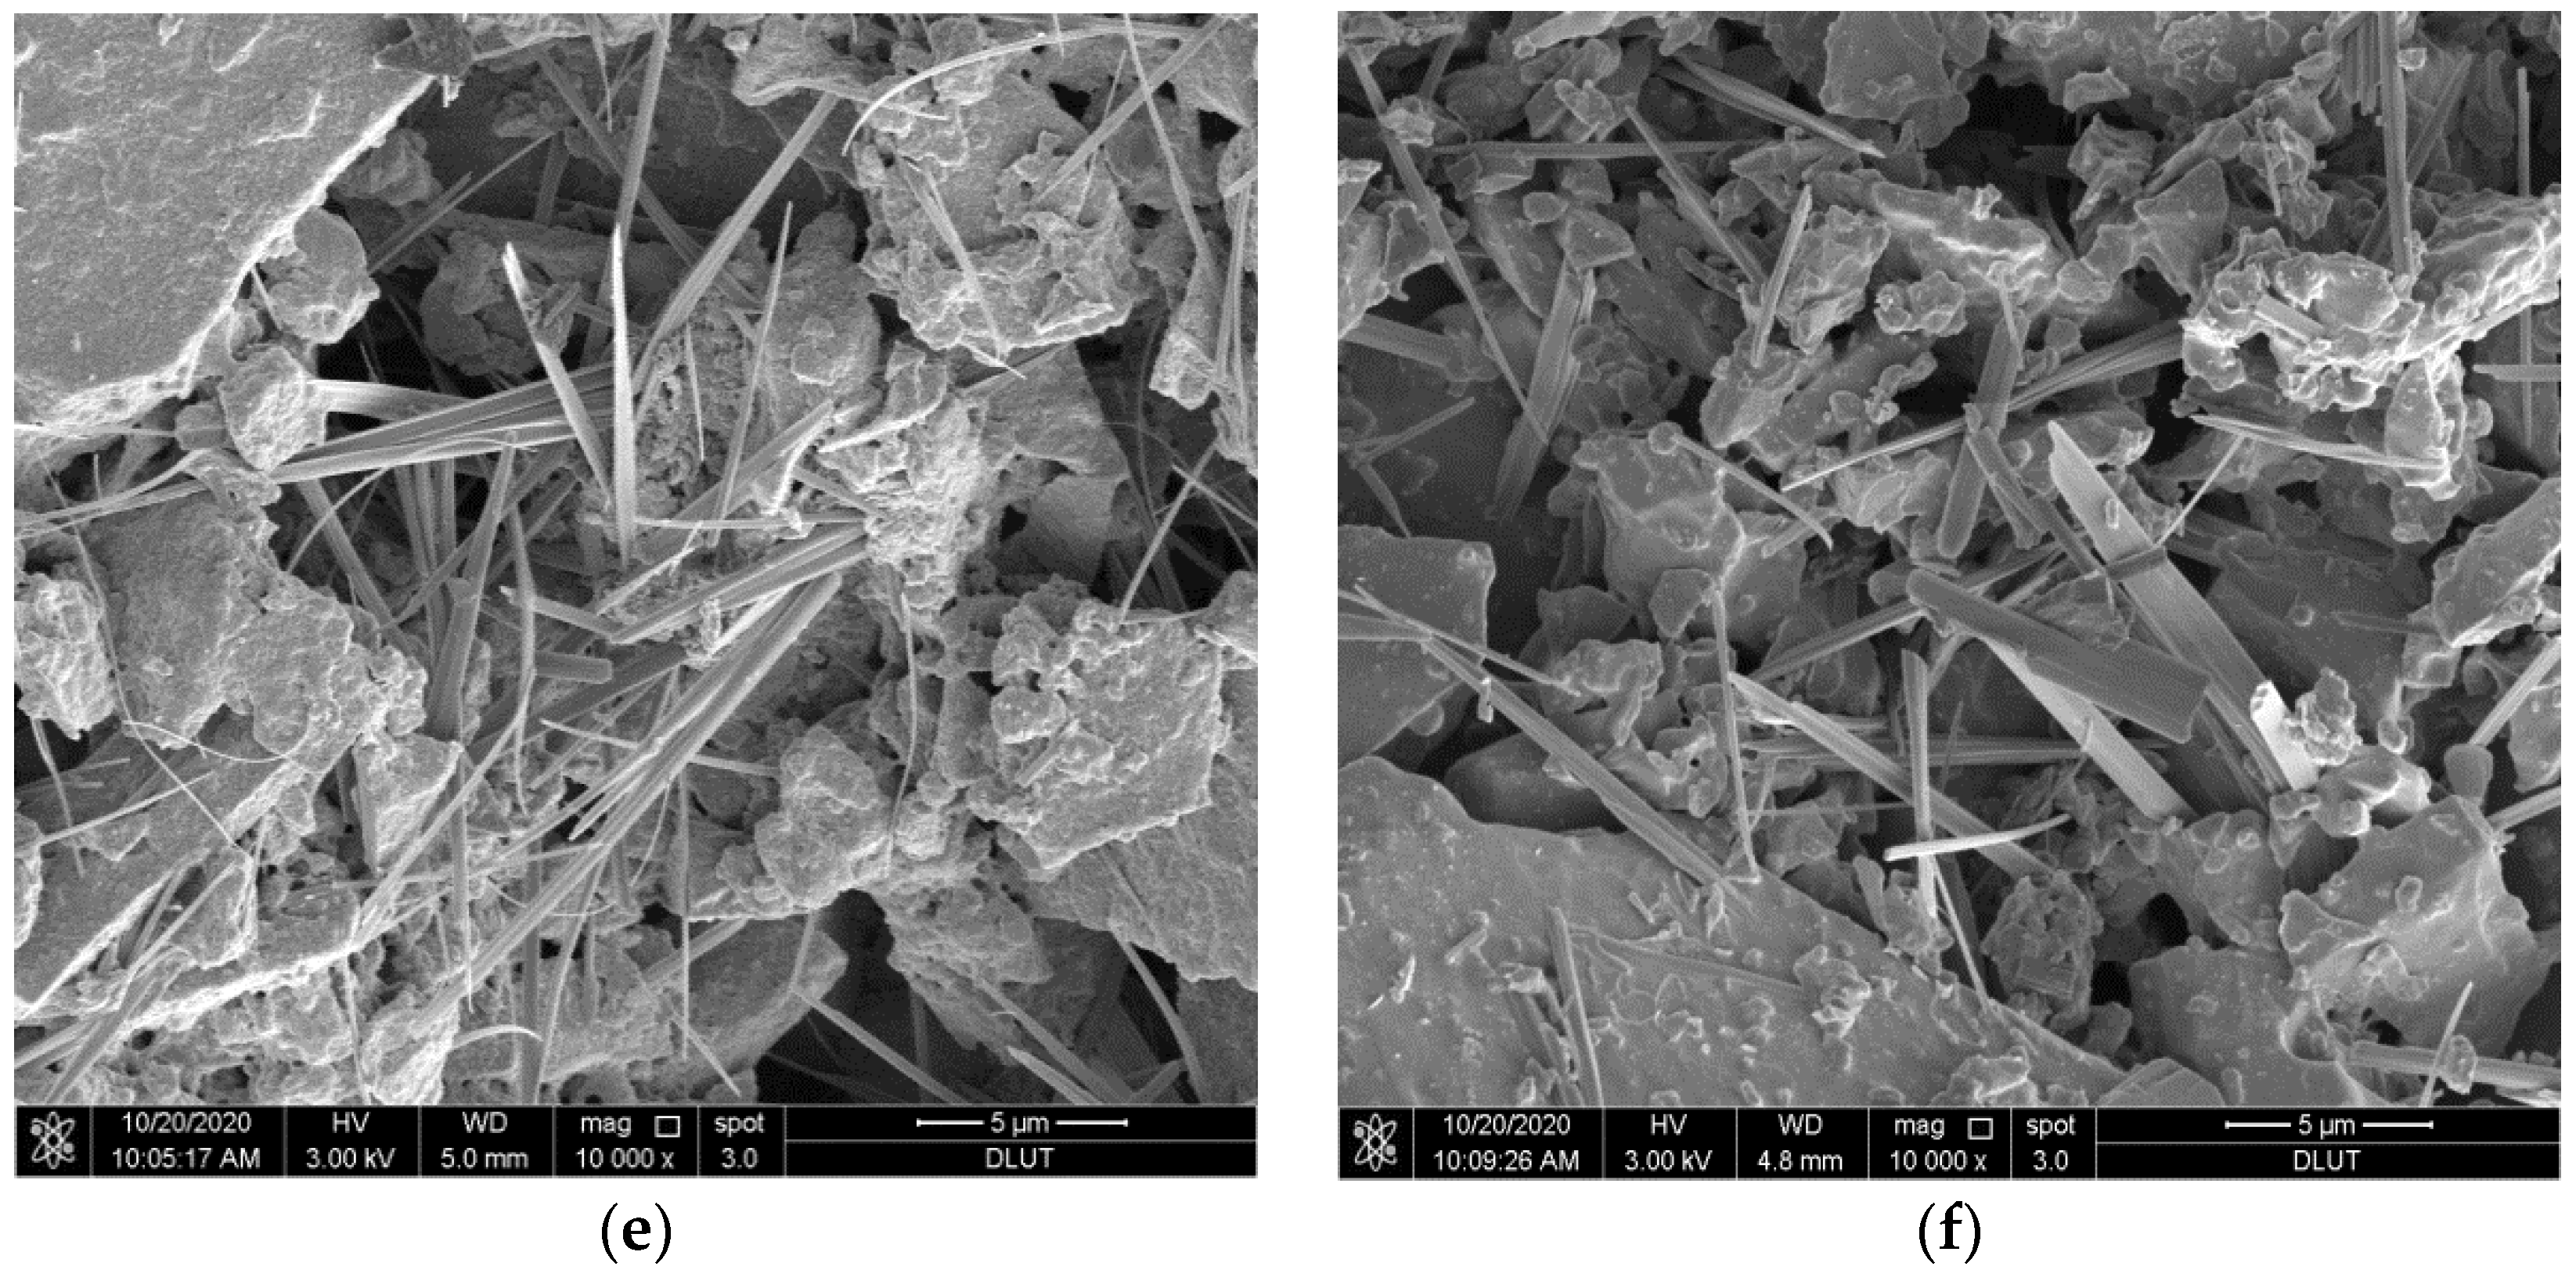
The microstructure of the alkali-activated CNS materials after hydration for 28 days was characterized by SEM, and the microstructures are shown in Figure 8. The moduli of sodium silicate solution in Figure 8a–f were 1.0, 1.5, 2.0, 2.5, 3.0 and 3.2, respectively. Compared with the original CNS sample, the surfaces in Figure 8a–f were all covered by flocculent hydration products. Combined with the analysis of the XRD and FT-IR results, these flocculent hydration products were C-S-H gels. Upon increasing the modulus of sodium silicate solution, the flocculent C-S-H gels on the surface decreased, and the material structure became looser because the higher the modulus of sodium silicate solution, the lower the alkalinity of its aqueous solution. The higher modulus of sodium silicate solution had a weak effect on the activation of CNS, and the larger original sample was only corroded into fragmented blocks or strips (Figure 8d–f), resulting in the formation of less hydration products.
3.3. The Influence of Sodium Silicate Dosage
When the modulus of sodium silicate solution was 1.0, the compressive strength of the cementitious system was highest. So, solid sodium silicate with a modulus of 1.0 was used as the activator to further investigate the influence of sodium silicate content on the cementitious system of CNS. The specific experimental results are shown in Table 3.
Figure 9 shows the influence of different sodium silicate contents on the compressive strength of alkali-activated CNS material. Upon increasing the sodium silicate content, the compressive strength of the alkali-activated CNS material at various ages increased first and then slightly decreased. When the content of sodium silicate was 3.0%, the compressive strength of the alkali-activated CNS material increased rapidly. When the sodium silicate content was 7.0%, the compressive strength of the alkali-activated CNS material reached the maximum, with a maximum compressive strength of 79 MPa after 3 days and 125 MPa after 28 days. These values were slightly higher than those of the M1.0 test groups due to the exothermic dissolution of sodium silicate, which promoted the hydration reaction of the system.
3.3.1. XRD
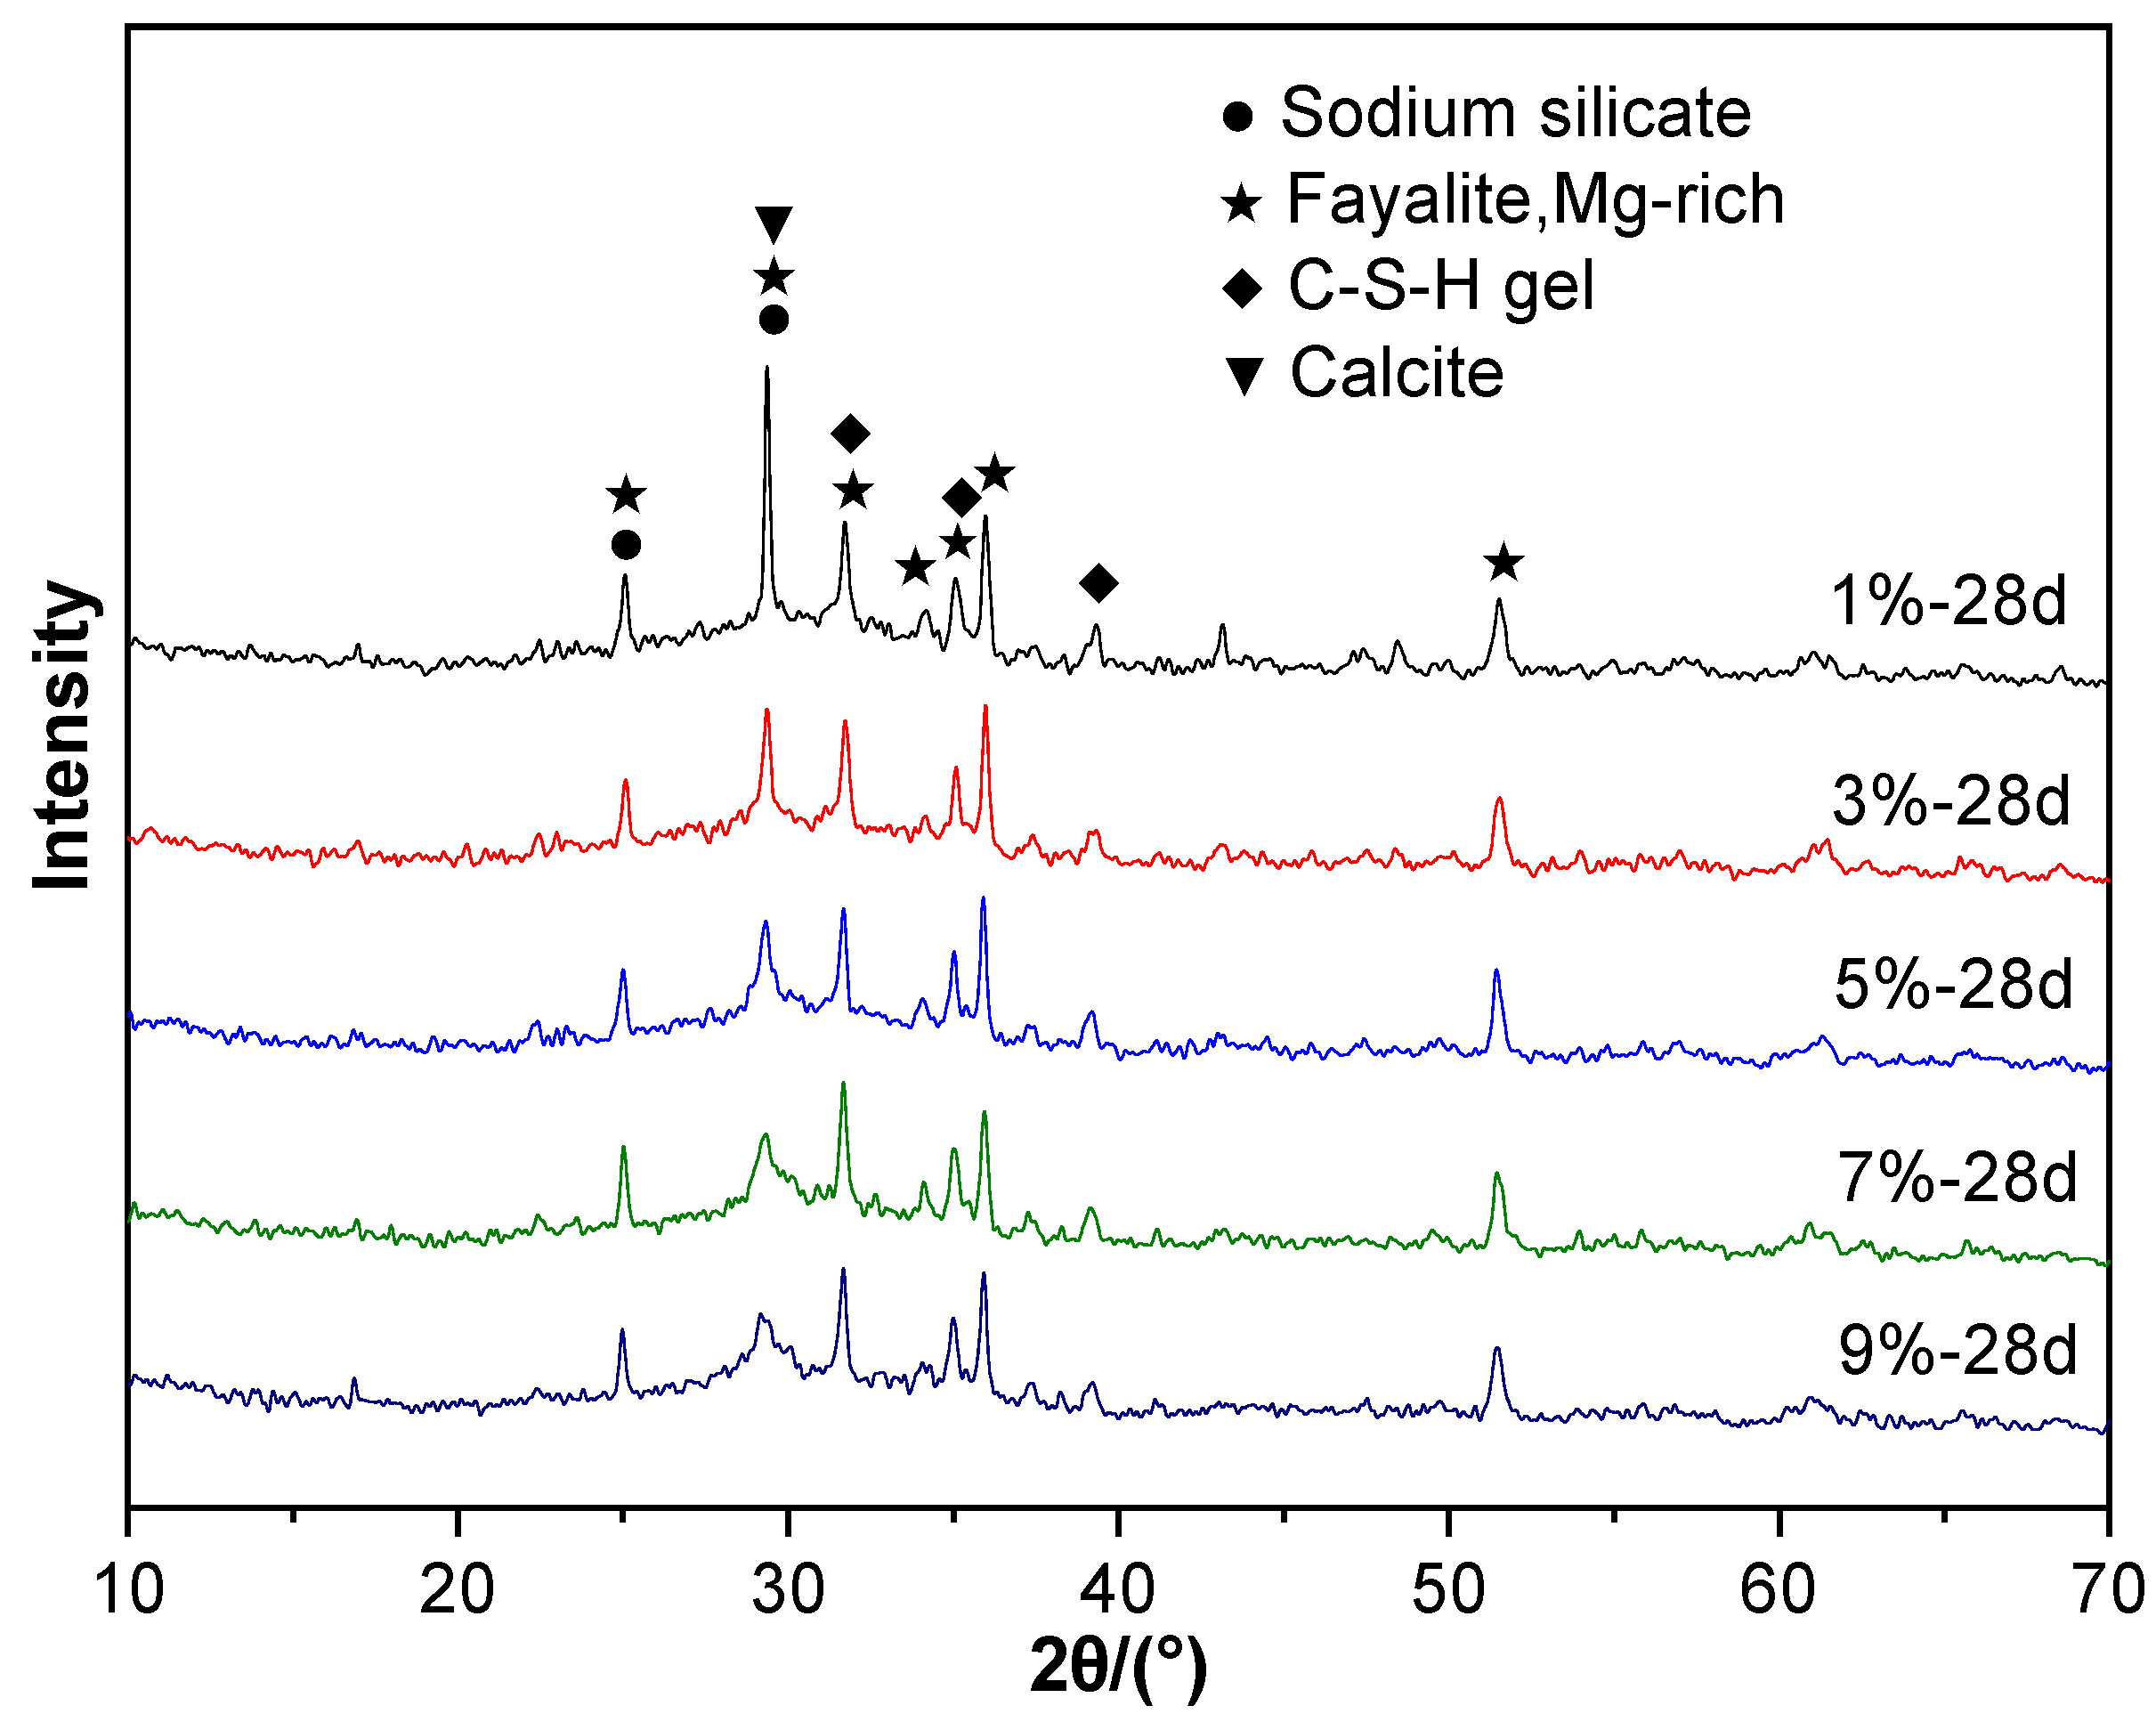
The alkali-activated CNS material showed a higher strength under sodium silicate activation because the system produced more hydration products, which made the structure of the system very dense. The phase analysis of the products after hydration for 28 days is shown in Figure 10. The XRD patterns of the hydrated alkali-activated CNS material have four diffraction peaks that correspond to Mg-rich fayalite, calcite, C-S-H gels, and sodium silicate. Calcite was formed by carbonation of the hydration products. The diffraction peak of sodium silicate indicates a surplus of activator. Under the action of the activator, the glassy phase of the alkali-activated CNS material dissolved first, causing active Si, Al, and Ca to enter the solution. Then, a polycondensation reaction occurred to form C-S-H gels. As the sodium silicate content went up, the diffraction peak strength of C-S-H gels gradually increased, which indicates that increasing the sodium silicate content promoted the formation of hydration products.
3.3.2. FT-IR
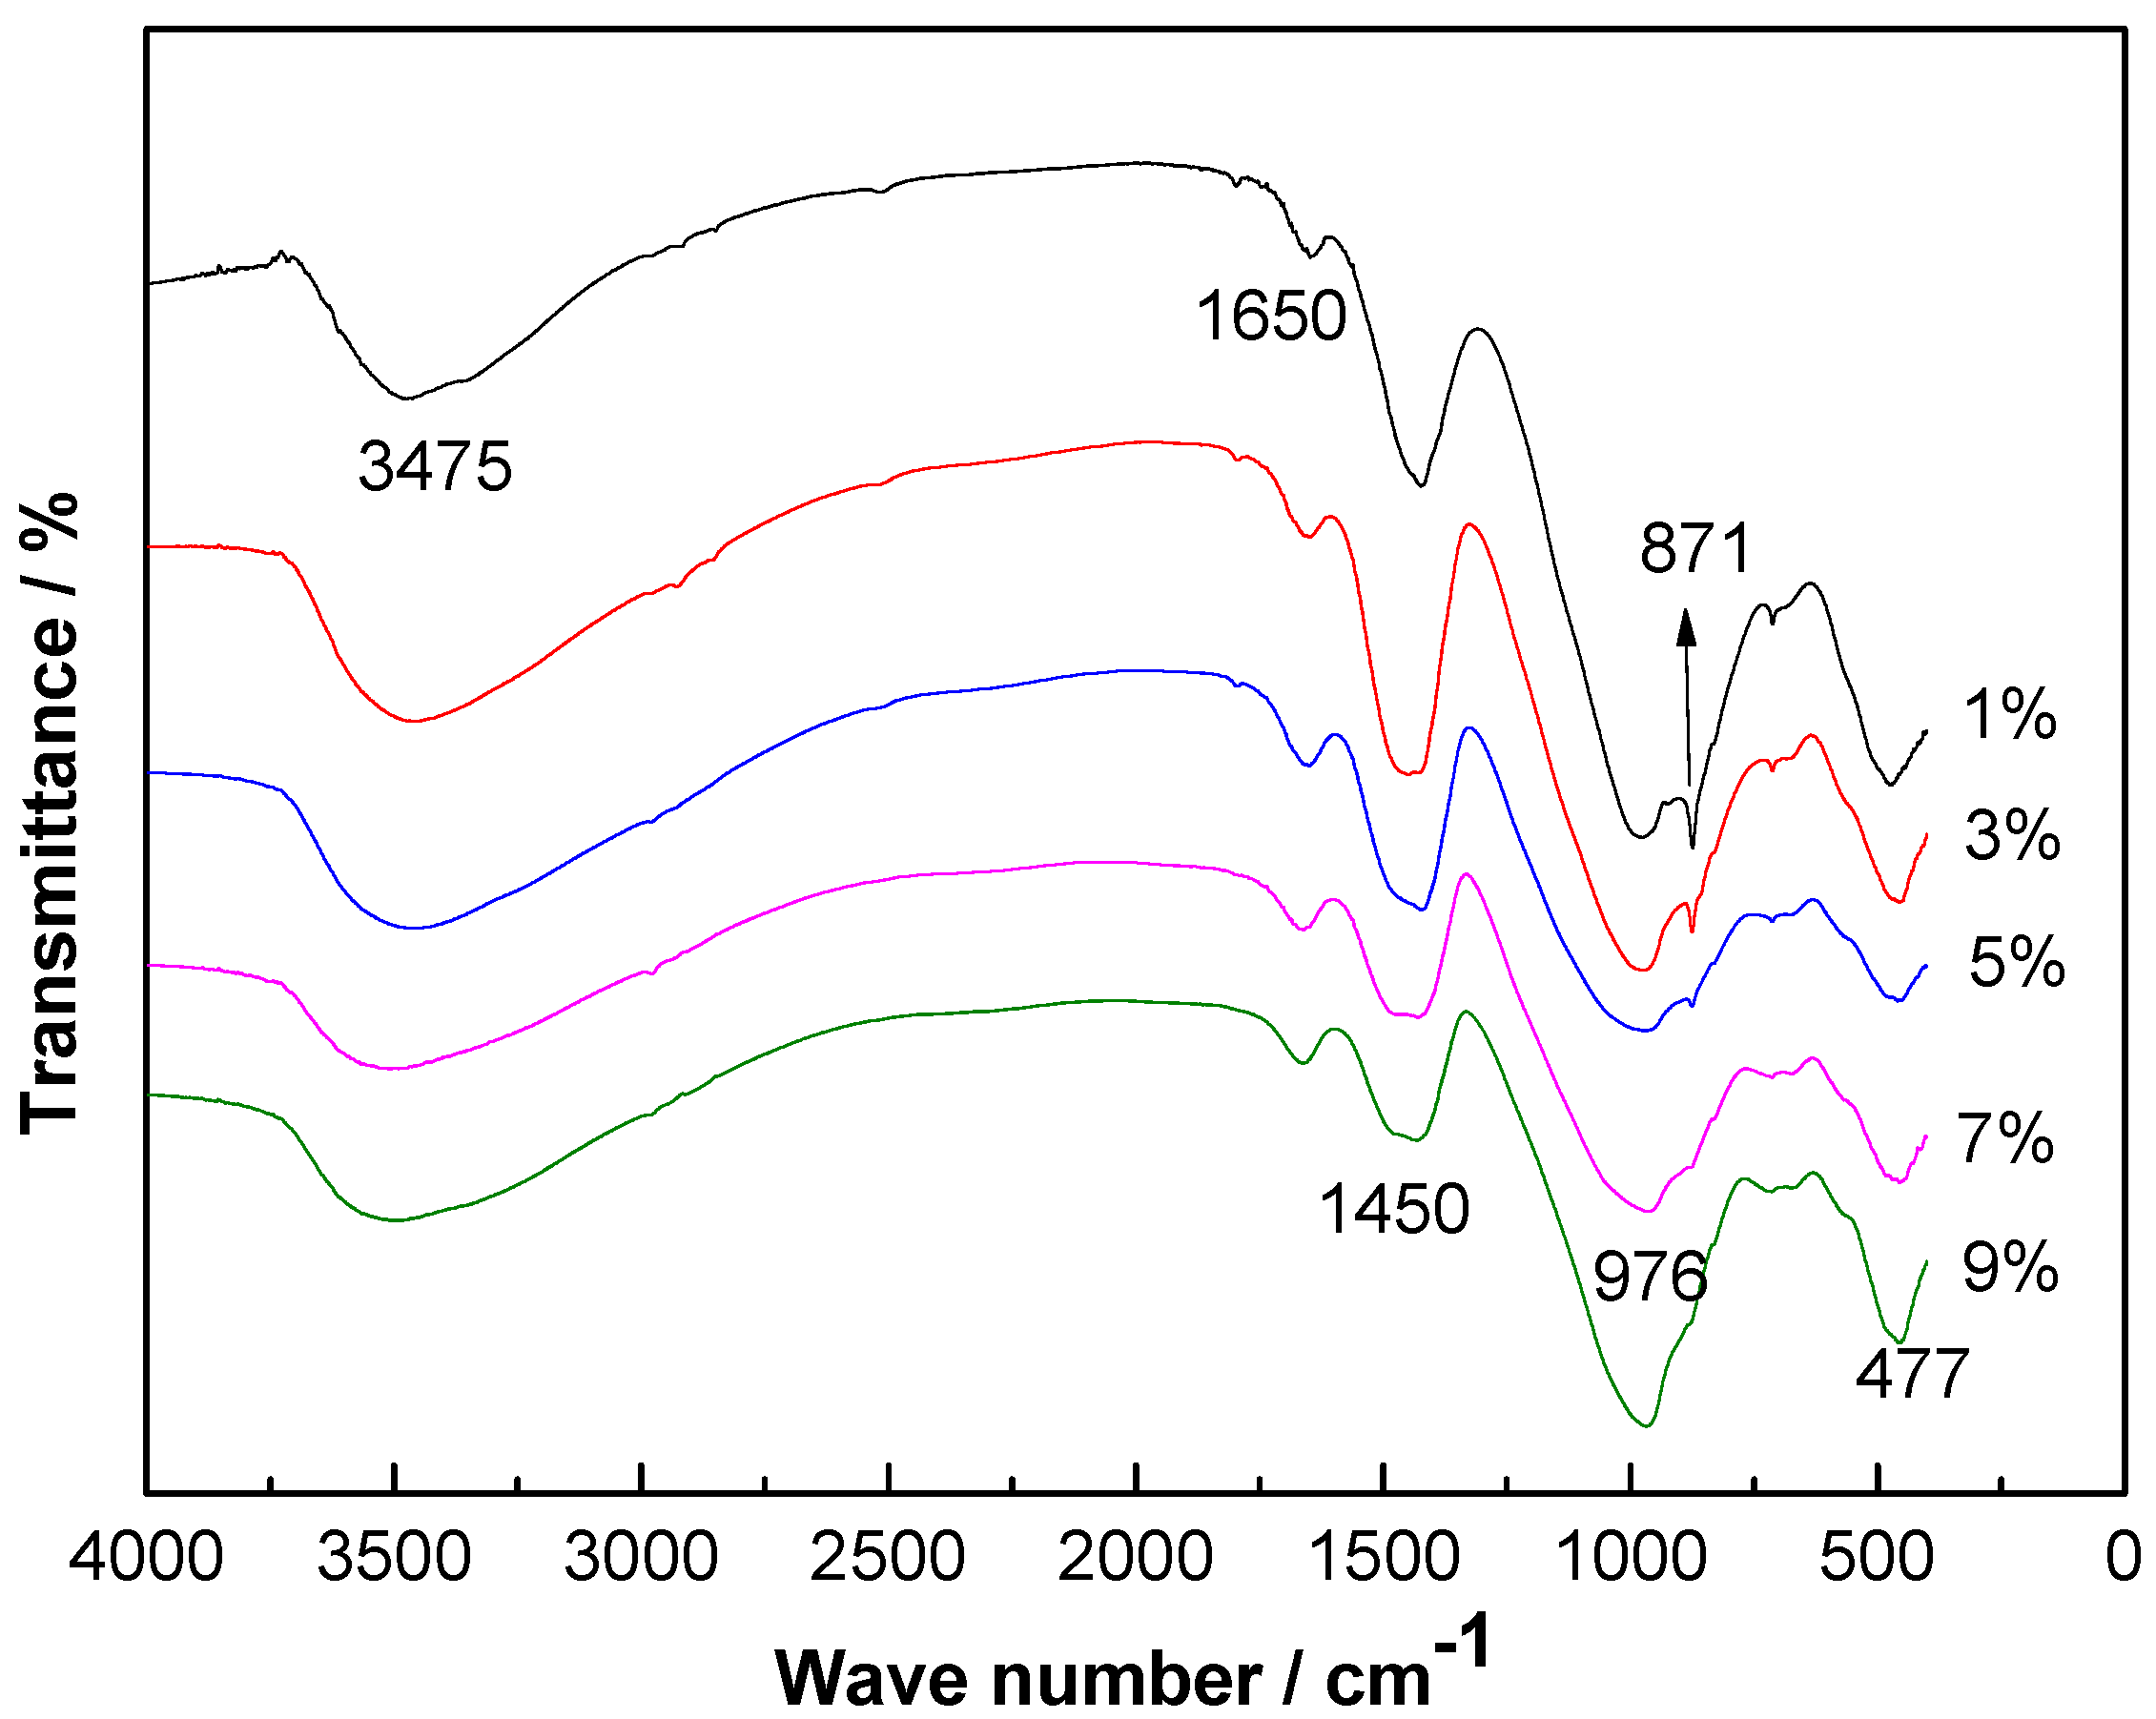
Figure 11 shows the FT-IR spectra of alkali-activated CNS materials with different sodium silicate contents after 28 days of hydration. There are six absorption bands in the FT-IR spectrum at 3475 cm−1, 1650 cm−1, 1450 cm−1, 976 cm−1, 871 cm−1, and 477 cm−1.
The absorption peaks at 3475 cm−1 and 1650 cm−1 are the stretching and bending vibrations of –OH groups. The absorption band at 1450 cm−1 is connected to the vibration of in calcite. The absorption band at 976 cm−1 is connected to the asymmetrical stretching vibration of Si-O-T (T is tetrahedral Si/Al) in C-(A)-S-H. The absorption band at 871 cm−1 is related to the vibration of Al-O, and the absorption band at 477 cm−1 is the bending vibration of Si-O-Si. When the sodium silicate content was high, more hydration product was produced, which increased the intensity of the peak at 976 cm−1.
3.3.3. SEM
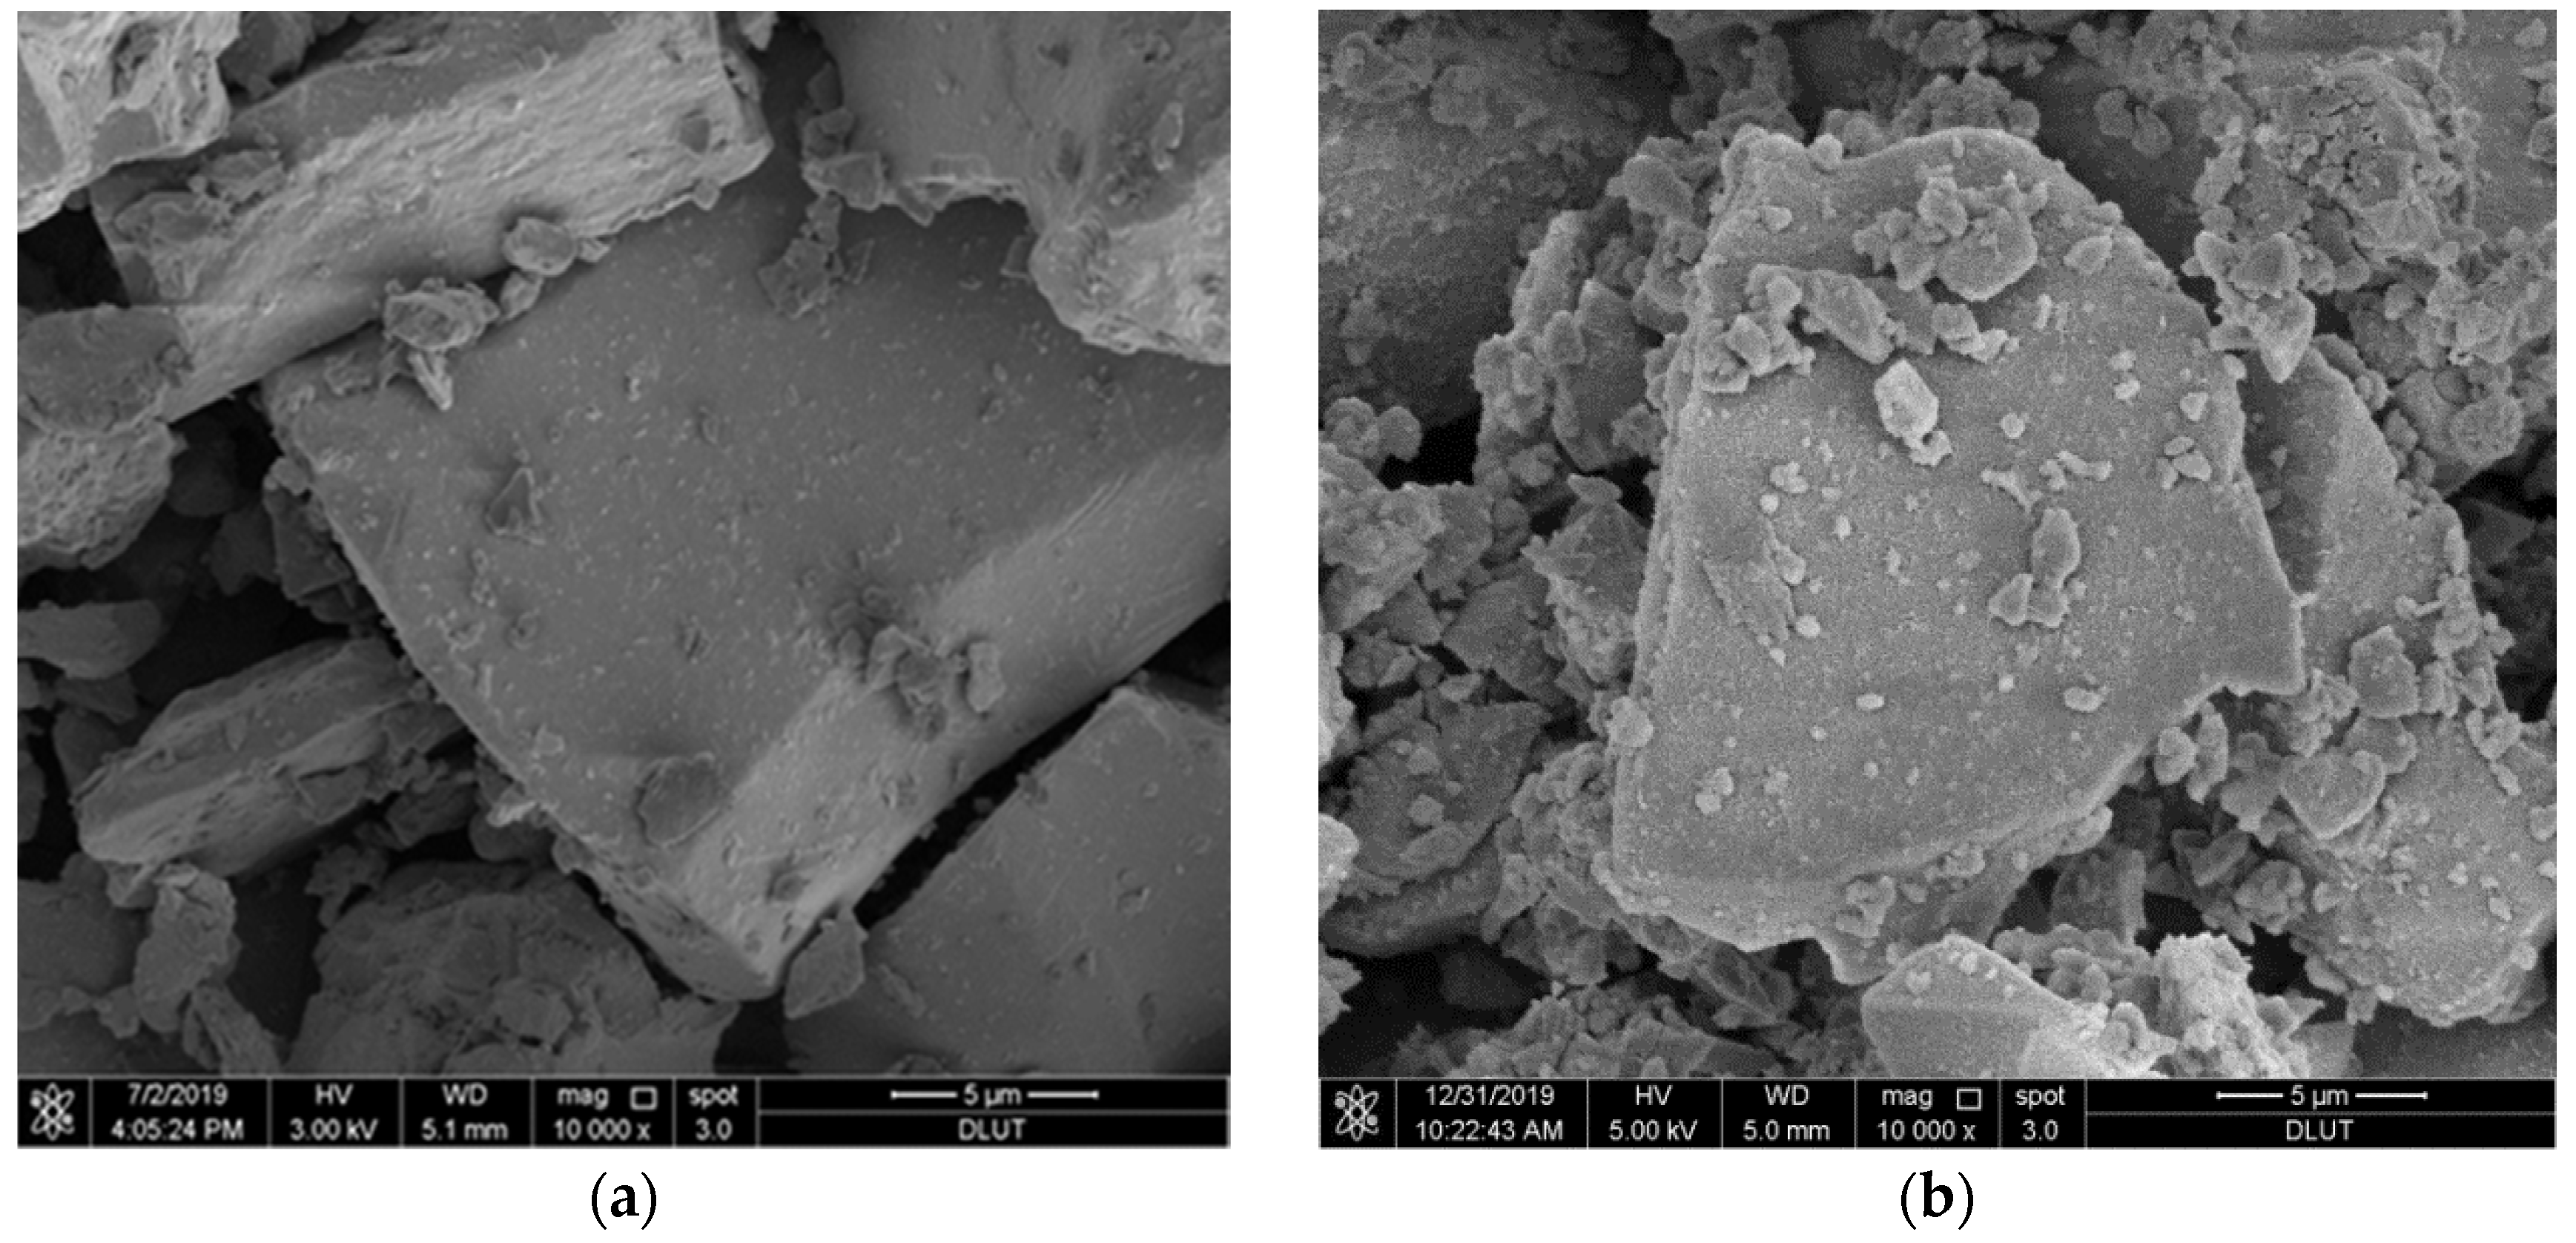
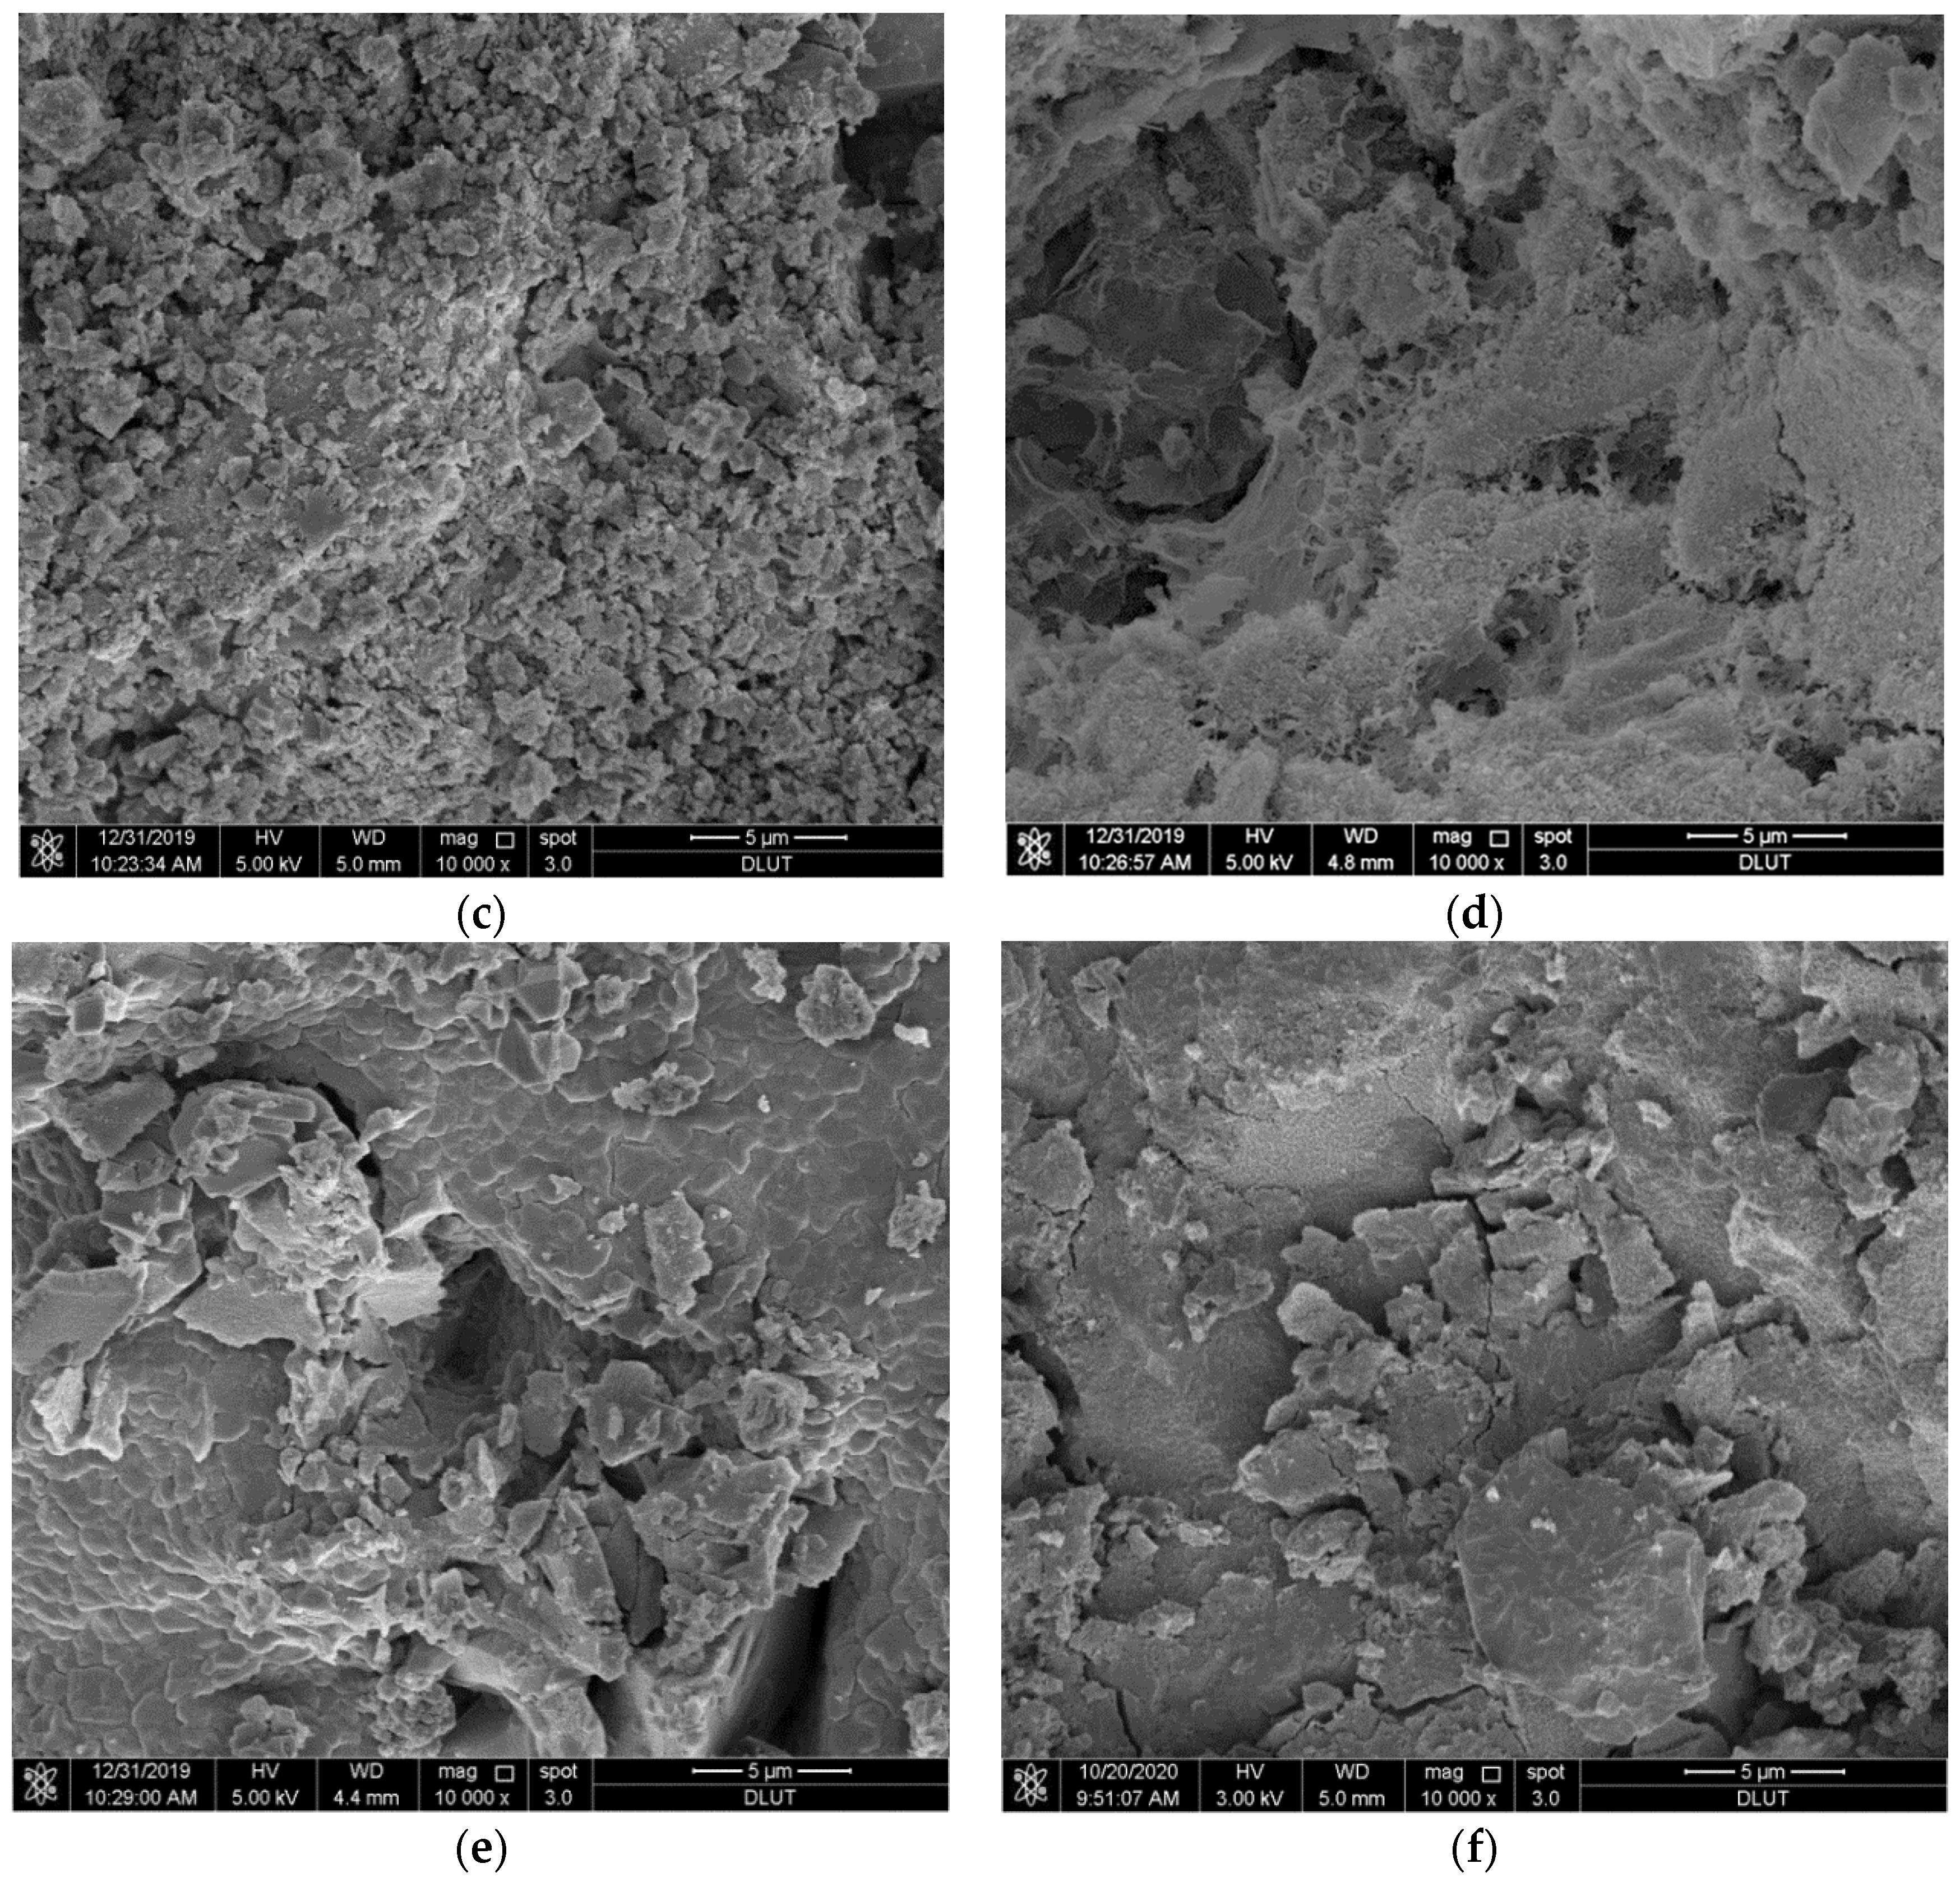
Figure 12 shows the SEM images of CNS with different sodium silicate contents after hydration for 28 days, where (a) is the raw material (CNS), and (b–f) are C1, C2, C3, C4, and C5, respectively. Compared with Figure 12a, the microstructure shown in Figure 12b–f changed to different degrees, and the sample surface was covered by hydration product flocculants. The samples in Figure 12e,f have large amounts of hydration product covering their surface and the densest structures. The alkali dissolution of the glassy phase shows that increasing the sodium silicate content increased the concentration of activator solution, and depolymerization of the glassy phase dissolved more Si, Al, and Ca ions. These Si, Al, and Ca ions underwent a polycondensation reaction in solution and eventually generated C-S-H gels, so the system showed higher macroscopic mechanical properties. If the sodium silicate dosage is excessive, efflorescence may appear on the surface. Therefore, the sodium silicate dosage should not exceed 7.0%.
4. Discussion
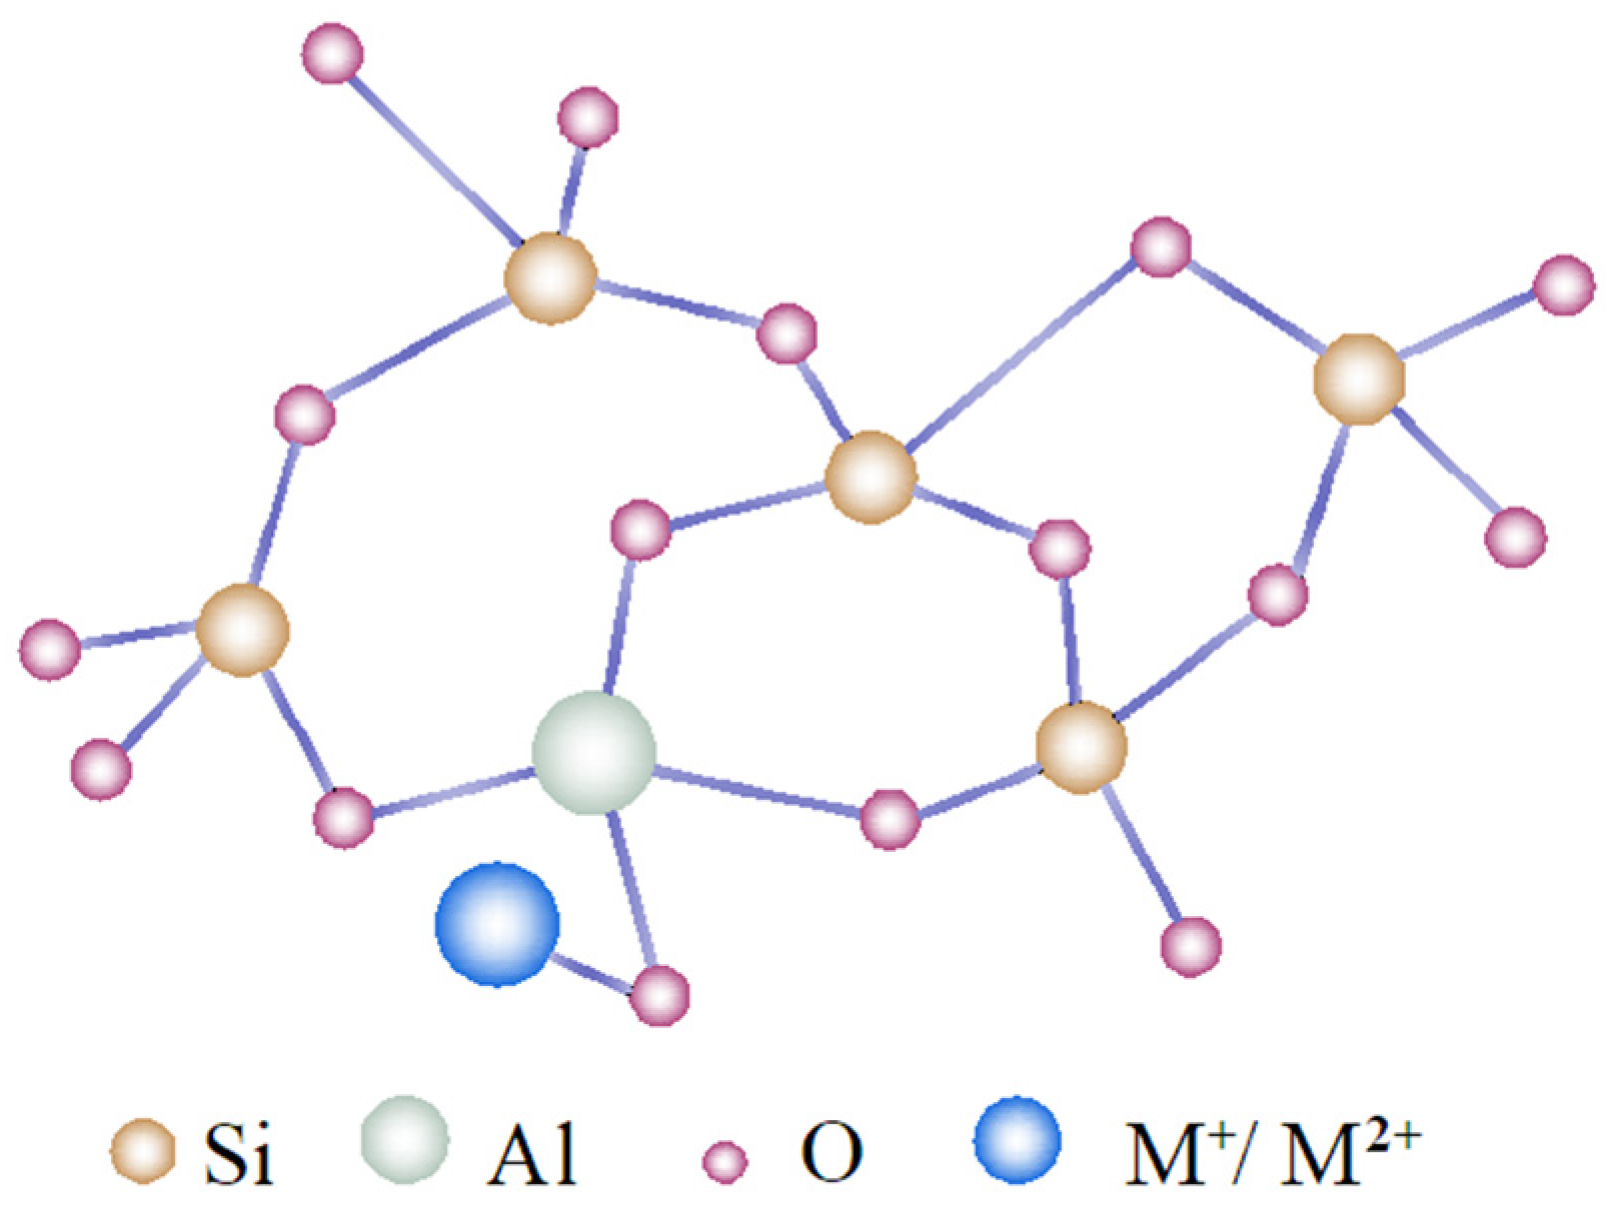
The glassy phase of CNS is composed of a network, network intermediates, and network modifiers, and its spatial structure is shown in Figure 13 [21,22]. The network is composed of three-dimensional [SiO4]4− tetrahedra. Since the network intermediate Al3+ can replace some Si4+, there will be a charge imbalance near Al3+. At this time, the network modifiers with positive charges, such as alkali metal ions (M+, such as K+ or Na+) or alkali earth metal ions (M2+, such as Ca2+), will be attracted to balance the charge difference and make the glassy phase electronically neutral. Compared with the original silicate structure, the replacement structure did not change significantly [23]. The glassy phase of CNS has potential gelling activity and can undergo hydration in the presence of the sodium silicate activator. The hydration of CNS is a complex process, but it can be summarized as a depolymerization-condensation reaction of the glassy phase.
From a thermodynamics perspective, the Al-O bond in Al-O-Si is easier to break than the Si-O-Si bond, as the bond energy of the network modifiers is weaker [24,25]; therefore, under the action of the activator sodium silicate, the chemical bond of the network modifier is broken first, and active Ca2+ is released. Then, OH− ions in the solution will break the chemical bond between Si-O-Al and Si-O-Si by bridging oxygen, which causes depolymerization of the glassy phase. When the modulus of sodium silicate solution is low and it is present in a high concentration, the activator solution is more alkaline, and the depolymerization of the glassy phase will be more vigorous.
The [SiO4]4− tetrahedron with a high degree of polymerization and [AlO4]5− tetrahedron in the CNS glassy phase generated Si(OH)4 and with a low degree of polymerization. These then reacted with active Ca2+ in the system to form C-S-H gels, which provided strength to the system [12,26]. The GGBFS also undergoes a similar reaction as mentioned above. The alkali-activated CNS material prepared with GGBFS powder as a mineral admixture has good mechanical properties because of its higher glassy phase content.
5. Conclusions
By studying the influence of the sodium silicate modulus and dosage on the hydration of alkali-activated CNS material, the following conclusions were drawn:
(1) Sodium silicate can destroy the spatial structure of the CNS glassy phase, which caused Si, Al, and Ca ions to dissolve. Moreover, when the content of sodium silicate did not exceed 7%, upon increasing the sodium silicate solution concentration, the dissolution rate of Al and Ca ions increased, and then promoted the formation of hydration products.
(2) The modulus and dosage of sodium silicate greatly influenced the hydration of alkali-activated cementitious materials. The smaller the modulus of sodium silicate solution and the higher the dosage of sodium silicate, the stronger the alkalinity of the activator solution and the higher the compressive strength of the resulting alkali-activated cementitious materials. When the sodium silicate content was 7.0% and the modulus of sodium silicate solution was 1.0, the compressive strength of the alkali-activated cementitious material reached 125 MPa.
(3) The glassy phase of CNS has a three-dimensional network structure. Under activation by sodium silicate, the [SiO4]4− and [AlO4]5− with a high degree of polymerization in the glassy phase underwent depolymerization and condensation reactions, and finally formed C-S-H gels, which provided strength to the alkali-activated cementing material.
Author Contributions
Conceptualization, L.G.; Data curation, S.Z. and J.Y.; Formal analysis, J.Y.; Funding acquisition, L.G. and T.Z.; Investigation, S.Z. and J.Y.; Methodology, J.H.; Resources, L.G.; Writing—review & editing, J.Y. and T.Z. All authors will be informed about each step of manuscript processing including submission, revision, revision reminder, etc. via emails from our system or assigned Assistant Editor. All authors have read and agreed to the published version of the manuscript.
Funding
This research was funded by the National Key R & D Program of China, grant number 2021YFE0102900; funded by the National Natural Science Foundation of China, grant number 52274122 and Liaoning Revitalization Talents Program, grant number XLYC2007126.
Institutional Review Board Statement
Not applicable.
Informed Consent Statement
Not applicable.
Data Availability Statement
All data, models, and code generated or used during the study appear in the submitted article.
Conflicts of Interest
The authors declare that they have no known competing financial interests or personal relationships that could have appeared to influence the work reported in this paper.
References
- Li, K.Q.; Zhang, Y.Y.; Zhao, P.; Feng, L. Activating of Nickel Slag and Preparing of Cementitious Materials for Backfilling. Adv. Mater. Res. 2014, 936, 1624–1629. [Google Scholar] [CrossRef]
- Wang, L.J.; Wei, Y.K.; Lv, G.C.; Liao, L.; Zhang, D. Experimental Studies on Chemical Activation of Cementitious Materials from Smelting Slag of Copper and Nickel Mine. Materials 2019, 12, 303. [Google Scholar] [CrossRef] [PubMed] [Green Version]
- Lan, W.T.; Wu, A.X.; Yu, P. Development of a new controlled low strength filling material from the activation of copper slag: Influencing factors and mechanism analysis. J. Clean. Prod. 2020, 246, 119060. [Google Scholar] [CrossRef]
- Al-Jabri, K.S.; Hisada, M.; Al-Oraimi, S.K.; Al-Saidy, A.H. Copper slag as sand replacement for high performance concrete. Cem. Concr. Compos. 2009, 31, 483–488. [Google Scholar] [CrossRef]
- Ding, G.Y.; Xu, J.; Wei, Y.; Chen, R.; Li, X. Engineered reclamation fill material created from excavated soft material and granulated blast furnace slag. Resour. Conserv. Recycl. 2019, 150, 104428. [Google Scholar] [CrossRef]
- Aydın, S.; Baradan, B. Effect of activator type and content on properties of alkali-activated slag mortars. Compos. B Eng. 2014, 57, 166–172. [Google Scholar] [CrossRef]
- Palomo, Á.; Alonso, S.; Fernandez-Jiménez, A.; Sobrados, I.; Sanz, J. Alkaline Activation of Fly Ashes: NMR Study of the Reaction Products. J. Am. Ceram. Soc. 2004, 87, 1141–1145. [Google Scholar] [CrossRef]
- Burciaga-Díaz, O.; Magallanes-Rivera, R.X.; Escalante-García, J.I. Alkali-activated slag-metakaolin pastes: Strength, structural, and microstructural characterization. J. Sustain. Cem. Based Mater. 2013, 2, 111–127. [Google Scholar] [CrossRef]
- Chen, W.W.; Li, B.; Wang, J.; Thom, N. Effects of alkali dosage and silicate modulus on autogenous shrinkage of alkali-activated slag cement paste. Cem. Concr. Res. 2021, 141, 106322. [Google Scholar] [CrossRef]
- Luukkonen, T.; Sreenivasan, H.; Abdollahnejad, Z.; Yliniemi, J.; Kantola, A.; Telkki, V.-V.; Kinnunen, P.; Illikainen, M. Influence of sodium silicate powder silica modulus for mechanical and chemical properties of dry-mix alkali-activated slag mortar. Constr. Build. Mater. 2020, 233, 117354. [Google Scholar] [CrossRef]
- Bocullo, V.; Vitola, L.; Vaiciukyniene, D.; Kantautas, A.; Bajare, D. The influence of the SiO2/Na2O ratio on the low calcium alkali activated binder based on fly ash. Mater. Chem. Phys. 2021, 258, 123846. [Google Scholar] [CrossRef]
- Zhang, T.T.; Zhi, S.W.; Li, T.; Zhou, Z.Y.; Li, M.; Han, J.N.; Li, W.C.; Zhang, D.; Guo, L.J.; Wu, Z.L. Alkali activation of copper and nickel slag composite cementitious materials. Materials 2020, 13, 1155. [Google Scholar] [CrossRef] [PubMed] [Green Version]
- Feng, Y.; Kero, J.; Yang, Q.X.; Chen, Q.S.; Engström, F.; Samuelsson, C.; Qi, C.C. Mechanical Activation of Granulated Copper Slag and Its Influence on Hydration Heat and Compressive Strength of Blended Cement. Materials 2019, 12, 772. [Google Scholar] [CrossRef] [Green Version]
- Barbosa, V.F.F.; MacKenzie, K.J.D.; Thaumaturgo, C. Synthesis and characterisation of materials based on inorganic polymers of alumina and silica: Sodium polysialate polymers. Int. J. Inorg. Mater. 2000, 2, 309–317. [Google Scholar] [CrossRef]
- Puertas, F.; Fernández-Jiménez, A. Mineralogical and microstructural characterisation of alkali-activated fly ash/slag pastes. Cem. Concr. Compos. 2003, 25, 287–292. [Google Scholar] [CrossRef]
- Garcia-Lodeiro, I.; Palomo, A.; Fernández-Jiménez, A.; Macphee, D.E. Compatibility studies between N-A-S-H and C-A-S-H gels. Study in the ternary diagram Na2O–CaO–Al2O3–SiO2–H2O. Cem. Concr. Res. 2011, 41, 923–931. [Google Scholar] [CrossRef]
- Bernal, S.A.; de Gutierrez, R.M.; Provis, J.L.; Rose, V. Effect of silicate modulus and metakaolin incorporation on the carbonation of alkali silicate-activated slags. Cem. Concr. Res. 2010, 40, 898–907. [Google Scholar] [CrossRef]
- Allahverdi, A.; Mahinroosta, M. Mechanical activation of chemically activated high phosphorous slag content cement. Powder Technol. 2013, 245, 182–188. [Google Scholar] [CrossRef]
- Ma, H.Q.; Li, X.M.; Zheng, X.; Niu, X.Y.; Fang, Y.L. Effect of active mgO on the hydration kinetics characteristics and microstructures of alkali-activated fly ash-slag materials. Constr. Build. Mater. 2022, 361, 129677. [Google Scholar] [CrossRef]
- Abdalqader, A.F.; Jin, F.; Al-Tabbaa, A. Characterisation of reactive magnesia and sodium carbonate-activated fly ash/slag paste blends. Constr. Build. Mater. 2015, 93, 506–513. [Google Scholar] [CrossRef] [Green Version]
- Gong, K.; White, C.E. Impact of chemical variability of ground granulated blast-furnace slag on the phase formation in alkali-activated slag pastes. Cem. Concr. Res. 2016, 89, 310–319. [Google Scholar] [CrossRef] [Green Version]
- Zachariasen, W.H. The atomic arrangement in glass. J. Am. Chem. Soc. 1932, 54, 3841–3851. [Google Scholar] [CrossRef]
- Yip, C.K.; Lukey, G.C.; van Deventer, J.S.J. The coexistence of geopolymeric gel and calcium silicate hydrate at the early stage of alkaline activation. Cem. Concr. Res. 2005, 35, 1688–1697. [Google Scholar] [CrossRef]
- Hamilton, J.P.; Brantley, S.L.; Pantano, C.G.; Criscenti, L.J.; Kubicki, J.D. Dissolution of nepheline, jadeite and albite glasses: Toward better models for aluminosilicate dissolution. Geochim. Cosmochim. Acta 2001, 65, 3683–3702. [Google Scholar] [CrossRef]
- Oelkers, E.H.; Gislason, S.R. The mechanism, rates and consequences of basaltic glass dissolution: I. An experimental study of the dissolution rates of basaltic glass as a function of aqueous Al, Si and oxalic acid concentration at 25 °C and pH = 3 and 11. Geochim. Cosmochim. Acta 2001, 65, 3671–3681. [Google Scholar] [CrossRef]
- Alonso, S.; Palomo, A. Calorimetric study of alkaline activation of calcium hydroxide–metakaolin solid mixtures. Cem. Concr. Res. 2001, 31, 25–30. [Google Scholar] [CrossRef]
Figure 1.
Particle size distribution of raw materials (a) CNS, (b) GGBFS.

Figure 2.
Effect of sodium silicate solution concentration on the dissolution of Si, Al, Ca and Fe.

Figure 3.
XRD patterns of CNS dissolved by different concentrations of sodium silicate solutions.

Figure 4.
FT−IR spectra of CNS dissolved by solutions with different sodium silicate solution concentrations.
Figure 4.
FT−IR spectra of CNS dissolved by solutions with different sodium silicate solution concentrations.

Figure 5.
Effect of sodium silicate solution modulus on the compressive strength of alkali-activated CNS material.
Figure 5.
Effect of sodium silicate solution modulus on the compressive strength of alkali-activated CNS material.

Figure 6.
XRD patterns of alkali-activated CNS materials after hydration under different sodium silicate solution moduli.
Figure 6.
XRD patterns of alkali-activated CNS materials after hydration under different sodium silicate solution moduli.

Figure 7.
FT−IR spectra of alkali-activated CNS materials after hydration using sodium silicate solution with different moduli.
Figure 7.
FT−IR spectra of alkali-activated CNS materials after hydration using sodium silicate solution with different moduli.

Figure 8.
SEM images of hydration products of CNS under different sodium silicate solution moduli: (a) M1.0, (b) M1.5, (c) M2.0, (d) M2.5, (e) M3.0, and (f) M3.2.
Figure 8.
SEM images of hydration products of CNS under different sodium silicate solution moduli: (a) M1.0, (b) M1.5, (c) M2.0, (d) M2.5, (e) M3.0, and (f) M3.2.


Figure 9.
Compressive strength of CNS samples with different sodium silicate contents.

Figure 10.
XRD patterns of alkali-activated CNS materials after hydration with different sodium silicate contents.
Figure 10.
XRD patterns of alkali-activated CNS materials after hydration with different sodium silicate contents.

Figure 11.
FT-IR spectra of alkali-activated CNS materials after hydration with different sodium silicate contents.
Figure 11.
FT-IR spectra of alkali-activated CNS materials after hydration with different sodium silicate contents.

Figure 12.
SEM images of the hydration products of CNS with different sodium silicate contents: (a) raw material (CNS), (b) C1, (c) C2, (d) C3, (e) C4, and (f) C5.
Figure 12.
SEM images of the hydration products of CNS with different sodium silicate contents: (a) raw material (CNS), (b) C1, (c) C2, (d) C3, (e) C4, and (f) C5.


Figure 13.
Schematic diagram of CNS glassy phase spatial structure.


Table 1.
Chemical composition of GGBFS and CNS (wt.%).
| Component | ||||||||||
|---|---|---|---|---|---|---|---|---|---|---|
| GGFBS | 46.27 | 19.20 | 15.43 | 14.74 | 0.73 | 0.62 | - | - | - | - |
| CNS | 1.66 | 1.18 | 32.37 | 6.53 | 53.87 | 0.56 | 1.00 | 0.54 | 0.49 | 0.43 |
Table 2.
Experimental ratios.
| Number | CNS/% | GGBFS/% | Sodium Silicate/% | Modulus | Water/Cement Ratio |
|---|---|---|---|---|---|
| M1.0 | 50 | 43 | 7.0 | 1.0 | 0.23 |
| M1.5 | 50 | 43 | 7.0 | 1.5 | 0.23 |
| M2.0 | 50 | 43 | 7.0 | 2.0 | 0.23 |
| M2.5 | 50 | 43 | 7.0 | 2.5 | 0.23 |
| M3.0 | 50 | 43 | 7.0 | 3.0 | 0.23 |
| M3.2 | 50 | 43 | 7.0 | 3.2 | 0.23 |
Table 3.
Experimental results.
| Number | CNS/% | GGBFS/% | Sodium Silicate/% | Water/Cement Ratio |
|---|---|---|---|---|
| C1 | 50 | 49 | 1.0 | 0.23 |
| C2 | 50 | 47 | 3.0 | 0.23 |
| C3 | 50 | 45 | 5.0 | 0.23 |
| C4 | 50 | 43 | 7.0 | 0.23 |
| C5 | 50 | 41 | 9.0 | 0.23 |
Disclaimer/Publisher’s Note: The statements, opinions and data contained in all publications are solely those of the individual author(s) and contributor(s) and not of MDPI and/or the editor(s). MDPI and/or the editor(s) disclaim responsibility for any injury to people or property resulting from any ideas, methods, instructions or products referred to in the content. |
© 2023 by the authors. Licensee MDPI, Basel, Switzerland. This article is an open access article distributed under the terms and conditions of the Creative Commons Attribution (CC BY) license (https://creativecommons.org/licenses/by/4.0/).
Share and Cite
MDPI and ACS Style
Yang, J.; Zhang, T.; Guo, L.; Zhi, S.; Han, J. Effect of Sodium Silicate on the Hydration of Alkali-Activated Copper-Nickel Slag Materials. Metals 2023, 13, 596. https://doi.org/10.3390/met13030596
AMA Style
Yang J, Zhang T, Guo L, Zhi S, Han J. Effect of Sodium Silicate on the Hydration of Alkali-Activated Copper-Nickel Slag Materials. Metals. 2023; 13(3):596. https://doi.org/10.3390/met13030596
Chicago/Turabian StyleYang, Jie, Tingting Zhang, Lijie Guo, Shiwei Zhi, and Junnan Han. 2023. "Effect of Sodium Silicate on the Hydration of Alkali-Activated Copper-Nickel Slag Materials" Metals 13, no. 3: 596. https://doi.org/10.3390/met13030596
Note that from the first issue of 2016, this journal uses article numbers instead of page numbers. See further details here.