Article

The Effect of Heating Temperature on α-α′ Miscibility and Separation in Fe-25Cr-5Al-RE Alloy

1
School of Mechanical Engineering, North University of China, Taiyuan 030051, China
2
Shanxi Key Laboratory of Advanced Metal Materials for Special Environments, Taiyuan 030051, China
*
Authors to whom correspondence should be addressed.
Metals 2023, 13(3), 597; https://doi.org/10.3390/met13030597
Submission received: 5 February 2023 / Revised: 4 March 2023 / Accepted: 11 March 2023 / Published: 15 March 2023
(This article belongs to the Special Issue Advanced Research of Metal Matrix Composites)

Abstract

:
In general, FeCrAl alloys are faced with the separation of the high-chromium solid solution into α and α′ phases. For the Fe-25Cr-5Al-RE alloy, it is imperative to investigate the structure and morphology and their effect on the alloy’s mechanical properties. In this paper, XRD is used to reveal the presence of α and α′ phases. Based on XRD data, Rietveld refinement combined with quantitative texture analysis is carried out to determine the lattice constants and the harmonic coefficients. Then, SEM and TEM techniques are employed to provide an insight into the α′ phase and its morphology. The percentage total elongation at fracture is anti-correlated with the lattice of the α′ phase and the generalized harmonic coefficients C41.

1. Introduction

Fe-(10–30Cr)-(1–20Al) alloy is one of the promising materials for heat resistance applications, with uses in high temperature desulfurization pipes in power plants [1,2,3]. These compounds are designed to combine corrosion resistance, conferred by chromium, as well as to retain adequate toughness and elevated-temperature strength. Current research efforts are focused on developing excellent mechanical properties, radiation tolerance, and processability of the FeCrAl systems [4,5,6,7].
In general, the FeCrAl alloys should be processed with a fabrication route, such as hot forging/rolling, before practical use [2,8,9]. One major drawback of the use of FeCrAl alloys is the inevitable formation of Cr-rich α′ precipitates within the α substrate in the FeCrAl ternary alloys [6,10]. Thus, it is imperative to reveal the information on the formation and behavior of α′ precipitates in FeCrAl ternary alloys.
As with other high-Cr FeCrAl systems, the Fe-25Cr-5Al-RE alloy may also be prone to the composition of the body-centered cubic (BCC) high-Cr ferrites into a Fe-rich substrate and Cr-rich α′ precipitates [11,12,13]. Considering the potential degradation in the mechanical properties of Fe-25Cr-5Al-RE alloys under thermal processing and treatment, knowledge of α and α′ phases is of great importance. The three-dimensional atom probe is the primary technique due to size factor [1,10]. In this paper, emphasis is devoted to the separation of the high-chromium solid solution into α and α′ phases using XRD, SEM, and TEM techniques. Having different natures, they each have a different morphology and differently affect the mechanical and technological properties of the Fe-25Cr-5Al-RE alloy.

2. Experiment

2.1. Materials, Processing, and Heat Treatment

A coil of Fe-25Cr-5Al-RE wire with a diameter of 6.5 mm was produced by Taiyuan Iron and Steel Corporation (TISCO) in China. It was prepared in a repeated hot-rolling process at 1100 °C and cooled in the air (Figure 1). The chemical composition of the steel is listed in Table 1; this information was provided by TISCO and measured using a spectrometer. The hot-rolled Fe-25Cr-5Al-RE wire was first uncoiled and then cut into small pieces (wire rods). The Fe-25Cr-5Al-RE wire rods were strengthened with the vise and hammer, thus rending the uniformed collimation among the different samples. In the thermal treatment process (Figure 1), the Fe-25Cr-5Al-RE wire rods were put into the furnace at various stable temperatures, set at 600, 700, 800, 900, and 1000 °C, respectively. After 60 m, the samples were transferred into water for quenching. All the preprocesses were performed in air.

2.2. Materials Characterization

Metallographic samples were first mechanically ground and polished. The samples for the scanning electron microscope (SEM) were etched in a fresh aqua regia with concentrated nitric acid (60 wt%) and hydrochloric acid (37 wt%) mixed uniformly at a 1:3 ratio. The SEM analysis was carried out using a field emission scanning electron microscopy (TESCAN 9000X) with an Oxford energy dispersive spectroscopy (EDS). The TEM analysis and precipitate analysis were carried out on a transmission electron (JEOL 2100F) equipped with an Oxford energy dispersive spectroscopy. The total elongation (EL) was tested on an electronic universal testing machine (Instron 3382) with a strain rate of 1.5 mm/min according to the ISO 6892-1:2009 standard with the tensile specimen.

2.3. Metholody (Rietveld Analysis)

The phase analysis of Fe-25Cr-5Al-RE wire rods was performed on an X-ray diffractometer. Step-scanned profiles (θ/2θ scan mode) were measured using a Smartlab Bragg–Brentano diffractometer. Data were collected up to 100° because Bragg intensities were barely observable beyond this angle. The analysis of the XRD profiles was carried out using Rigaku SmartLab Studio II software. With the second derivative method, the location of the diffraction peaks was identified from the XRD profiles. During the quantitative texture analysis [14,15,16], the preferred orientation was corrected with the generalized harmonics function (GSH). As accepted, the orientation distribution function (ODF) in quantitative texture analysis relies on pole-figure measurements. A newer technique was based on the Rietveld refinement for whole diffraction profiles with the generalized spherical harmonic (GSH) method. The GSH description is either explicitly encoded up to a maximum order n and generated using selection rules depending on the crystal symmetry of the phase under investigation [17,18].
A ( φ , β , ψ , γ ) = 1 + 2 L ( 4 π 2 + l ) m = l + l n = l + l C l m n k l m ( φ , β ) k l n ( ψ , γ )
In Equation (1), the two harmonics terms, klm(φ, β) and kln(Ψ, γ), take on values according to the crystal and sample symmetries, in which the crystal reflection coordinate (φ, β) is determined by the choice of reflection index (hkl); the sample coordinates (Ψ, γ) are determined by the choice of reflection index (hkl) and sample orientation on the diffractometer, respectively.
In general, the sample symmetry must be imposed depending on the kind of measurement that is performed. In the present study, with one XRD profile in Bragg–Brentano, the cylindrical symmetry for Fe-25Cr-5Al-RE can be used. The fiber axis of the Fe-25Cr-5Al-RE rod is normal to the surface for Bragg–Brentano diffraction geometry. Thus, the macrotexture is then completely described by the set of harmonic coefficients Clmn determined from Rietveld refinement with GSH description.

3. Results and Discussion

3.1. Phase and Rietveld Analysis

As an effort to reveal the phase of the rolled and heat-treated Fe-25Cr-5Al-RE wire rods, X-ray diffraction was carried out. As shown in Figure 2, the main diffraction peaks in the location (2θ) of 44.6, 65.0, 82.3, and 98.9° can be the ferrite matrix (the α phase, Im-3m, 229) among the rolled and heat-treated Fe-25Cr-5Al-RE wire rods. Apart from the main diffraction peaks, another set of minor peaks can be detected on the lower angle of each peak beside the α phase in Figure 2. This phase can be roughly evaluated with the same crystal structure when compared with the α phase but showing a larger lattice constant. After careful indexation, the set of minor peaks can be indexed as chromium iron (the α′ phase, Im-3m, 229) [19]. The diffraction peaks have been labeled as the planes of the α and α′ phases. It can be seen that the distance gap (2θ) between α(110) and α′(110) varies with the heating temperature; this is due to the difference in the lattice constant of the α and α′ phases. With the basic Rietveld refinement, the lattice constants of the rolled and heat-treated specimens are obtained and listed in Table 2. There is no apparent difference for the α phase among the rolled and heat-treated specimens. The distance gaps between α(110) and α′(110) are primarily from the lattice constant of the α′ phase. With the increase of the heating temperature from 600 to 1000 °C, the lattice constant of the α′ phase experienced a slight drop and then an increase, bottoming out at the heating temperature of 800 °C. At the heating temperature of 800 °C, the lattice difference between α′ and α is only 0.0638 Å. These results are consistent with the energy-filtered TEM and HRTEM investigation that show that α and α′ phase is semi-coherent and the lattice differs by only 0.01 Å [20].
The reason for the lattice difference of the α′ phase is primarily due to the atomic solid solution; the missing atoms in the lattice or atom with a small atomic radius replace the larger one. In the chemical composition of Fe-25Cr-5Al-RE, a small amount of Ti was used to trap the carbon and nitrogen element [1]. In the Fe-25Cr-5Al-RE alloy, the atom radius of the primary elements (iron, chromium, and aluminum) is 194, 189, and 184 pm, respectively. Considering the metal bonding in the α′ phase, the reduction of the lattice constant of the α′ phase may be due to the dissolving of more chromium and aluminum elements or the missing atoms in the α′ lattice.
It is worth noting the phenomenon that the relative intensity bias can be observed in the rolled and heat-treated Fe-25Cr-5Al-RE wire rod, especially in the diffraction peaks of {110} and {200}; this is due to the preferred orientation. For the fiber symmetry of the Fe-25Cr-5Al-RE wire rod along the axial direction, preferred orientation correction can be used to correct the diffraction bias to reveal the texture (Figure 3). Generally, texture correction is the last step to refine the preferred orientation strength. After refining the background, lattice, scale factor, and the profile function of each diffraction peak, the generalized spherical harmonics (lmax = 8), one of the commonly used functions, is used to determine the preferred orientation index from the whole Rietveld refinement and quantitative texture analysis, regarding the reliability of the formulations and their use in correcting intensity bias for the preferred orientation. Thus, the preferred orientation of the rolled and heat-treated Fe-25Cr-5Al-RE samples can be fully described by the set of harmonic coefficients Clmn determined from Rietveld refinement with GSH description (Table 2). The general trend of the harmonic coefficients C41 is consistent with the lattice of the α′ phase.
Regarding the diffraction peak of the α′ phase, only {110} plane is obvious in the rolled and heat-treated specimens. It is the typical phenomenon of lacking statics in terms of the number of irradiated planes. The enhancement of {110} peak in the Bragg–Brentano diffraction geometry may be due to the enforcement of {110} plane.

3.2. SEM Analysis

A scanning electron microscope (SEM) was employed to characterize the rolled and annealed Fe-25Cr-5Al-RE wire rods to provide an insight into the morphology of the α and α′ phases. As shown in Figure 4a and Figure 5a, there are no apparent precipitates in the SEM image of the rolled Fe-25Cr-5Al-RE sample. With the sample heat treated at 600 °C (Figure 4b and Figure 5b), the lamellar precipitates in the fishbone can be observed along the grain boundary. When heat-treated at 700 °C (Figure 4c and Figure 5c), the lamellar structure is discontinuously distributed in the grain boundary when compared with the sample at 600 °C. With the energy dispersive spectrometer analysis, the most used technique for semi-quantitative analysis, the typical precipitates in the lamellar structure are rich in chromium element. The precipitates in lamellar structure may be the α′ phase due to its Cr-rich behavior.
When the heating temperature increased to 800 °C (Figure 4d and Figure 5d), no visible precipitates in the lamellar structure could be detected. Yet, the round precipitates (marked with red arrows) in a few microns can be observed both in the grain and along the grain boundary. When heat-treated at 900 °C, the number of micro-sized precipitates was less than that at 800 °C. As confirmed by the EDS technique, the typical micro-sized precipitates in sphere morphology were also rich in chromium elements but continued to have more aluminum elements. As shown in Figure 4f and Figure 5f, there were no apparent precipitates in the lamellar structure and micro-sized sphere when heat-treated at 1000 °C. The large precipitates (mark in TiN) with sharp edges can be reckoned as titanium nitride (TiN) [20].

3.3. TEM Analysis

To provide an insight into the Cr-rich precipitates, a transmission electron microscope (TEM) is used to characterize the rolled and heat-treated Fe-25Cr-5Al-RE wire rods. As shown in Figure 6a, there are few precipitates in the sub-grain or along the sub-grain boundary in the rolled Fe-25Cr-5Al-RE wire rods. When heat-treated at 600 °C (Figure 6b), there are continuous precipitates along the grain or sub-grain boundary. When heat-treated at 700 °C (Figure 6c), the number of precipitates along the grain boundary is less continuous than that at 600 °C. Compared with Fe-25Cr-5Al-RE wire rods heat-treated at 600 and 700 °C, there have been no visible continuous precipitates along the grain and sub-grain boundary when heat-treated at 800 and 900 °C. These are consistent with the conclusion of the SEM analysis. With the annealed temperature is set at 1000 °C, the precipitates are randomly distributed in the α phase matrix, thus rendering a significant amount of dislocation.
SAED patterns are especially valuable for the investigation of small crystals and partly disordered material on a scale of a few hundred Angstrom units or less. Two-dimensional geometry information contained in selected area electron diffraction (SAED) pattern augmented with energy dispersive spectroscopy (EDS) data is employed to identify the precipitates in the heat-treated Fe-25Cr-5Al-RE wire rod, which renders the initial chemistry information and the reciprocal lattice of a candidate phase.
Two pole SAED patterns (Figure 7d,e) obtained from electron beam focalization reveal a predominance of the ordered diffraction spots; these are unambiguously associated with the Cr-rich phase (b). With the projection of the α′ phase in the smallest size, these two SAED patterns can be used to construct the three-dimensional structure of the candidate phase. The SAED patterns in Figure 7d,e can be indexed as [111] and [110] pole of α′ phase with space group (Im-3m, 229), respectively, whose constructed lattice cell is illustrated in Figure 7c. Two extra diffraction spots (marked in the yellow ring) lie between the central spot and (1–10) spot (marked in the red ring) in these two SAED patterns. This is the typical phenomenon of the ordered solid solution in the (1–10) plane. As the atomic scattering factor (fFe-fCr) is not equal to zero in the α′ phase, the forbidden diffraction spot marked in yellow 1/3(1–10) and 2/3(1–10) can be reflected as minor spots in the back focal plane. The ordered (1–10) plane may result in the enhanced {110} diffraction peak in the measured diffraction profiles.
High-resolution transmission electron microscopy (HRTEM) is used to understand the interface between the α and α′ phases at the level of the atomic resolution. The α′ phase is always oriented along [1 1 1] zone axis and is coherent with the a-Fe matrix. As shown in the HRTEM image in Figure 7f, there is a clear interface between the α and α′ phases. Due to the very important role in image processing and pattern recognition in analyzing periodicity and repeating units, the Fast Fourier transform pattern (Figure 8b) was transformed from HRTEM images in Figure 8a to reveal the reciprocal information. The reciprocal spots using FFT, seen in Figure 8b, are consistent with the SAED pattern of the α′ phase, showing the uniform structure in the α′ phase. With only (1–10) and (−110) unmarked, the inverse fast Fourier transform (IFFT) image was retransformed from the reciprocal space, as shown in Figure 8c. The one-dimensional (1–10) lattice fringe is traversing the α and α′ phases, showing the close interconnection on the atomic scale and unit cell. The Rietveld analysis shows that the average spacing of {110} plane for α and α′ phases heat-treated at 600 °C are 2.1661 and 2.0473 Å, respectively. The spacing difference of 0.1188 Å causes the interface to form several dislocations (marked in red arrows in Figure 8c).
The XRD results show that there are two main phases, the α and α′ phases, in the rolled and heat-treated Fe-25Cr-5Al-RE wire rod. Yet, in the SEM and TEM morphology of the rolled samples, there are no apparent precipitates. It can be inferred that the α′ phase has been dissolved into the α substrate. Yet, when heat-treated at 600 and 700 °C, the Cr-rich phase in the lamellar structure is found in the grain boundary. As confirmed by the TEM and EDS, the Cr-rich phase can be confirmed as the α′ phase having the same space group as the α phase. As confirmed by the SEM, the α′ phase is present in the lamellar structure. The smallest projection of the α′ phase in the TEM is its lateral cross-section. The surface of the lamellar α′ phase is dominated by the (110) plane, the closed-packed plane in the body-centered materials. In this case, the α′ phase in the lamellar structure has the lowest surface energy. In addition, the α′ phase is ordered in the (1–10) plane.
The precipitates are in a micro-sized sphere when heat-treated at 800 and 900 °C. Considering the rich chromium and aluminum, the micro-sized spherical precipitates are also the α′ phase. Compared with the lamellar α′ phase heat-treated at 600 and 700 °C, the micro-sized spherical precipitates contain more aluminum elements. Containing more chromium and aluminum elements with smaller atom radii, the lattice constant of α′ phase becomes smaller for the chromium and aluminum atoms replacing iron atoms. As Kabayashi has demonstrated, the dissolving of more aluminum elements serves to destabilize the α′ phase and allows for increased Cr solubility [21,22]. Compared with the lamellar α′ phase, the α′ phase in the spherical structure has more (110) planes, thus increasing the irradiated planes. As a result, the {110} diffraction peak is enhanced when heat-treated at 800 °C. When the heat-treated temperature is set at 1000 °C, the α′ phase has been dissolved into the α substrate again.

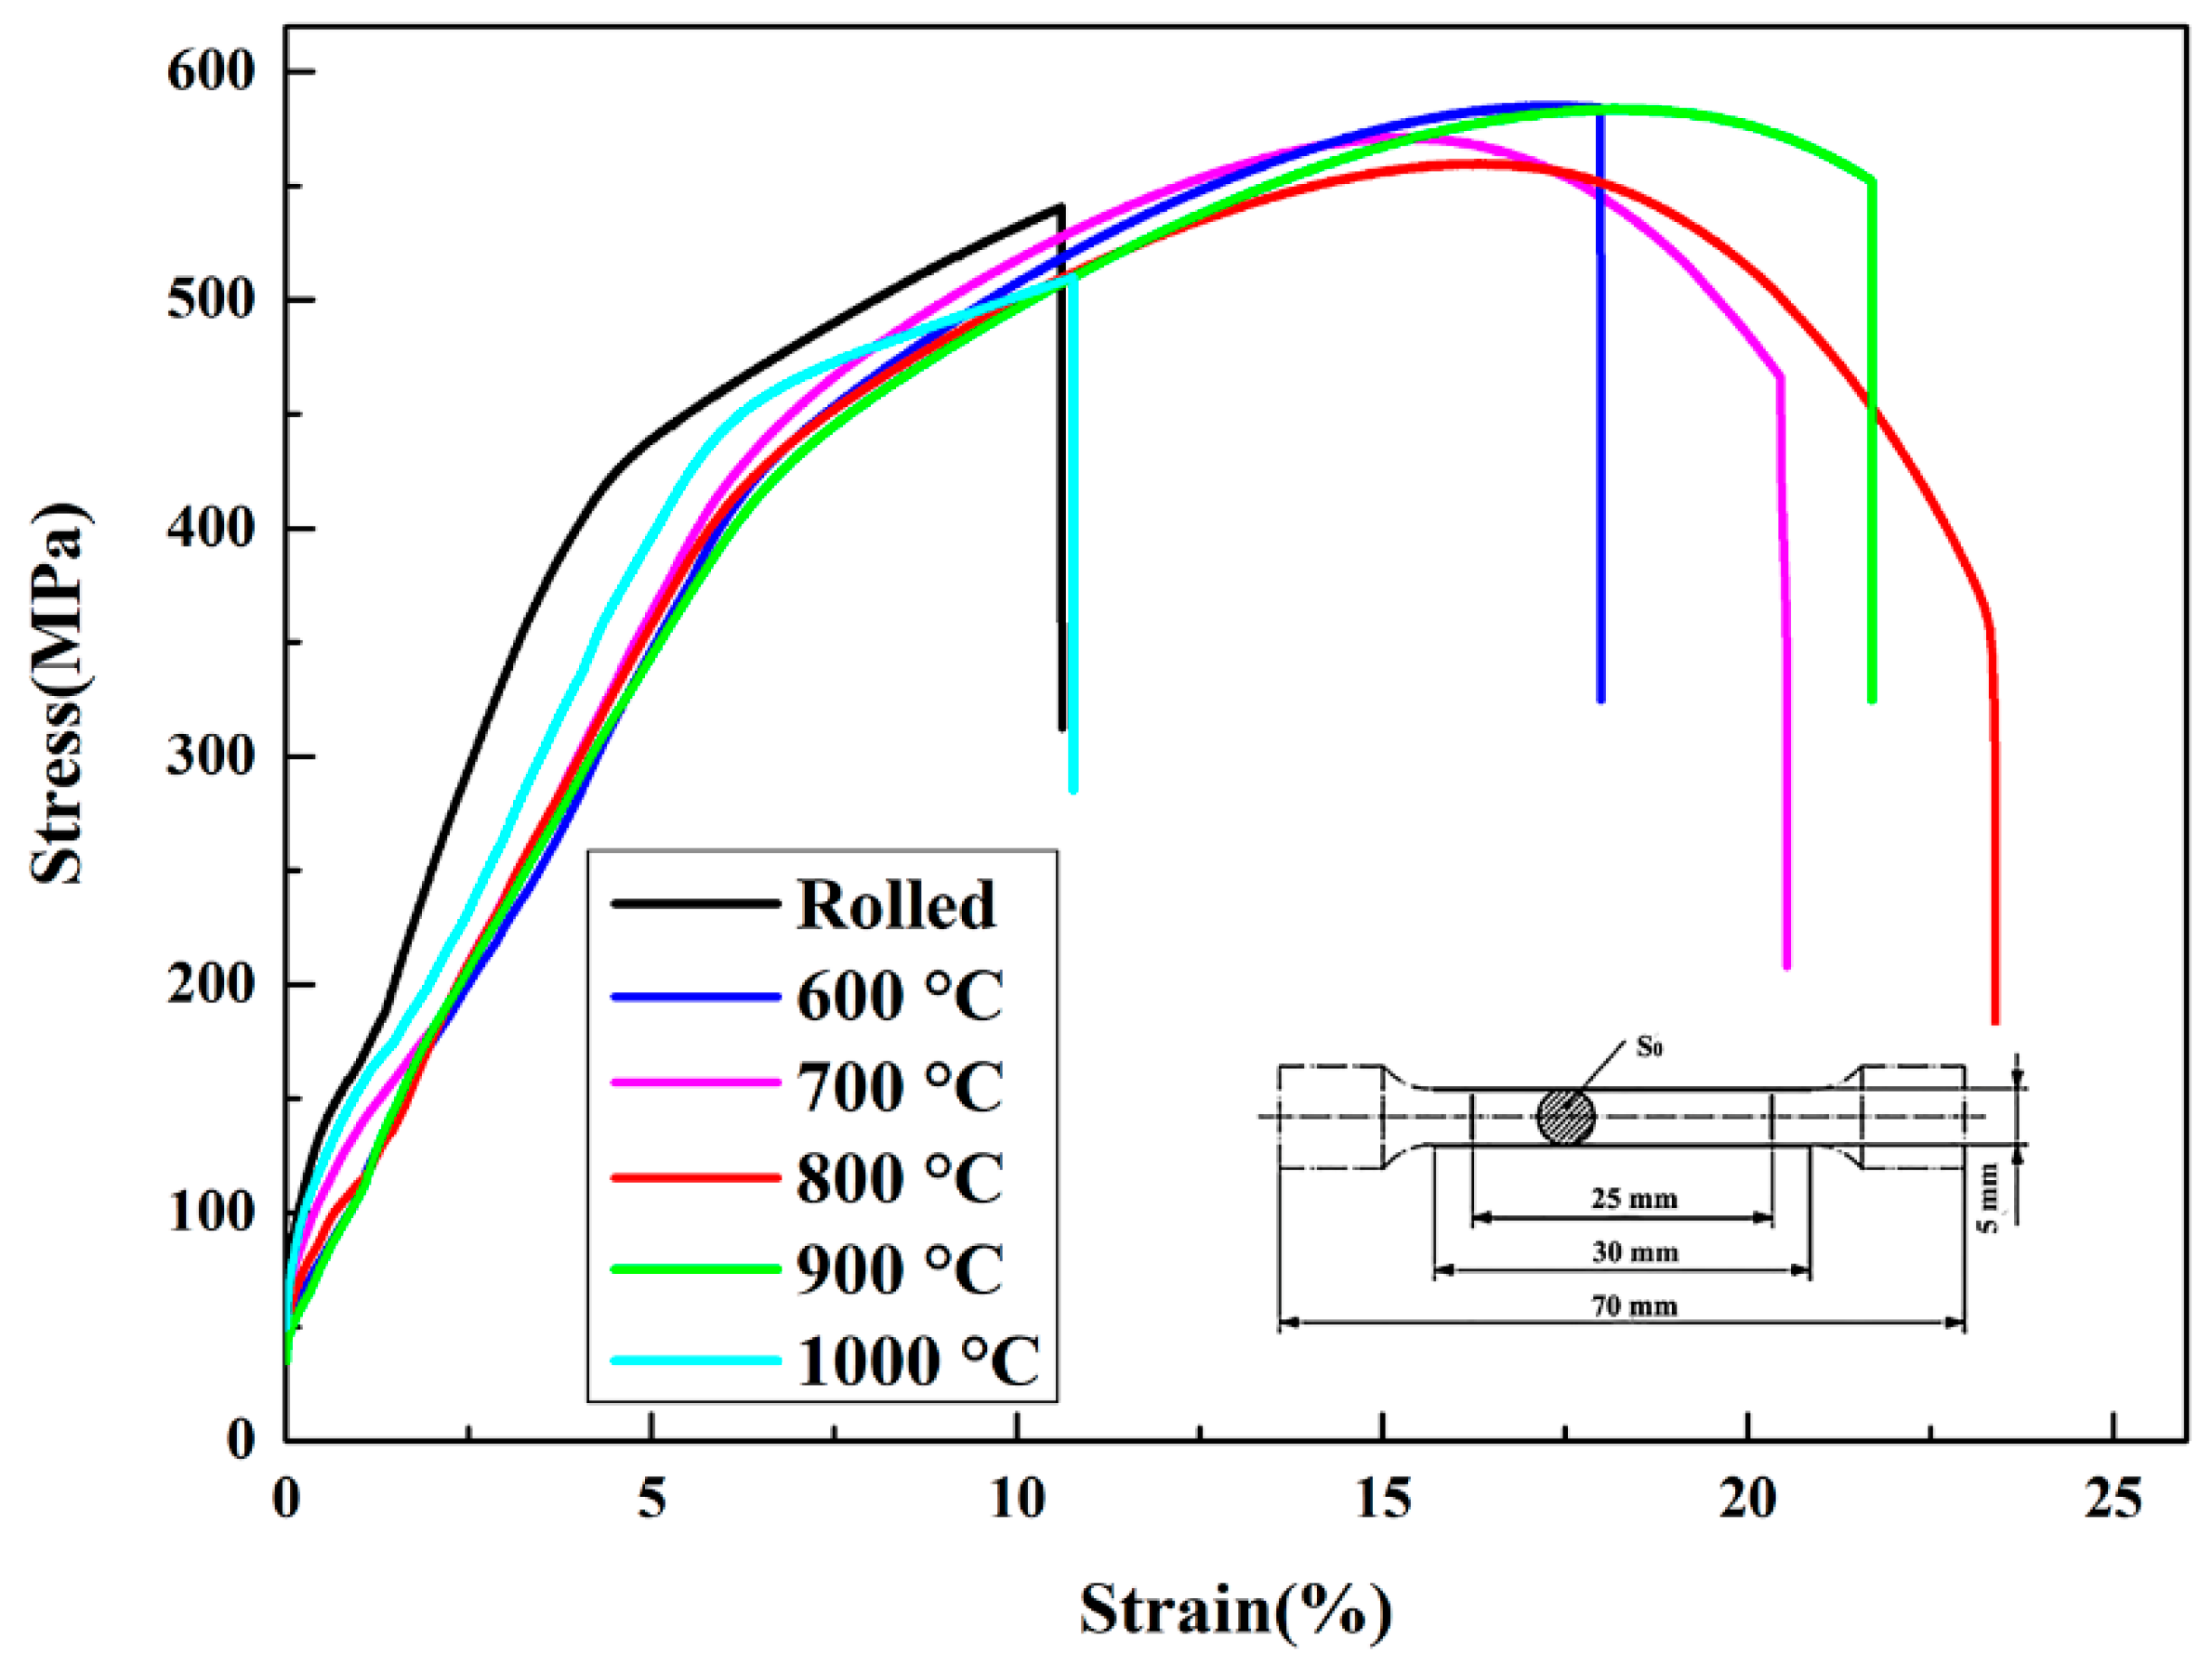
3.4. Mechanical Analysis and Discussion

Figure 9 shows the representative engineering stress-strain curves of the rolled and quenched Fe-25Cr-5Al-RE wire rod. The percentages of total elongation at fracture of the rolled and annealed Fe-25Cr-5Al-RE wire rods at 600, 700, 800, 900, and 1000 °C are 18.0%, 20.6%, 23.4%, 21.7%, and 10.7%, respectively. The percentage of total elongation at fracture (At) of the Fe-25Cr-5Al-RE wire rods varied with annealed temperature. With the quenched temperature increased from 600 to 1000 °C, the percentage of total elongation at fracture of the samples experience an increase followed by a drop, topped at 800 °C. The general trends of the percentage total elongation at fracture are anti-correlated with the lattice of the α′ phase and the generalized harmonic coefficients C41.
The α′ phase is distributed along the grain boundary or in the grain of the α phase. The less the difference in the lattice constant between the α and α′ phases, the better conjunction between the two phases, thus strengthening the Fe-25Cr-5Al-RE alloys. At the crystallite scale, the α′ phase has been dissolved into the α substance after hot-rolling [23,24]. When quenched at 600~900 °C, the α-(Fe, Cr) ferrite phase is separated into Fe-rich ferrite (α) and Cr-rich chromium ferrite (α′) phases. The α-α′ phase separation induces a stress field (misfit between the α and α′ phases) that hinders dislocations from propagating. At the heating temperature of 600 and 700 °C, the α′ phase is in a lamellar structure and distributed along the grain boundary, enclosed by the lowest surface energy (110). When quenched at 800 and 900 °C, the α′ phase is present with spherical morphology but distributed both in the grain and along the grain boundary.

4. Conclusions

The effect heating temperature on α-α′ miscibility and separation in Fe-25Cr-5Al-RE alloy was investigated in this paper. The XRD and related Rietveld refinements show that with the increase of the heating temperature from 600 to 1000 °C, the lattice constant of α′ phase experienced a slight drop and then an increase, as well as harmonic coefficients, bottoming out at the heating temperature of 800 °C, which induces a stress field between the α and α′ phases. The percentage total elongation at fracture is anti-correlated with the lattice of the α′ phase and the generalized harmonic coefficients C41.

Author Contributions

T.L., Manuscript; Y.L., funding acquisition and editing; S.C., data curation and analysis; C.L., Supervision. All authors have read and agreed to the published version of the manuscript.

Funding

This work was supported by the fundamental research program of Shanxi Province 20210302124310.

Data Availability Statement

Data available on request from the authors.

Conflicts of Interest

The authors declare no conflict of interest.

References

  1. Capdevila, C.; Aranda, M.M.; Rementeria, R.; Chao, J.; Urones-Garrote, E.; Aldazabal, J.; Miller, M.K. Strengthening by intermetallic nanoprecipitation in Fe–Cr–Al–Ti alloy. Acta Mater. 2016, 107, 27. [Google Scholar] [CrossRef] [Green Version]
  2. He, Y.; Liu, J.; Qiu, S.; Deng, Z.; Yang, Y.; McLean, A. Microstructure and high temperature mechanical properties of as-cast FeCrAl alloys. Mater. Sci. Eng. A. Struct. Mater. Prop. Microstruct. Process. 2018, 726, 56. [Google Scholar] [CrossRef]
  3. Liu, Z.; Han, Q.; Guo, Y.; Lang, J.; Shi, D.; Zhang, Y.; Du, S. Development of interatomic potentials for Fe-Cr-Al alloy with the particle swarm optimization method. J. Alloy. Compd. 2019, 780, 881. [Google Scholar] [CrossRef]
  4. Nagahama, K.; Miki, I. Precipitation during Recrystallization in Al–Mn and Al–Cr Alloys. Trans. Jpn. Inst. Met. 1974, 15, 185. [Google Scholar] [CrossRef] [Green Version]
  5. Nagahama, K.; Miki, I. Precipitation during recrystallization in Al-Cr alloys. J. Jpn. Inst. Light Met. 1974, 24, 77. [Google Scholar] [CrossRef]
  6. Malerba, G.B.T. On the α–α′ miscibility gap of Fe–Cr alloys. Scr. Mater. 2008, 59, 1193. [Google Scholar]
  7. Rank, M.; Franke, P.; Hoffmann, J.; Seifert, H.J. Experimental investigation of phase equilibria in the Al–Cr–Fe system. Calphad 2019, 66, 101638. [Google Scholar] [CrossRef]
  8. Qu, H.P.; Lang, Y.P.; Yao, C.F.; Chen, H.T.; Yang, C.Q. The effect of heat treatment on recrystallized microstructure, precipitation and ductility of hot-rolled Fe–Cr–Al–REM ferritic stainless steel sheets. Mater. Sci. Eng. A 2013, 562, 9. [Google Scholar] [CrossRef]
  9. Lu, H.H.; Guo, H.K.; Liang, W.; Shen, X.Q. The precipitation behavior and its effect on mechanical properties of cold-rolled super-ferritic stainless steels during high-temperature annealing. J. Mater. Res. Technol. 2021, 8, 1171. [Google Scholar] [CrossRef]
  10. Yang, Z.; Wang, Z.X.; Xia, C.H.; Ouyang, M.H.; Peng, J.C.; Zhang, H.W.; Xiao, X.S. Aluminum suppression of α′ precipitate in model Fe–Cr–Al alloys during long-term aging at 475 °C. Mater. Sci. Eng. A 2019, 772, 138714. [Google Scholar] [CrossRef]
  11. Kim, H.; Subramanian, G.O.; Kim, C.; Jang, H.; Jang, C. 400 °C aging embrittlement of FeCrAl alloys: Microstructure and fracture behavior. Mater. Sci. Eng. A 2018, 743, 159. [Google Scholar] [CrossRef]
  12. Capdevila, C.; Miller, M.K.; Russell, K.F. Aluminum partitioning during phase separation in Fe–20%Cr–6%Al ODS alloy. J. Mater. Sci. 2008, 43, 3889. [Google Scholar] [CrossRef] [Green Version]
  13. Zhang, Y.; Sun, H.; Wang, H.; Wang, X.; An, X.; He, K. Effects of Cr element on the crystal structure, microstructure, and mechanical properties of FeCrAl alloys. Mater. Sci. Eng. A 2021, 826, 142003. [Google Scholar] [CrossRef]
  14. Li, T.; Dang, N.; Zhang, W.; Liang, W.; Yang, F. Determining the Degree of [001] Preferred Growth of Ni(OH)2 Nanoplates. Nanomaterials 2018, 8, 991. [Google Scholar] [CrossRef] [PubMed] [Green Version]
  15. Rietveld, H.M. A profile refinement method for nuclear and magnetic structures. J. Appl. Crystallogr. 1969, 2, 65. [Google Scholar] [CrossRef]
  16. Wenk, H.R.; Matthies, S.; Lutterotti, L. Texture Analysis from Diffraction Spectra. Mater. Sci. Forum 1994, 157–162, 473. [Google Scholar]
  17. Sitepu, H.; O’Connor, B.H.; Li, D. Comparative evaluation of the March and generalized spherical harmonic preferred orientation models using X-ray diffraction data for molybdite and calcite powders. J. Appl. Crystallogr. 2005, 38, 158. [Google Scholar] [CrossRef]
  18. Li, T.; Zheng, L.W.; Zhang, W.G. Determining the Preferred Orientation of Silver-Plating via X-ray Diffraction Profile. Nanomaterials 2021, 11, 2417. [Google Scholar] [CrossRef]
  19. Tarafder, K.; Ghosh, S.; Sanyal, B.; Eriksson, O.; Mookerjee, A.; Chakrabarti, A. Electronic and magnetic properties of disordered Fe–Cr alloys using different electronic structure methods. J. Phys. Condens. Matter 2008, 20, 445201. [Google Scholar] [CrossRef]
  20. Bachhav, M.; Odette, G.R.; Marquis, E.A. α′ precipitation in neutron-irradiated Fe–Cr alloys. Scr. Mater. 2014, 74, 48. [Google Scholar] [CrossRef]
  21. Beraldo, C.H.; Calderón-Hernández, J.W.; Magnabosco, R.; Alonso-Falleiros, N. Effect of Aging Heat Treatment H950 and H1000 on Mechanical and Pitting Corrosion Properties of UNS S46500 Stainless Steel. Mater. Res. 2018, 22, 1. [Google Scholar] [CrossRef]
  22. Kobayashi, S.; Takasugi, T. Mapping of 475 °C embrittlement in ferritic Fe–Cr–Al alloys. Scr. Mater. 2010, 63, 1104–1107. [Google Scholar] [CrossRef]
  23. Bonny, G.; Erhart, P.; Caro, A.; Pasianot, R.C.; Malerba, L.; Caro, M. The influence of short range order on the thermodynamics of Fe-Cr alloys. Model. Simul. Mater. Sci. Eng. 2009, 17, 25006. [Google Scholar] [CrossRef]
  24. Ejenstam, J.; Thuvander, M.; Olsson, P.; Rave, F.; Szakalos, P. Microstructural stability of Fe–Cr–Al alloys at 450–550 °C. J. Nucl. Mater. 2015, 457, 291. [Google Scholar] [CrossRef] [Green Version]
Figure 1. Schematic graph of heat treatment procedure.
Metals 13 00597 g001
Figure 2. XRD profiles of the rolled and heat-treated Fe-25Cr-5Al-RE wire rod. The letters α and α′ denote ferrite and chromium, respectively.
Metals 13 00597 g002
Figure 3. The agreement between measured and calculated XRD profile for the rolled and annealed Fe-25Cr-5Al-RE wire rods following Rietveld refinement with generalized spherical harmonics description (GSH) for preferred orientation correction. (a): rolled; (b): 600 °C; (c): 700 °C; (d): 800 °C; (e): 900 °C; (f): 1000 °C.
Metals 13 00597 g003
Figure 4. Typical SEM images (low magnification) showing α phase morphology and precipitates in the rolled and heat-treated Fe-25Cr-5Al-RE wire rod. (a): rolled; (b): 600 °C; (c): 700 °C; (d): 800 °C; (e): 900 °C; (f): 1000 °C.
Metals 13 00597 g004
Figure 5. Typical SEM images (High magnification) showing α phase morphology and typical precipitates in the rolled and heat-treated Fe-25Cr-5Al-RE wire rod. (a): rolled; (b): 600 °C; (c): 700 °C; (d): 800 °C; (e): 900 °C; (f): 1000 °C.
Metals 13 00597 g005
Figure 6. TEM morphology of rolled and heat-treated Fe-25Cr-5Al-RE wire rods at 600~1000 °C for 60 min. (a): rolled; (b): 600 °C; (c): 700 °C; (d): 800 °C; (e): 900 °C; (f): 1000 °C.
Metals 13 00597 g006
Figure 7. (a): Typical TEM-BF image of the Cr-rich precipitate along the grain boundary in the annealed Fe-25Cr-5Al-RE wire rod at 600 °C, where a hole was formed because of irradiation by the converged incident electron beam. (b): EDS results from the area around the hole in (a). (c): The constructed α′ phase lattice. (d,e): Indexing the SAED patterns from the precipitates along the grain boundary. (f): High-resolution TEM images of the precipitate in the rectangle in (a) along [110] axis.
Metals 13 00597 g007
Figure 8. (a) A square section of HRTEM image from Figure 7f; (b) The fast Fourier transform (FFT) pattern of (a); (c): The inverse fast Fourier transform (FFT) image with marked all the reciprocal space except (1–10) and (−110) marked in red rings.
Metals 13 00597 g008
Figure 9. Engineering stress-strain curves for rolled and heat treated at 600~1000 °C of Fe-25Cr-5Al-RE wire rods.
Metals 13 00597 g009
Table 1. The chemical composition of Fe-25Al-5Al (wt%).
CSiMnPSCrAlTiRE(La)N
0.0180.230.110.0140.00124.185.460.120.0530.001
Table 2. Refined lattice constant and preferred orientation index for generalized harmonic index (GSH).
Rietveld ResultsRolled6007008009001000
Lattice constantChromium iron(Å)3.01273.06332.98842.95402.99903.0656
Ferrite(Å)2.89172.89532.88802.89022.89142.8938
Lattice difference(Å)0.12100.16800.10040.06380.10760.1718
Preferred orientation (Ferrite)Generalized harmonic coefficients(Clmn)C4110.511.175.04−1.8591.562.41
C61−5.40−3.58−0.831.9884.641.51
C81−4.06−2.432.203.7847.095.90
Disclaimer/Publisher’s Note: The statements, opinions and data contained in all publications are solely those of the individual author(s) and contributor(s) and not of MDPI and/or the editor(s). MDPI and/or the editor(s) disclaim responsibility for any injury to people or property resulting from any ideas, methods, instructions or products referred to in the content.

