Article

High-Throughput Investigation of Multiscale Deformation Mechanism in Additively Manufactured Ni Superalloy

1
Department of Materials Science and Engineering, University of North Texas, Denton, TX 76207, USA
2
Advanced Materials and Manufacturing Processes Institute, University of North Texas, Denton, TX 76207, USA
3
Department of Mechanical Engineering, University of North Texas, Denton, TX 76207, USA
4
Research & Development Group, Hitachi Ltd., Ibaraki 319-1292, Japan
5
Research & Development Division, Hitachi America Ltd., Farmington Hills, MI 48335, USA
*
Author to whom correspondence should be addressed.
Metals 2023, 13(2), 420; https://doi.org/10.3390/met13020420
Submission received: 4 January 2023 / Revised: 9 February 2023 / Accepted: 14 February 2023 / Published: 17 February 2023
(This article belongs to the Special Issue Deformation of Metals and Alloys: Theory, Simulations and Experiments)

Abstract

:
In this paper, Inconel 718 (IN718) superalloy was processed by laser powder-bed fusion additive manufacturing (L-PBFAM), followed by heat treatment. High-resolution nanoindentation was used to investigate the complex deformation mechanisms that occurred at various length scales in both conditions. The nanoindentation elastoplastic maps show a strong crystal orientation dependency of modulus and hardness, which is attributed to the high mechanical anisotropy of IN718. The hardness map effectively resolves complex microscale strength variation imparted due to the hierarchical heat distribution associated with the thermal cycles of L-PBFAM. The disproportionately high hardening effect of Nb, Mo-rich chemical segregations and Laves phases in dendritic structures is also observed. The heat treatment resulted in a 67% increase in yield strength (from 731 MPa in the L-PBFAM condition to 1217 MPa in the heat-treated condition) due to the activation of multiple precipitation-strengthening mechanisms. The nanoindentation mapping of a heat-treated sample delineates the orientation-dependent hardness distribution, which apart from high mechanical anisotropy of the alloy, is also contributed to by a high degree of coherency strengthening of the D022 γ″-precipitates oriented parallel to the <001> crystal plane of the γ-matrix. The mean hardness of the sample increased from 13.3 GPa to 14.8 GPa after heat treatment. Evidence of extensive deformation of twin networks and dislocation cells was revealed by transmission electron microscopy of the deformed region under the nanoindentation tip.

1. Introduction

The Ni-based superalloy, Inconel 718 (IN718), is a popular material choice for aerospace industries due to its excellent structural stability and performance at extreme operational temperatures [1]. Many intricate aerospace components, such as turbine blades, cooling channels, and discs made from IN718, require high geometrical accuracy, which is difficult and expensive to achieve via the traditional subtractive or forming manufacturing processes. Rapid tool wear, high chatter, and low thermal conductivity associated with the machining of IN718 are some of the difficulties that are alluded to above [2]. Alternatively, additive manufacturing (AM) is highly productive for developing such complex geometrical shapes with near-net accuracy for high-strength engineering materials [3,4]. The excellent printability of IN718 has led to AM being a breakthrough manufacturing process for it. In addition, AM allows a wide range of microstructural control to achieve the best combination of desired mechanical and functional properties. Among the various AM techniques, laser powder-bed fusion additive manufacturing (L-PBFAM) has gained popularity due to its better process control, improved mechanical outcome and reduced processing defects. Wang et al. [5] made one of the earliest attempts to print IN718 by L-PBFAM, establishing the processing window and setting the benchmarks for the microstructure control of IN718 using L-PBFAM. Numerous manufacturing-structure-properties correlative studies aimed at improving the mechanical properties via optimal L-PBFAM of IN718 have been subsequently reported [6,7,8,9,10].
Heat treatment has been applied to the L-PBFAM of IN718 to enhance its mechanical strength further. The heat-treated IN718 derives its mechanical properties from a complex multimodal precipitation-strengthening phenomenon [11]. Primary strengthening phases are intermetallic-like face-centered cubic (f.c.c.) L12 γ′-Ni3(Al,Ti,Nb) and body-centered tetragonal D022 γ″-Ni3Nb. They are ordered coherent phases and possess a lattice misfit of 0.407% (for the γ′-phase) and 2.86% (for the γ″ phase) with the f.c.c. γ-matrix. The coherency strengthening mechanisms via shearing of the γ′ and γ″ particles by a pair of glide dislocations are dominant over ordered strengthening because of the anti-phase boundaries (APB) [12]. MX-type carbides and nitrides, such as f.c.c. (Nb,Ti)(C,N) also contribute positively to IN718’s strengthening [11,13]. The γ″-phase is the principal strengthening phase, while γ′ and MX carbide are moderate strengtheners. On the other hand, the incoherent, topologically close-packed intermetallic-like orthorhombic D0a δ-Ni3(Nb,Ti), hexagonal C14 Laves (Ni,Fe,Cr)2(Nb,Mo,Ti) phase, and tetragonal D8b σ-CrFe phase promote embrittlement and often cause premature catastrophic failure [14].
High thermal gradients during L-PBFAM result in non-equilibrium solidification, promoting micro-segregation of heavy elements, such as Nb and Mo, resulting in the formation of the Laves phase and low solubility elements such as C, leading to the formation of carbides. The investigation by Mantri et al. [15] revealed a hierarchical phase distribution in the segregations comprising a γ′-rich core, with segregation boundaries decorated with γ″ or γ′/γ″ co-precipitates, and with inter-dendritic spaces rich in discrete Laves and MX-type carbides. Typically, multi-step heat-treatment strategies are adopted on the L-PBFAM of IN718 to dissolve the undesirable Laves phases, annihilate residual stresses, and simultaneously increase the volume fraction of desirable strengthening phases (mainly γ′ and γ″). A solution treatment at a temperature between 930–1070 °C for an hour effectively dissolves the embrittling Laves phases [6,16]. However, to preserve the strength-contributing microstructural signatures of L-PBFAM, solution treatment is preferred at the lower end of the temperature range, which results in the retention of δ-Ni3(Nb,Ti) and the prevention of grain growth during the subsequent stages of heat treatment. Note that this strategy risks overaging the coherent and metastable γ″- Ni3Nb phases to incoherent and stable δ-Ni3(Nb,Ti) phases, further compromising mechanical strength. Grain and cell boundaries provide active sites for such diffusion/solute-partitioning activities and primarily influence δ-phase distribution [17]. A big challenge in optimizing the post-heat treatment of L-PBFAM material is the probabilistic nature of their microstructure, which varies widely with processing conditions, equipment, and building atmosphere, all of which further challenge the standardization of heat treatment. While the microstructure resulting from L-PBFAM is probabilistic, the subsequent mechanical behavior is deterministic [18]. In this view, the micromechanical investigation is pivotal to establishing a link between the microstructure and mechanical behavior of such a complex material; to capture this probabilistic-deterministic duality. It is important to understand how these individual phases contribute to the material’s overall strength at various processing and heat-treatment conditions. Although the investigation of the precipitation phenomenon in L-PBFAM and heat-treated IN718 has been well-documented on a macroscale, the micromechanical impact of these phases has not been significantly discussed. In this context, a novel high-throughput microstructure-micromechanical correlative approach is proposed to investigate the precipitation-strengthening mechanism in L-PBFAM and heat-treated IN718. This methodology uses high-resolution nanoindentation spatial maps, macroscale tensile testing, scanning electron microscopy, and transmission electron microscopy. Thus far, high-resolution nanoindentation mapping has been used to characterize the phase-specific mechanical heterogeneity in the L-PBFAM Ti-6Al-4V and Al alloys [19,20] and conventionally manufactured IN718 [21,22]. This paper, for the first time, attempts to spatially map the micromechanical properties and provide insight into the complex precipitation strengthening in the L-PBFAM of IN718 before and after standard heat treatment.

2. Materials and Methods

Commercially available IN718 powder was procured from Sanyo Special Steel Co., Himeji, Japan. The powder size was certified by the supplier, and it ranged from 15 to 45 µm. The chemical composition of the powder, as specified by the supplier, is reported in Table 1. Cuboid blocks of the dimensions 150 mm (X) × 50 mm (Y) × 50 mm (Z) were printed using Hitachi’s L-PBFAM machine. A laser power of 420 W, a scan speed of 960 mm/s, a hatch spacing of 0.1 mm, a stripe size of 10 mm, a layer thickness of 0.04 mm per layer and 67° interlayer rotation were adopted. L-PBFAM was done in an inert N2 atmosphere maintained at 15 kPa, and the O2 concentration was limited to <4 ppm during the printing process. The above-mentioned printing condition was selected based on the literature data [23,24,25]. The AMS 2772 heat-treatment strategy [26] implemented involved three stages: (i) solution treatment at 954 °C for 1 h, followed by water cooling, (ii) aging treatment at 718 °C for 8 h, and (iii) furnace cooling to 621 °C for 18 h, followed by air cooling.
A mini-tensile machine equipped with a high-sensitivity load cell was used for the tensile test of L-PBFAM and the heat-treated samples. Miniaturized dog-bone specimens were tested with a gauge length, width, and thickness of 3 mm, 1 mm, and 1 mm, respectively. The tests were performed with a gauge length of the sample parallel and gauge width perpendicular to the build direction of the printed block (i.e., corresponding to the XZ plane). High-resolution nanoindentation mapping was performed using the FemtoTools FT-NMT04 nanomechanical system in the continuous stiffness measurement (CSM) mode. Indentation was completed in a displacement-controlled mode with a maximum depth of 100 nm. A diamond Berkovich tip was employed for the nanoindentation. An area of 150 μm × 150 μm was indented with an inter-indent spacing of 1 μm (to maintain 10 times the maximum depth). The high-throughput mapping was performed at a speed of 3 s/indent and comprised 40,000 indents covering several grains, second-phase particles, and segregation networks. Before nanoindentation, the sample was mechanically polished using a series of superfine emery papers, followed by vibratory polishing in a 0.02 μm colloidal silica solution.
Basic pool level and grain level microstructural characterizations were performed using a Wilson VH3100 light microscope and FEI Nova Nano scanning electron microscope (SEM), operating at 20 kV, respectively. Electron backscatter diffraction (EBSD) and immersion mode backscattered electron (BSE) scans were performed by the SEM. For the EBSD scan, the Hikari Super high-resolution acquisition system was utilized. Transmission electron microscopy (TEM) was performed using the FEI Tecnai G2 TF20 microscope operating at 200 keV for visualizing the fine precipitates and micro-segregation. Electron transparent foils for the TEM study were extracted using the FEI Nova 200 NanoLab dual-beam focused ion beam microscope equipped with the Omniprobe Pt-based gas injection system. An EBSD map of the entire nanoindented region was captured, and selective site-specific TEM analysis of the nanoindented zone with high hardness was also performed.

3. Results and Discussion

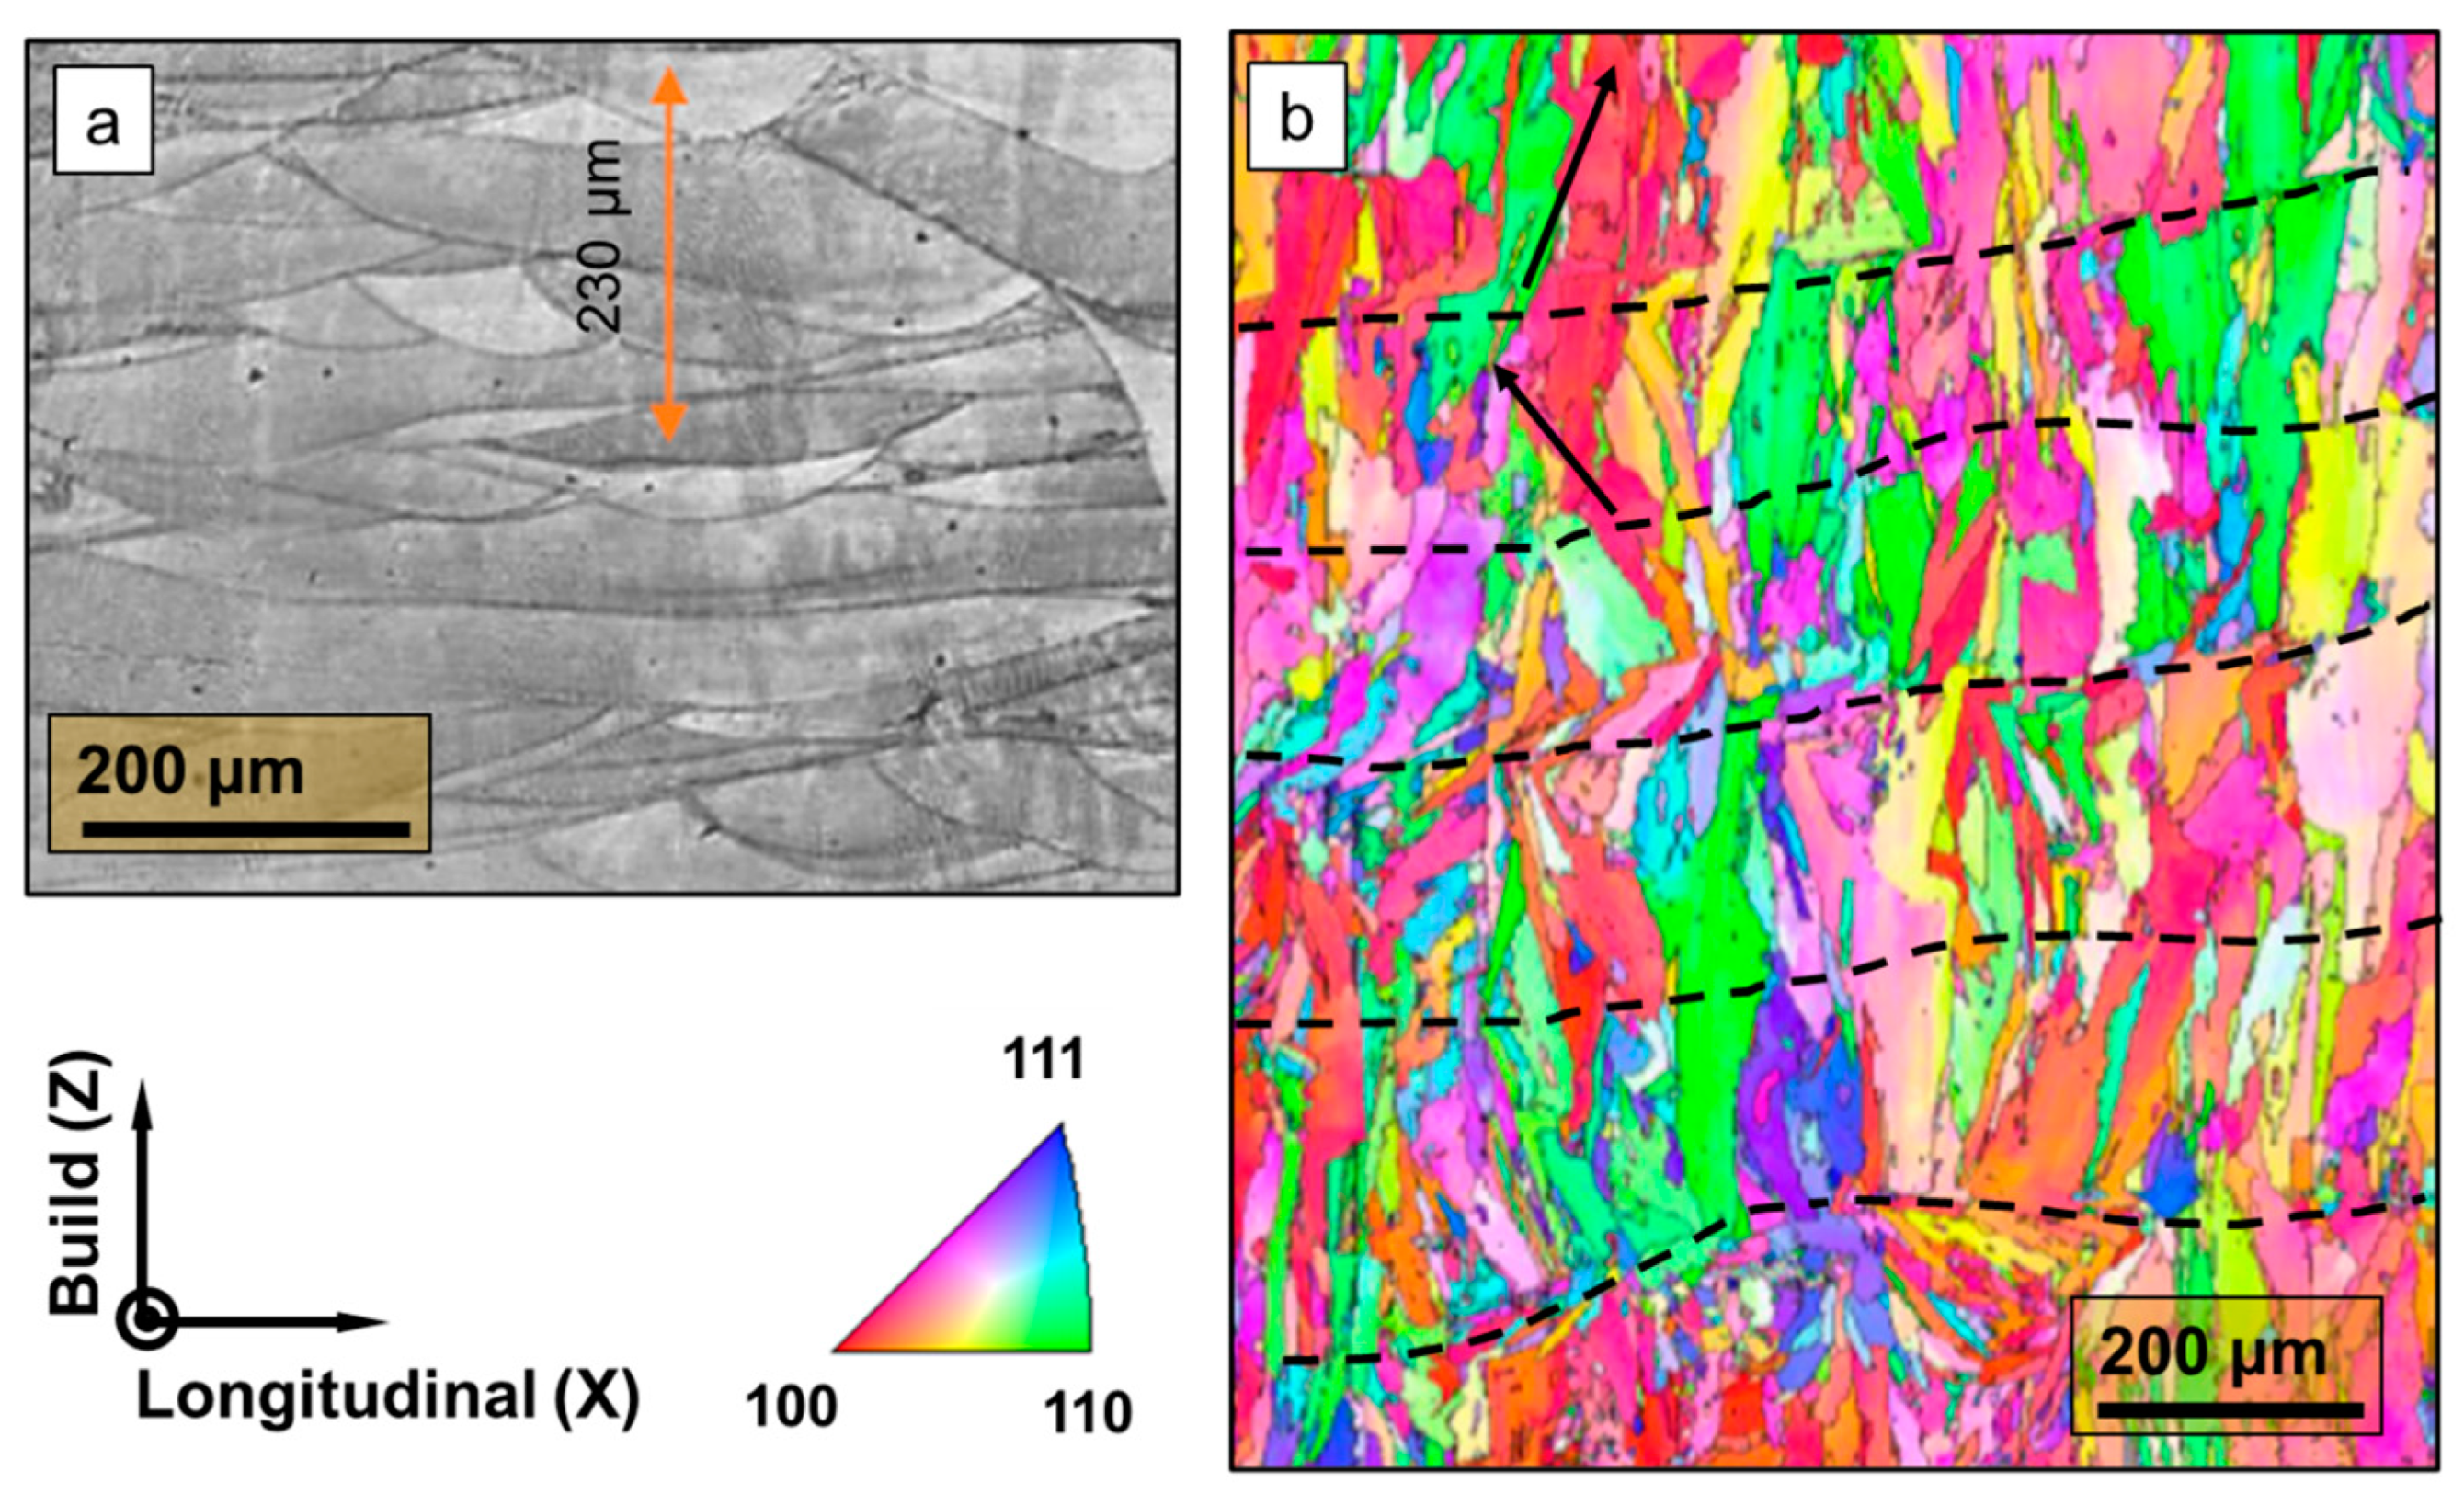
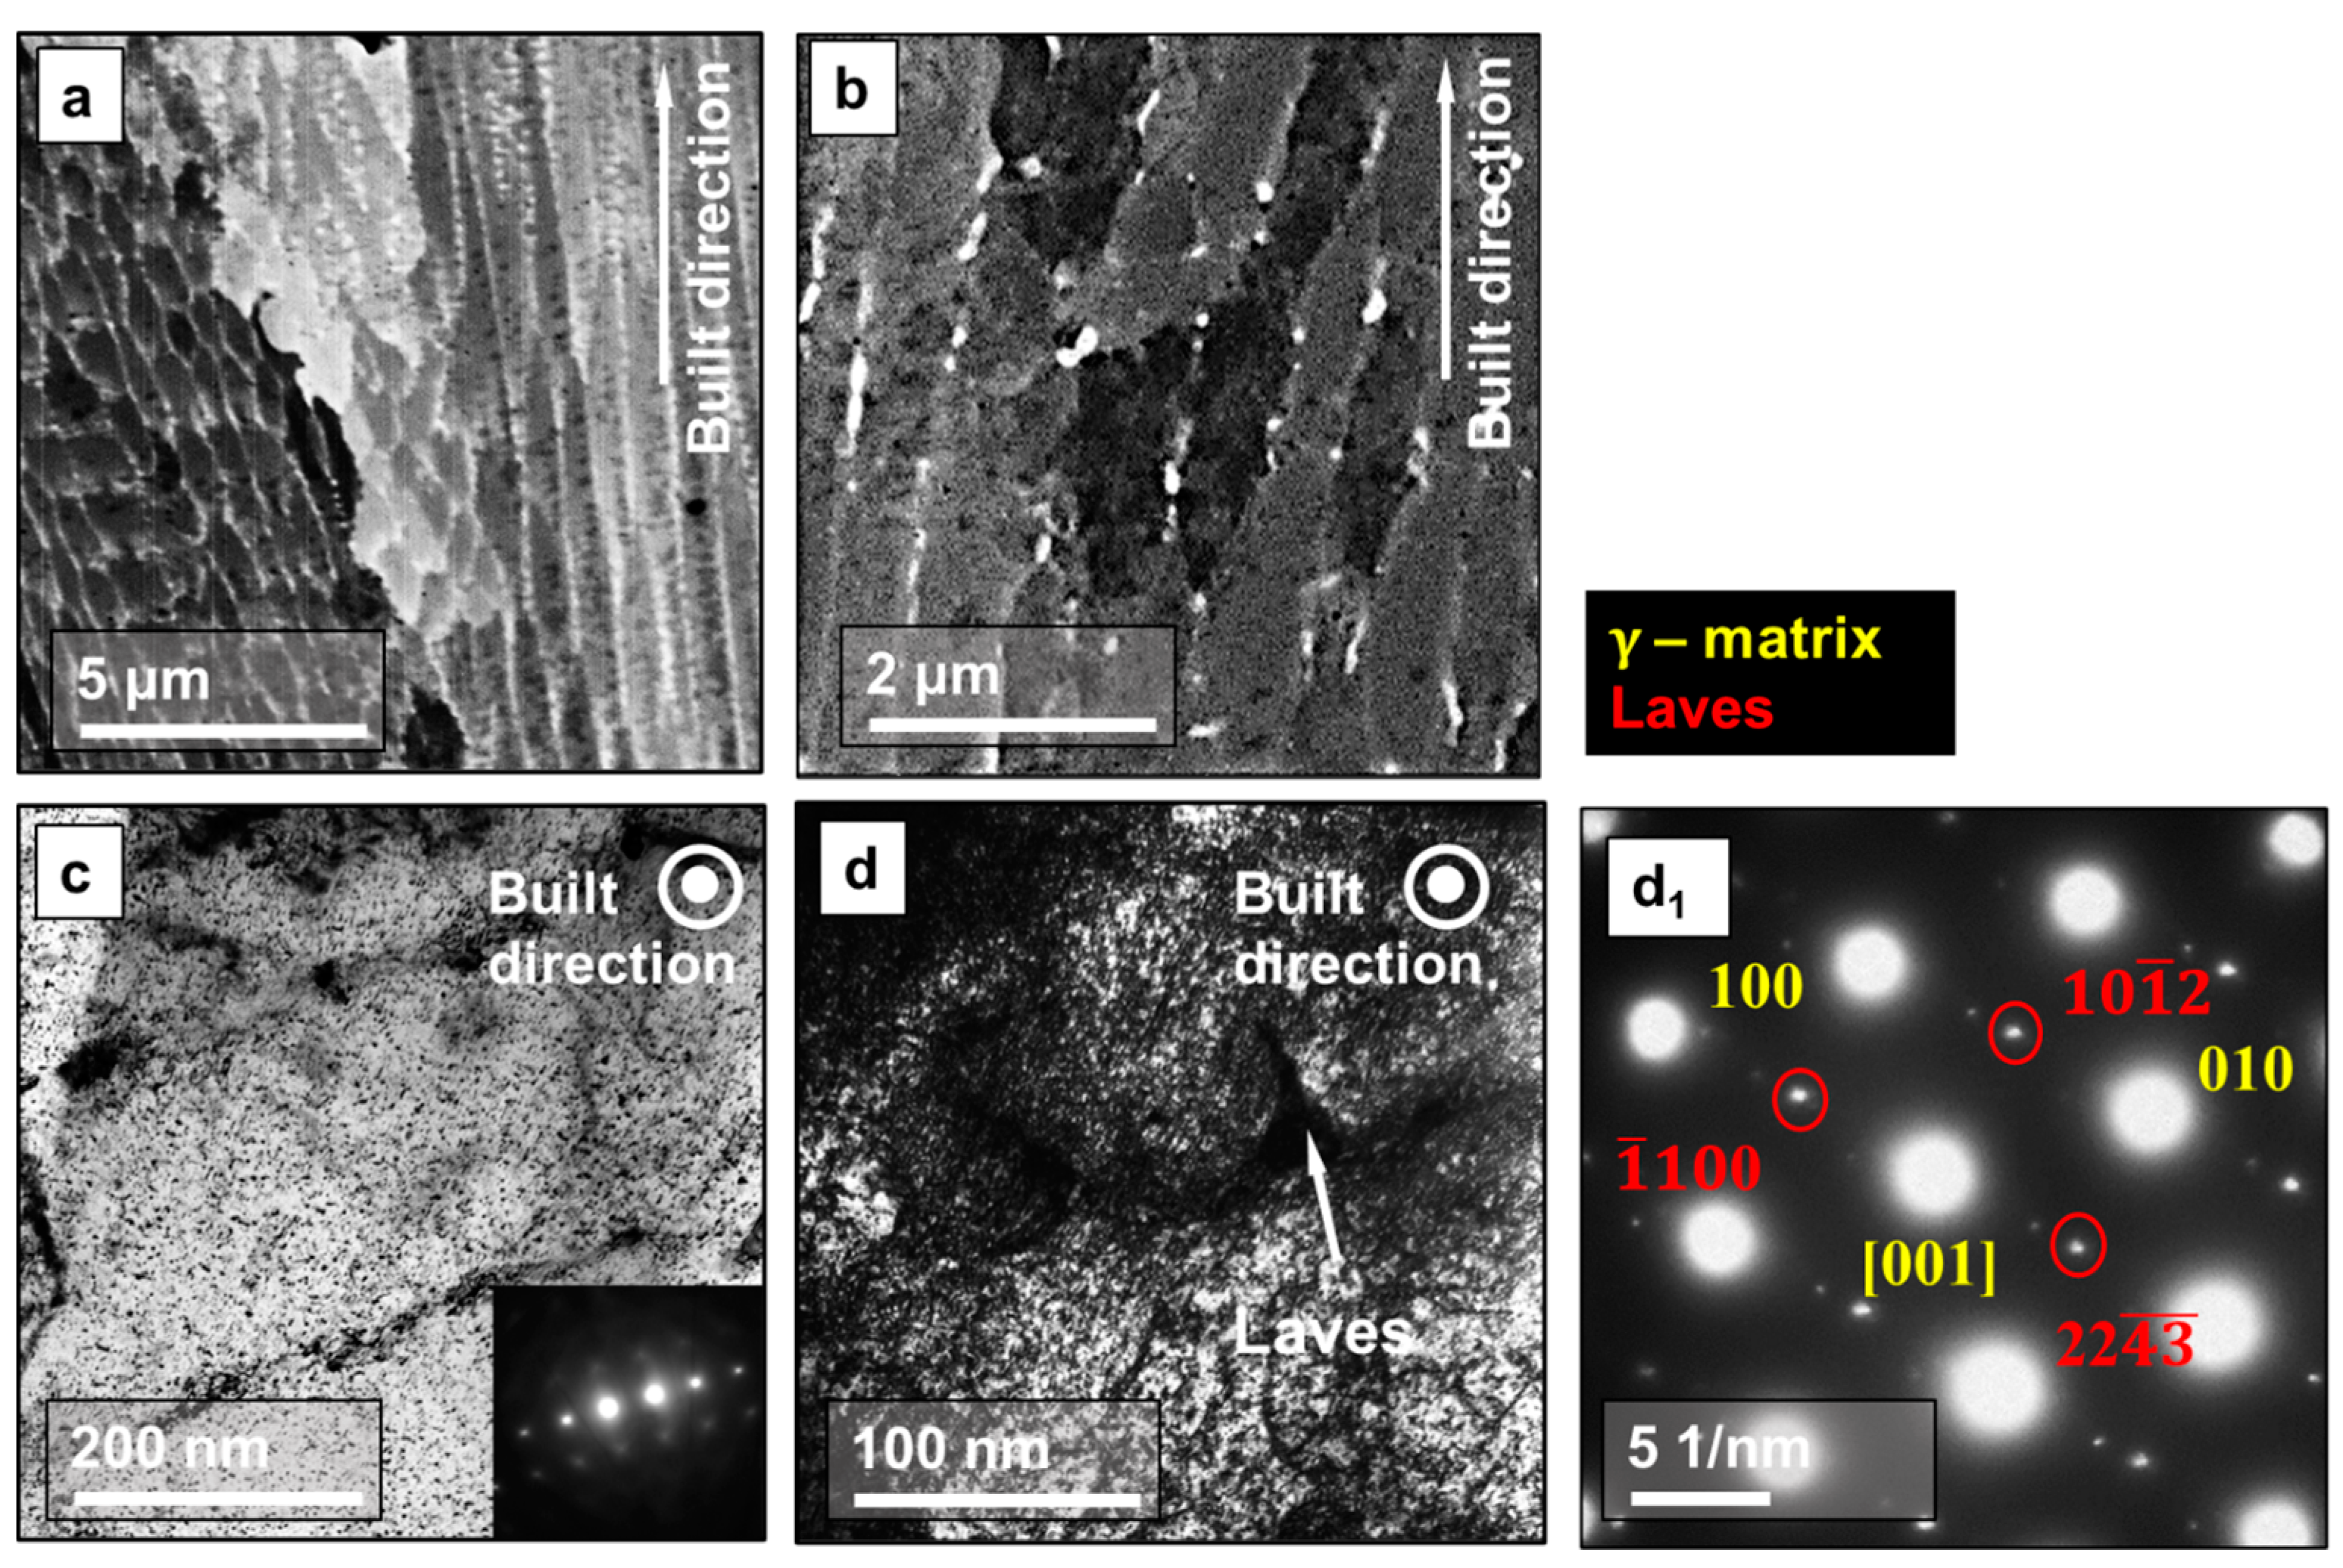
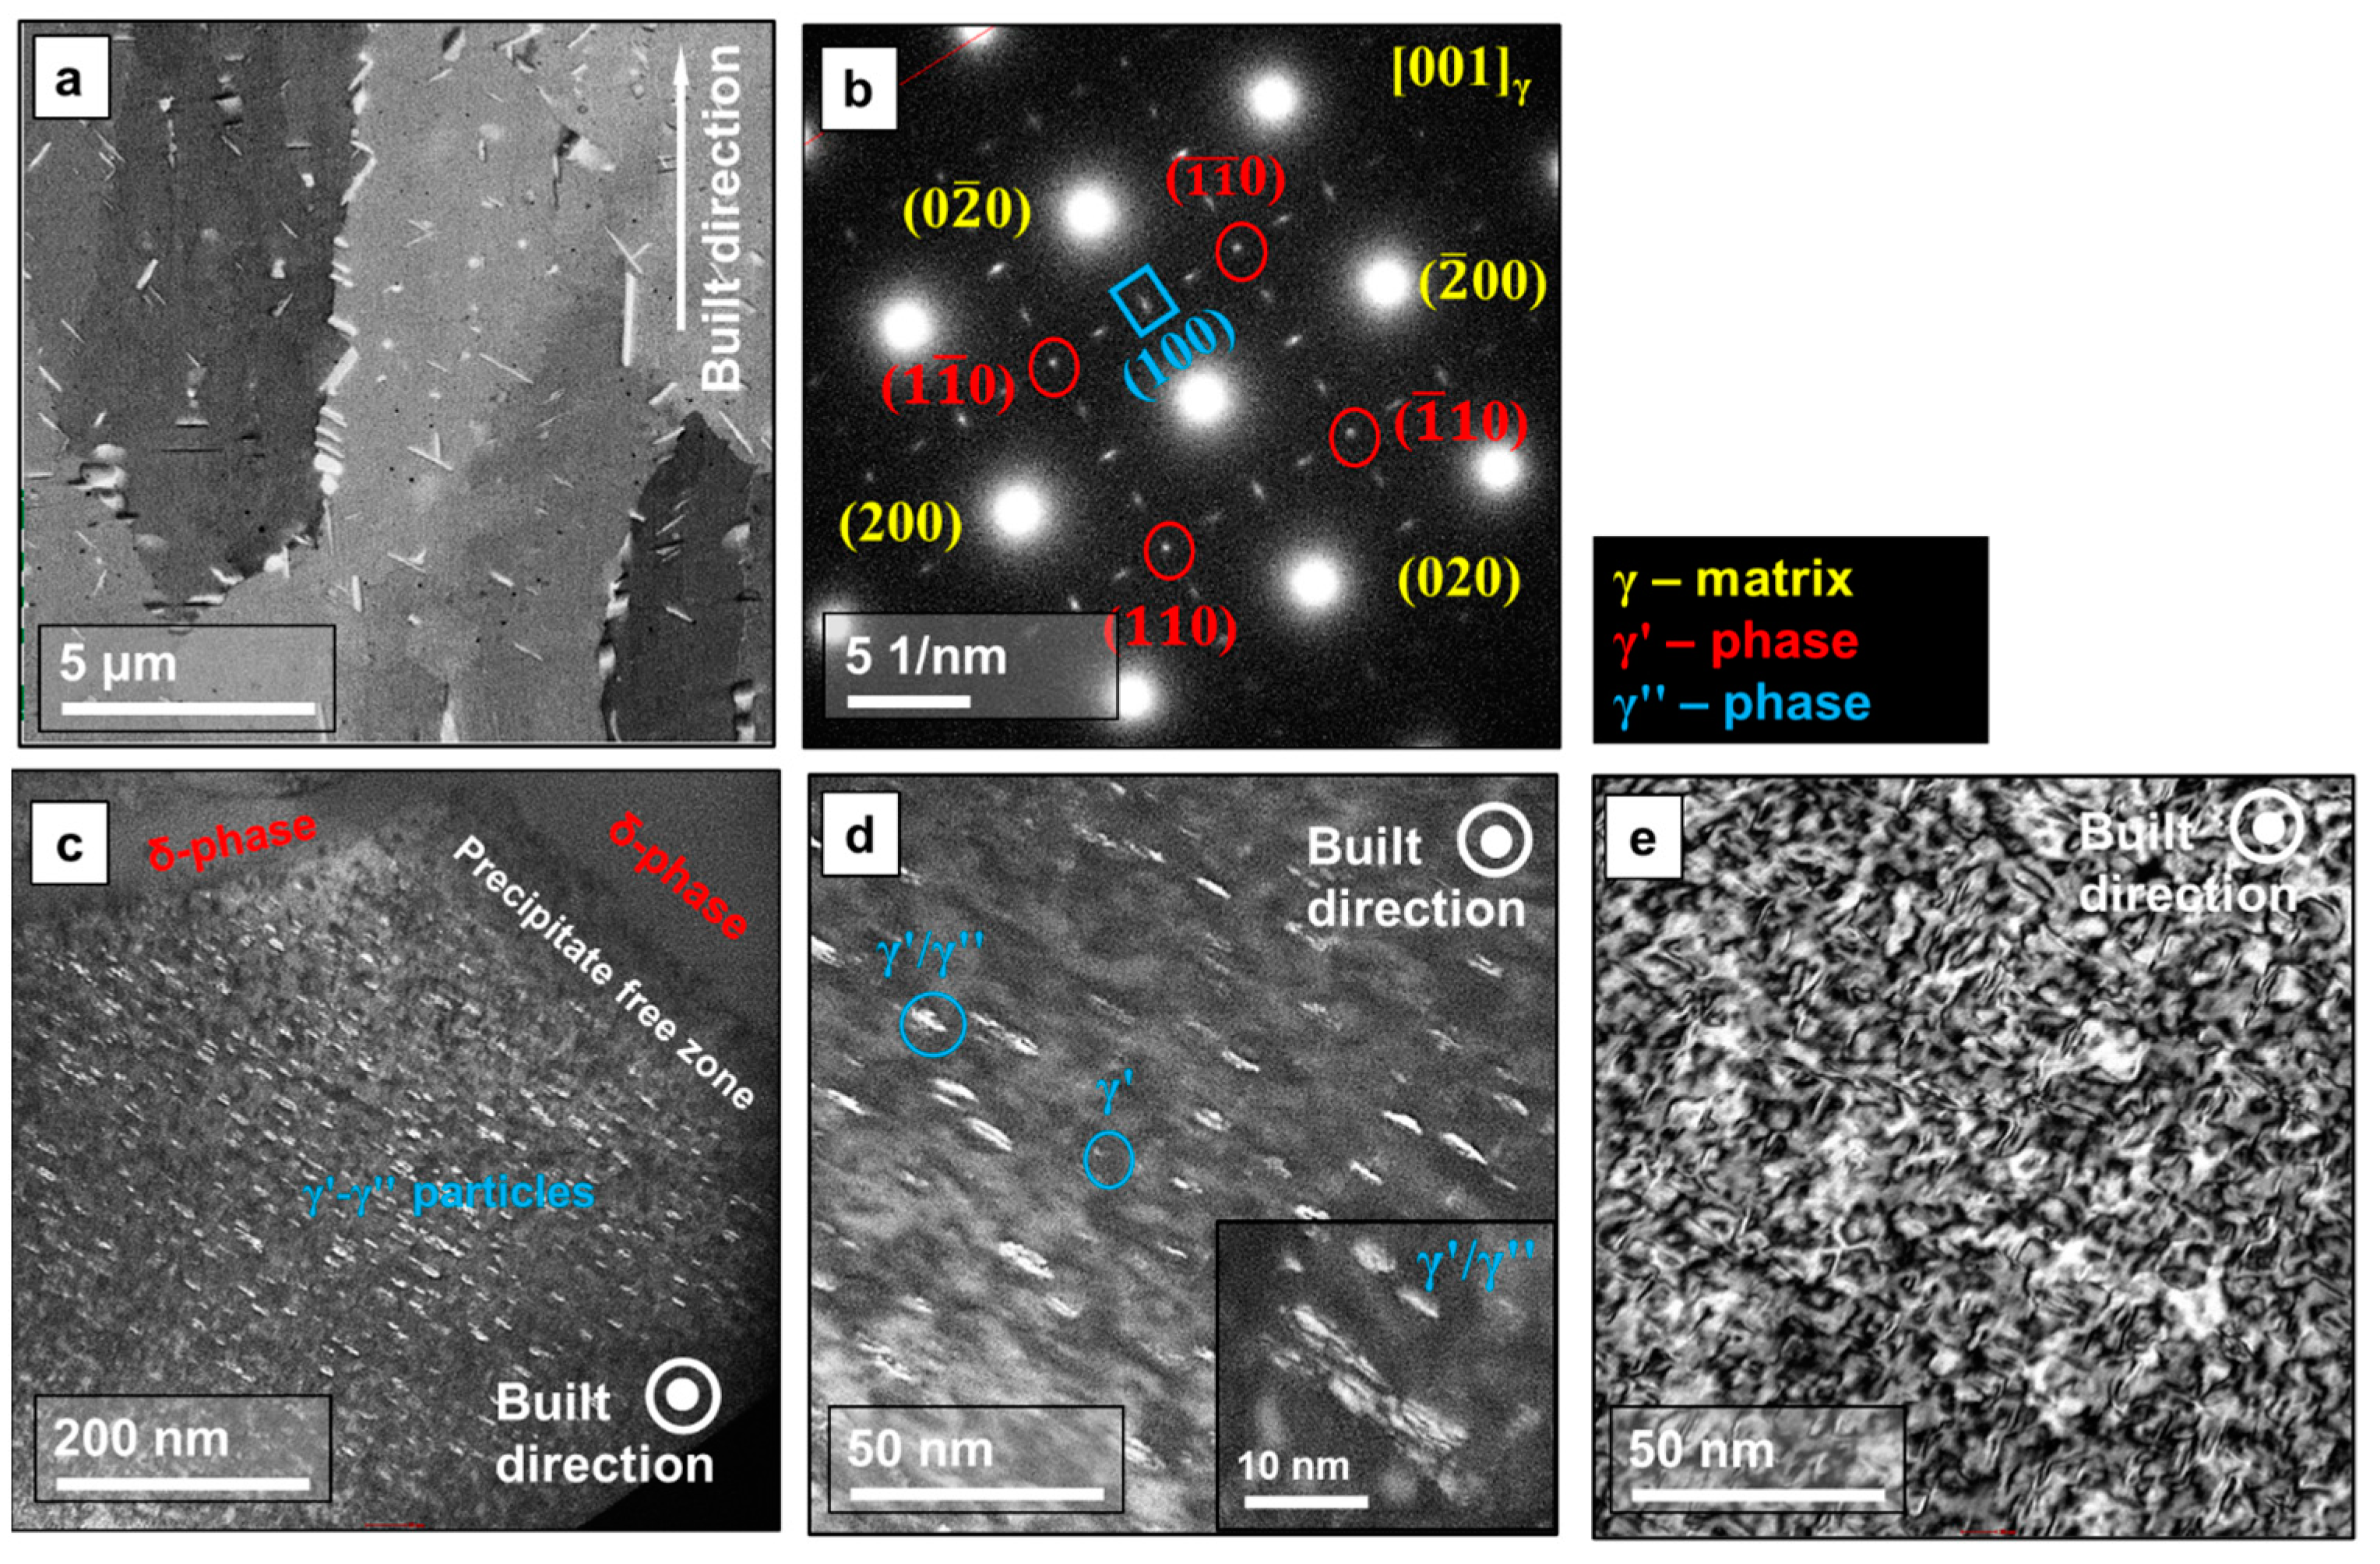
3.1. Microstructure Evolution and Precipitation Phenomenon after L-PBFAM and Heat Treatment

The optical micrograph in Figure 1a corresponds to the XZ plane of the L-PBFAM IN718 sample and shows the pool boundary. The EBSD inverse pole figure (IPF) in Figure 1b illustrates the grain size distribution and orientation-related information. A bimodal microstructure, dominated by elongated columnar grains sporadically interspersed with clusters of fine grains, is observed. The elongated grains are due to the directional solidification, normal for the laser scanning plane (i.e., along the Z direction). The extension of the grains beyond the fusion line is an aftereffect of epitaxial growth resulting from the partial remelting of the previously solidified melt pool [27]. During L-PBFAM, the interplay between the temperature gradient and growth rate dictates the solidification mode and degree of microstructural refinement. Furthermore, the width of the columnar grain is, to some extent, controlled by hatch spacing, the remelting depth by layer thickness, and the direction of grain growth and crystallographic texture by scanning strategy [28]. The preferred crystallographic orientation is a result of the anisotropy in the dendritic growth rates between grains of different orientations. Among various orientations, grains in the <001> orientation are known to have the highest growth rate and therefore grow epitaxially, aligning with the heat withdrawal direction and temperature gradient (arrows in Figure 1b) [29]. For the 67° interlayer rotation strategy, the scanning direction makes a complete 360° rotation in the XZ plane between every fifth and sixth iteration (roughly 230 μm apart, as marked in Figure 1a). Therefore, after every 230 μm, the direction of the epitaxially growing grains changes. For an ideal cellular solidification, grain growth perpendicular to the melt pool boundary is preferred because it is the direction of maximum heat flux. However, disruption to the ideal heat flow pattern is caused by the Marangoni effect, the convective flow of molten material, random nucleation events, and the recoil pressure caused by sudden material vaporization and/or gas expansion [27,30]. As a result of these disruptions, epitaxial growth is interrupted, and local grain refinement and texture randomization occur. Due to the stochasticity of such phenomena, the fine-grained clusters are observed sporadically in the EBSD-IPF map (Figure 1b). The 67° scan strategy also breaks the epitaxial grain growth and results in clusters of fine grains. Additionally, the intersection of the columnar grains of different orientations is also interpreted as fine sub-grains in the microstructure.
In the low-magnification BSE micrograph (Figure 2a), the dark-shaded regions represent the γ-solid solution (f.c.c), while the bright regions are micro-segregations. The different shades represent grains/sub-grains of varying crystallographic orientations. A well-defined micro-segregation behavior is observed with an ultrafine average secondary dendrite arm spacing (λs) of 1.2 μm. The value of λs is a signature of solidification and depends on the local solidification rate (R) based on the relationship,
λ S = α R β  
where α and β are the coefficient and exponent associated with inhomogeneous diffusion that results in the Oswald ripening phenomenon, and their values are considered as 183.6 and 0.33 for IN718 [31]. A fine dendritic spacing (λs = 1.2 μm) is observed in the BSE micrograph, and this value corresponds to the high cooling rate (R) of 3.6 × 10⁶ K/s associated with the current L-PBFAM process parameters. However, the diversity in spacing and morphology in micro-segregation behavior, ranging from highly columnar to cellular/mosaic segregation structure (Figure 2a), is observed. Such wide heterogeneity is a signature of a high thermal gradient and complex solidification behavior of L-PBFAM. As explained earlier, the observed microstructure corresponds to various polar sections of the cellular-dendritic structure (due to the 67° interlayer rotation), which may also contribute to the observed heterogeneity in the micro-segregation behavior. The dendritic segregation contains hierarchical elemental distribution due to the variations in their solidification partition coefficient. Elements with high solidification partition coefficients, such as Nb and Mo, tend to segregate in the inter-dendritic spaces [32]. Furthermore, large thermal gradients in L-PBFAM result in constitutional undercooling at the solid–liquid interfaces and result in the segregation of low solubility elements, such as C, and heavy elements, such as Nb and Mo ahead of the solidification front. These elements tend to form well-defined, topologically closed-packed structures, such as the Laves phase (Ni,Cr,Fe)2(Nb,Mo,Ti) with intermittent MC and M23C6 carbides in the dendritic channels [27]. However, during multiple reheat cycles of L-PBFAM, continuous and long Laves strips can dissociate into blocky or granular Laves, as seen in the high-magnification BSE image (Figure 2b) [16]. Here, the primary dendritic segregation appears as moderately bright channels, and the Laves phases, richer in heavy elements, appear as irregularly shaped brighter blobs (Figure 2b). The Nb released into the inter-dendritic regions surrounding the Laves phase may eventually form γ-eutectics, γ′/γ″ precipitates, and/or acicular δ-Ni3(Nb,Ti) intermetallic compounds during the successive L-PBFAM reheat cycles. The TEM micrographs (Figure 2c,d) provide further microstructural insights into the dendritic regions. From the bright-field image (Figure 2c), the thickness of the dendritic channel is measured as approximately 30 nm. As the BSE image shows, blocky discontinuous Laves phases are observed within the dendritic channel. The TEM micrographs do not show evidence of δ-Ni3(Nb,Ti) needles in the inter-dendritic spaces. The γ-matrix is laced with very fine, rapid solidification-induced dislocation structures. The high-magnification bright-field TEM (Figure 2d) also shows highly dense dislocation structures near the Laves phases in the dendritic regions. The TEM micrograph corresponds to the [001] orientation of the f.c.c. γ-matrix parallel to {22 43 ¯ }. The C14 Laves phase is ascribed in the superlattice reflection of the corresponding selective area diffraction (SAD) in Figure 2 (d1).
Figure 3 comprises a compilation of microstructures corresponding to the heat-treated sample. The bright acicular particles in the immersion mode BSE image (Figure 3a) are morphologically alike to the δ-Ni3(Nb,Ti) phases commonly observed in heat-treated IN718 [33]. The δ-phases nucleated in the grain boundaries are thicker, with lengths ranging from 2–3 μm, while finer δ-phases are observed in the cell boundaries. Further particle-related details are revealed in the TEM investigation (Figure 3b–e). As revealed in the SAD pattern in Figure 3b, the TEM micrographs (Figure 3c,d) correspond to the [001] zone axis of the f.c.c γ-matrix and g along the <020> direction. The dark-field TEM images reveal the morphology and distribution of the nanoscale γ′/γ″ phases. In the low-magnification image, precipitate-free zones are found near the vicinity of δ-phase. The high-magnification dark-field image (Figure 3b), captured in the [001] zone axis and g along the <200> direction, resolves the detailed morphology of the γ′/γ″ platelets. Mantri et al. [15] have attributed the plates as γ′-γ″ duplet or γ″-γ′-γ″ triplets. Some fine phases with dot-like morphology are attributed as standalone γ′ phases, which have spherical morphology (Figure 3d). A high degree of coherency strain is observed around the γ′/γ″ particles (Figure 3e). By using image processing techniques, the mean diameter of the standalone γ′-particles was statistically calculated as 3.2 ± 1.4 nm, while the average length and thickness of the γ′/γ″ platelets were calculated as 13.6 ± 11.1 nm and 6.7 ± 8.2 nm, respectively.

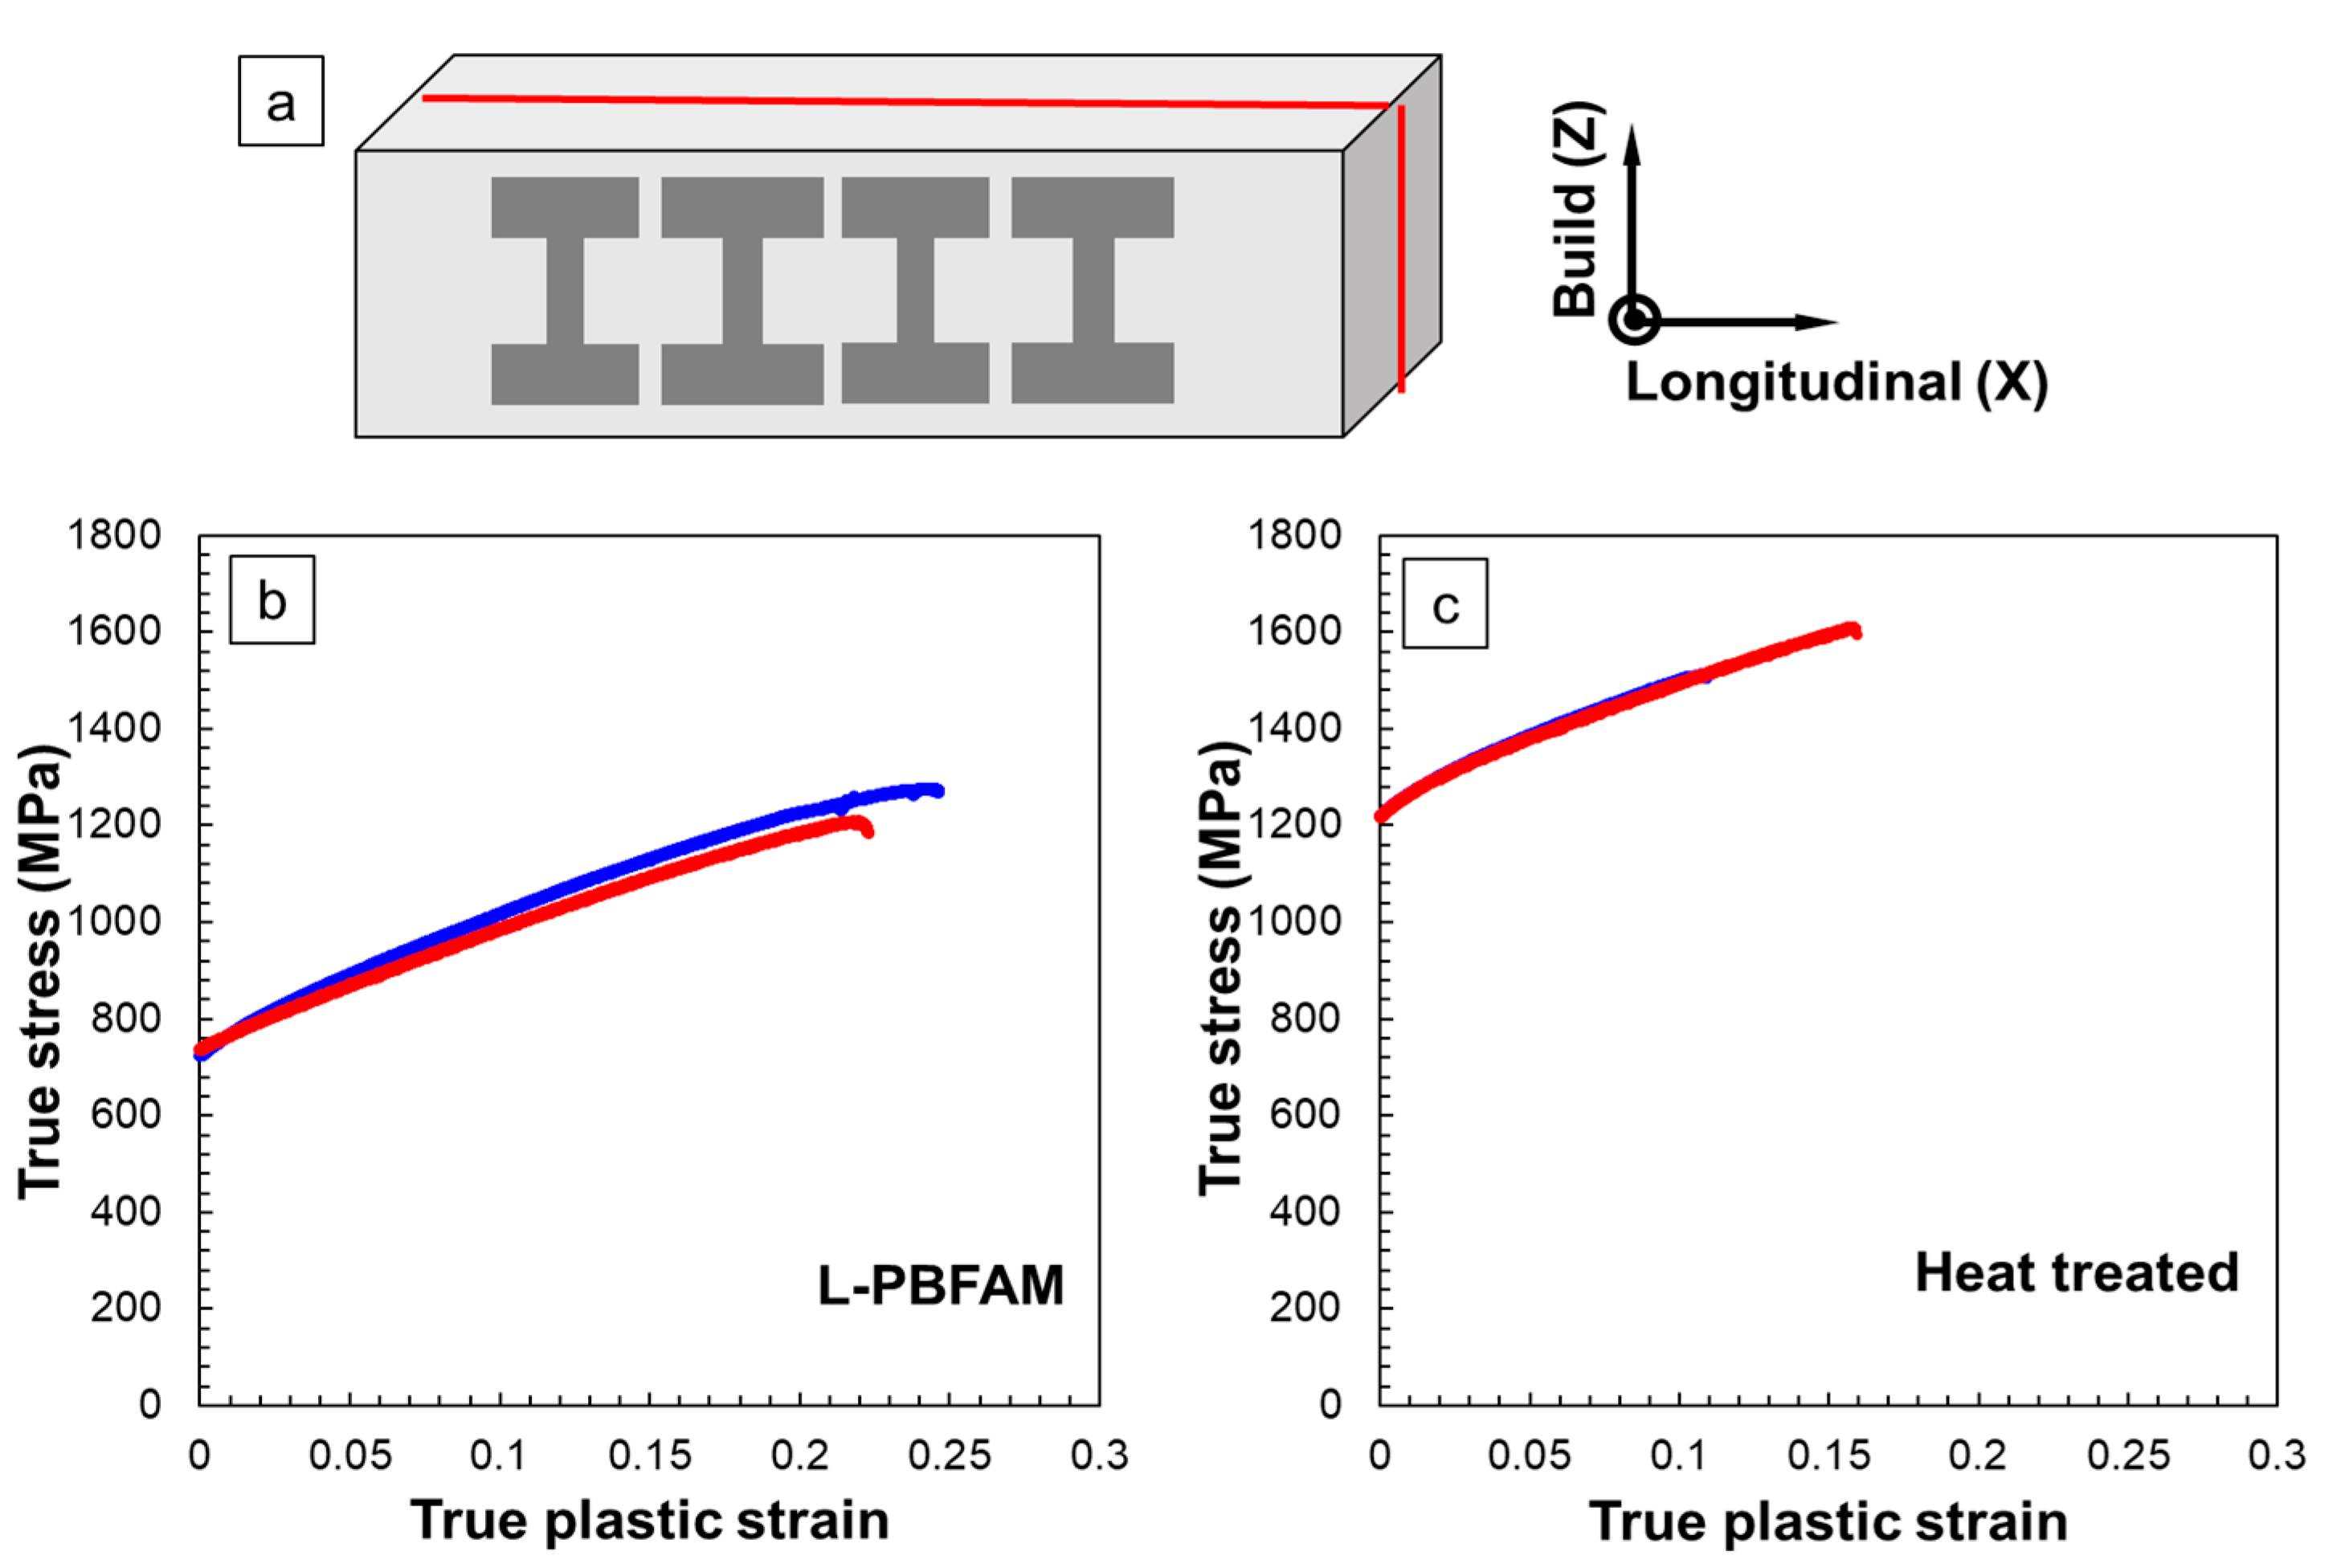
3.2. Investigation of Macroscale Tensile Properties

Figure 4 shows the tensile stress–strain behavior of the IN718 sample for both L-PBFAM and heat-treated conditions. As illustrated in Figure 4a, two samples corresponding to each condition were extracted from the middle portion of a single printed block. In order to reduce scatter due to the L-PBFAM-induced defects in the tensile stress–strain curves, samples were cut from the middle section (red line in Figure 4a) of the printed block, and the region near the edge of the block was neglected. Figure 4b,c show the true stress–strain curves of the L-PBFAM and heat-treated samples. The average yield strength (YS), ultimate tensile strength (UTS), and uniform ductility (UD) of the L-PBFAM sample are 731 MPa, 1226 MPa, and 23%, respectively. Compared to IN718, processed via conventional manufacturing routes such as casting (YS: 991 MPa, UTS: 1235 MPa, UD: 11.1%) and forging (YS: 1034 MPa, UTS: 1390 MPa, UD: 11.3%), the L-PBFAM material showed better strength–ductility synergy. For the heat-treated sample, the rise in tensile strength is significant, with a slight decrease in ductility (YS: 1217 MPa, UTS: 1515 MPa, UD: 12%) after heat treatment [34]. The increase in YS of 486 MPa is a 64% rise and is attributed to the activation of various precipitation-strengthening mechanisms in the heat-treated sample. Note that the variation in elongation between the samples corresponding to the same processing condition is coincidental and is attributed to the stochasticity in the defect distribution between the samples.
The mechanical yield strength in the L-PBFAM sample is a culmination of various strengthening mechanisms: (i) grain boundary (Hall–Petch) strengthening, (ii) dislocation (solidification-induced) strengthening, (iii) solid solution strengthening, (iv) misfit strain between the matrix and micro-segregants, and (v) intrinsic Peierls–Nabarro stress of the material [14,35]. For the heat-treated samples, various precipitate strengthening mechanisms (from both γ′ and γ″ particles) provide elevated yield strength and work hardening to the heat-treated sample. The primary precipitation-strengthening mechanism for heat-treated IN718 is the Orowan looping or particle shearing of the γ′ precipitates. The critical radius for the transition from shear to the Orowan mechanisms depends on b/δ, where b is the Burgers vector, and δ is the lattice misfit parameter. From the calculation established by Brown in his classical paper, the critical radius is determined to be 140 nm for the γ′ precipitates [36]. For the current heat-treated sample, the particle size of the γ′ precipitates is less than 140 nm and, thereby, particle shearing will be the dominating strengthening mechanism. The particle shearing mechanism is a combination of weakly and strongly coupled dislocation mechanisms and is contributed by the coherency strain due to lattice misfit, i.e., coherency strengthening (Equation (2)) and APB between two domains of the same ordered phase, i.e., ordered strengthening (Equation (3)). Within the mechanisms, the hardening effect of APB is higher.
σ c = 1.3 2 M ε G 3 / 2 d b f T 1 / 2
σ a = M γ A P B 2 b 3 π 2 γ A P B f d 32 G b 2 1 / 2 f
Equations (2) and (3) denote the mathematical formulation for determining the yield stress contribution from coherency strengthening ( σ c ) and ordered strengthening   ( σ a ) . In these equations, M is the Taylor factor, ε is the strain equivalent to two-thirds of the lattice misfit, G is the shear modulus, d is the mean precipitate size, f is the volume fraction, b is the Burgers vector for dislocations in the γ-matrix reported as 2.54 nm, T is the line tension of the dislocations, which is equivalent to Gb2/2, and γ A P B is the anti-phase boundary energy, which is 0.296 J/m2 [37]. The aggregate contribution of both particle shear mechanisms to yield strength is determined by the following relationship [38],
( σ Y S ) γ ' = σ a 1.8 + σ c 1.8 1 / 1.8
Furthermore, coherency and ordered strengthening, as provided by the metastable D022 tetragonally-distorted γ″ precipitates oriented parallel to the <001> crystal direction, are expressed mathematically as Equations (5) and (6), respectively [39].
σ c γ ' ' = γ A P B 2 b 4 π γ A P B f r π T   6 3 A 1 / 2 k f
σ o γ ' ' = 1.7 δ 3 / 2 r f 1 k r 2 b A 2 1 / 2
Among the additional parameters used in Equation (5), r is half the major axis, A is the aspect ratio of the γ″-precipitates, and k is a coefficient that represents the variants of γ″ and is typically taken as 1/3. Due to the high misfit of the γ″-particles with the γ-matrix, coherency strengthening dominates over ordered strengthening. However, due to the high aspect ratio of the γ″-phase, the strengthening effect shows an orientation preference with the <001> direction under simple loading conditions. Based on the relationships established by You et al. [6], for the average particle size of the standalone γ′-phases in the current heat-treated sample, the combined YS contribution from APB and coherency strengthening is estimated to be 110 MPa. Similarly, for the measured volume fraction and size of γ′/γ″-platelets, the YS contribution from coherency and ordered strengthening of the phase is approximately calculated as 180 MPa. Therefore, considering the average particle size and volume fraction of the heat-treated sample, the additional YS contributed by the particle strengthening mechanism, as per the above-mentioned simplified model, is 290 MPa. However, due to the wide heterogeneity in the particle size and volume fraction of the heat-treated sample, the simple particle strengthening model underestimates the increase of 486 MPa, observed experimentally for the heat-treated sample.

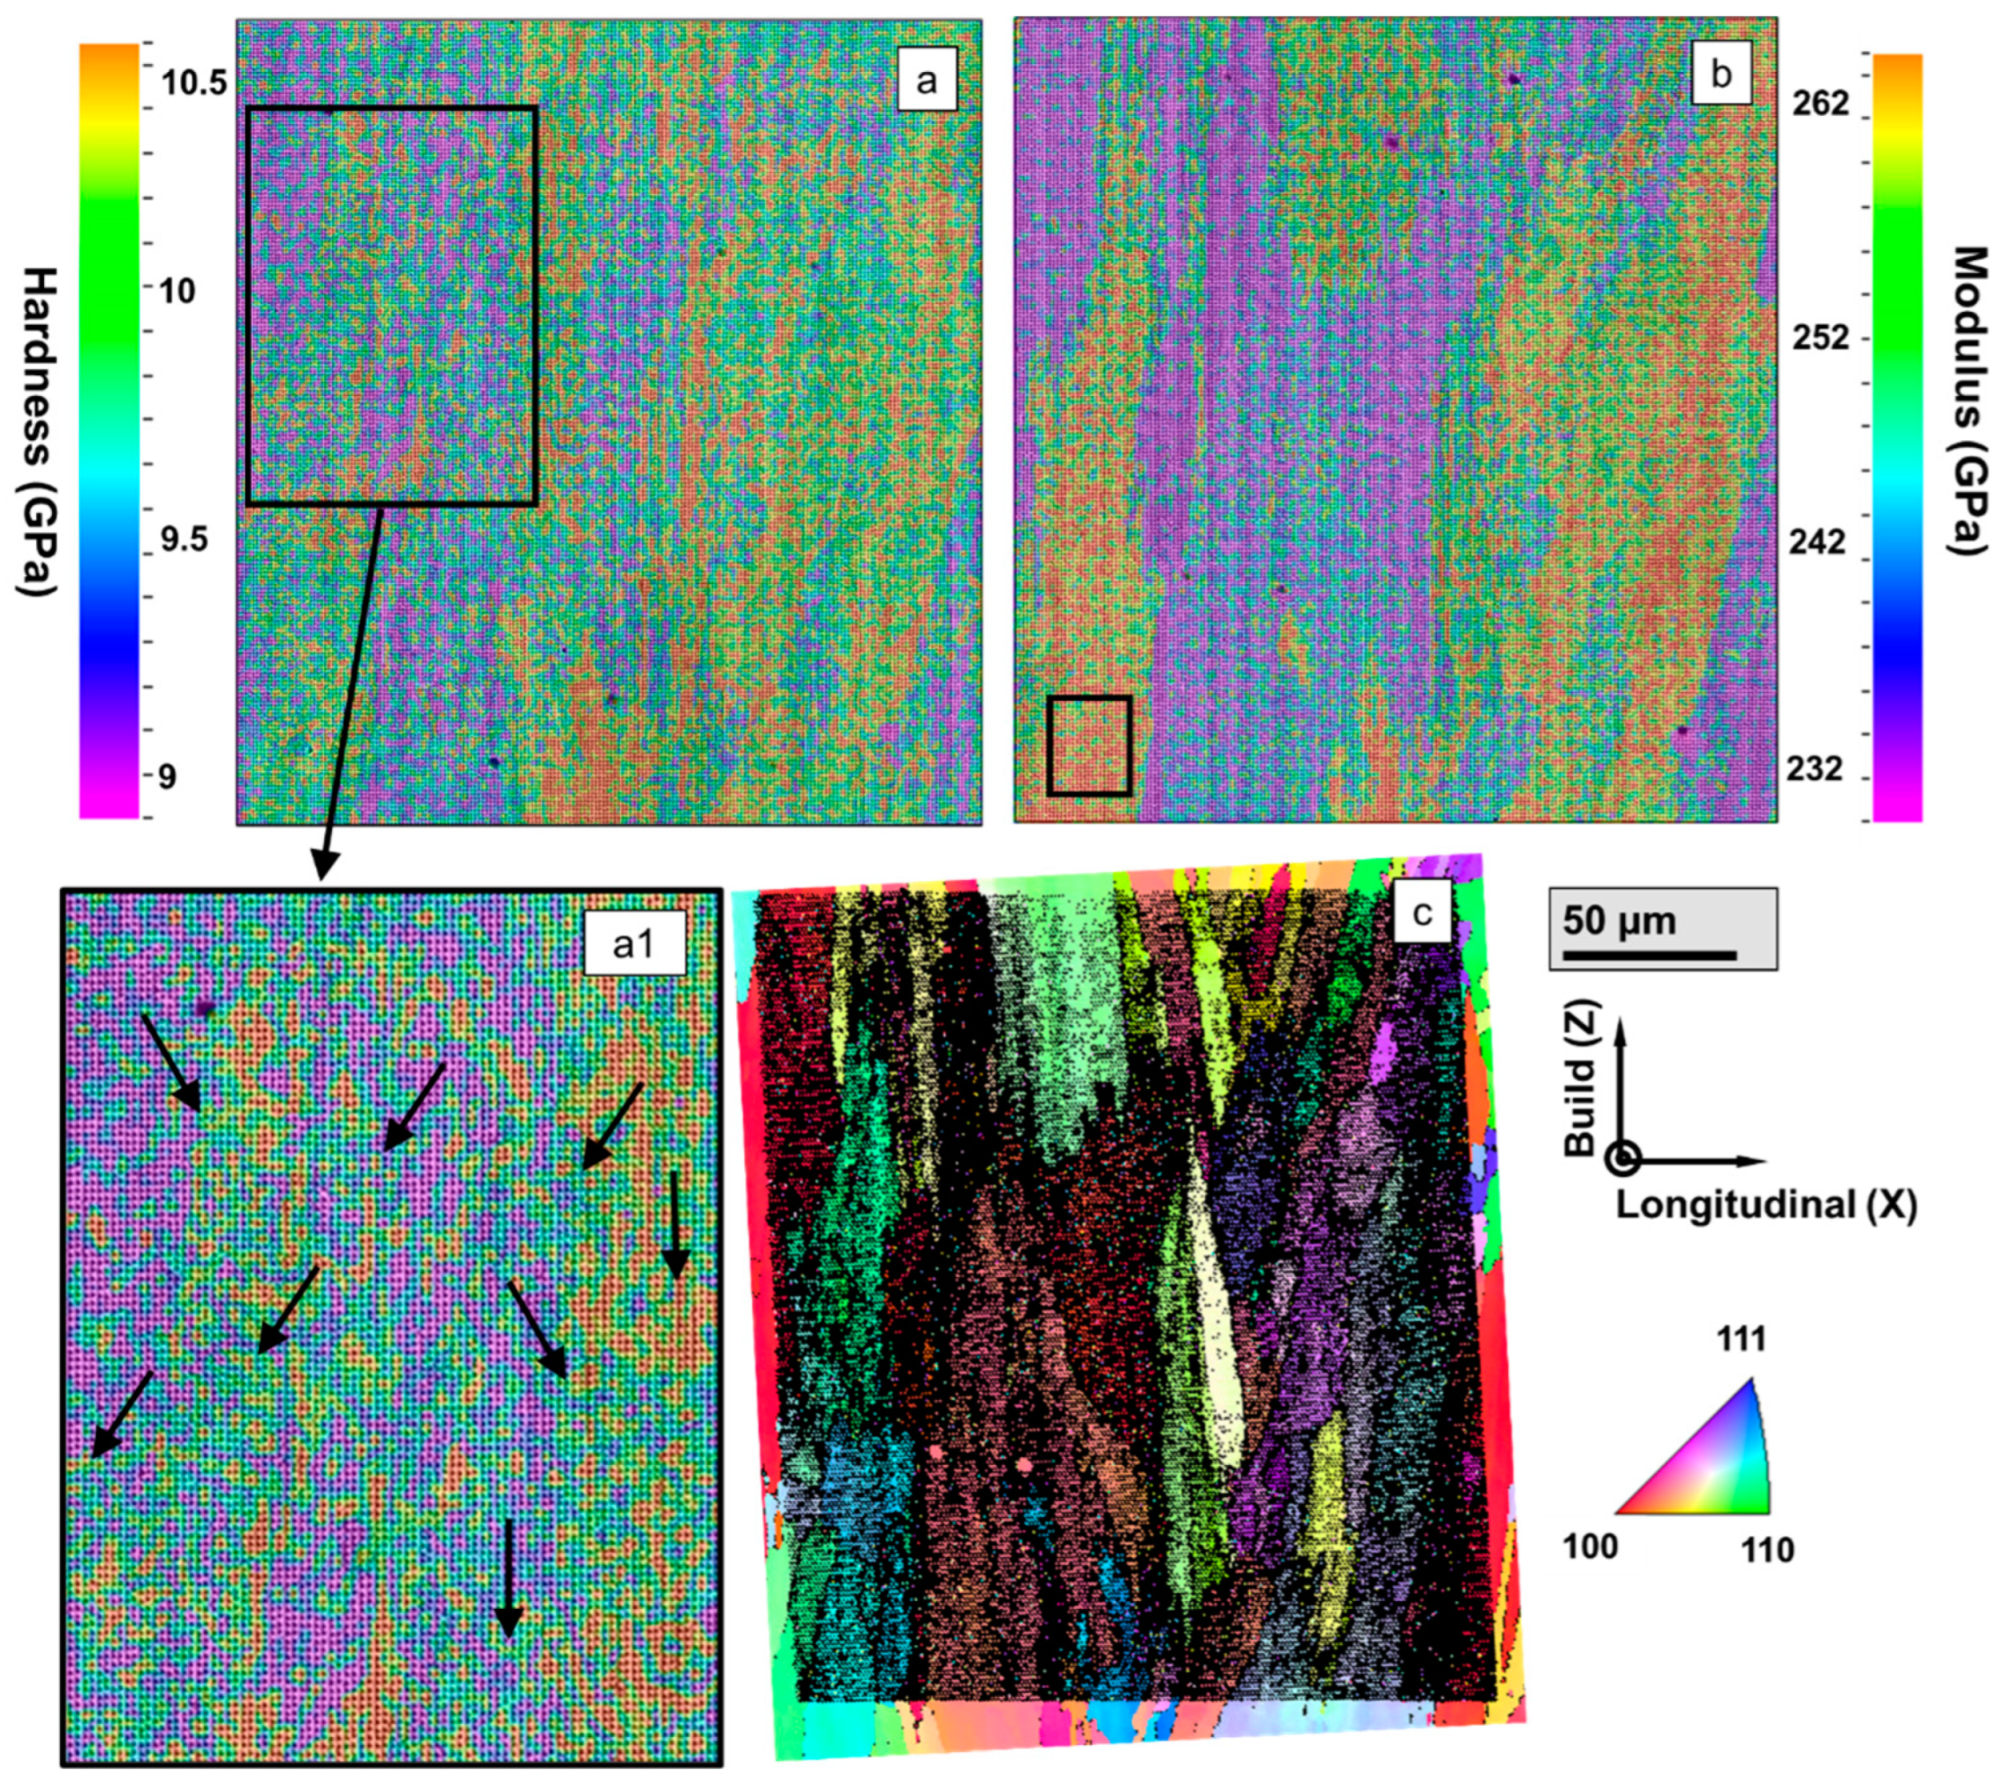
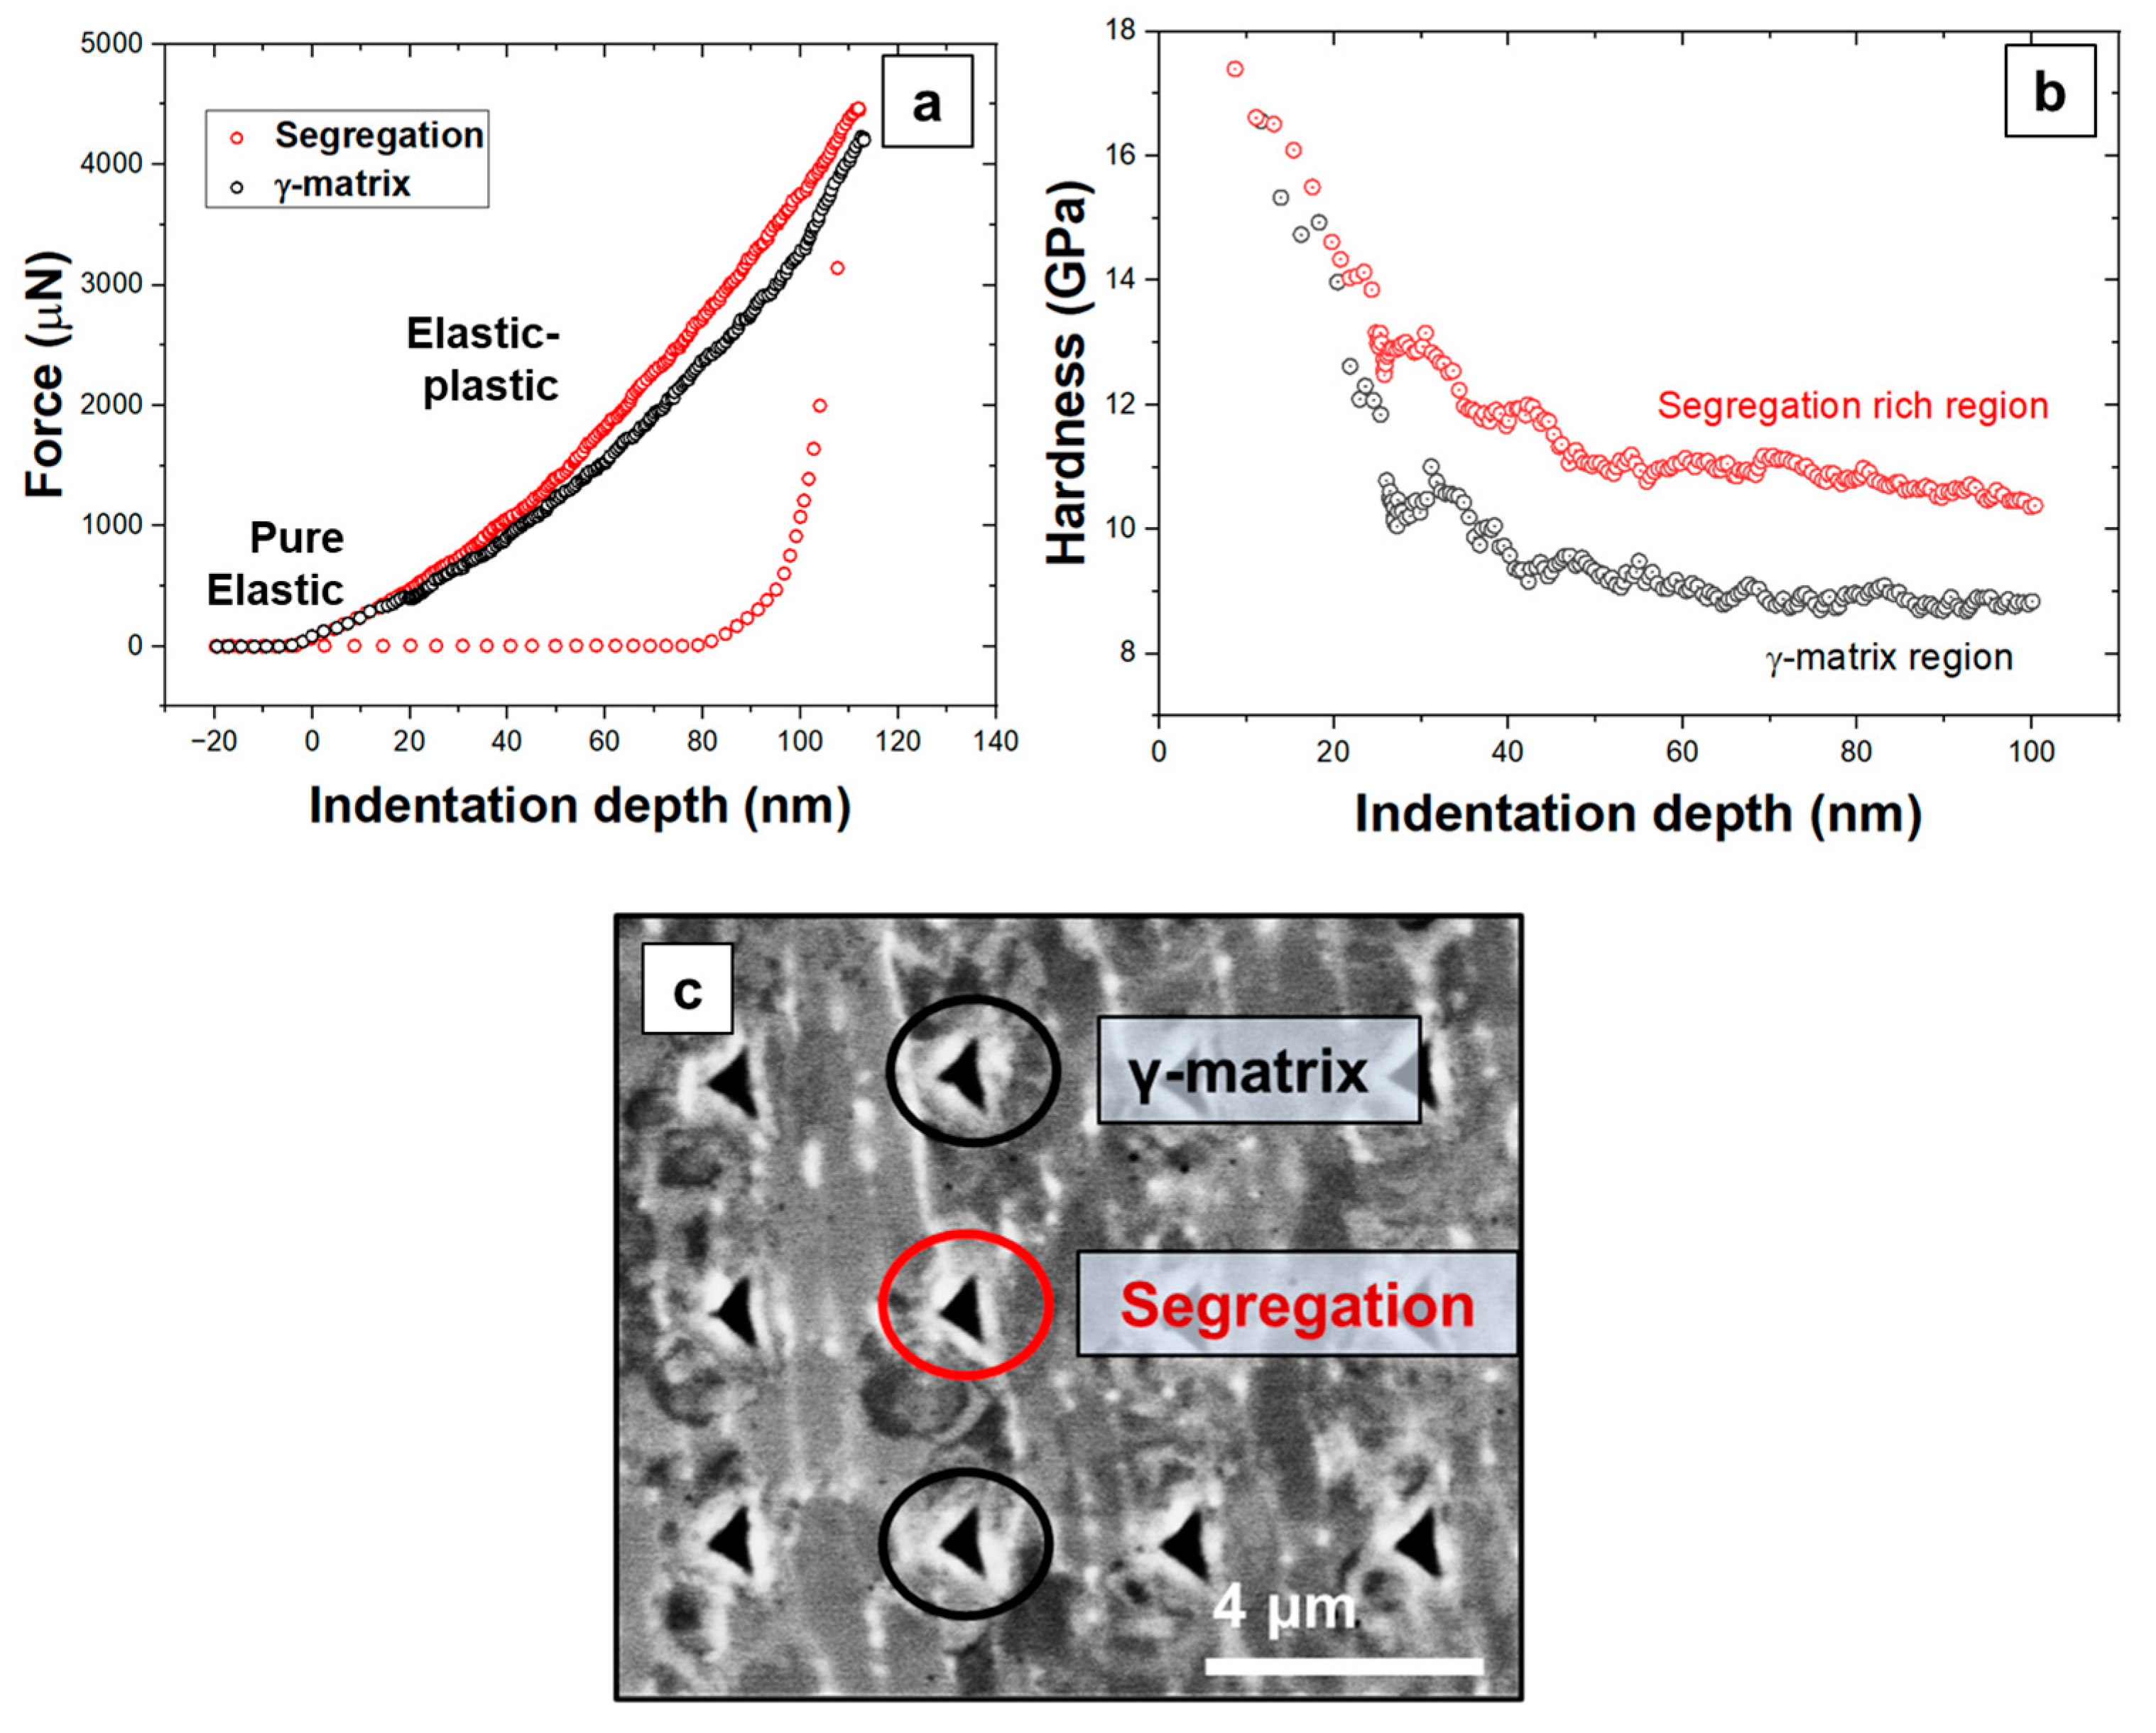
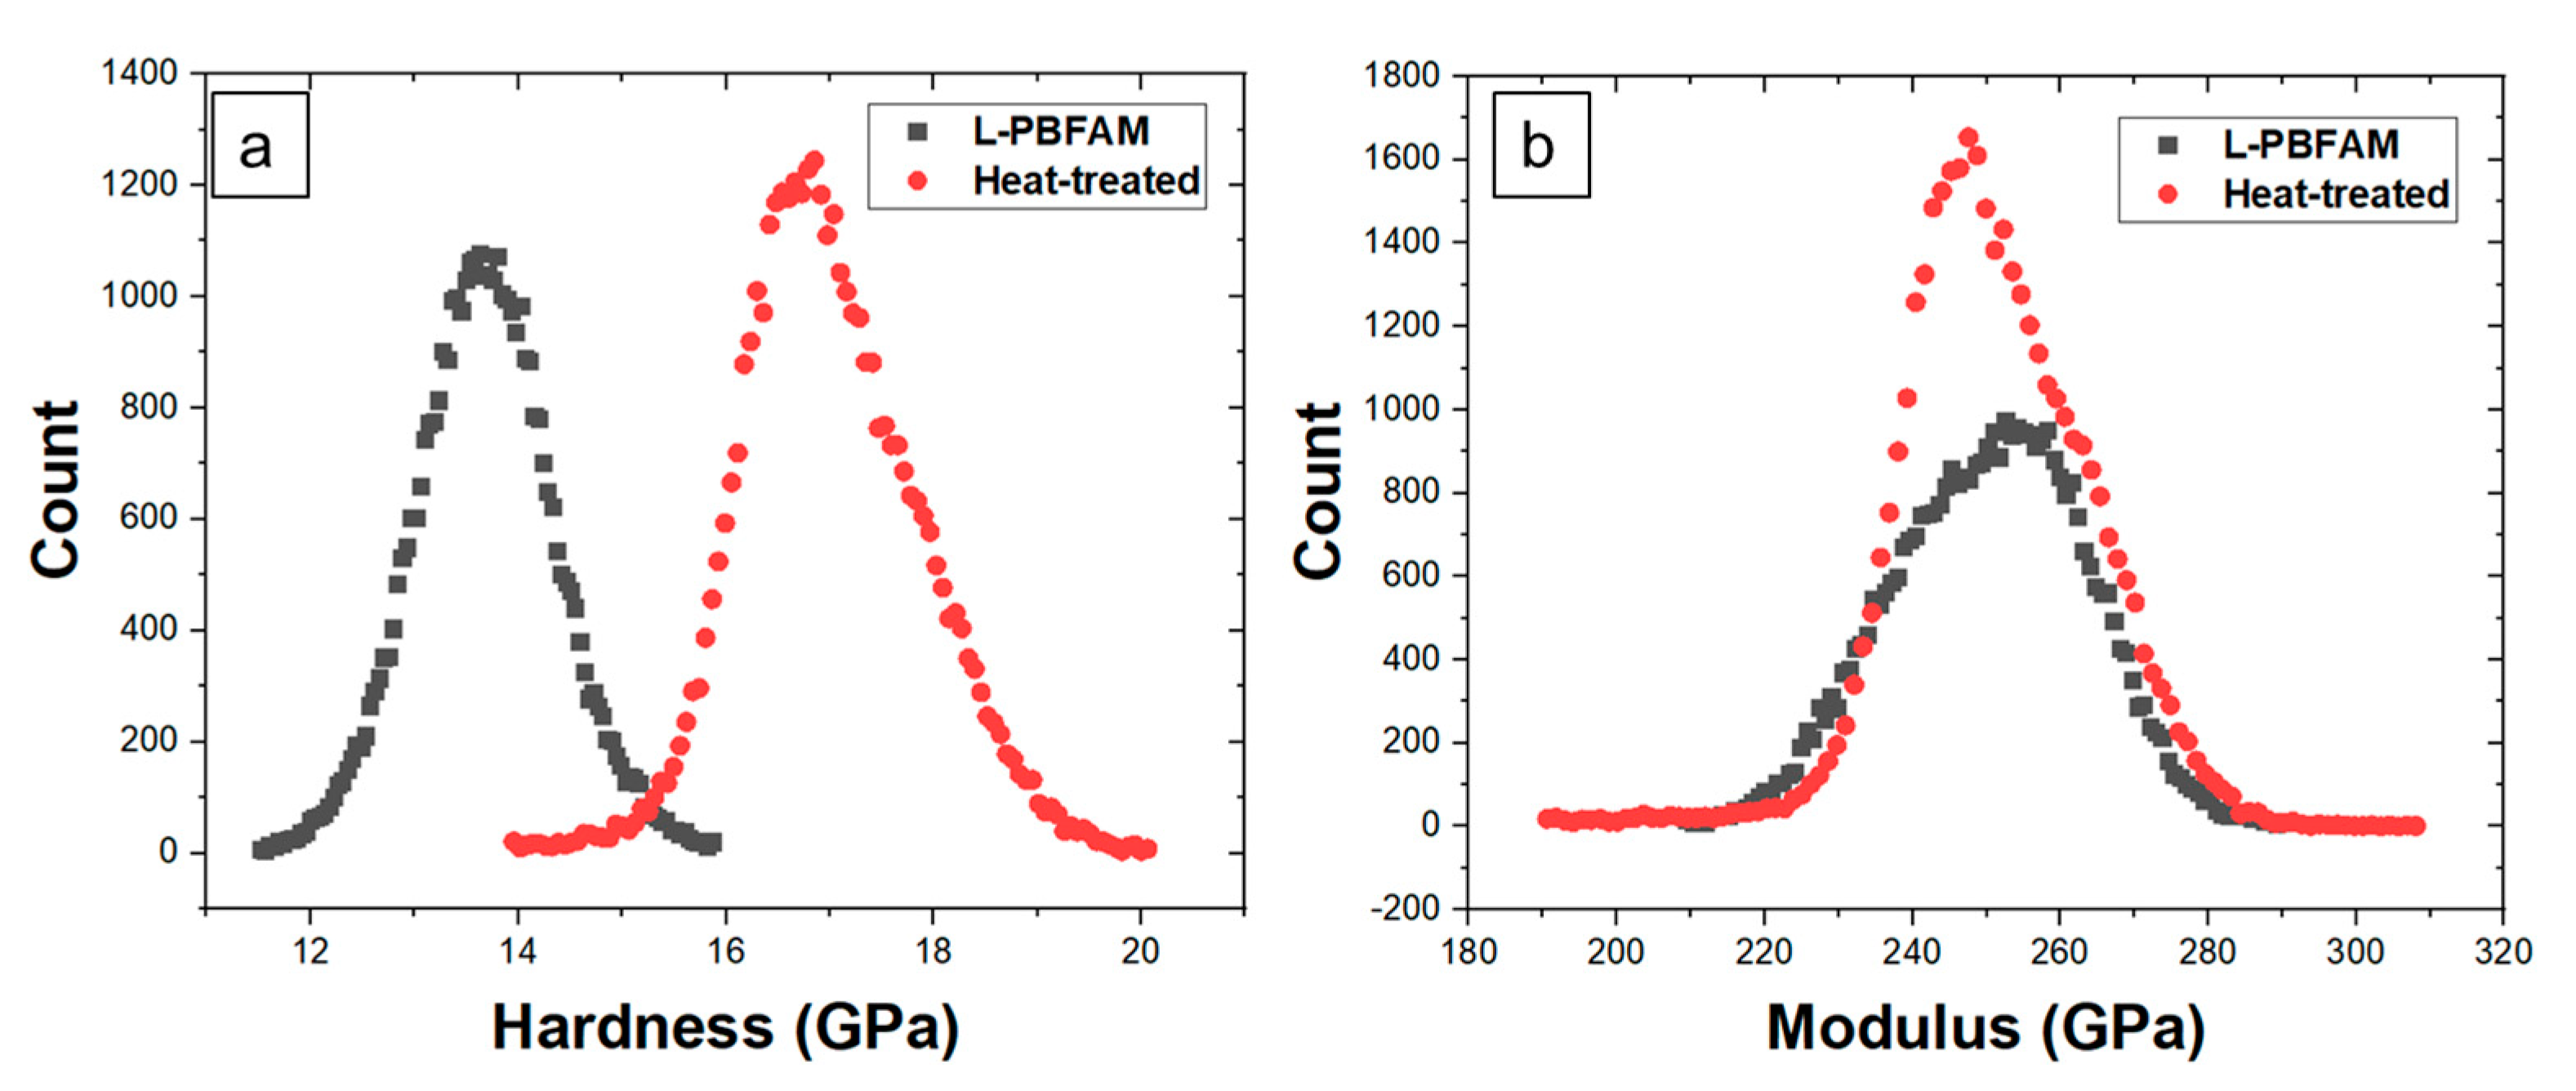
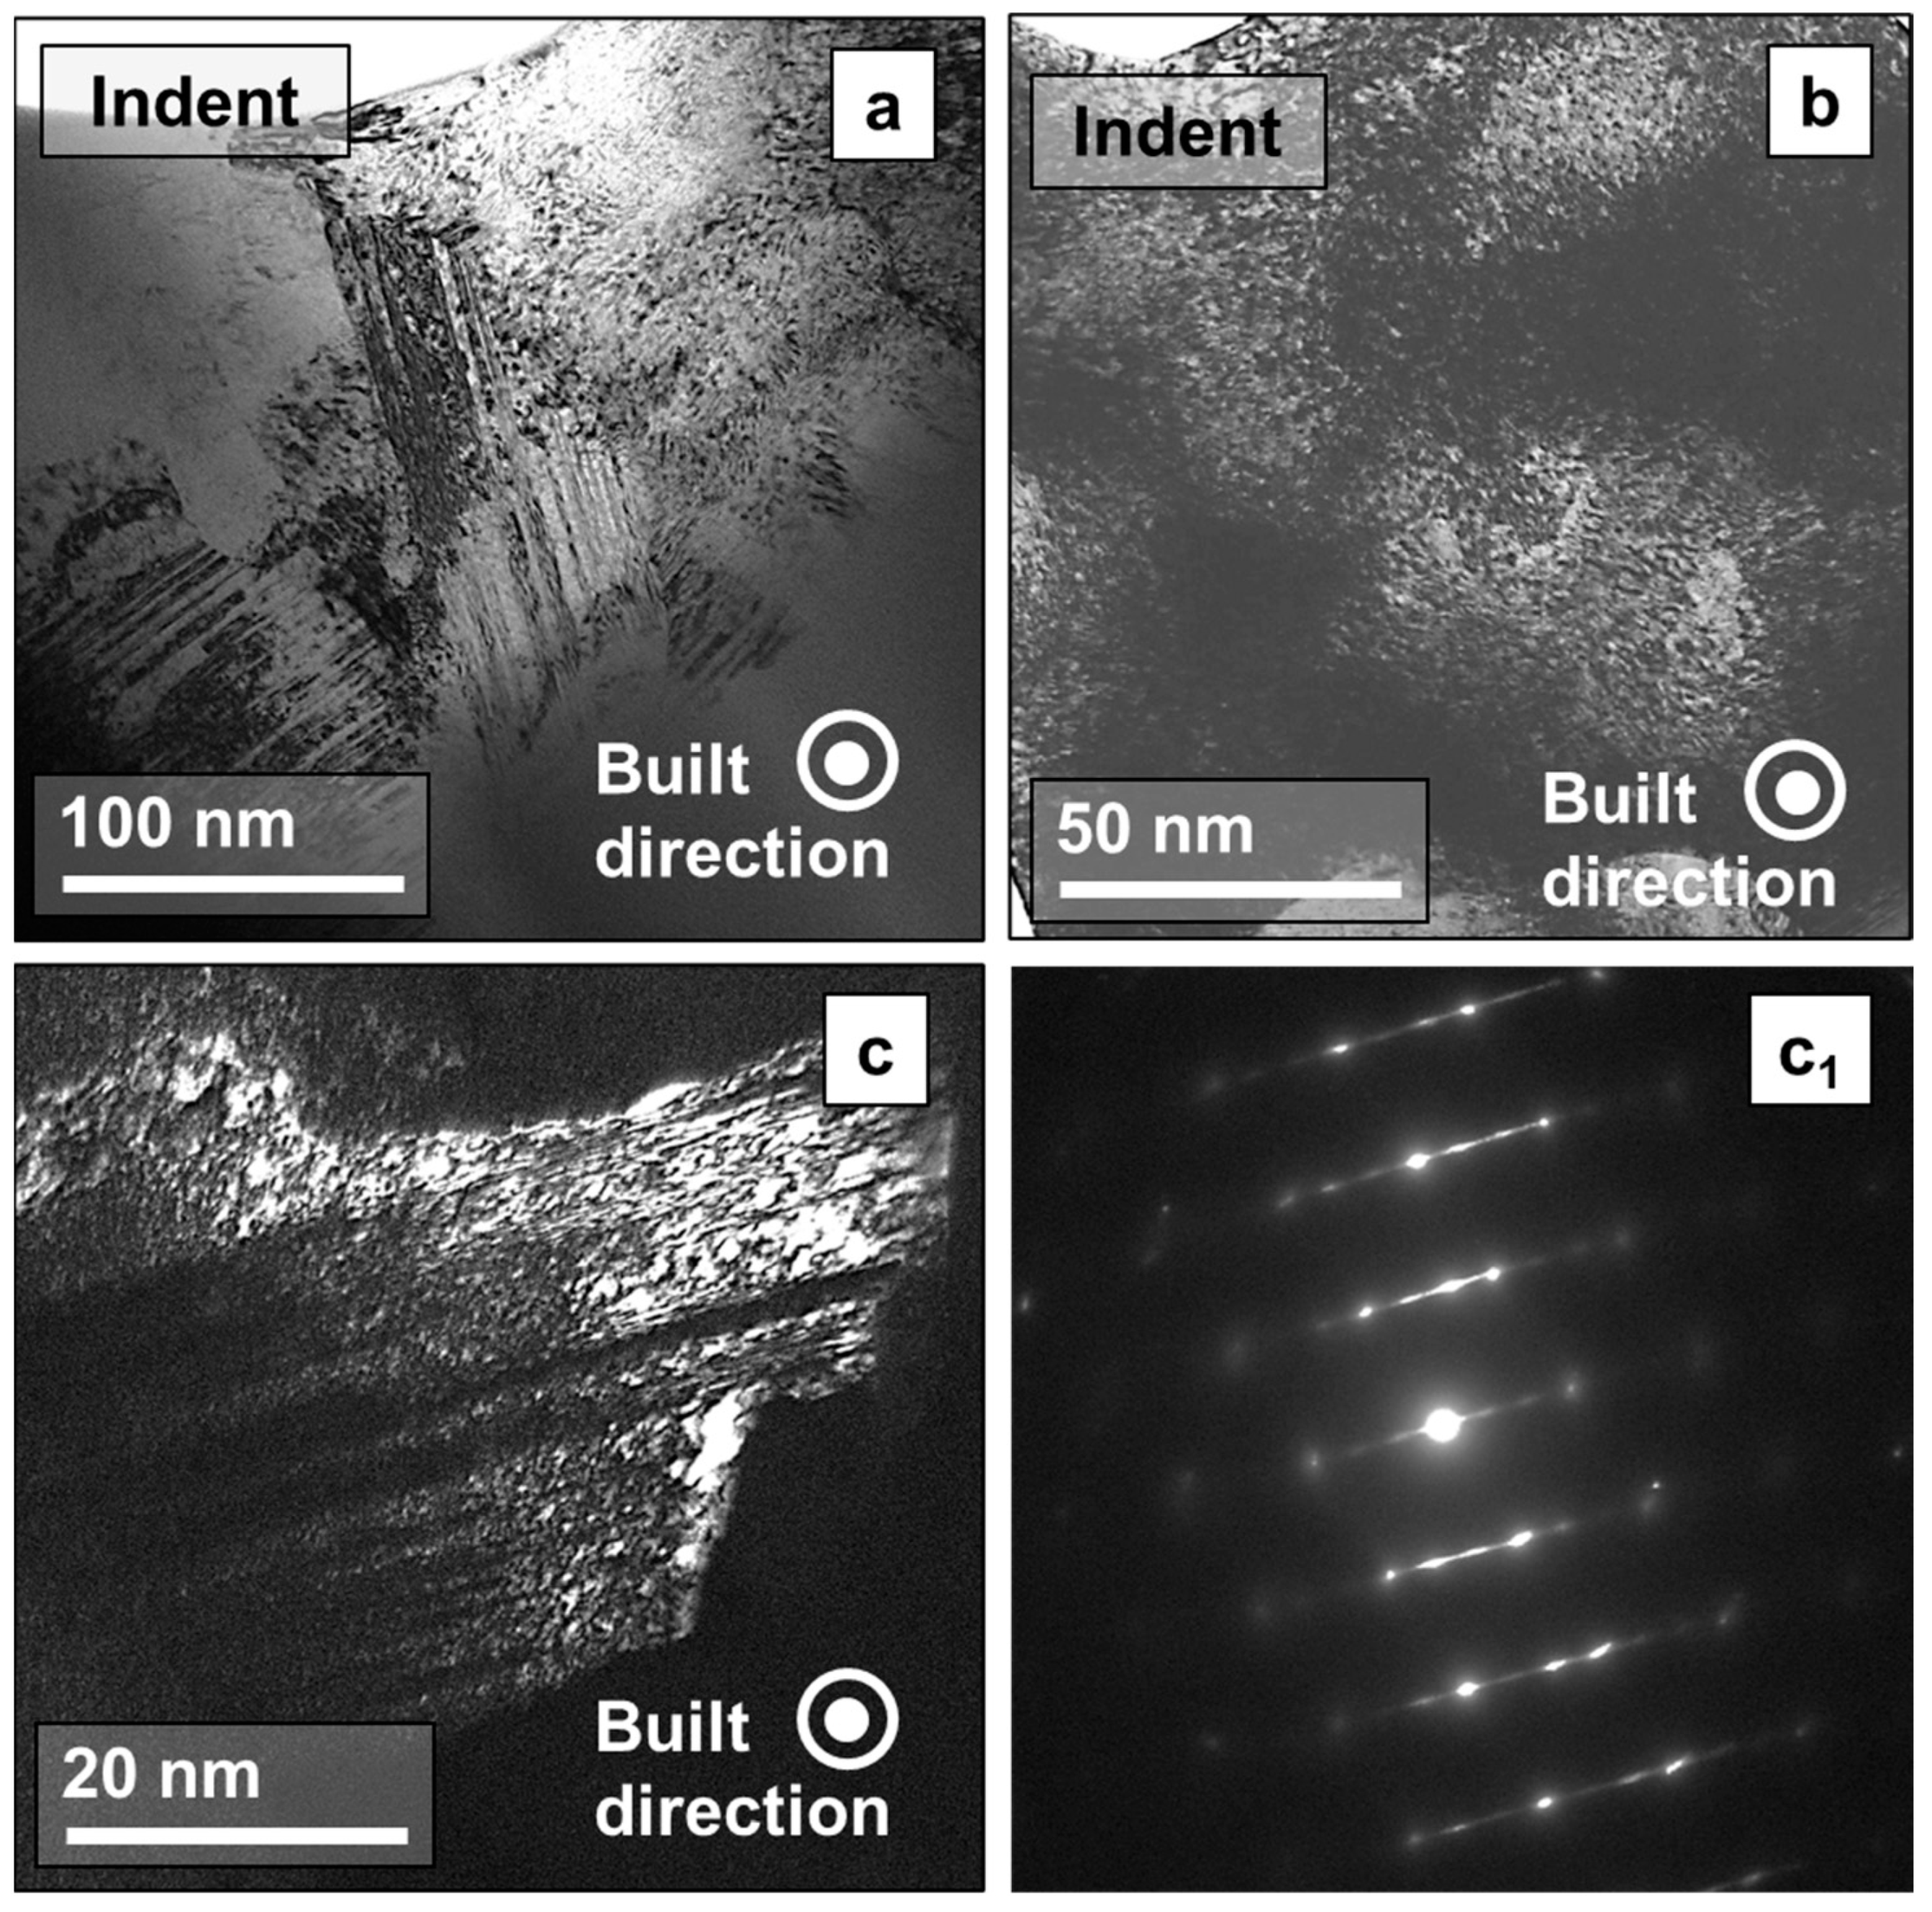
3.3. High-Resolution Nanoindentation Elastoplastic Mapping and Micromechanical Analysis

High-resolution hardness and modulus maps of the L-PBFAM sample are presented in Figure 5a,b. The hardness map covers an area of 150 μm × 150 μm, which corresponds to more than five L-PBFAM layers. Therefore, the indented map captures the signatures of microstructural variation and hierarchical heat distribution between multiple layers. The EBSD-IPF map of the indented region is displayed in Figure 5c to correlate it with the grain orientation. Hardness is measured by adopting Oliver and Pharr’s technique [40]. The spatial variation of nano-hardness ranges statistically from 9.0 to 10.5 GPa, with an average hardness of 9.7 GPa. Among the reported nano-hardness values of laser-processed IN718, Zhou et al. [8] observed a hardness of 6.8 GPa, Palma et al. [41] recorded a mean hardness of 5.5 GPa, and Wang et al. [42] discovered a hardness of 5 GPa. The observed values are significantly higher than these reported nano-hardness’ for L-PBFAM IN718. One of the reasons is the prominence of the indentation size effect (ISE) in an ultra-low indentation depth of 100 nm [43]. To some level, the effect of ISE is mitigated by an appropriate data selection from the hardness–indentation depth (Hh) curves. Another reason is the heterogeneous nature of the L-PBFAM microstructure, due to which the influence of intrinsic hardness of Nb, Mo-rich micro-segregants, and high solidification-induced misfit strain can be captured only at a low indentation depth of 100 nm. This mechanical impact of misfit strain is recorded because the length scale of indentation is in a similar order as the length scale of the dendritic channels and associated strain gradients. Despite the depth-dependent discrepancies in hardness values, the hardness map is an effective and high-throughput way to capture the relative distribution of the strengthening behavior in the material. In the hardness map, the grain orientation dependency of nano-hardness is observed. Nanoindentation hardness is the resistance force per unit area of deformation, and resistance force is directly related to the amount of dislocation generated under the tip during indentation. Due to lower critical resolved shear stress, the most closed-packed <111> grains deform early and accumulate greater dislocation under the tip, followed by <110> and <100> orientations. The orientation dependency on hardness is significant in IN718 due to its high mechanical anisotropy, contributed by a dominant effect of the Taylor factor [44]. Apart from orientation, the solidification-induced dislocation distribution and micro-segregation behavior influence hardness variations in the microscale. In the magnified view of the hardness map (Figure 5(a1)), signatures of the heat distribution, imparted by the complex solidification cycle of L-PBFAM, are detected. During L-PBFAM, heat is extracted predominantly via three-dimensional conduction. The arrows indicate the net direction of the heat extraction in the L-PBFAM sample. The authors, in their earlier work, also demonstrated the capability of high-resolution nanoindentation mapping to delineate such hierarchical heat distribution in a L-PBFAM Al alloy.
The reduced modulus (Er) determined during the CSM unloading cycles accounts for the elastic deformation of both the tip and sample. Therefore, based on the theory of contact mechanics (Equation (7)), the modulus of sample (E) is outlined. In this equation, the tip (diamond) elastic modulus (Ei) and Poisson ratio (υi) are 1100 GPa and 0.1, respectively. Similarly, the standard Poisson ratio (υ) of 0.28 reported for IN718 is used in this equation.
1 E r = 1 υ 2 E + 1 υ i 2 E i
The elastic modulus is an intrinsic material property and is not affected by ISE and the solidification-induced dislocation distribution in the material. The variation in modulus is representative of the heterogenous indentation volume comprising a mixture of γ-matrix and Nb-Mo rich segregation (which depends on the local thermal gradient and cooling rate). The modulus response of the γ-matrix follows the classical orientation-dependent relationship of E111 > E110 > E100 and shows high anisotropy. The modeled values for E111, E110, and E100 of conventional IN718 are reported as 264 GPa, 214 GPa, and 137 GPa, respectively [45]. The captured indentation region consists mostly of grains of nearly <110> and <100> orientations (Figure 5c), and the respective average modulus in these grains is 262 GPa and 232 GPa—significantly higher than the modeled values. Deng et al. [46] reported an elastic modulus of 210 GPa from the macromechanical tensile testing of ASTM-standard L-PBFAM IN718 samples. Wang et al.’s [42] nanoindentation tests (with an indentation depth of 1000 nm) on L-PBFAM samples resulted in a modulus in the range of 140–200 Gpa. However, considering the length scale of the dendritic structure in the current L-PBFAM sample, the above-mentioned testing strategies may not be sensitive to the intrinsic modulus effect of the fine micro-segregants. For the current indentation depth of 100 nm and a tip radius of 50 nm, the maximum tip–material interaction length scale is approximately 250 nm, which is much closer to the order of the segregant’s thickness (30 nm). Therefore, the present indentation strategy is effective in delineating the elastic behavior of micro-segregants and the γ-matrix. It is important to note that at a shallow penetration depth, the Oliver and Pharr area function underestimates the projected contact area and, therefore, the measured elastic modulus is slightly elevated. At 100 nm, it is 20% more than the theoretical value, and the overestimation increases significantly at a penetration depth of less than 100 nm [47]. Error in the definition of the contact depth due to surface roughness and tip roundness effects is also prevalent at an ultra-low depth [48]. Despite these factors, the map is effective in delineating the effect of second-phase elements on modulus distribution on a relative scale.
Stark differences are observed between the load-displacement (Ph) and Hh curves (Figure 6a,b) of regions dominated by the γ-matrix and dendrites. High-magnification BSE imaging confirmed the location of the indent relative to the phase (Figure 6c). At a very low depth, the contact between the tip and indenter is of pure elastic, and eventually, it transitions to an elastic–plastic deformation mode. The Ph curve of the γ-dominated region (black) shows a spontaneous elastic-to-elastoplastic deformation behavior, while the Ph curve corresponding to the segregation-rich region (red) shows a subtle transition. This is because of pre-existing dislocation localized around the dendritic region due to a large misfit strain between the matrix and segregation and the high local elastic stiffness of the dendritic region. The high modulus of the dendritic region is attributed to the ultrahigh elasticity provided by the Laves and carbides phases present in the segregation channel. Ye et al. [49] determined the elastic modulus of NbC carbides as 423 GPa. Luo et al. [50] reported the modulus of the C14 Laves phase to be close to 260 GPa. The difference in the observed modulus and the orientation-dependent modulus is a function of the volume fraction of micro-segregants. The modulus distribution in the map correlates with the volume fraction of the segregants in the indented volume. The region with mosaic segregation behavior has a greater density of segregants and shows large clusters of high modulus points compared to the region with dendritic segregation. Such a multiscale spatial variation in elastic properties results can manifest in an elastic mismatch in multiple length scales during deformation. Furthermore, elastic misfit, arising from atomic size mismatch and short-range internal stress due to modulus differences between heavily segregating elements, such as Nb and Mo with the γ-matrix, also contributes to the elevated modulus.
The hardness, modulus, and EBSD-IPF maps corresponding to the heat-treated sample are shown in Figure 7a–c. Compared to the L-PBFAM condition, the heat-treated sample shows a significant rise in both the range and average values of hardness and modulus. This statistical comparison, illustrated in Figure 8a, shows an increase in average hardness from 13.3 GPa to 14.8 GPa after heat treatment. The increase of 1300 MPa of nano-hardness approximately follows Tabor’s empirical rule (hardness = 3 times that of YS). In the aforementioned section, an increase of 486 MPa in YS was observed in the macroscale stress–strain curves (Figure 4). This improvement in hardness is attributed directly to the coherency strengthening provided by the γ′/γ″ precipitates in the heat-treated sample. Coherency strengthening results in work hardening and dislocation multiplication of the γ-matrix under the tip. The improvement in hardness is consistent with the macroscale mechanical testing and demonstrates the nanoindentation capability to measure the level of precipitation strengthening. However, the average modulus (Figure 8b) does not change significantly compared to the L-PBFAM condition. The modulus represented the cumulative elasticity of the γ-matrix (orientation-dependent) and volume fraction of fine micro-segregation in the L-PBFAM condition; for the heat-treated condition, it represented the cumulative effect of the γ-matrix and δ-precipitates. Note that the nanoscale length scale of the γ′/γ″ precipitates is significantly smaller than the length scale of the indenter, and therefore the instrument is not sensitive to the intrinsic elastic modulus of the γ′/γ″ precipitates.
The modulus and hardness maps of the heat-treated sample demonstrate a clear orientation relationship, with higher hardness and modulus observed for grains with near <111> orientation. This can be attributed to the orientation dependency of hardness due to the high mechanical anisotropy of IN718 and orientation-dependent coherency strengthening of the γ″-precipitates. A microscale variation in hardness is also observed in the map due to the variations in volume fraction, size, and orientation effect of the δ-phase. Rieli et al. [27] delineated the intrinsic hardness contribution of the δ-phase by high-resolution nanoindentation and reported that the hardness of the elliptical disc-shaped δ-phase is lower than the round-shaped δ-phase. However, the hardness of both types of δ-phases is reported to be higher than the γ-matrix. Furthermore, the γ-matrix embedded between the fine δ-phase undergoes significant dislocation localization due to the constraints provided by the hard δ-particles. Since the δ-phases nucleate at the dendritic boundary, their hardening effect is disproportionately high in the region with a mosaic segregation pattern.
To obtain further insights into the deformation mechanism under the nanoindentation tip, electron transparent foils were extracted from the grain with a <111> crystallographic orientation (as this crystal orientation shows the highest hardness in the map). A low-magnification TEM micrograph from this region is shown in Figure 9a. An extensive network of dislocation tangles is seen in the interiors and around the boundaries of the dislocation cells (Figure 9b). These cells were formed during the rapid solidification of IN718 during L-PBFAM, and in order to accommodate the nanoindentation-induced strain, dislocations were accumulated within the cell interior. Crisscrossed twin networks are observed in the low-magnification image (Figure 9a) and high-magnification dark-field image (Figure 9c) of the twinned region, illustrating hierarchical nanotwins and dislocation structures. One reason behind such a twin phenomenon is the lowering of the stacking fault energy (SFE) in IN718. The primary base element of IN718 is Ni, which is a high SFE material [51] and typically does not deform via twinning. However, alloying elements such as Al, Ti, and Mo are known to drastically reduce the SFE in Ni-based binary alloys [52]. Another reason behind the twin phenomenon can be attributed to the particle shearing mechanism due to the larger size (>10 nm) of the γ″-particles. In such cases, the particle shearing is accommodated by the passage of true crystallographic twins without changing the ordered nature of the D022 γ″-precipitates [53]. The dark-field micrograph (Figure 9c) shows the presence of a crisscrossed network if the nanotwins are enriched with dislocation structures. Along with precipitate hardening, these additional phenomena contribute to the observed superior nano-hardness in the heat-treated IN718.

4. Conclusions

A novel high-throughput investigation of complex deformation mechanisms in laser powder-bed fusion additively manufactured (L-PBFAM) Ni superalloy (IN718), before and after heat treatment, was performed by using high-resolution nanoindentation mapping and microstructural analysis. From the nanoindentation elastoplastic maps, the strong orientation dependency of hardness and modulus is attributed to the high anisotropy of IN718. Microscale variations in hardness in the L-PBFAM sample were attributed to the thermal gradients in the solid-solution γ-matrix. High hardness and modulus in the dendritic channel were due to the intrinsic elevated hardness of Nb, Mo-rich elemental segregation, and the formation of Laves phases in the inter-dendritic region. After heat treatment, the 67% rise in yield strength of the material is due to the activation of multimodal particle strengthening mechanisms. The nanoindentation map also captures the effect of precipitation strengthening. It delineates the orientation-dependent hardness distribution, which is contributed by a large variation in the Taylor factor among the various grain orientations and by a high degree of coherency strengthening by the D022 γ″-precipitates oriented parallel to the <001> crystal plane. The transmission electron microscopy of a deformed region under a nanoindentation tip revealed evidence of the extensive deformation of twin networks and dislocation cells.
The presented nanoindentation mapping is a quick and relatively non-destructive mechanical testing tool compared to traditional tensile testing, which is more laborious and leads to high material consumption. Furthermore, nanoindentation mapping provides insight into the mechanical response at multiple length scales. If applied over a wide range of L-PBFAM and heat-treatment conditions, it can be used as a high-throughput tool to optimize the future heat-treatment and L-PBFAM parameters of IN718. Advanced statistical and machine learning algorithms can be integrated to elevate such an analysis further.

Author Contributions

Conceptualization, A.D. and R.S.M.; methodology, A.D., P.A. and H.K.; software, A.D.; formal analysis, A.D.; investigation, A.D., P.A., S.G. and A.S.; resources, A.D., P.A., R.S.H., D.P., H.K., S.M., Y.Y., S.H.C.P. and W.Y.; data curation, A.D.; writing—original draft preparation, A.D.; writing—review and editing, P.A., R.S.H., S.G., A.S. and R.S.M.; visualization, A.D.; supervision, R.S.M.; project administration, R.S.M.; funding acquisition, R.S.M. All authors have read and agreed to the published version of the manuscript.

Funding

This research received no external funding.

Data Availability Statement

All data generated or analyzed during this study are included in this published article.

Acknowledgments

This work was partially supported by Hitachi America Limited. The authors acknowledge the Materials Research Facility at the University of North Texas for access to their electron microscopes.

Conflicts of Interest

The authors declare no conflict of interest.

References

  1. Blackwell, P.L. The Mechanical and Microstructural Characteristics of Laser-Deposited IN718. J. Mater. Process. Technol. 2005, 170, 240–246. [Google Scholar] [CrossRef]
  2. De Bartolomeis, A.; Newman, S.T.; Jawahir, I.S.; Biermann, D.; Shokrani, A. Future Research Directions in the Machining of Inconel 718. J. Mater. Process. Technol. 2021, 297, 117260. [Google Scholar] [CrossRef]
  3. Kolli, R.P.; Devaraj, A. A Review of Metastable Beta Titanium Alloys. Metals 2018, 8, 506. [Google Scholar] [CrossRef] [Green Version]
  4. DebRoy, T.; Wei, H.L.; Zuback, J.S.; Mukherjee, T.; Elmer, J.W.; Milewski, J.O.; Beese, A.M.; Wilson-Heid, A.; De, A.; Zhang, W. Additive Manufacturing of Metallic Components—Process, Structure and Properties. Prog. Mater. Sci. 2018, 92, 112–224. [Google Scholar] [CrossRef]
  5. Wang, Z.; Guan, K.; Gao, M.; Li, X.; Chen, X.; Zeng, X. The Microstructure and Mechanical Properties of Deposited-IN718 by Selective Laser Melting. J. Alloys Compd. 2012, 513, 518–523. [Google Scholar] [CrossRef]
  6. You, X.; Tan, Y.; Shi, S.; Yang, J.M.; Wang, Y.; Li, J.; You, Q. Effect of Solution Heat Treatment on the Precipitation Behavior and Strengthening Mechanisms of Electron Beam Smelted Inconel 718 Superalloy. Mater. Sci. Eng. A 2017, 689, 257–268. [Google Scholar] [CrossRef]
  7. Tajyar, A.; Brooks, N.; Holtham, N.; Rowe, R.; Newell, D.J.; Palazotto, A.N.; Davami, K. Effects of a Modified Heat-Treatment on Microstructure and Mechanical Properties of Additively Manufactured Inconel 718. Mater. Sci. Eng. A 2022, 838, 142770. [Google Scholar] [CrossRef]
  8. Zhou, L.; Mehta, A.; McWilliams, B.; Cho, K.; Sohn, Y. Microstructure, Precipitates and Mechanical Properties of Powder Bed Fused Inconel 718 before and after Heat Treatment. J. Mater. Sci. Technol. 2019, 35, 1153–1164. [Google Scholar] [CrossRef]
  9. Komarasamy, M.; Shukla, S.; Williams, S.; Kandasamy, K.; Kelly, S.; Mishra, R.S. Microstructure, Fatigue, and Impact Toughness Properties of Additively Manufactured Nickel Alloy 718. Addit. Manuf. 2019, 28, 661–675. [Google Scholar] [CrossRef]
  10. Khorasani, M.; Ghasemi, A.H.; Leary, M.; Sharabian, E.; Cordova, L.; Gibson, I.; Downing, D.; Bateman, S.; Brandt, M.; Rolfe, B. The Effect of Absorption Ratio on Meltpool Features in Laser-Based Powder Bed Fusion of IN718. Opt. Laser Technol. 2022, 153, 108263. [Google Scholar] [CrossRef]
  11. Jiang, R.; Mostafaei, A.; Pauza, J.; Kantzos, C.; Rollett, A.D. Varied Heat Treatments and Properties of Laser Powder Bed Printed Inconel 718. Mater. Sci. Eng. A 2019, 755, 170–180. [Google Scholar] [CrossRef]
  12. Ardell, A.J.; Huang, J.C. Antiphase Boundary Energies and the Transition from Shearing to Looping in Alloys Strengthened by Ordered Precipitates. Philos. Mag. Lett. 1988, 58, 189–197. [Google Scholar] [CrossRef]
  13. Mostafa, A.; Rubio, I.P.; Brailovski, V.; Jahazi, M.; Medraj, M. Structure, Texture and Phases in 3D Printed IN718 Alloy Subjected to Homogenization and HIP Treatments. Metals 2017, 7, 196. [Google Scholar] [CrossRef] [Green Version]
  14. Hosseini, E.; Popovich, V.A. A Review of Mechanical Properties of Additively Manufactured Inconel 718. Addit. Manuf. 2019, 30, 100877. [Google Scholar] [CrossRef]
  15. Mantri, S.A.; Dasari, S.; Sharma, A.; Alam, T.; Pantawane, M.V.; Pole, M.; Sharma, S.; Dahotre, N.B.; Banerjee, R.; Banerjee, S. Effect of Micro-Segregation of Alloying Elements on the Precipitation Behaviour in Laser Surface Engineered Alloy 718. Acta Mater. 2021, 210, 116844. [Google Scholar] [CrossRef]
  16. Liu, F.; Lyu, F.; Liu, F.; Lin, X.; Huang, C. Laves Phase Control of Inconel 718 Superalloy Fabricated by Laser Direct Energy Deposition via ı Aging and Solution Treatment. J. Mater. Res. Technol. 2020, 9, 9753–9765. [Google Scholar] [CrossRef]
  17. Mahadevan, S.; Nalawade, S.; Singh, J.B.; Verma, A.; Paul, B.; Ramaswamy, K. Evolution of δ Phase Microstructure in Alloy 718. In Proceedings of the 7th International Symposium on Superalloy, Pittsburgh, PA, USA, 10–13 October 2010; Volume 2, pp. 737–750. [Google Scholar] [CrossRef]
  18. Mishra, R.S.; Thapliyal, S. Design Approaches for Printability-Performance Synergy in Al Alloys for Laser-Powder Bed Additive Manufacturing. Mater. Des. 2021, 204, 109640. [Google Scholar] [CrossRef]
  19. Liu, Z.; Zhang, J.; He, B.; Zou, Y. High-Speed Nanoindentation Mapping of a near-Alpha Titanium Alloy Made by Additive Manufacturing. J. Mater. Res. 2021, 36, 2223–2234. [Google Scholar] [CrossRef]
  20. Dhal, A.; Thapliyal, S.; Gaddam, S.; Agrawal, P.; Mishra, R.S. Multiscale Hierarchical and Heterogeneous Mechanical Response of Additively Manufactured Novel Al Alloy Investigated by High-Resolution Nanoindentation Mapping. Sci. Rep. 2022, 12, 1–8. [Google Scholar] [CrossRef]
  21. Orozco-Caballero, A.; Gutierrez, C.; Gan, B.; Molina-Aldareguia, J.M. High-Throughput Nanoindentation Mapping of Cast IN718 Nickel-Based Superalloys: Influence of the Nb Concentration. J. Mater. Res. 2021, 36, 2213–2222. [Google Scholar] [CrossRef]
  22. Rielli, V.V.; Theska, F.; Yao, Y.; Best, J.P.; Primig, S. Local Composition and Nanoindentation Response of δ-Phase and Adjacent Γ′′-Free Zone in a Ni-Based Superalloy. Mater. Res. Lett. 2022, 10, 301–309. [Google Scholar] [CrossRef]
  23. Patil, D.A. Effects of Increasing Layer Thickness in the Laser Powder Bed Fusion of Inconel 718; Arizona State University: Tempe, AZ, USA, 2019; Volume 8. [Google Scholar]
  24. Sadowski, M.; Ladani, L.; Brindley, W.; Romano, J. Optimizing Quality of Additively Manufactured Inconel 718 Using Powder Bed Laser Melting Process. Addit. Manuf. 2016, 11, 60–70. [Google Scholar] [CrossRef]
  25. Zhong, Q.; Wei, K.; Lu, Z.; Yue, X.; Ouyang, T.; Zeng, X. High Power Laser Powder Bed Fusion of Inconel 718 Alloy: Effect of Laser Focus Shift on Formability, Microstructure and Mechanical Properties. J. Mater. Process. Technol. 2023, 311, 117824. [Google Scholar] [CrossRef]
  26. ASTM standard UNS N07718; Standard Specification for Precipitation-Hardening Nickel Alloy Plate, Sheet, and Strip for High-Temperature Service 1. ASTM International: West Conshohocken, PA, USA, 2010; Volume 07.
  27. Rielli, V.V.; Piglione, A.; Pham, M.S.; Primig, S. On the Detailed Morphological and Chemical Evolution of Phases during Laser Powder Bed Fusion and Common Post-Processing Heat Treatments of IN718. Addit. Manuf. 2022, 50, 102540. [Google Scholar] [CrossRef]
  28. Newell, D.J.; O’Hara, R.P.; Cobb, G.R.; Palazotto, A.N.; Kirka, M.M.; Burggraf, L.W.; Hess, J.A. Mitigation of Scan Strategy Effects and Material Anisotropy through Supersolvus Annealing in LPBF IN718. Mater. Sci. Eng. A 2019, 764, 138230. [Google Scholar] [CrossRef]
  29. Zhou, Y.Z.; Volek, A.; Green, N.R. Mechanism of Competitive Grain Growth in Directional Solidification of a Nickel-Base Superalloy. Acta Mater. 2008, 56, 2631–2637. [Google Scholar] [CrossRef]
  30. Pantawane, M.V.; Sharma, S.; Dasari, S.; Mantri, S.A.; Sharma, A.; Banerjee, R.; Banerjee, S.; Dahotre, N.B. Spatial Variation of Thermokinetics and Associated Microstructural Evolution in Laser Surface Engineered IN718: Precursor to Additive Manufacturing. Metall. Mater. Trans. A Phys. Metall. Mater. Sci. 2021, 52, 2344–2360. [Google Scholar] [CrossRef]
  31. Doi, M.; Miyazaki, T. Γ′ Precipitate Morphology Formed under the Influence of Elastic Interaction Energies in Nickel-Base Alloys. Mater. Sci. Eng. 1986, 78, 87–94. [Google Scholar] [CrossRef]
  32. Liu, P.; Wang, Z.; Xiao, Y.; Horstemeyer, M.F.; Cui, X.; Chen, L. Insight into the Mechanisms of Columnar to Equiaxed Grain Transition during Metallic Additive Manufacturing. Addit. Manuf. 2019, 26, 22–29. [Google Scholar] [CrossRef]
  33. Sundararaman, M.; Mukhopadhyay, P.; Banerjee, S. Precipitation of the δ-Ni3Nb Phase in Two Nickel Base Superalloys. Metall. Trans. A 1988, 19, 453–465. [Google Scholar] [CrossRef]
  34. Keiser, D.D. Review of the Physical Metallurgy of Alloy 718; Idaho National Engineering Lab.: Idaho Falls, ID, USA, 1976. [Google Scholar]
  35. Knezevic, M.; Ghorbanpour, S. Modeling Tensile, Compressive, and Cyclic Response of Inconel 718 Using a Crystal Plasticity Model Incorporating the Effects of Precipitates. In Proceedings of the 9th International Symposium on Superalloy 718 & Derivatives: Energy, Aerospace, and Industrial Applications; Springer International Publishing: New York, NY, USA, 2018; pp. 655–668. [Google Scholar] [CrossRef]
  36. Chaturvedi, M.C.; Han, Y.F. Strengthening Mechanisms in Inconel 718 Superalloy. Met. Sci. 1983, 17, 145–149. [Google Scholar] [CrossRef]
  37. Zenk, C.H.; Feng, L.; McAllister, D.; Wang, Y.; Mills, M.J. Shearing Mechanisms of Co-Precipitates in IN718. Acta Mater. 2021, 220, 117305. [Google Scholar] [CrossRef]
  38. Whitmore, L.; Ahmadi, M.R.; Stockinger, M.; Povoden-Karadeniz, E.; Kozeschnik, E.; Leitner, H. Microstructural Investigation of Thermally Aged Nickel-Based Superalloy 718Plus. Mater. Sci. Eng. A 2014, 594, 253–259. [Google Scholar] [CrossRef]
  39. Oblak, J.M.; Paulonis, D.F.; Duvall, D.S. Coherency Strengthening in Ni Base Alloys Hardened by DO22 Γ′ Precipitates. Metall. Trans. 1974, 5, 143–153. [Google Scholar] [CrossRef]
  40. Oliver, W.C.; Pharr, G.M. Measurement of Hardness and Elastic Modulus by Instrumented Indentation: Advances in Understanding and Refinements to Methodology. J. Mater. Res. 2004, 19, 3–20. [Google Scholar] [CrossRef]
  41. Shang, S.L.; Wang, W.Y.; Zhou, B.C.; Wang, Y.; Darling, K.A.; Kecskes, L.J.; Mathaudhu, S.N.; Liu, Z.K. Generalized Stacking Fault Energy, Ideal Strength and Twinnability of Dilute Mg-Based Alloys: A First-Principles Study of Shear Deformation. Acta Mater. 2014, 67, 168–180. [Google Scholar] [CrossRef]
  42. Wang, H.; Dhiman, A.; Ostergaard, H.E.; Zhang, Y.; Siegmund, T.; Kruzic, J.J.; Tomar, V. Nanoindentation Based Properties of Inconel 718 at Elevated Temperatures: A Comparison of Conventional versus Additively Manufactured Samples. Int. J. Plast. 2019, 120, 380–394. [Google Scholar] [CrossRef]
  43. Nix, W.D.; Gao, H. Indentation Size Effects in Crystalline Materials: A Law for Strain Gradient Plasticity. J. Mech. Phys. Solids 1998, 46, 411–425. [Google Scholar] [CrossRef]
  44. Liu, S.Y.; Li, H.Q.; Qin, C.X.; Zong, R.; Fang, X.Y. The Effect of Energy Density on Texture and Mechanical Anisotropy in Selective Laser Melted Inconel 718. Mater. Des. 2020, 191, 108642. [Google Scholar] [CrossRef]
  45. Kumara, C.; Deng, D.; Moverare, J.; Nylén, P. Modelling of Anisotropic Elastic Properties in Alloy 718 Built by Electron Beam Melting. Mater. Sci. Technol. 2018, 34, 529–537. [Google Scholar] [CrossRef]
  46. Deng, D.; Peng, R.L.; Brodin, H.; Moverare, J. Microstructure and Mechanical Properties of Inconel 718 Produced by Selective Laser Melting: Sample Orientation Dependence and Effects of Post Heat Treatments. Mater. Sci. Eng. A 2018, 713, 294–306. [Google Scholar] [CrossRef]
  47. Krier, J.; Breuils, J.; Jacomine, L.; Pelletier, H. Introduction of the Real Tip Defect of Berkovich Indenter to Reproduce with FEM Nanoindentation Test at Shallow Penetration Depth. J. Mater. Res. 2012, 27, 28–38. [Google Scholar] [CrossRef]
  48. Zong, W.J.; Wu, D.; He, C.L. Radius and Angle Determination of Diamond Berkovich Indenter. Meas. J. Int. Meas. Confed. 2017, 104, 243–252. [Google Scholar] [CrossRef]
  49. Ye, C.; Chen, J.; Xu, M.; Wei, X.; Lu, H. Multi-Scale Simulation of Nanoindentation on Cast Inconel 718 and NbC Precipitate for Mechanical Properties Prediction. Mater. Sci. Eng. A 2016, 662, 385–394. [Google Scholar] [CrossRef]
  50. Luo, W.; Kirchlechner, C.; Li, J.; Dehm, G.; Stein, F. Composition Dependence of Hardness and Elastic Modulus of the Cubic and Hexagonal NbCo2 Laves Phase Polytypes Studied by Nanoindentation. J. Mater. Res. 2020, 35, 185–195. [Google Scholar] [CrossRef]
  51. Carter, C.B.; Holmes, S.M. The Stacking-Fault Energy of Nickel. Philos. Mag. 1977, 35, 1161–1171. [Google Scholar] [CrossRef]
  52. Dodaran, M.S.; Guo, S.; Khonsari, M.M.; Shamsaei, N.; Shao, S. A Theoretical Calculation of Stacking Fault Energy of Ni Alloys: The Effects of Temperature and Composition. Comput. Mater. Sci. 2021, 191, 110326. [Google Scholar] [CrossRef]
  53. Sundararaman, M.; Mukhopadhyay, P.; Banerjee, S. Deformation Behaviour of Γ″ Strengthened Inconel 718. Acta Metall. 1988, 36, 847–864. [Google Scholar] [CrossRef]
Figure 1. Pool structure, grain morphology, and grain orientation correspond to the XZ plane of the L-PBFAM sample illustrated by: (a) optical image and (b) EBSD-IPF map.
Metals 13 00420 g001
Figure 2. L-PBFAM-induced segregation behavior: (a) BSE image shows both columnar and mosaic micro-segregation patterns, (b) high-magnification BSE shows bright globular structures ascribed to Laves phases due to low solubility element segregation in the dendric channels, (c) bright-field TEM illustrates solidification-induced dislocation structures in between the dendritic spaces, (d) heavy dislocation accumulation near the Laves phases in the dendritic region, and (d1) SAD pattern of the micrograph.
Metals 13 00420 g002
Figure 3. Precipitation phenomenon after heat treatment: (a) BSE image showing δ-phases in grain and cell boundaries, (b) SAD pattern corresponding to various phases in the heat-treated sample, (c) low-magnification dark-field TEM micrograph shows a crisscross network of γ′/γ″, δ-phases, and adjoining precipitate-free zone, (d) high-magnification dark-field image shows finer details of γ′/γ″ phases, and (e) coherency strain around γ′-γ″ phases.
Metals 13 00420 g003
Figure 4. Macroscale mechanical study: (a) schematic showing location of miniaturized tensile sample used for the study, (b) true stress–true plastic strain curve of L-PBFAM sample, and (c) true stress–true plastic strain response of the heat-treated sample.
Metals 13 00420 g004
Figure 5. Nanomechanical investigation of L-PBFAM IN718: (a) nano-hardness, (a1) signatures of solidification gradients are illustrated in the high magnification of nano-hardness map, (b) modulus, and (c) EBSD-IPF map of the nanoindented region used for orientation-dependent micromechanical correlation.
Metals 13 00420 g005
Figure 6. Delineating nanomechanical responses of γ-matrix and segregation-rich region: (a) Ph, (b) Hh curves of L-PBFAM sample, and (c) BSE image showing the location of the indents with respect to the γ-matrix and segregation.
Metals 13 00420 g006
Figure 7. Nanomechanical investigation of heat-treated IN718: (a) nano-hardness, (b) modulus, and (c) EBSD-IPF map.
Metals 13 00420 g007
Figure 8. Statistical distribution of elastoplastic properties in L-PBFAM and heat-treated samples: (a) hardness and (b) modulus.
Metals 13 00420 g008
Figure 9. TEM micrograph under the nanoindentation tip showing: (a) extensive twin network, (b) dislocation accumulation between the solidification-induced dislocation cells, (c) dark-field micrograph reveals the presence of nanotwins and dislocation structure in the twinned region, and (c1) SAD pattern corresponding to the twinned region.
Metals 13 00420 g009
Table 1. Chemical composition of IN718 powder as certified by the supplier (trace elements are not mentioned).
ElementCSiMnNiCrMoCuAlTiNbFe
Wt. %0.0370.180.1752.6018.803.060.030.560.955.16Bal.
Disclaimer/Publisher’s Note: The statements, opinions and data contained in all publications are solely those of the individual author(s) and contributor(s) and not of MDPI and/or the editor(s). MDPI and/or the editor(s) disclaim responsibility for any injury to people or property resulting from any ideas, methods, instructions or products referred to in the content.

