Article

Eutectoid Transformation Kinetics of FeO under N2 and Air Atmospheres

State Key Laboratory of Rolling and Automation, Northeastern University, Shenyang 110819, China
*
Author to whom correspondence should be addressed.
Metals 2023, 13(2), 220; https://doi.org/10.3390/met13020220
Submission received: 15 November 2022 / Revised: 28 December 2022 / Accepted: 20 January 2023 / Published: 24 January 2023
(This article belongs to the Special Issue High Temperature Corrosion or Oxidation of Metals and Alloys)

Abstract

:
The effect of different oxygen content on eutectoid transformation kinetics in FeO were studied in this paper. Thermogravimetric analysis was employed to investigate the eutectoid reaction in the oxide formed on pure Fe after being exposed to air at 900 °C for 10 min. The oxidized specimens were held isothermally in N2 and air from 100 s to 10,000 s in the temperature range of 350 to 550 °C, and the morphologies in FeO were observed by electron probe microanalysis. The results of the eutectoid transformation are statistically analyzed, and the dynamic model of the FeO eutectoid transformation is established based on the Johnson-Mehl-Avrami-Kolmogorov equation. Combined with the measured values and the calculation results, the time of eutectoid reaction in air is earlier than that in N2. Under the experimental conditions, the formation of Fe3O4 seams can occur at the interface of the FeO-substrate after the eutectoid reaction has begun, which means the eutectoid reaction is more determined by local ion concentration changes. At the Fe3O4-FeO interface, there is a high concentration enrichment of Fe ions, giving priority to the formation of Fe-rich FeO, which makes the eutectoid phase transition time earlier than in N2 conditions.

1. Introduction

During the hot rolling process, an Fe-oxide scale forms on the surface of the strip. In the subsequent cooling process, the interior of the oxide scale undergoes phase transformation as the temperature decreases, and oxide scale structures with different structures are finally obtained [1]. The transformation into FeO is an important factor affecting the scale structure at room temperature [2,3]. The phase transformation process determines the subsequent processing properties of the steel and has a decisive impact on the stamping resistance, pickling behavior, and atmospheric corrosion resistance of the strip surface [4,5,6], so that controlling the phase transformation behavior of the oxide layer is crucial to improving the steel quality [7,8].
Many factors can affect the phase transformation in the oxide scale, such as the temperature [9], alloy elements [10,11], the growth environment of the oxide layer, and the residual stress [12] in the oxide scale. In this regard, many scholars have also conducted a large number of experimental studies and discussed the phase transition mechanism in various situations. Shigenari Hayashi [13,14] conducted an in-depth study on the eutectoid transformation behavior of pure Fe and believed that the eutectoid reaction was mainly based on (1) growth of the outer Fe3O4 layer and/or precipitation of Fe3O4, (2) formation of the Fe3O4 Seam, and (3) the eutectoid reaction in FeO. For the formation of the Fe3O4 Seam layer, Yuta Shizukawa [15] founded that the formation of the Fe3O4 Seam layer at the FeO-Substrate interface may be due to the low activation energy of Fe precipitation. Compared with the oxidation experiments of Fe-Au alloys, it was confirmed that the inward diffusion layer of Fe through the FeO/Fe interface promotes the occurrence of the eutectoid reaction. In terms of the effect of alloying elements, Suzue Yoneda [16] analyzed the effect of the Mn element with eutectoid transformation. He found that a 2 wt.% Mn addition in the Fe substrate can delay the proeutectoid and eutectoid transformations significantly. Zhi-feng Li [17] et al. compared the oxidation behavior in dry and wet air. Voids were formed in the oxide scale under wet air, and the pores fixed the gap between the new phase and the original phase, and grain boundaries inhibit the growth of new phases. Shigenari Hayashi et al. [12] used in situ high temperature X-ray diffraction to measure the stress development of oxide scales formed from pure iron. The results showed that the isothermal transformation leads to the compressive stress of Fe3O4 and Fe in the isothermal structure. This compressive stress was relaxed in the isothermal heat treatment after the homogeneous reaction.
In the actual production of hot-rolled steel strips, the phase transition environment during cooling after coiling is quite different. As shown in Figure 1, the strip produced has visible color differences at the edge and center because of the difference in oxide scale structure. At the edge position and the outermost ring of the strip coil after coiling, it is still in the external environment and can be in direct contact with air, while the center position is in a relatively oxygen-poor environment. This difference is more pronounced when the thickness specification of the steel strip is less than 6 mm. In addition to the difference in cooling rate caused by different coil positions, the phase transition environment may also affect the process of eutectoid reaction.
In this paper, pure-Fe oxide scale was used as the raw experimental material, and the different atmospheric environments (Air/N2) for different durations of isothermal transformation processes were used to simulate normal oxygen content and extreme low oxygen content. The influence of the atmosphere was analyzed, and the role and mechanism of oxygen in the environment in phase transition behavior were clarified.

2. Experimental Procedure

Samples with dimensions of 10 mm × 8 mm × 2 mm were cut from high-purity Fe sheets (>99.99%) and normalized under vacuum at 920 °C for 20 min to remove strain and elongated grain structure. The samples were ground on silicon carbide abrasion paper to 1500 grit and then ultrasonically cleaned with acetone before oxidation and isothermal transformation tests.
Experiments were performed using a SETARAM thermal gravimetric analyzer (KEP Technologies, Lyon, France). The heating process is shown in Figure 2. The sample was first placed in the furnace chamber of the apparatus and evacuated, and then N2 was introduced into it at standard atmospheric pressure. The sample was raised to 900 °C with a heating rate of 60 °C/min, and then passed through air at a rate of 100 mL/min for 10 min before being cooled to the set holding temperature (350–550 °C at a rate of 60 °C/min) and kept warm. The holding time was set to (100/500/1000/5000/10,000 s) and then cooled to room temperature at a rate of 60 °C/min.
The cross-sections of the samples after the experiment were mounted and then ground to 1500 grit along the direction of the oxide scale. Polishing was performed using a mechanical polisher at a rate of 500 rpm/min, and the section was etched with hydrochloric acid and alcohol. The cross-section of the corroded sample was detected and analyzed using the backscattering mode of the JXA-8530F electron probe microanalysis (EPMA) (JEOL Ltd., Tokyo, Japan). The proportion of eutectoid structure under each atmosphere and temperature (the white area marked with eutectoid Fe/Fe3O4 in Figure 2) in FeO (the area indicated by the red dotted line) was calculated.

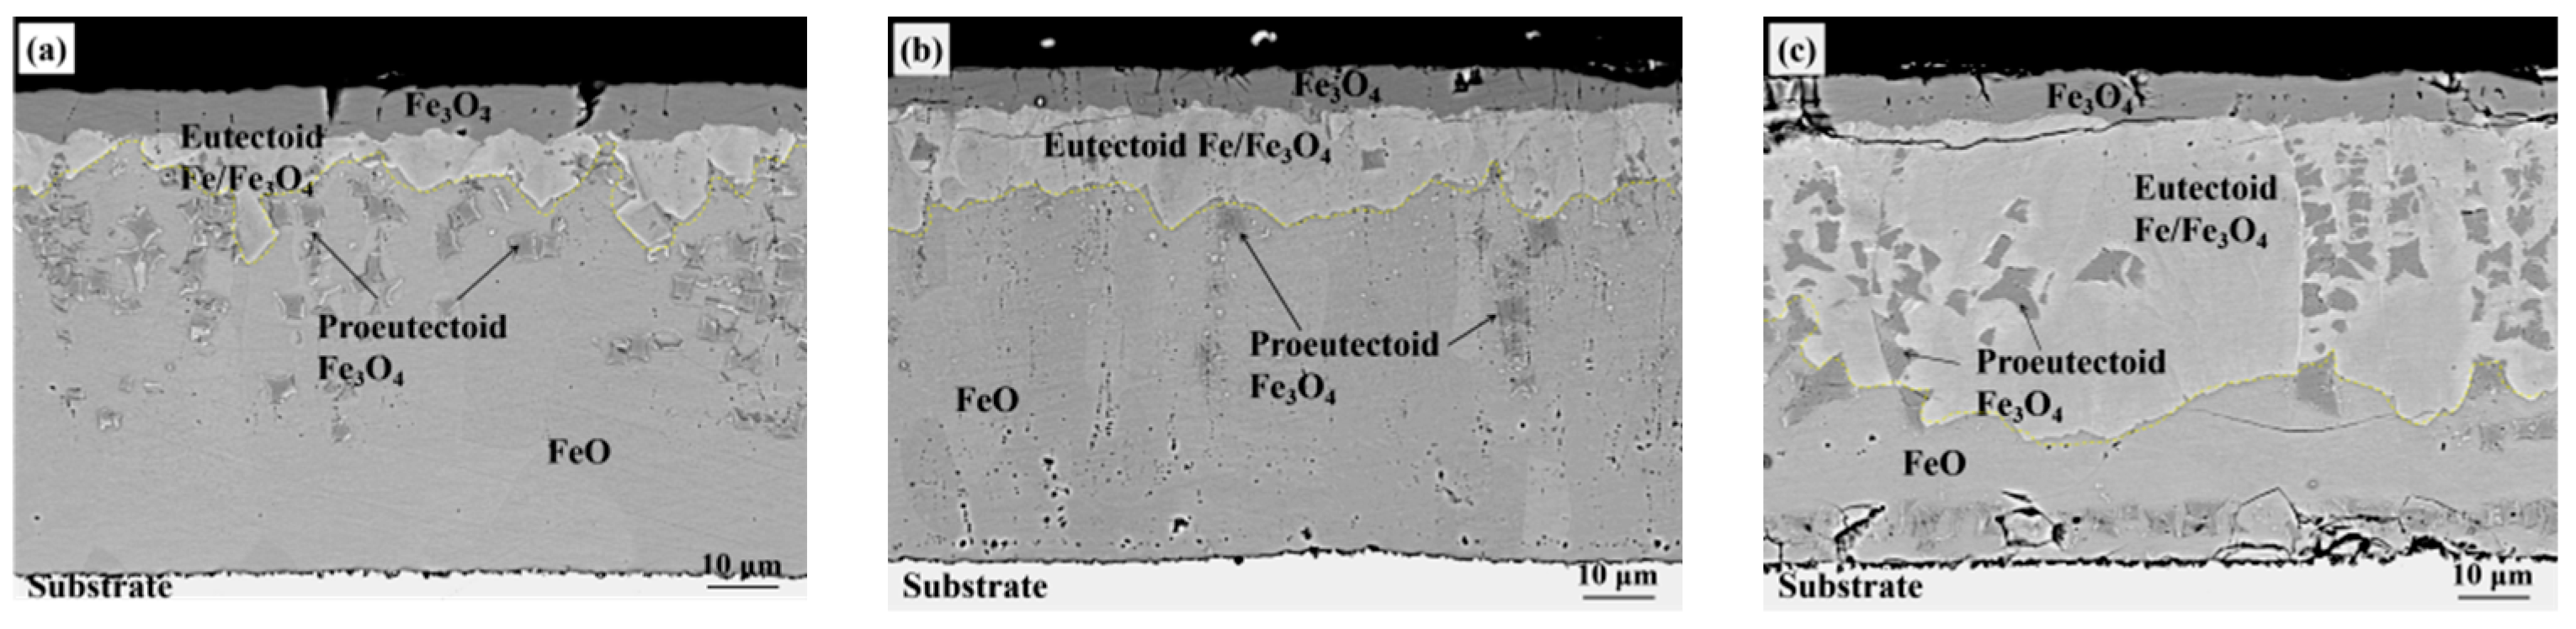
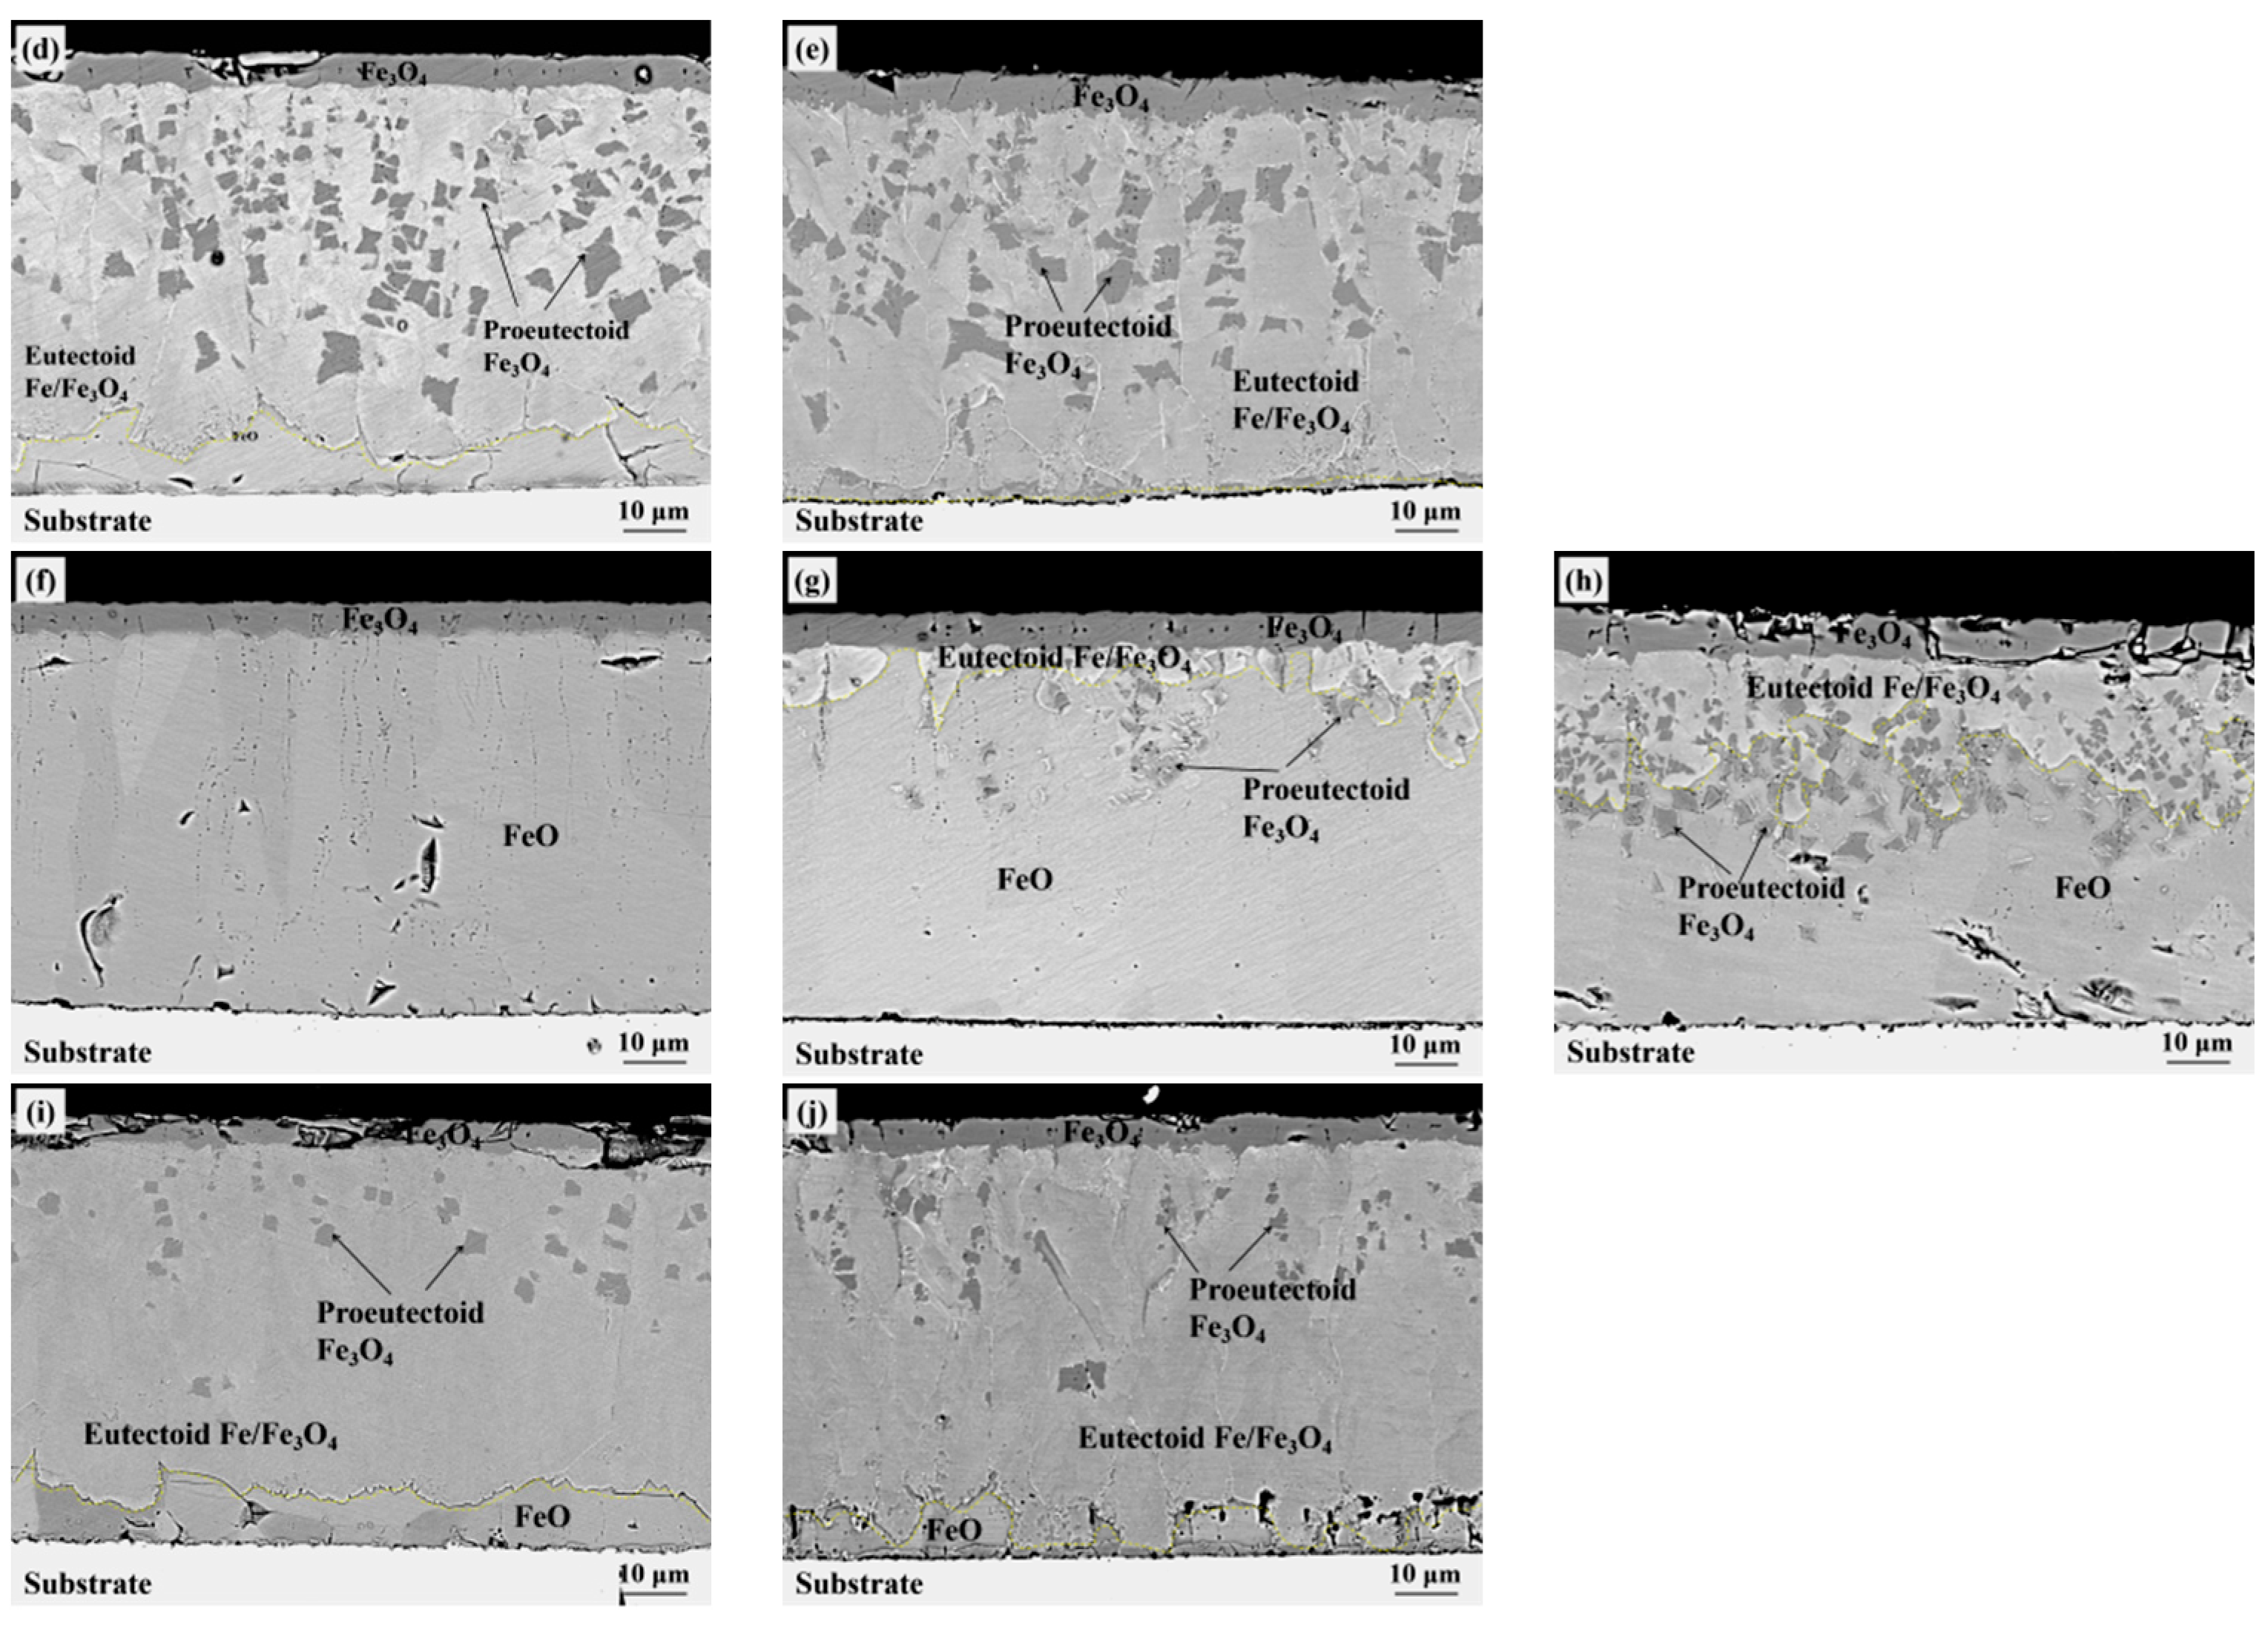
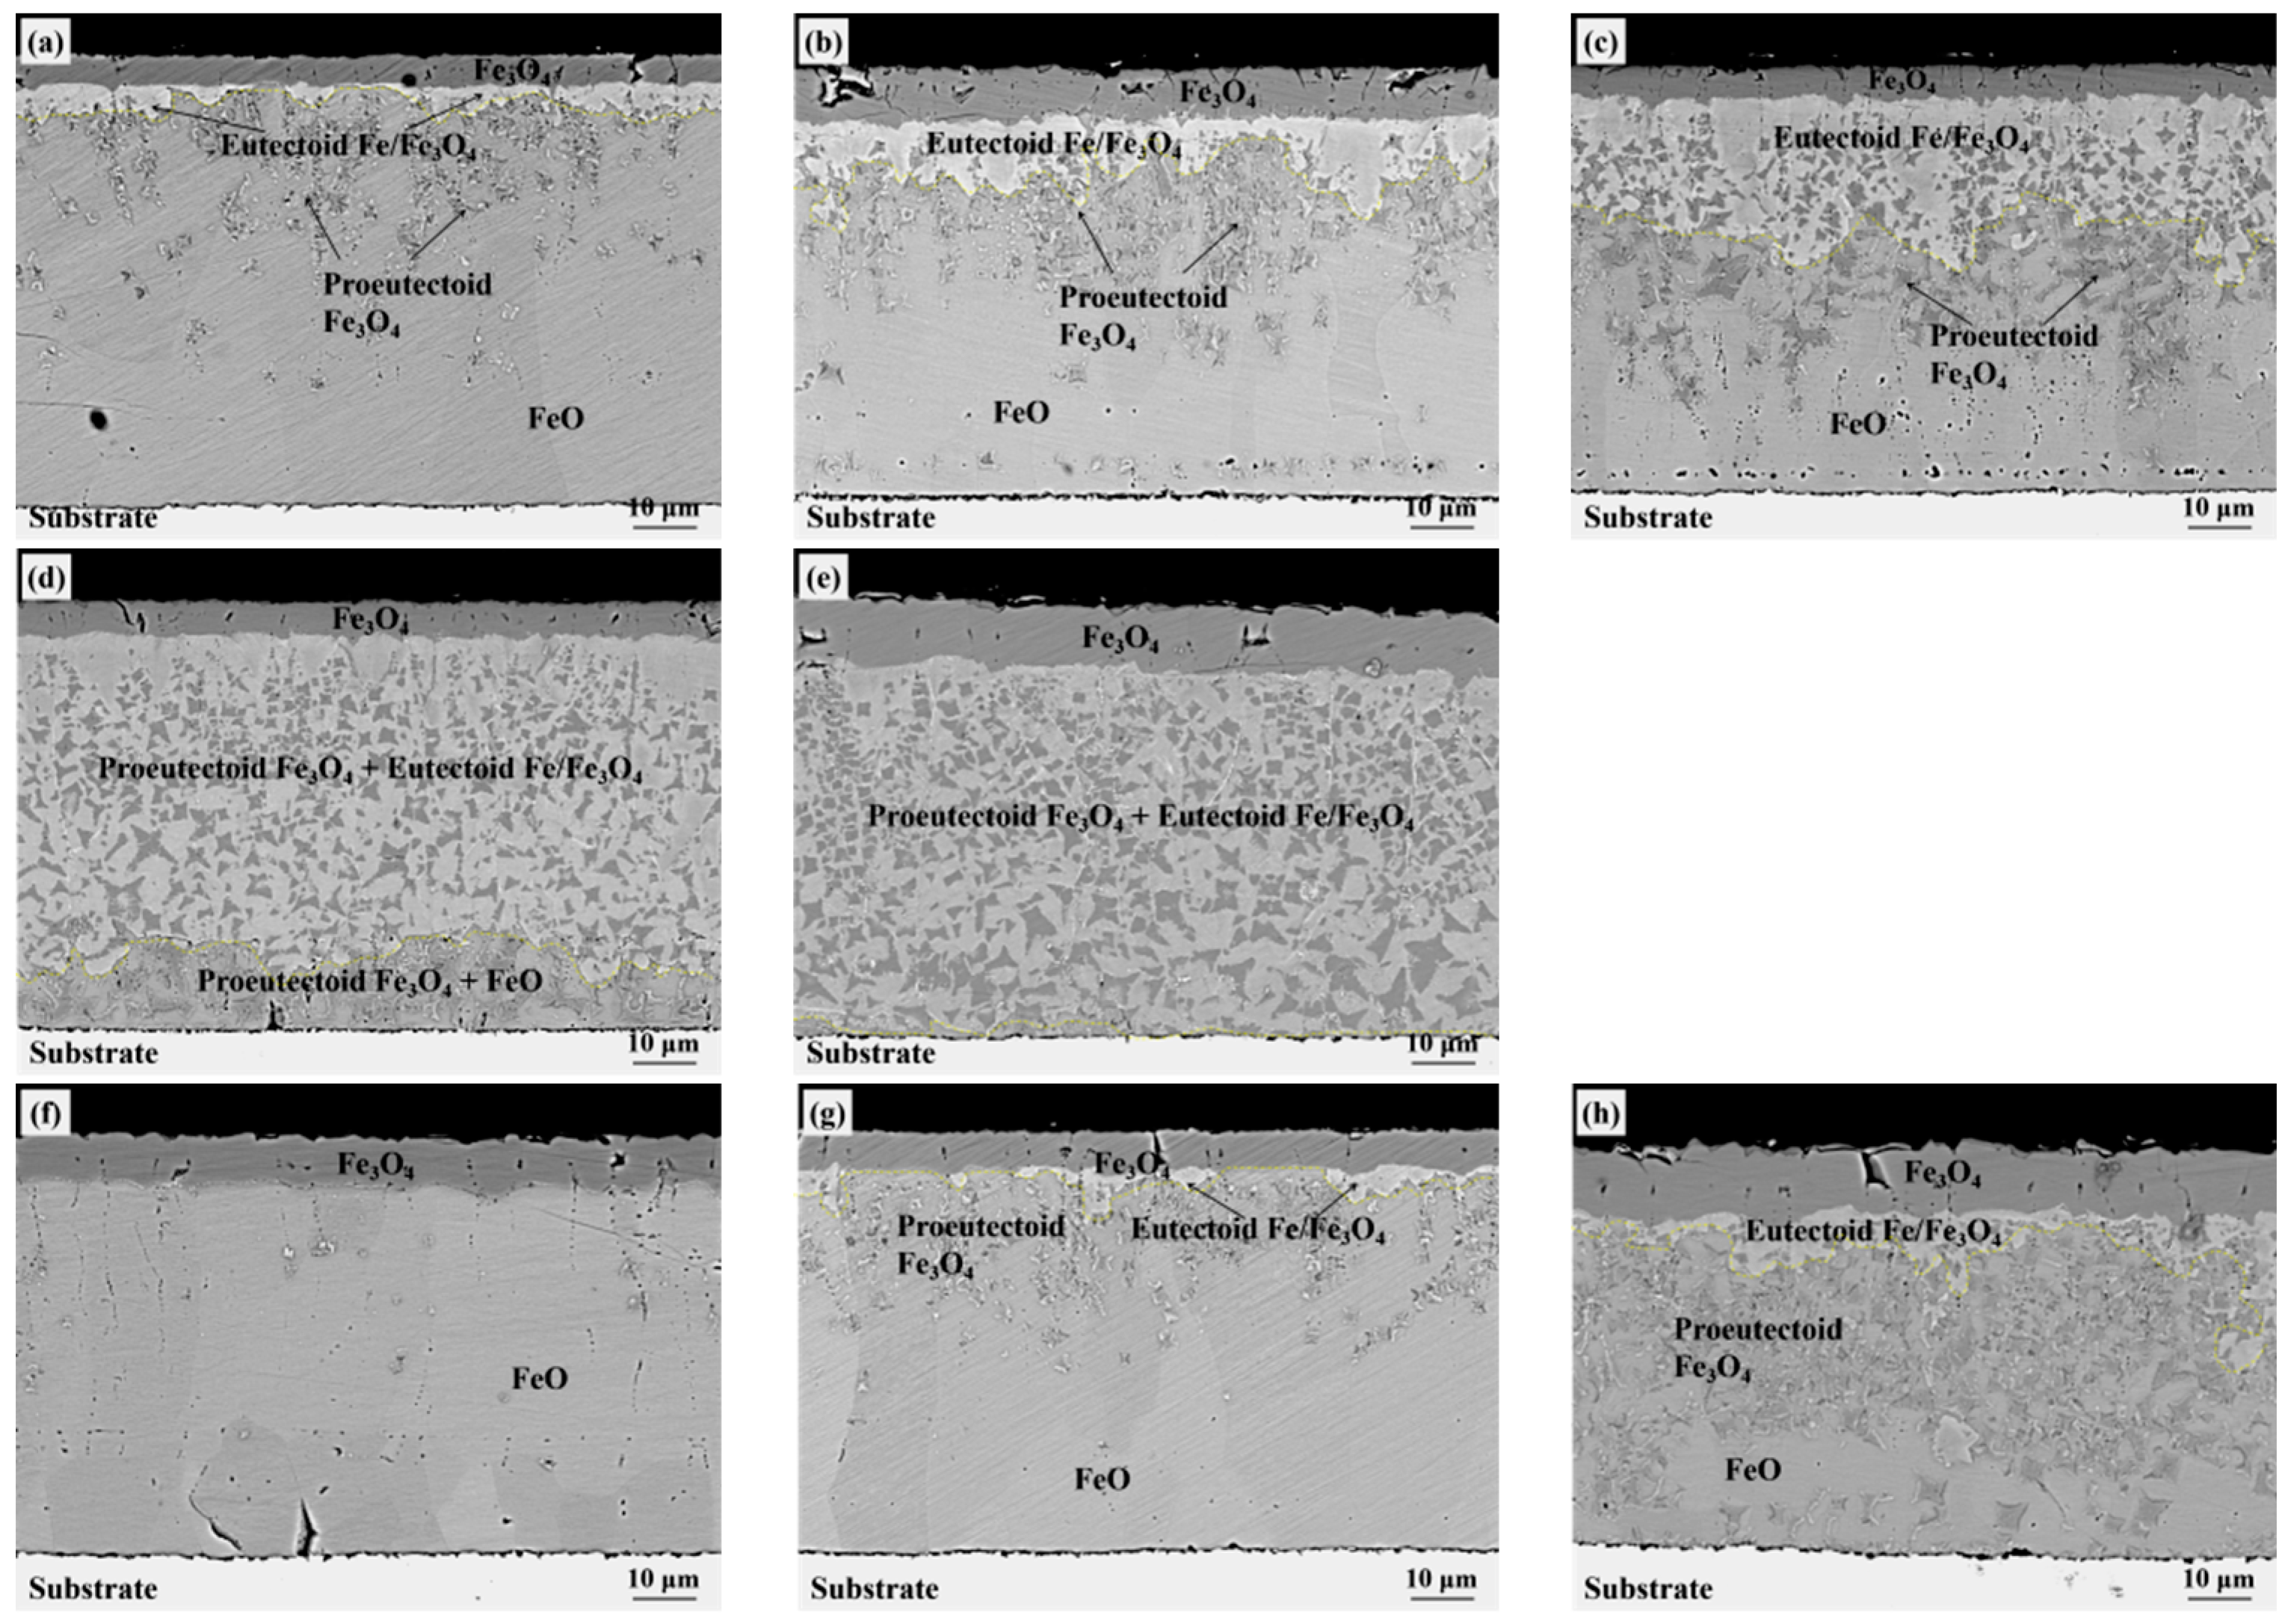
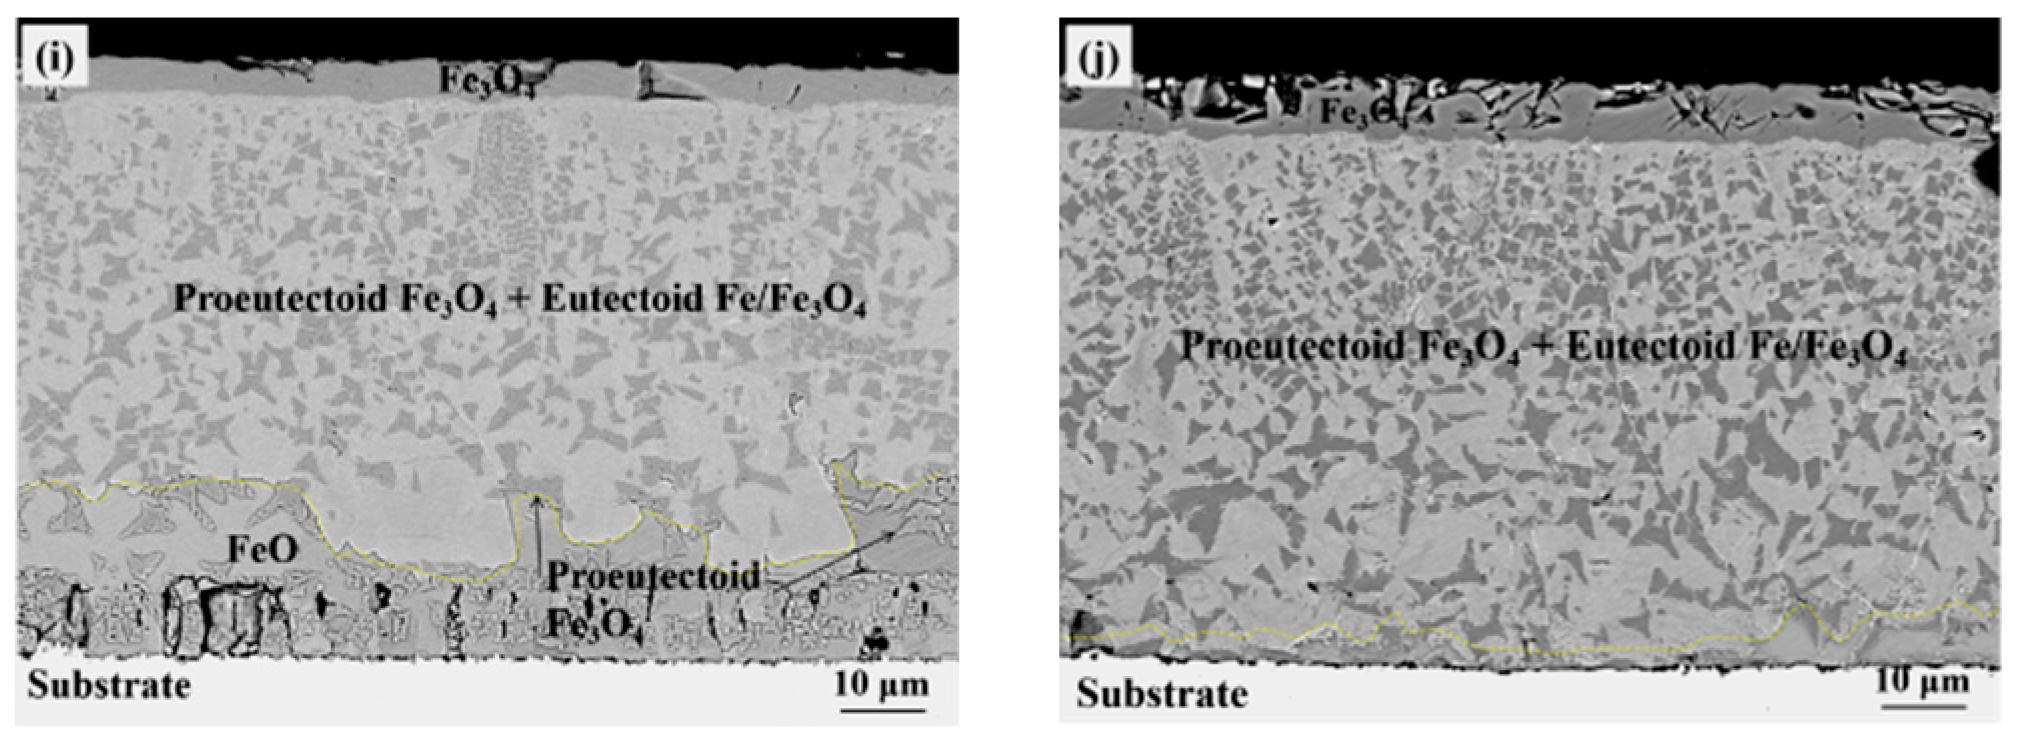
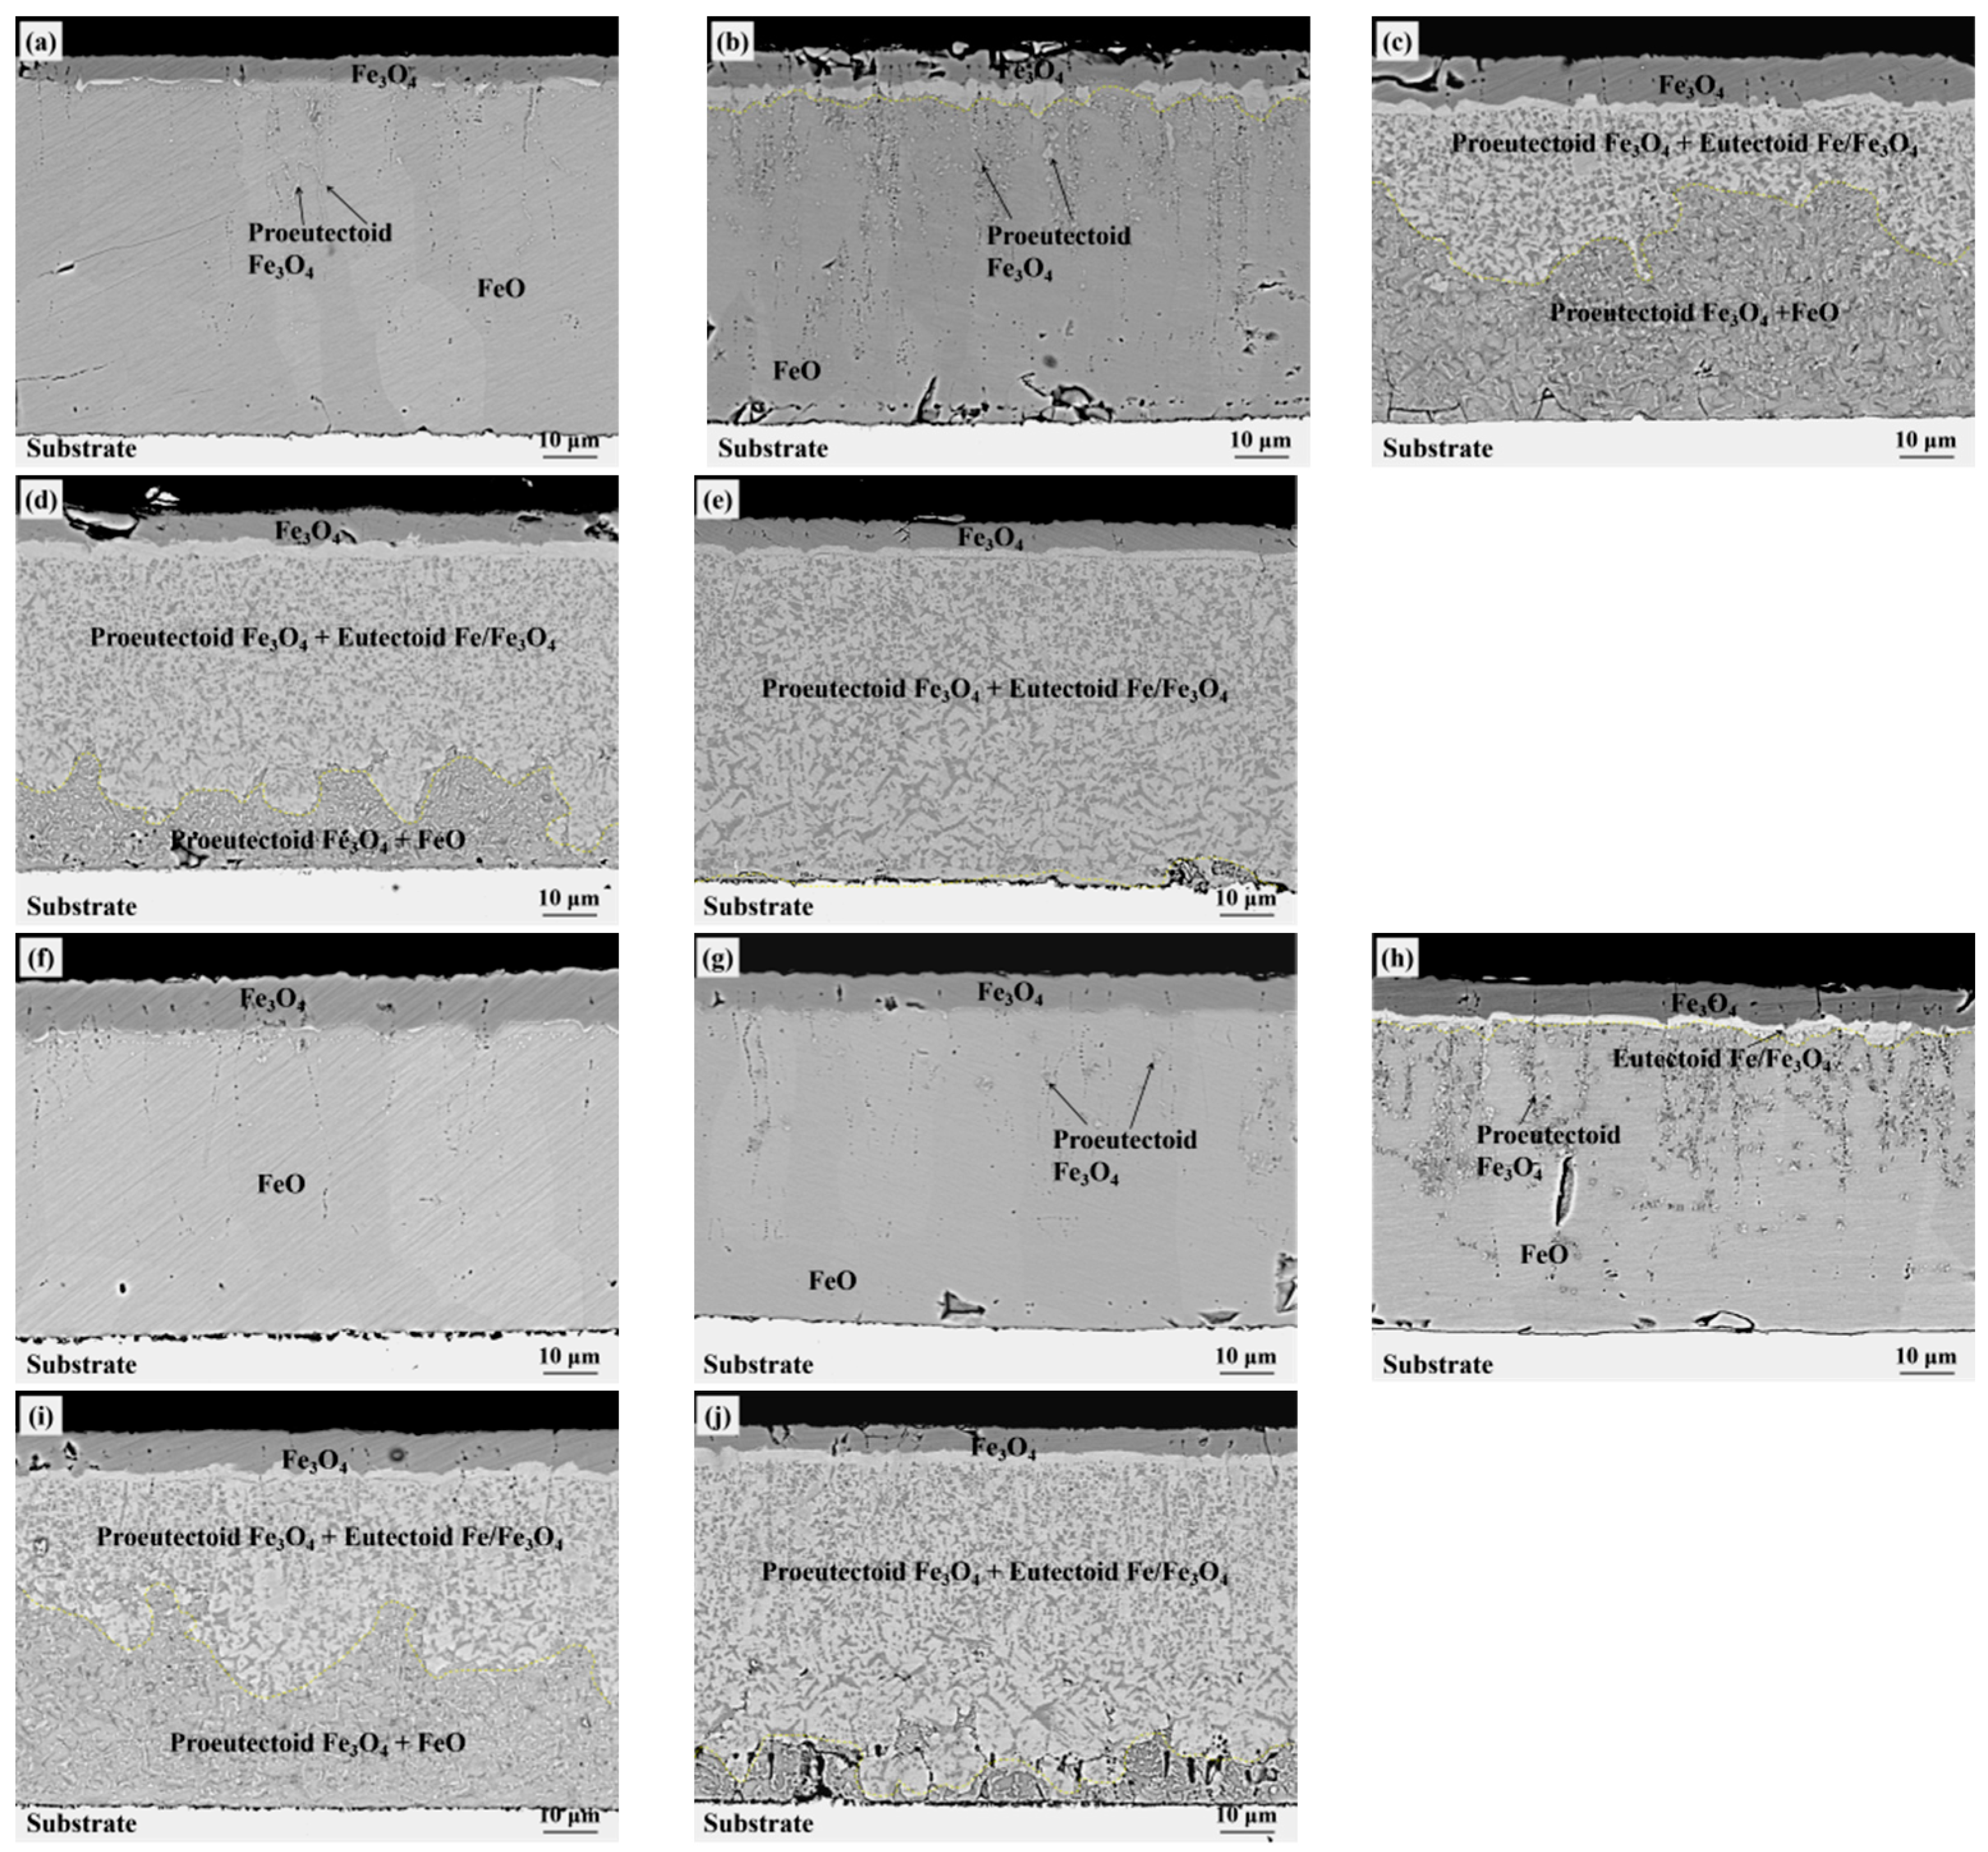
3. Experiment Results

Figure 3 shows the oxide structure obtained by isothermal operation in air and an N2 environment at 550 °C. In the N2 atmosphere, the oxides formed in 100–10,000 s are mainly outer Fe3O4 and inner FeO. At the same time, a small amount of diamond-shaped proeutectoid Fe3O4 appears in the interior of FeO. The size of the proeutectoid Fe3O4 increases obviously, and FeO has no eutectoid structure. Under the condition that air is isothermal, the oxides formed are similar to the results of phase transformation in an N2 atmosphere; the difference is that the proportion of the outer Fe3O4 layer increases during the phase transformation in air.
Figure 4 shows the oxide structures obtained under different isothermal conditions at 500 °C in air and N2 environments. When isothermal in air for 500 s, the eutectoid structure has already formed at the Fe3O4-FeO interface, while in the N2 environment, it is composed of Fe3O4 and FeO before 500 s, and the eutectoid structure will not appear until the isothermal temperature reaches 1000 s. With the extension of isothermal time, the eutectoid structure continued to grow into the oxide scale. When times are exposed for 10,000 s, the proportion of eutectoid transformation reaches more than 85% in air and 60% in N2.
Figure 5 shows the oxide structures obtained under different isothermal conditions at 450 °C in air and N2 environments. The time of the overall eutectoid reaction in both environments was significantly earlier than that at 500 °C. Especially in the air environment, the eutectoid structure has begun to appear at the Fe3O4-FeO interface within 100 s. The eutectoid structure has also begun to appear at the Fe3O4-FeO interface after 500 s in the N2 environment. The volume of eutectoid phase transition in FeO is more than 90% at 10,000 s in both air and N2 environments, which indicates the transformation is complete.
In the results of eutectoid transformation at 400 °C, shown in Figure 6, the start time of the eutectoid transformation is similar to the results at 450 °C, that is, isothermal for 100 s under air and 500 s under N2, at which point the eutectoids at the Fe3O4-FeO interface have begun to appear, and at the time point when the eutectoid reaction is complete, both of them reach the complete eutectoid reaction in 10,000 s. However, the process of eutectoid reaction in air is obviously faster than that in N2.
Figure 7 shows the oxide structures obtained under different isothermal times at 350 °C in air and N2 environments. Different from the independent and bulky growth mode above 400 °C, at this temperature, the formed proeutectoid Fe3O4 presents a large-area small block distribution, and the eutectoid structure grows in the gaps of the proeutectoid Fe3O4. The eutectoid structure first appeared in the air at an isothermal temperature of 500 s, and the eutectoid structure did not appear until 1000 s under the N2 condition. Under different conditions, both of the eutectoid phase transition processes took about 10,000 s.
With the structural changes of the oxide scale, it can be seen that at the same temperature, proeutectoid Fe3O4 will be formed in FeO, and its nucleation quantity is related to unit volume and isothermal temperature; the eutectoid structure begins to appear at the Fe3O4-FeO interface and gradually grows to the FeO-substrate interface. By comparison, two interesting phenomena occurred in this experiment. The first is the eutectoid reaction in air, which always takes priority with the N2 environment at the same time. The second is that proeutectoid Fe3O4 is formed in FeO, and a continuous Fe3O4 seam layer doesn’t form before the eutectoid reaction starts.

4. Discussion

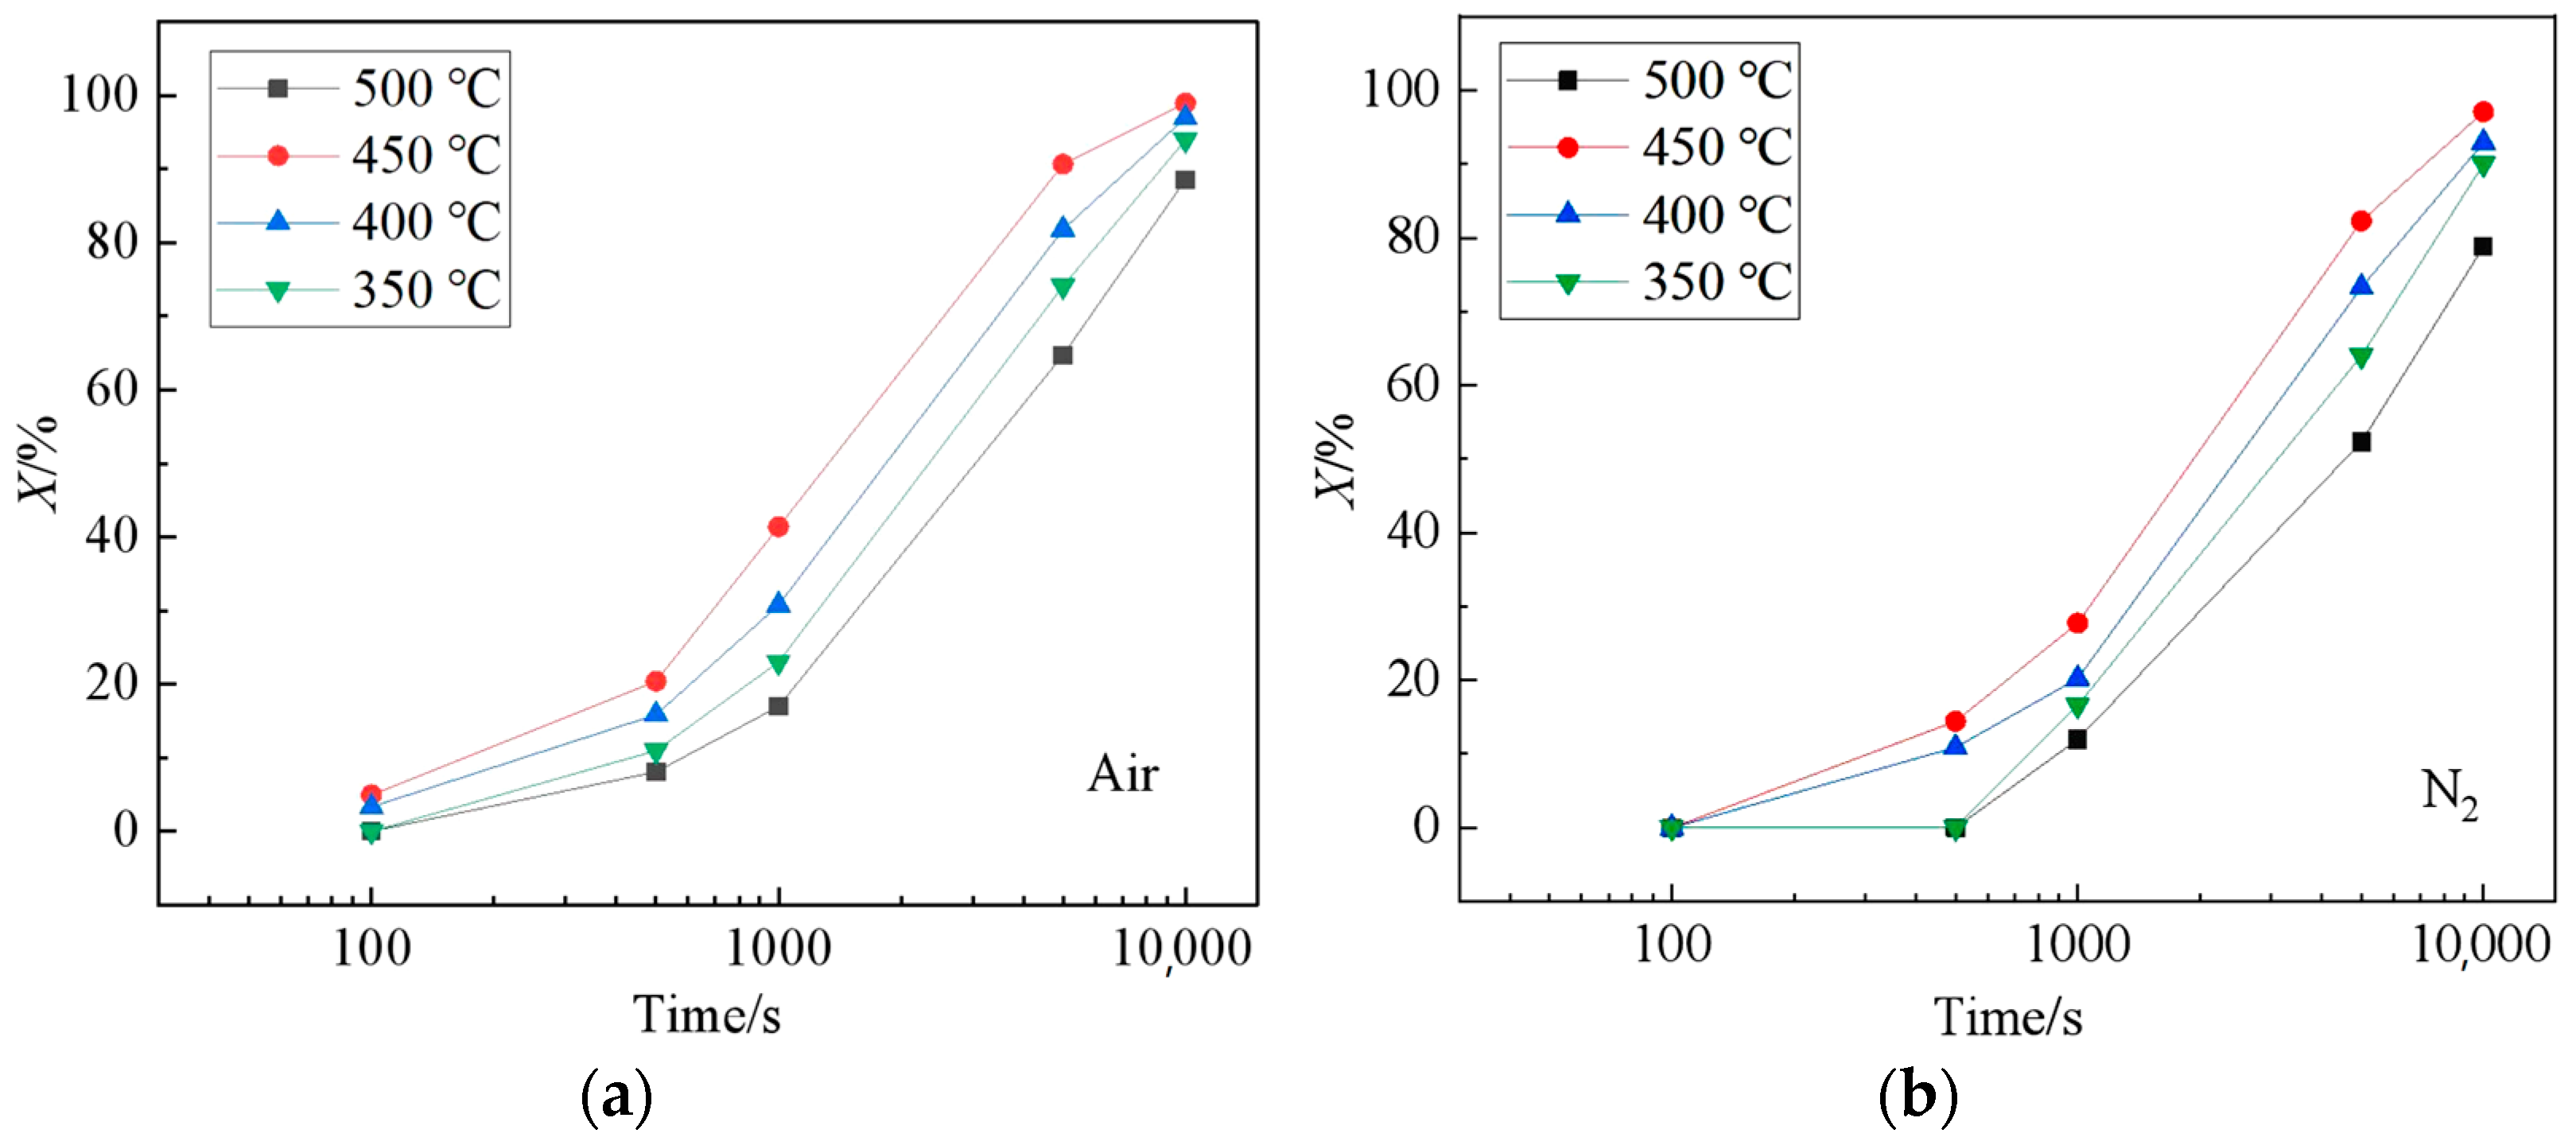
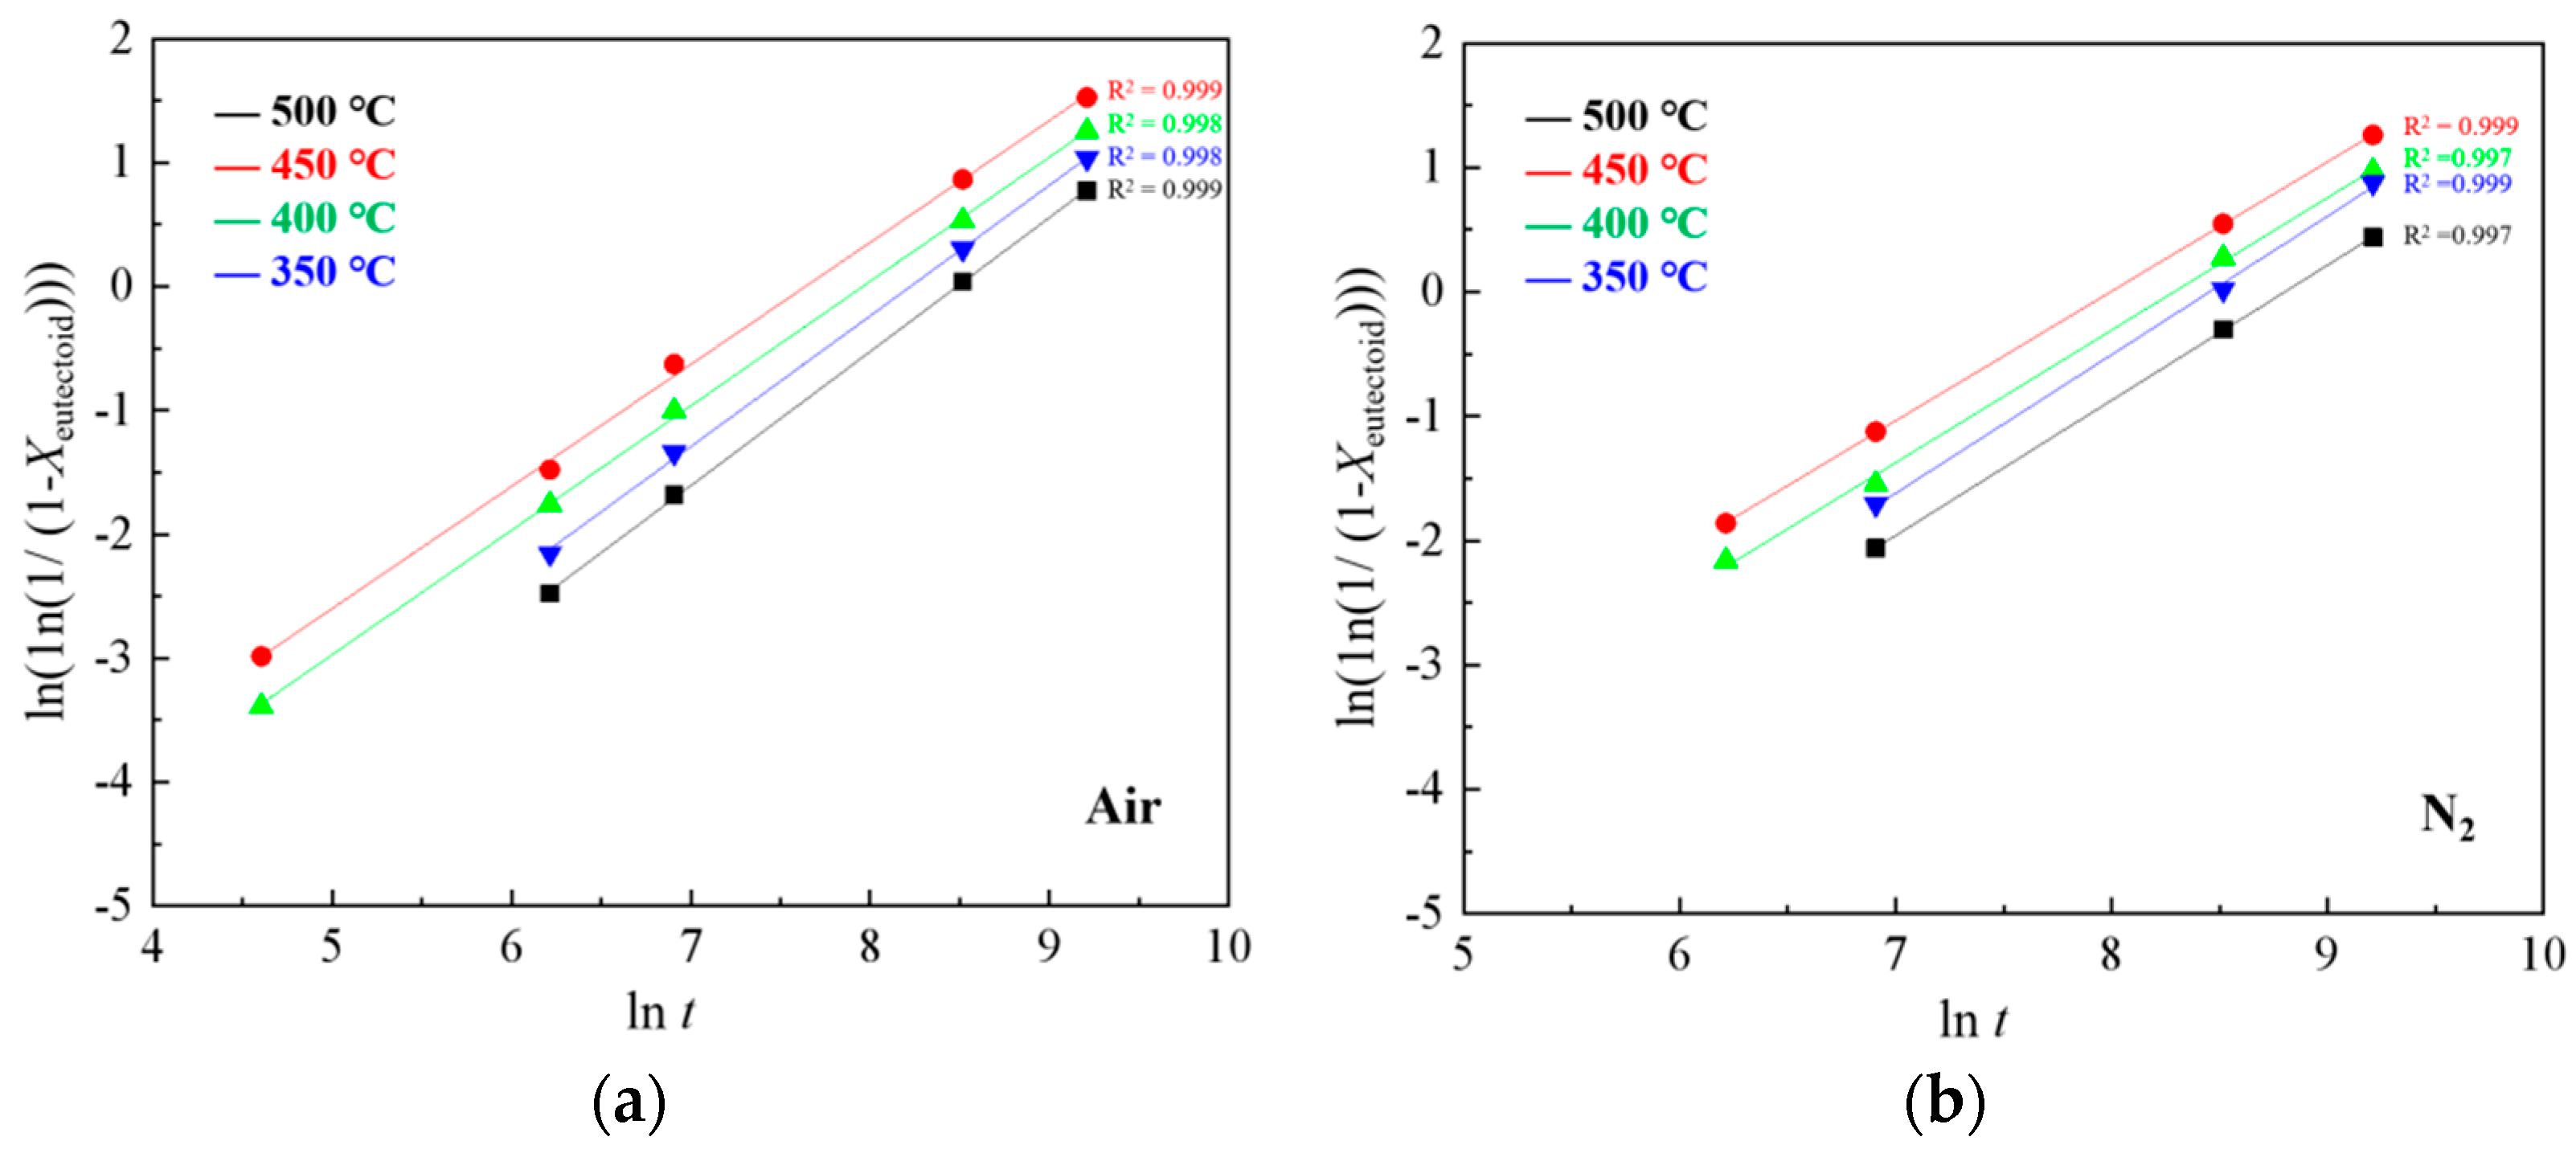
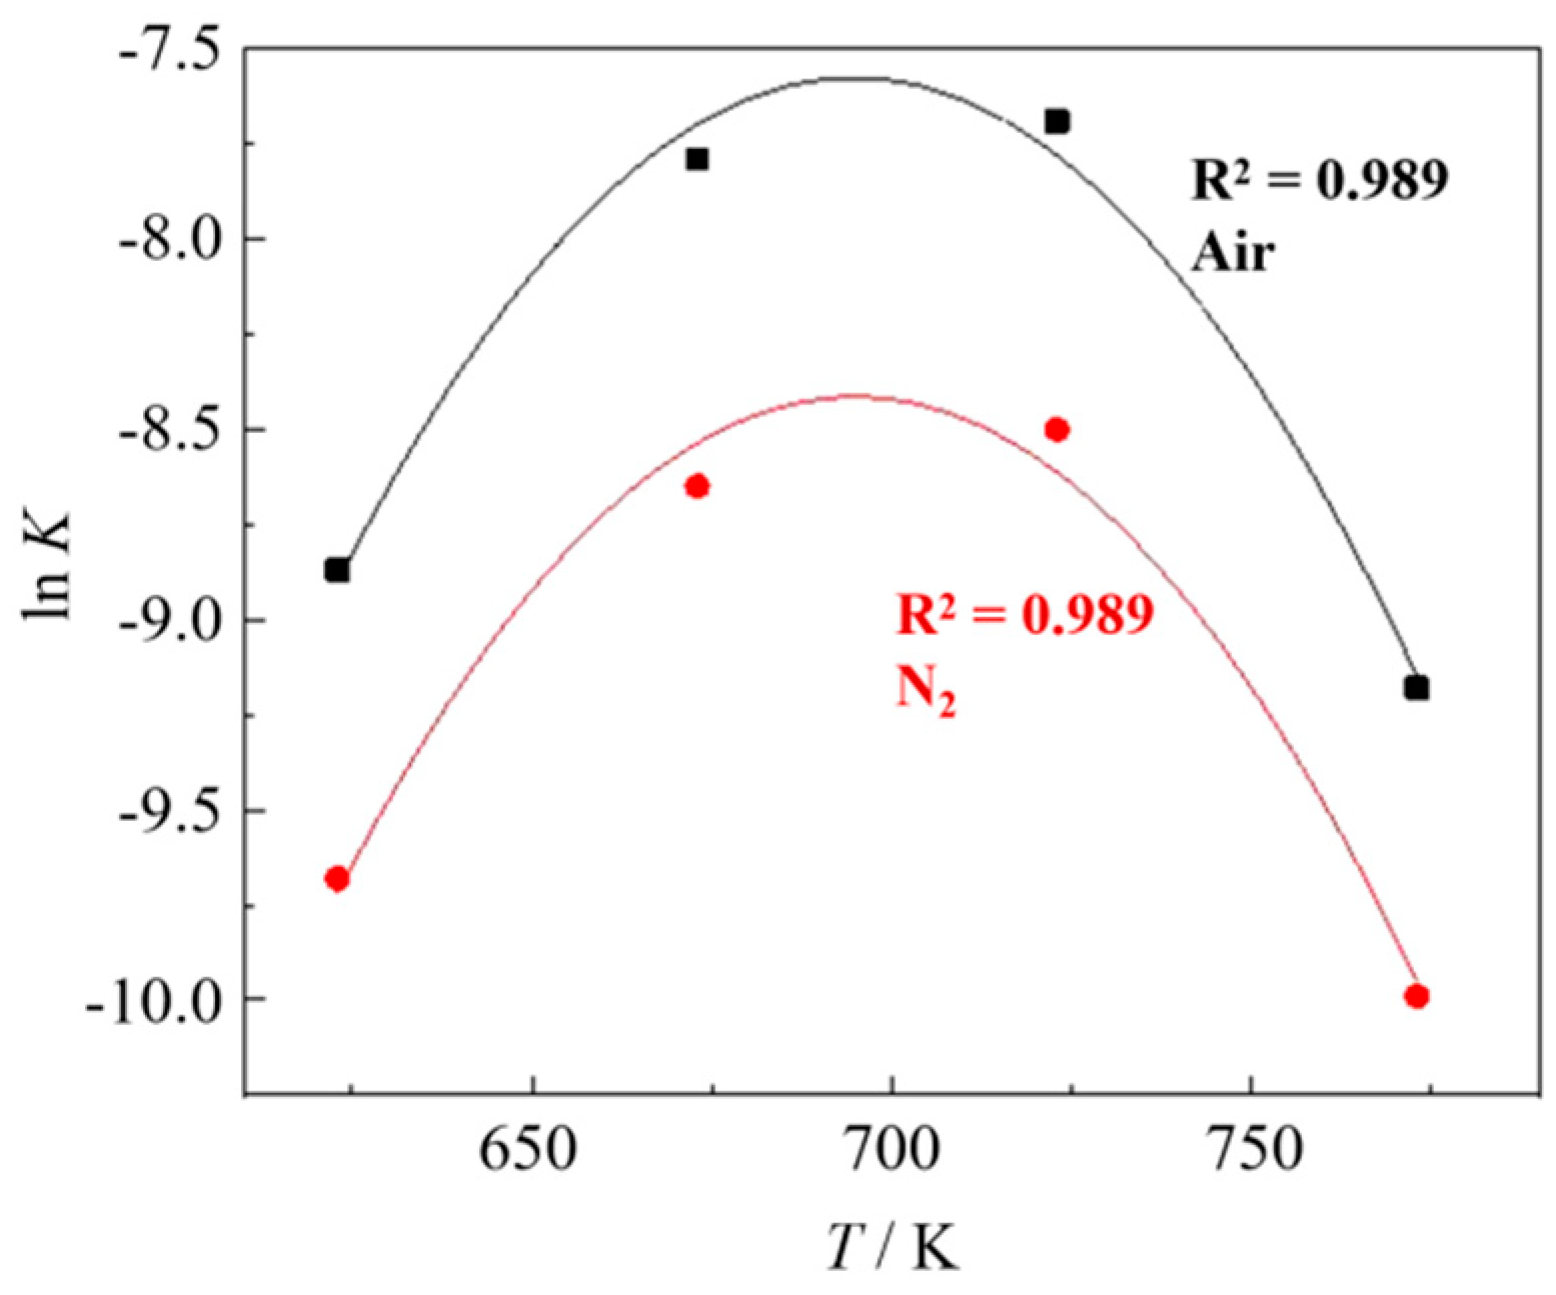
4.1. Eutectoid Transformation Kinetics

The volume fraction of eutectoid structure in the FeO layer at different times when the oxidation product is isothermal at 350–500 °C was calculated, and the formation kinetic curve of eutectoid structure was obtained, as shown in Figure 8. The eutectoid transformation of FeO can be divided into two stages: the slow incubation stage and the accelerated growth stage. In the incubation stage, the eutectoid structure was found at the interface between Fe3O4 and FeO after isothermal heating at 400 °C and 450 °C for 100 s in an air environment, indicating that due to energy fluctuation at the interface, the eutectoid structure began to nucleate here but the eutectoid reaction did not occur at 350 °C and 500 °C. Under the condition of N2, after 500 s at 400 and 450 °C, there is the eutectoid structure at the interface between outer Fe3O4 and FeO, and the incubation stage is significantly prolonged. In the accelerated stage after inoculation, when isothermal at 350–500 °C for 1000–10,000 s, the nucleation number of the eutectoid structure increases significantly and grows continuously. Therefore, the oxidation products undergo rapid eutectoid transformation at this stage. However, the acceleration phase time in air is relatively earlier than that in an N2 environment. In addition, it can be seen from Figure 8 that the eutectoid transformation process of the steels is the most rapid when the isothermal temperature is 450 °C.
The eutectoid transformation of FeO belongs to the diffusion type of transformation, including the nucleation and growth processes. The transformation rate depends on the nucleation rate and growth rate, both of which are influenced by isothermal temperature. Therefore, the kinetics of FeO eutectoid transformation conform to the general laws of phase transformation such as nucleation and growth. The phase transformation kinetics of FeO eutectoid transformation can be described by the Johnson-Mehl-Avrami-Kolmogorov (JMAK) equation, which is a semi-empirical and semi-theoretical model to describe the isothermal phase transformation kinetics [18,19,20]. The variation of the volume fraction of eutectoid structure in the FeO layer with time can be expressed as:
X Eutectoid = 1 exp ( K t n )
where Xeutectoid is the volume fraction of the eutectoid structure in the FeO phase; t is isothermal time (seconds); K is the coefficient, which depends on the phase transition temperature; and n is the coefficient, depending on the type of phase transition. Equation (1) can be further transformed to obtain Equation (2):
ln ln ( 1 / ( 1 X Eutectoid ) ) = ln K + n ln t
The above formula shows that there is a linear relationship between lnln (1/(1 − Xeutectoid)) and ln t, with slope n and intercept ln K. By substituting the statistical data of the eutectoid tissue volume fraction in the FeO layer under different isothermal conditions in Figure 4, Figure 5, Figure 6 and Figure 7 into Equation (2), the fitting curve shown in Figure 9 can be obtained. The ln k and n values at different temperatures are shown in Table 1.
The Avrami exponent n in the JMAK equation depends on the type of phase transition and is independent of temperature. The value of n generally varies in the range of 1–4. The n values of different temperatures are averaged for subsequent calculations. Since the coefficient k depends on the subcooling ΔT of the phase transition process, ln k in Table 1 can be compared with ΔT to carry out the quadratic polynomial fitting, and the fitting results are shown in Figure 10 and Equations (3) and (4):
K ( T ) N 2 = exp ( 2.52 × 10 4 T 2 + 0.3502 × T 129.5040 )
K ( T ) Air = exp ( 2.57 × 10 4 T 2 + 0.3571 × T 131.6321 )
where k is the coefficient, which depends on the phase transition temperature; T is the isothermal temperature (K).
Substituting the fitting results of various parameters into the JMAK equation, the relationship between the volume fraction of eutectoid tissue in the FeO layer and time under the condition of isothermal transformation can be obtained from (5) and (6), that is,
X N 2 = ( 1 exp ( e ( 2.52 × 10 4 T 2 + 0.3502 × T 129.5040 ) t 1.0 ) )
X Air = ( 1 exp ( e ( 2.57 × 10 4 T 2 + 0.3571 × T 131.6321 ) t 1.0 ) )
where, X is the volume fraction of the eutectoid structure; T is the isothermal temperature, K; t is the isothermal time (seconds). By substituting different isothermal transition temperatures t into Equations (5) and (6), the prediction curves of isothermal kinetic curves under different isothermal transition temperatures can be obtained. The comparison between the measured volume fraction of eutectoid structure in the FeO layer after isothermal heating at different temperatures and different times and the predicted results based on the FeO eutectoid transformation kinetic equation shown in Equations (5) and (6) is shown in Figure 10. Using Equations (5) and (6), draw the curves of eutectoid structure accounting for 5% and 95% of FeO under two different atmospheres, as shown in Figure 11. It can be seen that the eutectoid reaction process of FeO in an air environment is more advanced than that in N2.

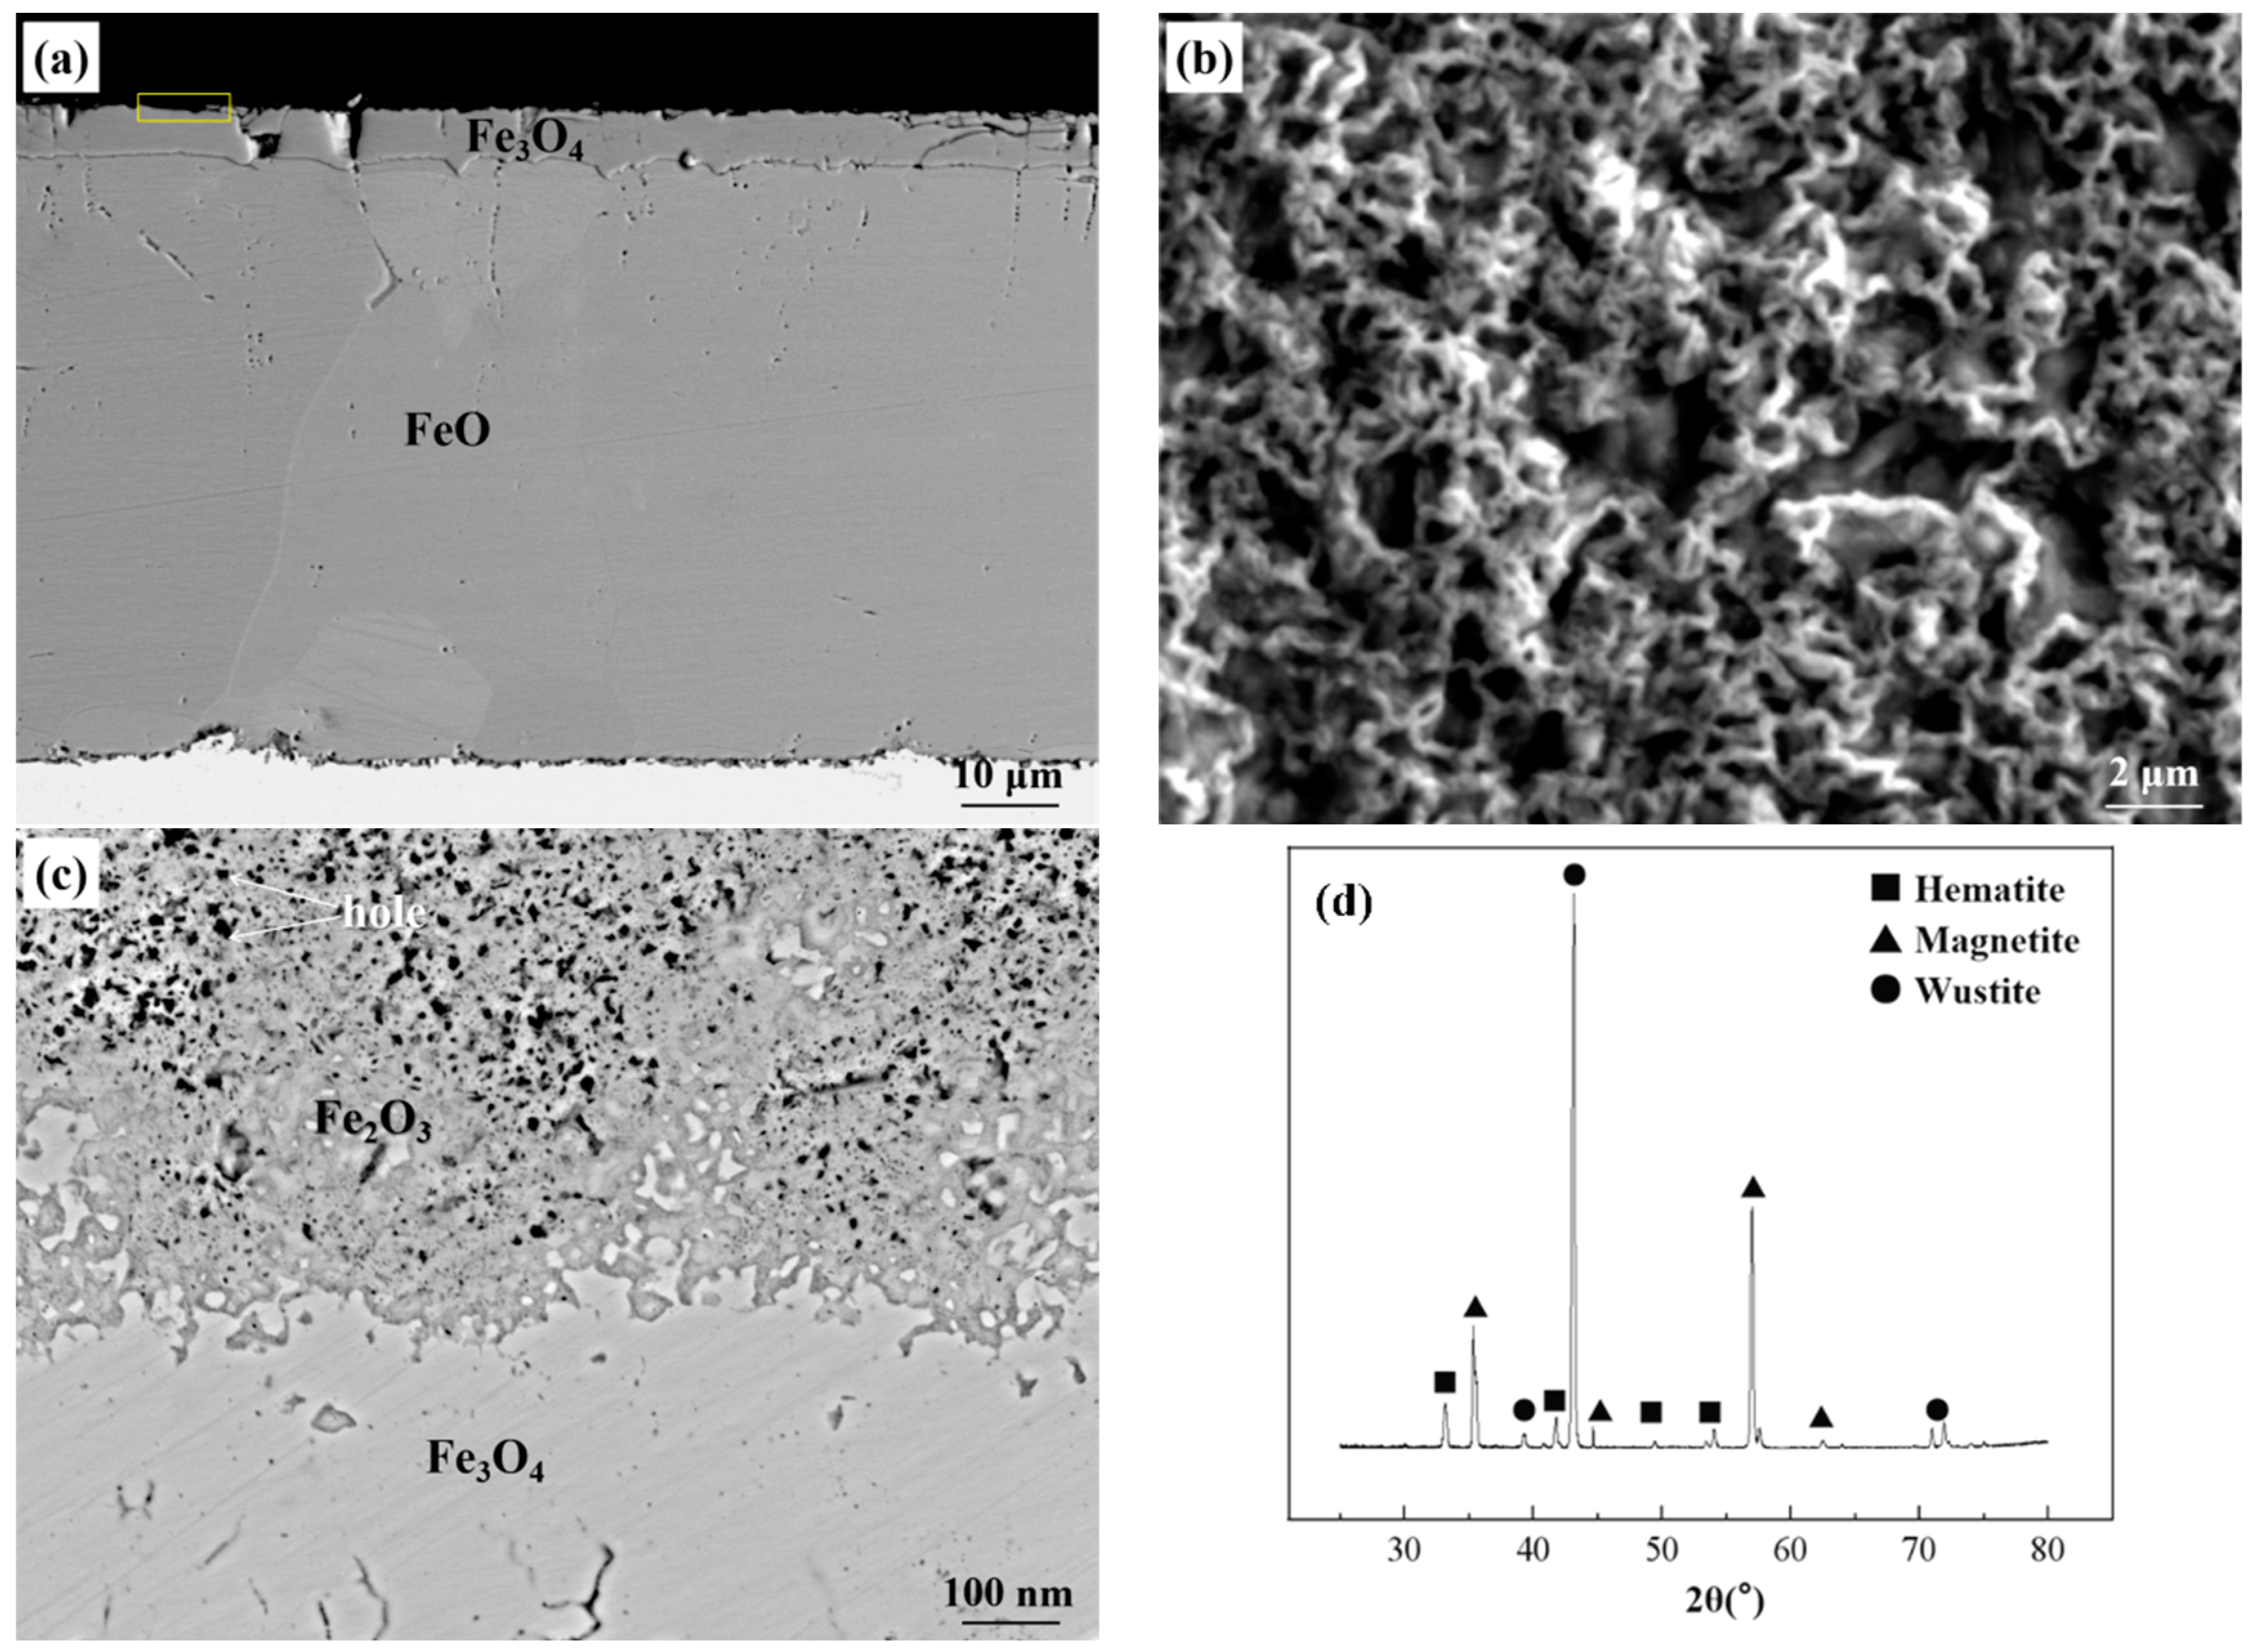
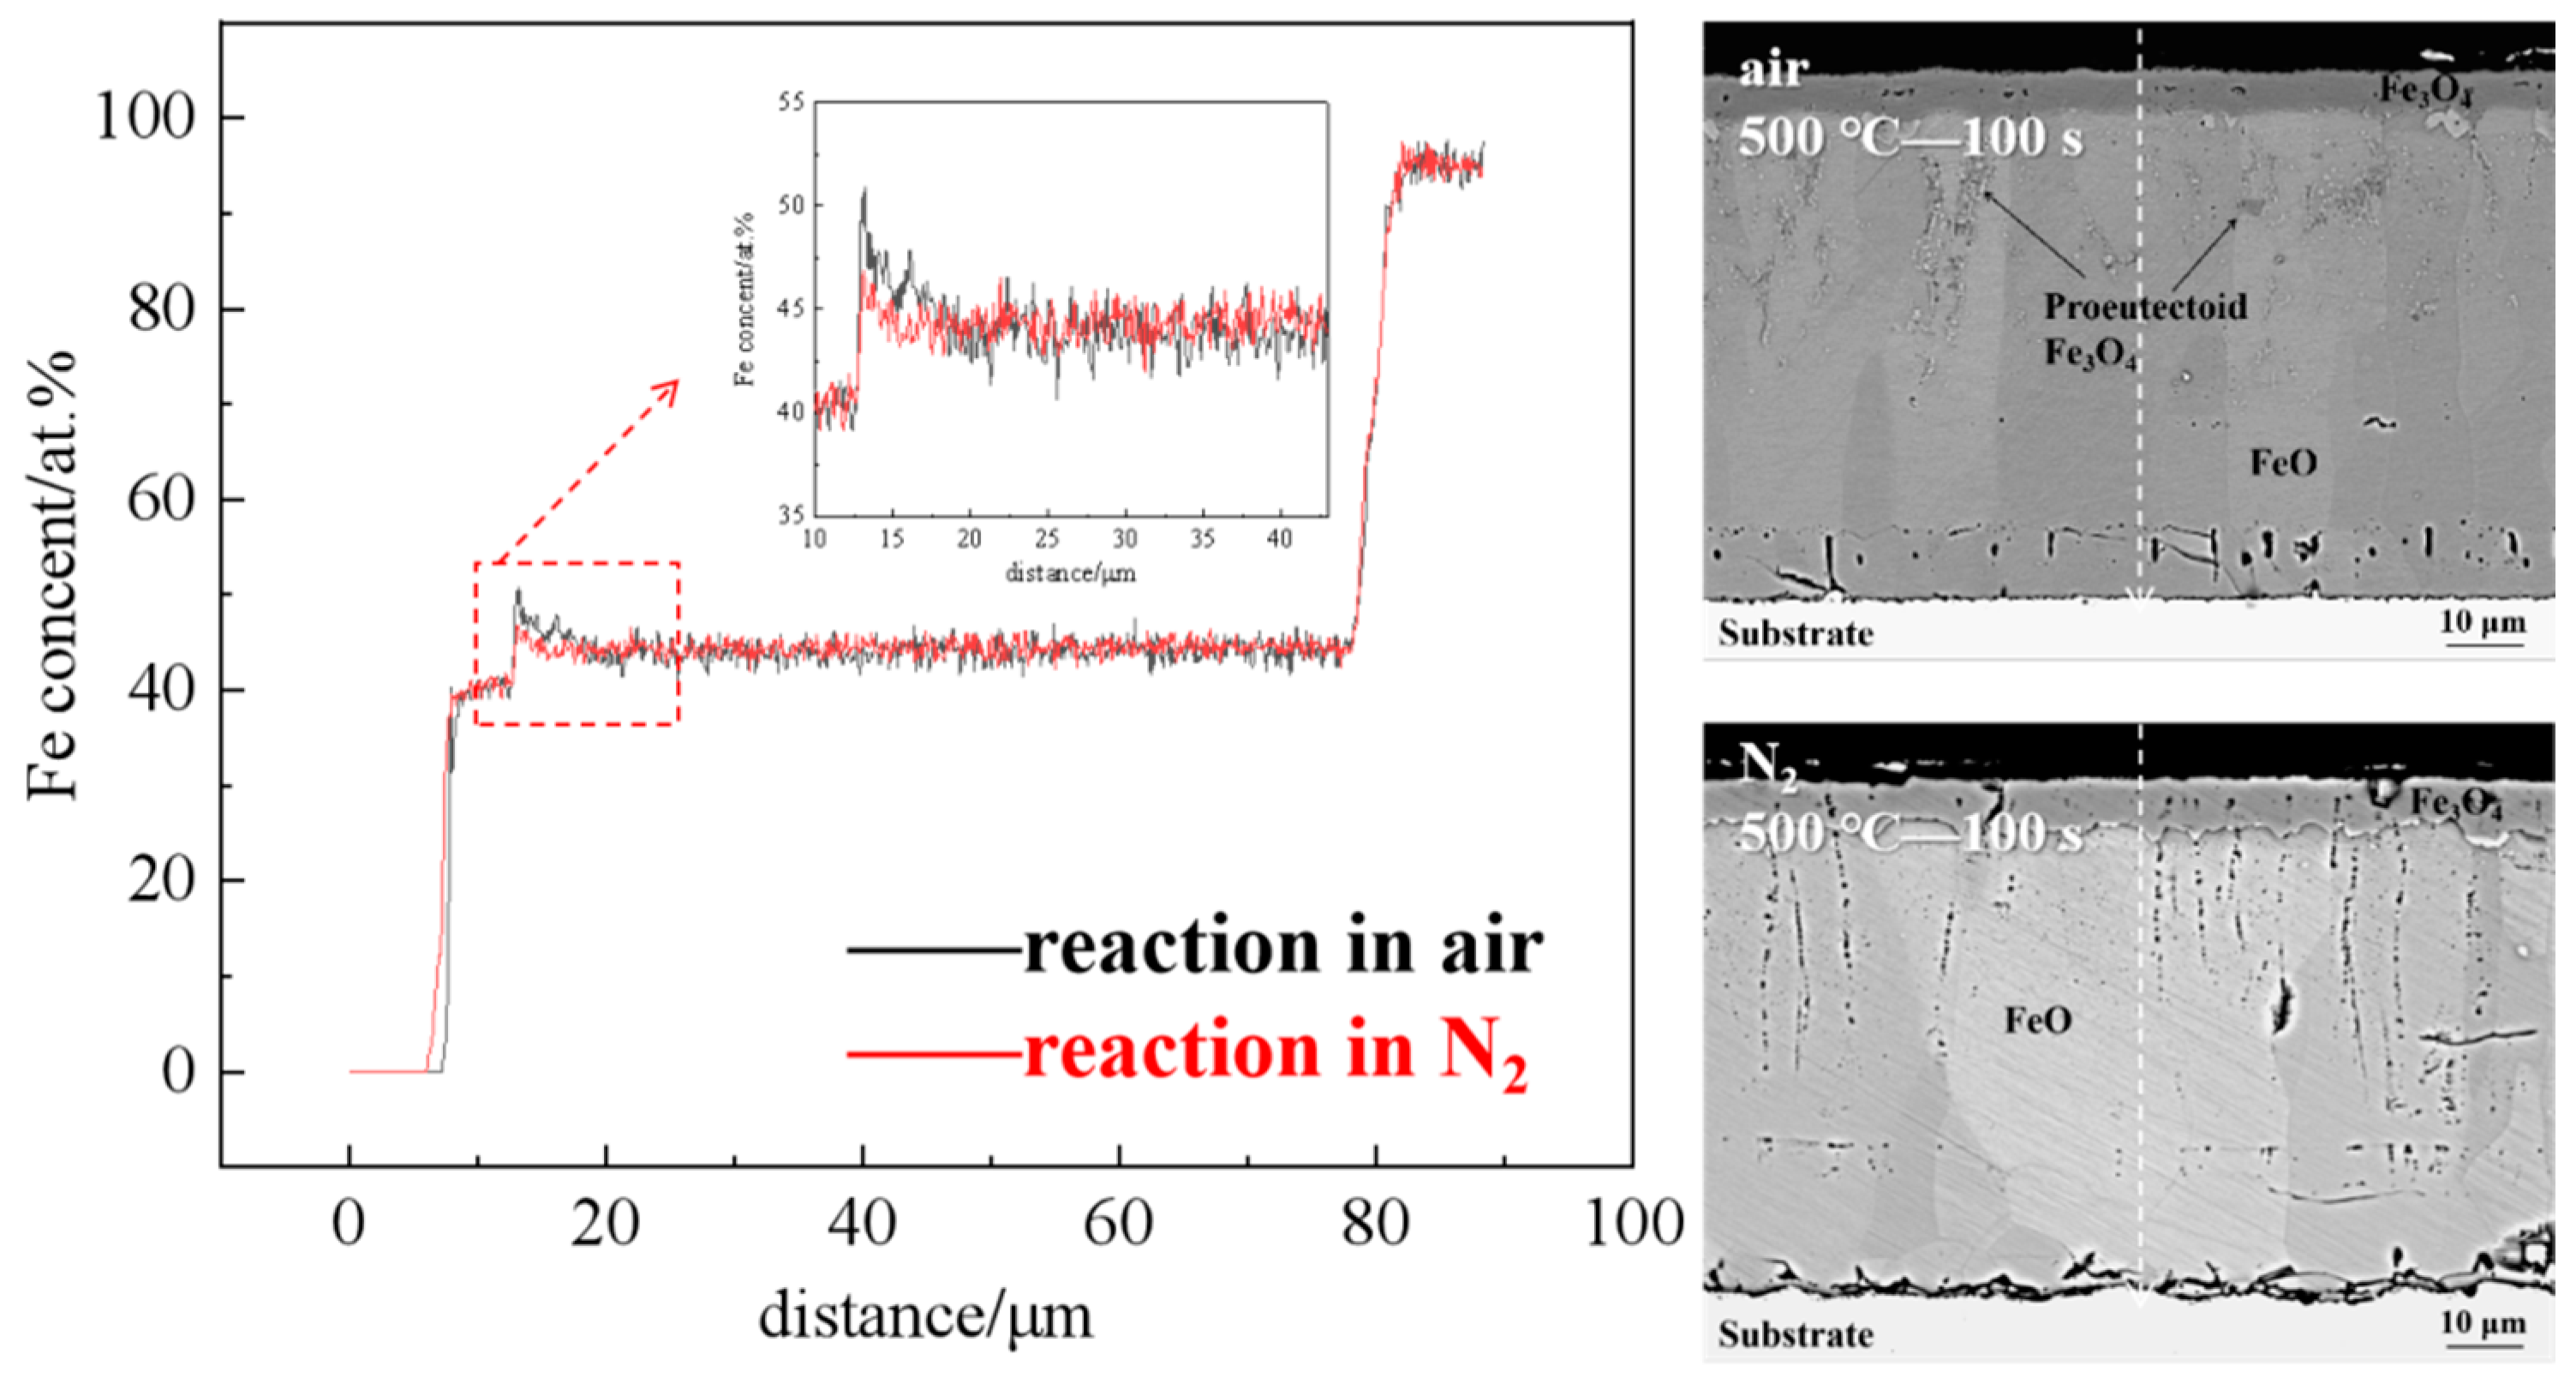
4.2. Oxide after High Temperature Oxidation and Fe3O4 Seam

Figure 12 shows the original oxide scale structure without structural transformation obtained after oxidation at 900 °C for 10 min. The thermally grown oxides consist of three iron oxides, namely hematite (Fe2O3), magnetite (Fe3O4), and wustite (FeO). Combined with the EDS and the XRD results, it can be determined that the outer layer of the oxide scale is Fe2O3 and Fe3O4, and the inner layer is FeO, and the ratio of them is about 1:4:95. This is in good agreement with previous studies [21]. Due to the lattice disorder of Fe2O3, both iron ions and oxygen ions can diffuse in Fe2O3. After magnification, it can be seen that Fe2O3 has a honeycomb shape on the surface, which means that the components in the external atmosphere can more easily pass through Fe2O3 and continue to react with the inner Fe oxides to form Fe oxides with higher valence states. Among the three typical oxidation products, FeO, as a typical p-type semiconductor, has a wide stoichiometric form (Fe0.95O–Fe0.88O) and a high cation vacancy concentration [22], which improves the mobility of cations and electrons in FeO. Fe3O4 has an inverse spinel structure, and there are voids in the octahedron and the tetrahedron, so Fe ions can also diffuse rapidly in Fe3O4.
As shown in Figure 13, after the eutectoid reaction starts, Fe3O4 starts to be generated at the local position of the FeO-substrate interface. Yu [23] analyzed the formation of the Fe3O4 seam layer based on texture. According to the research results, it is assumed that there is no oxygen vacancy in pure iron oxide, and the ion radii of Fe2+ and Fe3+ are 0.74 Å and 0.76 Å, respectively, which are about half of the O2− radius. Due to the large difference in atomic size, O2− is easily formed into a cubic close-packed structure. In iron oxides, the mobility of oxygen anions is significantly lower than that of Fe cations without other elements because of their large ion radius and lack of oxygen vacancies. Therefore, at the FeO-substrate interface, Fe3O4 seam are always difficult to form in the experimental steel. Therefore, in this paper, the eutectoid reaction is more determined by local ion concentration changes.

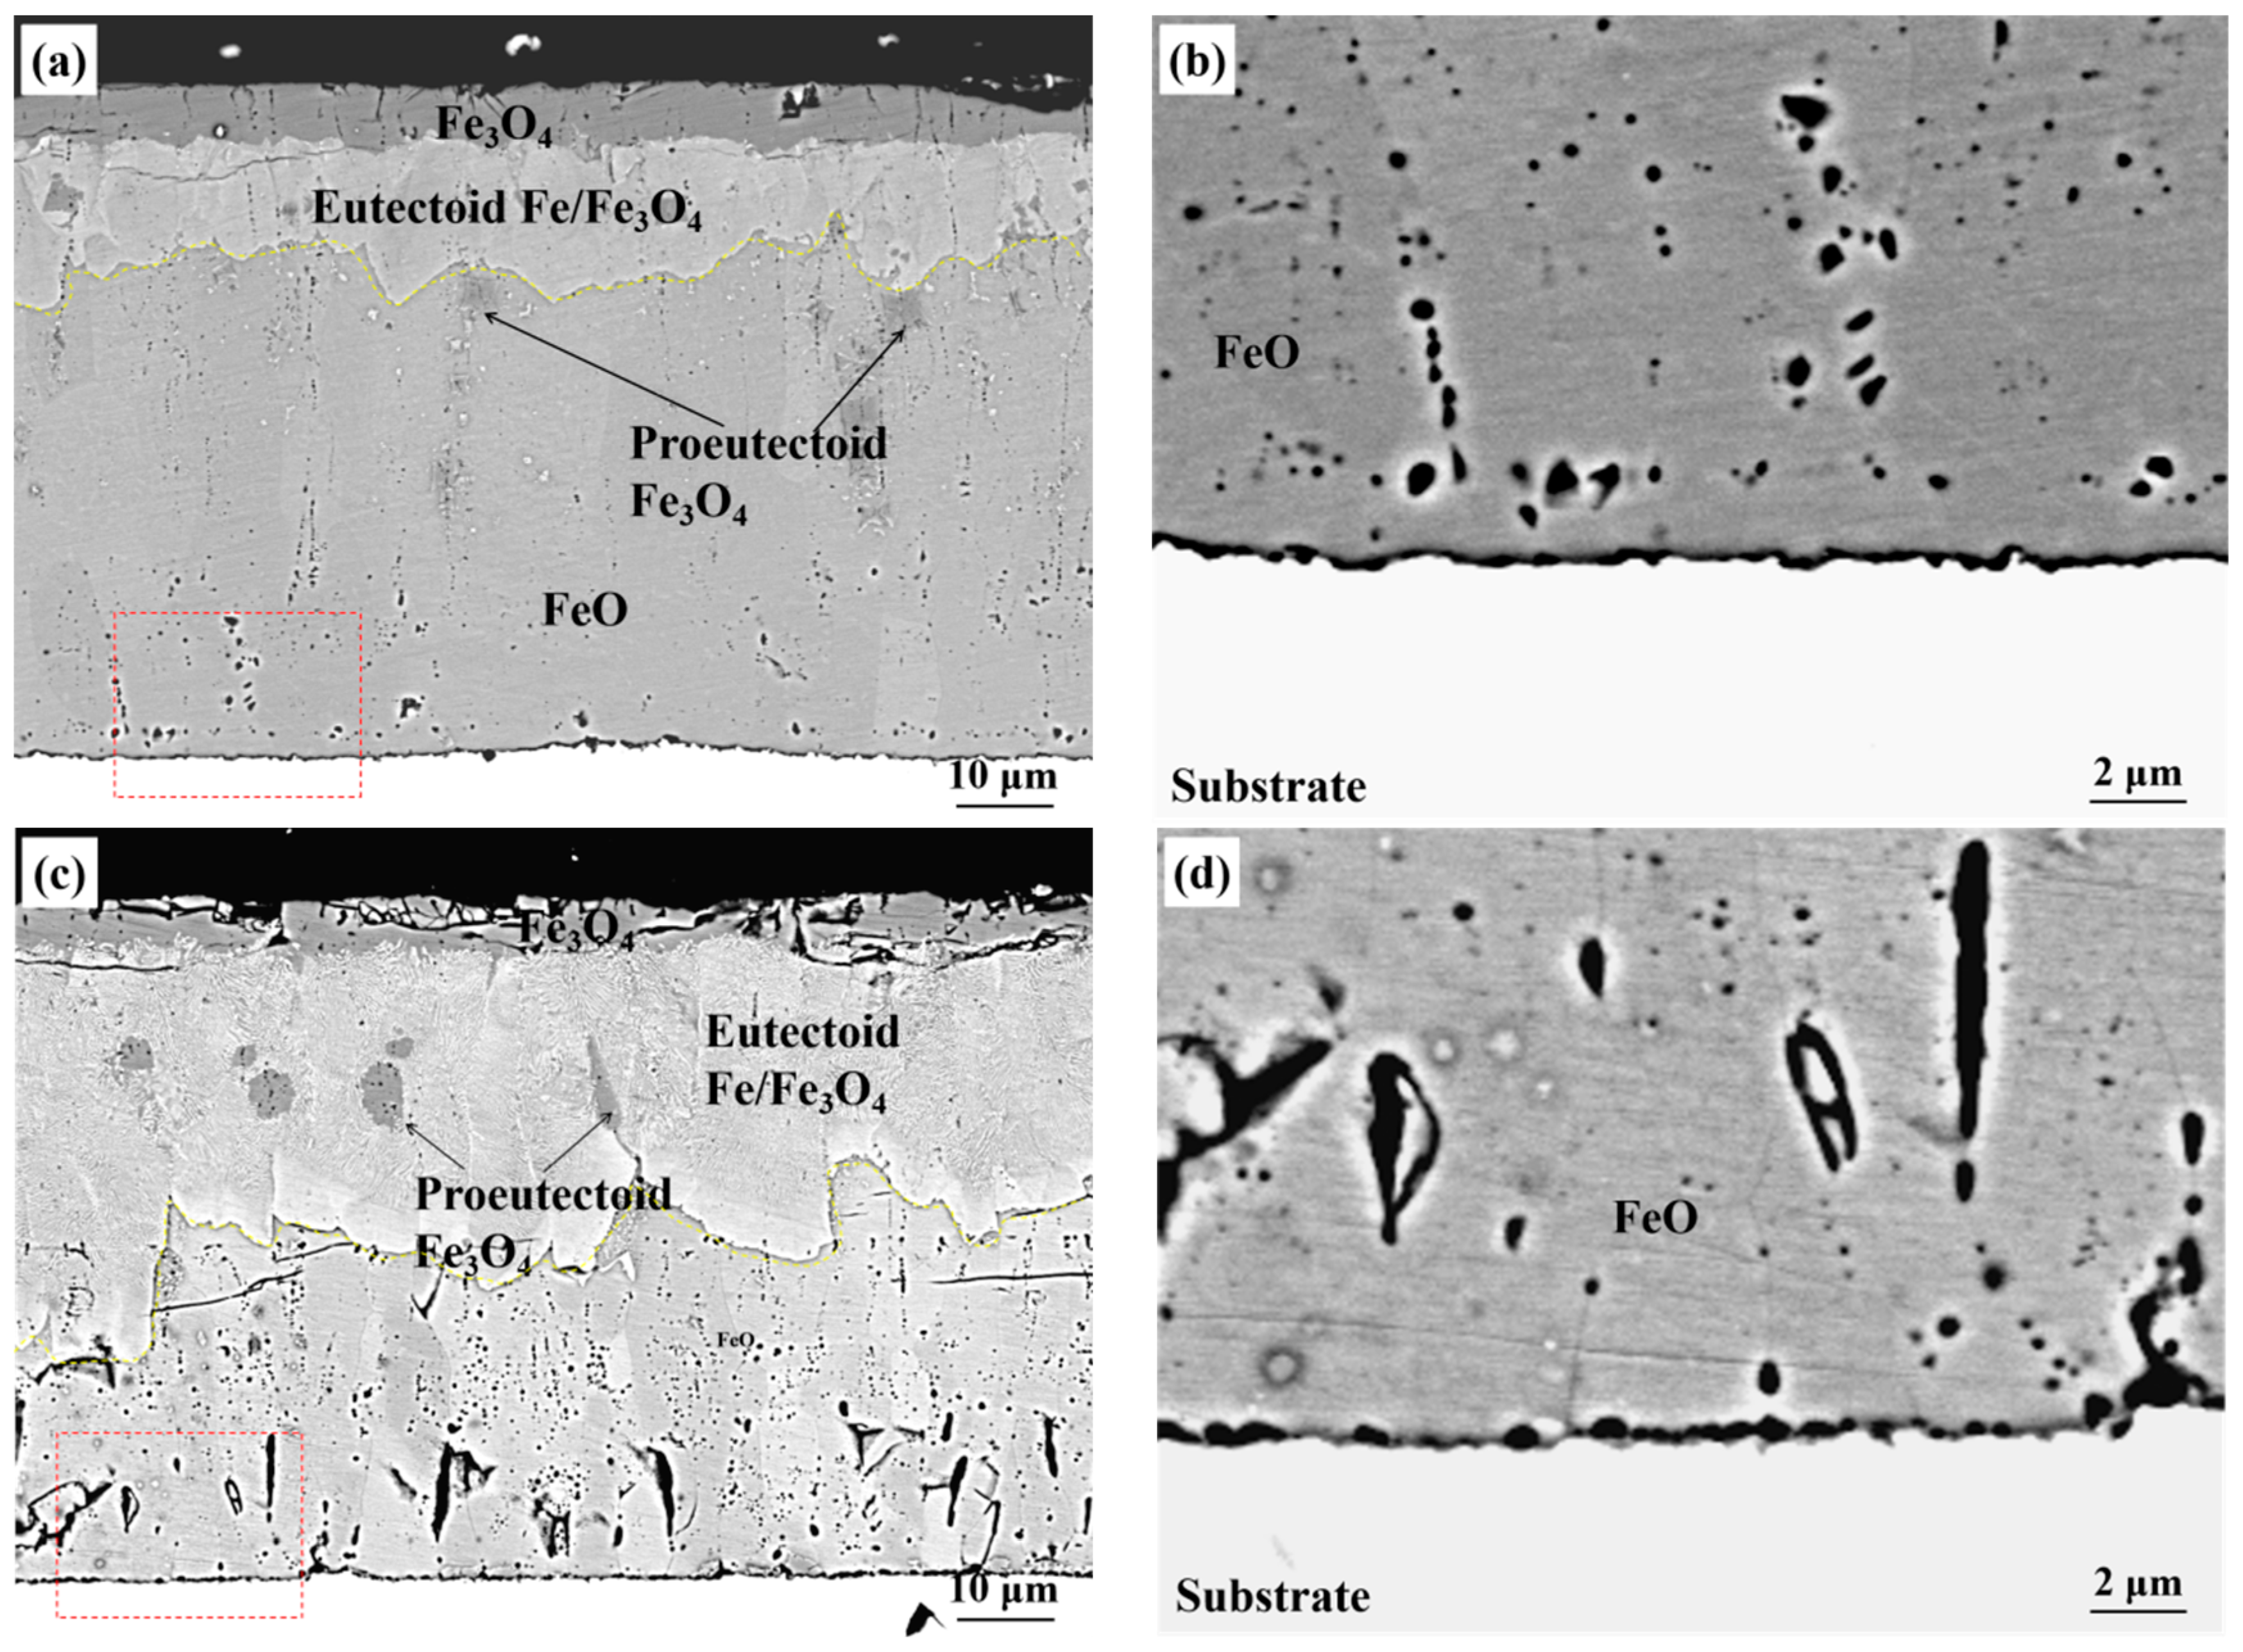
4.3. Eutectoid Transformation

FeO contains two different reaction types, namely, O-rich FeO and Fe-rich FeO. According to the Fe-O phase diagram in Figure 14, the equilibrium region of the O-rich FeO and FeO phases intersects at point d. With the decrease in temperature, the Fe3O4 phase with proeutectoid reactions will precipitate in FeO, and FeO will change from O-rich FeO to Fe-rich FeO. The reaction path that follows the reaction path is b→d→e/e′, which is shown in reaction (7):
Fe 1 x O x y 1 4 y Fe 3 O 4 + 1 4 x 1 4 y Fe 1 y O ( x > y )
When the O-rich FeO is transformed into Fe-rich FeO through the above reaction, eutectoid transformation occurs, resulting in a lamellar eutectoid structure of Fe+Fe3O4 is formed:
4 Fe 1 y O Fe 3 O 4 + ( 1 4 y ) Fe
Therefore, whether Fe-rich FeO can be formed preferentially will determine the eutectoid reaction process. In this experiment, the content of Fe ions in FeO mainly depends on two factors:
The first factor is the reaction temperature, which can be described in two aspects: when the isothermal transformation process is carried out at a relatively high temperature (500 °C, for example). At this time, the Fe cation can always diffuse from the steel substrate to the oxide scale, resulting in an increase in the Fe ion concentration in FeO, the direct formation of relatively Fe-rich FeO, and the eutectoid reaction path closer to a→b. At this time, the eutectoid reaction can occur without the formation of a large number of proeutectoid Fe3O4 in FeO.
When the formation temperature of the eutectoid structure is relatively low (350 °C, for example), the diffusion of Fe ions into FeO through the substrate is limited, and the occurrence of O-rich FeO in the eutectoid reaction will depend more on the proeutectoid reaction to increase the Fe ion concentration in FeO. At this time, through the c→d→e path, proeutectoid Fe3O4 will nucleate in FeO, and the number of nucleations will increase significantly at any time when the temperature decreases, resulting in a large number of proeutectoid Fe3O4 occupying FeO. Due to a large amount of proeutectoid growth, the rate of eutectoid reaction in FeO did not decrease significantly at 350 °C.
The second factor is the increase in local Fe ion concentration caused by the O element in the environment. In this experiment, the effect of reaction temperature was excluded by controlling variables. Since the eutectoid temperature was above 350 °C in the whole experiment, Fe2O3 and Fe3O4 still maintained the trend of continuous growth on the outside of FeO. Because Fe2O3 is porous, O can directly contact the Fe3O4 layer and react with it so that the Fe ions in Fe3O4 are consumed. The resulting concentration gradient will be that Fe ions in FeO will enrich towards the Fe3O4-FeO interface, forming a peak concentration gradient of Fe ions at the interface. As shown in Figure 15. The Fe-rich FeO in the inner layer was formed by the depletion diffusion of the outer layer, which made the eutectoid reaction of FeO start in advance. The effects persisted until the end of the eutectoid reaction.

5. Conclusions

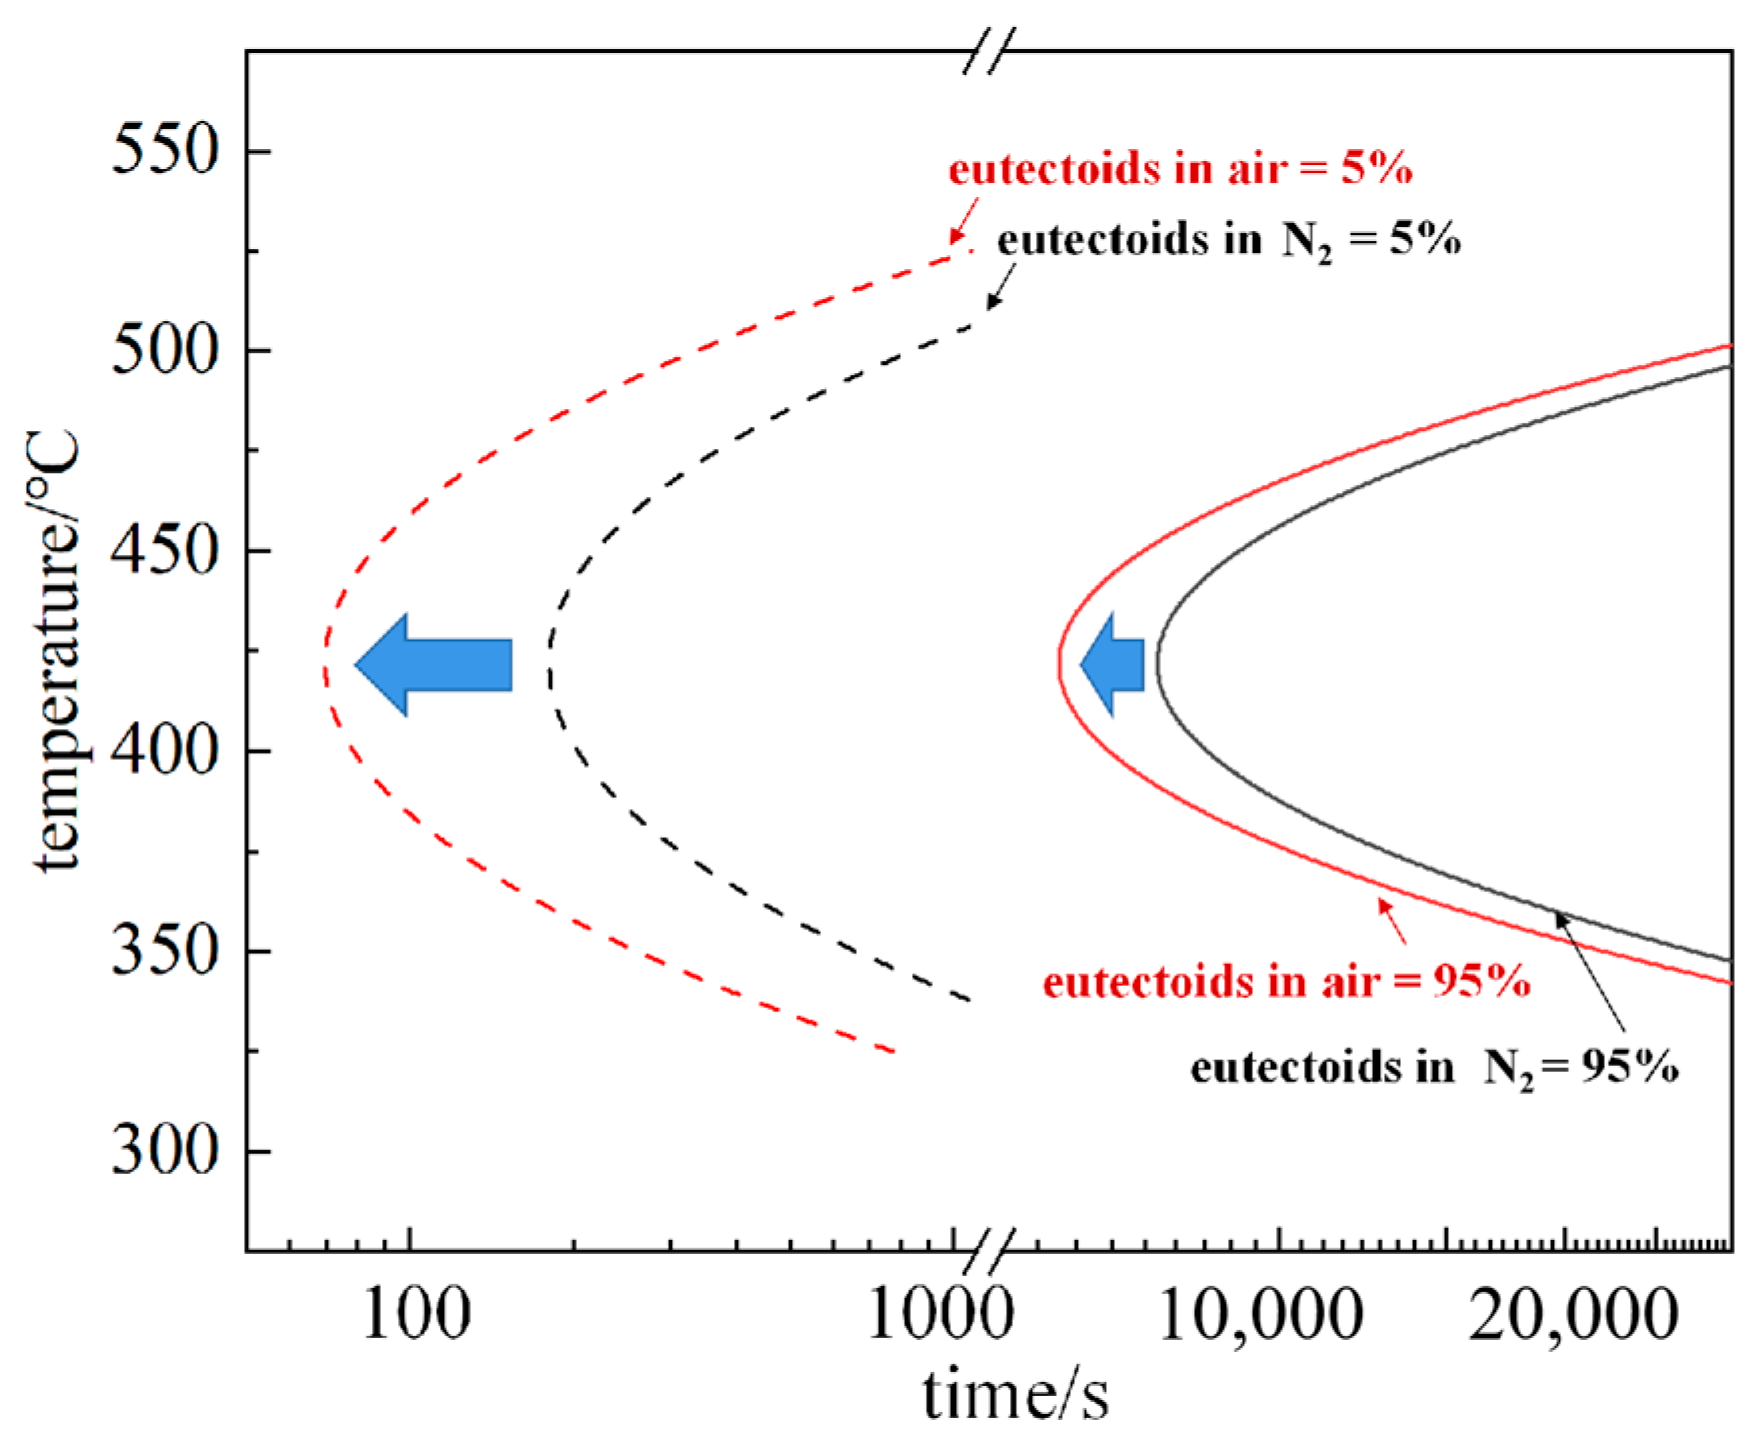
  • Model of FeO eutectoid transformation is established based on the JMAK equation, and the time of eutectoid structure in air is earlier than that of N2.
  • Fe3O4 seams formed at the interface of the FeO-substrate after the eutectoid reaction began, which means they are not a necessary condition of the eutectoid reaction. The eutectoids are more affected by local ion concentration changes in this experiment.
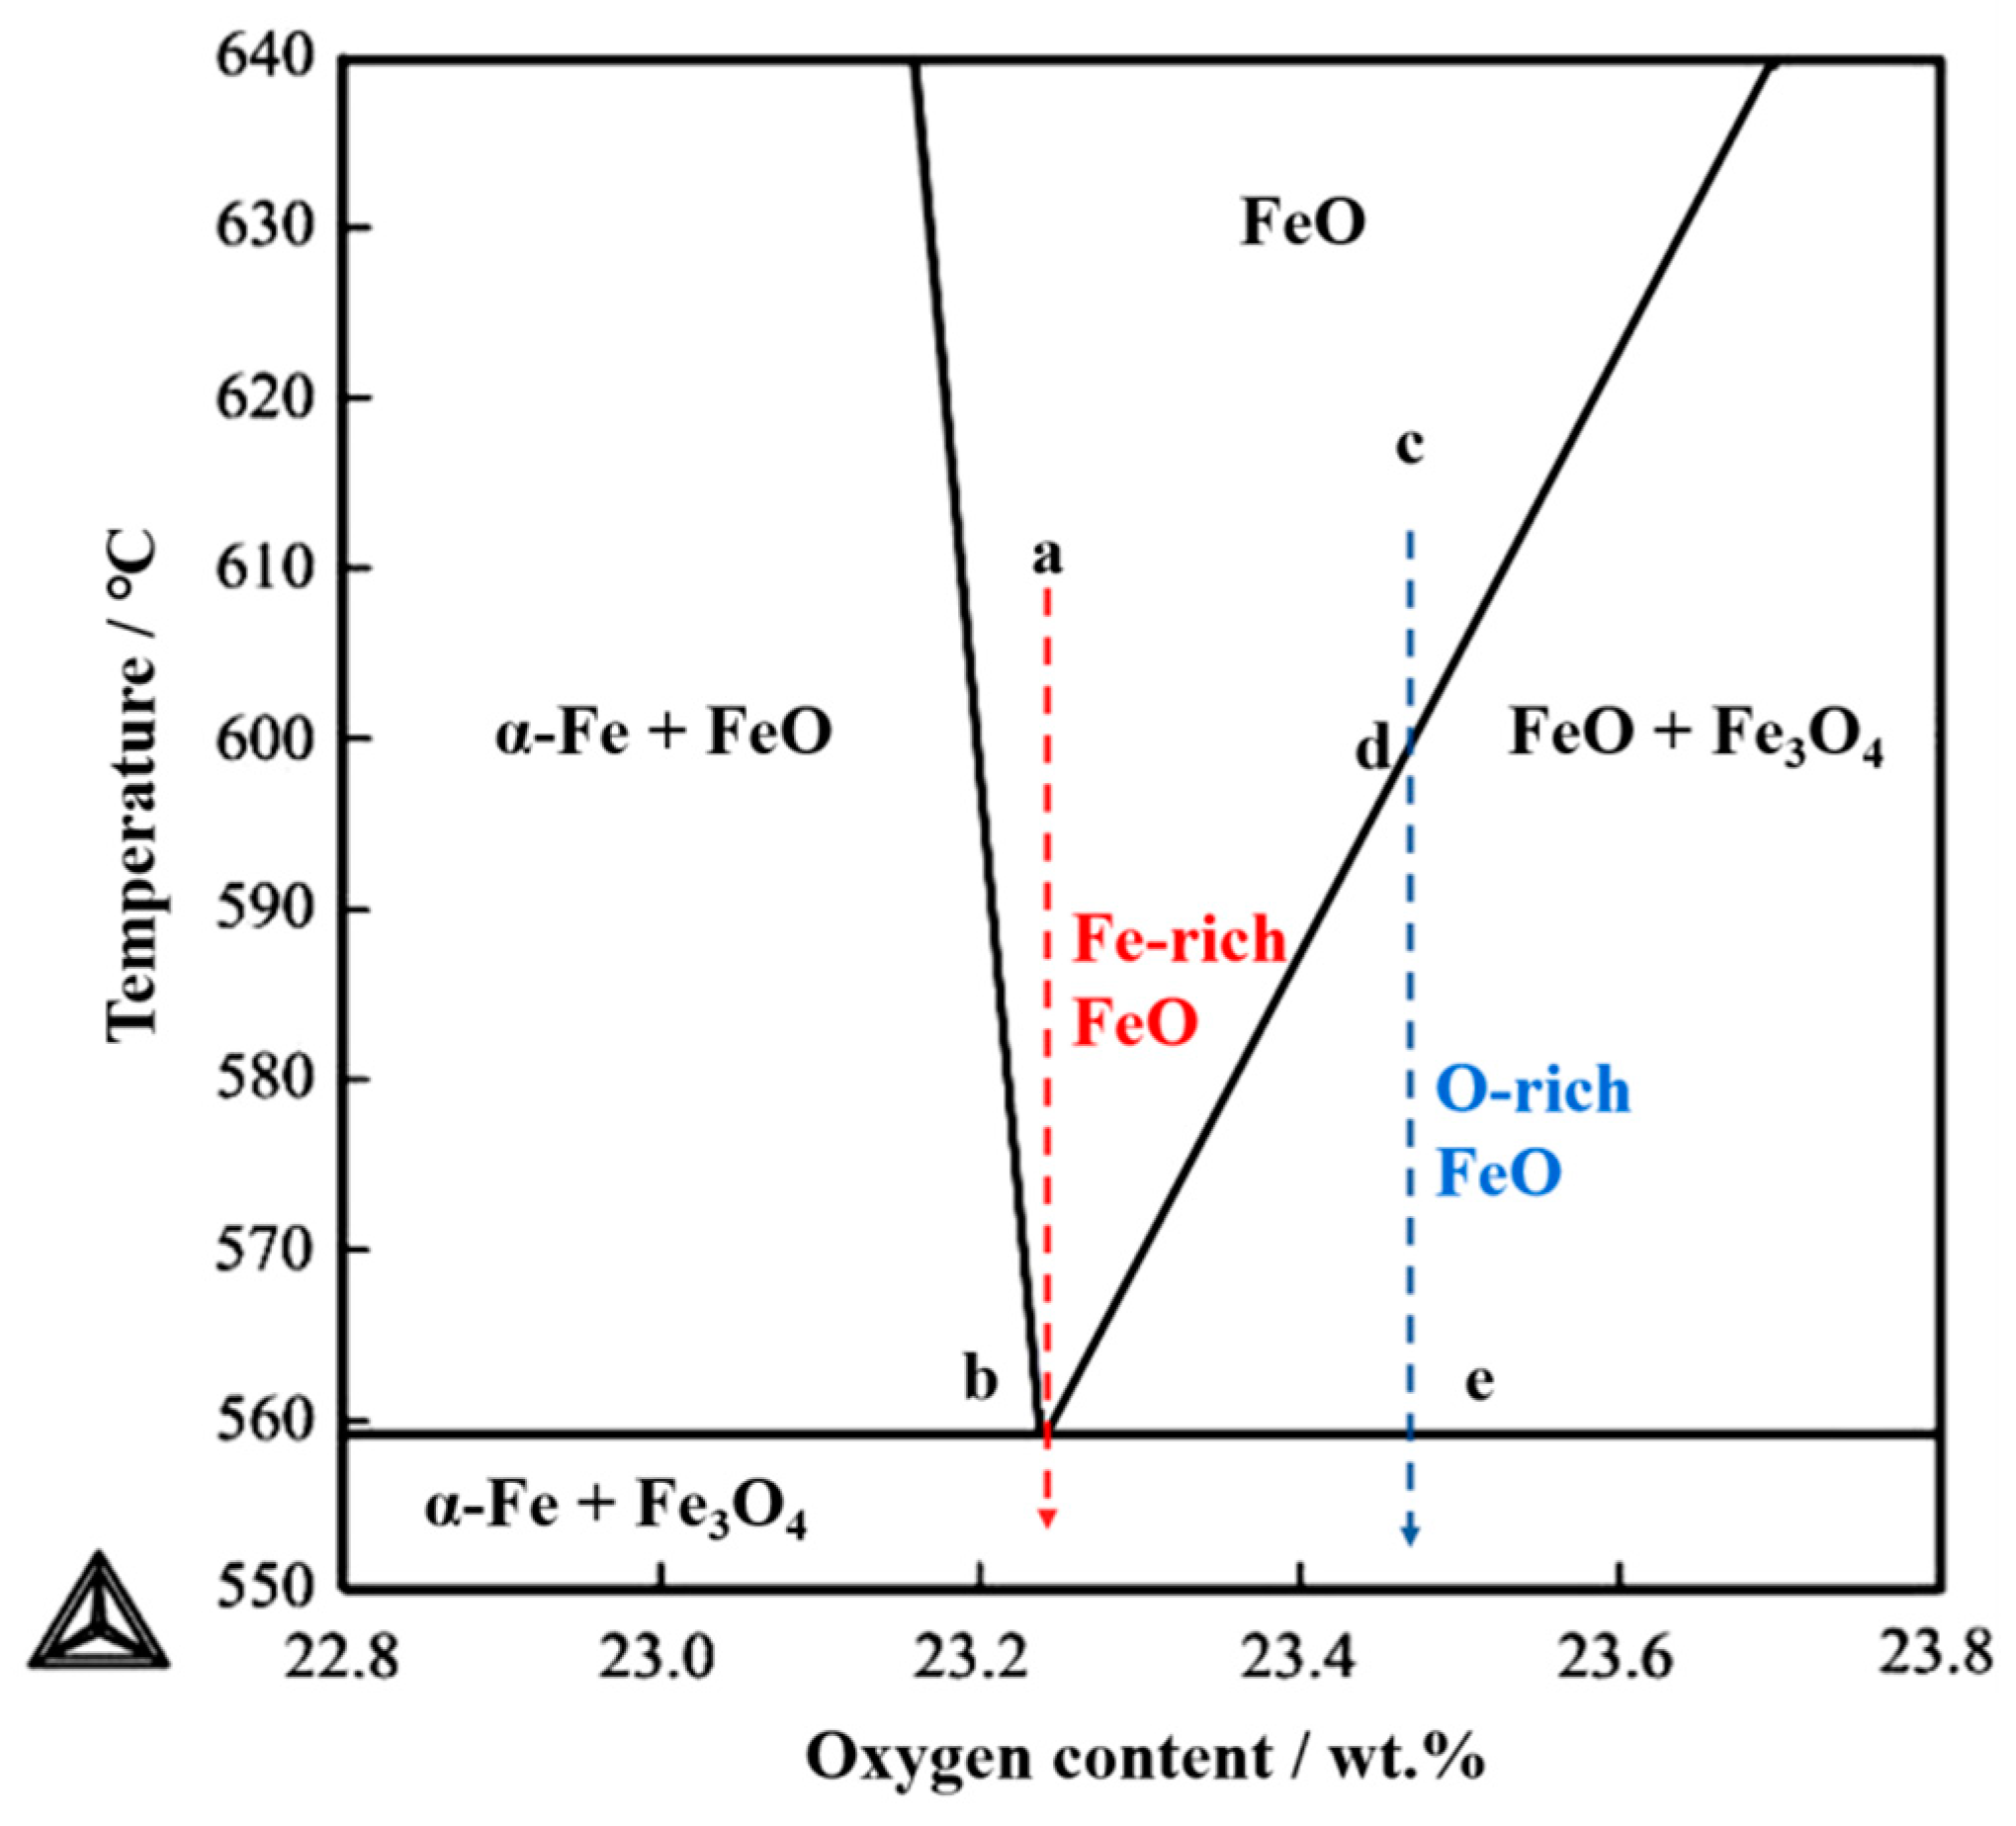
  • The isothermal temperature affects the concentration of Fe ions in FeO, which directly determines the nucleation and growth of proeutectoid in FeO.
  • In air conditions, there is a high concentration enrichment of Fe ions at the Fe3O4-FeO interface because of the oxygen in the environment, which gives priority to the formation of Fe-rich FeO and makes the eutectoid phase transition time earlier than N2 conditions.

Author Contributions

H.W.: conceptualization, methodology, investigation, writing—original draft, writing—review and editing. G.C.: investigation, writing—review and editing, and funding acquisition. S.L.: investigation. W.Z.: investigation and supervision. Z.L.: conceptualization, methodology, project administration, and funding acquisition. All authors have read and agreed to the published version of the manuscript.

Funding

This research was funded by the National Key Research and Development Program of China (Grant No.2022YFB3304800) and the Postdoctoral Science Foundation of China (Grant No. 2021M701167, 2022T150205).

Data Availability Statement

Not applicable.

Conflicts of Interest

The authors declare no conflict of interest.

References

  1. Chen, R.Y.; Yuen, W.Y.D. Oxide-Scale Structures Formed on Commercial Hot-Rolled Steel Strip and Their Formation Mechanisms. Oxid. Met. 2001, 56, 89–118. [Google Scholar] [CrossRef]
  2. Gleeson, B.; Hadavi, S.M.M.; Young, D.J. Isothermal transformation behavior of thermally-grown wüstite. Mater. High Temp. 2000, 17, 311–318. [Google Scholar] [CrossRef]
  3. Lin, S.N.; Hung, G.C.; Wu, M.T.; Wang, W.L.; Hsieh, K.C.S. Crucial Mechanism to the Eutectoid Transformation of Wüstite Scale on Low Carbon Steel. Steel. Res. Int. 2017, 88, 1700045. [Google Scholar] [CrossRef]
  4. He, Y.Q.; Jia, T.; Li, Z.F.; Cao, G.M.; Liu, Z.Y.; Li, J. Hot-dip Galvanizing of Carbon Steel after Cold Rolling with Oxide Scale and Hydrogen Descaling. J. Iron Steel Res. Int. 2014, 21, 222–226. [Google Scholar] [CrossRef]
  5. Liu, X.J.; Cao, G.M.; He, Y.Q.; Yang, M.; Liu, Z.Y. Reduction of Oxide Scale with Hydrogen. J. Iron Steel Res. Int. 2014, 21, 24–29. [Google Scholar] [CrossRef]
  6. Li, Z.F.; He, Y.Q.; Cao, G.M.; Tang, J.J.; Zhang, X.J.; Liu, Z.Y. Effects of Al contents on microstructure and properties of hot-dip Zn-Al alloy coatings on hydrogen reduced hot-rolled steel without acid pickling. J. Iron Steel Res. Int. 2017, 24, 1032–1040. [Google Scholar] [CrossRef]
  7. Liu, Z.Y.; Cao, G.M. Studies on Oxidation Behavior of Steels during Hot Rolling and Development and Application of the Scale Control Techologies; Metallurgical Industry Press: Beijing, China, 2021. [Google Scholar]
  8. Young, D.J. High Temperature Oxidation and Corrosion of Metals, 2nd ed.; Elsevier: Amsterdam, The Netherlands, 2016. [Google Scholar]
  9. Tanei, H.; Kondo, Y. Effects of Initial Scale Structure on Transformation Behavior of Wüstite. ISIJ Int. 2012, 52, 105–109. [Google Scholar] [CrossRef] [Green Version]
  10. Li, Z.F.; Cao, G.M.; Lin, F.; Cui, C.Y.; Wang, H.; Liu, Z.Y. Phase Transformation Behavior of Oxide Scale on Plain Carbon Steel Containing 0.4 wt.% Cr during Continuous Cooling. ISIJ Int. 2018, 58, 2338–2347. [Google Scholar] [CrossRef] [Green Version]
  11. Takeda, M.; Kushida, H.; Onishi, T.; Toyama, M.; Koizumi, F.; Fujimoto, S. Influence of Oxidation Temperature and Cr Content on the Adhesion and Microstructure of Scale on Low Cr Steels. Oxid. Met. 2010, 73, 1–13. [Google Scholar] [CrossRef]
  12. Hayashi, S.; Yamanouchi, Y.; Hayashi, K.; Hidaka, Y.; Sato, M. Stress measurement in the iron oxide scale formed on pure Fe during isothermal transformation by in situ high-temperature X-ray diffraction. Cor. Sci. 2021, 187, 109482. [Google Scholar] [CrossRef]
  13. Hayashi, S.; Mizumoto, K.; Yoneda, S.; Kondo, Y.; Tanei, H.; Ukai, S. The Mechanism of Phase Transformation in Thermally-Grown FeO Scale Formed on Pure-Fe in Air. Oxid. Met. 2014, 81, 357–371. [Google Scholar] [CrossRef]
  14. Hayashi, S.; Yoneda, S.; Kondo, Y.; Tanei, H. Phase Transformation of Thermally Grown FeO Formed on High-Purity Fe at Low Oxygen Potential. Oxid. Met. 2020, 94, 81–93. [Google Scholar] [CrossRef]
  15. Shizukawa, Y.; Hayashi, S.; Yoneda, S.; Kondo, Y.; Tanei, H.; Ukai, S. Mechanism of Magnetite Seam Formation and its Role for FeO Scale Transformation. Oxid. Met. 2016, 86, 315–326. [Google Scholar] [CrossRef]
  16. Yoneda, S.; Hayashi, S.; Kondo, Y.; Tanei, H.; Ukai, S. Effect of Mn on Isothermal Transformation of Thermally Grown FeO Scale Formed on Fe–Mn Alloys. Oxid. Met. 2017, 87, 125–138. [Google Scholar] [CrossRef]
  17. Li, Z.F.; Cao, G.M.; Lin, F.; Wang, H.; Liu, Z.Y. Characterization of Oxide Scales Formed on Plain Carbon Steels in Dry and Wet Atmospheres and Their Eutectoid Transformation from FeO in Inert Atmosphere. Oxid. Met. 2018, 90, 337–354. [Google Scholar] [CrossRef]
  18. Johnson, W.A.; Mehl, R.F. Reaction kinetics in process of nucleation and growth. Trans. Am. Inst. Min. Metall. Eng. 1939, 135, 416–458. [Google Scholar]
  19. Avrami, M. Kinetics of phase change I. General theory. J. Chem. Phys. 1939, 7, 1103–1112. [Google Scholar] [CrossRef]
  20. Kolmogorov, A.N. On the statistical theory of metal crystallization. Bull. Acad. Sci. USSR 1937, 3, 355–359. [Google Scholar] [CrossRef]
  21. Schwenk, W.; Rahmel, A. Theoretical considerations on phase boundary reactions and mass transfer during the oxidation of iron. Oxid. Met. 1986, 25, 293–303. [Google Scholar] [CrossRef]
  22. Engell, H.; Eisenhuttenwesen, J. Untersuchungen über Thermodynamik und Zusammensetzung des Wüstits. Arch. Eisenhüttenwesen 1957, 28, 109–115. [Google Scholar] [CrossRef]
  23. Yu, X.L.; Jiang, Z.Y.; Zhao, J.W.; Wei, D.B.; Zhou, C.L.; Huang, Q.X. Microstructure and microtexture evolutions of deformed oxide layers on a hot-rolled microalloyed steel. Cor. Sci. 2015, 90, 140–152. [Google Scholar] [CrossRef]
Figure 1. Visible color differences at the edge/center.
Metals 13 00220 g001
Figure 2. Experimental process.
Metals 13 00220 g002
Figure 3. Oxidized structures under different isothermal conditions at 550 °C in an air and N2 environment. (a) air—100 s; (b) air—1000 s; (c) air—10,000 s; (d) N2—100 s; (e) N2—1000 s; (f) N2—10,000 s.
Metals 13 00220 g003
Figure 4. Oxidized structures under different isothermal conditions at 500 °C in an air and N2 environment. (a) air—100 s; (b) air—500 s; (c) air—1000 s; (d) air—5000 s; (e) air—10,000 s; (f) N2—100 s; (g) N2—500 s; (h) N2—1000 s; (i) N2—5000 s; (j) N2—10,000 s.
Metals 13 00220 g004
Figure 5. Oxidized structures under different isothermal conditions at 450 °C in air and N2 environments. (a) air—100 s; (b) air—500 s; (c) air—1000 s; (d) air—5000 s; (e) air—10,000 s; (f) N2—100 s; (g) N2—500 s; (h) N2—1000 s; (i) N2—5000 s; (j) N2—10,000 s.
Metals 13 00220 g005aMetals 13 00220 g005b
Figure 6. Oxidized structures under different isothermal conditions at 400 °C in air and N2 environments. (a) air—100 s; (b) air—500 s; (c) air—1000 s; (d) air—5000 s; (e) air—10,000 s; (f) N2—100 s; (g) N2—500 s; (h) N2—1000 s; (i) N2—5000 s; (j) N2—10,000 s.
Metals 13 00220 g006aMetals 13 00220 g006b
Figure 7. Oxidized structures under different isothermal conditions at 350 °C in air and N2 environments. (a) air—100 s; (b) air—500 s; (c) air—1000 s; (d) air—5000 s; (e) air—10,000 s; (f) N2—100 s; (g) N2—500 s; (h) N2—1000 s; (i) N2—5000 s; (j) N2—10,000 s.
Metals 13 00220 g007
Figure 8. Volume fraction of eutectoid after isothermal transformation at different temperatures: (a) Air condition; (b) N2 condition.
Metals 13 00220 g008
Figure 9. Relationship between lnln(1/(1 − XEutectoid)) and ln t: (a) Air condition; (b) N2 condition.
Metals 13 00220 g009
Figure 10. Relationship between ln K and T.
Metals 13 00220 g010
Figure 11. TTT diagram with calculation.
Metals 13 00220 g011
Figure 12. Oxide scale structure obtained after high temperature oxidation. (a) cross-sectional structure. (b) Fe2O3 with a honeycomb-like surface, and (c) the interface of Fe2O3-Fe3O4 obtained after local amplification in (a), and (d) the XRD results after high temperature oxidation.
Metals 13 00220 g012
Figure 13. Formation of the Fe3O4 seam layer at the FeO-substrate interface after isothermal transformation: (a) air—450 °C—500 s; (b) magnified in the red square in (a); (c) N2—500 °C—5000 s; (d) magnified in the red square in Figure 13c.
Metals 13 00220 g013
Figure 14. Fe-O diagram.
Metals 13 00220 g014
Figure 15. Fe element distribution at the interface in the Fe3O4-FeO before the start of the eutectoid transformation.
Metals 13 00220 g015
Table 1. lnK and n at different temperature.
Temperature
/°C
AirN2
500 °C450 °C400 °C350 °C500 °C450 °C400 °C350 °C
n1.081.001.011.051.081.041.061.11
ln k−9.18−7.69−7.79−8.87−9.98−8.50−8.65−9.68
Disclaimer/Publisher’s Note: The statements, opinions and data contained in all publications are solely those of the individual author(s) and contributor(s) and not of MDPI and/or the editor(s). MDPI and/or the editor(s) disclaim responsibility for any injury to people or property resulting from any ideas, methods, instructions or products referred to in the content.

