
Probabilistic Seismic Assessment of CoSPSW Structures Using Fragility Functions


Abstract
:1. Introduction
2. Damage States and Repair States
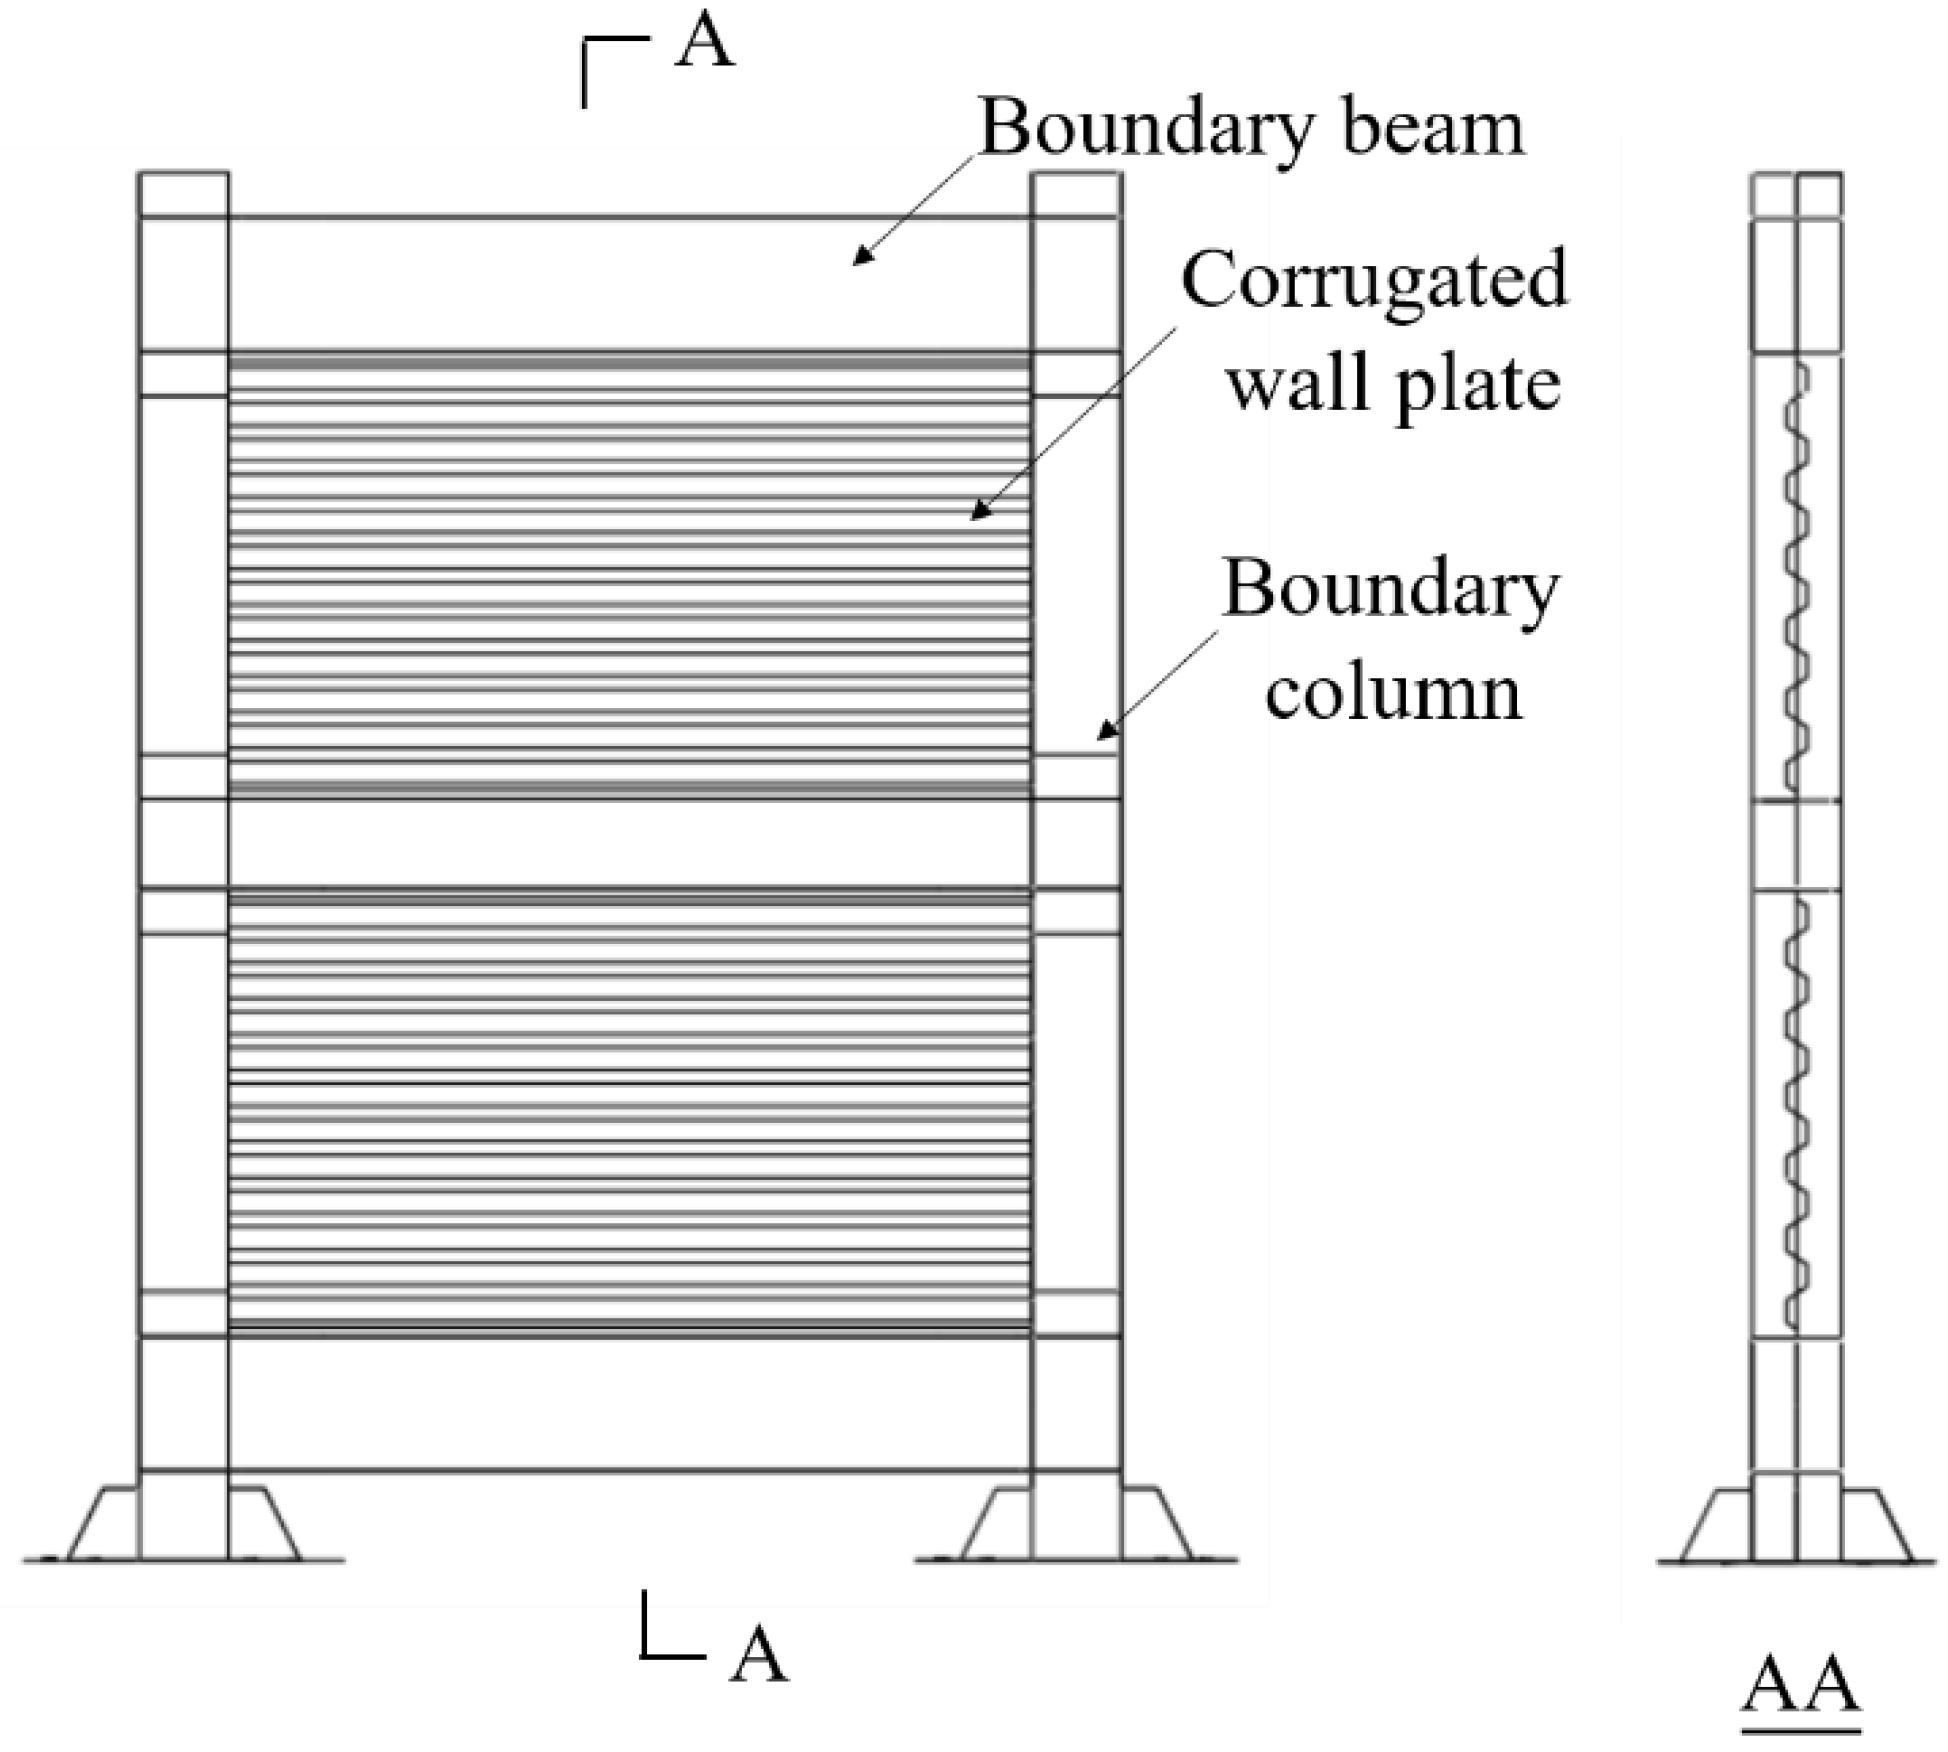
2.1. Establishment of Damage States and Repair States
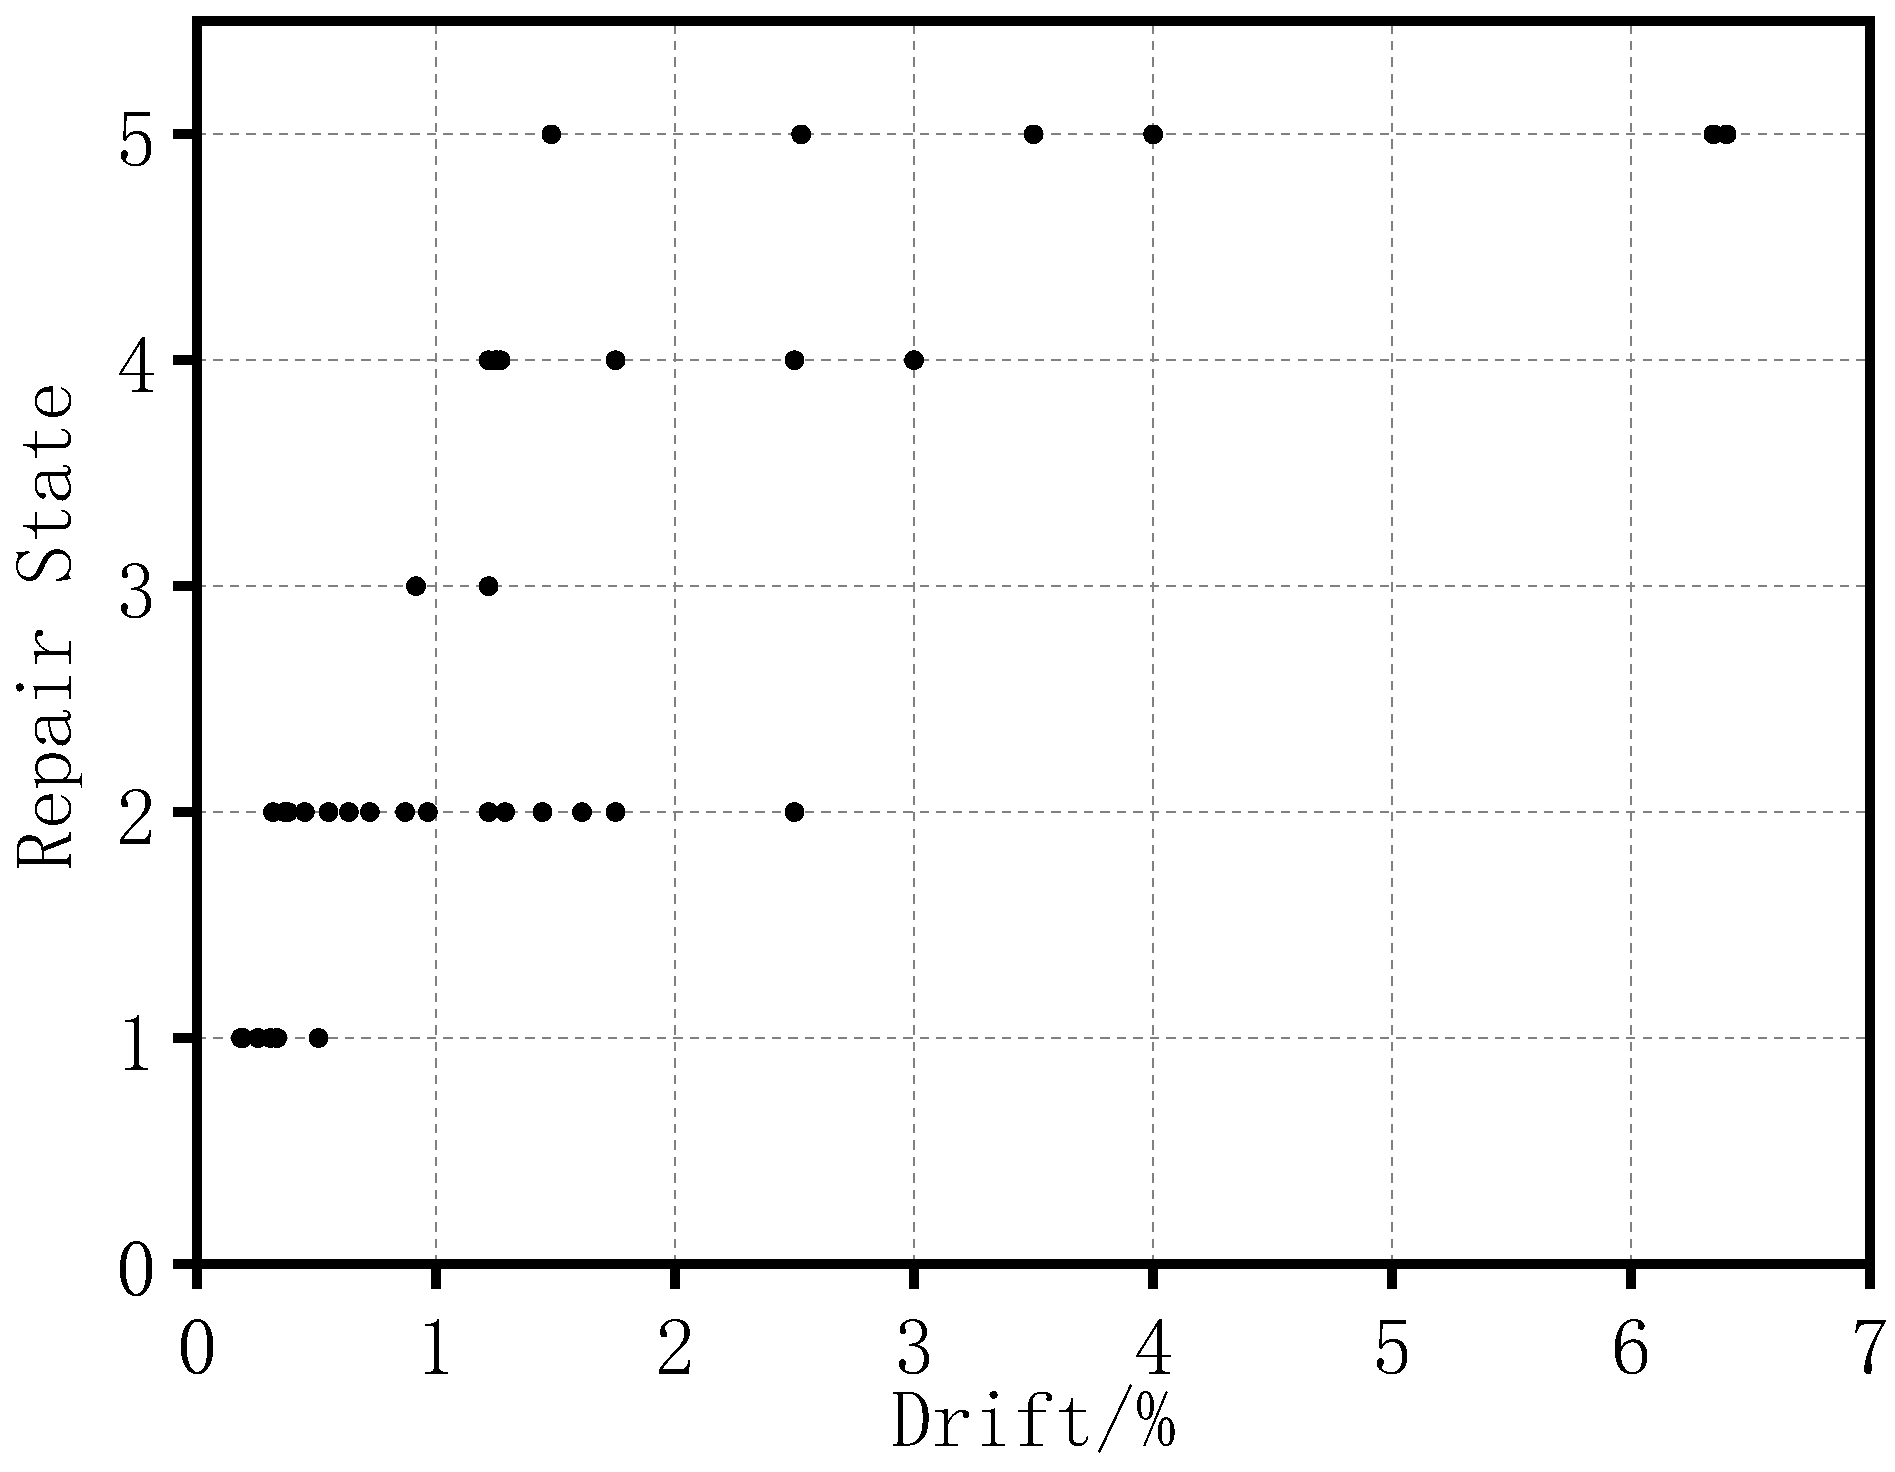
2.2. Calibration of Recommended Values of Inter-Story Drift
3. Incremental Dynamic Analyses
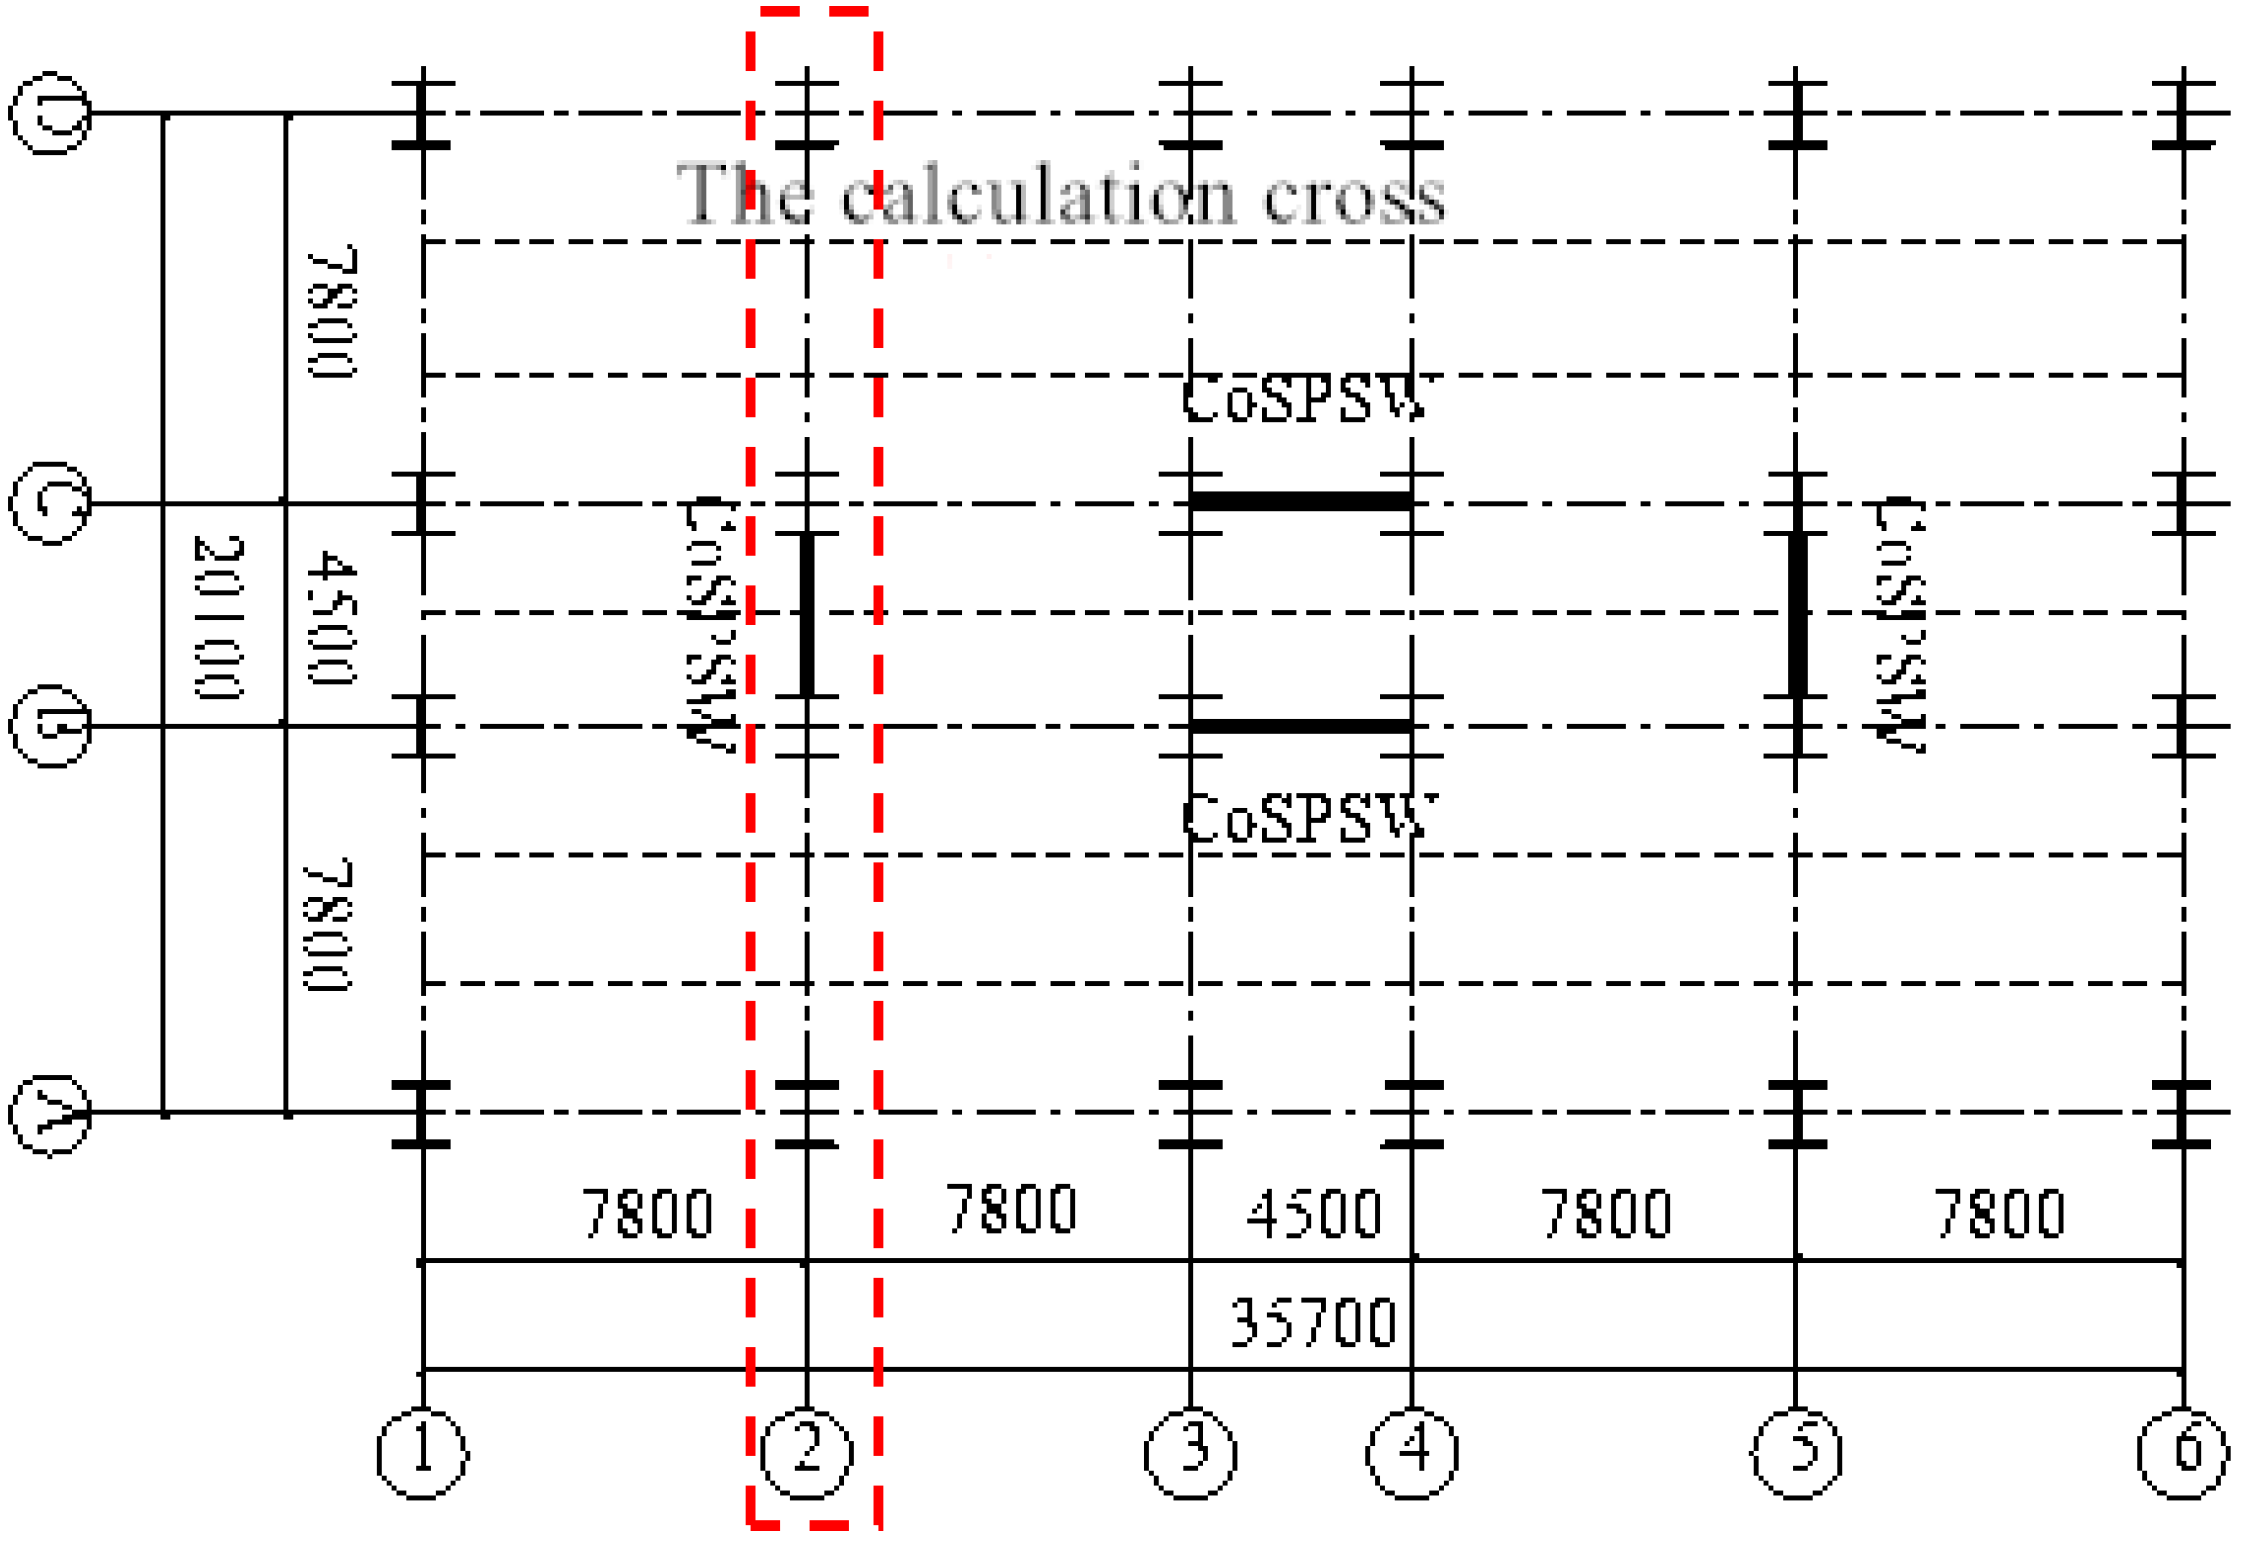
3.1. Structural Models
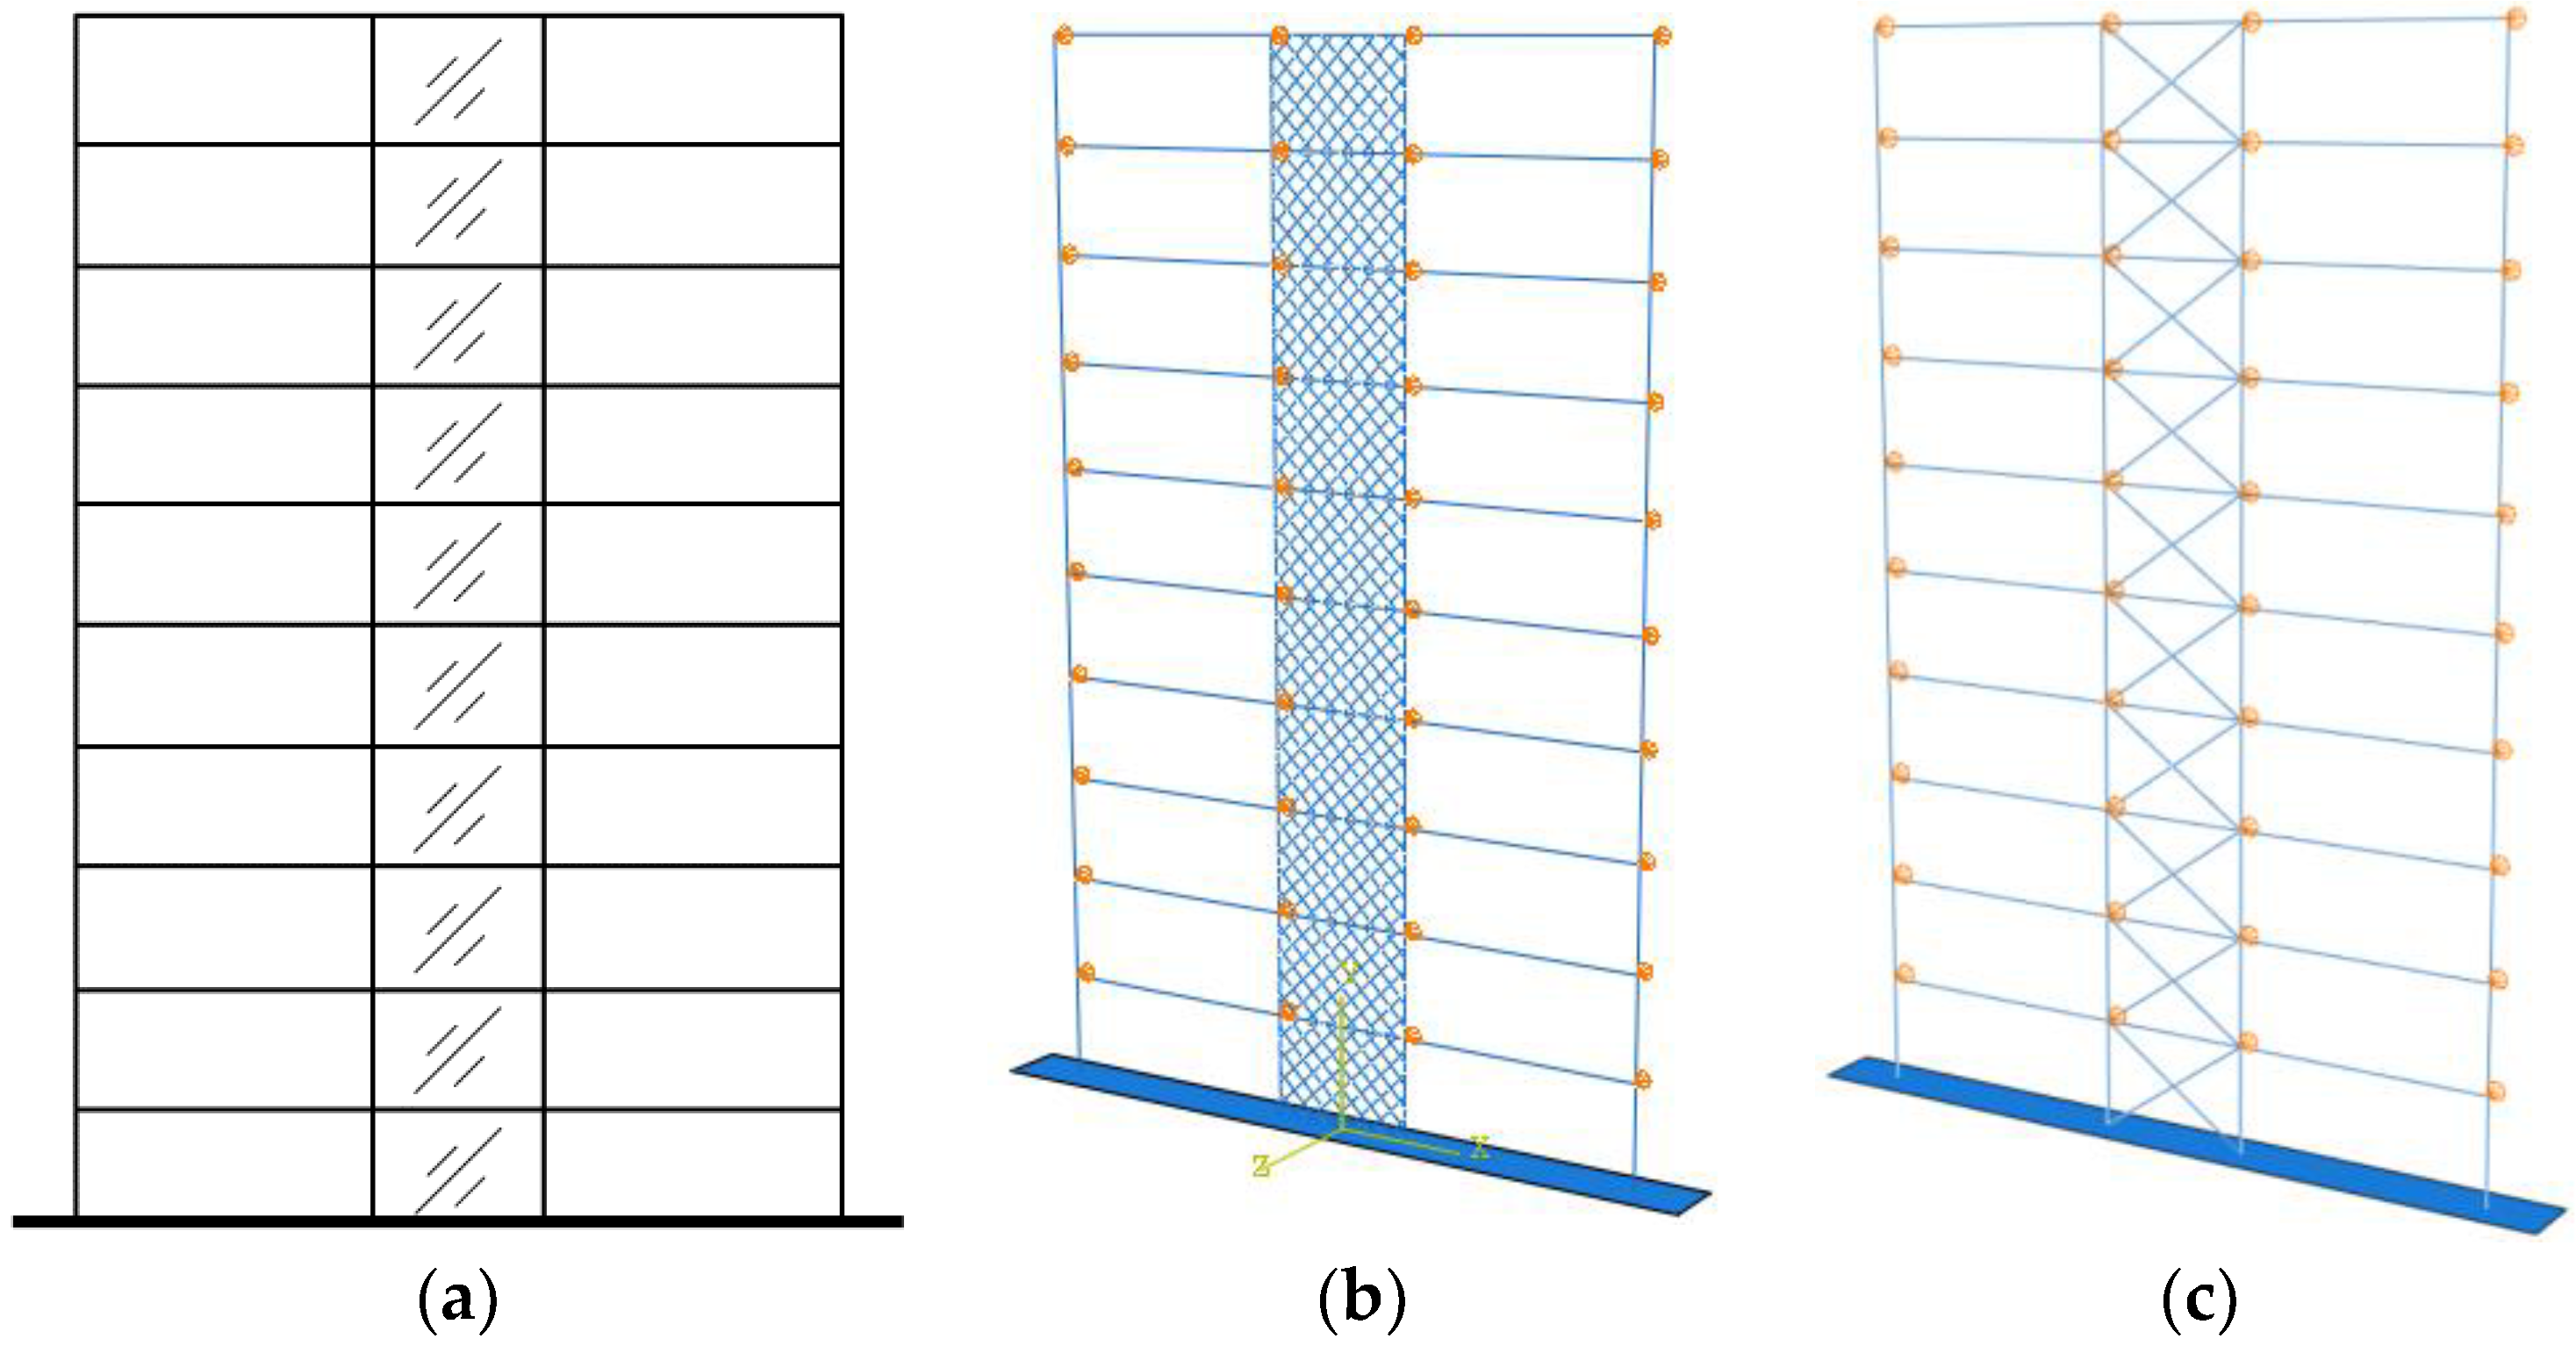
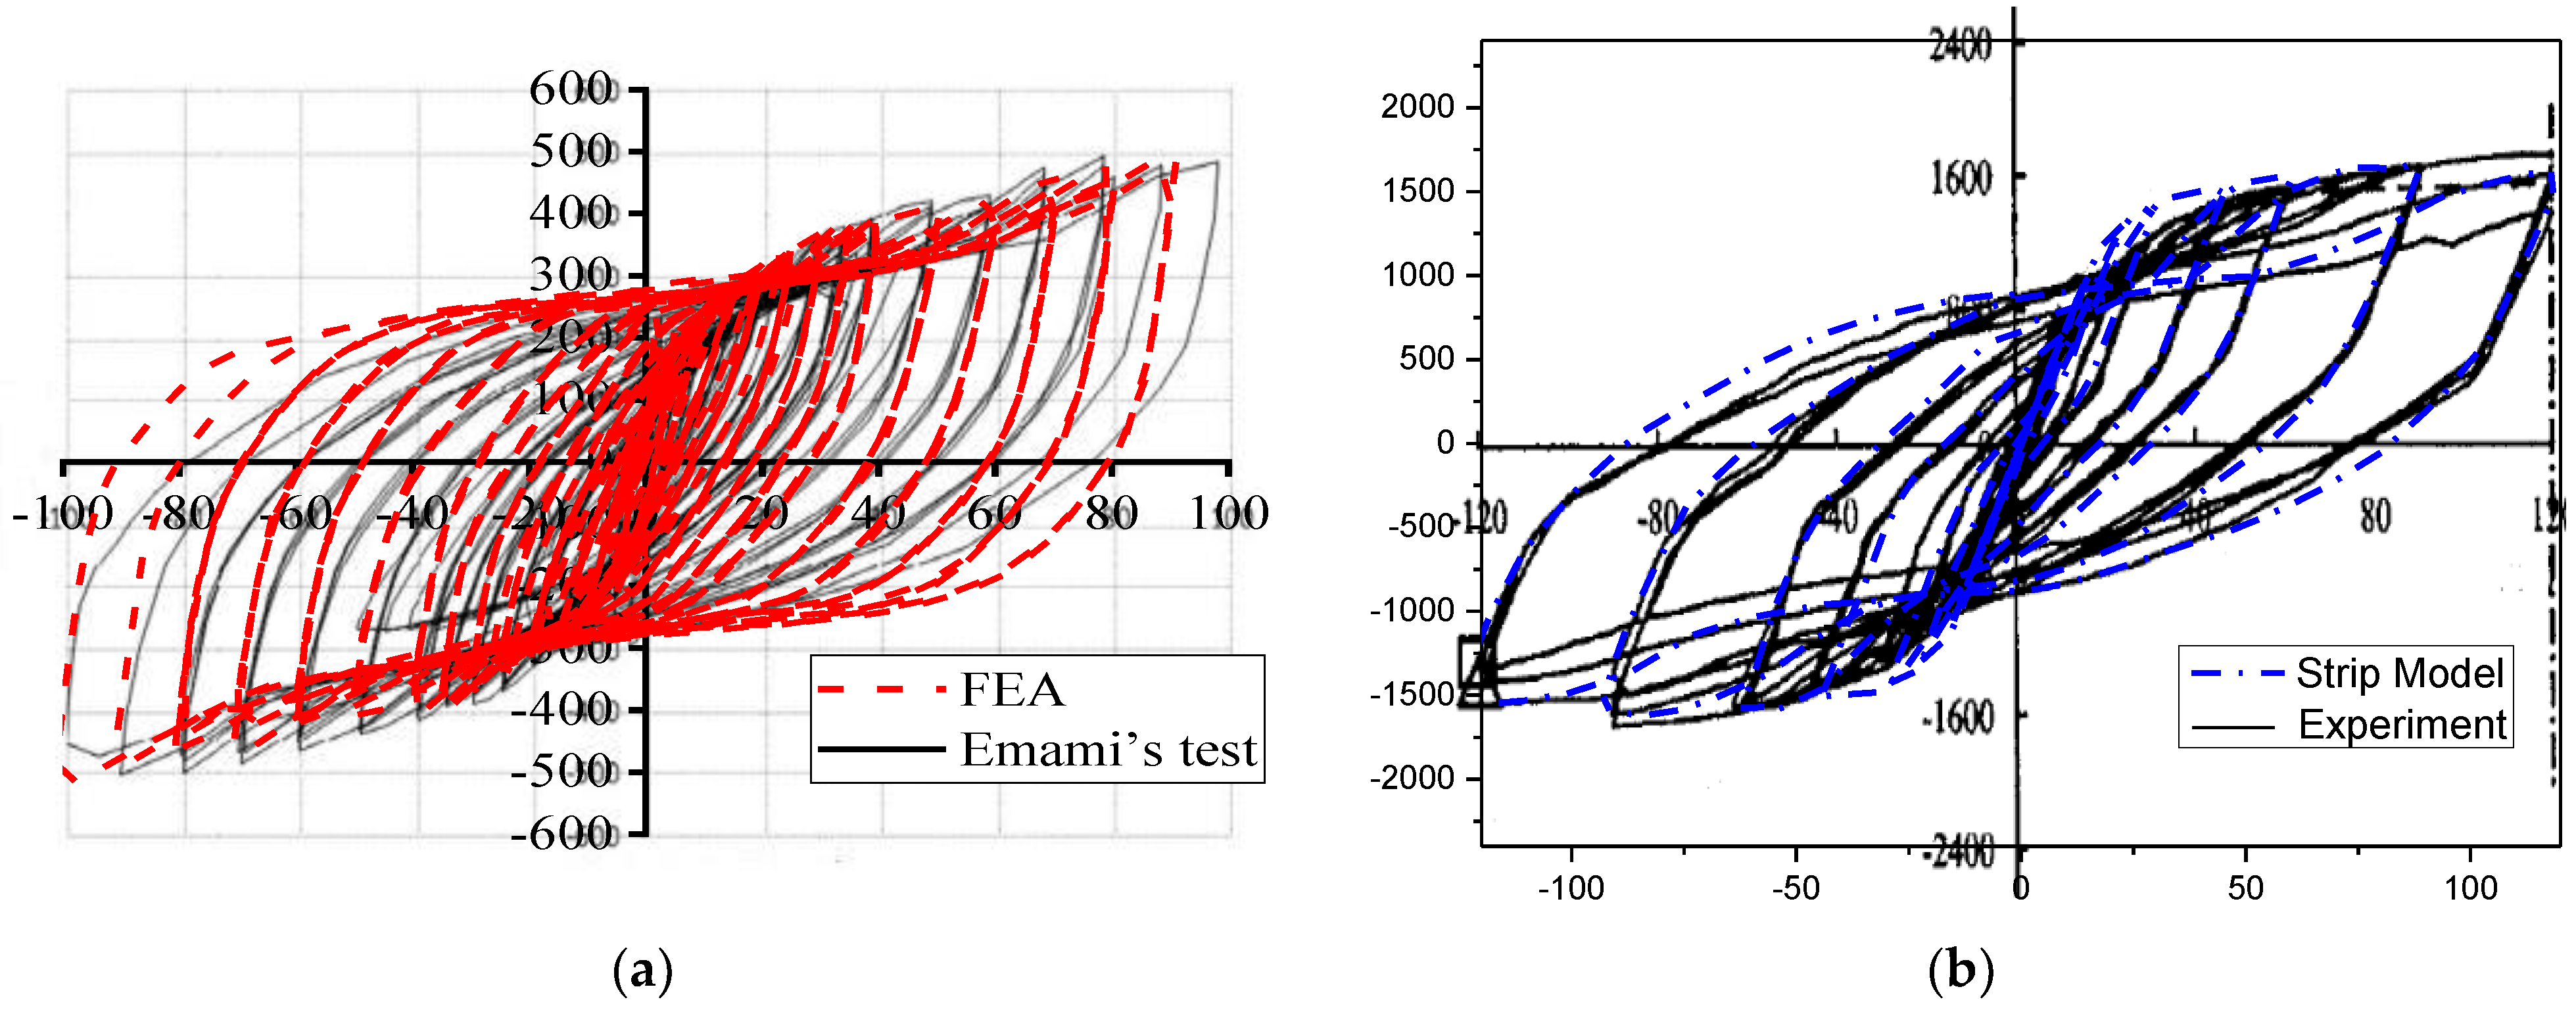
3.2. Finite Element Models
3.3. Incremental Dynamic Analyses
4. Probabilistic Assessment
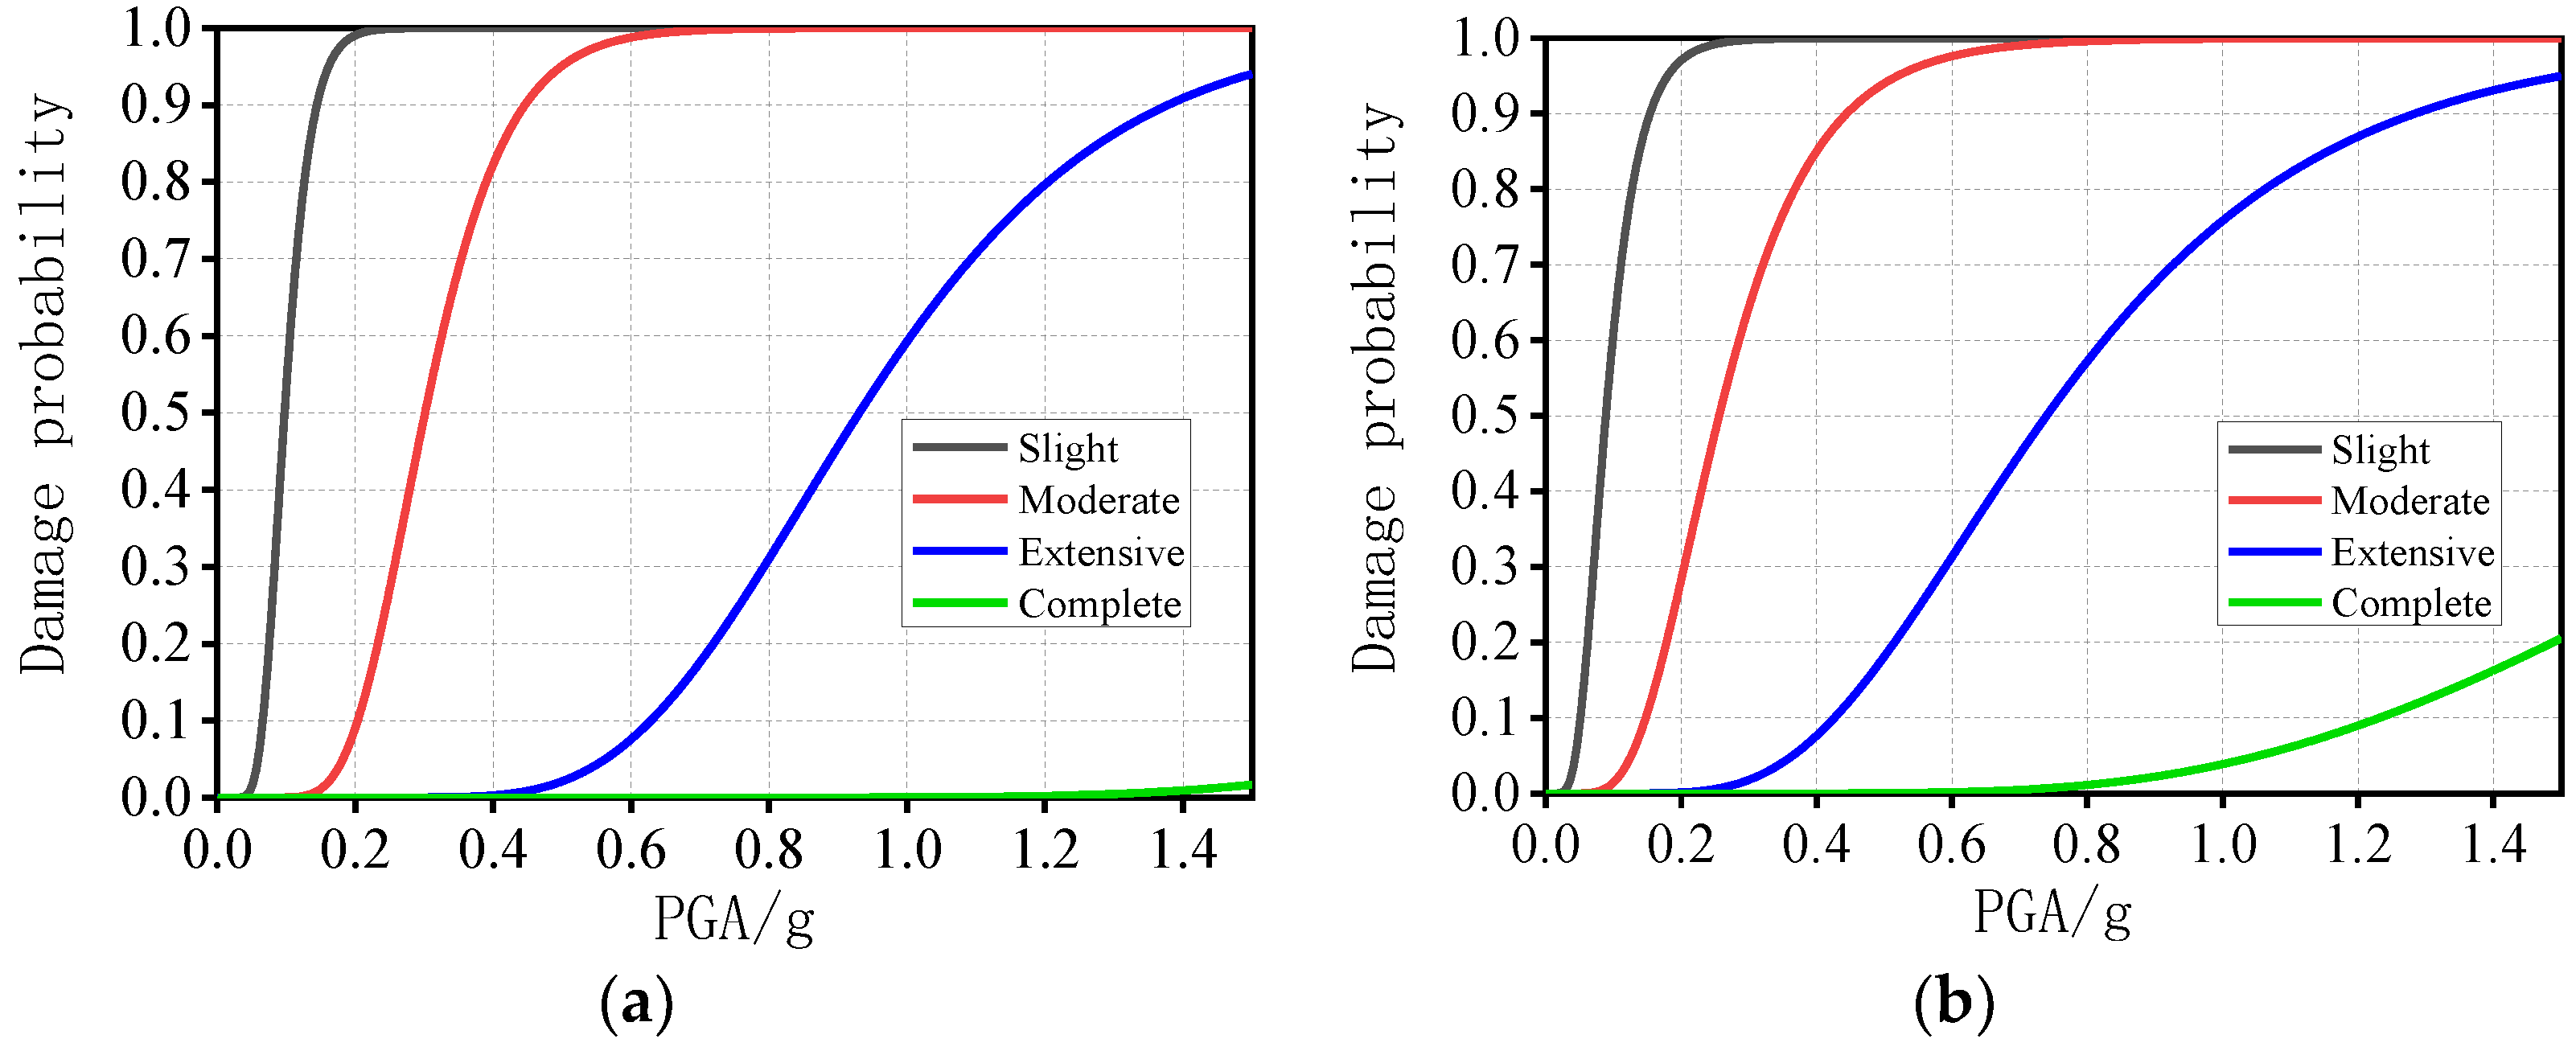
4.1. Fragility Functions
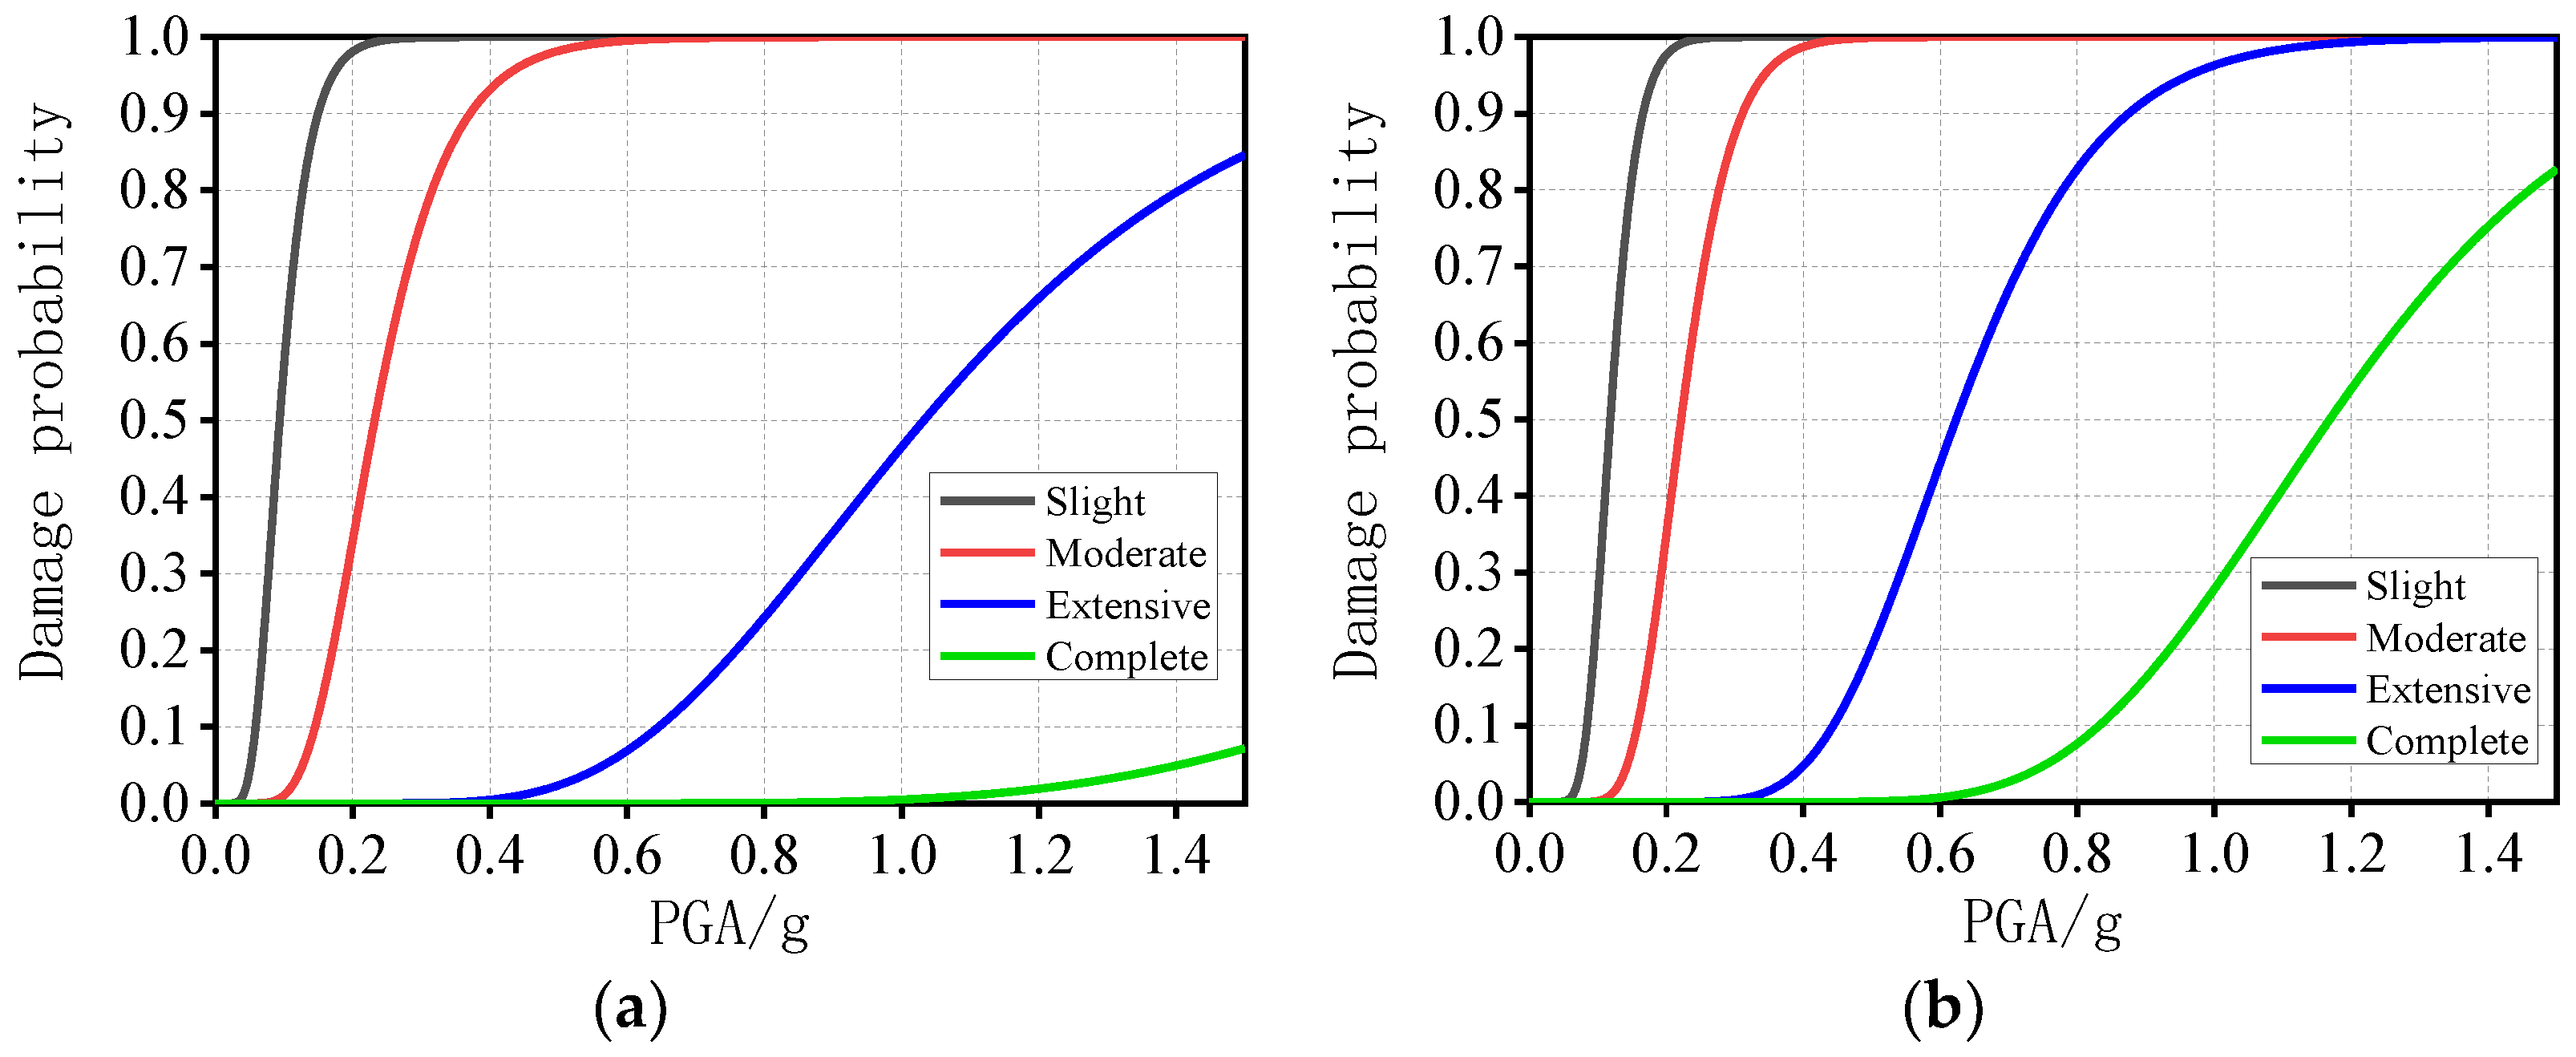
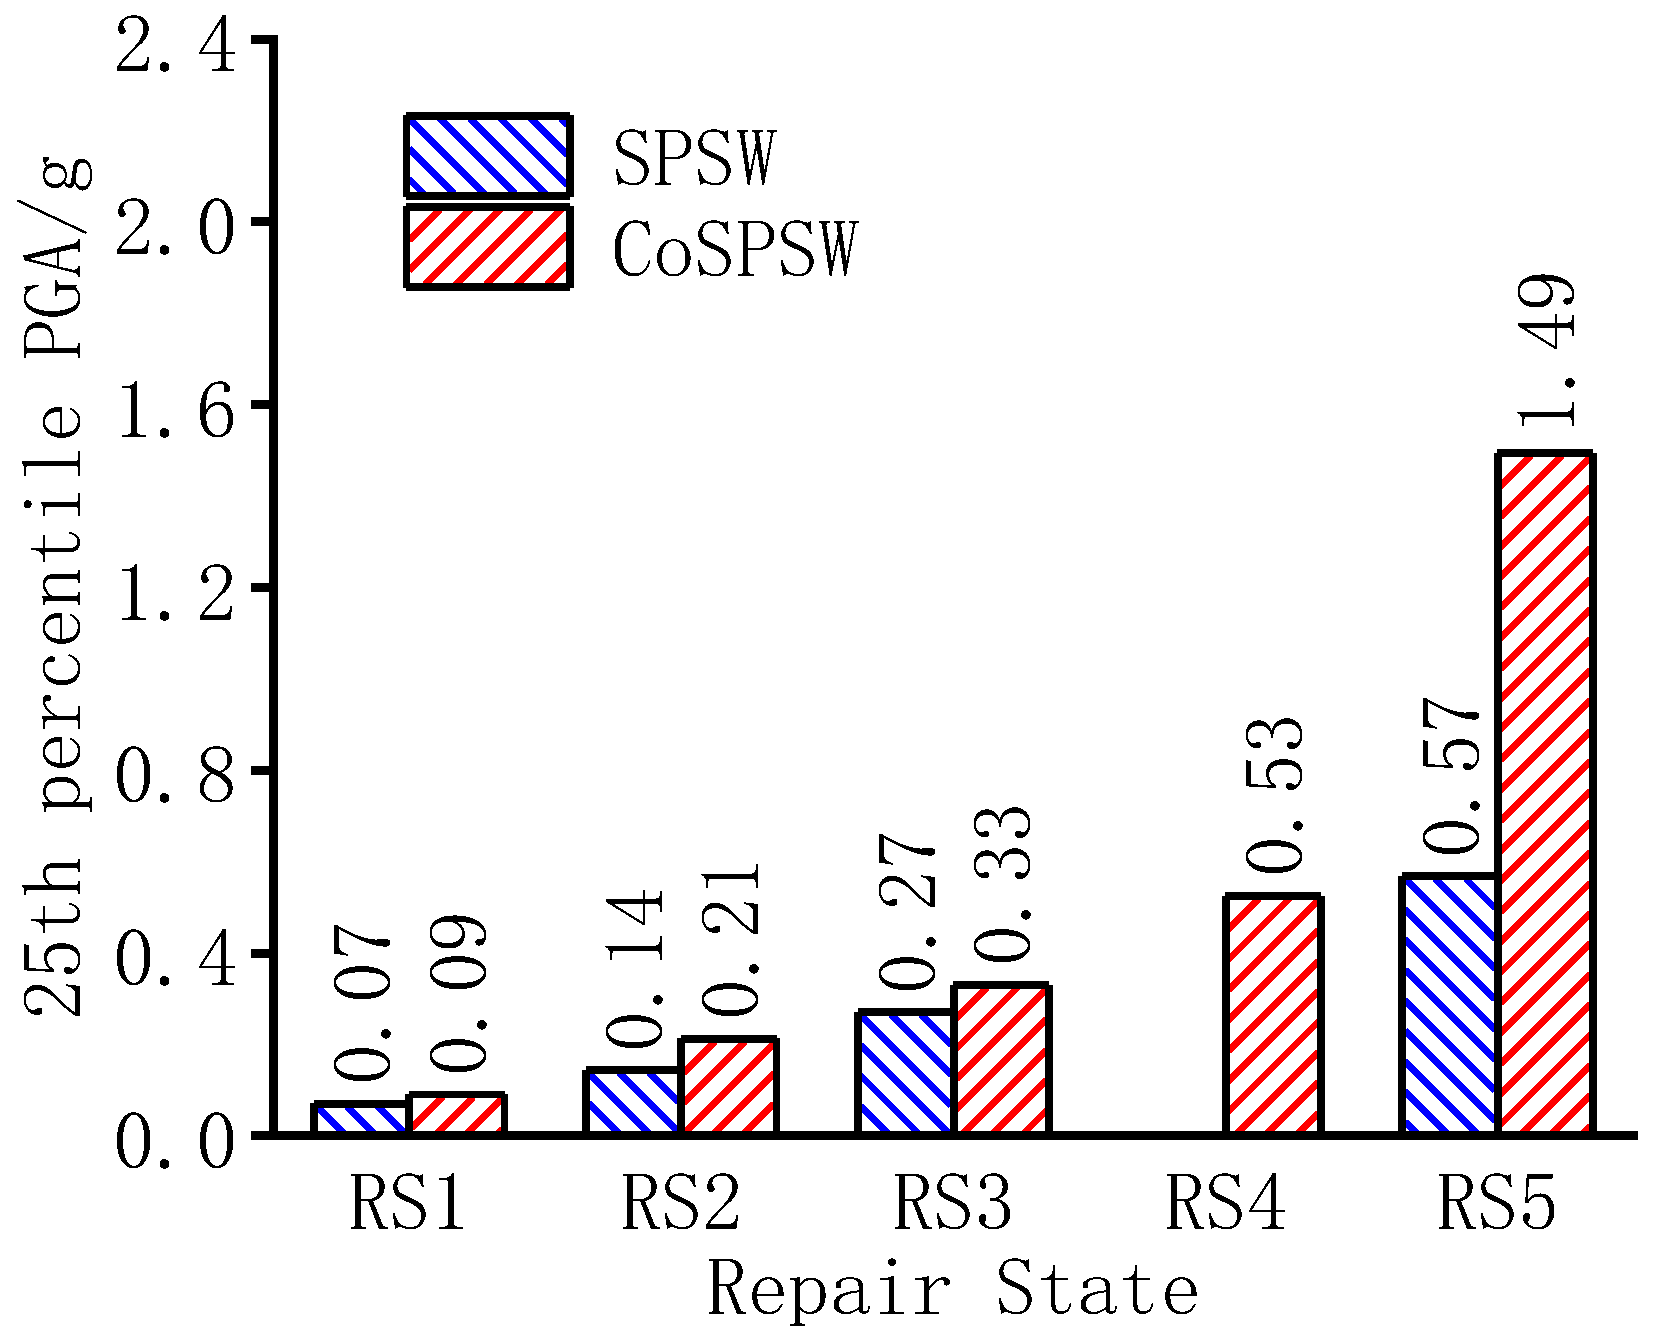
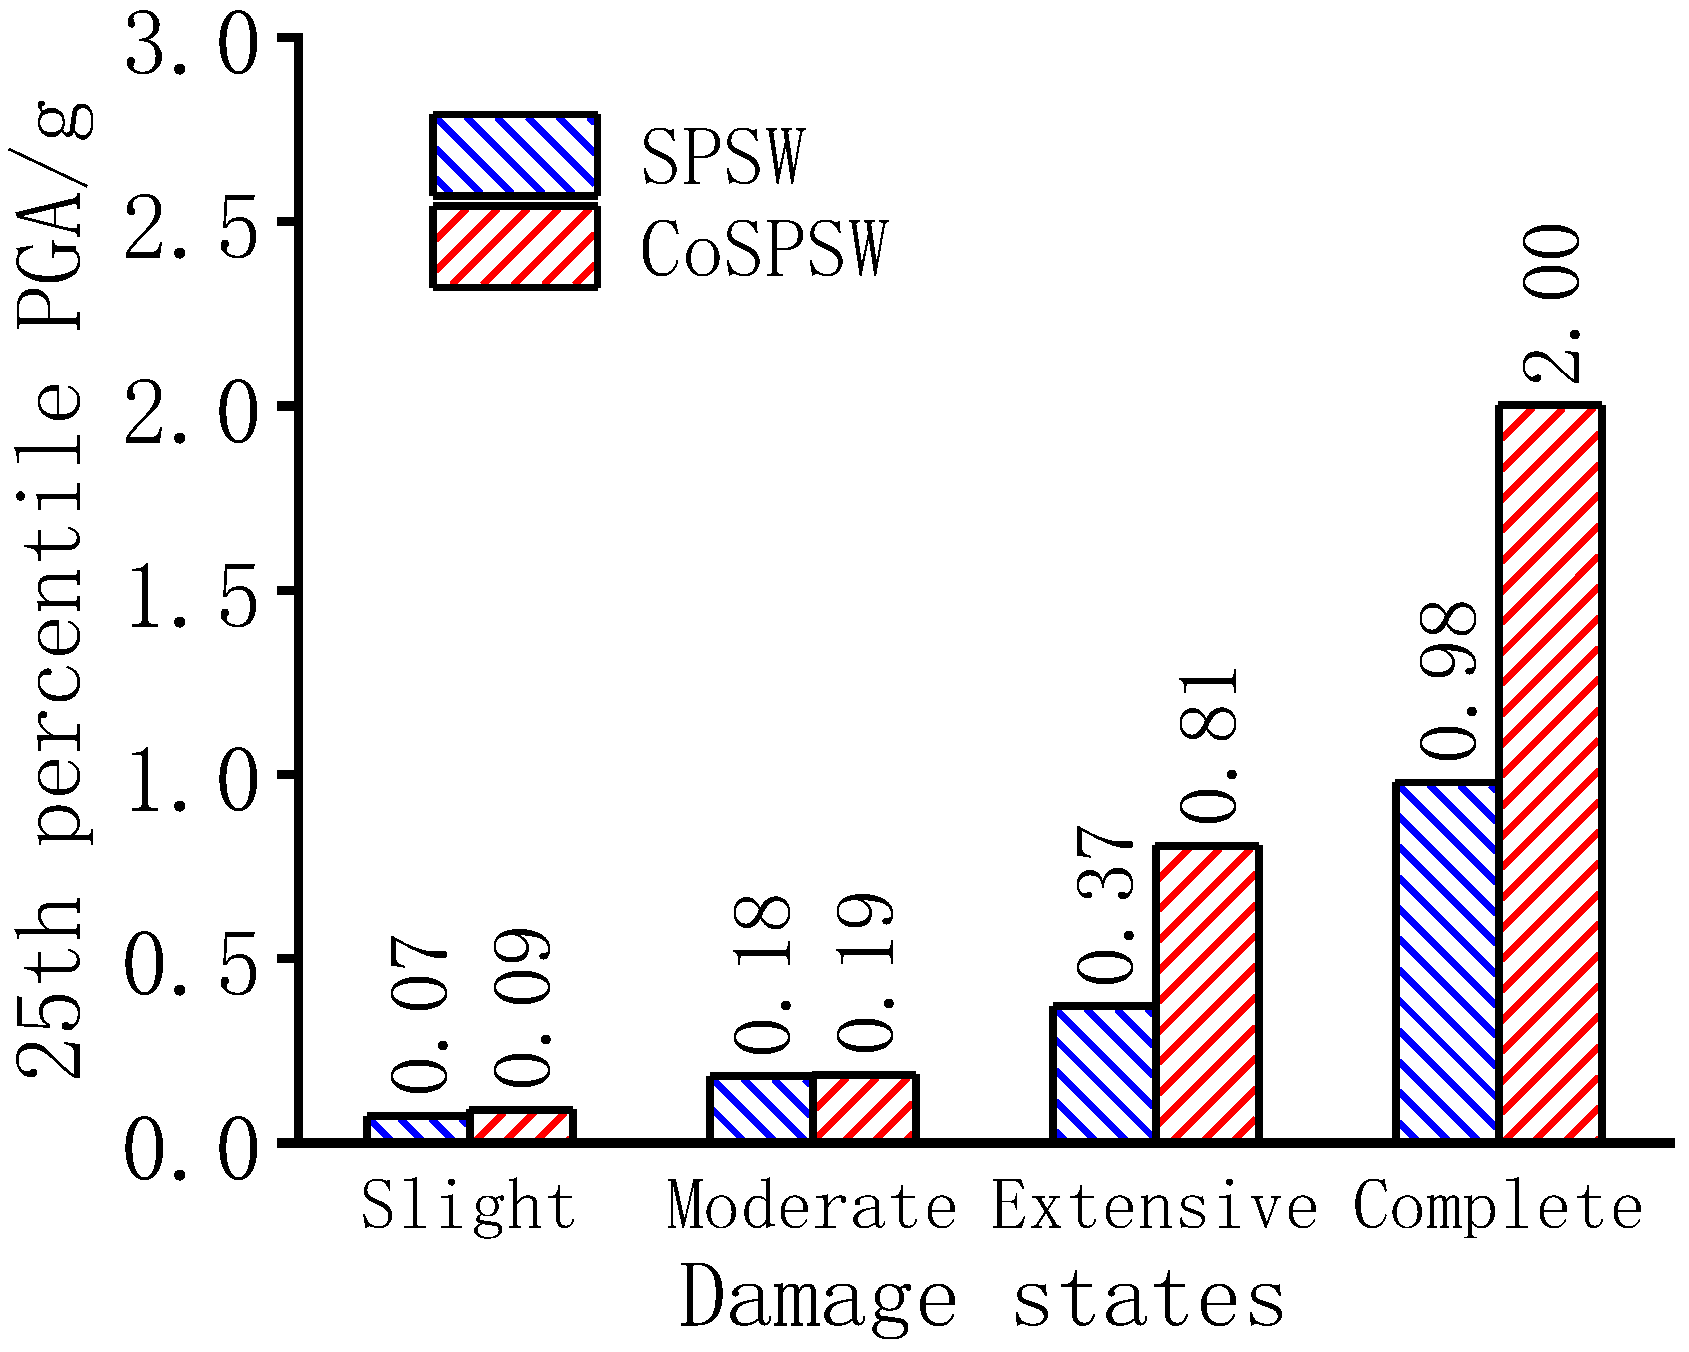
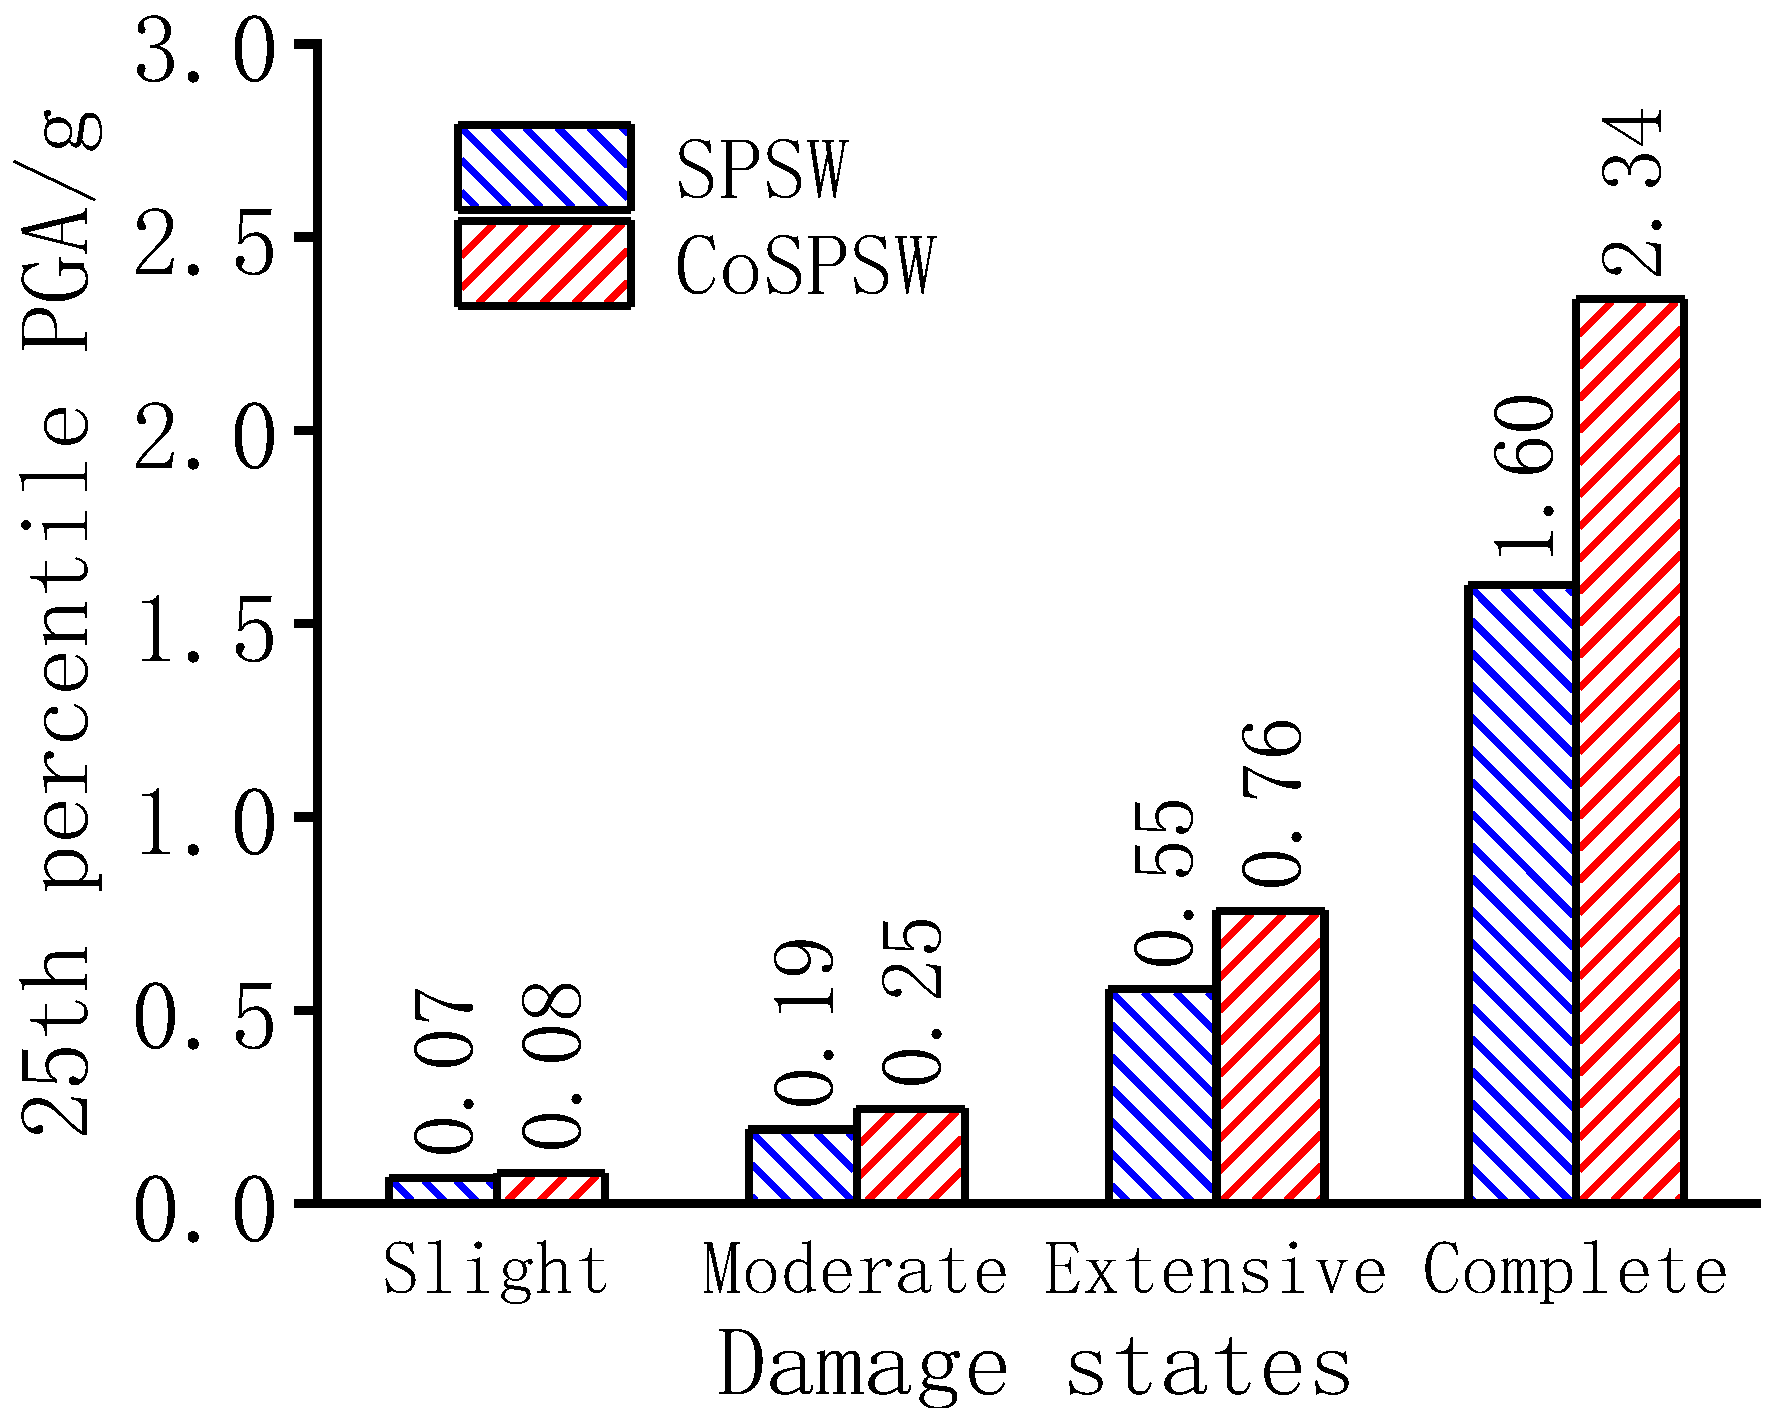
4.2. Seismic Vulnerability
5. Conclusions
Author Contributions
Funding
Institutional Review Board Statement
Informed Consent Statement
Data Availability Statement
Conflicts of Interest
References
- Montgomery, C.J.; Medhekar, M.; Lubell, A.S. Unstiffened Steel Plate Shear Wall Performance under Cyclic Loading. J. Struct. Eng. 2001, 127, 973–975. [Google Scholar] [CrossRef]
- Berman, J.W.; Bruneau, M. Plastic Analysis and Design of Steel Plate Shear Walls. J. Struct. Eng. 2003, 129, 1448–1456. [Google Scholar] [CrossRef] [Green Version]
- Berman, J.W. Seismic behavior of code designed steel plate shear walls. Eng. Struct. 2011, 33, 230–244. [Google Scholar] [CrossRef]
- Driver, R.G. Cyclic Test of Four-Story Steel Plate Shear Wall. J. Struct. Eng. 1998, 124, 112–120. [Google Scholar] [CrossRef]
- Berman, J.W.; Bruneau, M. Capacity Design of Vertical Boundary Elements in Steel Plate Shear Walls. Eng. J. Am. Inst. Steel Constr. Inc. 2008, 45, 57–71. [Google Scholar]
- JGJ/T 380-2015; Technical Specifications for Steel Plate Shear Walls. China Construction Industry Press: Beijing, China, 2016. (In Chinese)
- Berman, J.W.; Celik, O.C.; Bruneau, M. Comparing hysteretic behavior of light-gauge steel plate shear walls and braced frames. Eng. Struct. 2005, 27, 475–485. [Google Scholar] [CrossRef]
- Berman, J.W.; Bruneau, M. Experimental investigation of light-gauge steel plate shear walls. J. Struct. Eng. 2005, 131, 259–267. [Google Scholar] [CrossRef] [Green Version]
- Emami, F.; Mofid, M.; Vafai, A. Experimental study on cyclic behavior of trapezoidally corrugated steel shear walls. Eng. Struct. 2013, 48, 750–762. [Google Scholar] [CrossRef]
- Stojadinovic, B.; Tipping, S. Structural testing of corrugated sheet steel shear walls. In Proceedings of the19th International Specialty Conferences on Cold-Formed Steel Structures, Rolla, MO, USA, 14–15 October 2008. [Google Scholar]
- Hosseinzadeh, L.; Emami, F.; Mofid, M. Experimental investigation on the behavior of corrugated steel shear wall subjected to the different angle of trapezoidal plate. Struct. Des. Tall Spec. Build. 2017, 2, e1390. [Google Scholar] [CrossRef]
- Ding, Y.; Deng, E.F.; Zong, L.; Dai, X.; Lou, N. Cyclic tests on corrugated steel plate shear walls with openings in modularized-constructions. J. Constr. Steel Res. 2017, 138, 675–691. [Google Scholar] [CrossRef]
- Sudeok, S.; Mina, Y.; Seungjae, L. An Experimental Study on the Shear Hysteresis and Energy Dissipation of the Steel Frame with a Trapezoidal-Corrugated Steel Plate. Materials 2017, 10, 261. [Google Scholar] [CrossRef] [Green Version]
- Cao, Q.; Huang, J. Experimental study and numerical simulation of corrugated steel plate shear walls subjected to cyclic loads. Thin-Walled Struct. 2018, 127, 306–317. [Google Scholar] [CrossRef]
- Qiu, J.; Zhao, Q.H.; Yu, C.; Li, Z.X. Experimental studies on cyclic behavior of corrugated steel plate shear walls. J. Struct. Eng. 2018, 144, 4018200. [Google Scholar] [CrossRef]
- Wang, W.; Ren, Y.; Lu, Z. Experimental study of the hysteretic behaviour of corrugated steel plate shear walls and steel plate reinforced concrete composite shear walls. J. Constr. Steel Res. 2019, 160, 136–152. [Google Scholar] [CrossRef]
- Jin, S.S.; Wang, Q.Y.; Zhou, J.; Bai, J.L. Numerical and experimental investigation of assembled multi-grid corrugated steel plate shear walls. Eng. Struct. 2022, 251, 113544. [Google Scholar] [CrossRef]
- Emami, F.; Mofid, M. On the hysteretic behavior of trapezoidally corrugated steel shear walls. Struct. Des. Tall Spec. Build. 2014, 23, 94–104. [Google Scholar] [CrossRef]
- Edalati, S.A.; Yadollahi, Y.; Pakar, I.; Emadi, A.; Bayat, M. Numerical study on the performance of corrugated steel shear walls. Wind Struct. 2014, 19, 405–420. [Google Scholar] [CrossRef]
- Kalali, H.; Hajsadeghi, M. Hysteretic performance of SPSWs with trapezoidally horizontal corrugated web-plates. Steel Compos. Struct. 2015, 19, 277–292. [Google Scholar] [CrossRef]
- Zhao, Q.H.; Sun, J.H.; Li, Y.; Li, Z.X. Cyclic analyses of corrugated steel plate shear walls. Struct. Des. Tall Spec. Build. 2017, 26, e1351. [Google Scholar] [CrossRef]
- Dou, C.; Jiang, Z.Q.; Pi, Y.L.; Guo, Y.L. Elastic shear buckling of sinusoidally corrugated steel plate shear wall. Eng. Struct. 2016, 121, 136–146. [Google Scholar] [CrossRef]
- Farzampour, A.; Mansouri, I.; Hu, J.W. Seismic behavior investigation of the corrugated steel shear walls considering variations of corrugation geometrical characteristics. Int. J. Steel Struct. 2018, 18, 1297–1305. [Google Scholar] [CrossRef]
- Bahrebar, M.; Kabir, M.; Zirakian, M.; Hajsadeghi, M.; Lim, J. Structural performance assessment of trapezoidally-corrugated and centrally-perforated steel plate shear walls. J. Constr. Steel Res. 2016, 122, 584–594. [Google Scholar] [CrossRef]
- Bahrebar, M.; Lim, J.; Clifton, G.; Zirakian, T.; Shahmohammadi, A.; Hajsadeghi, M. Perforated steel plate shear walls with curved corrugated webs under cyclic loading. Structures 2020, 24, 600–609. [Google Scholar] [CrossRef]
- Farzampour, A.; Yekrangnia, M. On the behavior of corrugated steel shear walls with and without openings. In Proceedings of the Second European Conference on Earthquake Engineering and Seismology, Istanbul, Turkey, 25–29 August 2014. [Google Scholar]
- Farzampour, A.; Laman, J.A. Behavior prediction of corrugated steel plate shear walls with openings. J. Constr. Steel Res. 2015, 114, 258–268. [Google Scholar] [CrossRef]
- Farzampour, A.; Mansouri, I.; Lee, C.H.; Sim, H.B.; Hi, J.W. Analysis and design recommendations for corrugated steel plate shear walls with a reduced beam section. Thin-Walled Struct. 2018, 132, 658–666. [Google Scholar] [CrossRef]
- Masoud, H.A.; Mahna, S. Seismic behavior of steel plate shear wall with reduced boundary beam section. Thin-Walled Struct. 2018, 116, 169–179. [Google Scholar] [CrossRef]
- Fang, J.; Bao, W.; Ren, F.; Guan, T.; Xue, G.; Jiang, J. Experimental study of hysteretic behavior of semi-rigid frame with a corrugated plate. J. Constr. Steel Res. 2020, 174, 106–119. [Google Scholar] [CrossRef]
- Shariati, M.; Faegh, S.S.; Mehrabi, P.; Bahavarnia, S.; Zandi, Y.; Masoom, D. Numerical study on the structural performance of corrugated low yield point steel plate shear walls with circular openings. Steel Compos. Struct. 2019, 33, 569–581. [Google Scholar] [CrossRef]
- Yu, Y.J.; Chen, Z.H. Rigidity of corrugated plate sidewalls and its effect on the modular structural design. Eng. Struct. 2018, 175, 191–200. [Google Scholar] [CrossRef]
- Zhao, Y. Lateral Behavior and Design Method of Corrugated Steel Plate Shear Walls. Master Thesis, Tianjin University, Tianjin, China, 2018. (In Chinese). [Google Scholar]
- Baldvins, N.M.; Berman, J.W.; Lowes, L.N.; Janes, T.M. Fragility functions for steel plate shear walls. Earth. Spectra. 2012, 28, 405–426. [Google Scholar] [CrossRef]
- Negar, M.; Epackachi, S. Fragility functions for steel-plate concrete composite shear walls. J. Constr. Steel Res. 2019, 167, 105776. [Google Scholar] [CrossRef]
- Wang, M.; Guo, Y.; Yang, L. Damage indices and fragility assessment of coupled low-yield-point steel plate shear walls. J. Build. Eng. 2021, 11, 103010. [Google Scholar] [CrossRef]
- Zhang, J.; Zirakian, T. Probabilistic assessment of structures with SPSW systems and LYP steel infill plates using fragility function method. Eng. Struct. 2015, 85, 195–205. [Google Scholar] [CrossRef]
- Jiang, L.; Hong, Z.; Hu, Y. Effects of various uncertainties on seismic risk of steel frame equipped with steel panel wall. Bul. Earth. Eng. 2018, 16, 5995–6012. [Google Scholar] [CrossRef]
- Hu, Y.; Zhao, J.H. Seismic risk assessment of steel frames equipped with steel panel wall. Struct. Des. Tall Spec. Build. 2017, 26, e1368. [Google Scholar] [CrossRef]
- Bu, H.; He, L.; Jiang, H. Seismic fragility assessment of steel frame structures equipped with steel slit shear walls. Eng. Struct. 2021, 249, 113328. [Google Scholar] [CrossRef]
- HAZUS-MH MR5; Earthquake Loss Estimation Methodology—Technical and User’s Manual. Department of Homeland Security, Federal Emergency Management Agency, Mitigation Division: Washington, DC, USA, 2010.
- FEMA 352; Recommended Post-Earthquake Evaluation and Repair Criteria for Welded Steel Moment-Frame Buildings. Safety Council for the Federal Emergency Management Agency: Washington, DC, USA, 2000.
- ATC-58; Guidelines for Seismic Performance Assessment of Buildings. Safety Council for the Federal Emergency Management Agency, Applied Technology Council: Redwood, CA, USA, 2009.
- GB50011-2010; Code for Seismic Design of Buildings. China Architecture and Building Press: Beijing, China, 2010. (In Chinese)
- Jiang, W.W.; Jin, H.J.; Sun, F.F. Research on simplified analysis models of non-buckling corrugated steel shear walls. Pro. Steel Build. Struct. 2019, 21, 61–71. (In Chinese) [Google Scholar]
- Park, H.G.; Kwack, J.H.; Jeon, S.W.; Kim, W.K.; Choi, I.R. Framed steel plate wall behavior under cyclic lateral loading. J. Struct. Eng. 2007, 133, 378–388. [Google Scholar] [CrossRef]
- Baker, J.W.; Cornell, C.A. Vector-valued ground motion intensity measures for probabilistic seismic demand analysis. In PEER Report; College of Engineering, University of California: Berkeley, CA, USA, 2006. [Google Scholar]
- Zhang, J.; Huo, Y.; Brandenberg, S.J.; Kashighandi, P. Effects of structural characterizations on fragility functions of bridges subject to seismic shaking and lateral spreading. Earth. Eng. Eng. Vibr. 2008, 7, 369–382. [Google Scholar] [CrossRef]


| Specimen No. | Thickness (mm) | Aspect Ratio (L/H) | Height-to-Thickness Ratio (H/t) | Peak Inter-Story Drift (%) | |
|---|---|---|---|---|---|
| Emami [9] | S-2 S-3 | 1.25 1.25 | 1.33 1.33 | 1184 1184 | 6.10 6.10 |
| Hos [11] | C-30 C-45 C-60 | 1.25 1.25 1.25 | 1.20 1.20 1.20 | 1261 1261 1261 | 6.35 6.35 6.35 |
| Ding [12] | CSPSW-1 CSPSW-2 CSPSW-3 CSPSW-4 | 1.60 2.00 1.60 1.66 | 1.22 1.22 0.83 1.22 | 1687 1687 1687 1687 | 4.00 2.20 4.00 2.10 |
| Sudeok Shon [13] | FR-TR-V FR-TR-H | 3.20 3.20 | 1.69 1.69 | 555 555 | 8.00 8.00 |
| Cao [14] | S-1 S-2 | 2.93 2.47 | 0.96 0.71 | 425 628 | 2.53 1.48 |
| Zhao [15] | S-2 S-3 S-4 | 2.00 2.00 2.00 | 1.00 1.00 1.00 | 550 550 550 | 5.00 4.00 4.50 |
| Wang [16] | SPSW-2 SPSW-3 | 3.00 3.00 | 0.70 0.70 | 660 660 | 1.90 2.30 |
| Jin [17] | CoSPSW | 5.00 | 1.00 | 180 | 2.50 |
| Damage State | Description | Damage State | Description |
|---|---|---|---|
| 1 | Elastic Web Plate Buckling for Slender Corrugated Web Plate | 7 | HBE Local Buckling Requiring Repair |
| 2 | Initial Corrugated Web Plate Yielding | 8 | VBE Local Buckling Requiring Repair |
| 3 | Significant Plastic Deformation of Corrugated Web Plate | 9 | Corrugated Web Plate Cracking |
| 4 | Initial HBE and/or VBE Yielding | 10 | HBE and HBE-to-VBE Connection Cracking |
| 5 | Initial VBE Local Buckling | 11 | VBE Cracking |
| 6 | Initial HBE Local Buckling | 12 | Connection and/or Boundary Frame Failure |
| Repair State | Description | Corresponding Damage States |
|---|---|---|
| 1 | Cosmetic repair | 1,2,4,5,6 |
| 2 | Replace Web Plate | 3,9 |
| 3 | HBE and Connection Repair | 7,10 |
| 4 | VBE Repair | 8,11 |
| 5 | Replace Boundary Elements or Frame | 12 |
| DS | Median (%) | COV | Data Points |
|---|---|---|---|
| 1 | 0.19 | 0.15 | 5 |
| 2 | 0.25 | 0.32 | 4 |
| 3 | 0.42 | 0.39 | 10 |
| 4 | 0.26 | 0.45 | 5 |
| 5 | - | - | 0 |
| 6 | - | - | 0 |
| 7 | 1.07 | 0.20 | 2 |
| 8 | 1.25 | 0.17 | 5 |
| 9 | 1.37 | 0.35 | 10 |
| 10 | - | - | 0 |
| 11 | 3.00 | 0.10 | 3 |
| 12 | 4.10 | 0.39 | 10 |
| RS | Median (%) | COV | Data Points |
|---|---|---|---|
| 1 | 0.19 | 0.38 | 14 |
| 2 | 0.80 | 0.63 | 20 |
| 3 | 1.07 | 0.20 | 2 |
| 4 | 1.51 | 0.40 | 8 |
| 5 | 4.10 | 0.39 | 10 |
| Repair State | θx | βx | β | θrec | βrec |
|---|---|---|---|---|---|
| RS1 | 0.23 | 0.31 | 0.39 | 0.20 | 0.40 |
| RS2 | 0.80 | 0.63 | 0.67 | 0.80 | 0.50 |
| RS3 | 1.06 | 0.14 | 0.29 | 1.00 | 0.40 |
| RS4 | 1.76 | 0.38 | 0.46 | 1.80 | 0.40 |
| RS5 | 4.31 | 0.47 | 0.54 | 4.30 | 0.50 |
| Repair States | Recommended Inter-Story Drift | Description | ||
|---|---|---|---|---|
| CoSPSW | SPSW | CoSPSW | SPSW | |
| RS1 | 0.002 | 0.004 | Repair infill wall surface | |
| RS2 | 0.008 | 0.006 | Replace infill wall | |
| RS3 | 0.01 | 0.015 | Repair boundary beam and beam-column connection | Repair boundary column |
| RS4 | 0.018 | - | Repair boundary column | Repair boundary beam and beam-column connection |
| RS5 | 0.043 | 0.0275 | Replace boundary beam, column, or frame | |
| Damage States | Slight | Moderate | Extensive | Complete |
|---|---|---|---|---|
| Inter-story drift | 0.004 | 0.008 | 0.025 | 0.050 |
| Damage States | Slight | Moderate | Extensive | Complete |
|---|---|---|---|---|
| Peak floor acceleration | 0.3 g | 0.6 g | 1.2 g | 2.4 g |
| Design Parameter | Value |
|---|---|
| Horizontal seismic influence factor | 0.463 |
| Spectral acceleration Sa/g | 1.106 |
| Fundamental period T/s | 1.152 |
| Yield drift θy | 0.005 |
| Target drift θu | 0.025 |
| Ductility coefficient μs | 5 |
| Ductility reduction coefficient Rμ | 5 |
| Energy correction factor γ | 0.360 |
| ξ | 2.745 |
| Vy/W | 0.152 |
| Floor | Columns in the Wall Plate Span * | Columns Outside the Wall Plate Span * | Wall Plate Thickness (mm) |
|---|---|---|---|
| 10 | H450 × 450 × 12 × 20 | H350 × 350 × 16 × 18 | 1.8 |
| 9 | H500 × 500 × 14 × 22 | H400 × 400 × 16 × 18 | 3.0 |
| 8 | H550 × 550 × 18 × 26 | H400 × 400 × 16 × 20 | 4.0 |
| 7 | H600 × 600 × 24 × 32 | H450 × 450 × 16 × 22 | 4.9 |
| 6 | H600 × 600 × 32 × 42 | H450 × 450 × 20 × 26 | 5.6 |
| 5 | H650 × 650 × 36 × 48 | H500 × 500 × 20 × 26 | 6.3 |
| 4 | H650 × 650 × 48 × 56 | H500 × 500 × 24 × 28 | 6.9 |
| 3 | H700 × 700 × 48 × 56 | H550 × 550 × 24 × 28 | 7.3 |
| 2 | H750 × 750 × 56 × 64 | H550 × 550 × 28 × 32 | 7.6 |
| 1 | H750 × 750 × 68 × 72 | H600 × 600 × 28 × 36 | 7.8 |
| Record No. | Record | Minimum Frequency (Hz) | PGA (g) | PGV * (cm/s) |
|---|---|---|---|---|
| RSN0169 | IMPVALL.H_H-DLT352 | 0.09 | 0.35 | 33 |
| RSN0174 | IMPVALL.H_H-E11230 | 0.10 | 0.38 | 45 |
| RSN0752 | LOMAP_CAP090 | 0.25 | 0.51 | 38 |
| RSN0767 | LOMAP_G03090 | 0.13 | 0.56 | 45 |
| RSN0953 | NORTHR_MUL279 | 0.15 | 0.49 | 67 |
| RSN0960 | NORTHR_LOS270 | 0.13 | 0.47 | 41 |
| RSN1111 | KOBE_NIS090 | 0.13 | 0.48 | 47 |
| RSN1485 | CHICHI_TCU045N | 0.05 | 0.51 | 46 |
| RSN1602 | DUZCE_BOL090 | 0.06 | 0.81 | 66 |
| RSN1787 | HECTOR_HEC090 | 0.04 | 0.33 | 45 |
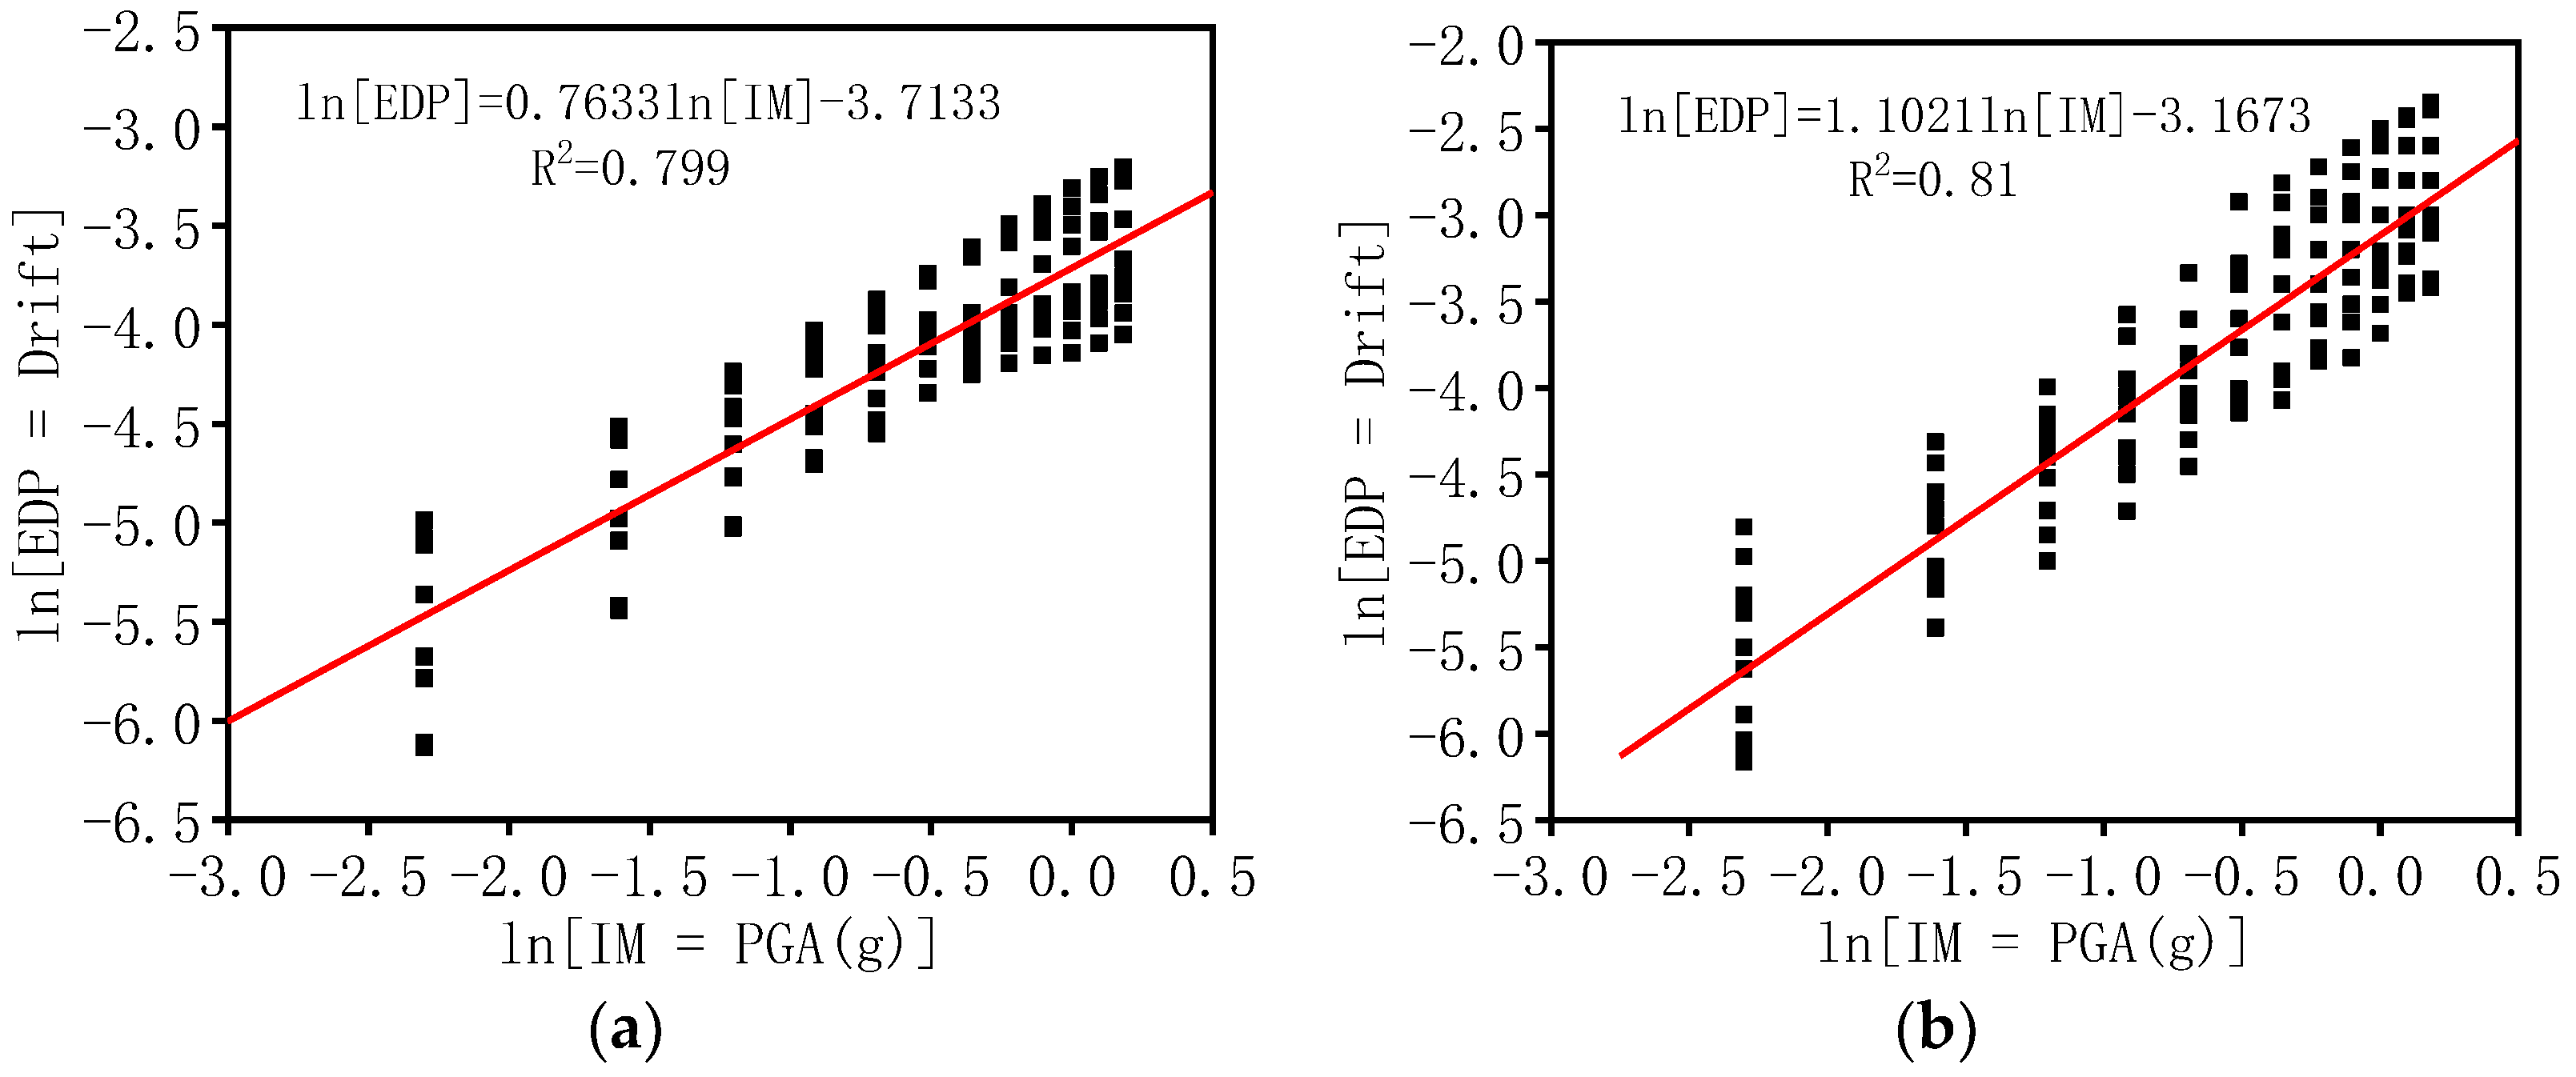
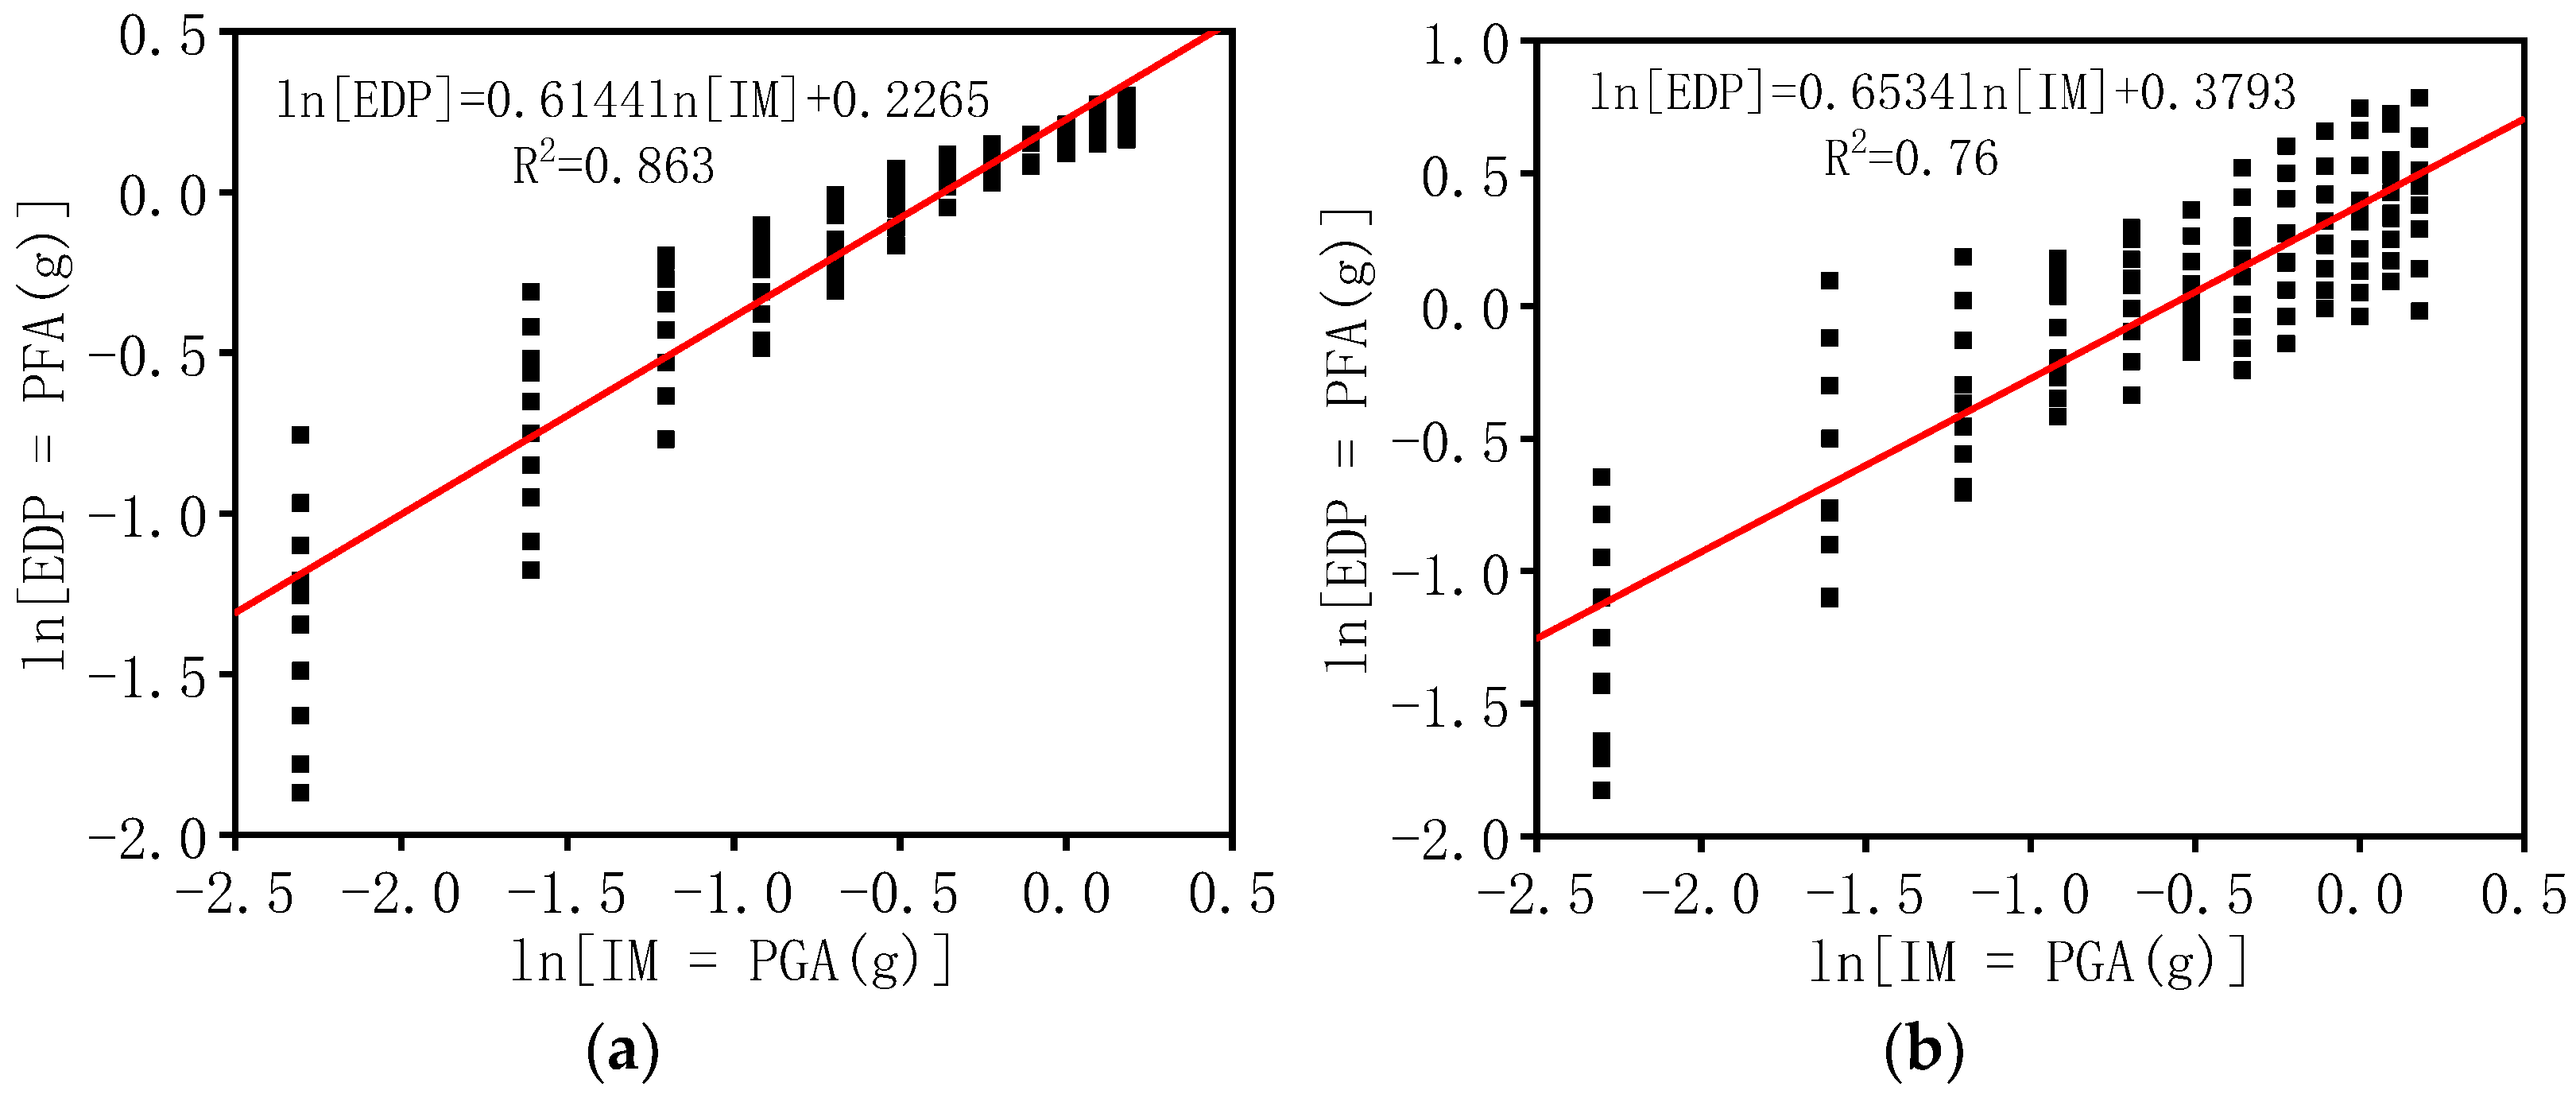
| Model | Selected | Regression Coefficients | ζEDP|IM | Function | ||
|---|---|---|---|---|---|---|
| EDP | IM | a | b | |||
| CoSPSW | Drift | PGA | 0.0244 | 0.7633 | 0.2792 | Drift = 0.0244(PGA)0.7633 |
| PFA | PGA | 1.3054 | 0.6144 | 0.1882 | PFA = 1.3054(PGA)0.6144 | |
| SPSW | Drift | PGA | 0.0421 | 1.1021 | 0.2919 | Drift = 0.0421(PGA)1.1021 |
| PFA | PGA | 1.4613 | 0.6534 | 0.2810 | PFA = 1.4613(PGA)0.6534 | |
Publisher’s Note: MDPI stays neutral with regard to jurisdictional claims in published maps and institutional affiliations. |
© 2022 by the authors. Licensee MDPI, Basel, Switzerland. This article is an open access article distributed under the terms and conditions of the Creative Commons Attribution (CC BY) license (https://creativecommons.org/licenses/by/4.0/).
Share and Cite
Tan, Z.; Zhao, Q.; Zhao, Y.; Yu, C. Probabilistic Seismic Assessment of CoSPSW Structures Using Fragility Functions. Metals 2022, 12, 1045. https://doi.org/10.3390/met12061045
Tan Z, Zhao Q, Zhao Y, Yu C. Probabilistic Seismic Assessment of CoSPSW Structures Using Fragility Functions. Metals. 2022; 12(6):1045. https://doi.org/10.3390/met12061045
Chicago/Turabian StyleTan, Zhilun, Qiuhong Zhao, Yu Zhao, and Cheng Yu. 2022. "Probabilistic Seismic Assessment of CoSPSW Structures Using Fragility Functions" Metals 12, no. 6: 1045. https://doi.org/10.3390/met12061045