Article

Effect of Heat Treatment Prior to Direct Hot-Extrusion Processing of Al–Cu–Li Alloy

by
Paula Rodríguez-González
*,
Elisa María Ruiz-Navas
and
Elena Gordo
Departamento de Ciencia e Ingeniería de Materiales e Ingeniería Química, IAAB, Universidad Carlos lll de Madrid, Avda. De la Universidad 30, 38911 Leganés, Spain
*
Author to whom correspondence should be addressed.
Metals 2022, 12(6), 1046; https://doi.org/10.3390/met12061046
Submission received: 26 May 2022 / Revised: 10 June 2022 / Accepted: 14 June 2022 / Published: 19 June 2022
(This article belongs to the Special Issue Advances in Powder Metallurgy II)

Abstract

:
This study presents and explains the results of the first steps in developing high strength aluminium alloy (Al–Cu–Li) wires for the ultimate purpose of using them as feedstock for DED (directed energy deposition) techniques, such as wire arc additive manufacturing (WAAM). Powder metallurgy (PM) is proposed as the method to produce the wires due to the high flexibility to adapt the composition and the lower temperatures used with respect to casting. Two PM routes are proposed. The first route comprises blending of the powders, uniaxial pressing, and hot extrusion of the green compact to obtain a bar; the second route includes a heat treatment of the green compact, to promote the diffusion of the alloying elements before hot extrusion. Further steps, such as rolling or drawing, are necessary to obtain the wire from the bar. This work studies the effects of the processing parameters on the properties of extruded bars and compares the results of the two routes employed, with special attention paid to the effects of heat treatment. The study confirms that heat treatment homogenises the microstructure and requires higher applied extrusion force and time. The results from characterisation show the presence of Al–Cu and Al–Cu–Li phases in the microstructure.

1. Introduction

Powder metallurgy (PM)-based extrusion technique is an industrial forming process to produce fully dense or porous metallic alloys and ceramic materials with improved performance [1,2].
Compared with other processes, the shear stresses involved in powder extrusion make it an ideal process to produce bulk Al alloys and composites, due to the rupture of the nanometric oxide layer covering the powder particles, activating densification mechanisms, and interparticle welding [3]. Some extrusion processes do not need powder compaction to obtain the extruded product, such as the ConformTM method, used since the 1970s for copper and aluminium rod feedstocks [4]. Using this technique, it is possible to obtain cold drawn wire <5 mm diameter, using 100% of the loose starting powders. Recent studies have shown that it is possible to obtain a fully consolidated product of aluminium alloys with a uniform and refined grain structure that could exhibit good superplastic properties [5,6]. Jabbari, M.A. et al. [3] demonstrated that it is necessary to start from a suitable premix of powders and to design an appropriate processing route based on the thermal, microstructural and mechanical characterization of the alloys under study at different stages of the consolidation process, to avoid non-homogeneous microstructures obtained through the extrusion process. Accordingly, the main advantage of PM routes is that as they start from powders as feedstock. The chemical composition can be tailored by a simple change in the percentages added to the mixture, resulting in a wide range of chemical composition possibilities.
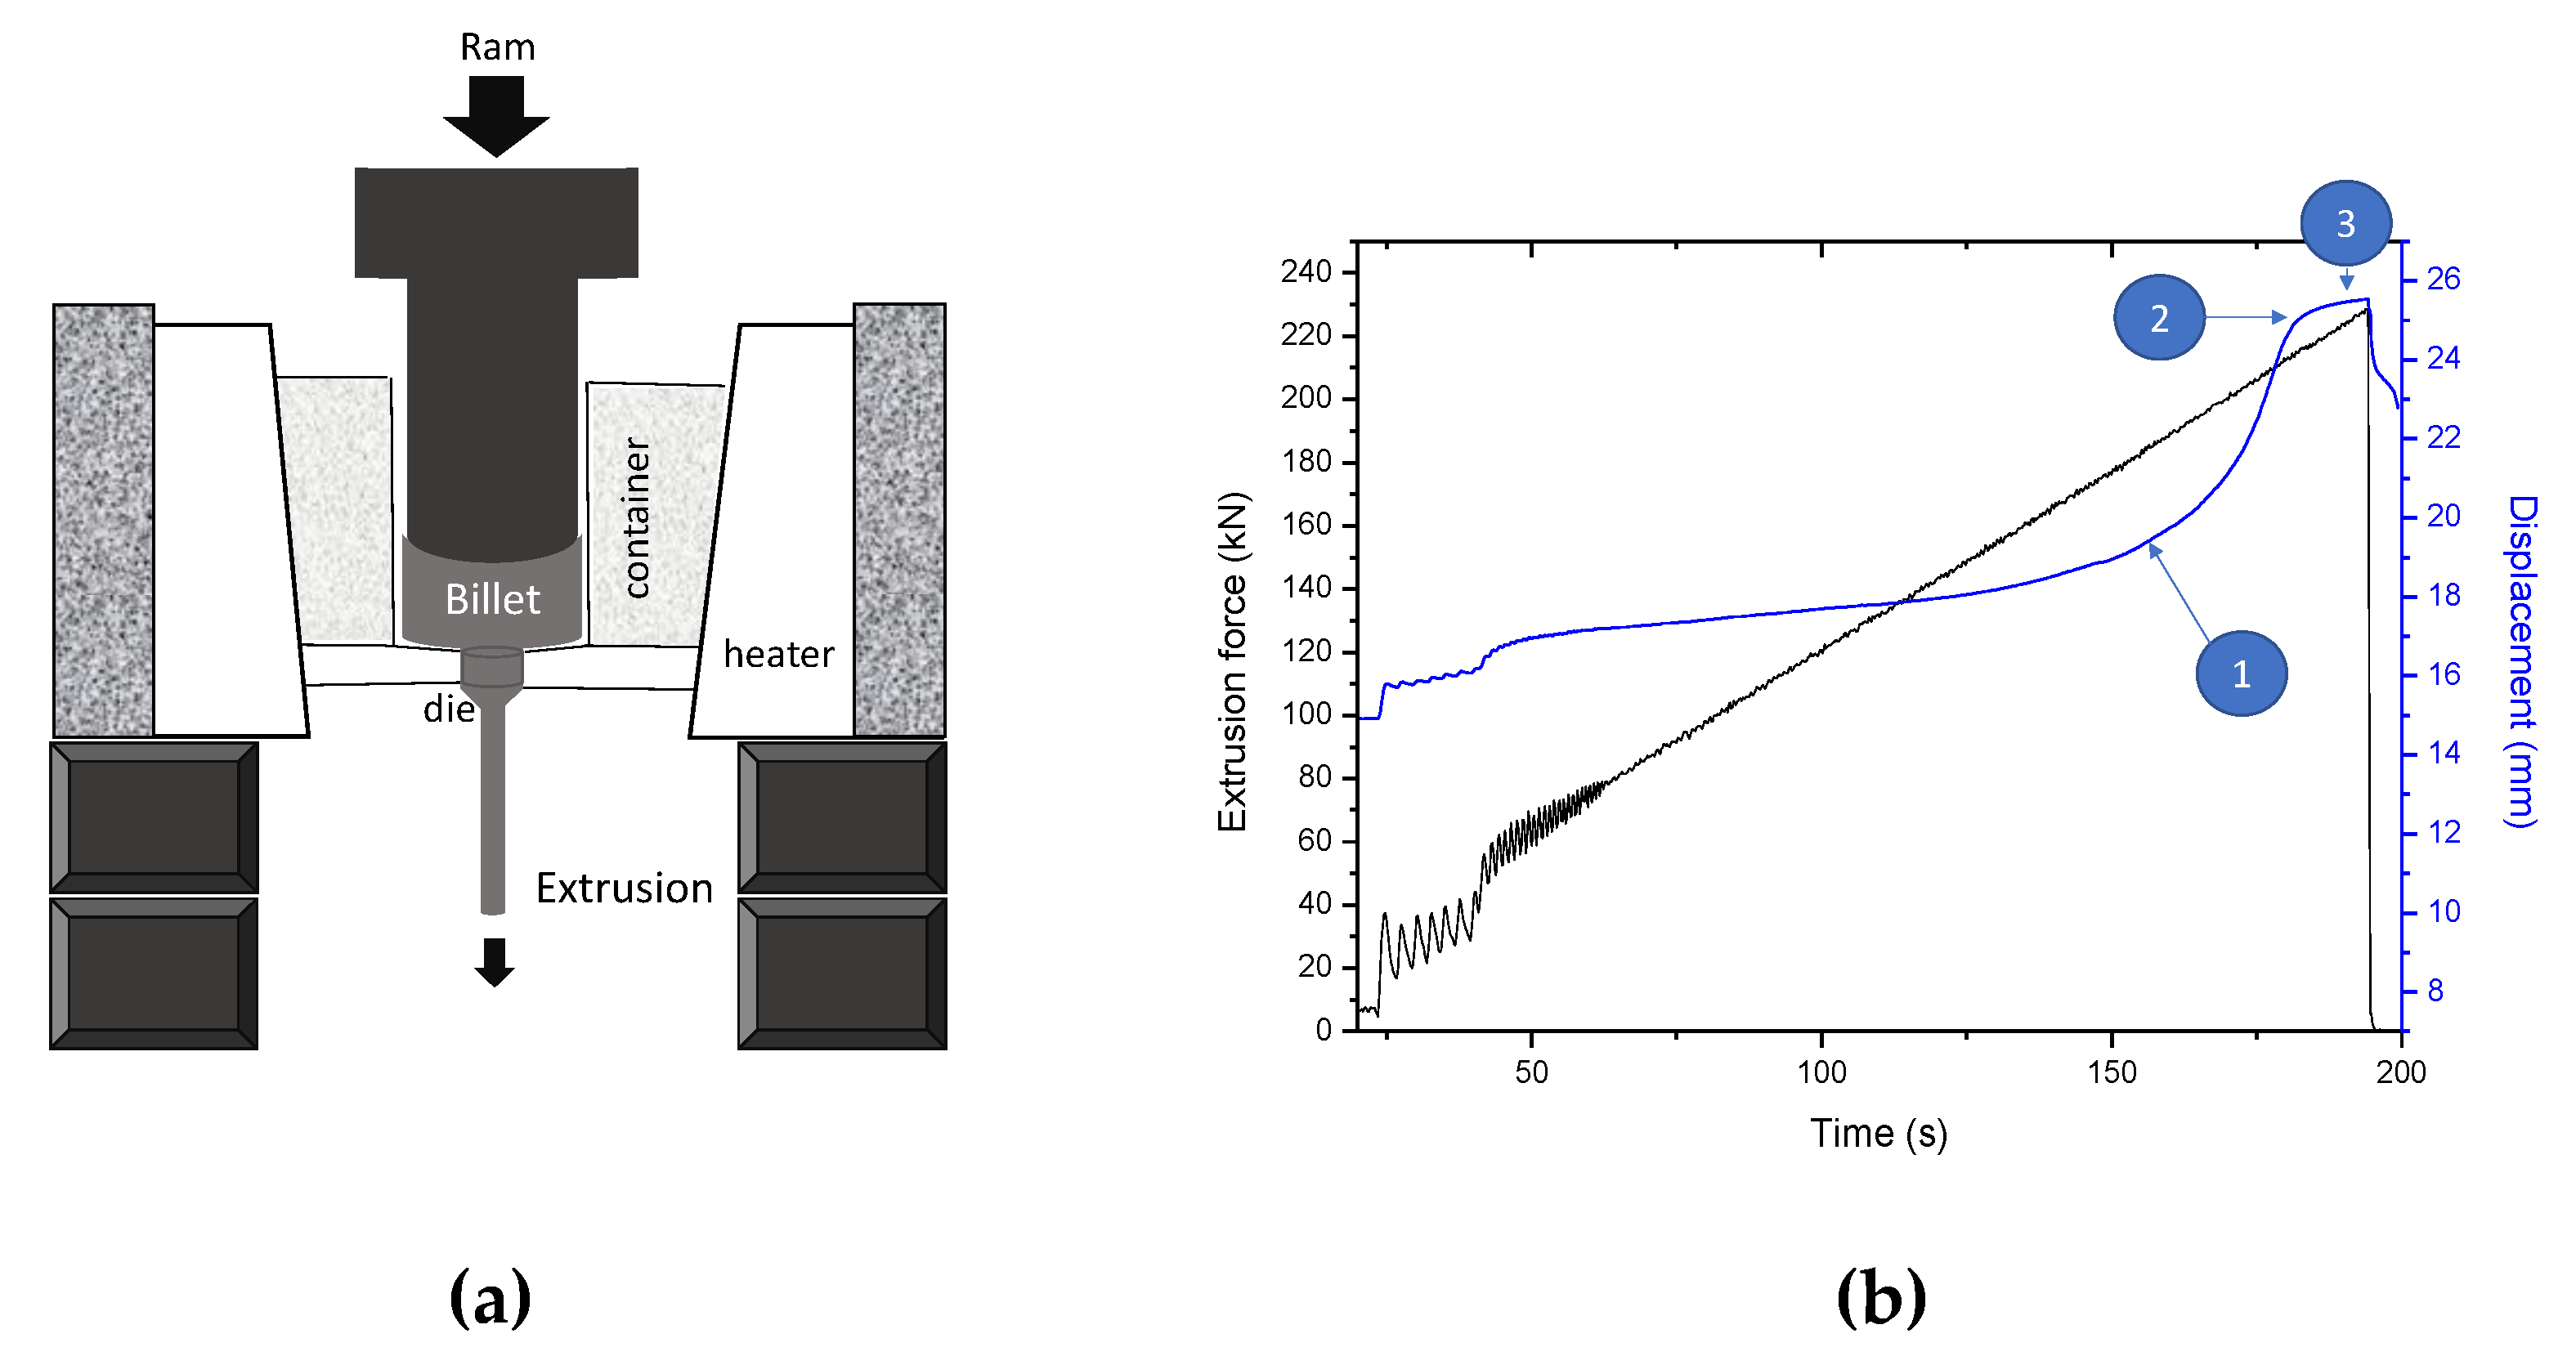
In hot extrusion, the billet is preheated below the melting point to facilitate plastic deformation. For aluminium, hot extrusion temperature is usually between 400 and 500 °C [7,8]. The extrusion pressure is a function of the temperature, deformation and material flow stress, friction, and extrusion ratio. The process parameters greatly influence the quality of the extruded product. The extrusion curve most commonly obtained presents the shape shown in Figure 1b.
The black line represents the extrusion force versus time. The initial oscillations indicate the friction forces inside the equipment as the material is expelled. The extrusion force increases with time until the end of the test. For typical curves of direct extrusion, the evolution of the displacement with time (Figure 1b Blue line) presents different stages: (1) the force increases in a non-linear way, (2) full densification is achieved, and (3) the force reaches a stationary value or decreases slightly [9]. From these curves, two important parameters of the extrusion process are obtained: (1) the time from the beginning of the applied force to the final extrusion process, and (2) the maximum applied force needed when the displacement reaches a stationary value. Other information, such as friction force, can be obtained from these curves, in case sticking occurs at the container wall. The extrusion ratio (R) is a fixed parameter of the extrusion process. It can be defined as R = A0/Af, where Ao is the cross-sectional area of the initial billet, and Af is the cross-sectional area of the final product.
Conversely, A. S. Chahare and K. H. Inamdar [10], using the Taguchi Method in ANOVA analysis, studied the weight of different process parameters (billet pre-heating temperature, container temperature and ram speed) for a 6063 aluminium alloy. They observed that ram speed has the maximum contribution with 59.83%, followed by the container temperature and billet pre-heating temperature, which have the least impact with a contribution of 7.75%. Therefore, pre-heating is less influential than ram speed in comparison.
Thus, homogenisation of the alloying elements is necessary for the proper design of the alloy. Furthermore, the phase diagram in the sintering process should be consulted, since it takes into account the solubility of the alloying elements, melting points, eutectics, and nature of the liquid phase in the sintering process. The aim of this study is to consider the feasibility of applying a heat treatment before extrusion in the processing of an Al–Cu–Li alloy for the final wire in additive manufacturing. For this purpose, the green compacts were heat treated in different conditions before extrusion, and the results were assessed by evaluating not only the properties obtained in the extruded bars but the influence on extrusion parameters as well. A preliminary study was made to optimise the extrusion conditions.

2. Materials and Methods

A 2xxx series alloy (AA2060) with chemical composition Al–4Cu–0.85Mg–0.3Mn-0.4Zn-0.75Li (wt.%) was produced using the blending of elemental powders and master alloys (Table 1). The main component is an elemental powder (Al), whereas Mg and Li were added as master alloys with compositions Al92.1/Mg7.9 and Al80/Li20, respectively (wt.%). The rest of the alloying elements were introduced as elemental powders. The main characteristics of the powders used are summarised in Table 1.
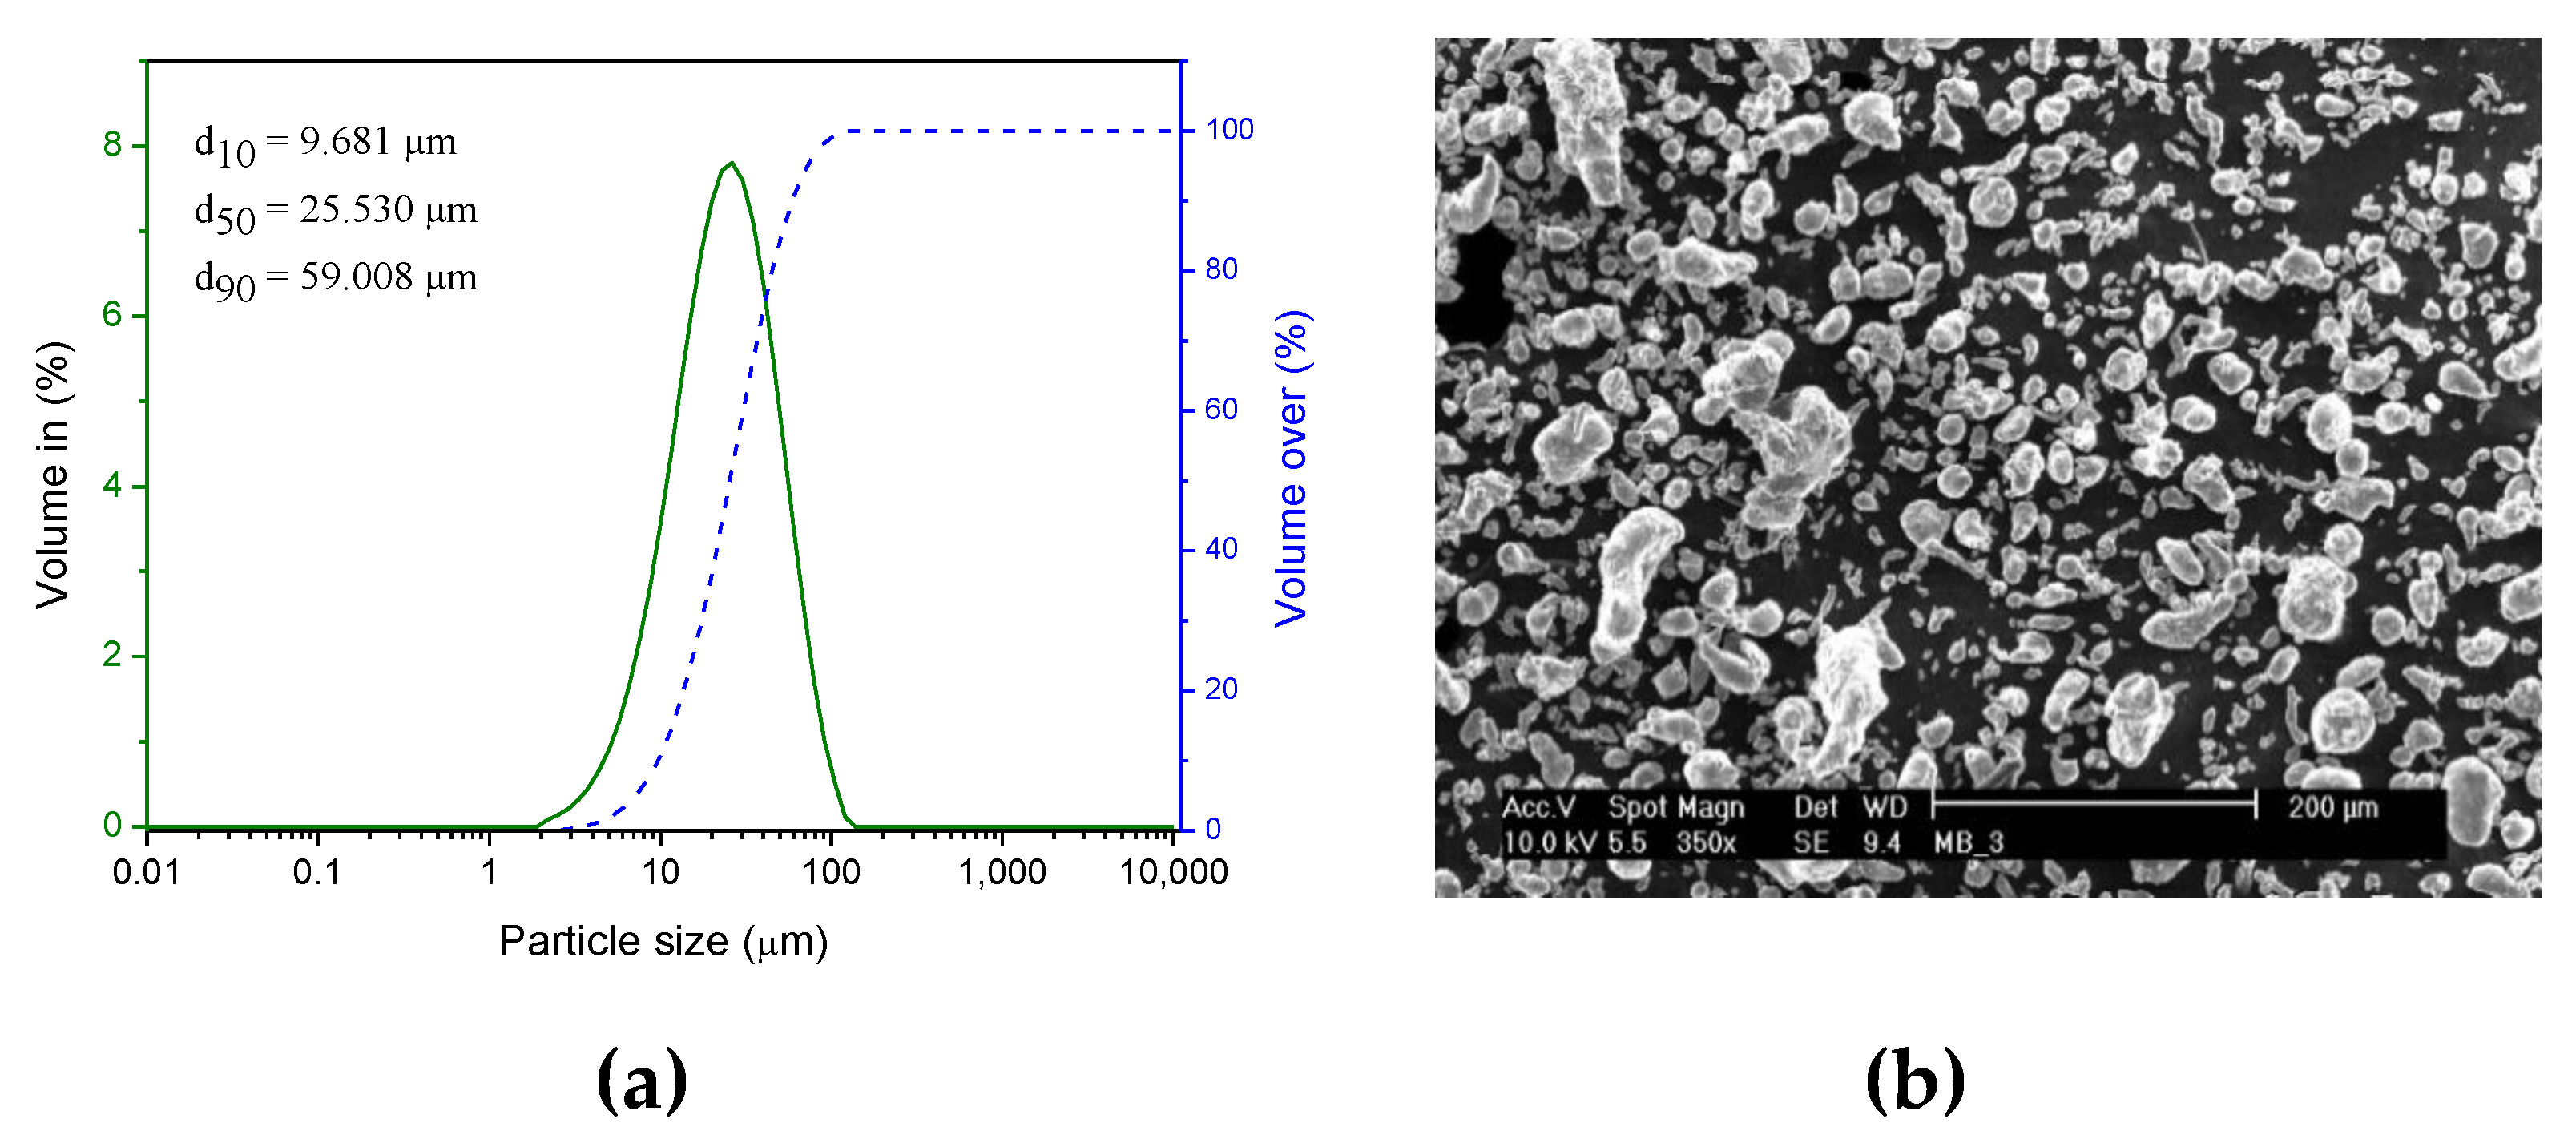
The pure aluminium powder used for the preliminary study was characterised in particle size and morphology, with the results shown in Figure 2. The particle size was measured by the laser diffraction technique with a Master Sizer 2000, Malvern Instruments, Malvern, UK using distilled water as a dispersant. In addition, a microstructure and morphology analysis of the powder was carried out using a Scanning Electron Microscope (SEM, Philips XL-30, USA).
Powders were blended in a Tubula Mixer (Turbula®, WAB, CH) for 60 min. Powder blends were submitted to differential scanning calorimetry (DSC) and thermal gravimetric analysis (TGA): tests of both techniques were carried out at the same time using a Simultaneous Thermal Analyser (STA) 6000 from PerkinElmer. STA analysis was performed under a high-purity nitrogen atmosphere (flow rate 20 mL/min) with temperatures ranging from 100 to 800 °C and 5 °C/min of heating rate.
To study the compressibility of the alloy, blended powders were uniaxially cold-pressed into cylindrical billets with diameters of 16 mm using compaction pressures ranging from 100 to 700 MPa. The green density was calculated by measuring the dimensions and mass of pressed samples using a precision electronic balance (±0.0001 g) and micrometre (±0.01 mm). Optimum compaction pressure was determined at 600 MPa, selecting this value for the following steps.
Cylinders of 25 mm diameter and 15 mm height, with the proper composition and 99% theoretical density, were produced for the extrusion process. Before heating to the extrusion temperature, the green compacts were coated with a suspension of graphite and oil to prevent oxidation and to provide lubrication during the extrusion process [3,11,12].
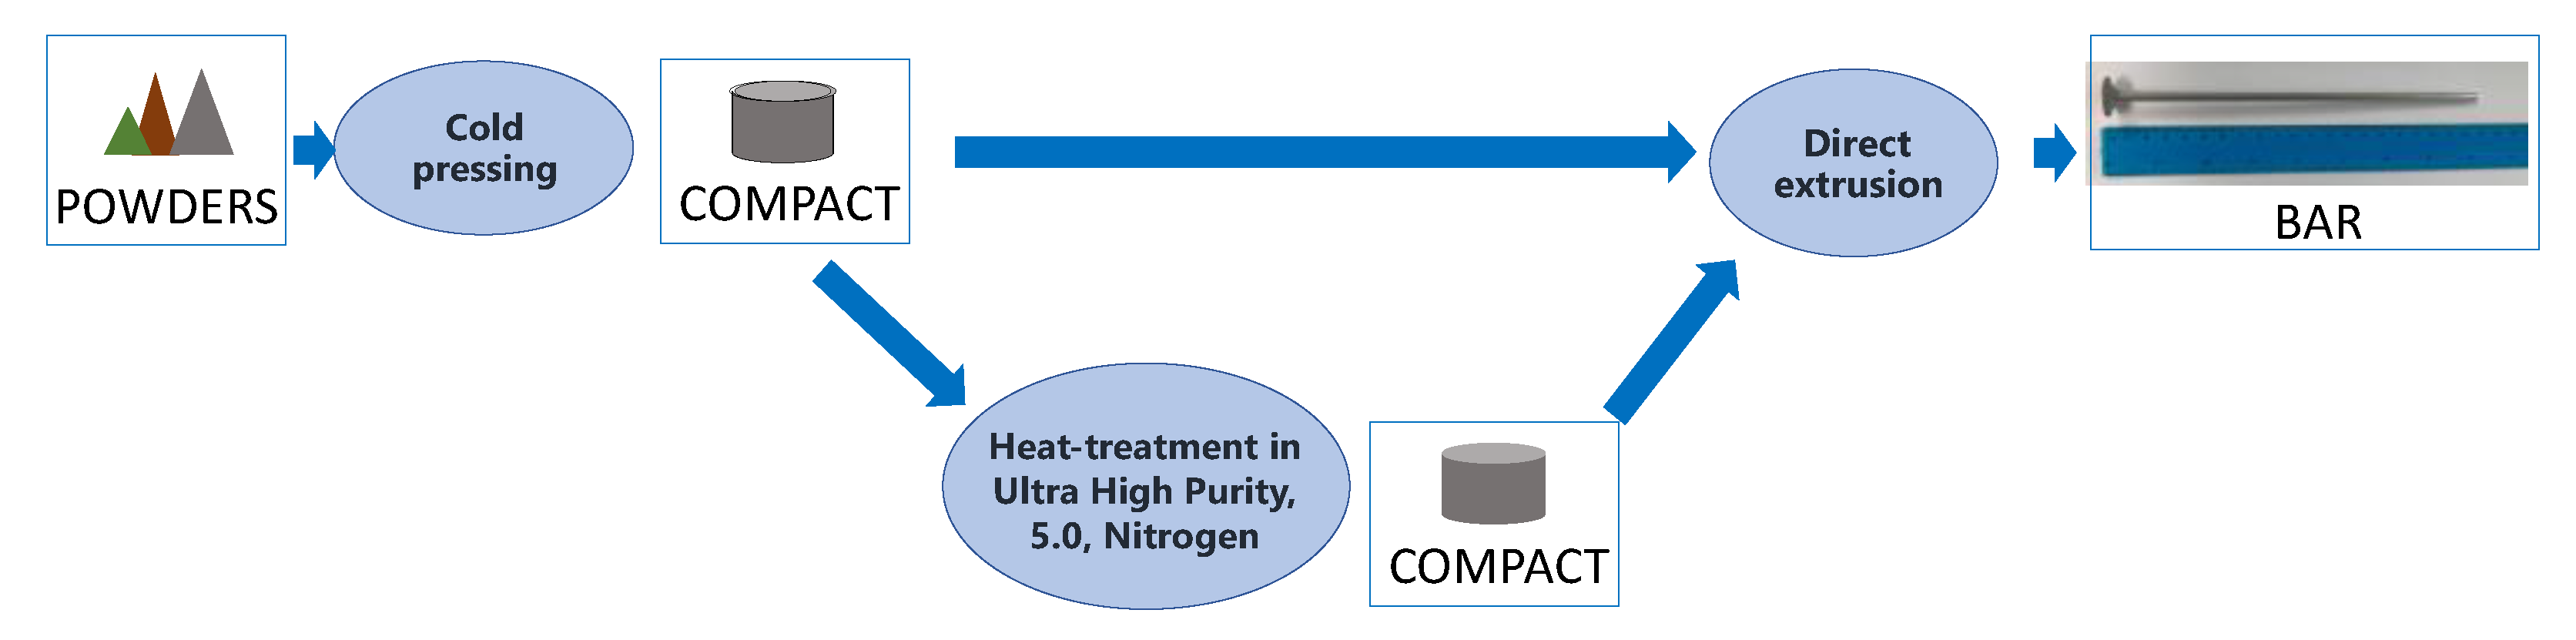
Some of the green compacts were directly extruded (from now on, DE materials). Others were submitted to a heat treatment (HT) under ultra-high purity nitrogen (>99.999%) atmosphere in a tubular furnace (STF-15/757450, Carbolite, UK),) (
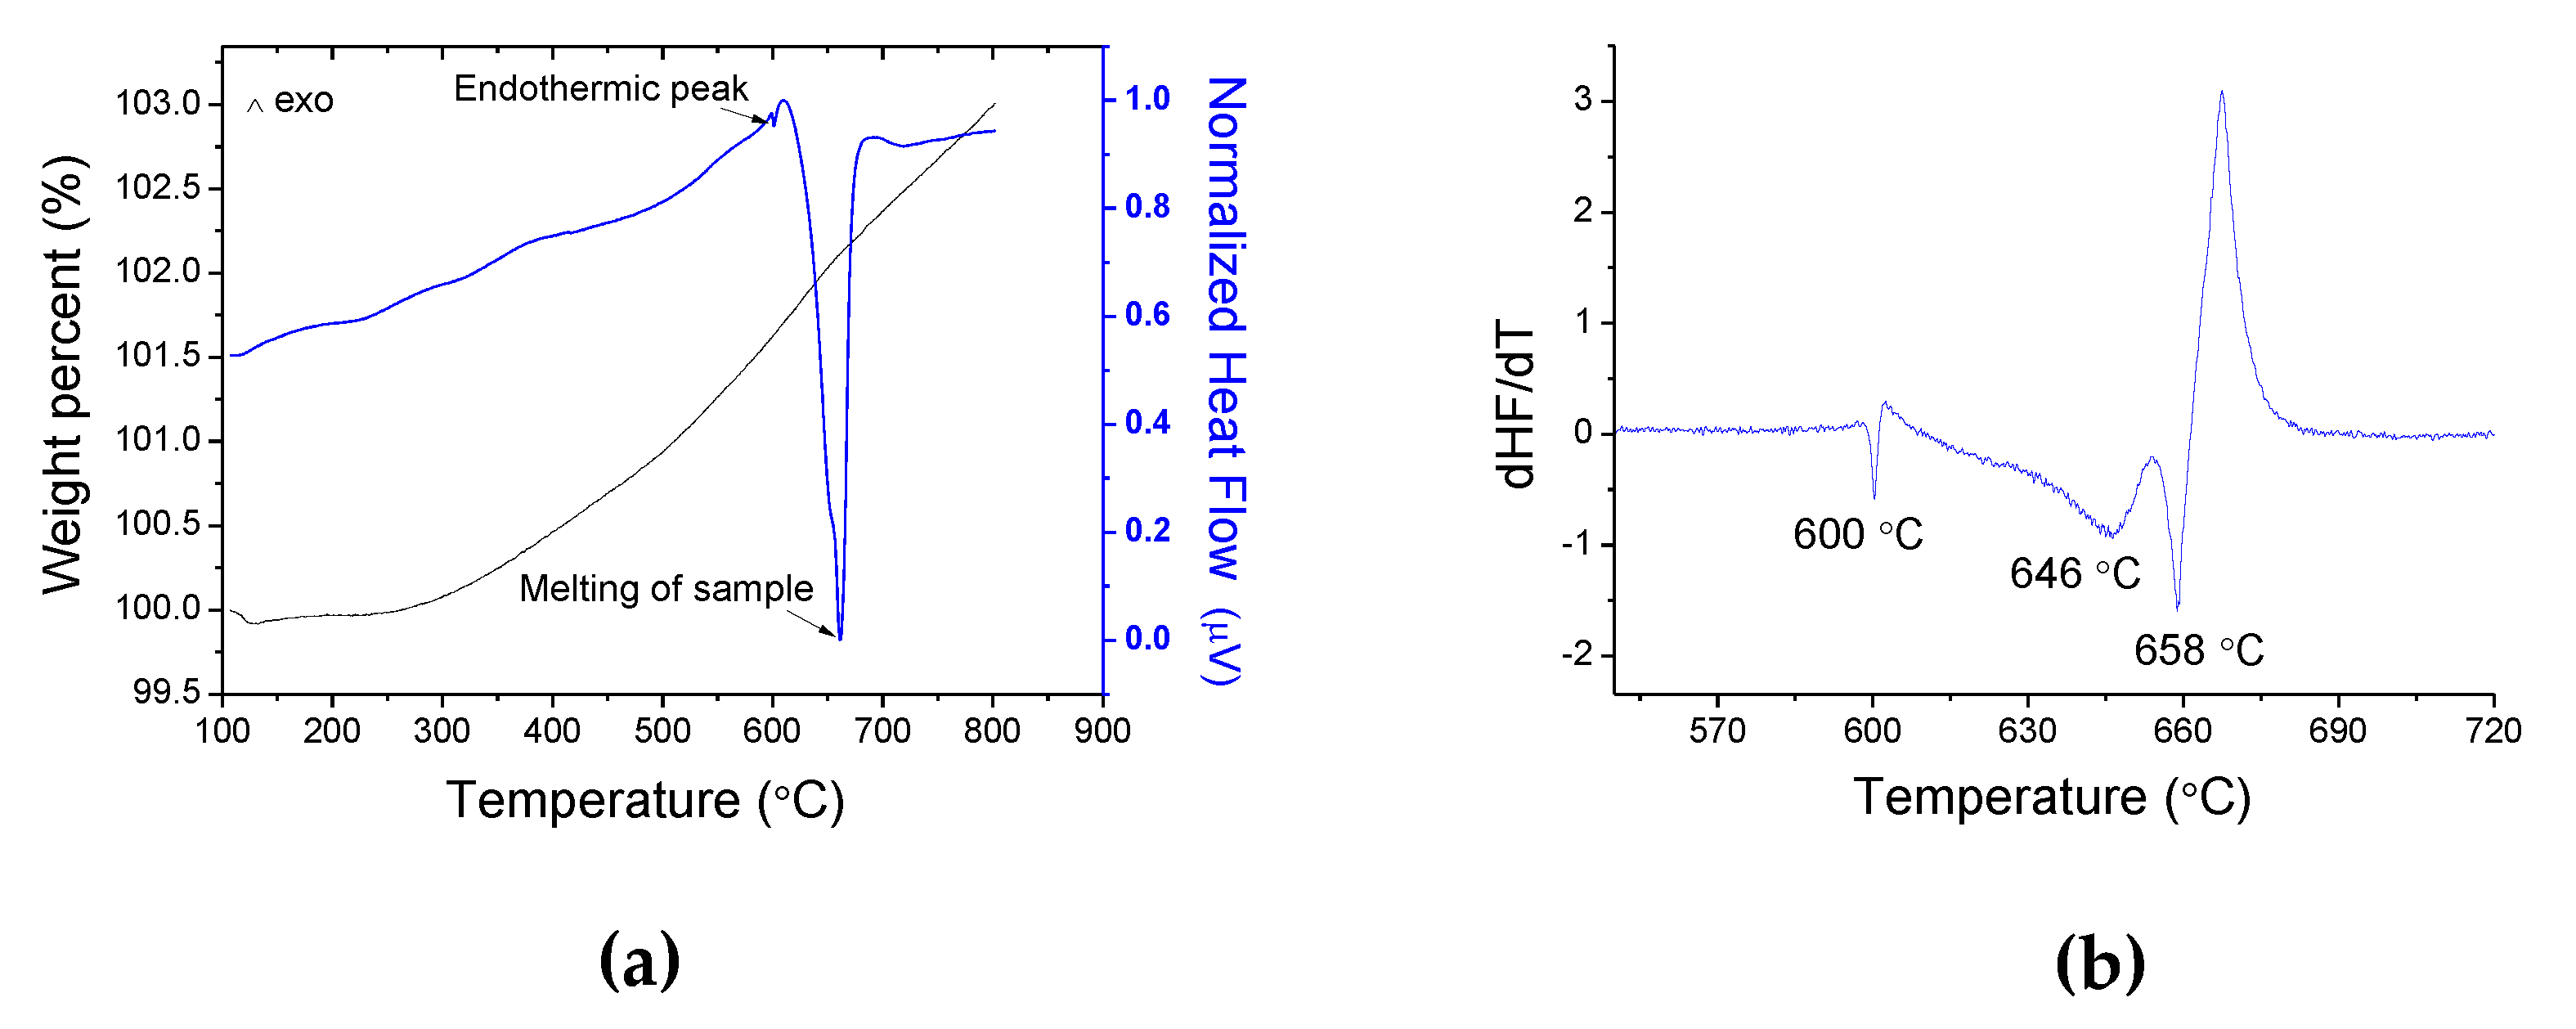
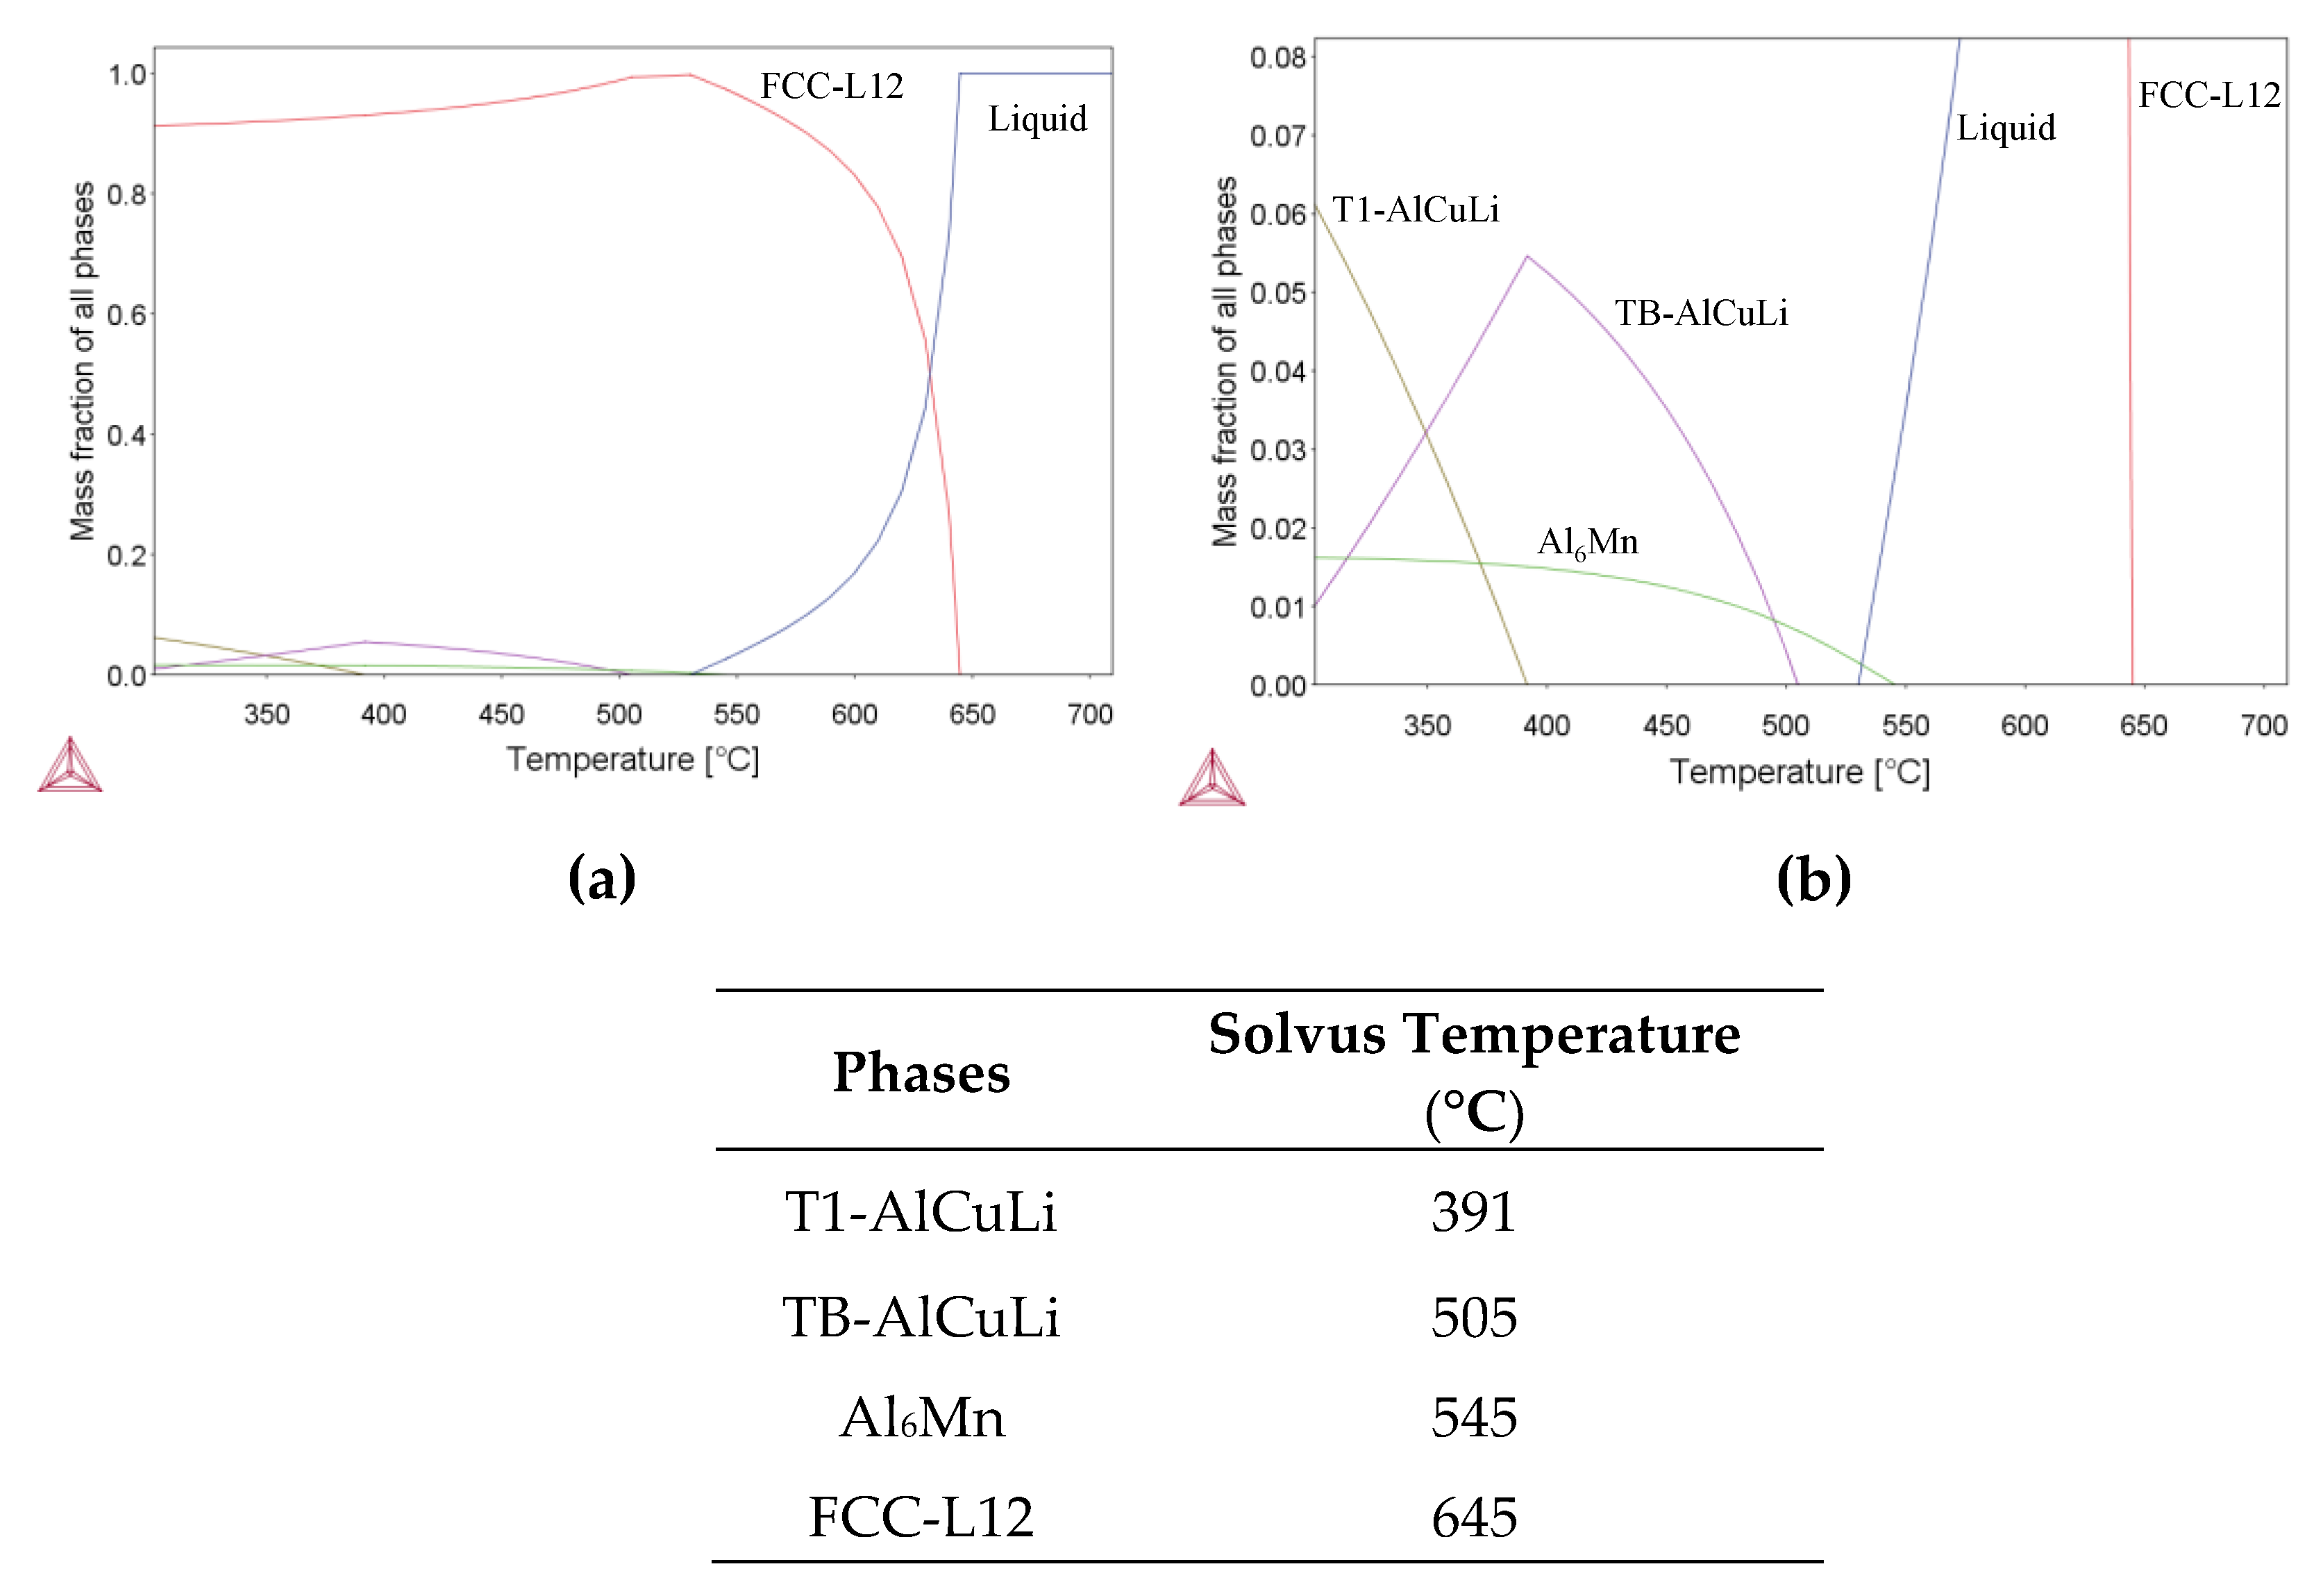
Figure 3). LECO analysis was used to determine oxygen content during the processing to ensure non-oxidation of the sample. The heat treatment conditions were heating at 5 °C/min up to 450, 500 and 525 °C for 1 h, and temperatures of 500 and 525 °C for 2 h. The temperatures were selected below the melting point, which was determined by differential thermal analysis (DTA), and the results obtained by Thermo-Calc.
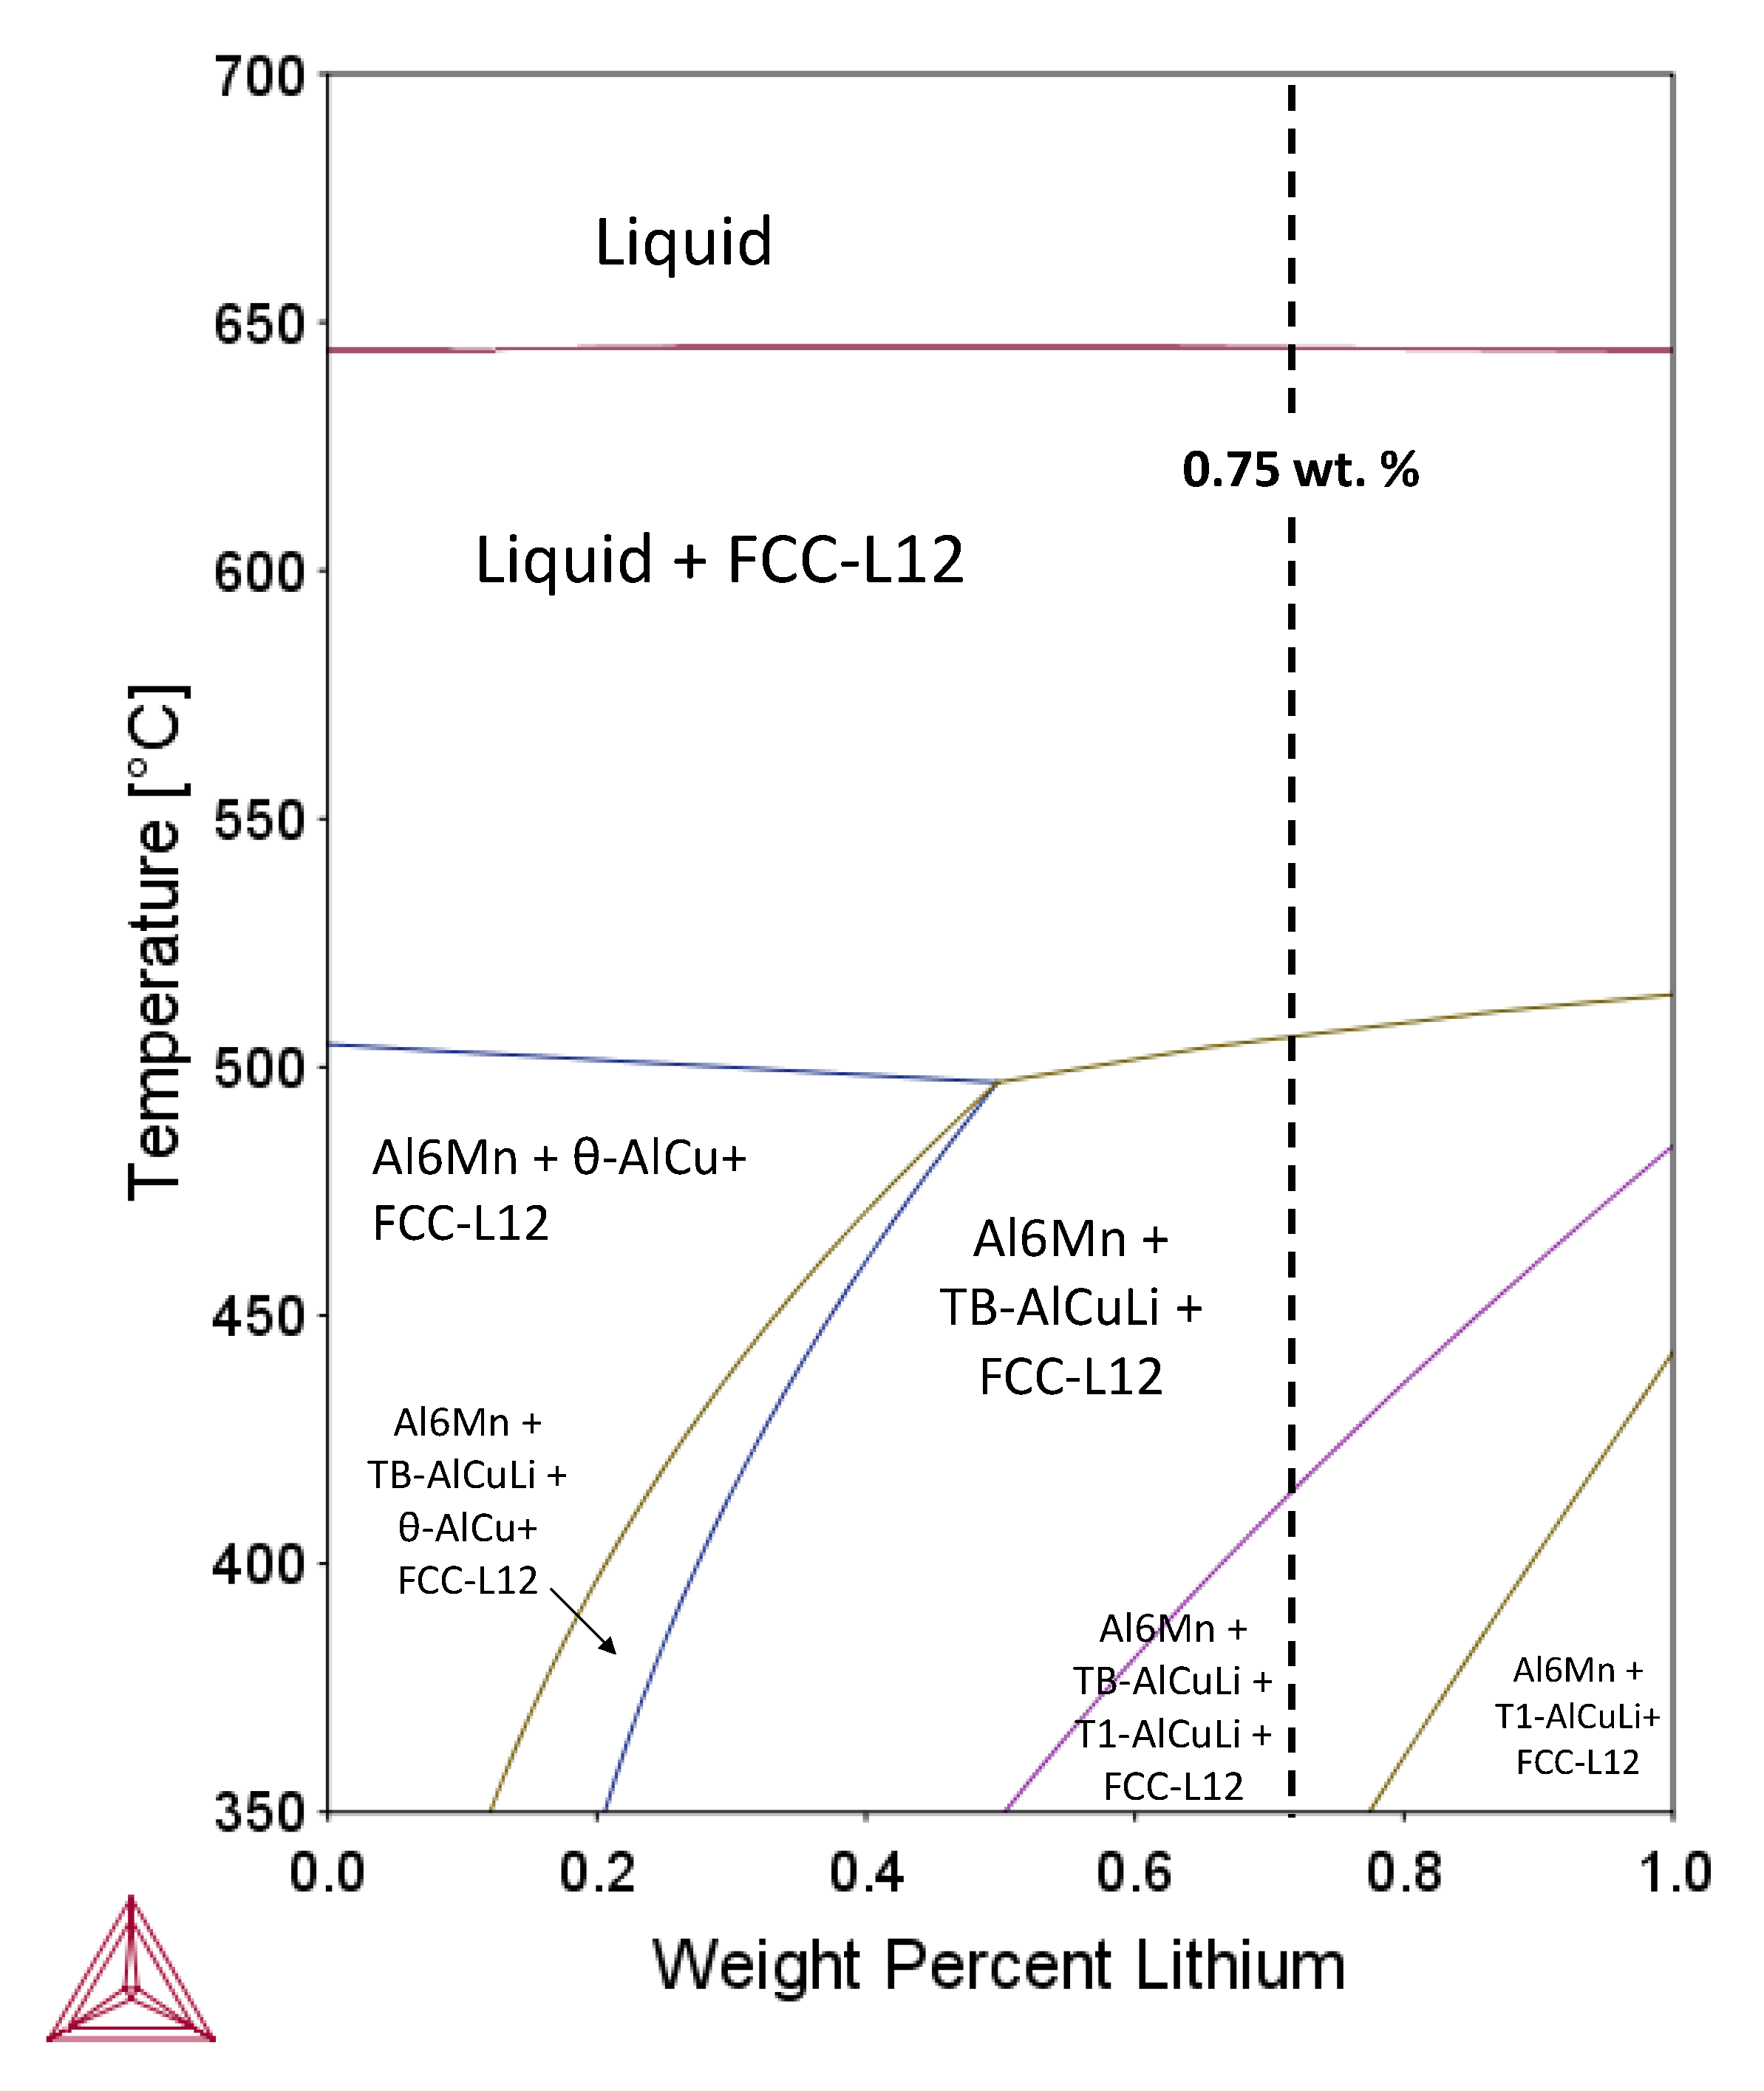
Thermo-Calc 2017a Software has been used to calculate the phase diagram of the alloy under study. The program allows the phase diagram to be obtained according to the composition of alloying elements, and it predicts phase formation at different extrusion temperatures. The database used was SSOL5: SGTE, General Alloy Solutions Database, version 5.0. The satisfactory results obtained as a reference for the systems Al–Cu, Al–Mn and Al–Li validate the implementation of the approach for this work [13,14].
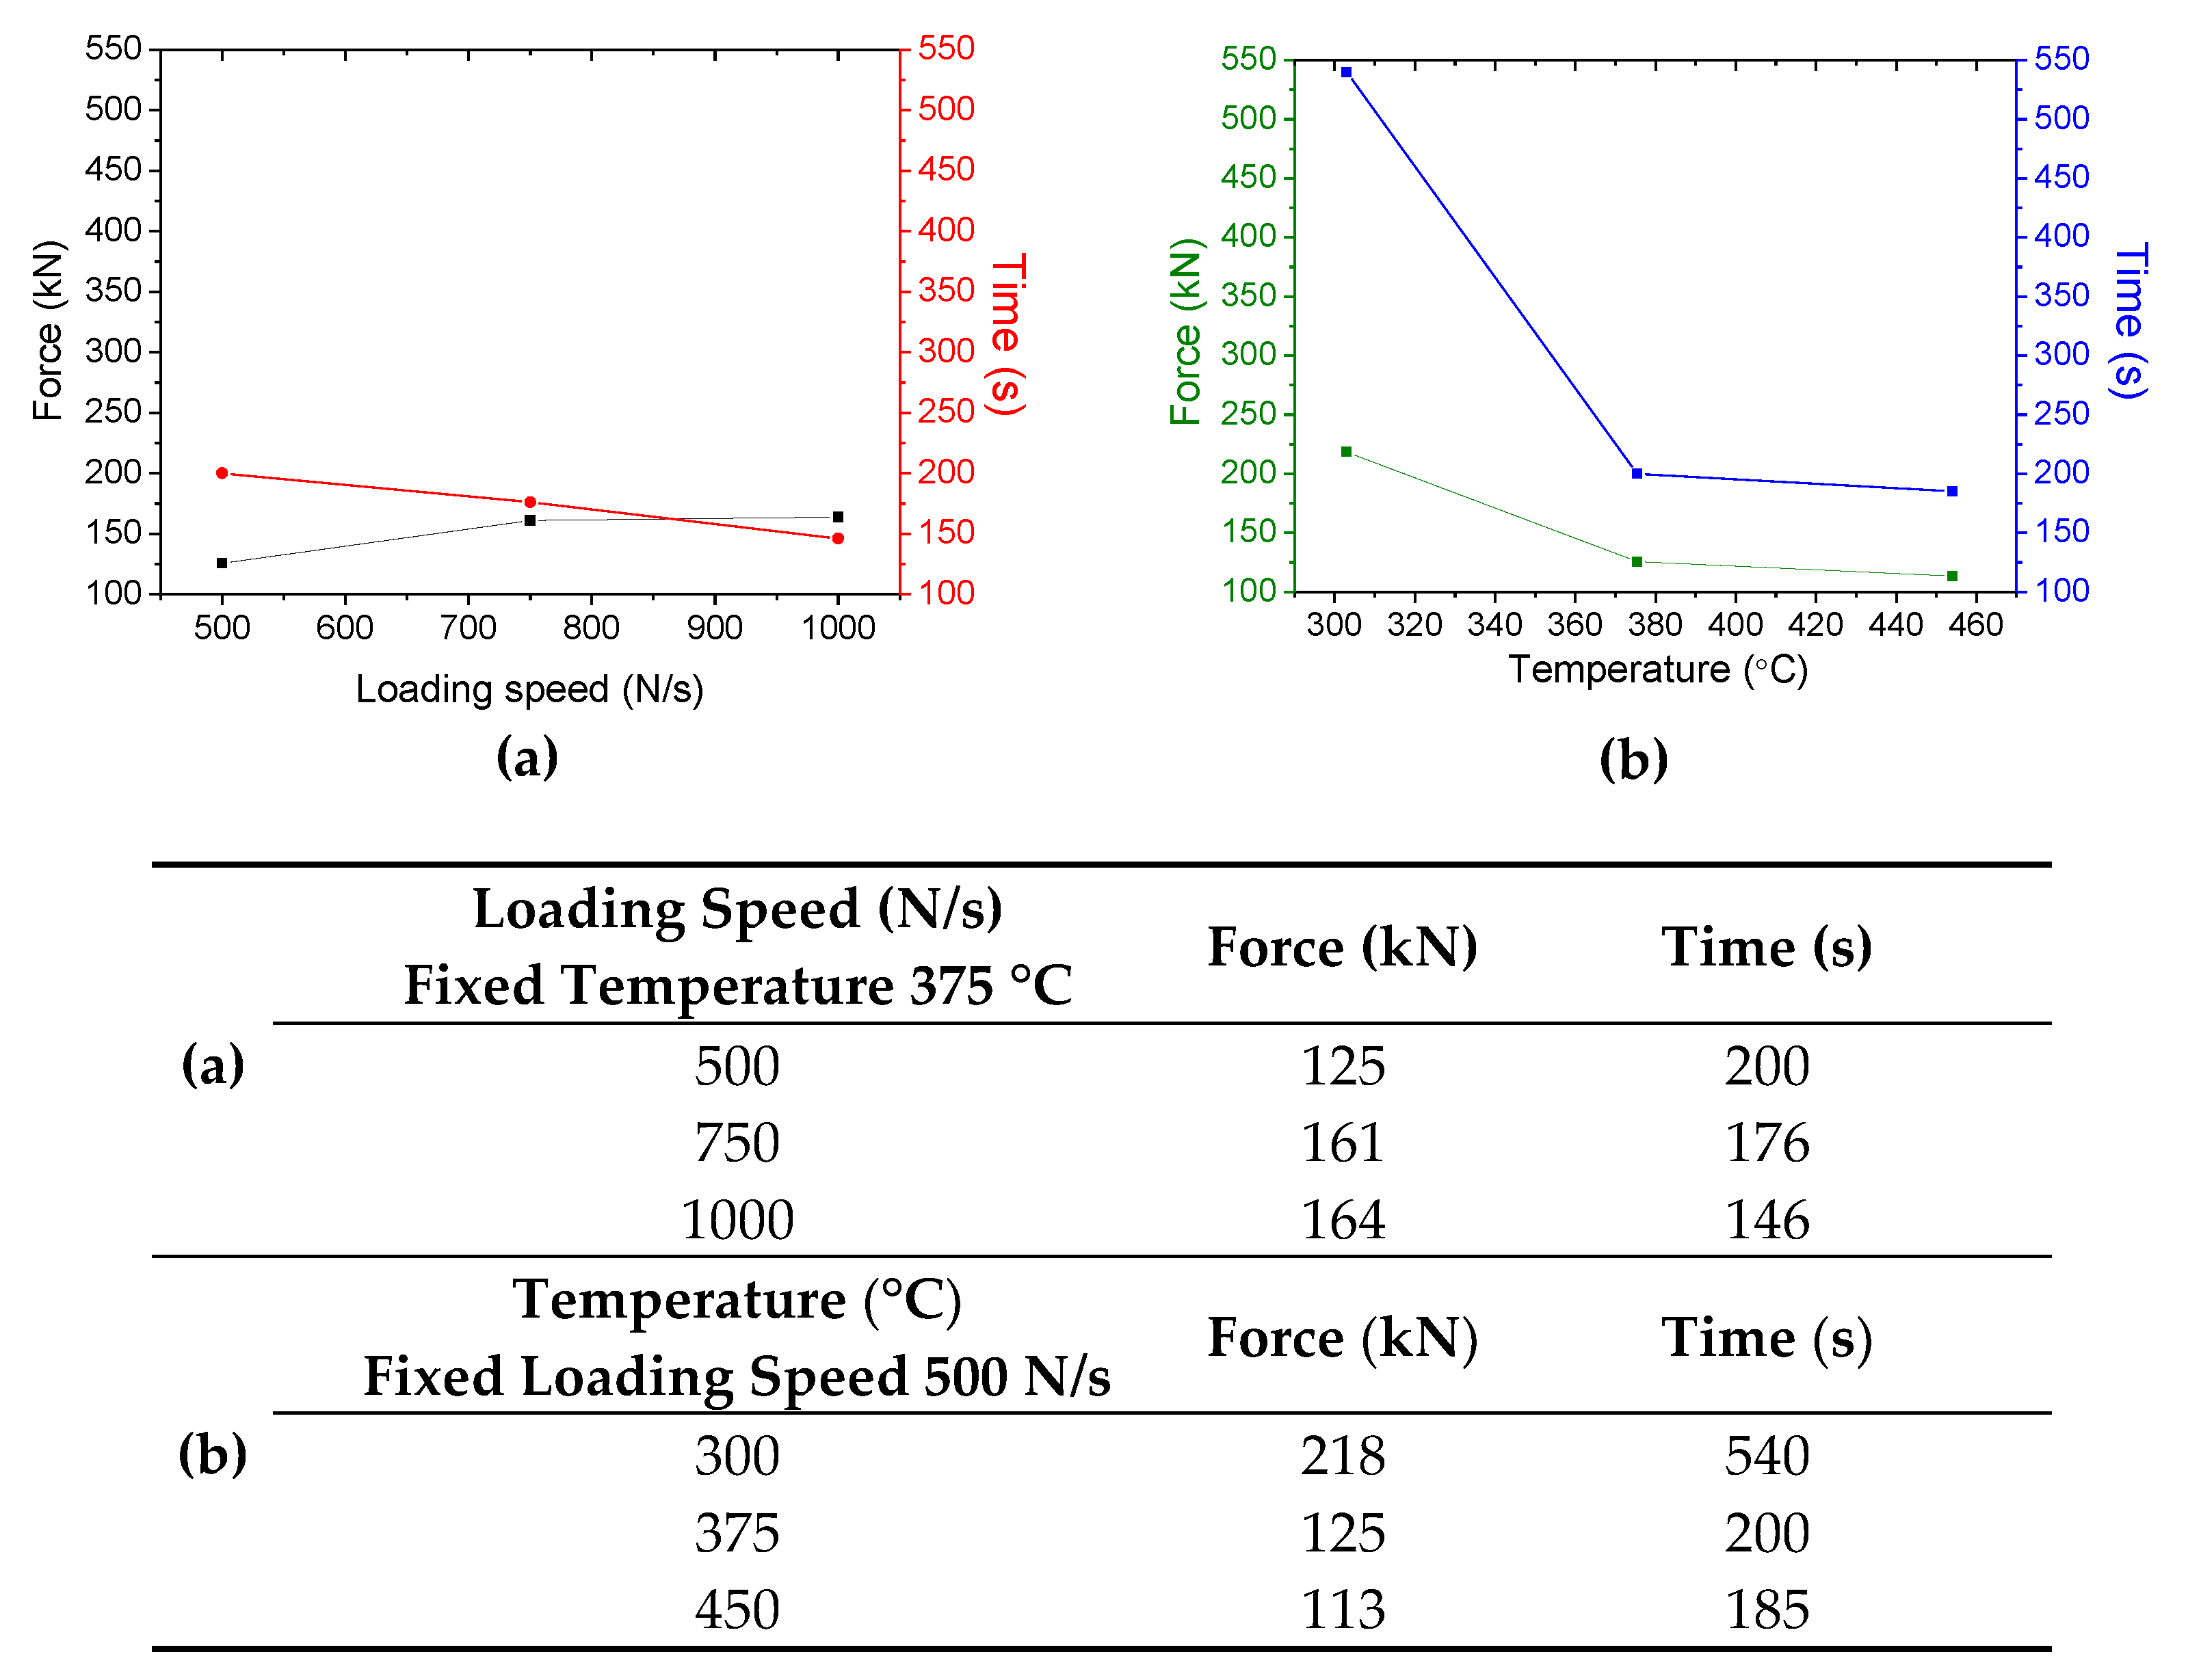
Moreover, to determine the optimum parameters for the extrusion process, aluminium green compacts were prepared. Extrusion was performed at different temperatures at 300, 375, and 450 °C and different loading speeds (500, 750, and 1000 N/s), using an extrusion ratio of 25:1 and a conical die with an angle of 45°, selected to ensure full densification of the material.
In general, there are several types of parameters in the powder extrusion process. In this study, loading speed and temperature can be set in the equipment independently of the material. In addition, required force and time are a response of the process and vary depending on the material and tools used. The extruded bars were 5 mm in diameter according to the extrusion ratio and 200 mm in length. The samples were air-cooled after extrusion. After the preliminary study, the optimum parameters of temperature and loading speed were selected and subsequently applied to obtain the alloy bars.
Microstructural characterisation of the heat treatment samples and extruded bars was performed by scanning electron microscopy (SEM) in a Philips XL-30 microscope with a filament of thermionic emission of tungsten using an acceleration power of 15 KV. The instrument is equipped with Energy-Dispersive X-ray Spectroscopy (EDS, EDAX, USA) that allows for semi-quantitative analysis of the chemical composition. X-Ray diffraction (XRD, Philips X’pert, Netherlands) was carried out with a Philips X’Pert diffractometer using monochromatic Cu Kα radiation (λ = 1.5405 Å) generated at 40 kV and 40 mA. The data were acquired and processed through the software HighScore.
Vickers micro-hardness tests were also performed at different steps of the processing by means of a micro-hardness instrument (Zwick Roell, Germany) using 500 gf load and a dwell time of 10 s for each point, and the data of ten points per sample were analysed by the hardness testing software ZHµHD. Measurements were carried out on the cross-section of the bars.

3. Results and Discussion

3.1. Optimisation of Extrusion Parameters

In this preliminary study, temperatures of 375, 450 and 525 °C and loading speeds of 500, 750 and 1000 N/s were employed. In Figure 4, the applied force and time test are represented versus loading speed and temperature. When the temperature is constant, and the loading speed is modified (Figure 4a), the differences observed in time and force are less significant than when the loading speed is constant and the temperature is modified (Figure 4b), showing the clear importance of temperature beyond loading speed in the extrusion process. This conclusion, obtained from the preliminary test for pure aluminium, demonstrates that temperature is the critical extrusion parameter in this process.
Examining the results above from tests carried out at 500, 750 and 1000 N/s, and considering the resulting low influence of the loading speed on the temperature, a loading speed of 500 N/s was selected according to the lowest force required to achieve the extrusion product.
Considering that the temperature is the parameter that determines the applied force and time in the extrusion process, STA and Thermo-Calc tests were carried out to find the temperature interval for the Al–Cu–Li alloy.
Despite the low influence of billet pre-heating and container temperature, as noted in the introduction, both tools and billet were progressively heated to ensure extrusion at the selected temperature.

3.2. Simultaneous Thermal Analysis (STA) of Al–Cu–Li Alloy and Phase Diagram by Thermo-Calc

Numerous research studies reveal that STA curves provide information about the sintering temperature, ranging between 0.6–0.9 of the melting point (Tm) [15]. The thermal behaviour of the alloys has been studied to help in setting the optimum extrusion temperatures.
Figure 5a displays the results of the Al–Cu–Li alloy powder studied by STA. The black line shows the mass change (wt.%) versus temperature from the thermal gravimetric analysis. It is observed that weight increases with temperature, due to the diffusion of N2 into the aluminium and the formation of nitrides [16]. LECO analysis in samples before and after the tests revealed that oxidation has not occurred with oxygen values under 0.2%. The blue line shows the heat flow (μV) versus temperature from the output signal of the DSC. Two endothermic peaks are observed by the first derivative of the differential scanning calorimetry graph (dDSC) (Figure 5b). The first, at 600 °C, could be related to low-temperature reactions among the alloying elements with a low melting point, such as Li, Mg and Zn with Al matrix, and the liquidus temperature due to the formation of liquid phases enriched in those elements. The second one, at 658 °C, corresponds to the melting point of the alloy. The onset value of the second peak is determined at 646 °C, which represents the temperature at which the material starts to melt.
The phase diagram of the alloy has been calculated and is shown in Figure 6 as a function of the Li content (0.75 wt.%) to understand the results obtained by STA. In addition, the diagram also provides information about the most favourable phases at different temperatures. The information is used to better understand the microstructure in the following tests.
The Thermo-Calc results show that the equilibrium phases in the Al–Li-Cu system are: θ-Al2Cu, δ-Al3Li, T1-Al2CuLi, T2-Al6CuLi3 and TB-Al7.5Cu4Li, which is the metastable phase, θ’, stabilized by the replacement of Al atoms with those of Li [17]. The hexagonal phase, T1-Al2CuLi, is the primary strengthening phase and the binary phases, such as δ’-Al3Li and θ’-Al2Cu, which contribute less to strengthening [18]. Focusing on the studied alloy, with 0.75 wt.% Li content (Figure 6), the equilibrium phases simulated by Thermo-Calc are Al6Mn, TB-AlCuLi, T1-AlCuLi and FCC-L12. During cooling in the solid state, the cubic TB and hexagonal T1 phases precipitate from the aluminium solid solution as a result of the decreasing solubility of Cu and Li in Al.
The temperatures at which the peaks appear in the STA are higher than those predicted by Thermo-Calc. These discrepancies could be due to the fact that the material is produced by blending elemental and master alloy powders, different from the theoretical composition assumed in the simulation.
Nevertheless, the temperature of the second peak in STA (658 °C) is close to the liquidus temperature predicted by Thermo-Calc (645 °C). In this way, the melting point is defined by both techniques.
To explain the low solvus temperature predicted by Thermo-Calc, and the possible formation of liquid phases, a study was carried out on the mass fractions of the phases present in the alloy as a function of temperature (Figure 7).
Equilibrium calculations enable the most stable phase for a given set of conditions to be identified. Observing Figure 7 in detail, the lines represent the solid solubility limit that changes as a function of temperature. In this study, all the phases reported in the literature appear in the simulation, and solvus temperatures of the different phases can be determined.
As for the previous results shown by both Thermo-Calc and STA, temperatures above 507 °C promote the formation of liquid phases, temperatures above 545 °C ensure dissolution of the more stable phases, and finally, rising temperature up to 645 °C lead to melting of the alloy.
In order to complete these studies aimed at defining the optimum extrusion temperature for the alloy under study, different extrusion temperatures were selected (375, 450, 500, 525, 550 and 575 °C). The temperature range was narrowed to between 500–575 °C due to the fact that these temperatures are close to the temperature of the liquid phase. The weight percent of the phases as a function of each temperature selected is plotted in Figure 8.
Figure 8 shows which phases are present and their evolution with the temperature. It also shows their percentage in weight, according to the solid solubility limit. According to the results, the most soluble phase is T1-AlCuLi, which is present at 350 °C but not at higher temperatures, as expected from the solvus temperature determined at 391 °C. The TB-AlCuLi phase appears in higher proportion at 350 °C and disappears at 525 °C, with its solvus temperature determined at 505 °C. Finally, the Al6Mn phase disappears at 550 °C, according to the solvus temperature determined at 545 °C.
Perhaps the most important phase to consider is the liquid phase. Liquid phases play an important role during the consolidation processes. Even more, it is of great interest in the extrusion process since it is considered a solid-state consolidation process, where the material is plastically deformed without melting.
The phase diagram predicts the formation of the liquid phase at 507 °C (Figure 6). Results in Figure 8 show a significant weight percentage of the liquid phase at 550 °C, 3.6 wt.% and reveal the complete dissolution of the rest of the phases that were present at lower temperatures. This percentage increases with the temperature until 8.8% at 575 °C. These results could explain those obtained in STA, where the first endothermic peak, at 600 °C, (Figure 5) could be associated with the formation of this liquid phase.
The formation of liquid phases during the extrusion process could cause irreversible damage to the extrusion product. Therefore, the temperature interval of 575–600 °C should be avoided for processing this alloy in solid state by means of hot extrusion, even though it is far below the melting point.

3.3. Extrusion from Green Compacts

Direct extrusions from green compacts (GC) were carried out at the selected temperatures, bearing in mind that the thermodynamic effects in extrusion processes are magnified by the joint action of temperature and pressure applied together. The values of parameters obtained in the extrusion process can be seen in Table 2, showing that the time and force decrease as the temperature increases for the same extrusion rate.
The microstructures of the bars obtained by extrusion at different temperatures are observed in Figure 9. Figure 9a,b shows undiffused elemental copper. The EDS analysis of the particles identified as Cu particle in the image showed a Cu-poor and a Cu-rich composition limit that were found at 99 at. % and at 75 at. % Cu, respectively, probably due to employing low temperature and preheating times, which are not able to promote suitable diffusion and homogenisation of alloying elements in the green compacts obtained from elemental powder blends. In addition, Figure 9c shows the segregation of Al–Cu-Zn and Al–Cu-Mn. The presence of these compounds in the microstructures, as well as the undissolved alloying elements, do not correspond to the results obtained by Thermo-Calc. Since no melting and liquid state homogenisation has been produced, the diffusion of the alloying elements starting from elemental powders leads to a local concentration in the alloying elements that is higher than the theoretical one of the alloy.
The microstructural features observed in Figure 9d reveal the possible formation of a liquid phase during the extrusion process. As explained above, despite the fact that the experimental results of the STA show that the first endothermic peak appears at 600 °C, the results in Figure 8 predict the presence of liquid phases at temperatures above 550 °C and contents of 8.8% in weight at 575 °C, which agree with the microstructures shown in Figure 9d.
The hardness values of extruded bars are shown in Table 3. When extrusion temperature increases, the hardness also increases, due to the diffusion phenomena, and the formation of solid solutions and precipitates. Starting from elemental powder blends, heating promotes these phenomena and consequently increases hardness after extrusion. These results can be observed when Figure 9a,c are compared, and the dissolution of elemental Cu leads to the formation of Al–Cu-Zn phases, observed and analysed by EDS. Since the formation of the liquid phase occurs at 575 °C (Figure 9d), this hardening effect was not observed in these samples (80 HV0.5).
These results agree with those of the Thermo-Calc studies. The formation of Al–Cu–Li phases is expected, and thus, they can also be responsible for the higher hardness obtained in bars when increasing the extrusion temperature. However, due to the limitations of FE-SEM with EDS in detecting light elements, such as Li, there is no direct evidence of these precipitates, as a difference from Al–Cu-Zn precipitates. The formation of precipitate phases turns out to be heterogeneous (Figure 9c) and nucleated on dislocations and grain boundaries as reported in the literature [12,19].

3.4. Heat Treatment (HT) Prior to Extrusion

To study the effect of the dissolution of the alloying elements before extrusion, a heat treatment was performed on some of the green compacts. According to the Themo-Calc studies, it is not easy to obtain a complete dissolution of all the alloying elements. Some phases, such as Al6Mn, always appear due to the limited solubility of Mn in Al. For that purpose, different temperatures were selected (450, 500 and 525 °C), according to the results obtained by STA, Thermo-Calc and the previous extrusion from green compacts.
Figure 10 shows SEM images of heat-treated samples at the different temperatures employed for 1 h. The images are taken in BSE mode to easily reveal contrasts corresponding to different phases. This helps to understand the diffusion of the alloying elements, from the starting elemental powder, into the Al matrix. Looking at pure Cu particles (bright contrast) with a composition close to 71 at. % Cu and 29 at. % Al by EDS analysis as an indicator of diffusion in Figure 10a (450 °C), by increasing the temperature, the quantity of pure Cu particles decreases. At 525 °C, the composition of the Al–Cu phase by EDS is 34 at. % Cu and 66 at. % Al, which means that the interdiffusion is more effective and alloying elements are being dissolved in the Al. There is no evidence of segregations enriched in Zn (Al–Cu-Zn) such as those observed in the SEM images of GC samples (Figure 10c). These results confirm that diffusion and homogenisation of Cu are enhanced with the heat treatment temperature. Furthermore, some precipitates containing Mn can be distinguished, with a composition close to 78 at. % Al 14 at. % Mn 8 at. % Cu by EDS analysis.
The dissolution of the alloying elements into the Al matrix promotes the formation of Al–Cu phases. Observation of these phases clearly shows that diffusion of the alloying elements has been achieved. Examining the diffusion coefficients of alloying elements in the Al matrix, they vary following the order Li > Mg > Zn > Cu > Mn [20,21] where, in addition, Mn is the least soluble element in the Al matrix. Nevertheless, the solubility of both Al and Cu is high in Mn. This could explain the presence of particles enriched in Mn-Cu in Al. These particles can reach compositions close to Al10Mn2Cu, which does not correspond to any equilibrium phase predicted by Thermo-Calc. Despite the fact that Al–Cu precipitates are formed during slow cooling down from the heating temperature, due to the continuous decrease in the solubility of the alloying elements in the Al matrix, the presence of particles with high content in Mn can be explained as a result of Al and Cu diffusion into former pure Mn powder particles (see Figure 10b,c).
The XRD diffractograms for samples heat treated at different temperatures are summarised in Figure 11. Elemental Cu is identified for samples after heat treatments at 450 °C, according to the SEM images. These conditions are not sufficient to achieve diffusion of the alloying elements.
The FCC Al2Cu phase was identified in the samples after heat treatments at 450, 500, and 525 °C. The presence of precipitates clearly shows the proper dissolution of elemental Cu particles into the Al matrix by increasing the temperature. Specifically, the AlCu3 and Al7Cu4Li phases were identified in samples heat treated at 525 °C. According to the phase diagram (Figure 6), the stable TB-Al7Cu4Li phase was predicted by Thermo-Calc.
To study the effect of the holding time, green compacts were also heat treated at 500 °C and 525 °C for 2 h (Figure 12). Since the purpose of the heat treatment is not to densify but rather to obtain homogeneous and uniform bars by means of the diffusion of alloying elements, it is necessary to find a balance between an optimal diffusion and a suitable extrusion process. No microstructural differences were observed among heat-treated samples at different temperatures and times.
Thus, further information is searched for in the XRD results, shown in Figure 13, where the most significant phases were found to be identical for compacts under the conditions studied: Al2Cu and Al7Cu4Li. Nevertheless, the Al–Cu phase only appears in the XRD of heat-treated samples for 2 h, regardless of the temperatures.
According to the literature, the GP-zones structure in Al–Cu alloys appear when Cu replaces Al atoms in a region of a {100} plane called ‘GP1’ or ‘GP-I’ zone (θ-Al2Cu). As mentioned in Section 3.2, the θ’-Al–Cu phase is stabilised by the replacement of Al atoms with Li atoms, promoting the formation of the AlCuLi phase. There are several reasons that explain the different results obtained by DRX and Themo calc. Firstly, Themo-Calc predicts TB and T1 Al–Cu–Li phases and no Al–Cu phases (Figure 6). However, DRX shows AlCu, Al2Cu and AlCu3. It has been observed that Al–Cu phases remain stable for low percentages of Li, below 0.2%. Secondly, the diffusion of alloying elements in the Al matrix is not completely achieved given zones where Li is lower than expected, thus allowing the formation of Al–Cu phases, not found in Themo-Calc, where the theoretical composition is simulated. In this way, the differences found in DRX with temperature and time (Figure 12 and Figure 13) show the formation of Al–Cu phases and their evolution into Al–Cu–Li phases by the substitution of Al atoms with atoms of Li.
The density was measured in the samples after the heat treatment (Figure 14a). The results show that at 450 °C and 500 °C for 1 h the heat treatment has no influence on the density, which reaches values of 100% of the theoretical one. Conversely, the density slightly decreases when temperature and/or time conditions are 500 °C—2 h, 525 °C—1 h, and 525 °C—2 h. Figure 14b shows the hardness of the different heat treatments. It can be observed that hardness is also quite similar in all the samples, and with a narrow standard deviation.
Temperature and time do not appear to have a significant influence on density and hardness in order to determine the optimum heat treatment conditions. A value of 525 °C—1 h was selected as heat treatment conditions, according to the microstructure and RX, showing the effective dissolution of alloying elements.

3.5. Extruded Bars from Heat-treated Compacts of Al–Cu–Li Alloy

Samples were heat treated (525 °C—1 h N2) and extruded at 525 °C according to all the results shown above.
The extrusion force required for this new processing route was 99 kN, a higher value than that required for GC samples. The densification of samples, as well as the solid solution of alloying elements and the new phases formed during heat treatment, increases the force. These changes must be considered when designing and scaling the extrusion process.
The microstructure of the bars obtained after the extrusion process is shown in Figure 15. The presence of homogenous and uniformly distributed fine precipitates can be seen. In particular, the dispersion of precipitates observed corresponds mainly to Al–Cu. The EDS results of the bright particles showed a composition close to 74 at. % Al and 26 at. % Cu.
The hardness on the cross-section was 84 ± 5 HV0.5. This value is lower compared to that from GC extruded at the same extrusion temperature (102 ± 2 HV0.5; see Table 3). Note that the hardness measurement was an intermediate value between that of bar extruded from the green compact at 450 and 525 °C (73 ± 3 HV0.5 and 102 ± 2 HV0.5). When extruding the green compact directly, these compacts are initially softer and present better flowability during the extrusion process. The formation of new phases during extrusion, along with the presence of undissolved former alloying elements, increase the hardness. However, heat treatment promotes the diffusion processes of the alloying elements and leads to obtaining homogeneous bars.

4. Conclusions

The main conclusions for the alloys studied support the results obtained in preliminary tests for pure aluminium: the extrusion temperature is a more influential parameter than the loading speed, and increasing the temperature allows the extrusion force and time to decrease. When extrusion tests were carried out on the alloy under study at different temperatures, a liquid phase was observed at 575 °C. These results agree with the Thermo-Calc studies, in which a liquid phase of 8.8 wt.% was predicted at 575 °C.
The heat treatment step before the extrusion process was effective to promote diffusion processes of the alloying elements. According to the microstructural results, most of the phases dissolve and promote a homogeneous solid solution at temperatures above 500 °C, except for manganese, which is the least soluble element in the Al matrix. However, as the solubility of both Al and Cu is high in Mn, the presence of the Al–Cu–Mn phase can be explained as a result of Al and Cu diffusion into pure Mn powder particles.
The AlCu3 and Al7Cu4Li phases were identified in the DRX results at 525 °C for 1 h. In accordance with the phase diagram, it is predictable that Li atoms form part of the network structure of the Al–Cu compound, which cannot be identified by EDS.
The results of these trials led to the conclusion that powder blends should be extruded at 525 °C after heat treatment at the same temperature for 1 h. This additional step prior to the extrusion process ensures the homogenisation of the alloying elements of the final bars in the microstructure.

Author Contributions

P.R.-G.: writing—original draft, conceptualization, methodology, investigation, and formal analysis. E.G.: review and editing, conceptualization, methodology, investigation, formal analysis, and resources. E.M.R.-N.: review and editing, conceptualization, methodology, investigation, formal analysis, and resources. All authors have read and agreed to the published version of the manuscript.

Funding

The authors would like to thank the funding provided for this research by the Regional Government of Madrid (Dra. Gral. Universidades e Investigación) through the project S2018/NMT4411 (ADITIMAT-CM).

Institutional Review Board Statement

Not applicable.

Informed Consent Statement

Not applicable.

Data Availability Statement

Not applicable.

Conflicts of Interest

The authors declare that they have no known competing financial interest or personal relationship that could have appeared to influence the work reported in this paper.

References

  1. Fu, Q.; Li, B.; Gao, M.; Fu, Y.; Yu, R.; Wang, C.; Guan, R. Quantitative mechanisms behind the high strength and electrical conductivity of Cu-Te alloy manufactured by continuous extrusion. J. Mater. Sci. Technol. 2022, 121, 9–18. [Google Scholar] [CrossRef]
  2. Gain, A.; Lee, B.-T. Microstructure Control of Continuously Porous t-ZrO2 Bodies Fabricated by Multi-Pass Extrusion Process. Mater. Sci. Eng. A 2006, 419, 269–275. [Google Scholar] [CrossRef]
  3. Jabbari Taleghani, M.A.; Ruiz Navas, E.M.; Torralba, J.M. Microstructural and mechanical characterisation of 7075 aluminium alloy consolidated from a premixed powder by cold compaction and hot extrusion. Mater. Des. 2014, 55, 674–682. [Google Scholar] [CrossRef] [Green Version]
  4. Pardoe, J.A. Conform continuous extrusion of metal powders into products for electrical industry: Development experience. Powder Metall. 1979, 22, 22–28. [Google Scholar] [CrossRef]
  5. Katsas, S.; Dashwood, R.; Todd, G.; Jackson, M.; Grimes, R. Characterisation of ConformTM and conventionally extruded Al–4Mg–1Zr. Effect of extrusion route on superplasticity. J. Mater. Sci. 2010, 45, 4188–4195. [Google Scholar] [CrossRef]
  6. Thomas, B.M.; Derguti, F.; Jackson, M. Continuous extrusion of a commercially pure titanium powder via the Conform process. Mater. Sci. Technol. (UK) 2017, 33, 899–903. [Google Scholar] [CrossRef]
  7. Ab Rahim, S.N.; Lajis, M.A.; Ariffin, S. Effect of extrusion speed and temperature on hot extrusion process of 6061 aluminum alloy chip. ARPN J. Eng. Appl. Sci. 2016, 11, 2272–2277. [Google Scholar]
  8. Saha, P.K. Aluminum Extrusion Technology; ASM International: Chardon, OH, USA, 2000. [Google Scholar]
  9. Zubizarreta, C.; Gim, S.; Mart, J.M.; Iturriza, I. Effect of the heat treatment prior to extrusion on the direct hot-extrusion of aluminium powder compacts. J. Alloys Compd. 2009, 467, 191–201. [Google Scholar] [CrossRef]
  10. Chahare, A.S. Optimization of Aluminium Extrusion Process using Taguchi Method. IOSR J. Mech. Civ. Eng. 2017, 17, 61–65. [Google Scholar] [CrossRef]
  11. Velasco, F.; Da Costa, C.E.; Candela, N.; Torralba, J.M. Fracture analysis of aluminium matrix composite materials reinforced with (Ni3Al)p. J. Mater. Sci. 2003, 38, 521–525. [Google Scholar] [CrossRef]
  12. Arif, A.F.; Sheikh, A.K.; Qamar, S.; Raza, M.; Al-Fuhaid, K. Product defects in aluminum extrusion and their impact on operational cost. In Proceedings of the 6th Saudi Engineering Conference, Dhahran, Saudi Arabia, 14–17 December 2002; Volume 5. [Google Scholar]
  13. The Materials Information Society. In ASM Handbook Volume 3-Alloy Phase Diagrams; ASM International: Chardon, OH, USA, 1992. [CrossRef]
  14. Chen, H.L.; Chen, Q.; Engström, A. Development and applications of the TCAL aluminum alloy database. Calphad 2018, 62, 154–171. [Google Scholar] [CrossRef]
  15. Davis, J.R.; Committee, A.S.M.I.H. ASM Specialty Handbook: Heat-Resistant Materials; ASM International: Chardon, OH, USA, 1997. [Google Scholar]
  16. Pieczonka, T.; Schubert, T.; Baunack, S.; Kieback, B. Sintering Behaviour of Aluminium in Different Atmospheres. In Proceedings of the 4th International Conference on Science, Technology and Applications of Sintering, Grenoble, France, 29 August–1 September 2005; pp. 5–8. [Google Scholar]
  17. Prasad, N.E.; Gokhale, A.; Wanhill, R.J.H. Aluminum-Lithium Alloys: Processing, Properties, and Applications; Elsevier Science: Amsterdam, The Netherlands, 2013. [Google Scholar]
  18. Raffeis, I.; Adjei-Kyeremeh, F.; Vroomen, U.; Richter, S.; Bührig-Polaczek, A. Characterising the microstructure of an additively built Al-Cu-Li alloy. Materials 2020, 13, 5188. [Google Scholar] [CrossRef] [PubMed]
  19. Decreus, B.; Deschamps, A.; de Geuser, F.; Donnadieu, P.; Sigli, C.; Weyland, M. The influence of Cu/Li ratio on precipitation in Al–Cu–Li–x alloys. Acta Mater. 2013, 61, 2207–2218. [Google Scholar] [CrossRef]
  20. Du, Y.; Chang, Y.; Huang, B.; Gong, W.; Jin, Z.; Xu, H.; Yuan, Z.; Liu, Y.; He, Y.; Xie, F.-Y. Diffusion coefficients of some solutes in fcc and liquid Al: Critical evaluation and correlation. Mater. Sci. Eng. A 2003, 363, 140–151. [Google Scholar] [CrossRef]
  21. Anderson, K.; Weritz, J.; Kaufman, J.G. ASM Handbook, Volume 2A: Aluminum Science and Technology; ASM International: Chardon, OH, USA, 2018. [Google Scholar]
Figure 1. (a) Schematic representation of the direct extrusion process. (b) Displacement and extrusion force vs. time graphs for hot extrusion processing of aluminium compact.
Metals 12 01046 g001
Figure 2. (a) Particle size of pure aluminium. (b) Scanning electron microscopy (SEM) images.
Metals 12 01046 g002
Figure 3. Process scheme of the experimental procedure.
Metals 12 01046 g003
Figure 4. Study of the process parameters of the extrusion process (a) Force (kN) and Time (s) vs. Loading Speed (N/s) (b) Force (kN) and Time (s) vs. Temperature (°C).
Metals 12 01046 g004
Figure 5. (a) Simultaneous thermal analysis (STA) of the as-mixed 2060 powder and (b) the first derivatives of differential scanning calorimetry curve (dDSC).
Metals 12 01046 g005
Figure 6. Phase diagram for Al–4Cu–0.85Mg–0.3Mn-0.1Zn-0.75Li (wt.%).
Metals 12 01046 g006
Figure 7. Mass fraction of all phases as a function of temperature (a) Major phases (b) Minor phases and values of solvus temperatures from simulations.
Metals 12 01046 g007
Figure 8. 
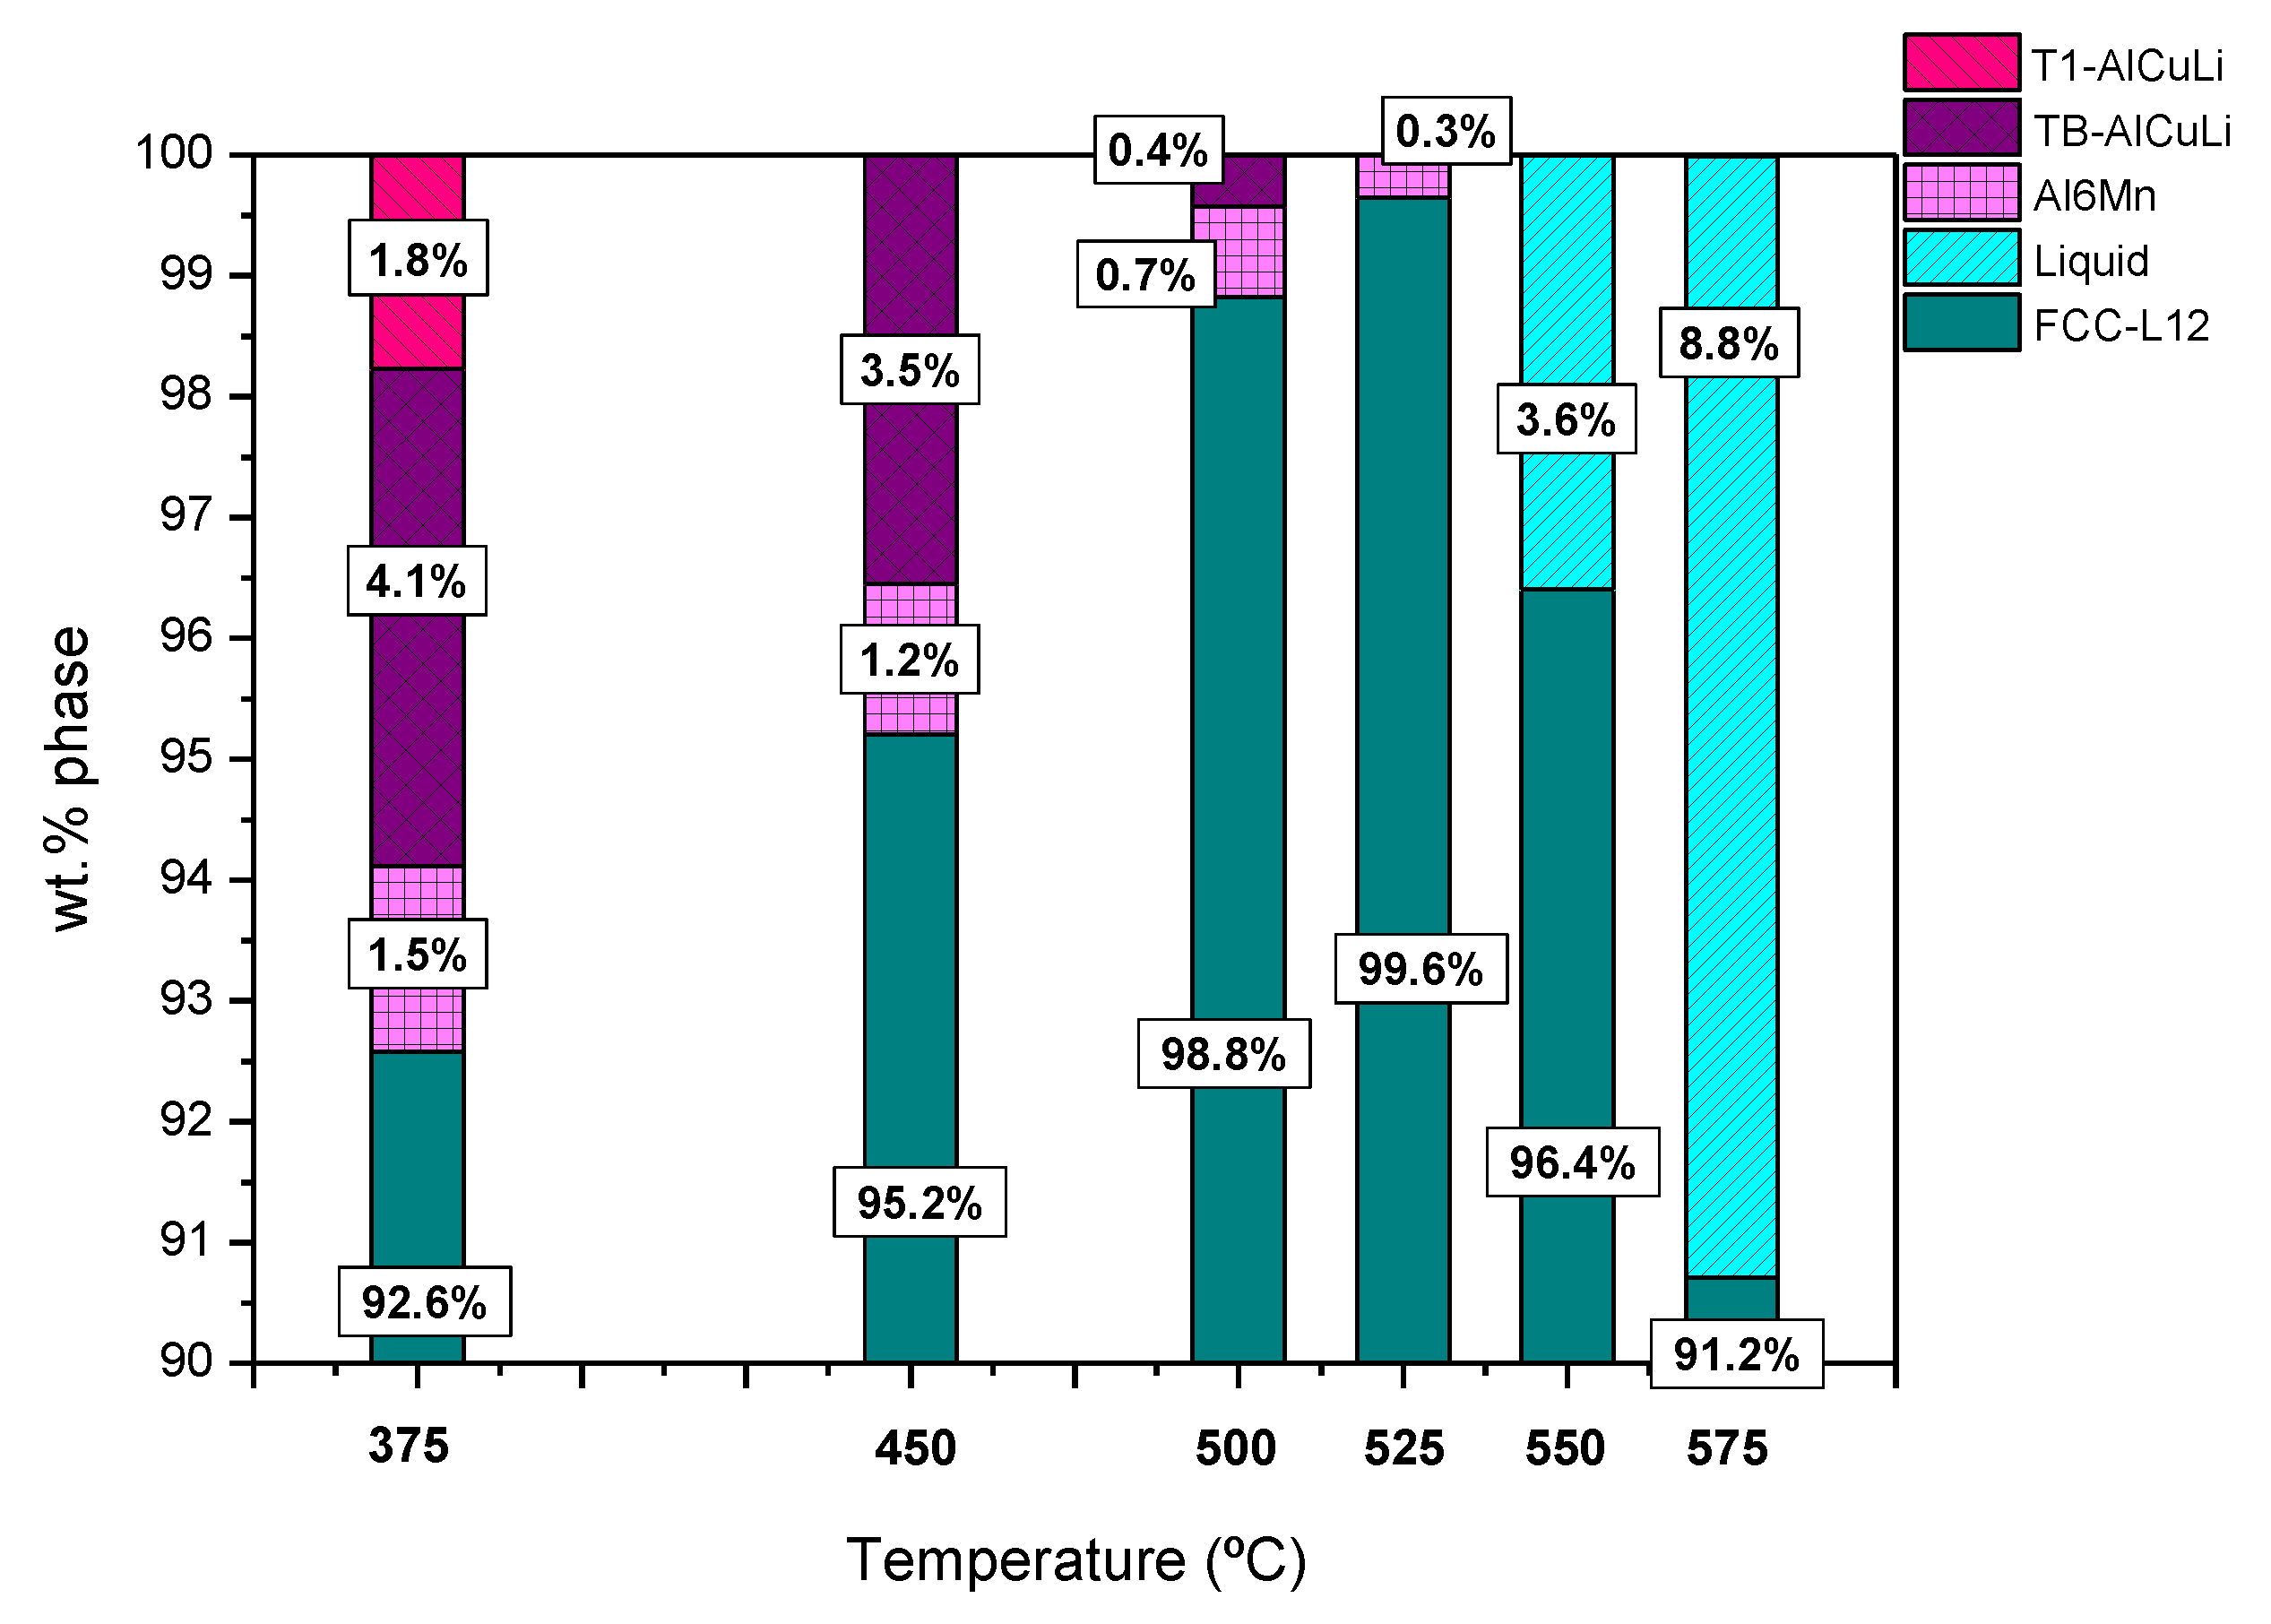
Weight percent of the phases at different temperatures for the Al–Cu–Li alloy.
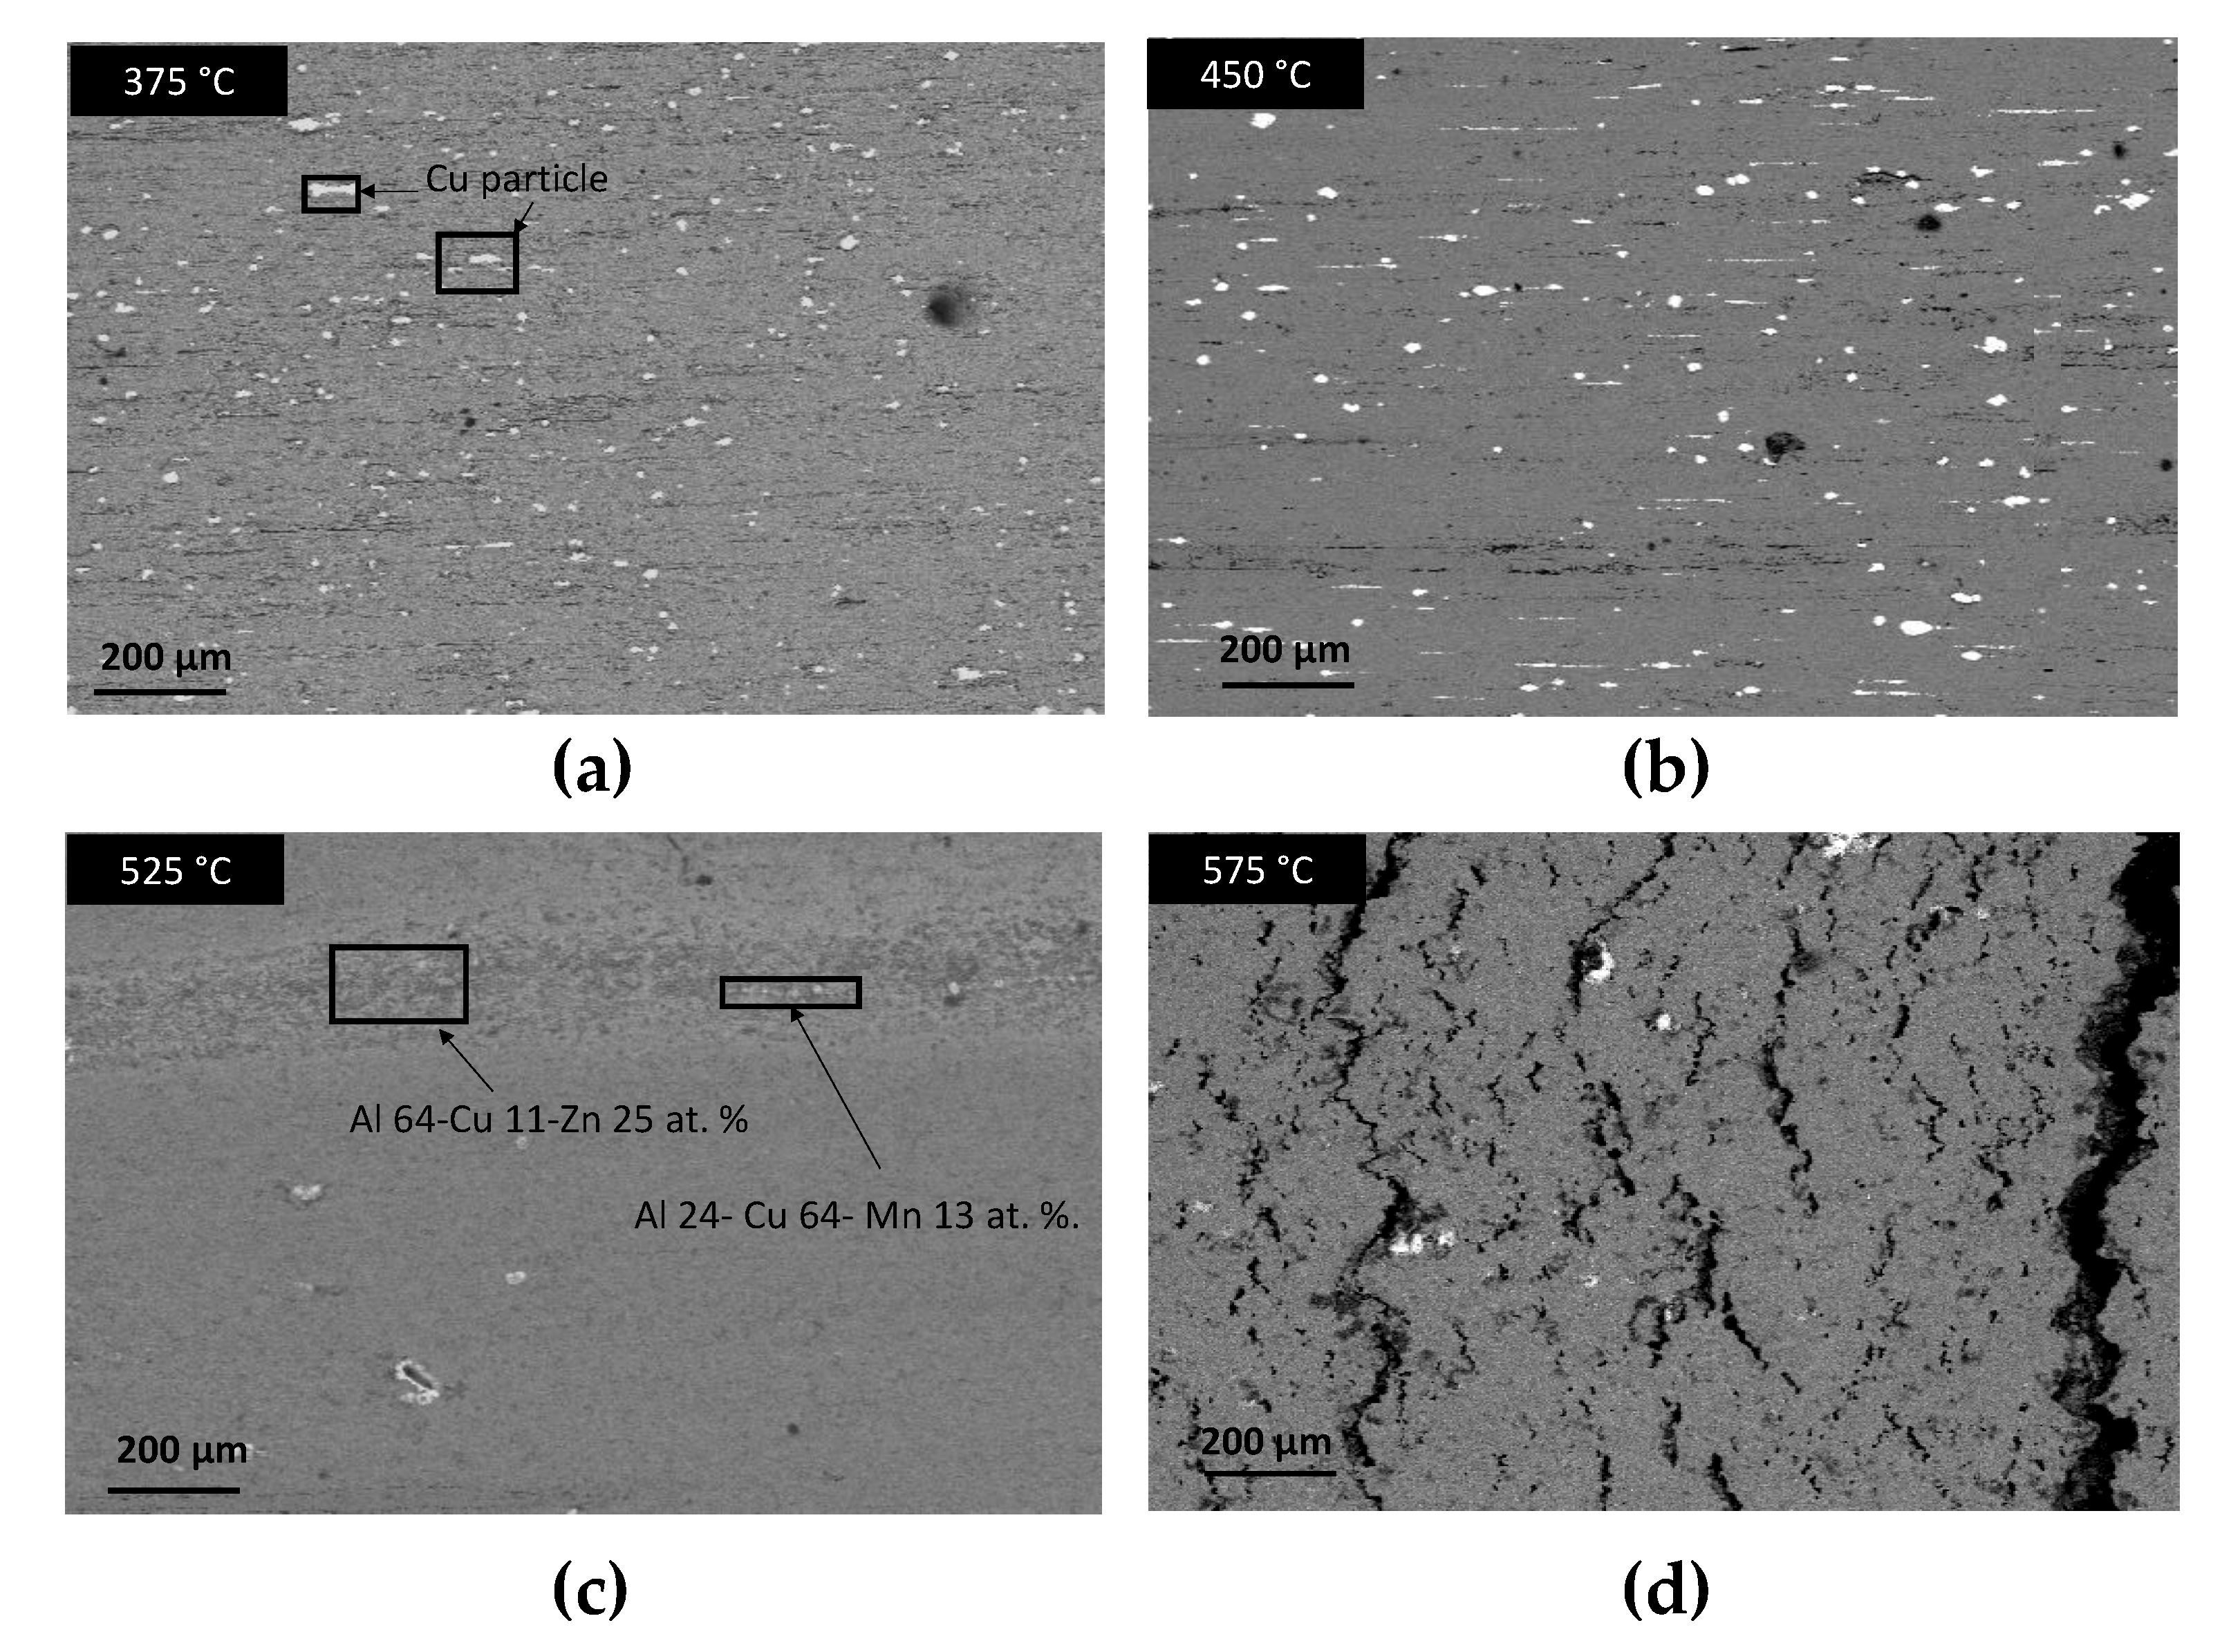
Metals 12 01046 g008
Figure 9. SEM images of the longitudinal section of bars from green compacts extruded at different temperatures: (a) 375 °C; (b) 450 °C; (c) 525 °C; (d) 575 °C.
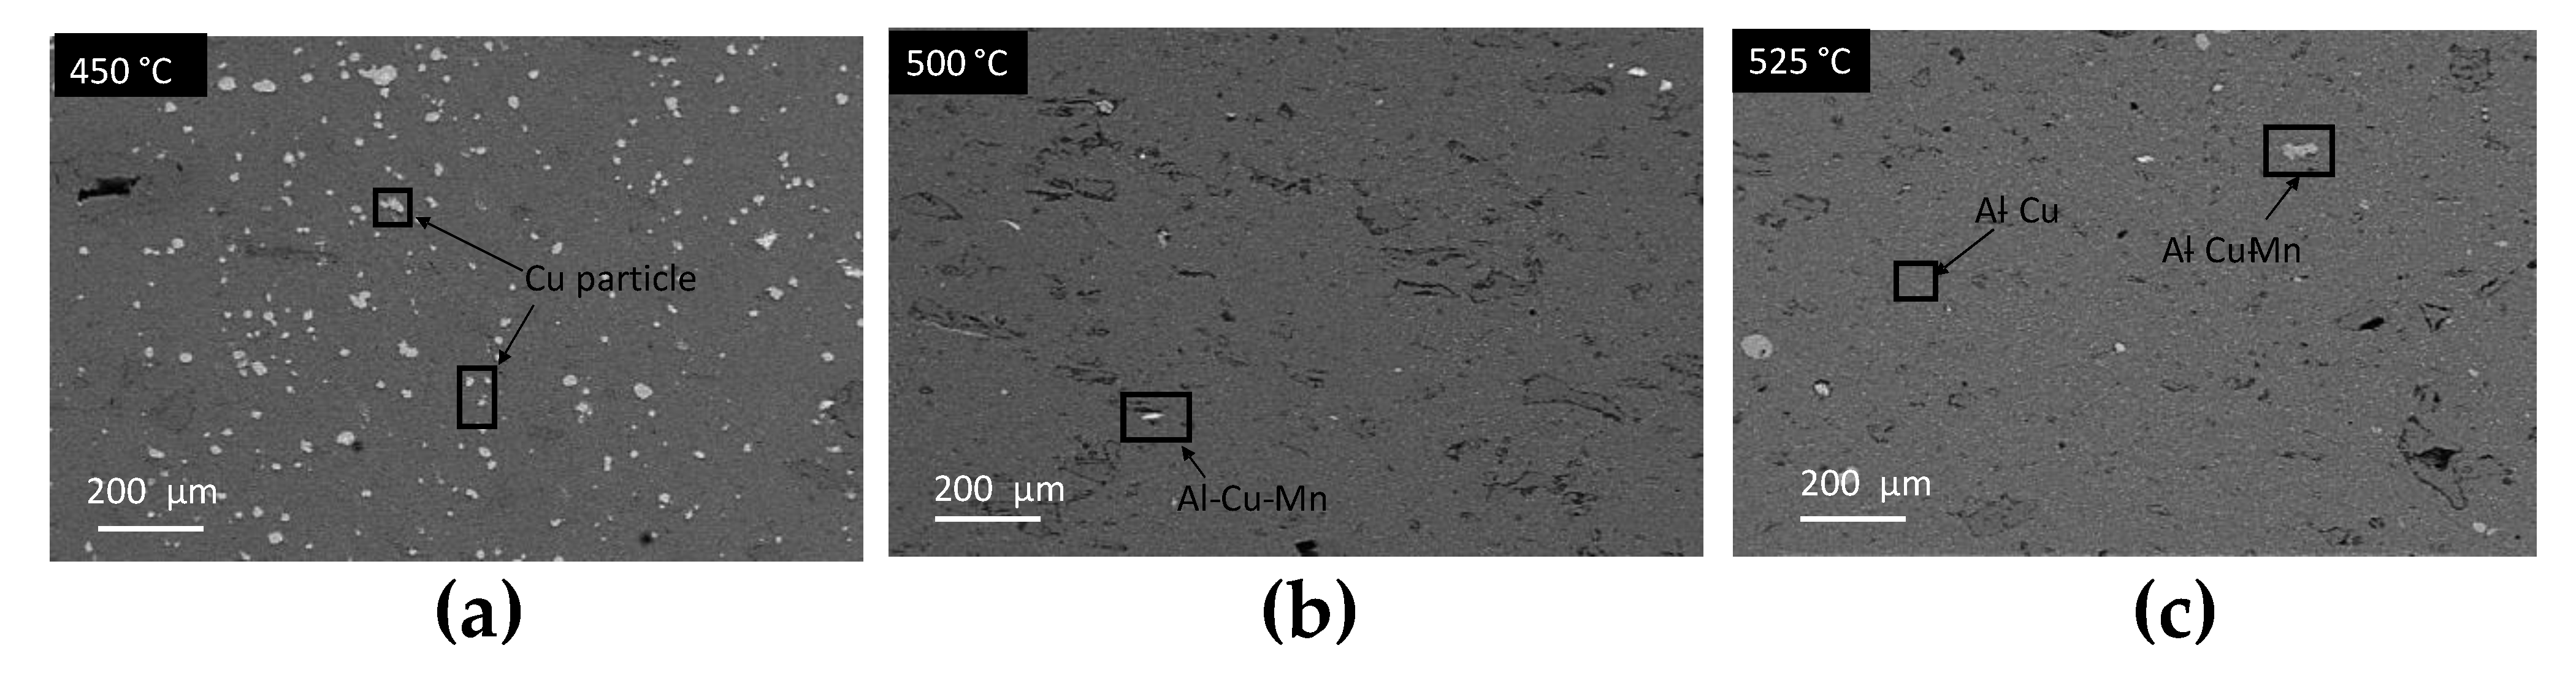
Metals 12 01046 g009
Figure 10. SEM images (BSE mode) at a 200× magnification of heat-treated compacts: (a) 450 °C, 1 h; (b) 500 °C, 1 h; (c) 525 °C, 1 h.
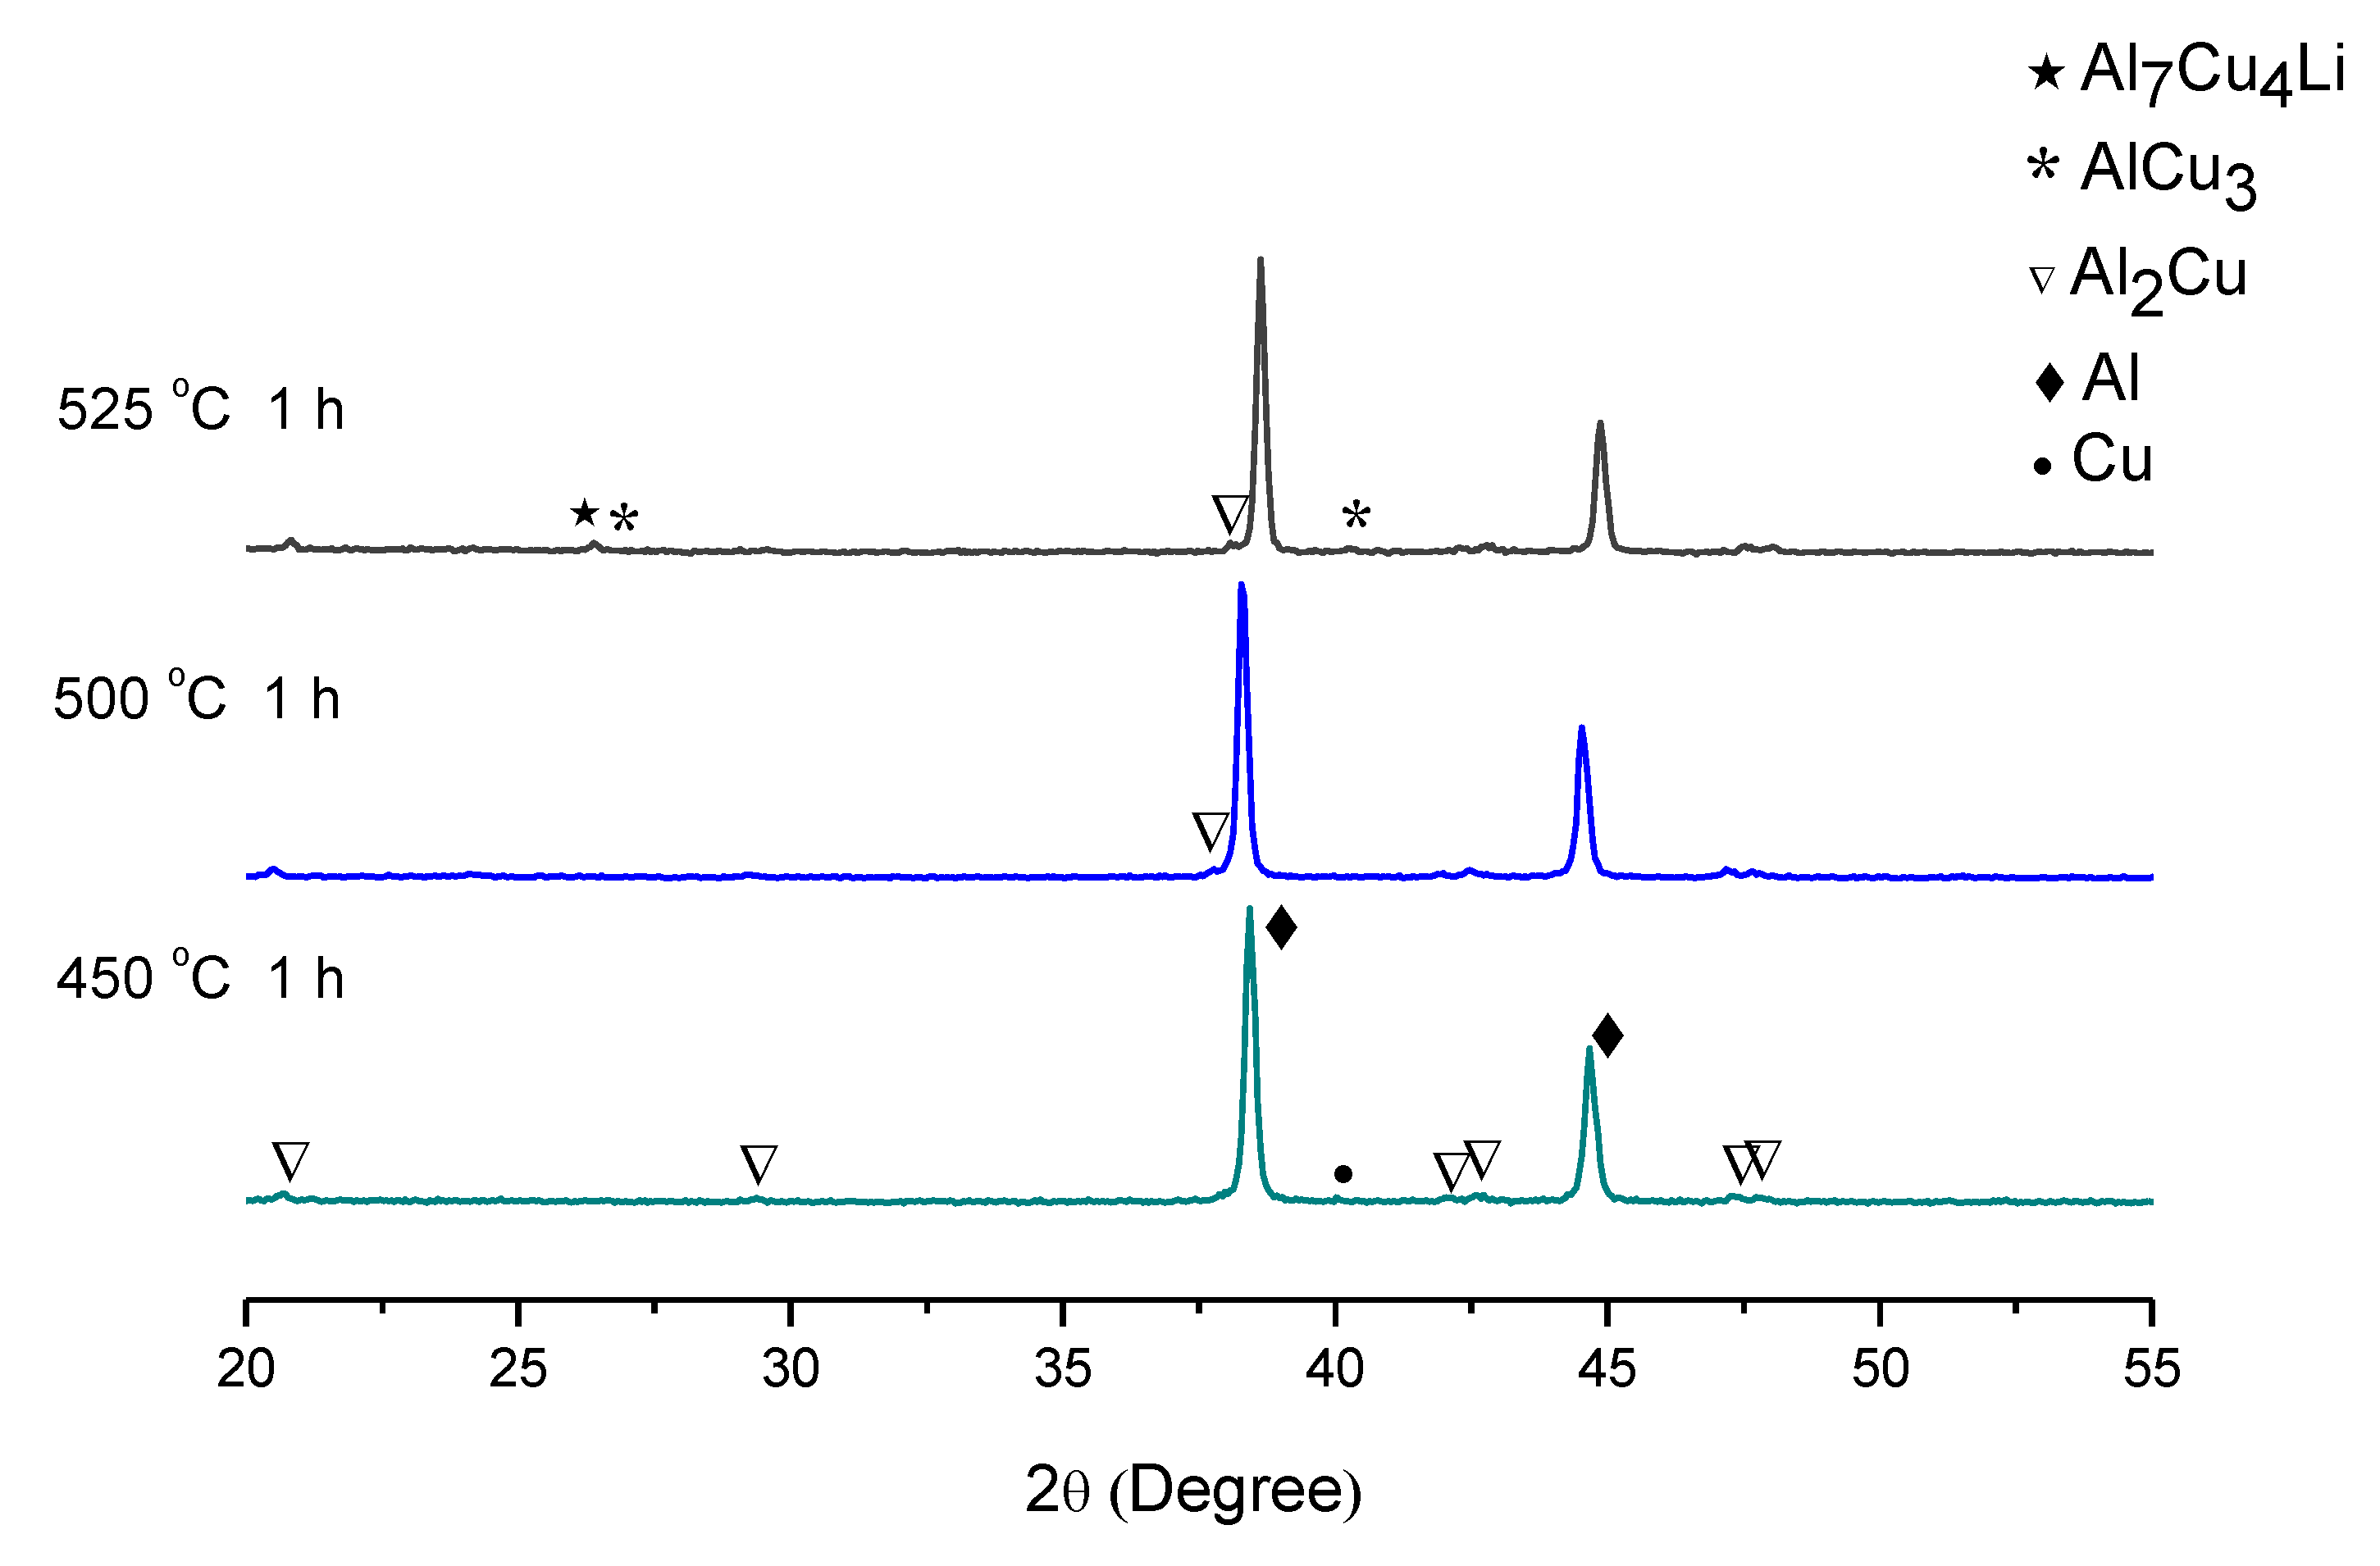
Metals 12 01046 g010
Figure 11. 
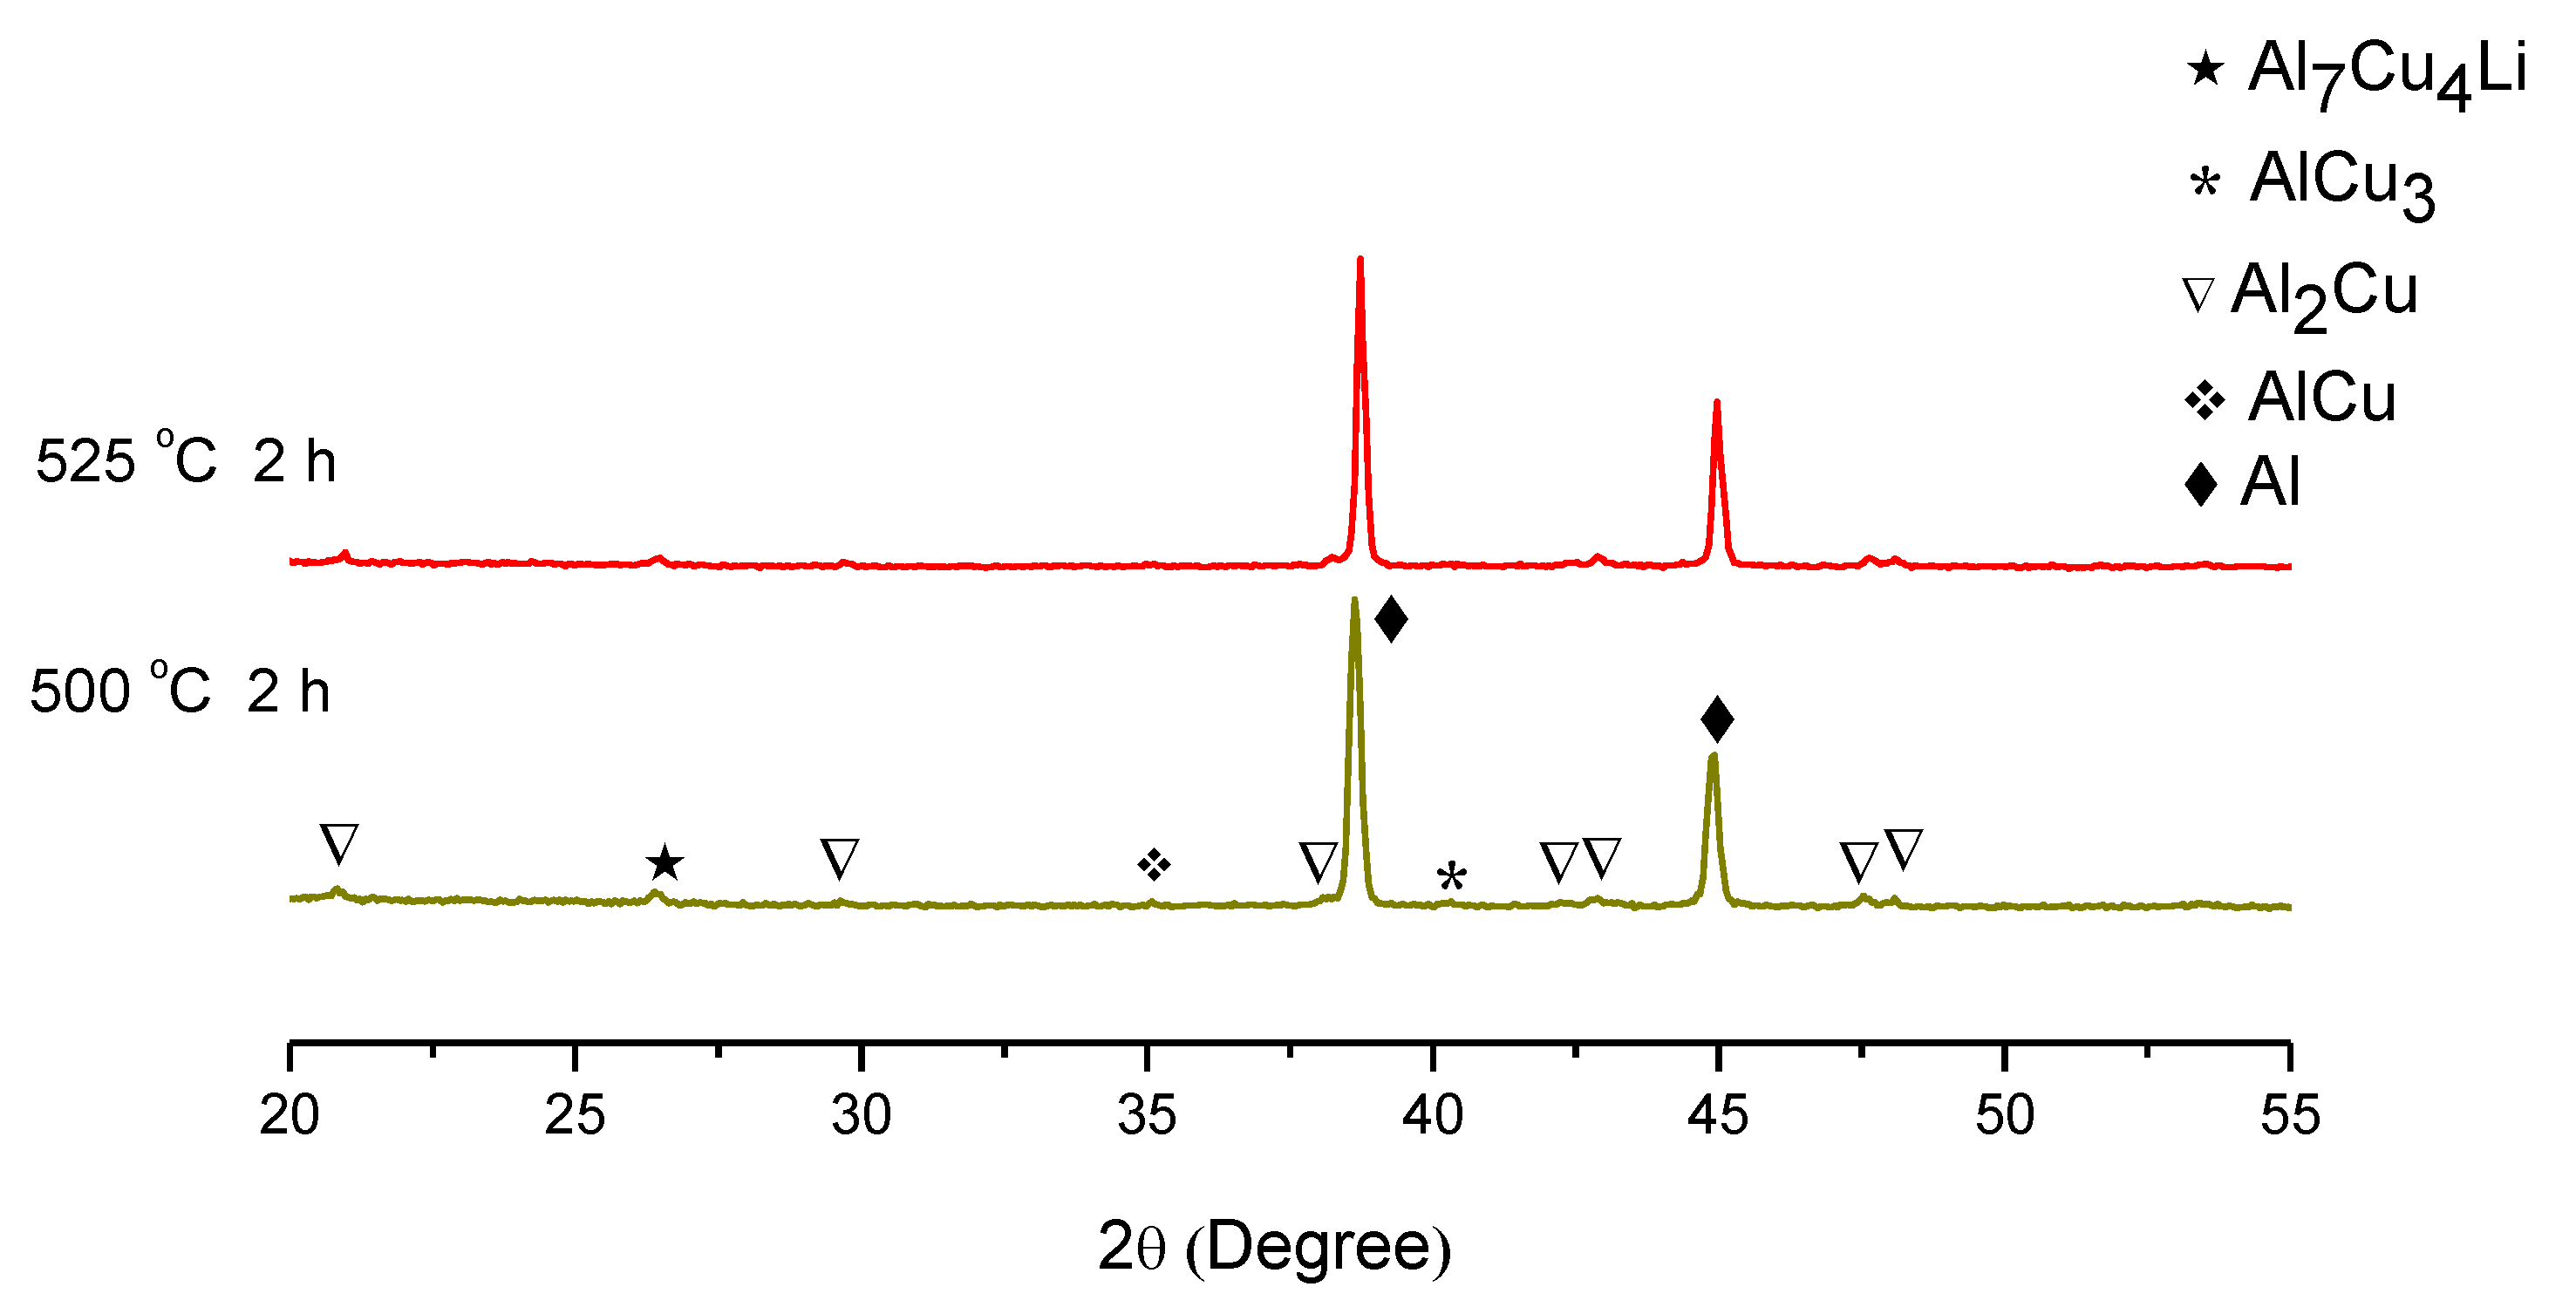
X-ray diffraction patterns of compacts heat treated at different temperatures.
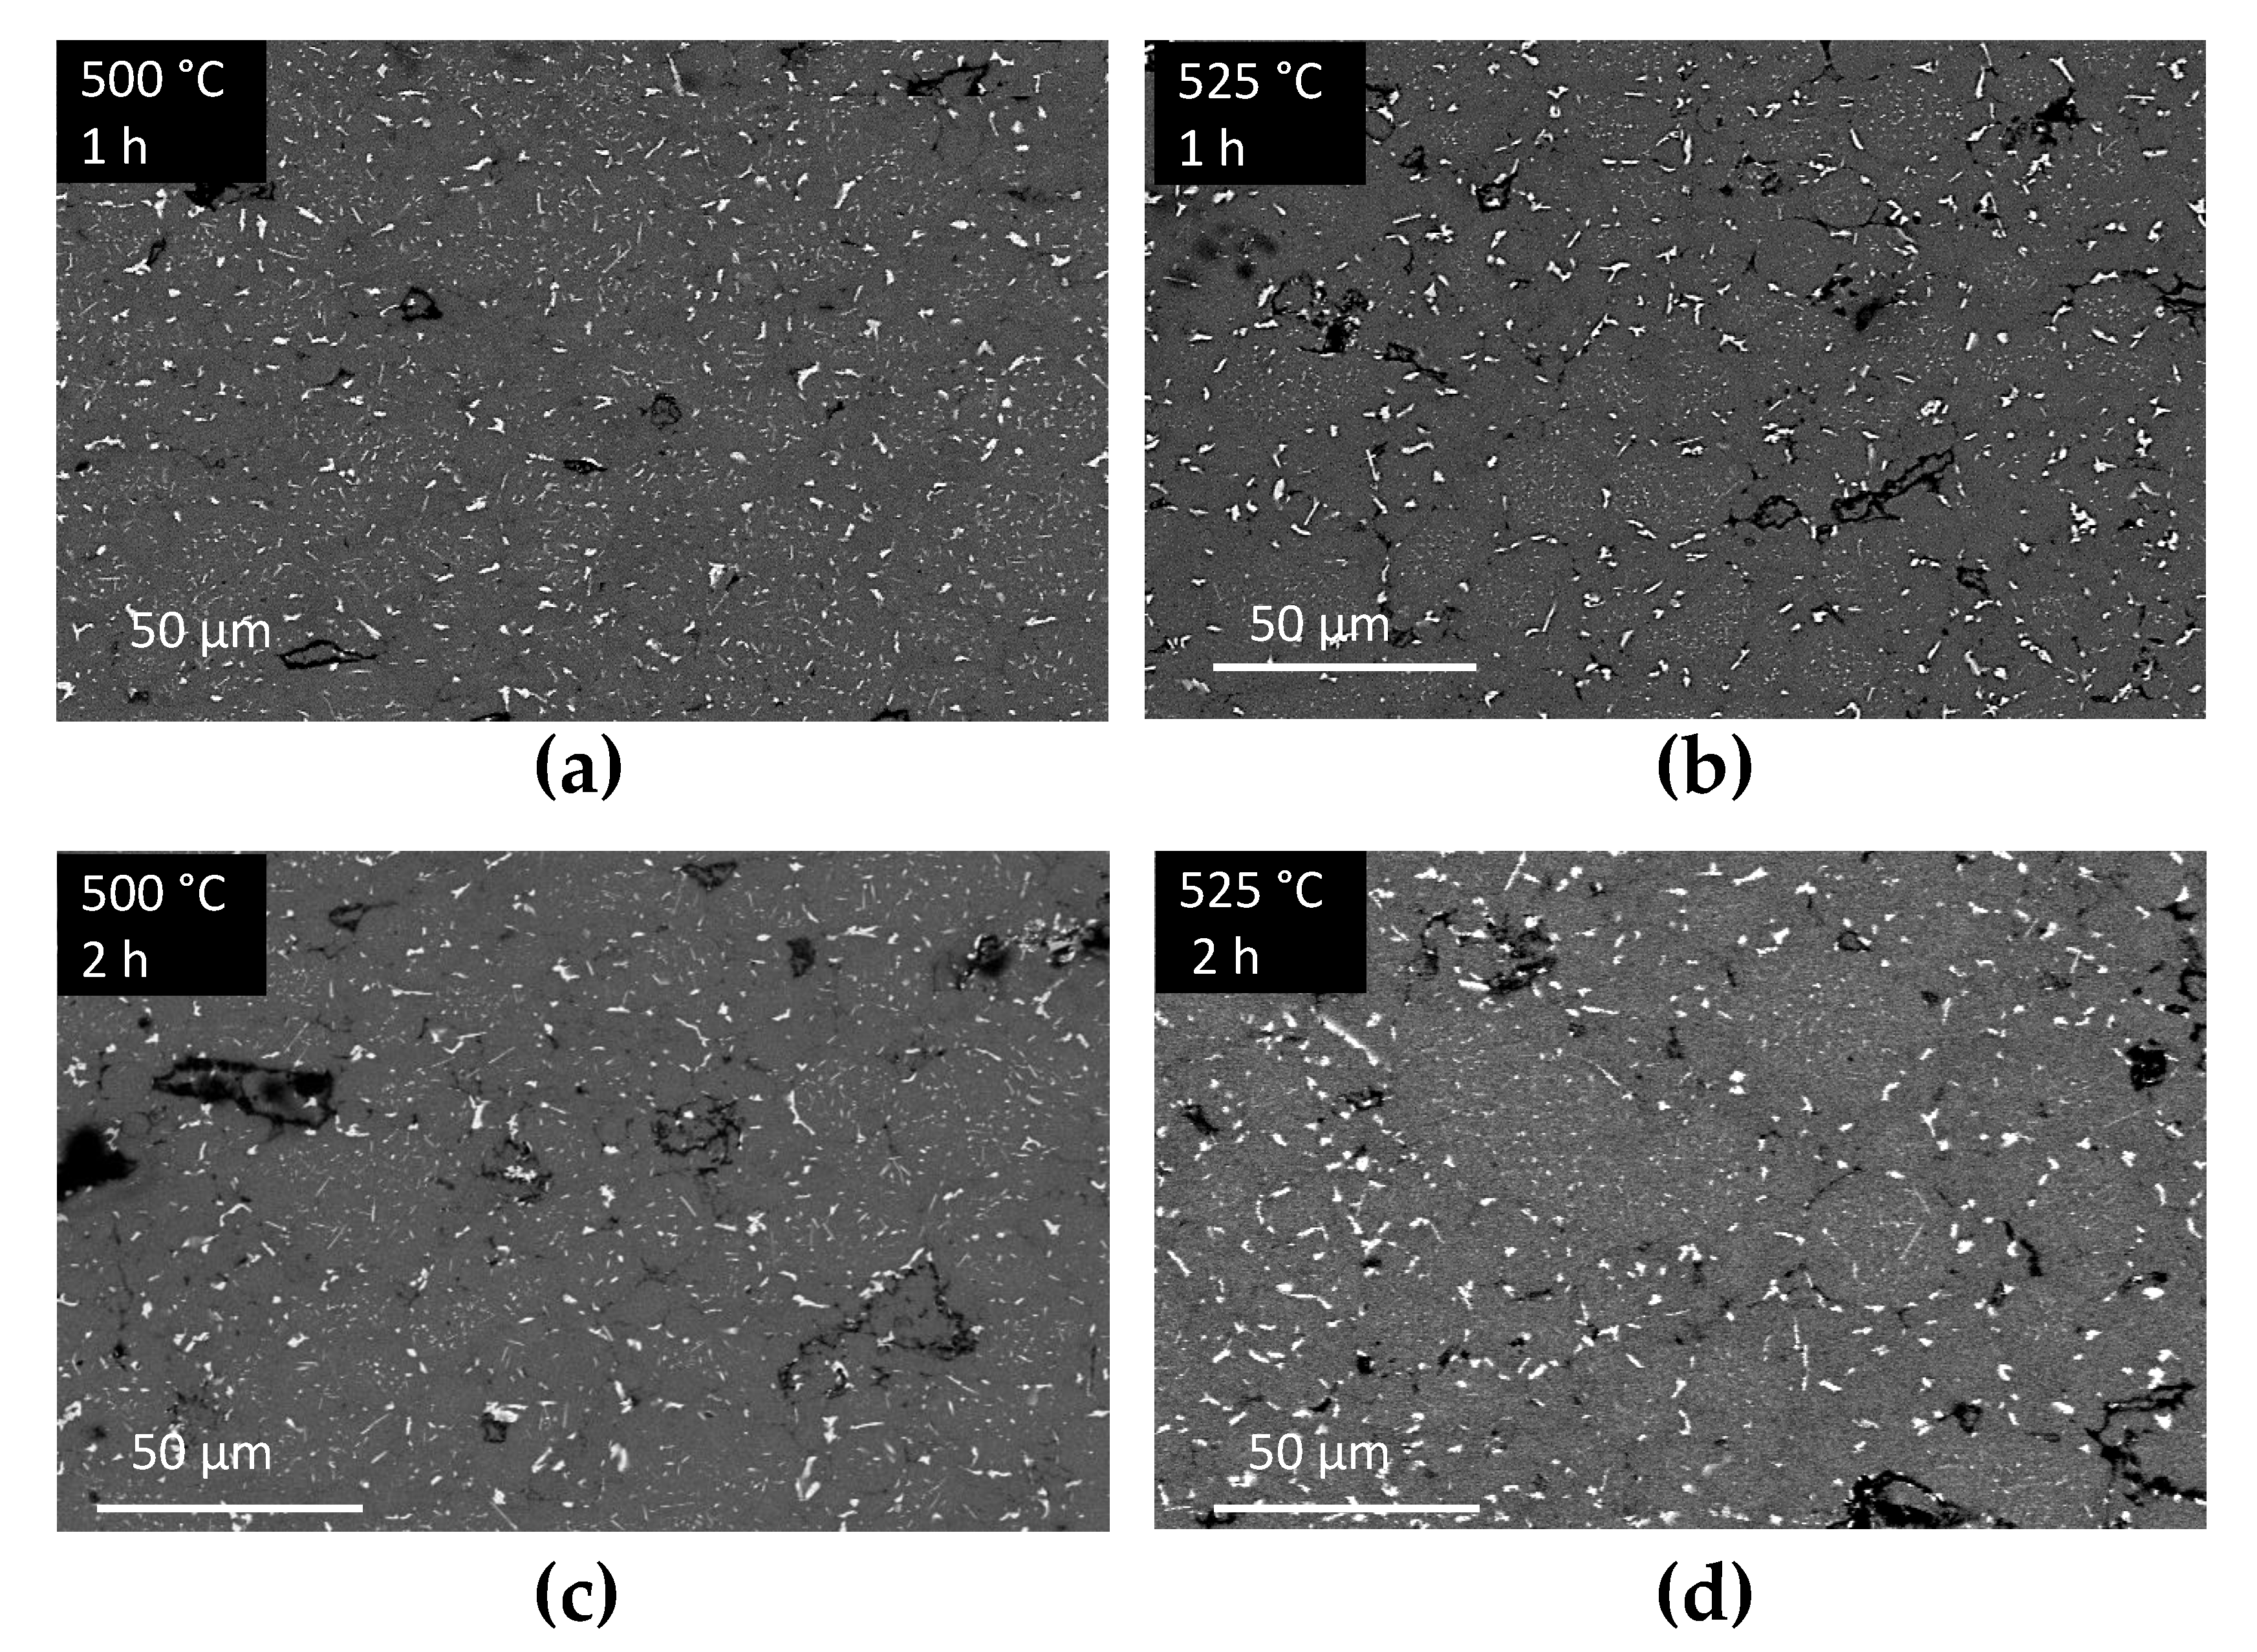
Metals 12 01046 g011
Figure 12. SEM images (BSE mode) taken at a 1200× magnification of heat-treated compacts at: (a) 500 °C, 1 h; (b) 525 °C, 1 h; (c) 500 °C, 2 h; (d) 525 °C, 2 h.
Metals 12 01046 g012
Figure 13. X-ray diffractograms of HT compacts at different temperatures and times.
Metals 12 01046 g013
Figure 14. 
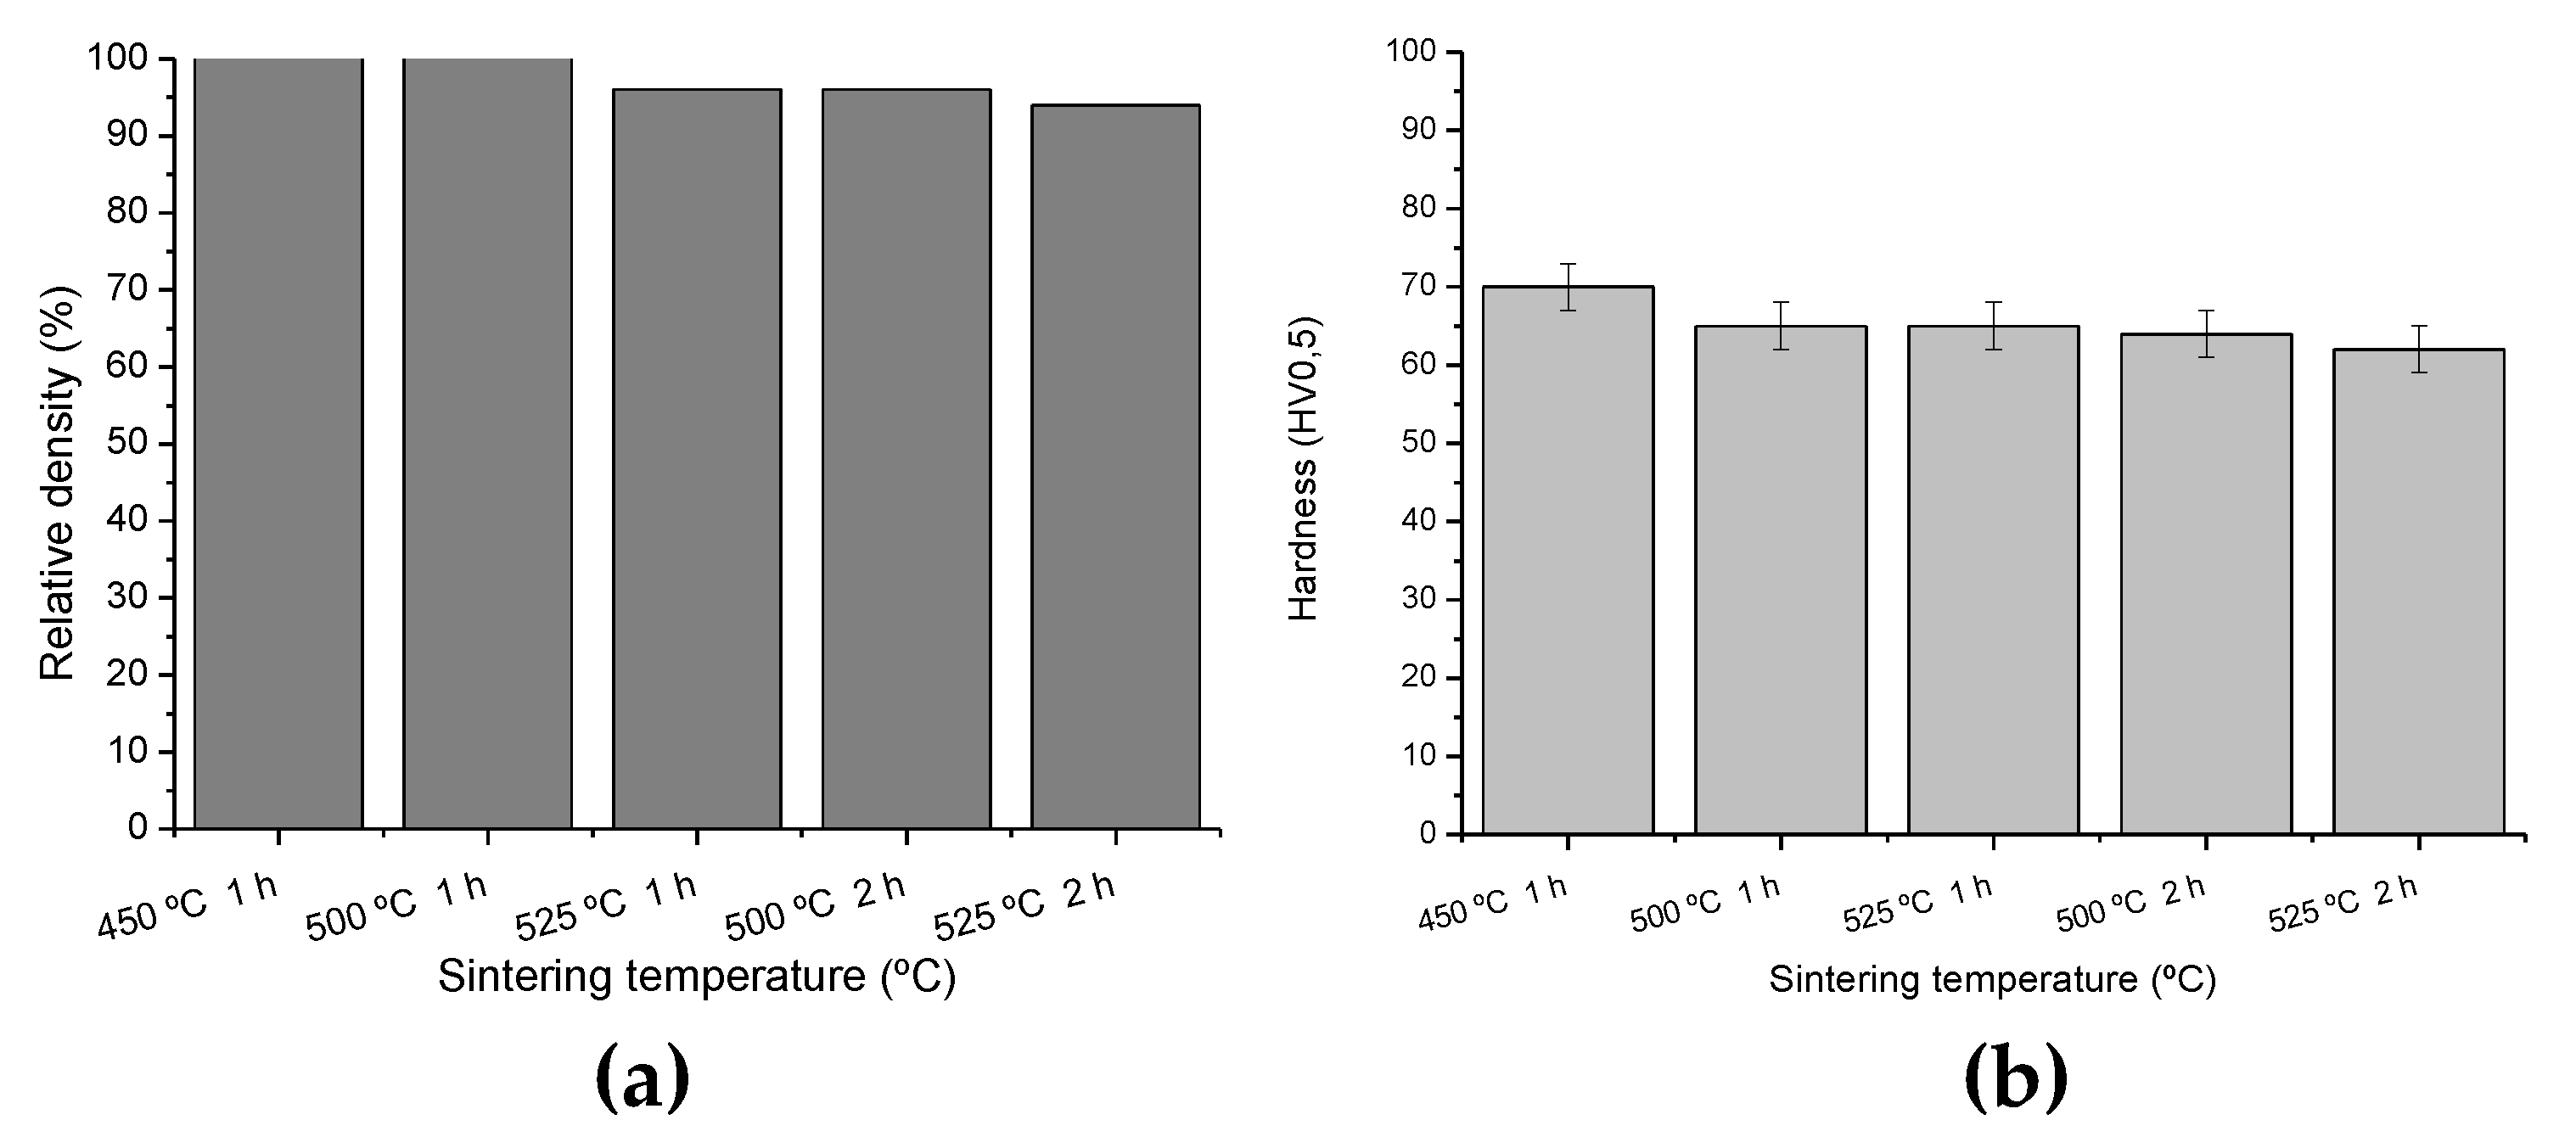
(a) Relative density (%) of HT compacts. (b) Hardness as a function of the temperature for Al–Cu–Li alloy.
Metals 12 01046 g014
Figure 15. 
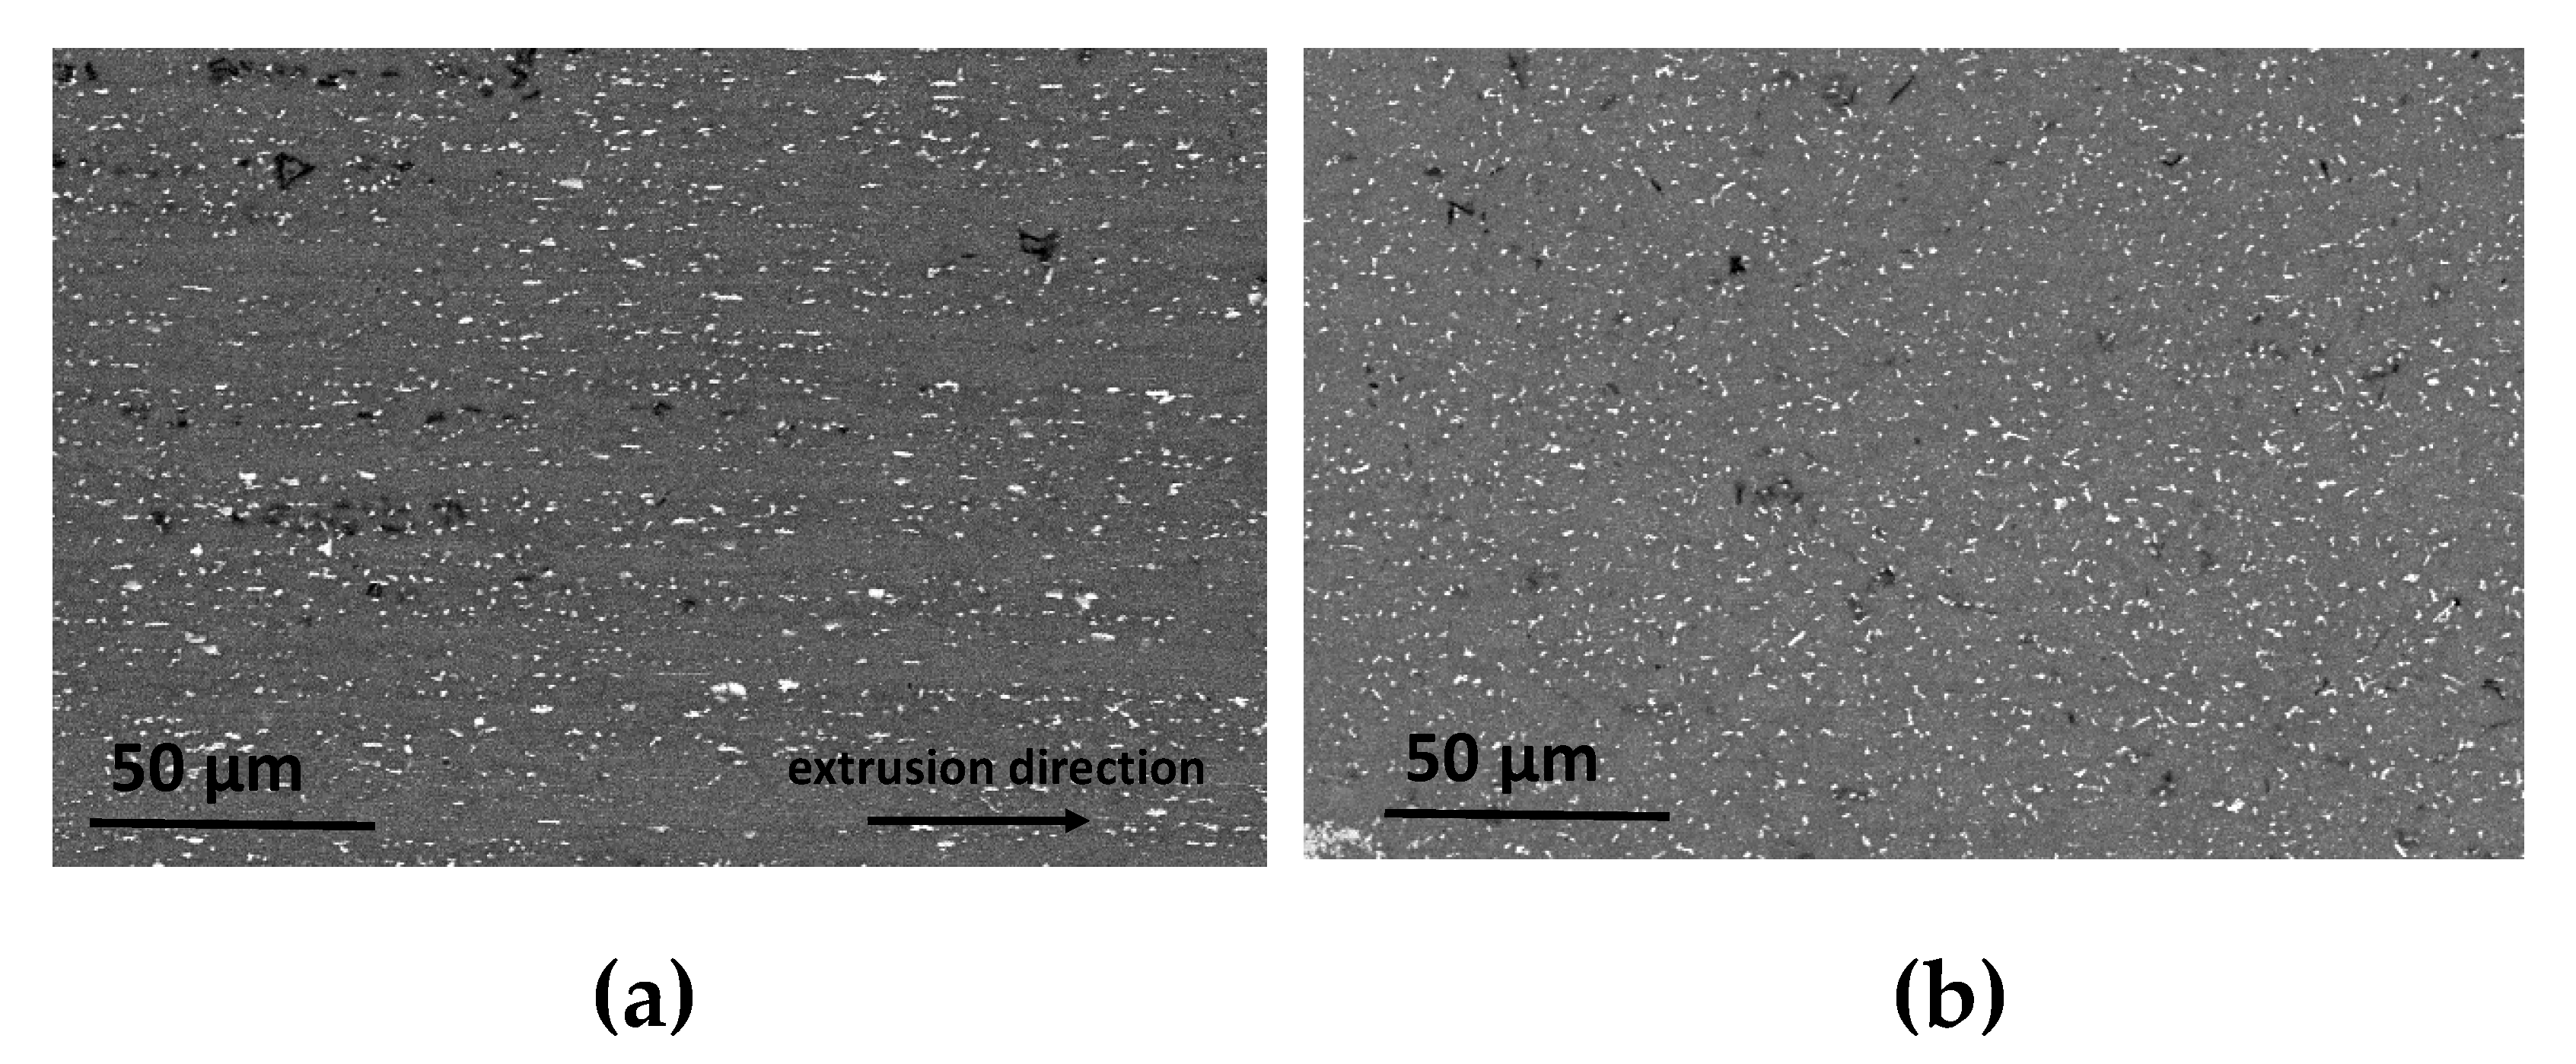
SEM images (BSE mode) of longitudinal section (a) and cross-section (b) for bar obtained from HT compact by extrusion process (heat treatment at 525 °C, 1 h; extrusion at 525 °C).
Metals 12 01046 g015
Table 1. Characteristics of powders. Aluminium and alloying elements.
PowderProviderParticle Size (µm)Purity (%)
AluminiumAEE, Upper Saddle River, NJ USA4599.9
Aluminium/Magnesium
(Al80 wt.%/Mg7.9 wt.%) atomized
Goodfellow Ltd., Huntingdon, UK<3099.0
ZincGoodfellow Ltd., Huntingdon, UKrange 1–1099.0
CopperSigma Aldrich, Madrid, Spainrange 14–2598.0
ManganeseSigma Aldrich, Madrid, Spain<4599.9
Aluminium/Lithium
(Al80 wt.%/Li20 wt.%)
Sigma Aldrich, Madrid, Spain<100-
Table 2. Parameters obtained in the extrusion of green compacts.
Temperature (°C)Force (kN)Time (s)
375227320
450163257
5257886
5755070
Table 3. Vickers hardness (HV0.5) of bars from green compacts obtained at different extrusion temperatures.
Temperature (°C)Vickers Hardness (HV0.5)
37552 ± 2
45073 ± 3
525102 ± 2
57580 ± 6
Publisher’s Note: MDPI stays neutral with regard to jurisdictional claims in published maps and institutional affiliations.

