
Erosion Layer Growth between Solid 316L Stainless Steel and Al–Li Alloy Melt

Abstract
:1. Introduction
2. Experimental
2.1. Material Preparation
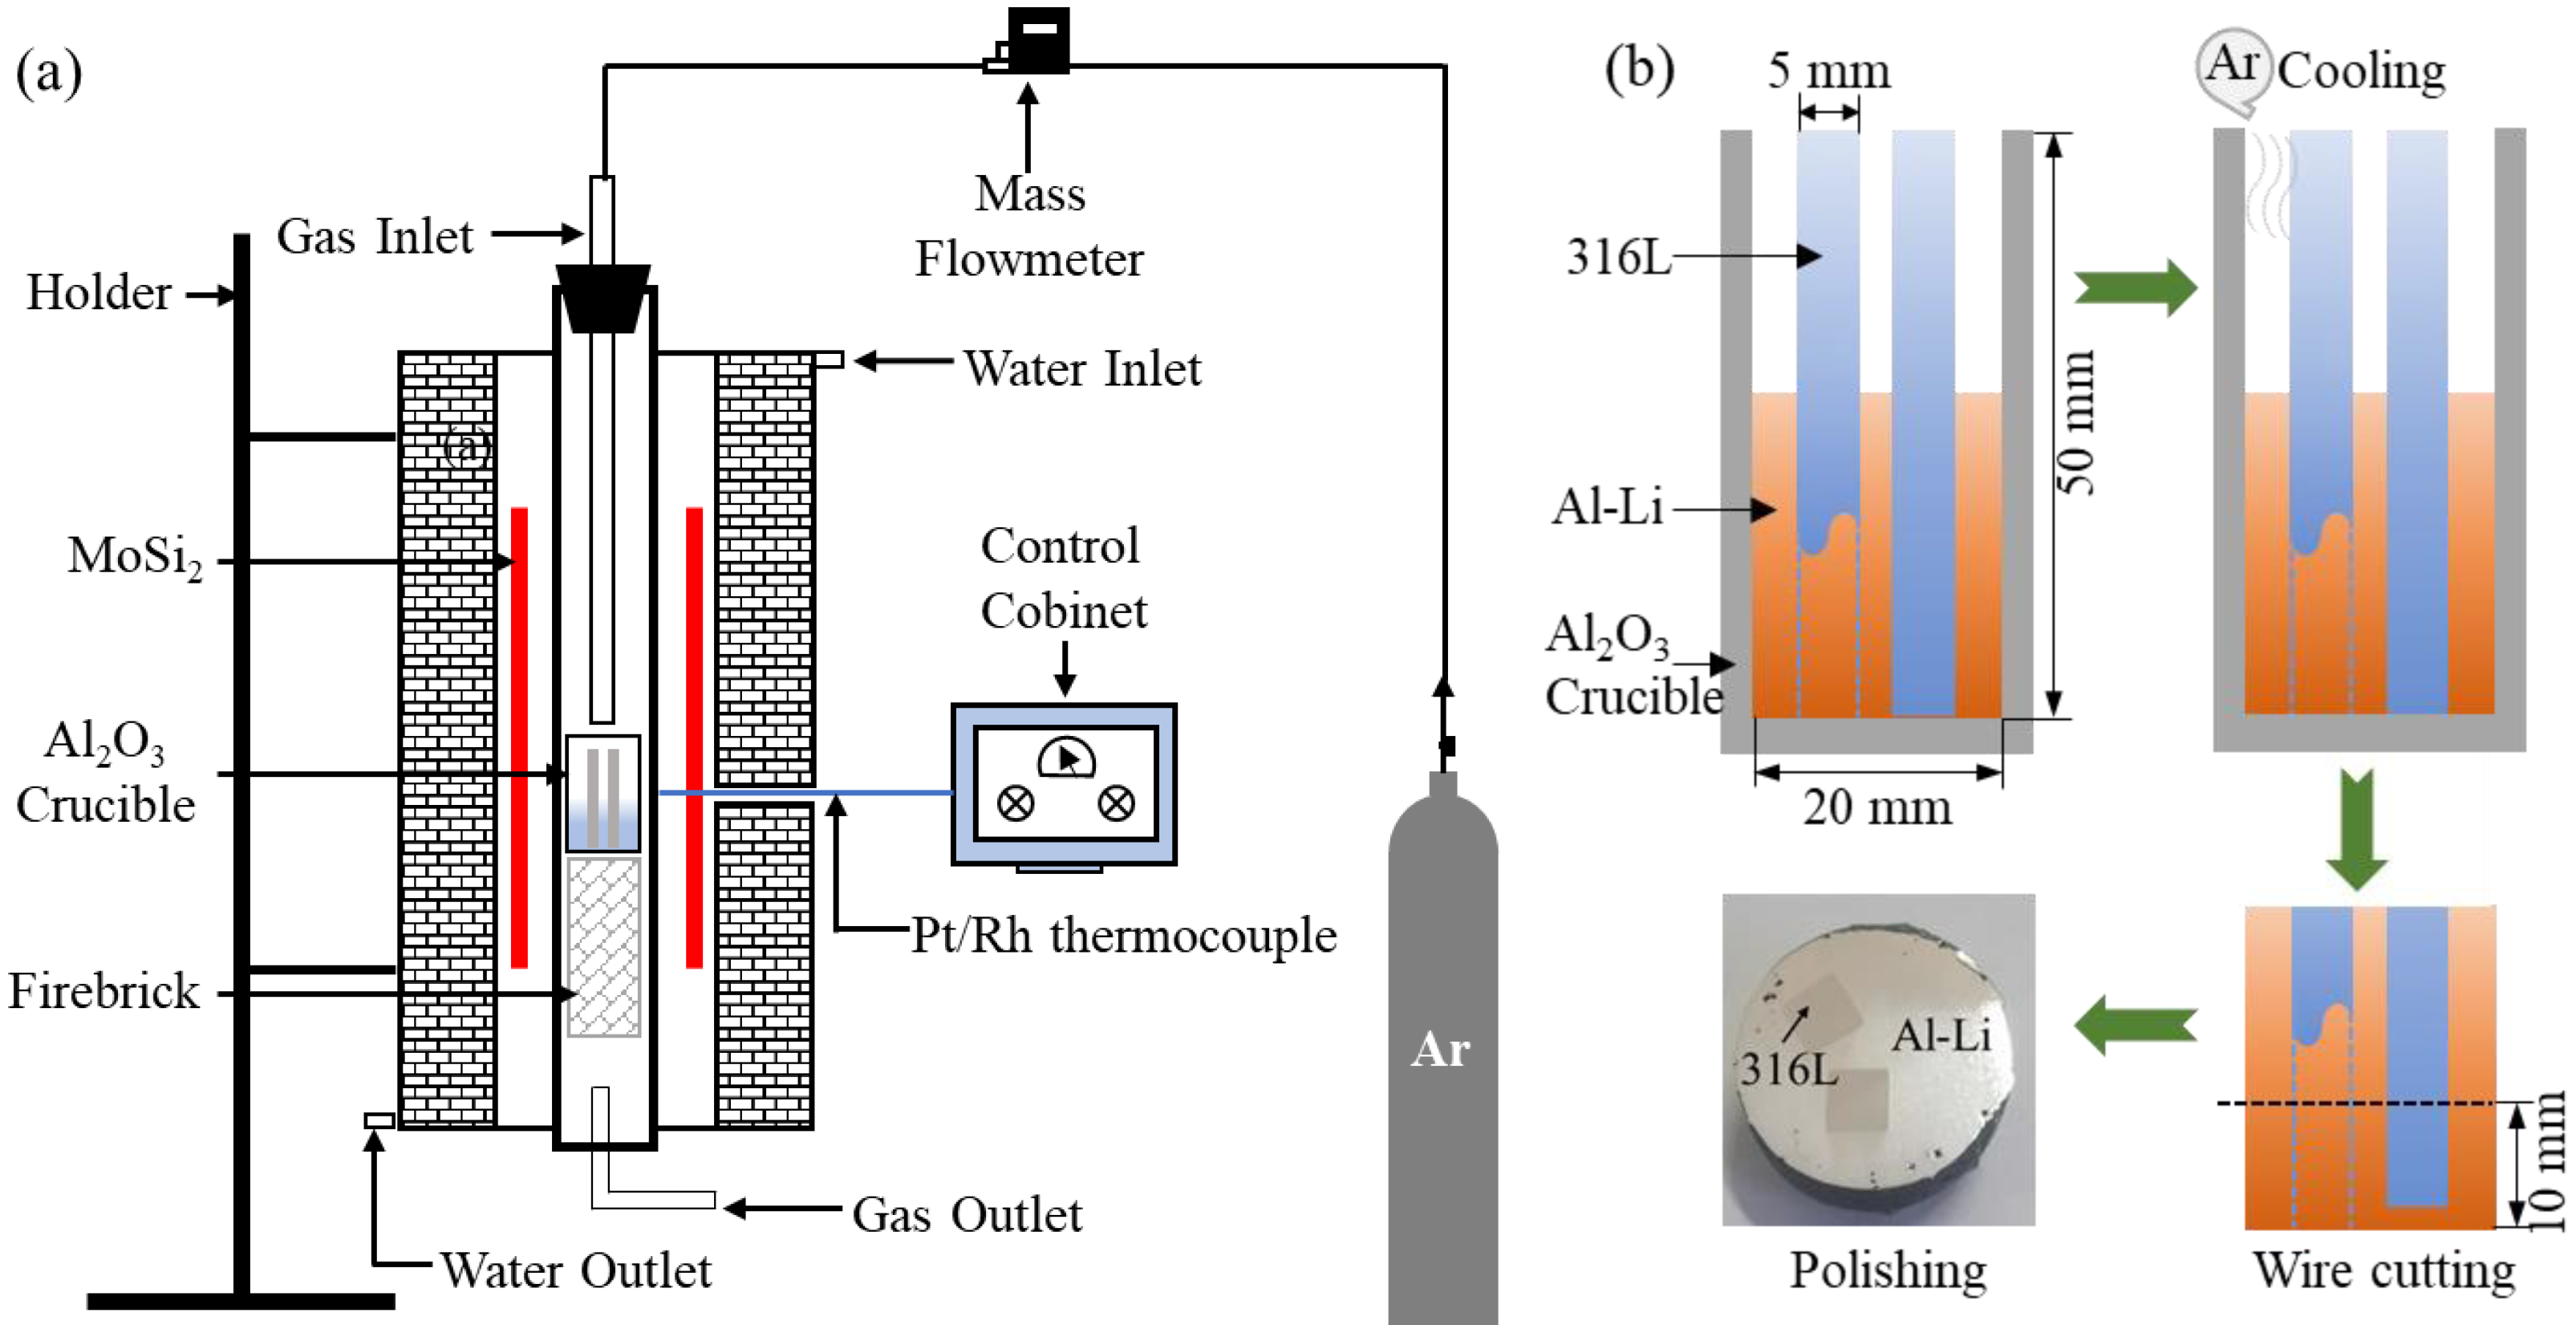
2.2. Procedures
3. Results and Discussion
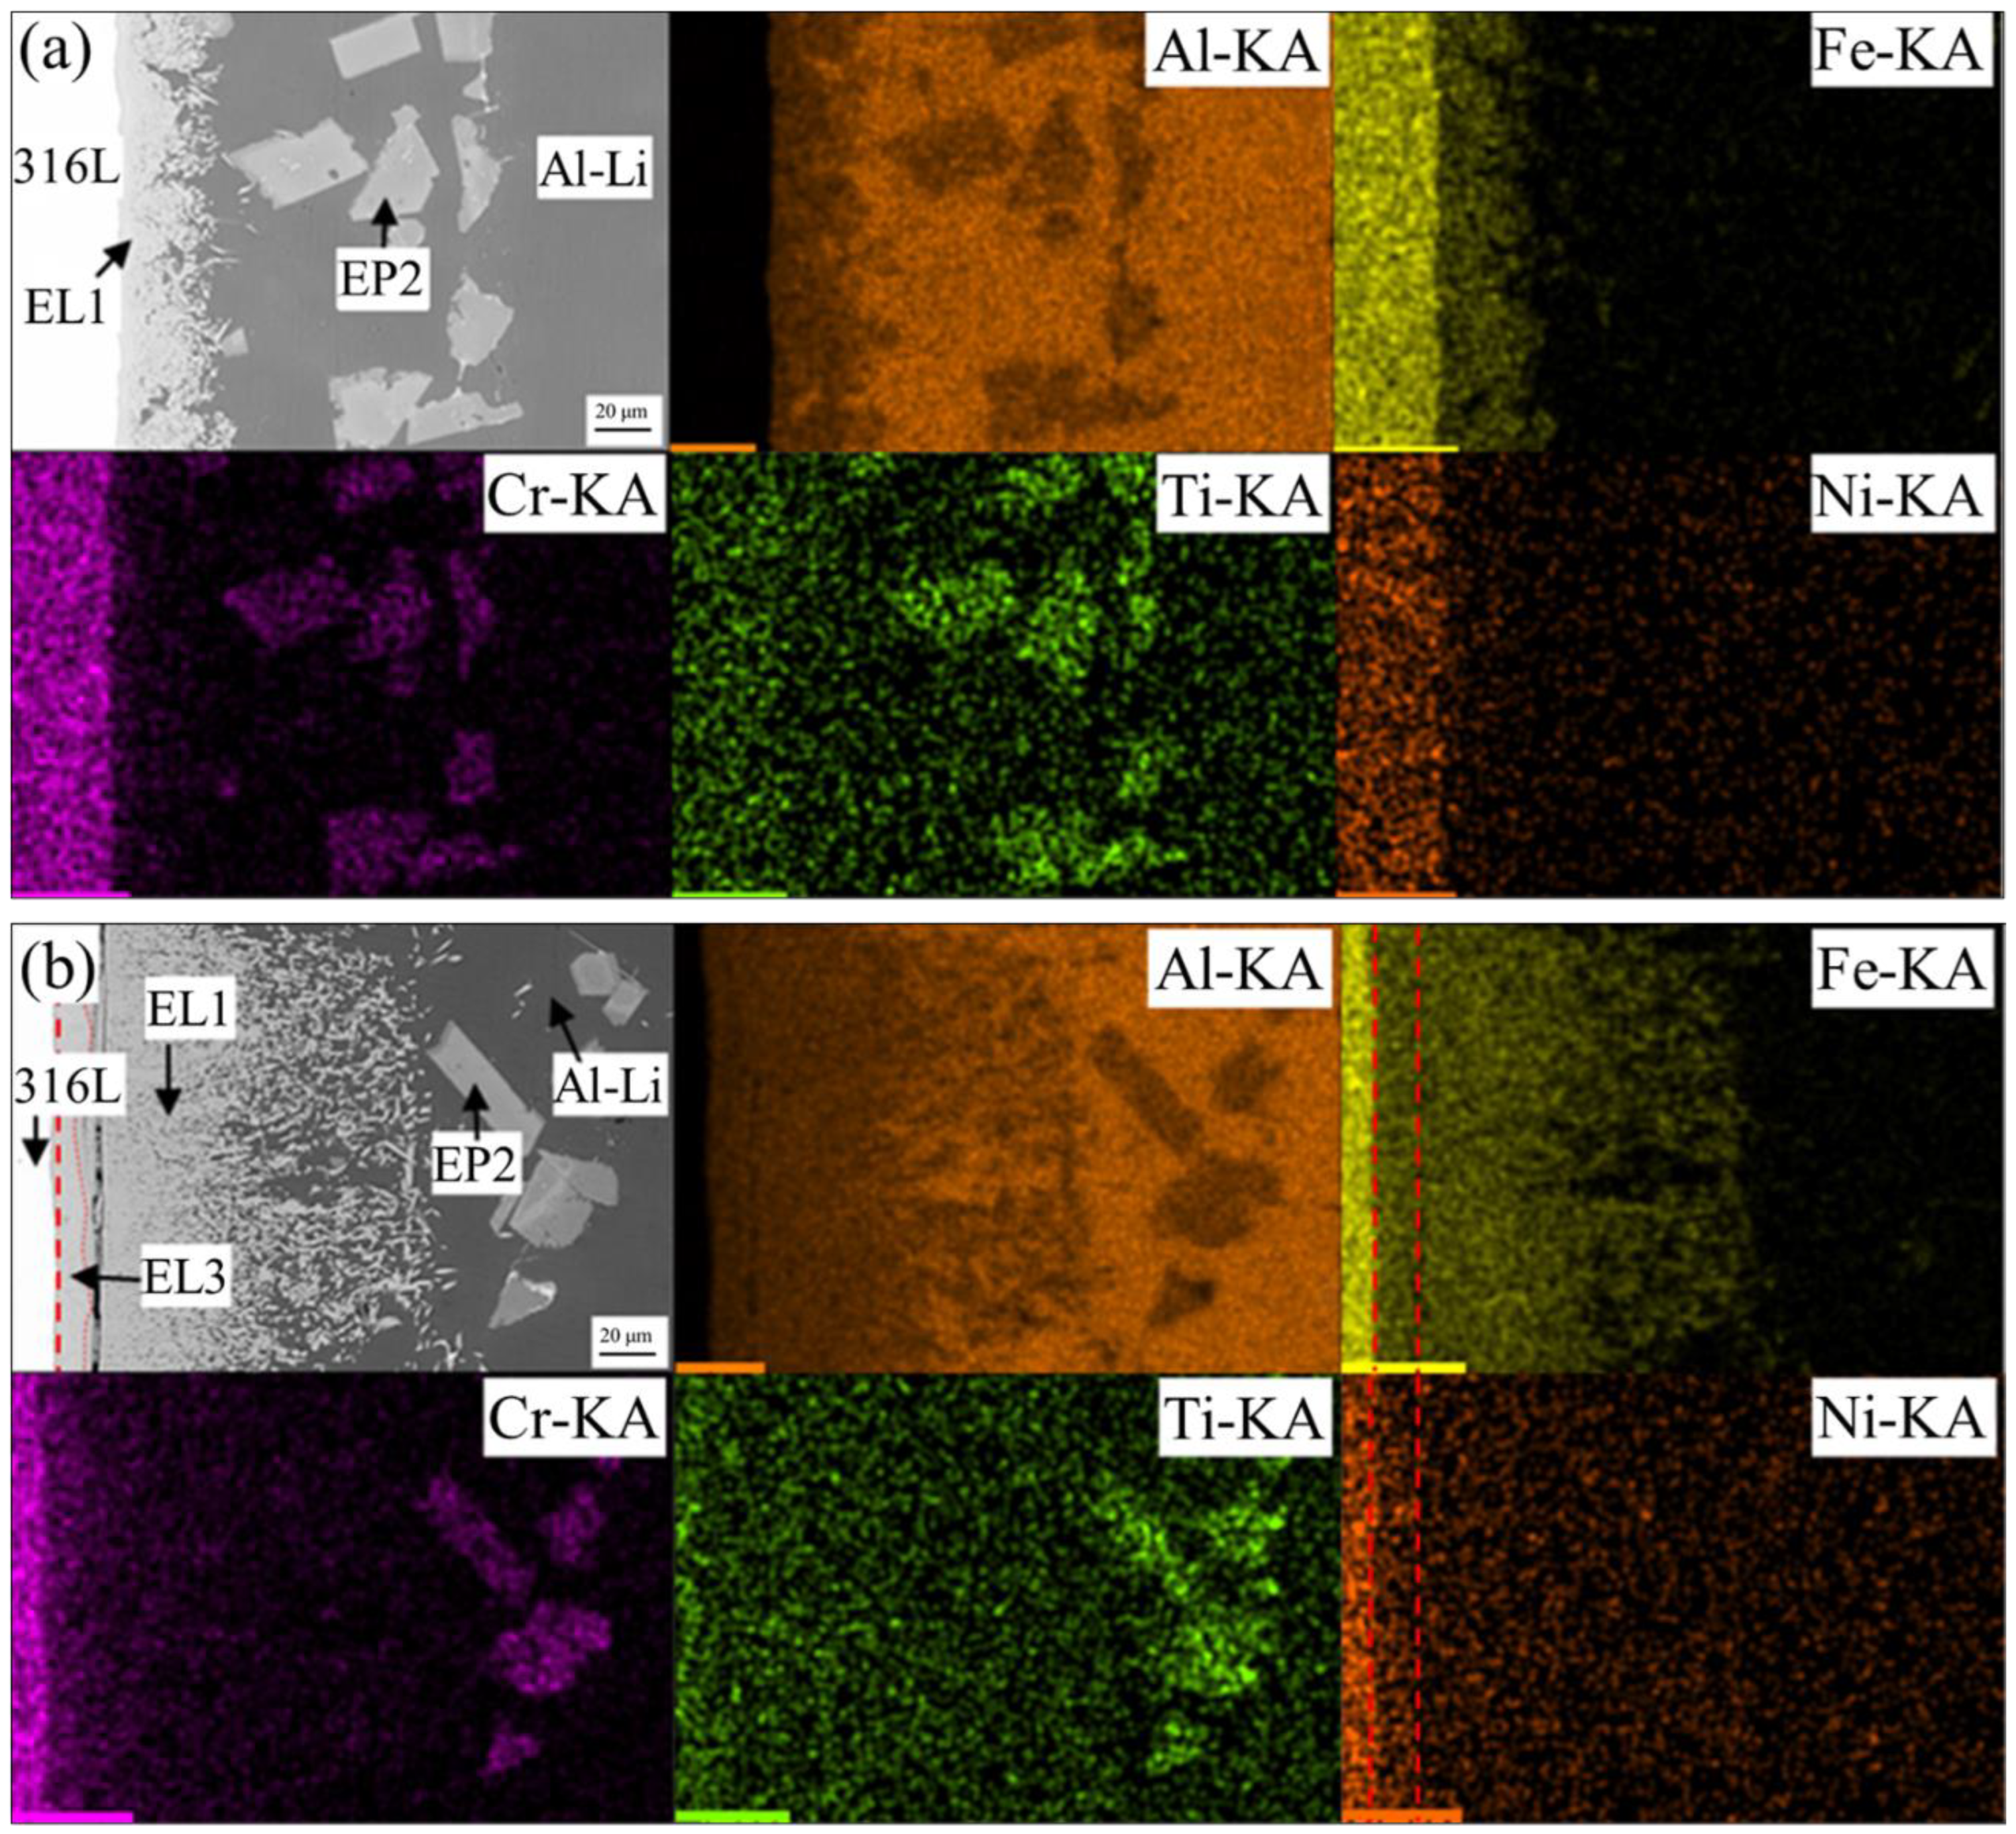
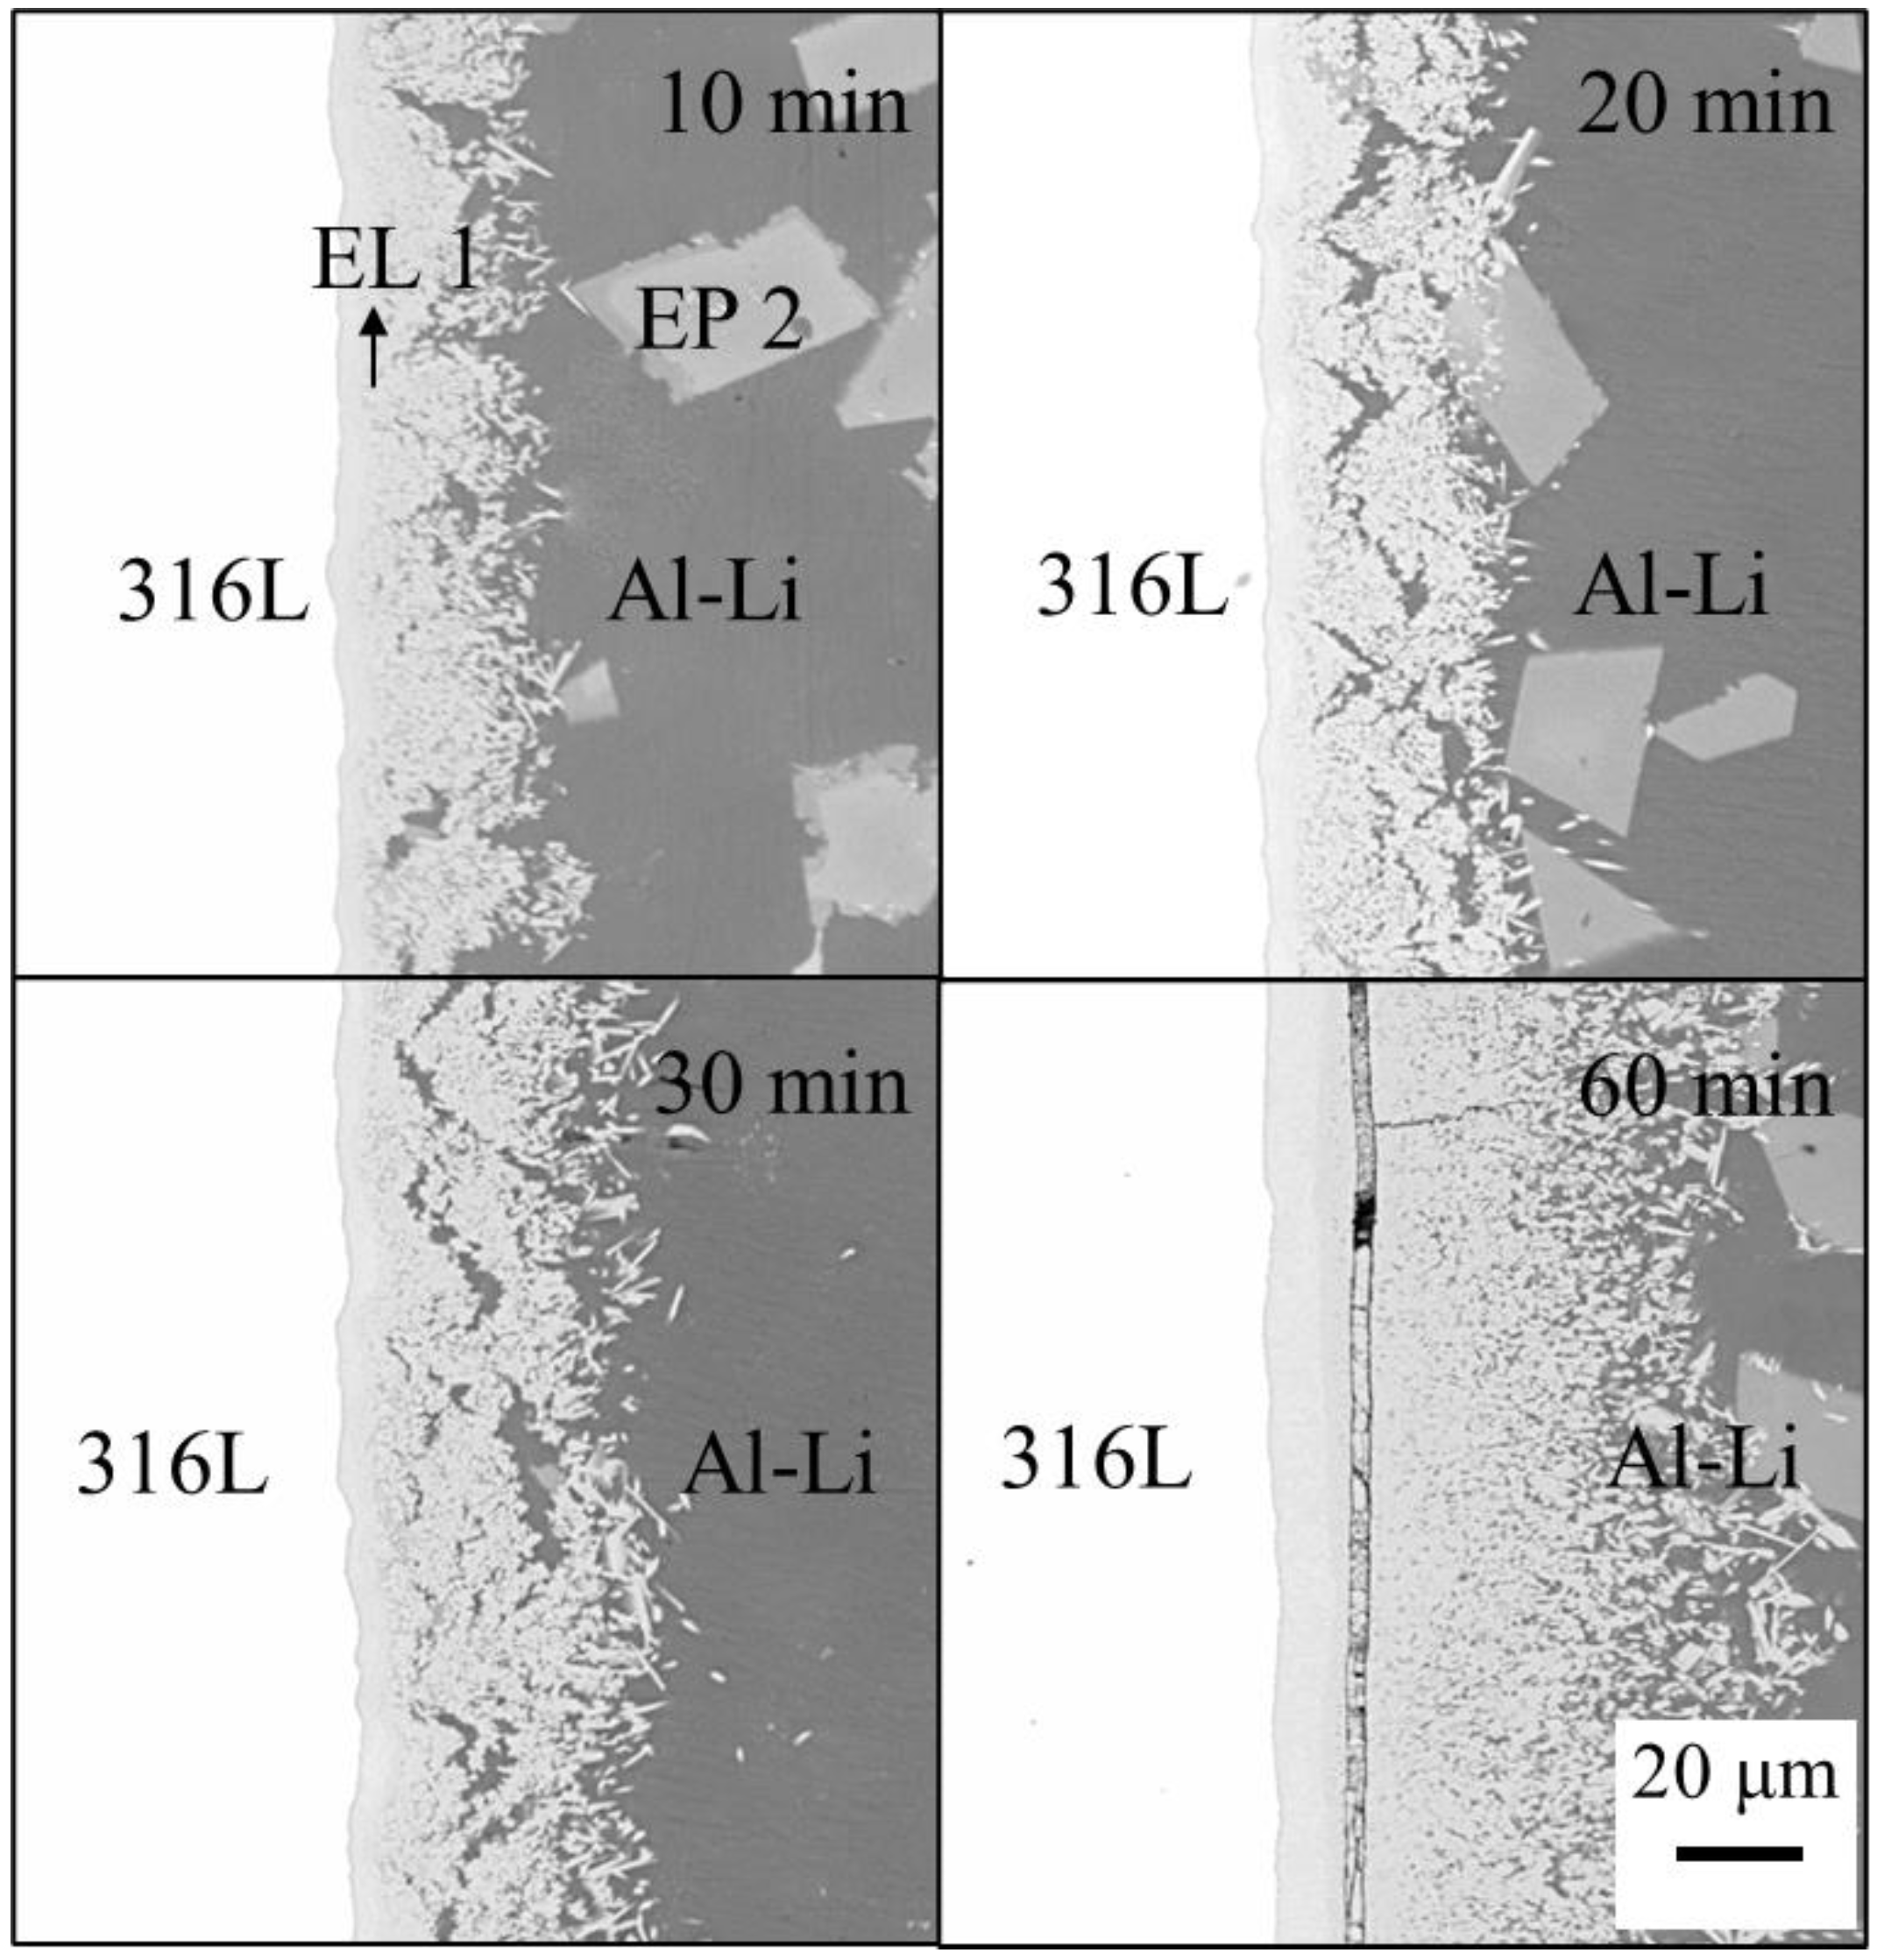
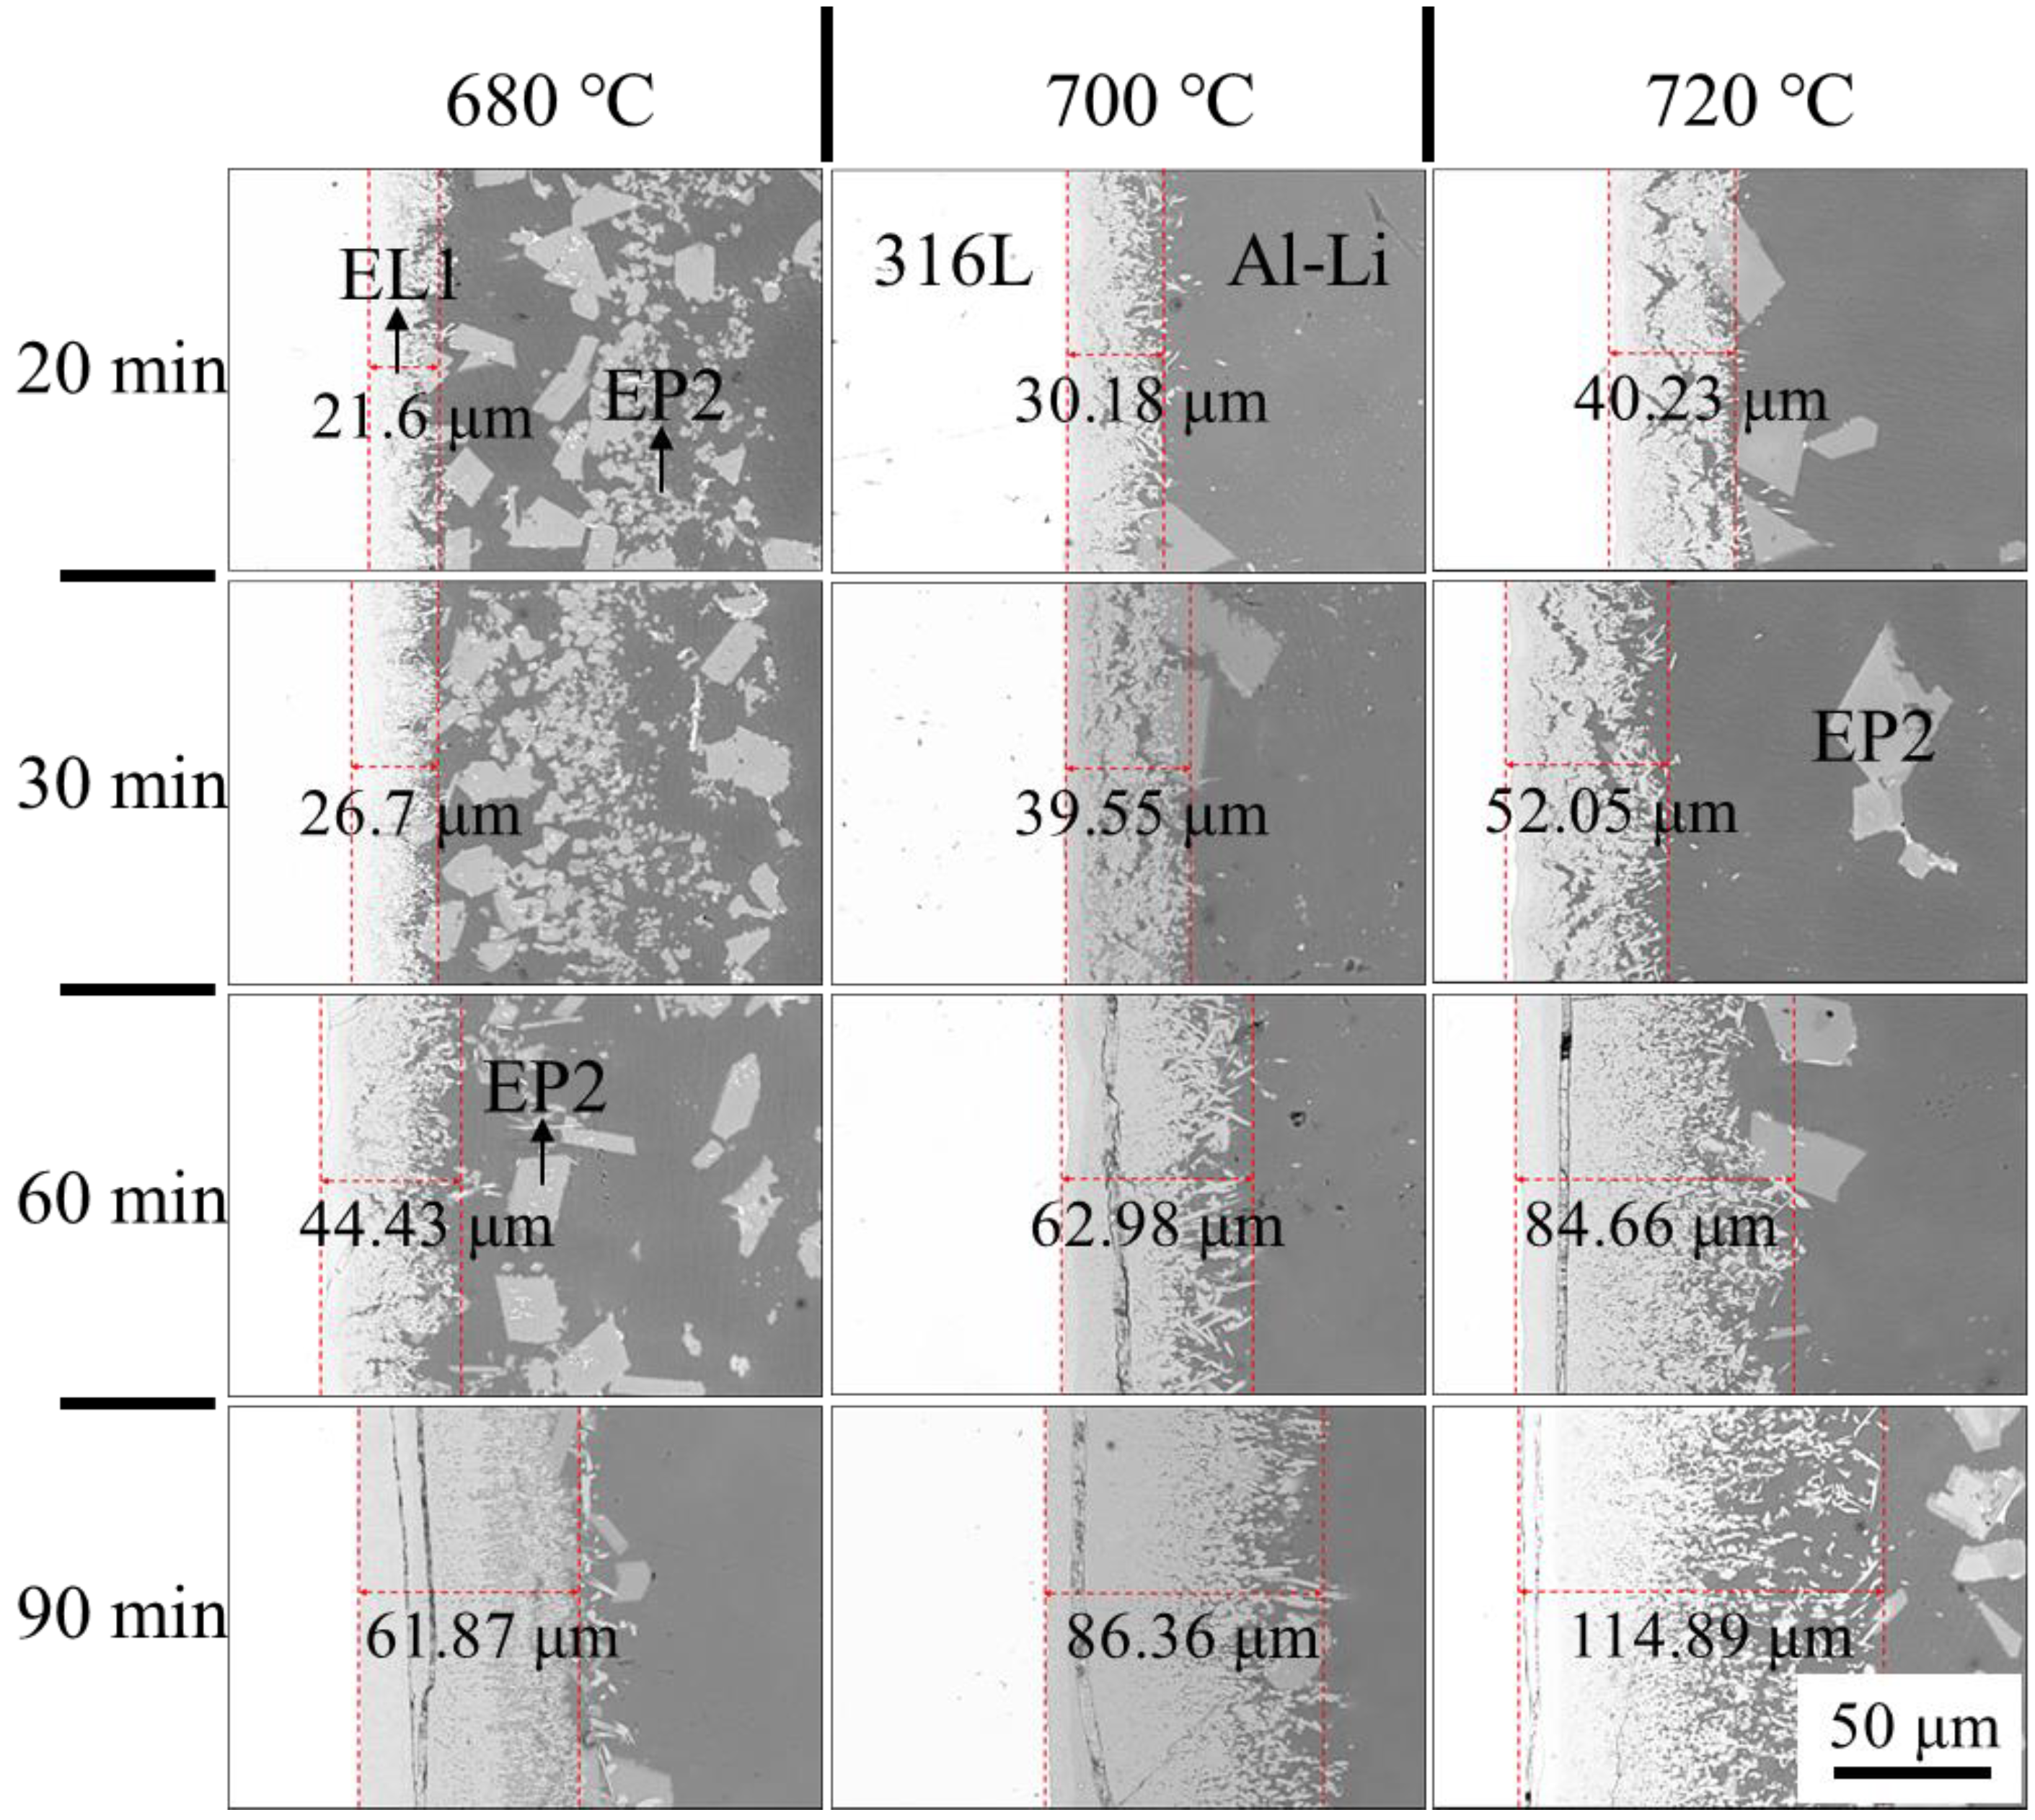
3.1. Microstructure and Composition of Erosion Layer
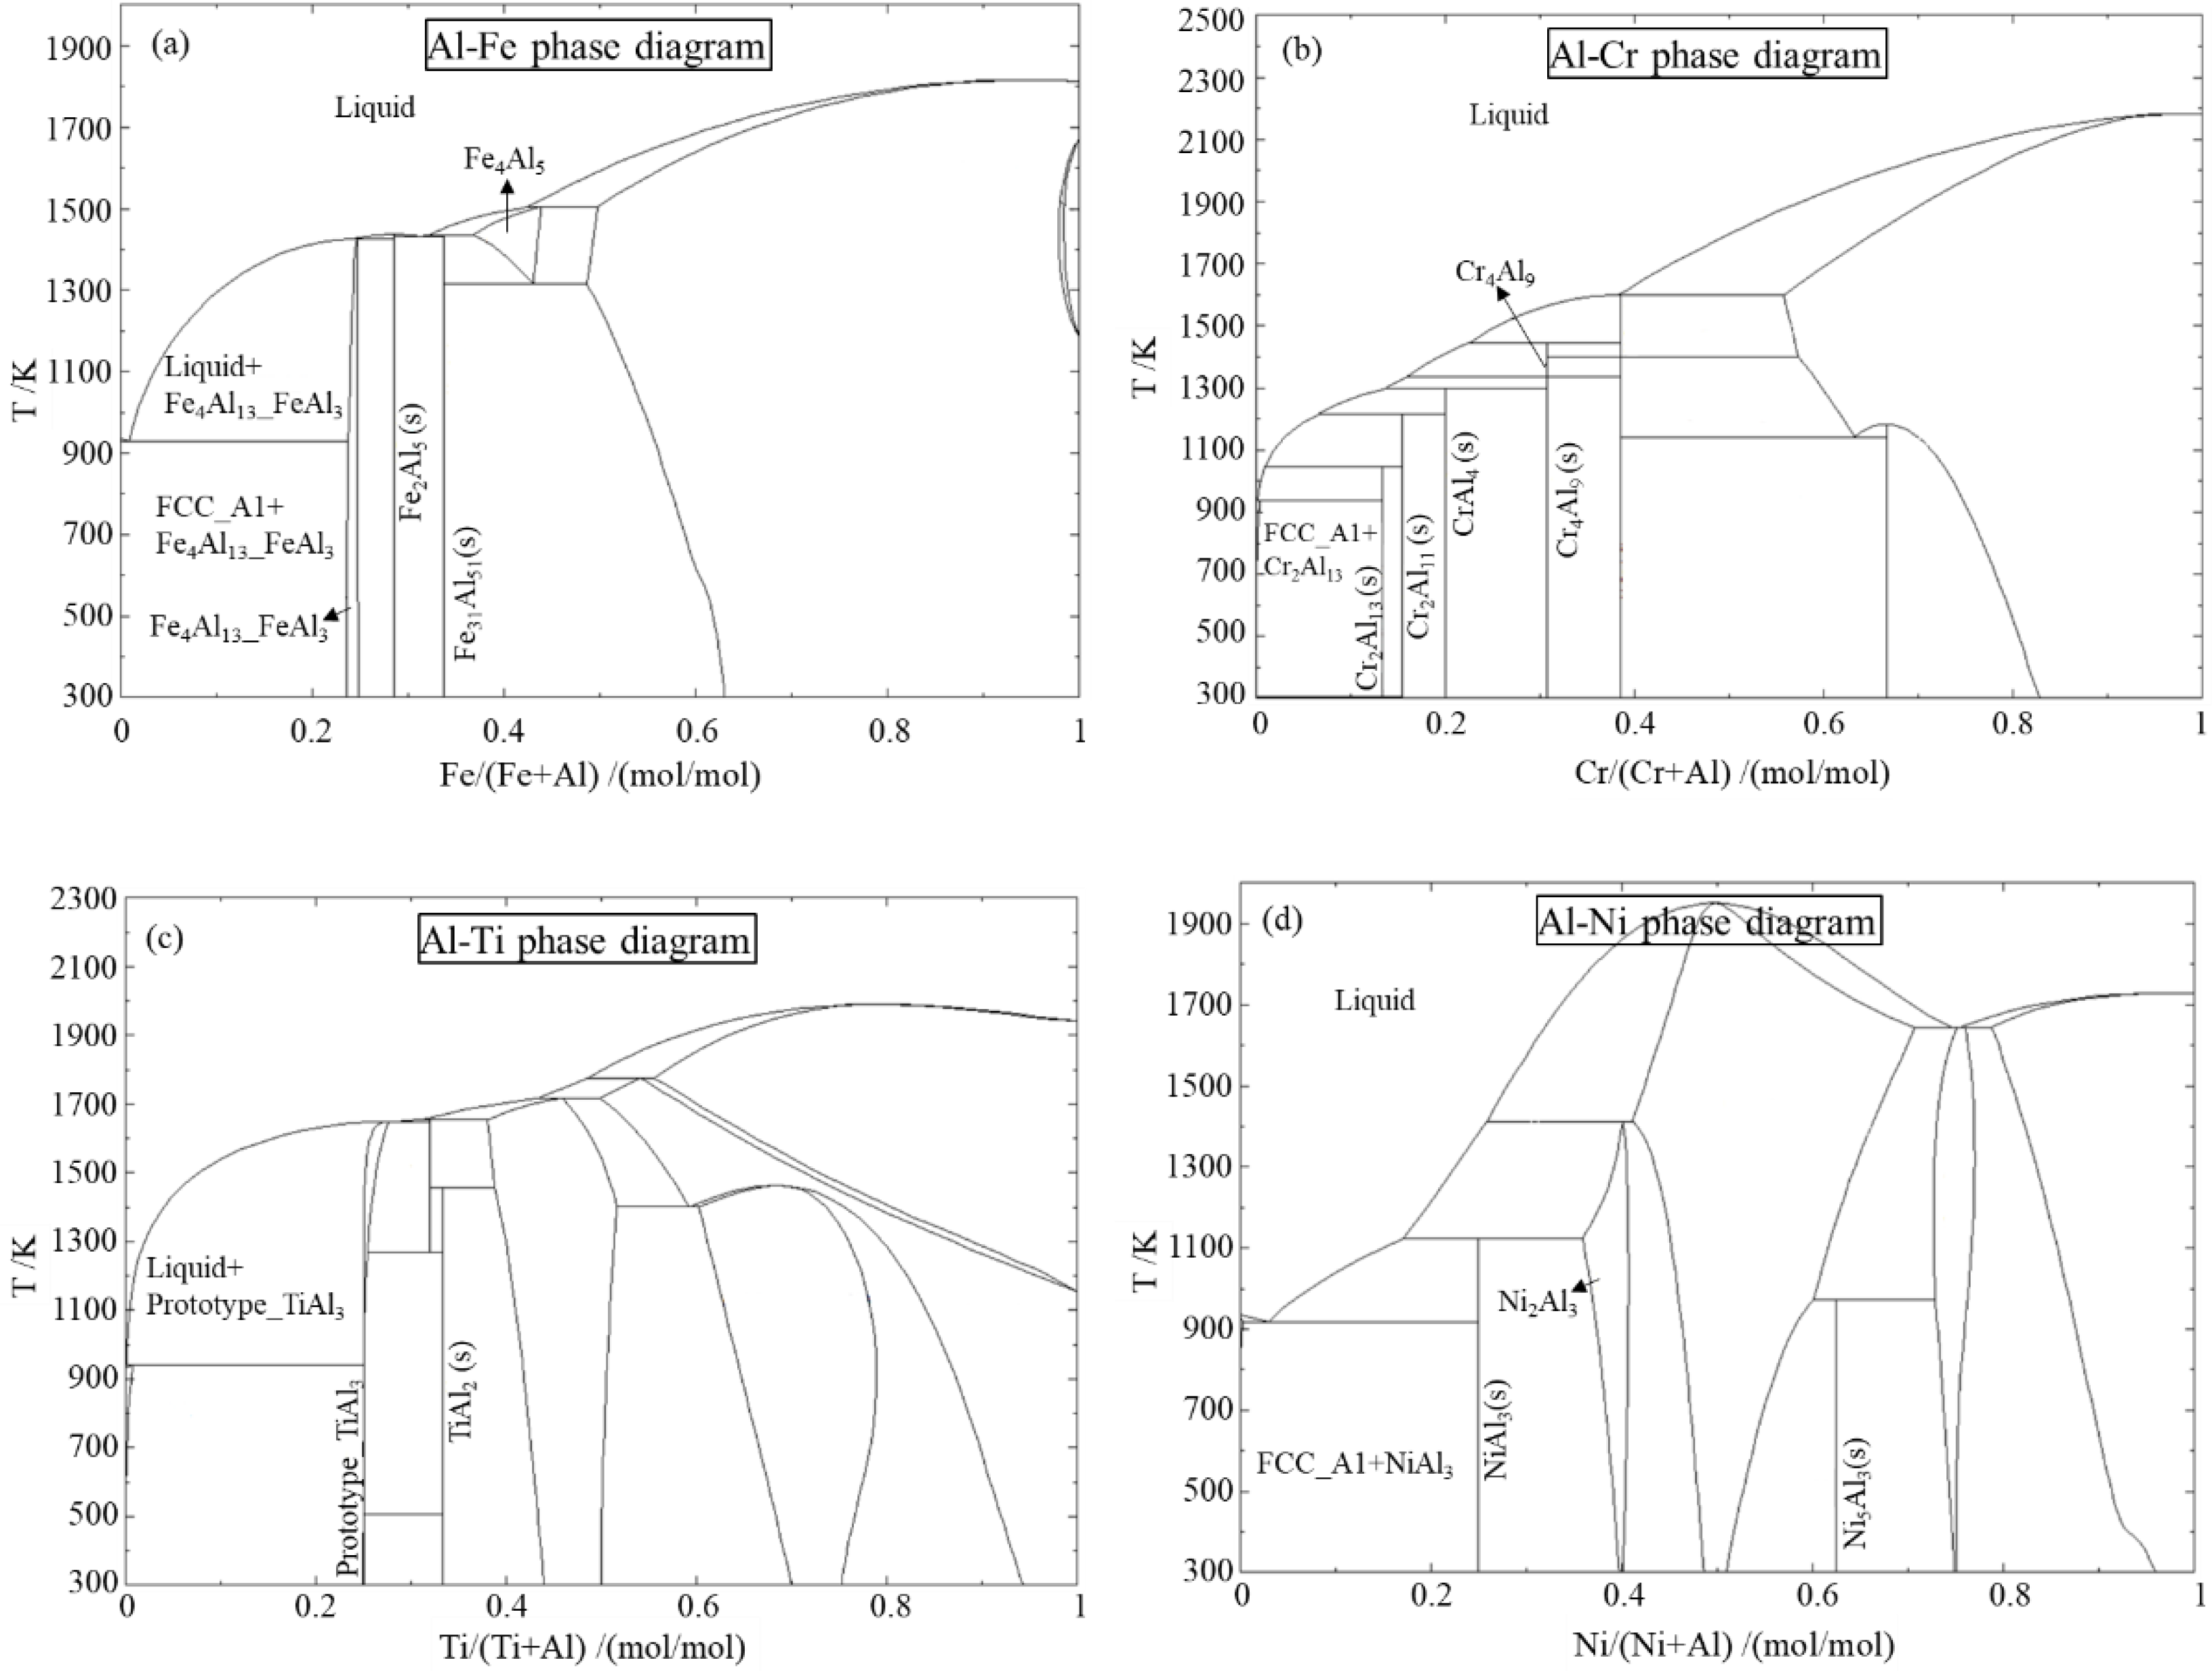
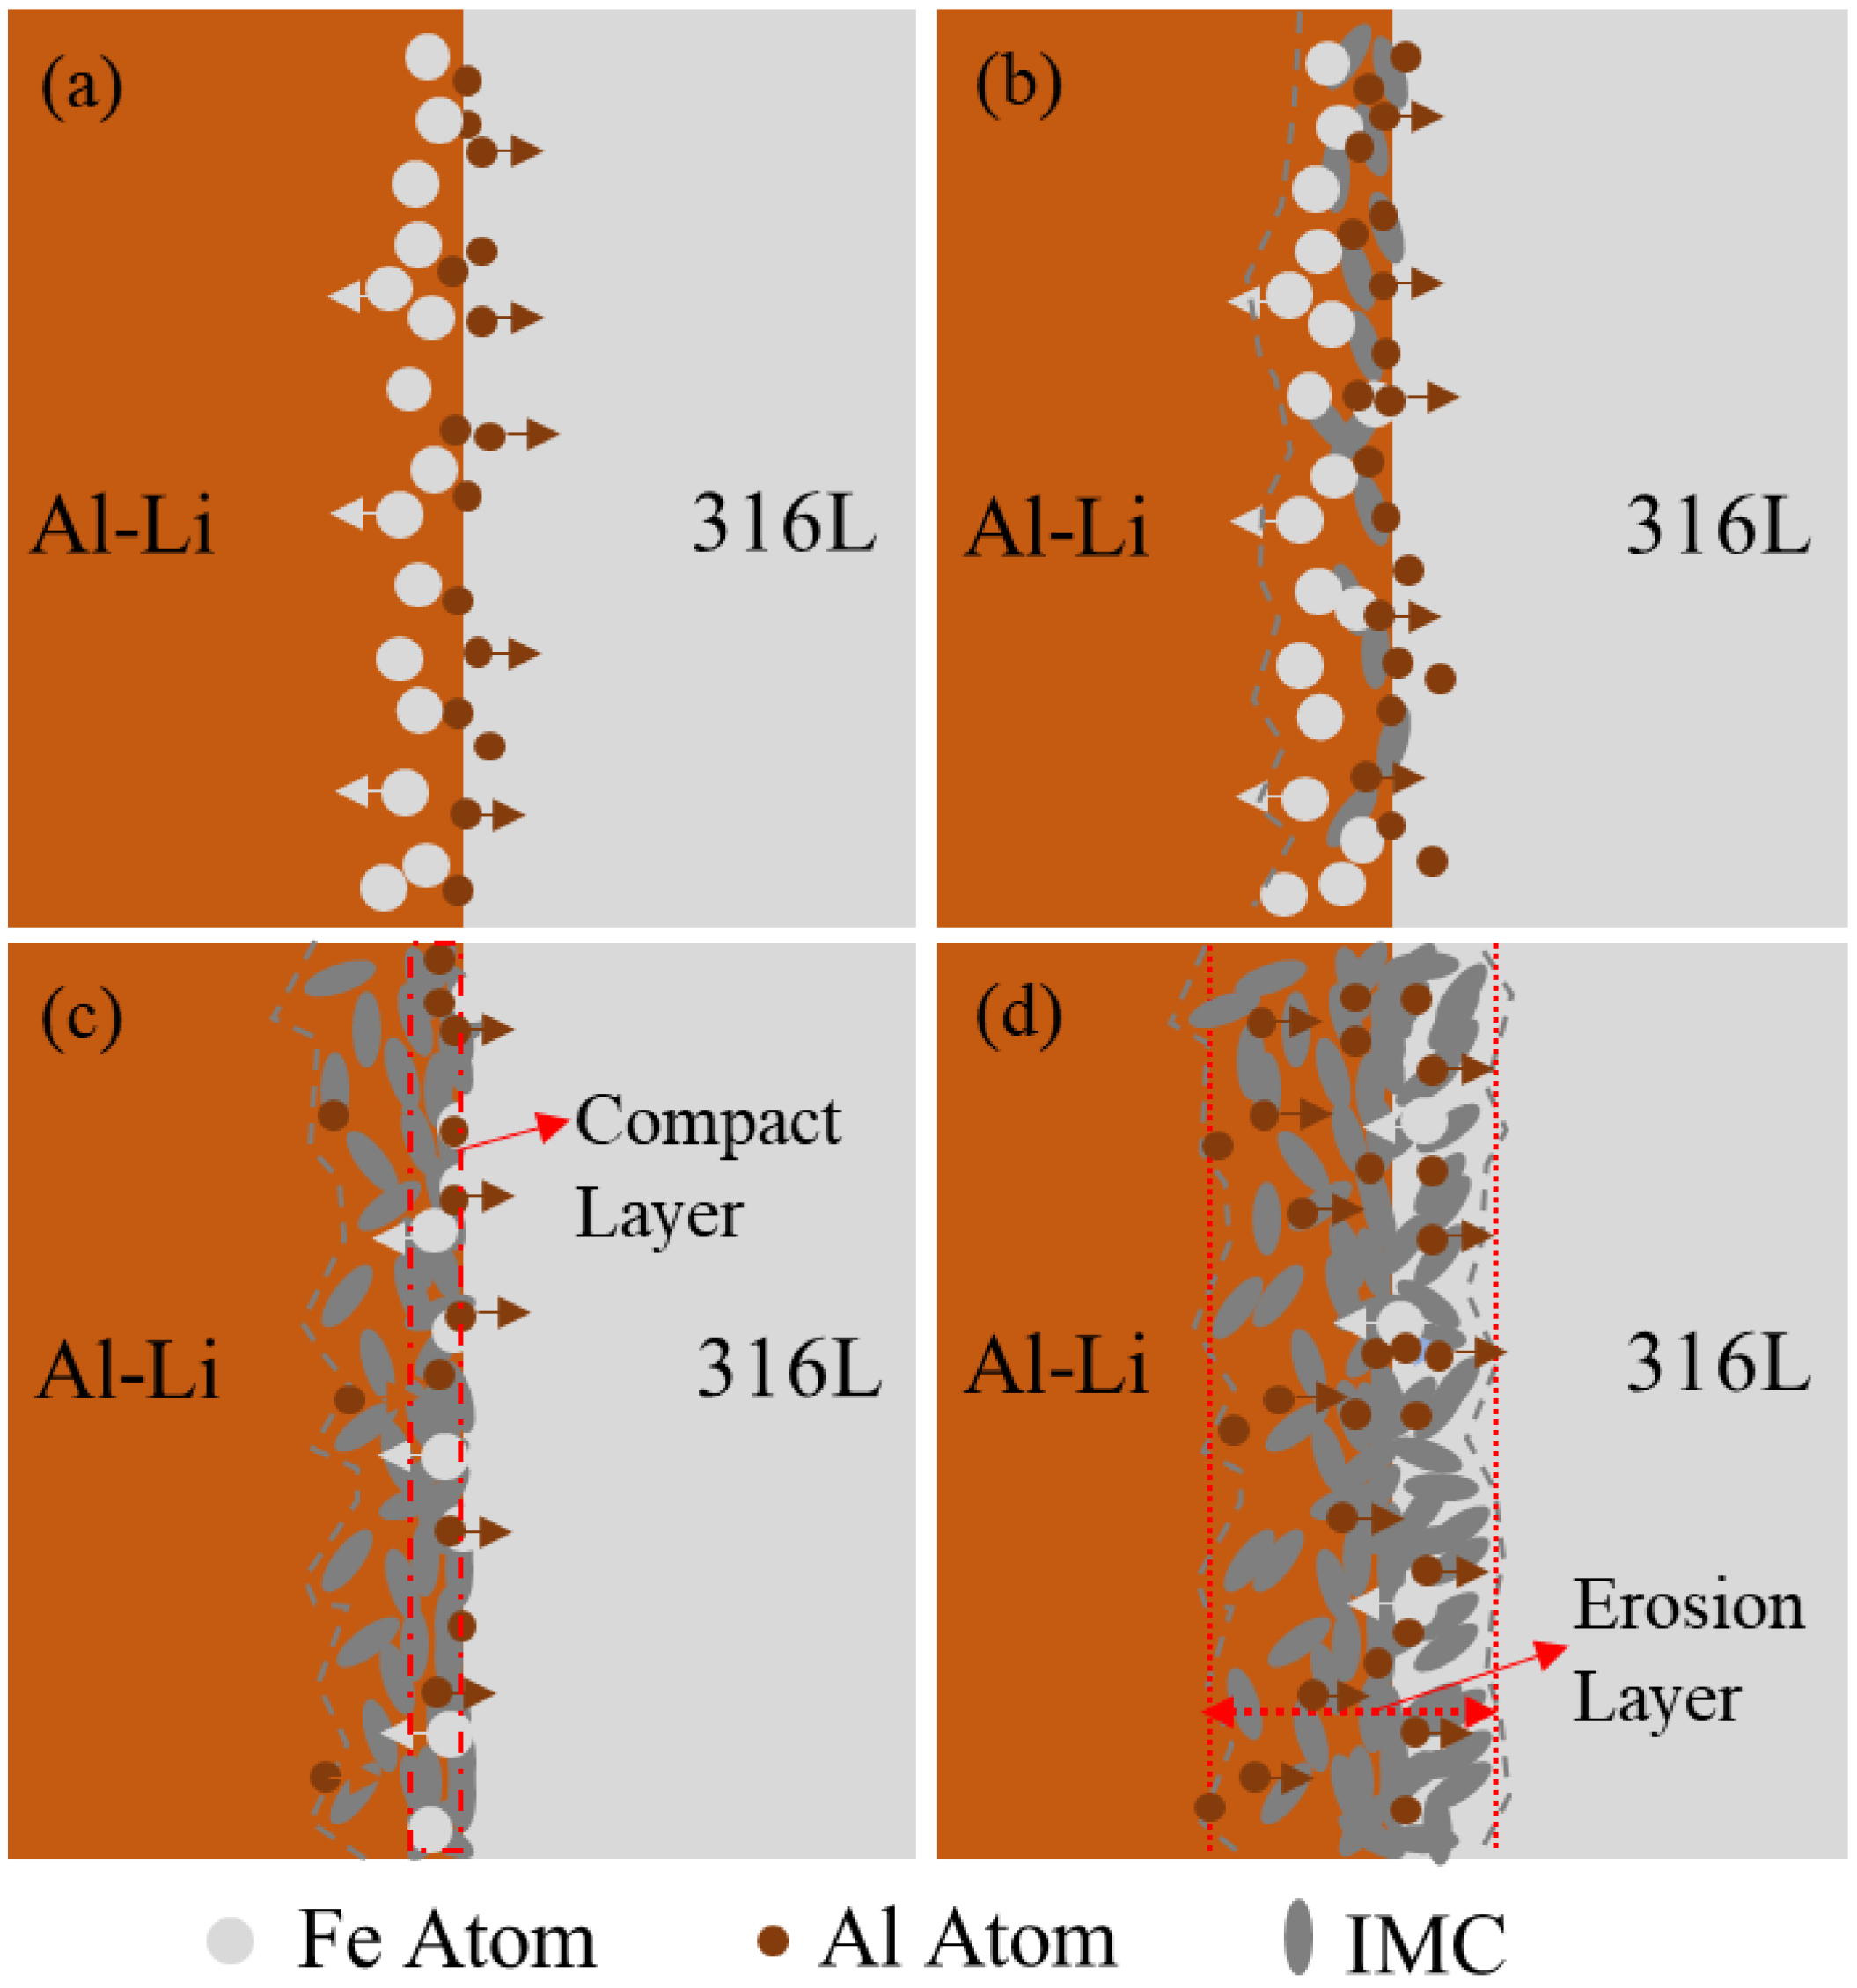
3.2. Formation Mechanism of Fe-Containing Erosion Layer
3.3. Formation Mechanism of Cr/Ti Erosion Layer
4. Conclusions
Author Contributions
Funding
Institutional Review Board Statement
Informed Consent Statement
Data Availability Statement
Conflicts of Interest
References
- Kim, N.J.; Lee, E.W. Effect of T1 precipitate on the anisotropy of Al–Li alloy 2090. Acta Metall. Mater. 1993, 41, 941–948. [Google Scholar] [CrossRef]
- Rioja, R.J. Fabrication methods to manufacture isotropic Al–Li alloys and products for space and aerospace applications. Mater. Sci. Eng. A 1998, 257, 100–107. [Google Scholar] [CrossRef]
- Su, J.X.; Zhang, Z.; Cao, F.H.; Zhang, J.Q.; Cao, C.N. Exfoliation corrosion behavior of T6 treated 2090 Al–Li alloy in EXCO solution and EIS during exfoliation corrosion evolution. Acta Metall. Sin. 2005, 41, 974–978. [Google Scholar]
- Xu, Y.B.; Zhong, W.L.; Chen, Y.J.; Shen, L.T.; Liu, Q.; Bai, Y.L.; Meyers, M.A. Shear localization and recrystallization in dynamic deformation of 8090 Al–Li alloy. Mater. Sci. Eng. A 2001, 299, 287–295. [Google Scholar] [CrossRef]
- Lavernia, E.J.; Grant, N.J. Aluminum-lithium alloys. J. Mater. Sci. 1987, 22, 1521–1529. [Google Scholar] [CrossRef]
- Du, Y.X.; Zhang, X.M.; Ye, L.Y.; Liu, S.D. Evolution of grain structure in AA2195 Al–Li alloy plate during recrystallization. Trans. Nonferrous Met. Soc. China 2006, 16, 321–326. [Google Scholar] [CrossRef]
- Lloyd, D.J.; Court, S.A. Influence of grain size on tensile properties of Al-Mg alloys. Mater. Sci. Technol. 2003, 19, 1349–1354. [Google Scholar] [CrossRef]
- Osório, W.R.; Cheung, N.; Spinelli, J.E.; Goulart, P.R.; Garcia, A. The effects of a eutectic modifier on microstructure and surface corrosion behavior of Al-Si hypoeutectic alloys. J. Solid State Electrochem. 2007, 11, 1421–1427. [Google Scholar] [CrossRef]
- Bonatti, R.S.; Meyer, Y.A.; Bortolozo, A.D.; Costa, D.; Osório, W.R. Morphology and size effects on densification and mechanical behavior of sintered powders from Al-Si and Al-Cu casting alloys. J. Alloys Compound. 2019, 786, 717–732. [Google Scholar] [CrossRef]
- Meyer, Y.A.; Bonatti, R.S.; Costa, D.; Bortolozo, A.D.; Osório, W.R. Compaction pressure and Si content effects on compressive strengths of Al-Si/Cu alloy composites. Mater. Sci. Eng. A 2020, 770, 138547. [Google Scholar] [CrossRef]
- Rioja, R.J.; Liu, J. The evolution of Al–Li base products for aerospace and space applications. Metall. Mater. Trans. A 2012, 43, 3325–3337. [Google Scholar] [CrossRef]
- Akhtar, N.; Akhtar, W.; Wu, S.J. Melting and casting of lithium containing aluminum alloys. Int. J. Cast Met. Res. 2015, 28, 1–8. [Google Scholar] [CrossRef]
- Liu, L.H.; Che, C.S.; Kong, G.; Lu, J.T.; Zhang, S.H. Destabilization mechanism of Fe-Al inhibition layer in Zn-0.2% Al hot-dip galvanizing coating and related thermodynamic evaluation. Acta Metall. Sin. 2016, 52, 614–624. [Google Scholar]
- Kattner, U.R.; Lin, J.C.; Chang, Y.A. Thermodynamic assessment and calculation of the Ti-Al system. Metall. Trans. A 1992, 23, 2081–2090. [Google Scholar] [CrossRef]
- Xu, L.; Cui, Y.Y.; Hao, Y.L.; Yang, R. Growth of intermetallic layer in multi-laminated Ti/Al diffusion couples. Mater. Sci. Eng. A 2006, 435, 638–647. [Google Scholar] [CrossRef]
- Zhang, L.J.; Wang, J.; Du, Y.; Hu, R.X.; Nash, P.; Lu, X.G.; Jiang, C. Thermodynamic properties of the Al-Fe-Ni system acquired via a hybrid approach combining calorimetry, first-principles and CALPHAD. Acta Mater. 2009, 57, 5324–5341. [Google Scholar] [CrossRef]
- Bouche, K.; Barbier, F.; Coulet, A. Intermetallic compound layer growth between solid iron and molten aluminum. Mater. Sci. Eng. A 1998, 249, 167–175. [Google Scholar] [CrossRef]
- Jindal, V.; Srivastava, V.C.; Das, A.; Ghosh, R.N. Reactive diffusion in the roll bonded iron-aluminum system. Mater. Lett. 2006, 60, 1758–1761. [Google Scholar] [CrossRef]
- Jiang, S.Y.; Li, S.C.; Zhang, L. Microstructure evolution of Al-Ti liquid–solid interface. Trans. Nonferrous Met. Soc. China 2013, 23, 3545–3552. [Google Scholar] [CrossRef]
- Jiang, S.Y.; Li, S.C. Formation mechanism and prediction of new phases in binary metallic liquid/solid interface. Rare Met. 2011, 30, 486–491. [Google Scholar] [CrossRef]
- Wang, F.Y.; Wang, X.J.; Yan, Q.; Cui, J.Z. Corrosion behavior of TC4 titanium alloys in Al–Li alloy melt. Metals 2021, 11, 794. [Google Scholar] [CrossRef]


| Sample | Al | Li | Cu | Ti | Zn | Mg | |||
| Al–Li | 91.59 | 2.34 | 4.67 | 0.07 | 0.77 | 0.56 | |||
| Sample | Fe | Cr | Ni | Mo | Mn | Ti | Si | S | C |
| 316L | 68.75 | 17.28 | 10.62 | 1.94 | 1.30 | <0.01 | 0.11 | <0.01 | 0.03 |
| Layer | Al | Fe | Cr | Ti | Ni | |
|---|---|---|---|---|---|---|
| Figure 2a (20 min) | EL 1 | 81.07 | 14.78 | 4.15 | - | - |
| EP 2 | 91.32 | - | 6.09 | 2.59 | - | |
| Figure 2b (90 min) | EL 1 | 81.29 | 14.59 | 4.12 | - | - |
| EP 2 | 91.68 | - | 6.05 | 2.27 | - | |
| EL 3 | 72.57 | 20.55 | 4.81 | - | 2.07 | |
| T/°C | d/μm | |||
|---|---|---|---|---|
| 20 min | 30 min | 60 min | 90 min | |
| 680 | 21.60 | 26.70 | 44.43 | 61.87 |
| 700 | 30.18 | 39.55 | 62.98 | 86.36 |
| 720 | 40.23 | 52.05 | 84.66 | 114.89 |
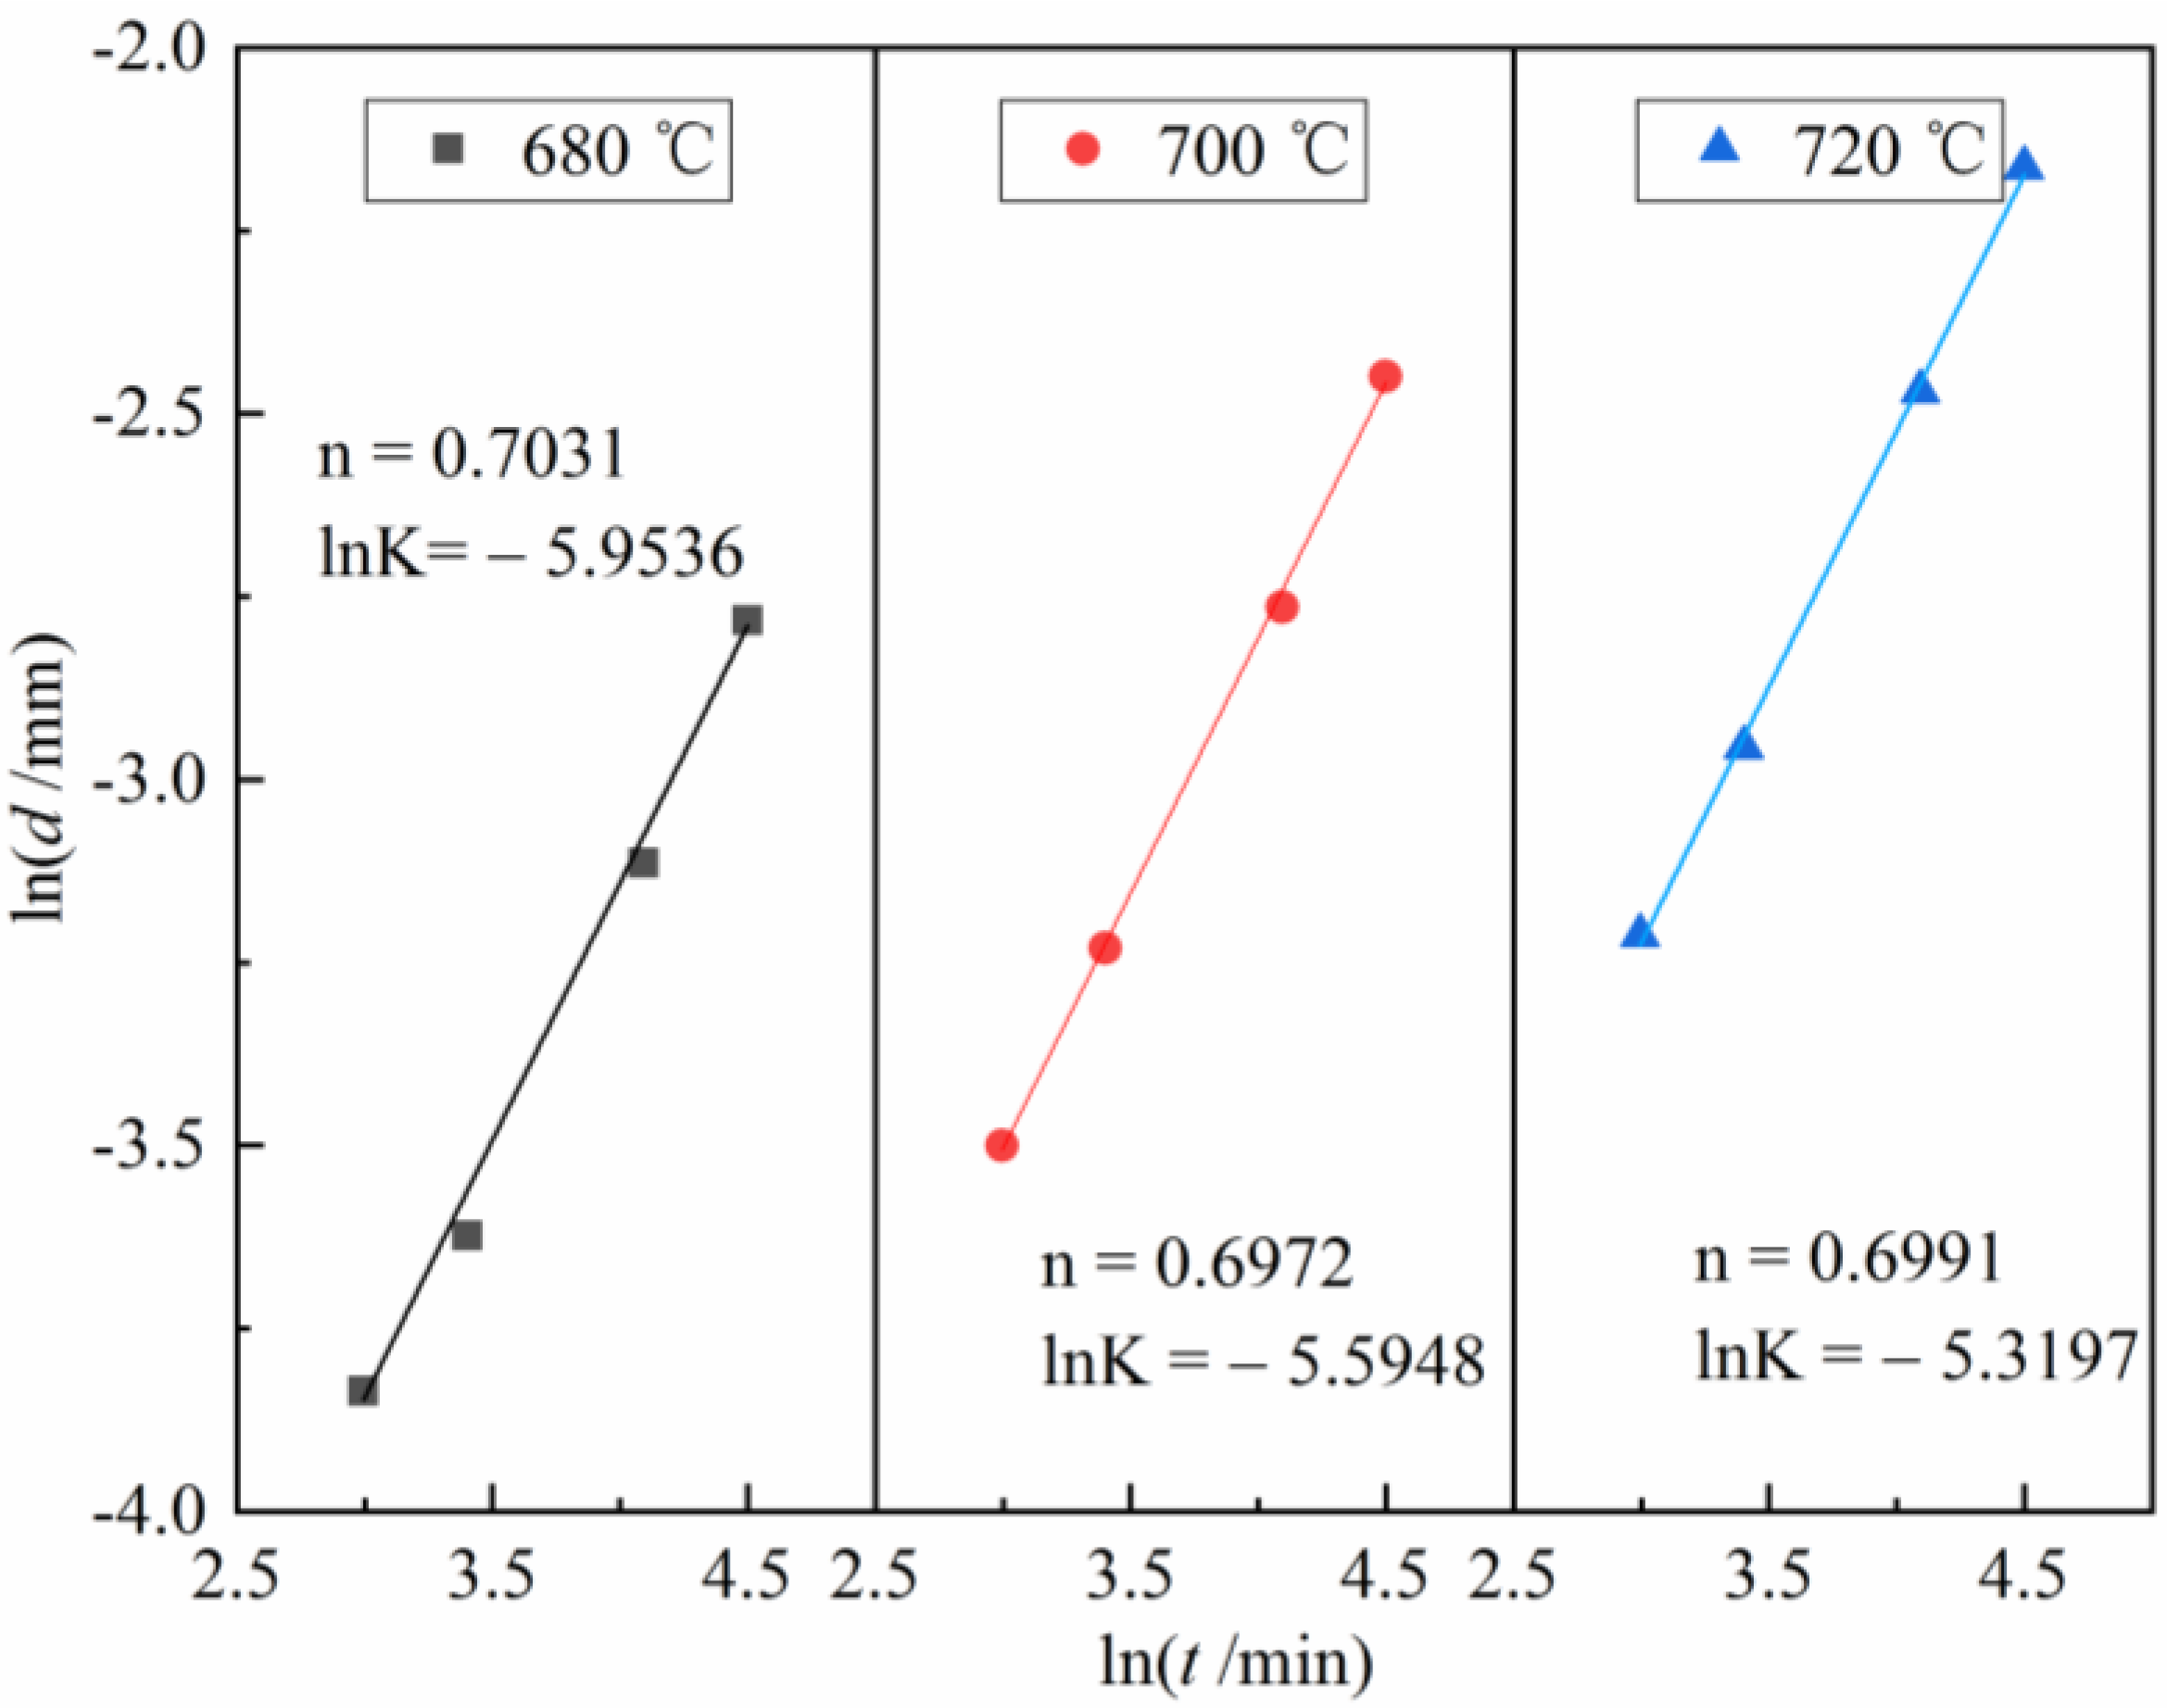
| Temperature T/K | Growth Coefficient K | Growth Index n |
|---|---|---|
| 680 | 0.002596 | 0.7031 |
| 700 | 0.003717 | 0.6972 |
| 720 | 0.004894 | 0.6991 |
Publisher’s Note: MDPI stays neutral with regard to jurisdictional claims in published maps and institutional affiliations. |
© 2022 by the authors. Licensee MDPI, Basel, Switzerland. This article is an open access article distributed under the terms and conditions of the Creative Commons Attribution (CC BY) license (https://creativecommons.org/licenses/by/4.0/).
Share and Cite
He, Z.; Hu, X.; Han, W.; Mao, X.; Chou, K.-C. Erosion Layer Growth between Solid 316L Stainless Steel and Al–Li Alloy Melt. Metals 2022, 12, 350. https://doi.org/10.3390/met12020350
He Z, Hu X, Han W, Mao X, Chou K-C. Erosion Layer Growth between Solid 316L Stainless Steel and Al–Li Alloy Melt. Metals. 2022; 12(2):350. https://doi.org/10.3390/met12020350
Chicago/Turabian StyleHe, Zhanwei, Xiaojun Hu, Wan Han, Xudong Mao, and Kuo-Chih Chou. 2022. "Erosion Layer Growth between Solid 316L Stainless Steel and Al–Li Alloy Melt" Metals 12, no. 2: 350. https://doi.org/10.3390/met12020350