Article

Towards a Data Lake for High Pressure Die Casting

by
Maximilian Rudack
1,*,†,
Michael Rath
2,*,†,
Uwe Vroomen
1 and
Andreas Bührig-Polaczek
1
1
Foundry Institute, RWTH Aachen University, 52072 Aachen, Germany
2
Information Management in Mechanical Engineering, RWTH Aachen University, 52068 Aachen, Germany
*
Authors to whom correspondence should be addressed.
These authors contributed equally to this work.
Metals 2022, 12(2), 349; https://doi.org/10.3390/met12020349
Submission received: 12 January 2022 / Revised: 10 February 2022 / Accepted: 15 February 2022 / Published: 17 February 2022
(This article belongs to the Special Issue Advances in Metal Casting Technology)

Abstract

:
The High Pressure Die Casting (HPDC) process is characterized by a high degree of automation and therefore represents a data rich production technology. From concepts such as Industry 4.0 and the Internet of Production (IoP), it is well known that the utilization of process data can facilitate improvements in product quality and productivity. In this work, we present a concept and its first steps of implementation to enable data management via a data lake for HPDC. Our goal was to design a system capable of acquiring, transmitting and storing static as well as dynamic process variables. The measurements originate from multiple data sources based on the Open Platform Communication Unified Architecture (OPC UA) within the HPDC cell and are transmitted via a streaming pipeline implemented in Node-Red and Apache Kafka. The data are consecutively stored in a data lake for HPDC that is based on a MinIO object store. In initial tests the implemented system proved it to be reliable, flexible and scalable. On standard consumer hardware, data handling of several thousand measurements per minute is possible. The use of the visual programming language Node-Red enables swift reconfiguration and deployment of the data processing pipeline.

1. Introduction

The HPDC process is a discontinuous permanent mold based production technology which is applied to cast near net shape metal components from nonferrous alloys. The process is most commonly deployed within the automotive industry since it can facilitate high production volumes at competitive costs compared to competing production routes. It enables the production of near net shape components with high freedom of design and functional integration with respect to the produced part geometries. An HPDC machine is part of an HPDC cell which consists of multiple interconnected subsystems such as thermal regulation units, a spraying system, a vacuum system, a dosing system, an extraction robot, an optical part evaluation system as well the holding furnace and the machine itself. The systems of the HPDC cell are controlled by multiple Programmable Logic Controllers (PLC) which are configured to replicate the interaction between the subsystems and their cycle related operations. The HPDC process conditions can change over time due to wear of core components such as the die and its inserts and programming changes by the process engineer as well as have some degree of process intrinsic fluctuation.
With the increased availability of interfaces for querying data from PLCs, such as OPC UA [1,2], the focus of research and development is increasingly shifting to the further processing of data with finer granularity compared to standard data acquisition systems in production [3,4]. In particular, the analytical evaluation of data is seen as having great potential for increasing productivity and quality, while minimizing costs [5,6]. However, before modern methods of data analysis can be used, a data infrastructure must be developed, based on the existing interfaces for querying current machine states, with the help of which machine, process and product data can be collected, processed, stored and made available for analysis [7].
Such computing infrastructures are summarized under the term Online Analytical Processing (OLAP). The most prominent and well established representative is the data warehouse [8] and its extension to big data: the data lake. A data lake is a multi-layer architecture for an extensive data store, which is designed in particular to record and store raw data and then to extract knowledge from the collected data [9]. The data lake differs from a data warehouse in particular in that it stores as much data as possible in its initial state, without aggregating it, for example, as mean values, standard deviation or similar summaries of data. This makes it possible to examine historical data retrospectively for aspects that were not considered when the data were originally stored. Data lakes, as well as data warehouses, are usually created within a cloud infrastructure. This enables access via the internet. The ingestion and subsequent readout of data thus become independent of the location of the machine and the user, which significantly facilitates data exchange.
In order to be able to fill the data lake with raw data, the first step is to set up a data pipeline [10]. This is used to query and organize machine data and to transfer them to the data lake and thus to the cloud. Such a pipeline consists of three elements: data sources, processing elements and data sinks [11]. The sources generate data that are to be transmitted by the pipeline. In our case, these are the OPC UA servers, i.e., indirectly the states and measured values of the machine’s sensors. The sinks are the elements in which the data leave the pipeline. In our scenario, this is the data lake. In addition, there are processing elements that lie between sources and sinks and provide functionalities for the pipeline. For example, it is usually necessary to include buffers in the pipeline to compensate for temporary fluctuations in the load and thus prevent the loss of data.
In this article, we present a concept and its first implementation steps to enable a data lake for HPDC. In addition to storing and retaining the data, this includes collecting the data at the machine and forwarding them efficiently to the cloud using a data pipeline. Before exploring the data lake and its exact design, in this article we will focus on the overall architecture of the IT infrastructure and in particular on the design of the data pipeline. In addition to describing the design and software used, we present the results of an extensive load test to demonstrate that the pipeline is suitable for connecting our HPDC cell to the data lake in the cloud.

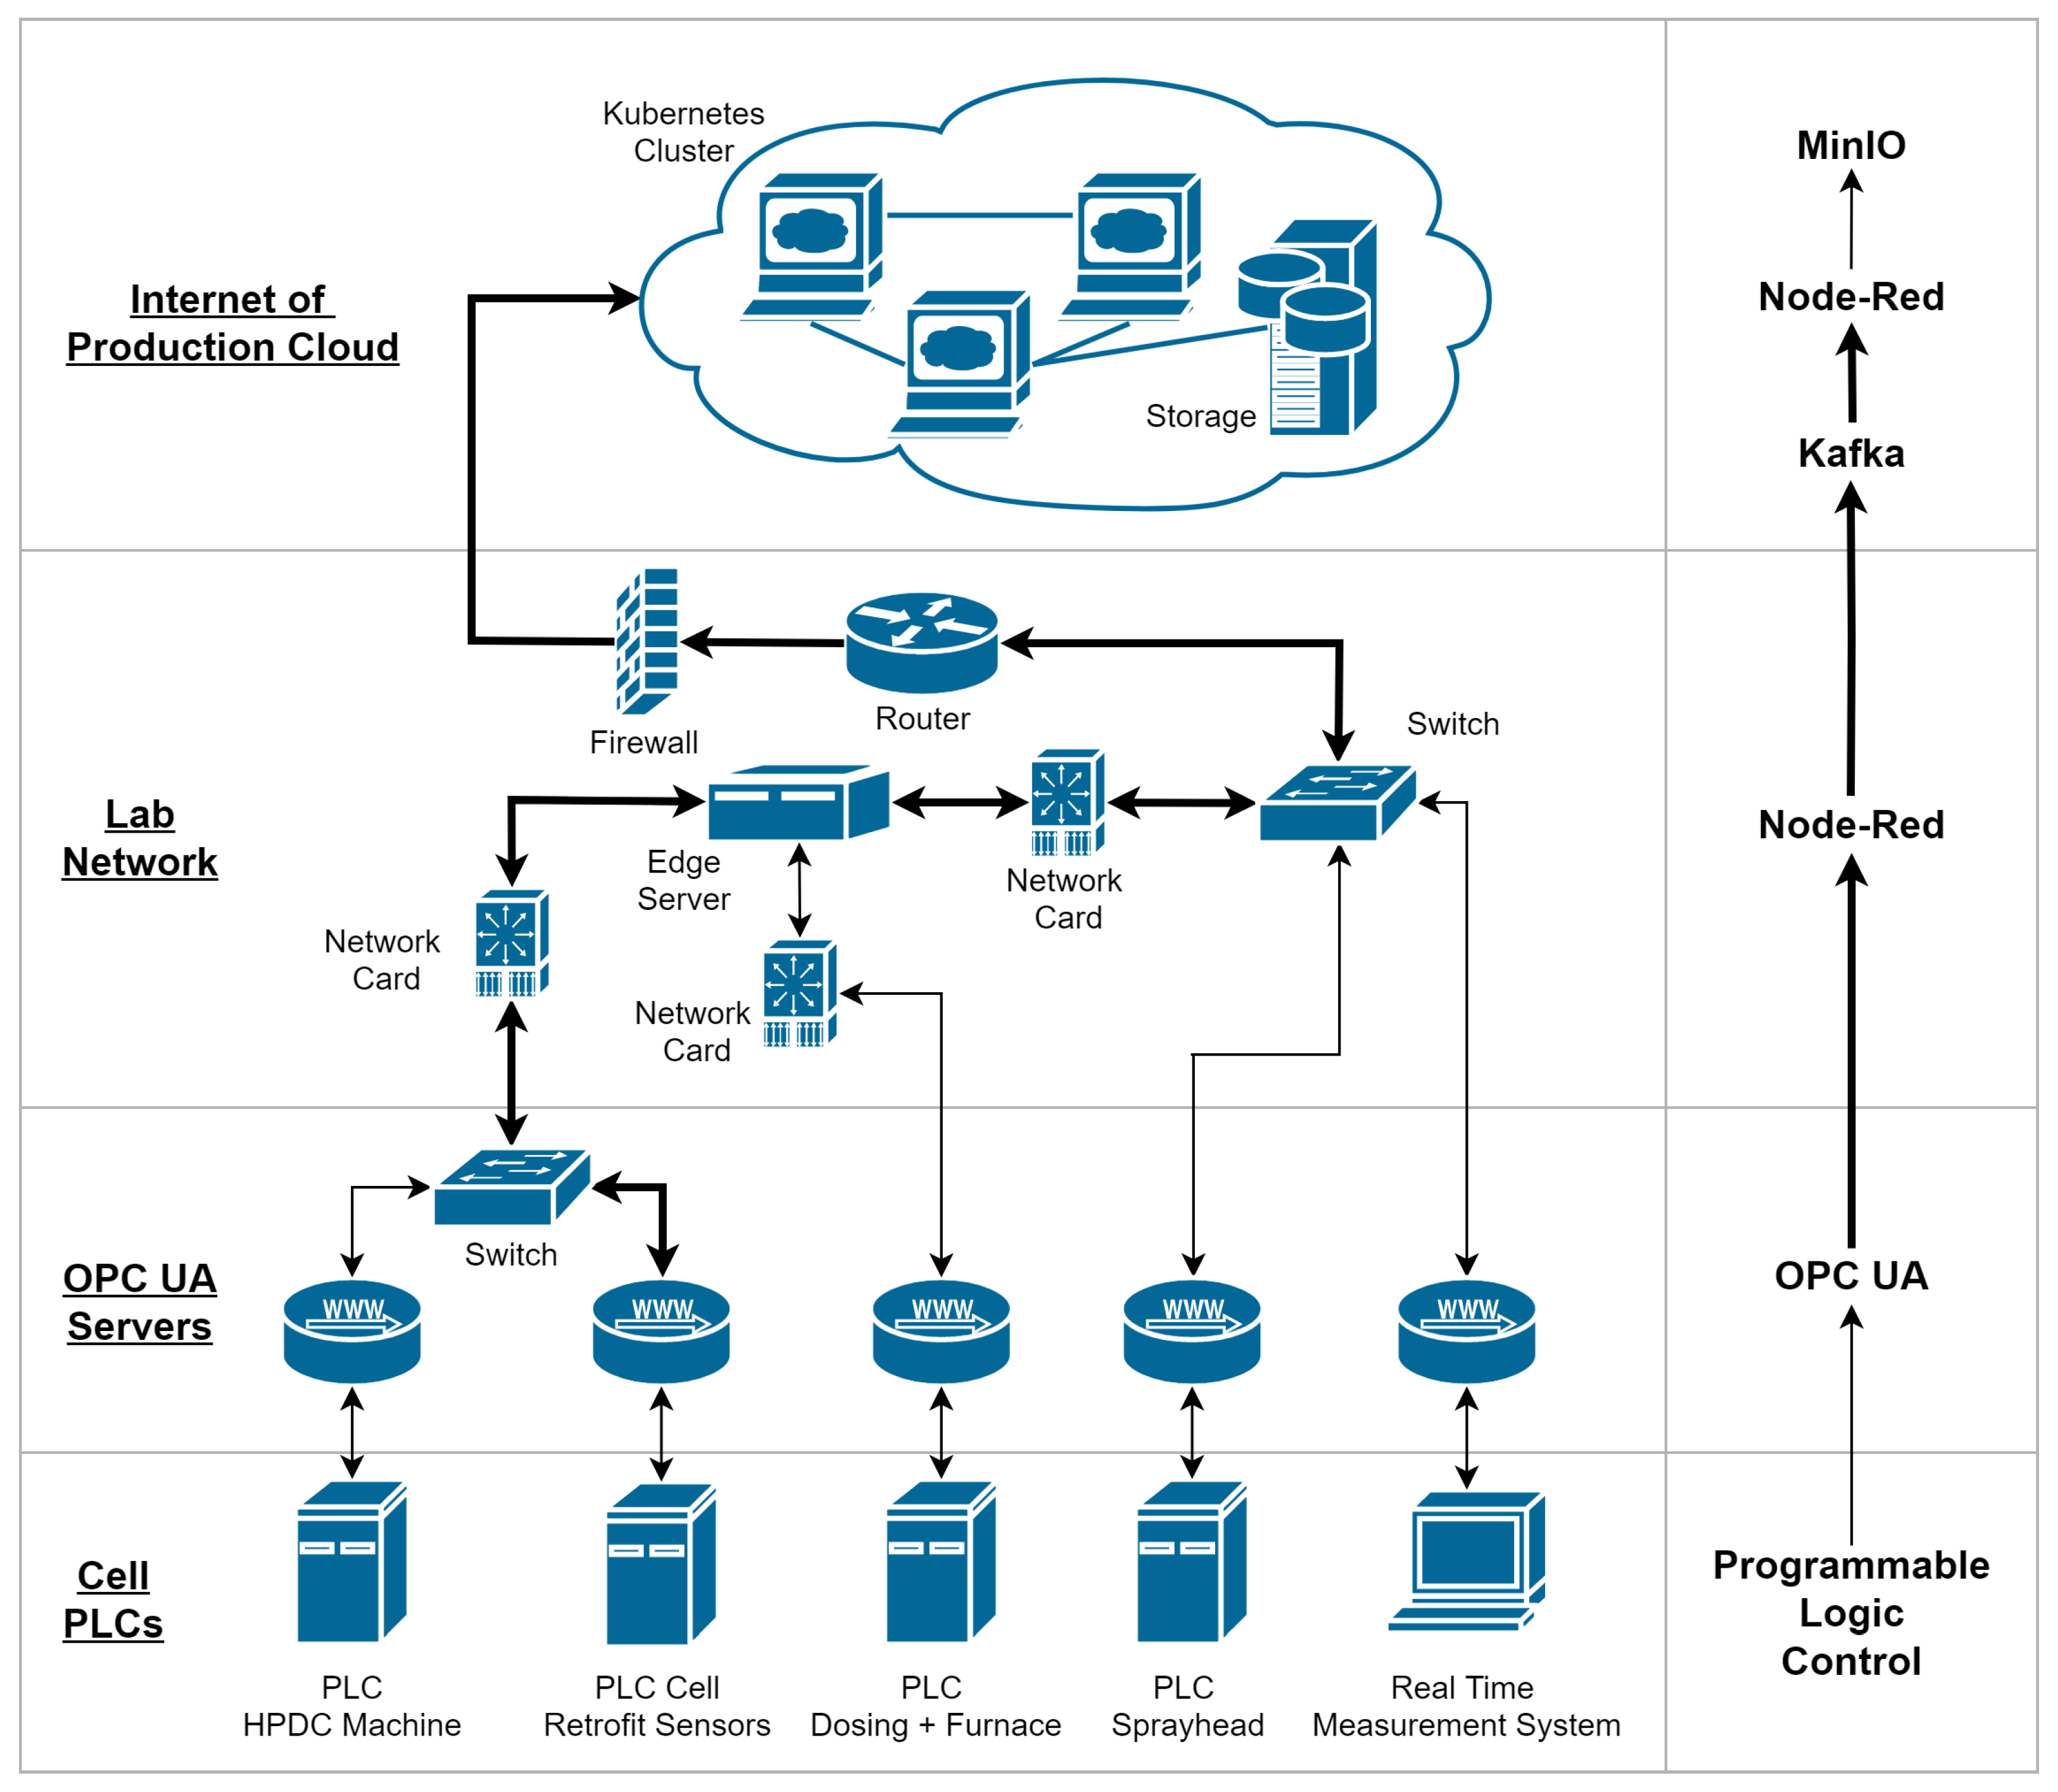
2. HPDC Cell PLC Structure

For this study, the HPDC cell of a 500t horizontal cold chamber HPDC machine DAK450-40 Vacural (Oskar Frech GmbH & Co.KG, Schorndorf, Germany) at the Foundry-Institute of RWTH Aachen University in Aachen, Germany was used. The cell contains multiple PLCs that provide process data via OPC UA servers. In this study, data is collected from five OPC UA servers.
The setup of the cell PLCs and their corresponding OPC UA servers is outlined in the following:
  • PLC HPDC Machine: The PLC provides core data of the process which include the shot end velocities and pressures, the locking force for every lock, the HPDC die thermocouples as well as the step cycle time required for every suboperation such as dosing or part extraction of the HPDC cycle. Furthermore, the flow rates and temperatures from the thermal regulation units are accessed via this PLC.
  • PLC Cell Retrofit Sensors: Retrofitting sensors to an existing HPDC cell and integration into the cell can be difficult and costly, especially if the data are to be available on the core machine PLC and the HMI. Therefore, a second standalone PLC with a separate OPC UA server is used to acquire retrofitted sensor signals which include the plunger water flow rate and temperature as well as the heat exchanger water flow rates of the thermal regulation units, the facility temperature and humidity, the electrical power draw of various cell components as well as additional thermocouples, the air flow towards the sprayhead and, if necessary, additional 0–10 V or 4…20 mA signals.
  • PLC Dosing + Furnace: The furnace and the dosing system are controlled by this PLC which provides information from the furnace such as the melt temperature, chamber temperature, the power draw and the fill level as well as data from the vacuum dosing system which include the time to take in the metal, the time to reach the pour hole as well as the determined shot weight for every cycle as long as that option is active in the control.
  • PLC Sprayhead: Provides the spraying time for every circuit of the sprayhead.
  • Real Time Measurement System: A third party measurement system which can acquire cavity surface temperature and pressure measurement values as well as high resolution shot end data. This system can also provide certain process data via an integrated OPC UA server.

3. Results

3.1. Data Architecture

Figure 1 depicts the network setup which was implemented to conduct the presented study. All OPC UA servers can be accessed via an edge server. One instance of the Node-Red v2.0.6 (The OpenJS Foundation, San Francisco, CA, USA) [12,13] software package runs locally on the edge server and facilitates the deployment of multiple data flows to enable connectivity to the OPC UA servers. It provides the means to transmit the data to the cloud. Apache Kafka v2.6.0 (The Apache Software Foundation, Wilmington, DE, USA) [14] serves as a message broker and runs within a Docker container [15] on a Kubernetes cluster v1.19.10 (Cloud Native Computing Foundation, San Francisco, CA, USA) based [16,17] Internet of Production cloud (IoP cloud) at the data center of RWTH Aachen University. A MinIO object storage version 2021-11-24T23:19:33Z (MinIO, Inc., Palo Alto, CA, USA) [18] represents a first simple version of a data lake. A second instance of Node-Red is deployed in the cloud to facilitate data transfer from the message broker to the data lake.
In order to enable connectivity of all five OPC UA servers to the IoP cloud, it was necessary to install an edge server to access the separate networks of the HPDC cell components. In the case of the spraying system and the external measurement system, it was possible to assign IP addresses from the facility network and access them from any device in the network. It was not feasible to use this strategy for the remaining servers of the cell. They could not be reliably accessed from different internal and external networks, since the multiple gateways led to instabilities with regard to the availability of the OPC UA servers in the facility network. The edge server is equipped with two additional USB 3.0 1000 MBit/s network interfaces that are assigned IP addresses and suitable gateways for two separate networks to overcome this issue: the HPDC machine network as well as the network of the PLC for the holding furnace and dosing system. A consumer grade SBC Raspberry Pi 4 Model B with 8 GB of RAM (Raspberry Pi Foundation, Cambridge, UK), that runs the 64 bit version of the Raspbian Buster operating system (Raspberry Pi Foundation, Cambridge, UK), is deployed as the edge server. All process values from the five PLCs are initially processed via Node-Red flows and consecutively forwarded to Apache Kafka from this device.
A key benefit of our data streaming pipeline implementation lies in the ease of adding new devices and server nodes that provide additional process data, while being modular in terms of the used technology stack. Another advantage is the use of a graphical programming framework. Engineers with limited background knowledge or experience in using advanced programming languages can set up and extend flows for data extraction, processing and metadata injection within a few hours of the initial deployment of the data pipeline. Figure 2 depicts the edge side of the data pipeline for the HPDC machine PLC. Each of the five OPC UA servers is accessed with a separate flow in which the overall node list is separated into groups corresponding to subsystems of the machine to improve the usability. Access to specific node groups from the server for users that have no previous experience with the system is simplified by this structured approach.
The messages sent through the pipeline are annotated with a source description and forwarded towards a separate flow depicted in Figure 3 that compounds and subsequently transmits the messages from all servers by:
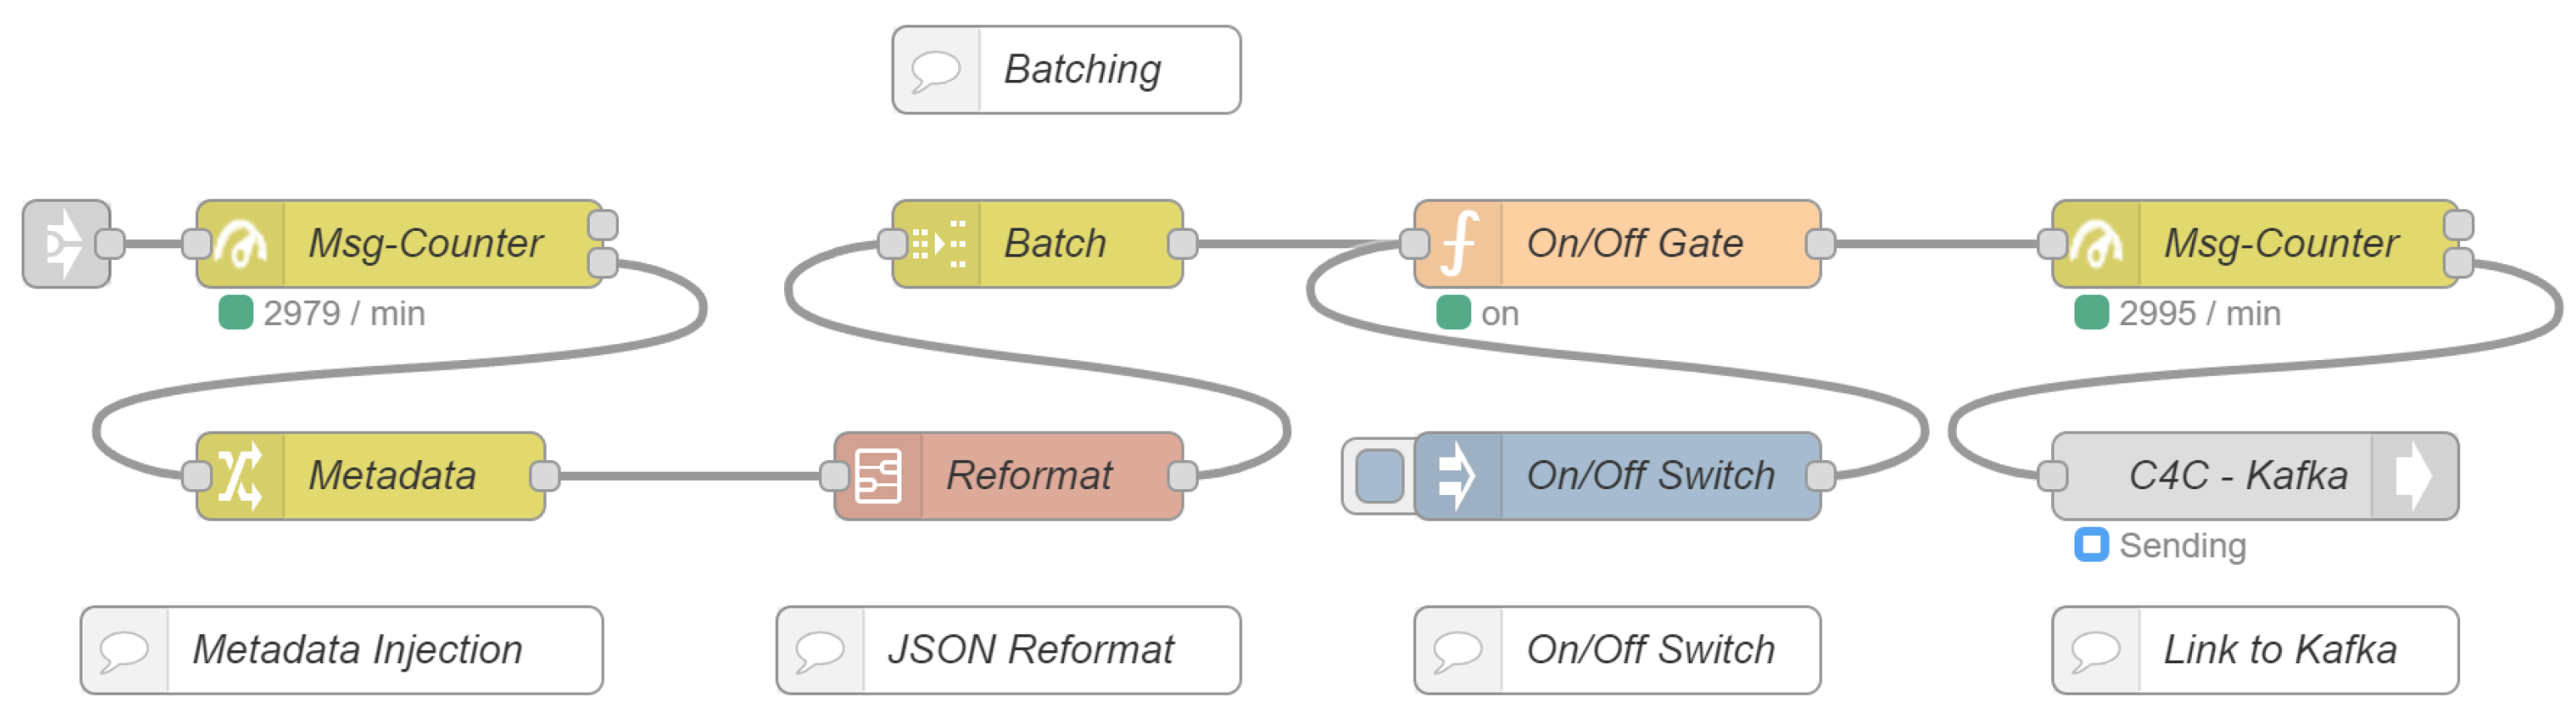
  • Adding higher level source descriptions that apply to all compounded flows.
  • Reformatting the messages as JavaScript Object Notation (JSON) files.
  • Optional batching of the messages.
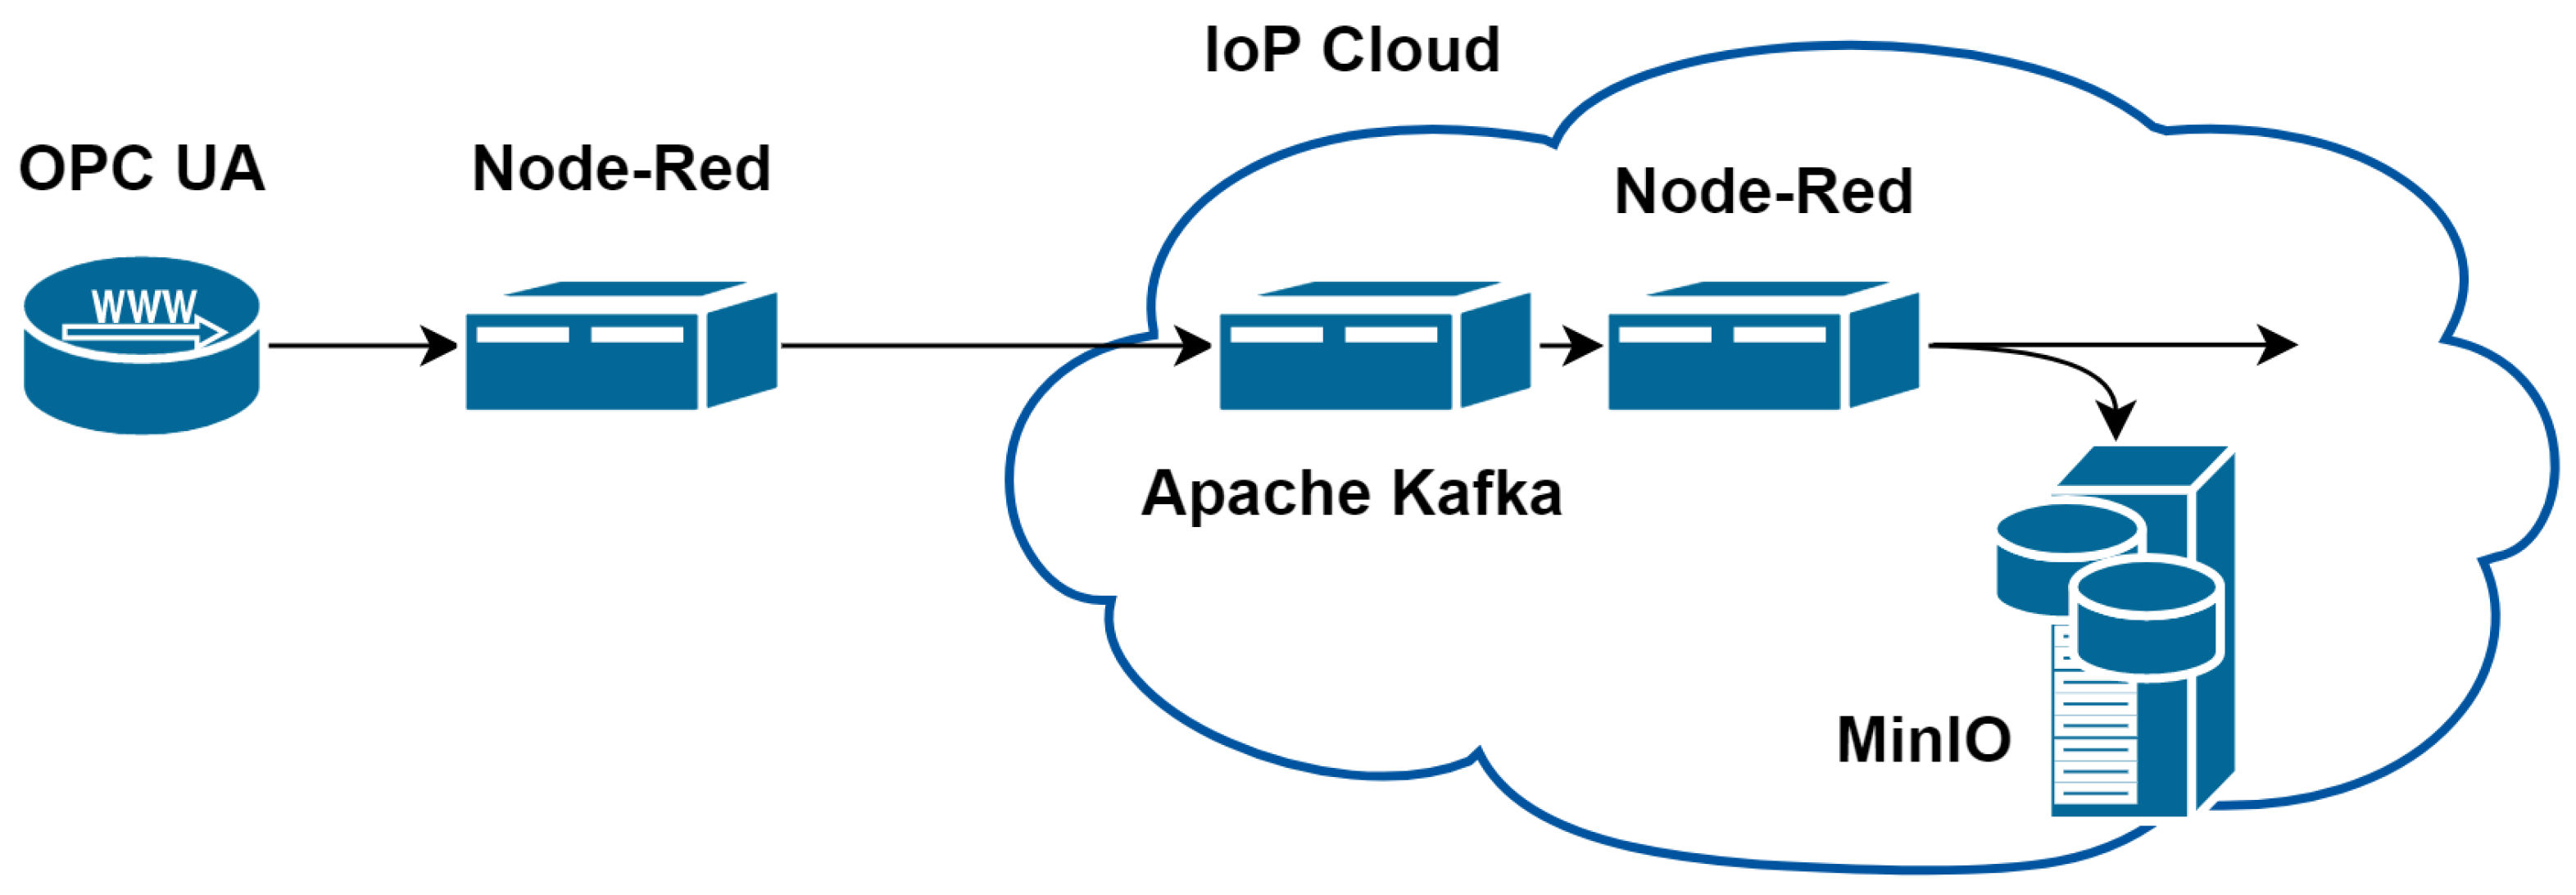
  • Sending the batches to the Kafka message broker running in the IoP cloud.
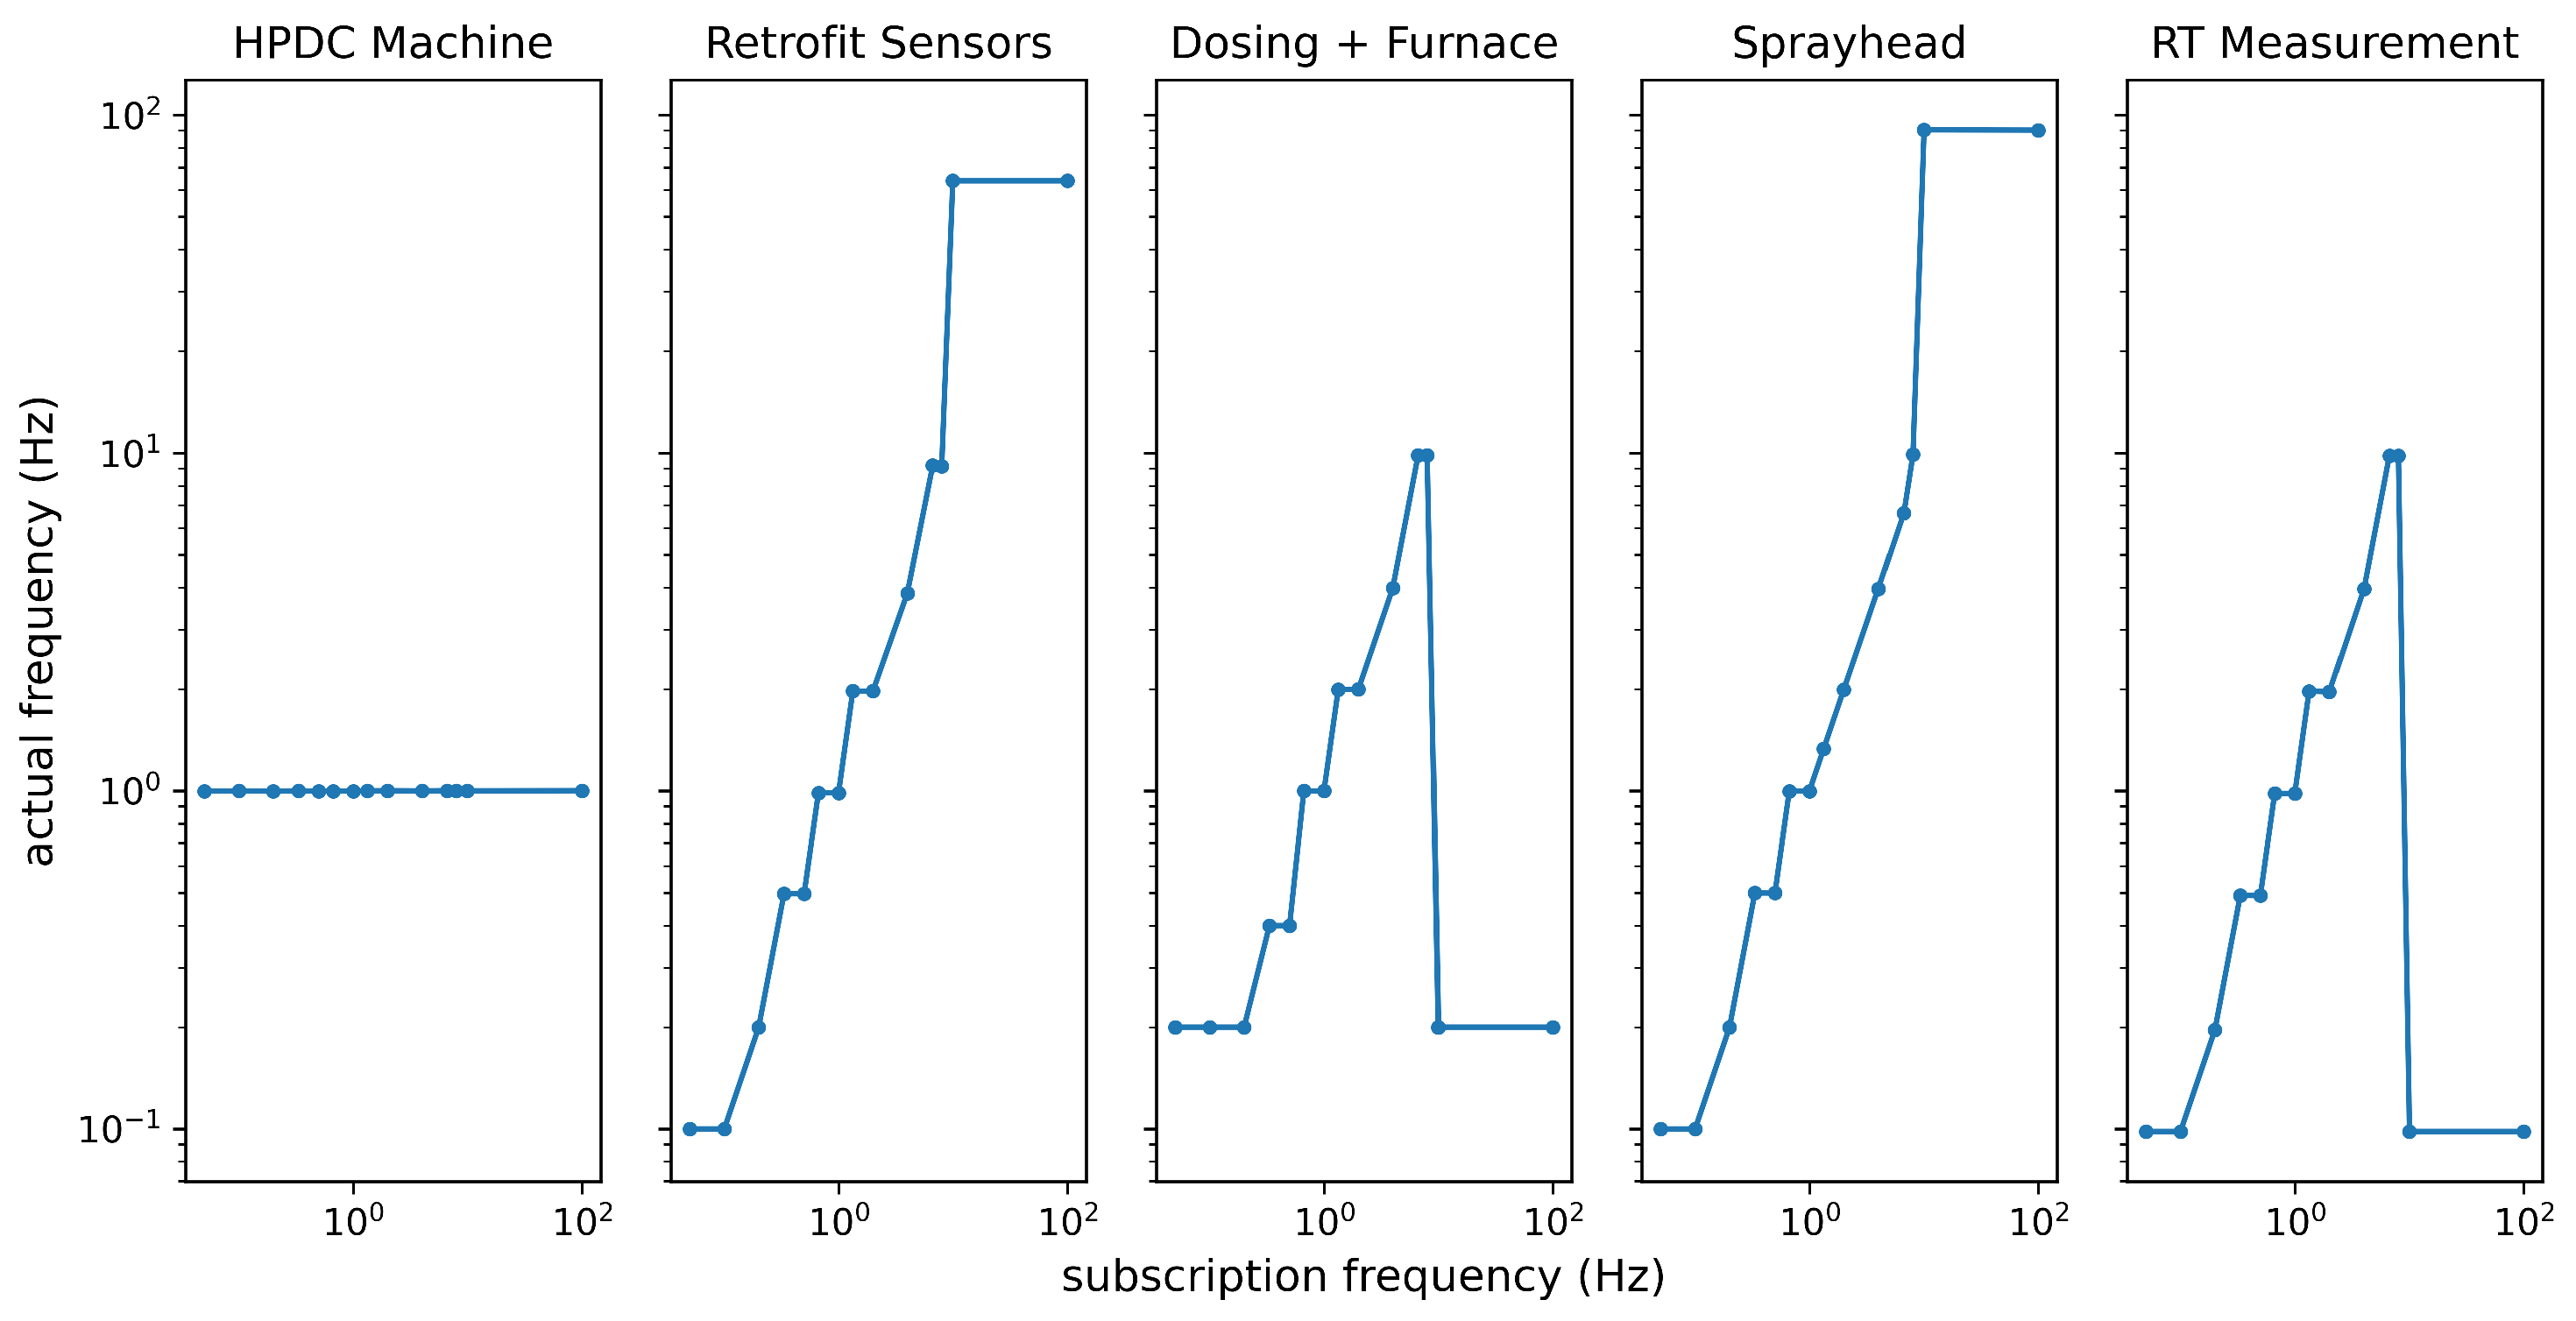
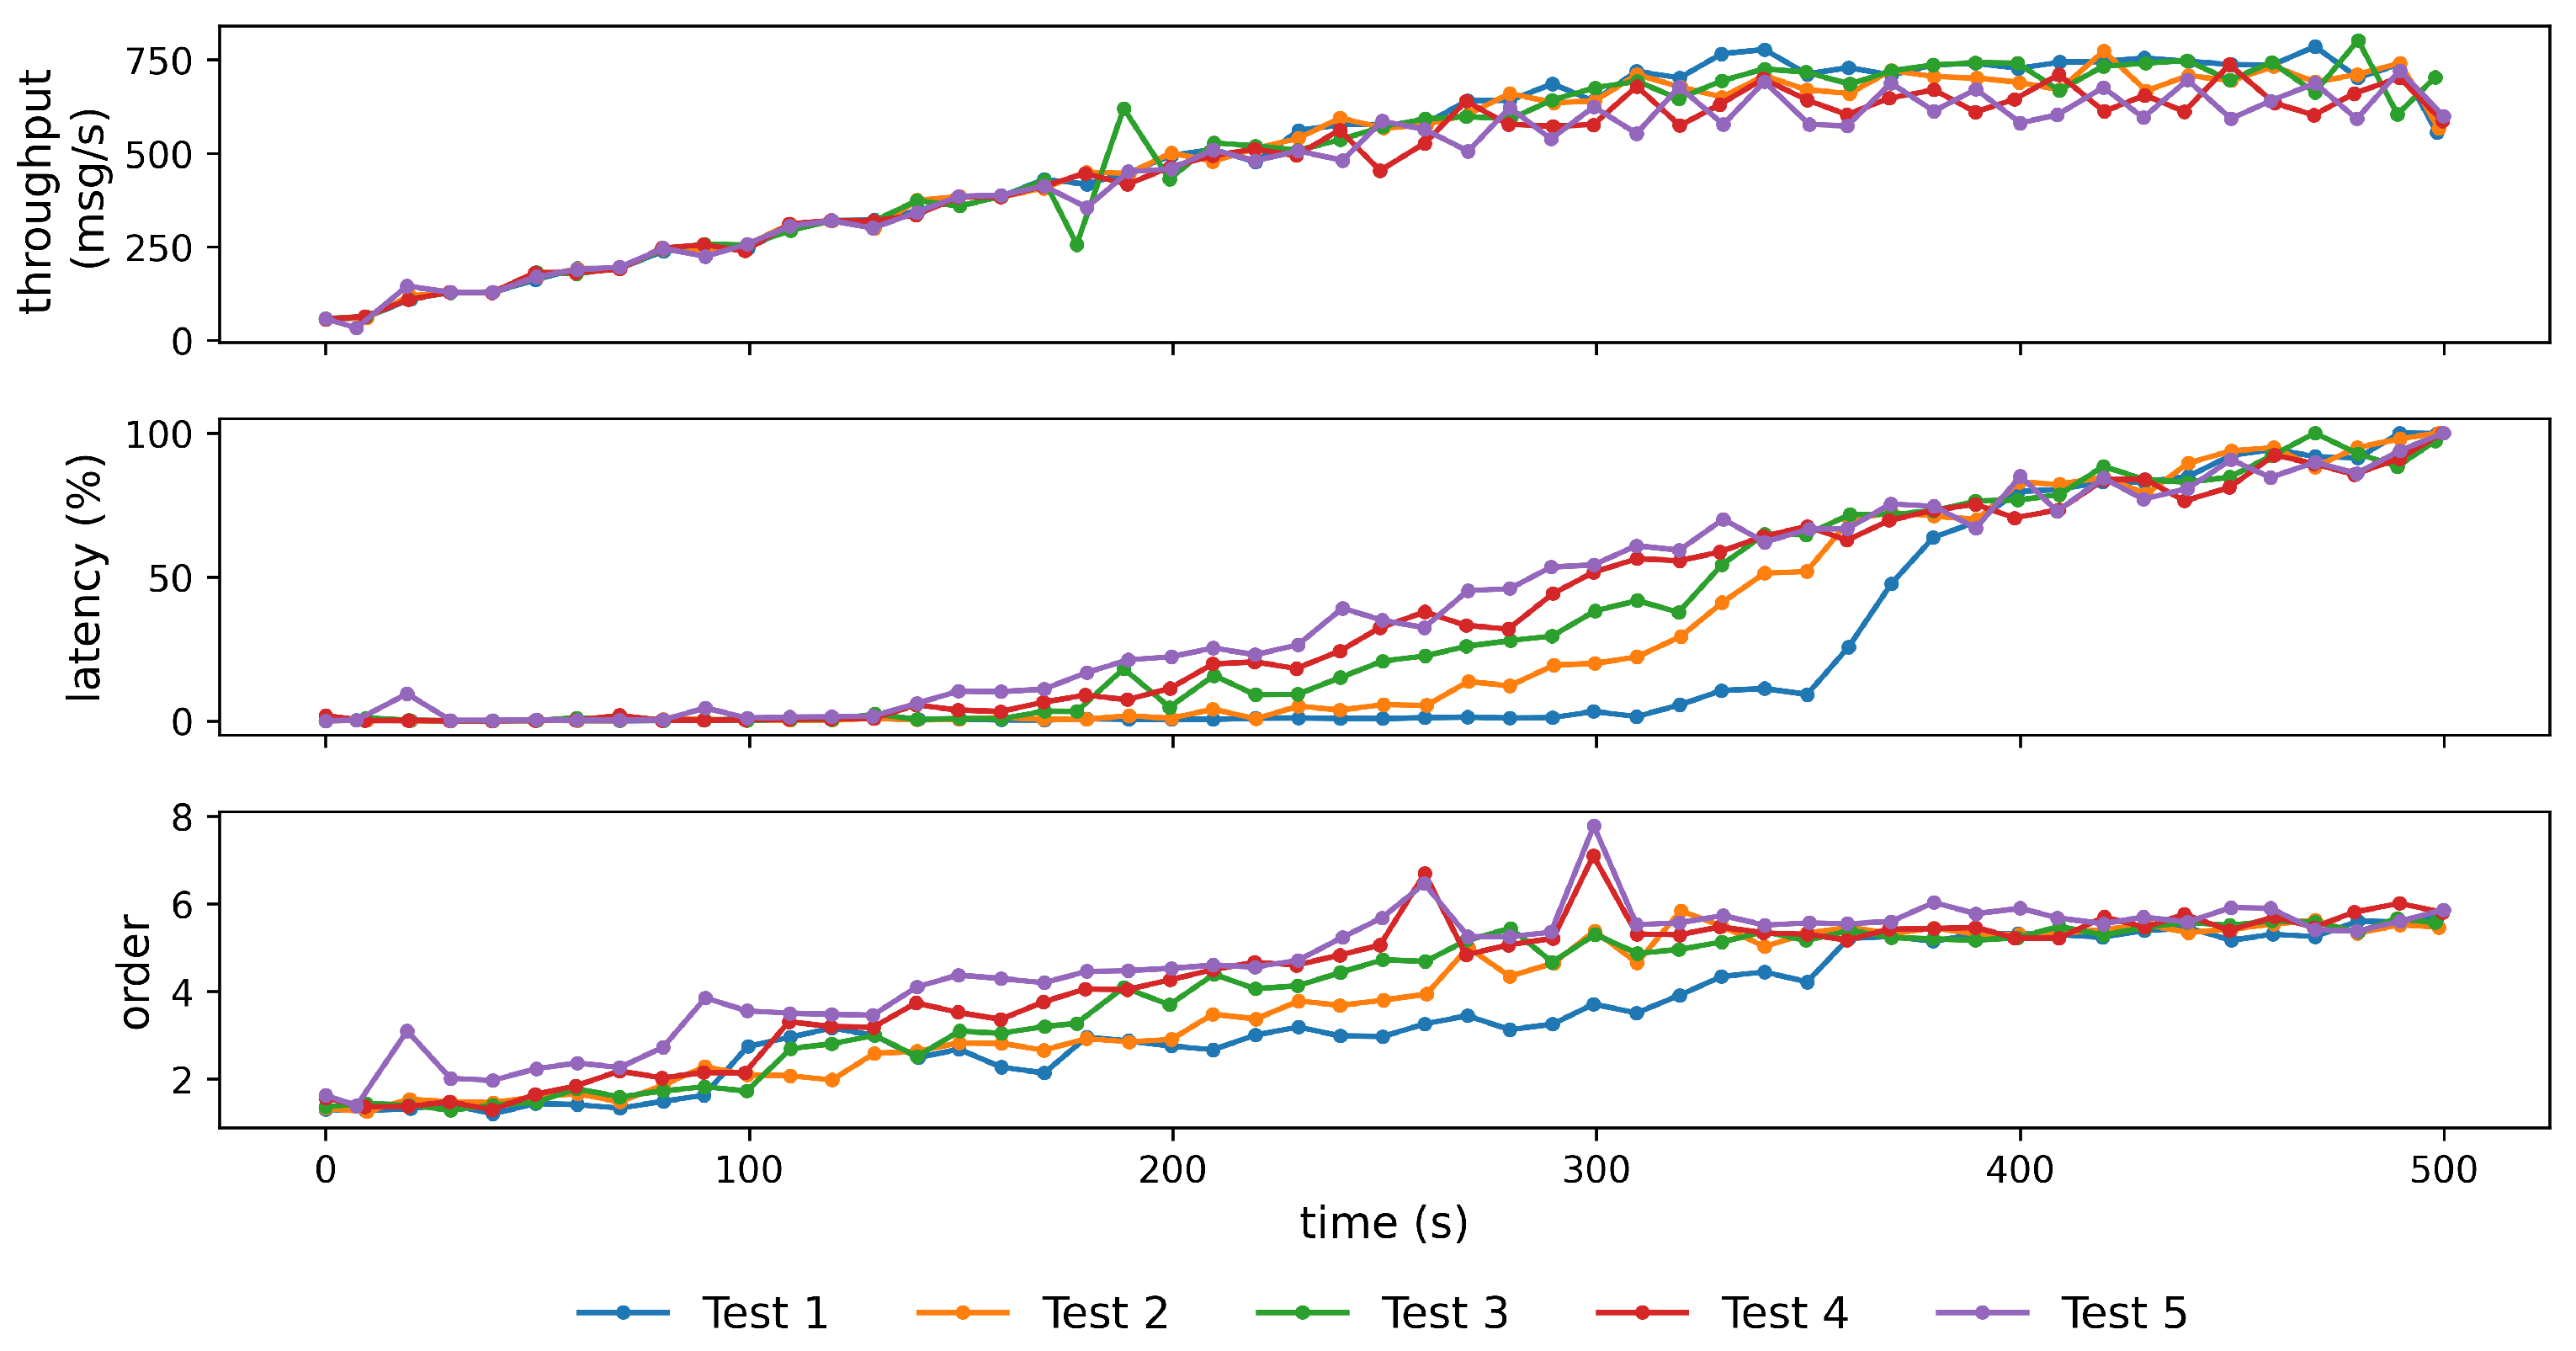
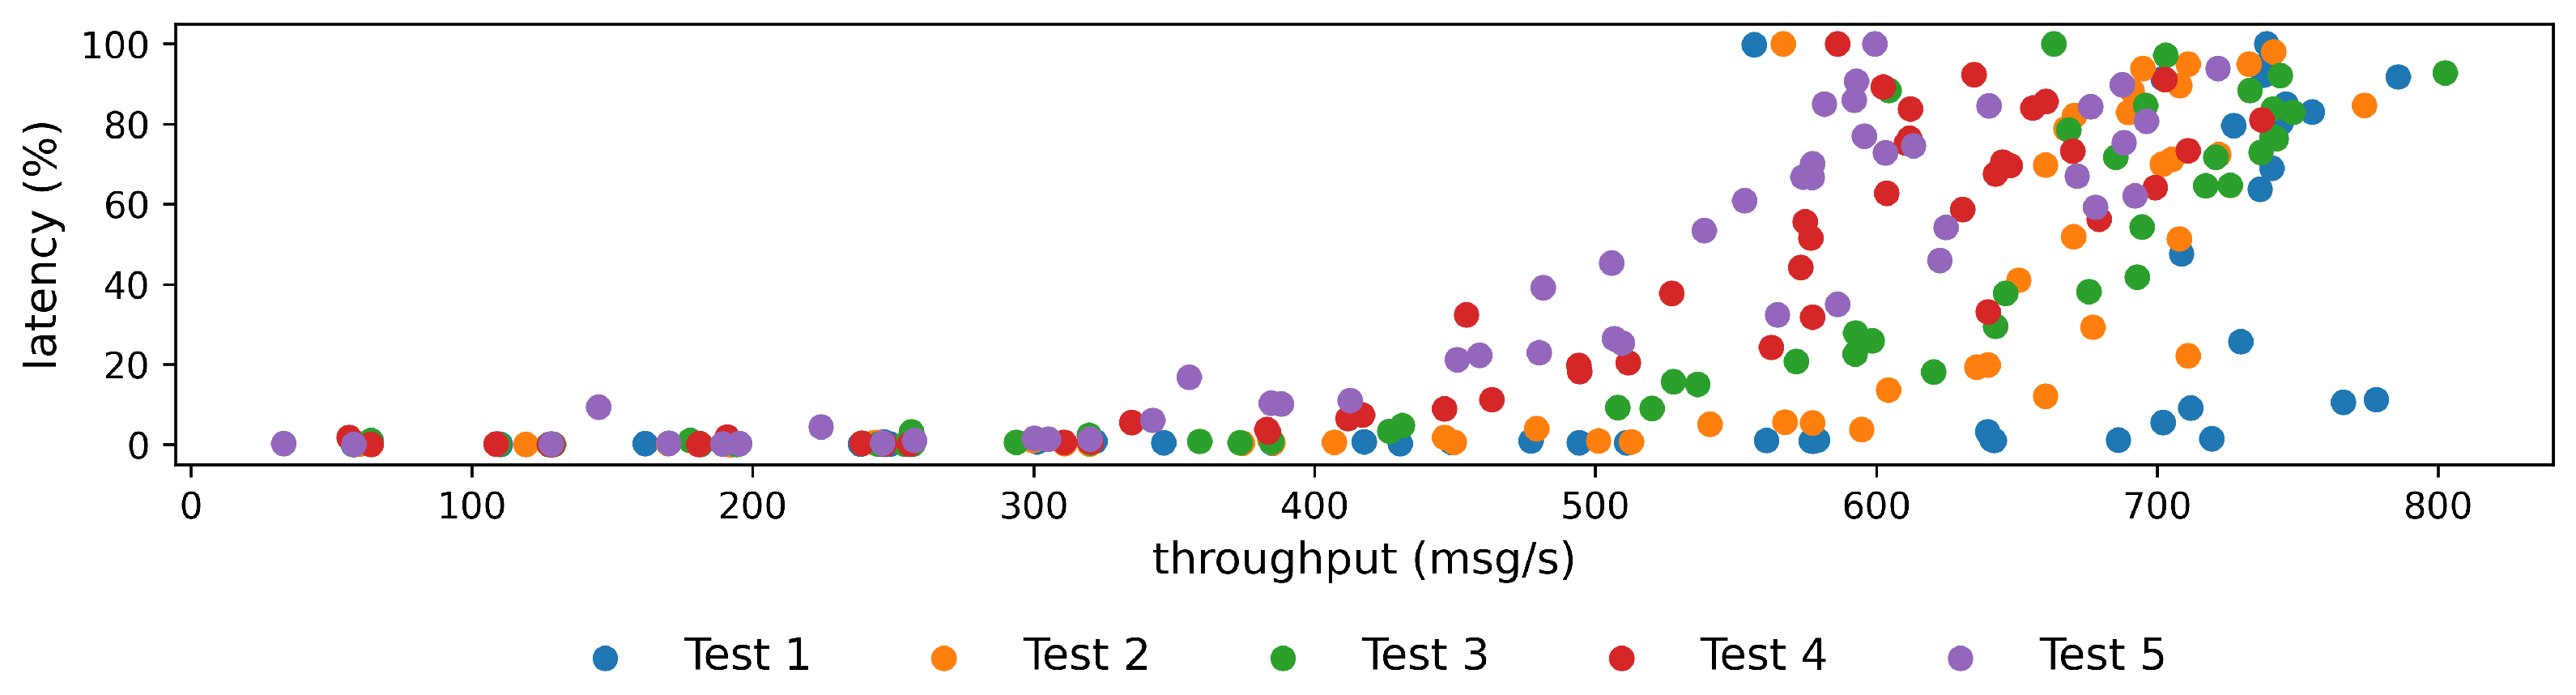
Figure 4 depicts the flow deployed in the cloud that transmits the process data to the data lake based on a MinIO object storage.

3.2. Load Tests

The performance of the data pipeline was determined by an extensive load test. Data was generated by multiple parallel queries of information from the OPC UA servers, which was routed via the edge server to the cloud using the presented pipeline (see Figure 5). There, it was made available for further processing as a Node-Red data stream and additionally stored in a MinIO object storage. In the course of the test, the amount of transmitted data was continuously increased by the controlled query of the OPC UA servers. To quantify the performance of the system, metrics such as throughput and latency of the data pipeline have been measured.

3.3. Preliminary Tests

In order to be able to generate a load that is as precisely controlled as possible during load testing, the properties of the available OPC UA servers were determined first. It was necessary to determine the actual frequency at which the OPC UA servers produce data, depending on the set target frequency. Furthermore, it had to be shown at which maximum frequency OPC UA can feed data into the pipeline. For this purpose, the Node-Red flow running on the edge server was used to subscribe to the “serverTimestamp” endpoint (representing the current time of the server [19]) of the different OPC UA servers. The resulting messages were collected over a certain period of time. After completion of a measurement period, the messages were stored on the edge server. The measurement of the “serverTimestamp” was used, since it is available within the default OPC UA namespace on every OPC UA server and because it is updated frequently. The results of the measurements of target/subscribed and actual transmission frequency are shown in Figure 6.
As depicted in the figure above, the various OPC UA servers differ significantly in their behavior. The server of the HPDC machine, for example, always sends the measured values of the “current time” exactly once a second, regardless of the set target frequency. All other OPC UA servers used show a gradual, quasi-linear progression of around one hertz. However, if the requested frequency reaches 10 Hz, the frequency of the messages collapses for two OPC UA servers. Only the OPC UA servers of the retrofit sensors and the sprayhead increase to a maximum transmission frequency of 70–100 messages per second when the requested frequency is set to 10 Hz or more. Therefore, for the load test of the whole data pipeline, the use of those two OPC UA servers as data sources was the best choice due to the significantly higher maximum frequency. However, as it turned out, the retrieval of data from the sprayhead became unstable when several clients were used in parallel, so we decided to only use the OPC UA server of the retrofit sensors in the load testing.

3.4. Pipeline Tests

The final load test of the entire data pipeline was implemented by the parallel use of up to 40 OPC UA clients in the Node-Red flow of the edge server. Each client subscribed with maximum frequency to the “serverTimestamp” of the OPC UA server of the retrofit sensors. At the start time, a single client was connected to the OPC UA server and successively every 30 s another client was added, until after 1170 s all 40 OPC UA clients were active and queried data in parallel. Using the Node-Red flow, the individual messages were converted to a JSON format and a unique, sequential message ID was added and sent to Kafka in the cloud. Another instance of Node-Red ran within the Kubernetes cloud infrastructure through which the messages were read from Kafka and made available for further processing. The messages were buffered for 2.5 min, converted to Comma Separated Value (CSV) format, and stored in small batches in a MiniIO object storage.
The metrics used to quantify the pipeline’s performance are throughput, latency and ordering. All metrics were calculated as averages within a time window of Δ t = 10 s. The throughput was measured by counting the number N of messages that were received by the Node-Red flow which connects the Kafka ingestion with the MinIO object store within the cloud:
throughput = N Δ t
The latency was determined by the difference between the measured OPC UA server’s “serverTimestamp” value t A and the timestamp attached to the messages by the Node-Red flow within the cloud t B . The OPC UA server’s clock was not synchronized with the cloud infrastructure’s clocks. Therefore, the absolute value of the latency does not provide any meaningful insight. To avoid this problem, we decided to measure the latency as relative quantity: we transformed the absolute latency into a percentage, where the minimal latency L min was assigned 0 percent and the maximal latency L max 100 percent, using the measured absolute minimum and maximum latencies L min and L max . This relative latency is defined as the transformed average of all messages within the 10 s time window as:
latency = 1 L max L min · j = 1 N t j B t j A N L min .
The third metric is the ordering of the messages. We defined a metric that is supposed to capture the extent to which the messages arrive in or out of order. To allow for this to be measured, messages that were read by the OPC UA clients were serially numbered/indexed starting with 1. The order metric is then calculated by comparing the messages indices at time of arrival in the cloud’s Node-Red flow. Let i j be the index of the message that arrived as the j-th message where i and j are between 1 and N (assuming no messages are lost, which was true in our experiments), then the ordering metric is defined as:
order = j = 2 N i j i j 1 N 1 .
In case all transmitted messages arrive in the same order in which they were sent, the order metric will take the value one. Otherwise, the value of the metric will increase. The results for five consecutive load tests are shown in Figure 7.
During the course of the load tests, new data producers (OPC UA servers) were gradually added. Therefore, at least in the first 250 s a continuous increase in throughput is observed. After that, the throughput reaches a stable maximum at about 600 to 700 messages per second. Increasing the polling frequency from second 250 to 1170 no longer results in an increase in actual throughput. Latency remains at a minimum value until about 200 s, roughly the same time that the pipeline reaches a maximum throughput, and steadily increases from that point on. The order metric increases at the beginning and seems to reach a plateau at about 300 s.
A simplified evaluation of the performance of the pipeline can be achieved by plotting latency as a function of throughput, as shown in Figure 8. It can be clearly seen that a transmission of at least 300 messages per second was possible in all experiments. Delays in data transmission only occurred above this point.

3.5. Data Usage

Although the further use of the data stored in the data lake was not part of this work, in the following we want to give an overview of what benefits can be expected from the comprehensive collection of all process and machine data in the HPDC process. A specific example for our data use includes the assessment of the second phase velocity with regard to the stability during the filling stroke as well as the counter pressure from the metal in order to detect process fluctuations which are otherwise lost due to the assessment of an aggregated value for the fast shot speed. Additionally, we use thermal measurements from the die as well as from the shot sleeve for the inverse optimization of a numerical process simulation. These are selected examples for the use of acquired data in downstream applications. More importantly, if HPDC machines are generally enabled to collect data with the granularity level we use and provide access via the internet, machine and die specific digital finger prints could be derived on a machine and die specific basis to tailor simulation models to the actual process, for example, by using a custom set for Heat Transfer Coefficients (HTCs) for every process that reflects the true thermal behavior of the die.
Generally, the internet wide availability of data as well as the level of sophistication that has been reached by algorithms in recent years creates an alluring vision: any production process might be fully self optimizing for target values such as part quality, downtime or productivity. While mathematical and numerical models are undoubtedly enablers of these improvements, we do believe that in many cases the human operator is still the most vital component of the production system. Only the operator has the ability to reconcile possibly conflicting information that emerges from automated data refinement and analytics. We therefore want to develop a visualization methodology that enables the human operator to gain the maximum benefit of any refined data by providing an interface to visualize the data drawn from the data lake. Furthermore, similarly to our data pipeline for scalar and vector data provided by OPC UA servers, we aim for a highly flexible solution that can quickly be reconfigured and redeployed, by utilizing a semantic integration layer.

4. Conclusions

During regular HPDC operation, around 50 messages per second are transferred through the data pipeline. These messages contain floating point numbers and arrays as delivered by the server as well as the annotated information from the Node-Red flows. By running load tests it has been determined that the hardware and software technology stack is capable of handling around 300 messages per second before delays in transmission occur. The pipeline can then still reach a maximum of around 700 messages per minute before reaching its throughput capacity limit. It is therefore concluded that performance is sufficient for the HPDC use case with spare room for additional OPC UA servers and nodes.
During the development and use of the pipeline, the technology stack has proven to be highly expandable and adjustable with minimal user input. It can be transferred to any use case where multiple PLCs provide process data via an OPC UA. Minimal time for deployment is ensured while retaining a high level of flexibility. The integration of a high performance object storage system like MinIO as a data sink enables the extendability of the data lake with different data types such as optical or numerical data as well as seamless access for mathematical models and third party users via the internet. Our next steps to enhance the framework of a data lake for HPDC include the following:
Research about adequate semantic metadata for the process data will be conducted in order to facilitate their integration into the data lake as well as their subsequent extraction. While the messages that are transferred through the data pipeline are already annotated with some information about their origin, a more holistic approach has to be developed to enable interoperability of different data sources and the integration of new use cases. An adequate semantic information model, e.g., an ontology, that incorporates domain specific knowledge of the HPDC process has to be deployed to archive cross domain use of the collected data. Essentially, the semantic integration via an information model serves the purpose of removing the communicative friction between the process owner and downstream data users by delivering an unambiguous standard for the meaning of each data point. Possible downstream applications include software for numerical process simulations, visualization tools, mathematical models and machine learning for data analysis.
Conceptually, we aim to structure the data from the HPDC use case within the data lake into three layers. We refer to these layers as the bronze, silver and gold layers which define the quality level of the data in ascending order. In the cloud infrastructure, incoming messages are received by the Kafka message broker, processed by the cloud based Node-Red flow and saved as CSV files containing several minutes of data from the HPDC cell. This is what we refer to as bronze layer data. They are unrefined and ill suited for direct use by downstream applications. In the data lake’s second layer, the silver zone, data are stored in a transformed format that is adequate for the use case under consideration. During the refinement, data are organized in such a way that represents a full HPDC production cycle and its subcycle phases. This serves the purpose of allowing the generation of data as matrices (i.e., in tabular form) that are suitable as input for downstream applications. An example would be a 4 × N matrix for the shot end data arrays, representing the measurements of path, velocity and pressure at each time step (N). Similarly, an M × N matrix can be defined for all M 1 measured parameters of the process (assuming the M-th parameter to be the time). In symbiosis with adequate semantic integration, the data are then prepared for use as input files for processing by suitable applications. Lastly, the gold layer contains the refined data that went through the downstream application layer of mathematical, numerical or manual processing by users. The goal is that the data in the gold layer make it possible to draw clear conclusions about the performance of the process.
The proposed data pipeline has proven to be feasible. It supports practical and agile development, deployment and maintenance. However, this is only applicable for scalar or vector data that are typically delivered by OPC UA servers. While PLC data are arguably the most important data category for the HPDC process, different types of data need to be considered to enable a holistic view on the cyber-physical system. Visual information is typically available in an HPDC cell. Often, an image of every casting is taken after ejection, in order to check if all overflows were removed from the die. A wide range of additional scenarios in HPDC can benefit from analyzing this visual data. These include video data from: the pour hole to check for plunger lubricant combustion and the plunger surface wear, the open die on the machine (to assess the spraying behavior and die surface wear) and the castings themselves (for tracking purposes or for quality information). In order to integrate such data into the data lake, the next steps will include assessments with regard to streaming of high volume video data and their alternative processing on the edge of the network. These steps also require the development and integration of procedures for automated image recognition of the phenomena of the HPDC process described above.

Author Contributions

The physical network setup and configuration including the edge device were carried out by M.R. (Maximilian Rudack). The Kubernetes, Kafka and MinIO set up and the load tests were carried out by M.R. (Michael Rath). Both authors contributed in equally to the development of the conceptual framework for this work. Supervision and project administration were provided by U.V. and A.B.-P. All authors have read and agreed to the published version of the manuscript.

Funding

Funded by the Deutsche Forschungsgemeinschaft (DFG, German Research Foundation) under Germany’s Excellence Strategy–EXC-2023 Internet of Production–390621612.

Data Availability Statement

The full JSON files of the Node-Red flows are not publicly available due to fact that they contain login credentials, sensitive comments and sensitive networking information of RWTH Aachen University. The load testing data and segments of the flows without sensitive information are available on request from the corresponding authors.

Conflicts of Interest

The authors declare no conflict of interest.

Abbreviations

The following abbreviations are used in this manuscript:
CSVComma Separated Values
HTCsHeat Transfer Coefficients
HPDCHigh Pressure Die Casting
IPInternet Protocol
JSONJavaScript Object Notation
OLAPOnline Analytical Processing
OPC UAOpen Platform Communications Unified Architecture
PLCProgrammable Logic Control
RAMRandom Access Memory
SBCSingle Board Computer

References

  1. OPC Unified Architecture. Available online: https://opcfoundation.org (accessed on 6 January 2022).
  2. Mahnke, W.; Leitner, S.H.; Damm, M. OPC Unified Architecture; Springer Science & Business Media: Berlin, Germany, 2009. [Google Scholar]
  3. Rix, M.; Kujat, B.; Meisen, T.; Jeschke, S. An agile information processing framework for high pressure die casting applications in modern manufacturing systems. Procedia CIRP 2016, 41, 1084–1089. [Google Scholar] [CrossRef] [Green Version]
  4. Pennekamp, J.; Glebke, R.; Henze, M.; Meisen, T.; Quix, C.; Hai, R.; Gleim, L.; Niemietz, P.; Rudack, M.; Knape, S.; et al. Towards an infrastructure enabling the internet of production. In Proceedings of the 2019 IEEE International Conference on Industrial Cyber Physical Systems (ICPS), Taipei, Taiwan, 6–9 May 2019; pp. 31–37. [Google Scholar]
  5. Dai, H.N.; Wang, H.; Xu, G.; Wan, J.; Imran, M. Big data analytics for manufacturing internet of things: Opportunities, challenges and enabling technologies. Enterp. Inf. Syst. 2020, 14, 1279–1303. [Google Scholar] [CrossRef] [Green Version]
  6. Rath, M.; Gannouni, A.; Luetticke, D.; Gries, T. Digitizing a Distributed Textile Production Process using Industrial Internet of Things: A Use-Case. In Proceedings of the 2021 4th IEEE International Conference on Industrial Cyber-Physical Systems (ICPS), Victoria, BC, Canada, 10–12 May 2021; pp. 315–320. [Google Scholar]
  7. Lee, J.Y.; Yoon, J.S.; Kim, B.H. A big data analytics platform for smart factories in small and medium-sized manufacturing enterprises: An empirical case study of a die casting factory. Int. J. Precis. Eng. Manuf. 2017, 18, 1353–1361. [Google Scholar] [CrossRef]
  8. Chen, K.Y.; Wu, T.C. Data warehouse design for manufacturing execution systems. In Proceedings of the IEEE International Conference on Mechatronics (ICM’05), Taipei, Taiwan, 10–12 July 2005; pp. 751–756. [Google Scholar]
  9. Hai, R.; Geisler, S.; Quix, C. Constance: An intelligent data lake system. In Proceedings of the 2016 International Conference on Management of Data, San Francisco, CA, USA, 26 June–1 July 2016; pp. 2097–2100. [Google Scholar]
  10. Lipp, J.; Rath, M.; Rudack, M.; Vroomen, U.; Bührig-Polaczek, A. Flexible OPC UA Data Load Optimizations on the Edge of Production. In Enterprise Information Systems, Proceedings of the 22nd International Conference (ICEIS 2020), Virtual Event, 5–7 May 2020; Revised Selected Papers; Springer: Cham, Switzerland, 2020; pp. 43–61. [Google Scholar]
  11. Raj, A.; Bosch, J.; Olsson, H.H.; Wang, T.J. Modelling Data Pipelines. In Proceedings of the 2020 46th Euromicro Conference on Software Engineering and Advanced Applications (SEAA), Portoroz, Slovenia, 26–28 August 2020; pp. 13–20. [Google Scholar]
  12. Node-Red. Available online: https://nodered.org (accessed on 6 January 2022).
  13. Nicolae, A.; Korodi, A. Node-Red and OPC UA Based Lightweight and Low-Cost Historian with Application in the Water Industry. In Proceedings of the 2018 IEEE 16th International Conference on Industrial Informatics (INDIN), Porto, Portugal, 18–20 July 2018; pp. 1012–1017. [Google Scholar]
  14. Apache Kafka. Available online: https://kafka.apache.org (accessed on 6 January 2022).
  15. Docker. Available online: https://www.docker.com (accessed on 6 January 2022).
  16. Kubernetes. Available online: https://kubernetes.io (accessed on 6 January 2022).
  17. Burns, B.; Grant, B.; Oppenheimer, D.; Brewer, E.; Wilkes, J. Borg, omega, and kubernetes. Commun. ACM 2016, 59, 50–57. [Google Scholar] [CrossRef]
  18. MinIO. Available online: https://min.io (accessed on 6 January 2022).
  19. OPC UA Foundation. OPC Unified Architecture—Part 4: Services, Version 1.05; OPC UA Foundation: Scottsdale, AZ, USA, 2021. [Google Scholar]
Figure 1. Network layout and technology stack from the HDPC cell to the storage solution.
Metals 12 00349 g001
Figure 2. Segment of the flow to access the data from the machine PLC.
Metals 12 00349 g002
Figure 3. Compounding flow on the edge server that connects to the message broker.
Metals 12 00349 g003
Figure 4. Compounding flow in the cloud that connects the message broker with the data lake.
Metals 12 00349 g004
Figure 5. Part of the overall architecture used for load testing.
Metals 12 00349 g005
Figure 6. Response to subscriptions to the current time of the OPC UA servers depending on various requested frequencies.
Metals 12 00349 g006
Figure 7. Time dependent metrics of five load tests in identical setups.
Metals 12 00349 g007
Figure 8. Dependence of latency on throughput measured in five load tests conducted in identical setups.
Metals 12 00349 g008
Publisher’s Note: MDPI stays neutral with regard to jurisdictional claims in published maps and institutional affiliations.

